SharePoint for the Social Enterprise enabling better and faster decisions.

Enabling better decisionsDeloitte Economics, Valuation and Modelling practice

Contents
Enabling better decisions in a time of unprecedented innovation and disruption 01
Uncertainty is the new normal 02
Valuing Innovation: The trade‑off between ambition and realism 03
Modelling for effective decision‑making 07
Unicorns: Magical Valuations 09
The “average” company: traps for the unwary 13
UK contacts 17
EMEA contacts 18
Deloitte Economics, Valuation and Modelling: enabling better decisions 20

Enabling better decisions in a time of unprecedented innovation and disruptionIn an era of unprecedented change, many market participants are grappling with strategic business and valuation based decisions arising as a result of; increased innovation and greater market controversy, uncertainty and volatility.
Deloitte’s Economics, Valuation and Modelling practice brings together industry specialists who understand the markets in which our clients operate, current and future direction of regulation, drivers and opportunities of value creation and leading edge modelling and analytics capabilities. It draws on the depth and breadth of wider parts of Deloitte and is focussed on enabling its clients make better decisions in these times of unprecedented innovation and disruption.
In this document we share our thoughts on a number of topics relevant to businesses, now more than ever, in our innovative, uncertain and volatile times.
• Uncertainty is the new normal shows how using our understanding of economics and analytical skills are being used as a guide for better decision‑making in an increasingly uncertain environment.
• Valuing innovation explains how to consider the value of innovative businesses, drawing on the challenges for many of the world’s largest investment funds and leading tech firms.
• In Modelling for effective decision‑making we highlight the enduring relevance of C. Northcote Parkinson, the writer behind Parkinson’s Law of Triviality, and use his findings to explain why many models that we see are destined to prevent quick and effective decision‑making. We then explain how to use cutting‑edge data tools to craft models that achieve the opposite: enabling quick and effective decisions.
• Unicorns: magical valuations highlights the superficial thinking which means that $1 billion‑plus start‑up companies are systematically overvalued even if market sentiment pervades.
• The “average” company: traps for the unwary considers the dangers, when valuing businesses, of picking and relying on averages too much or, of picking an inappropriate average.
It is our experience as well as these stories and ideas that allow us to help our clients understand and manage their most complex challenges, empowering them to make wise decisions.
We hope that these intriguing and captivating pieces show how these insights need not be excessively technical and that you enjoy reading this document. Please do not hesitate to get in touch.
Sam Blackie PartnerEconomics
Andrew Robinson PartnerValuation
Iain Williams PartnerBusiness Modelling
01
Enabling better decisions | Deloitte Economics, Valuation and Modelling practice
Uncertainty is the new normal
We live in uncertain times. We don’t yet know what the effect of Brexit will be on the UK economy. We can’t yet gauge the destabilising effects of dissatisfaction with established ways of thinking and governing across mainland Europe, from Spain to Hungary. It’s still too soon to consider what the legacy of the Trump presidency in the US will be for the world.
As uncertainty continues to increase, the importance of sophisticated and accurate techniques for economic forecasting, valuation and modelling becomes even more vital.
But businesses and investors so often get this wrong.
It’s rare that managers offer up business cases or forecasts that are not upwardly biased. So why, then, do analysts, investors and industry professionals place so much emphasis on such plans? Much of our work in Economics, Valuation and Modelling involves moderating forecasting away from mere hope and towards sober realism.
A flight to quality – but for how long?In these uncertain times, we have detected a flight to quality – to established market brands. That’s because these brands are founded on a natural psychological tendency to favour the familiar over the unusual. Morgan Housel of venture capital firm Collaborative Fund puts it well: “Truly amazing companies combine perfection with consistency.”
But we can’t be certain that consumers will stick with these brands. Businesses must carefully monitor shifts in consumer behaviour, because these changes might affect their brand. When consumer behaviour starts to change, it’s important for businesses to continue investment in technologies that enable them to adapt to these changes. This is especially the case when there are significant cost and price pressures that might tempt consumers to switch to cheaper brands. That was a particular risk in the UK, where a drop in the pound in the wake of the Brexit vote increased inflation and hit consumers’ real incomes.
We must always remember, in short, that the value of established products, services and brands is dependent not on past performance but on future performance. Albeit historical performance can help frame the future.
From dreams to realismAt the other end of the strategic scale, technological advance and business innovation is opening the door to new or rapidly evolving business models. By definition, investments in disruptive and start‑up businesses are highly uncertain and require consideration of data‑rich analytical techniques. The key is not simply taking a forecast and inserting it into an economic or valuation model; it is vital to test and benchmark the forecast to generate realistic sets of outcomes.
For uncertain investments in new technologies and business models it is possible that the investment will become valueless. For the most speculative investments there is a high probability of this. Given this, it’s vital to understand the future outcomes and economic drivers that propel these businesses towards success or failure.
What differentiates an effective economic forecast from a scenario is taking the dreams and aspirations underpinning new business models and turning them into realistic expectations. This is a tricky balancing act: we have to remove the optimistic bias of forecasts, while still recognising the vision and ambition behind new projects.
Data‑rich analytical techniques:
Economic testing: assessing the impact of “reforecasts” and changes to macroeconomic conditions
Scenario testing: adjusting key business drivers to understand the impact on value
Probability weighting/simulations: examining the continuum of valuation possibilities to understand the range of an investment’s potential outcomes
02
Enabling better decisions | Deloitte Economics, Valuation and Modelling practice

Valuing Innovation: The trade‑off between ambition and realismInnovation‑related M&A deals increased fourfold in the four years from 2012 – rising to almost $300 billion in 2016. This highlights the increasing need for sound judgement in valuing new technologies and start‑ups. Valuing innovation requires predictions which are fraught with difficulty, because they are often affected by conscious or unconscious bias. In this article, we describe a simple three‑step model that can act as a guide in valuing innovation, by setting out explicit assumptions in determining the value of start‑ups and disruptive technologies. This can help to avoid skewed forecasts arising from biased thinking.
Three steps to heavenStep 1: What is the market?The first step is to determine the market for the innovation. We can form a judgement from reviewing a company’s operations, mission statements and objectives, company culture and strategy, and from industry and market analysis. At first glance, this may appear simple. However, subtle differences can have a huge impact on the framework you use to value an entity or investment. Judging the relevant market opportunity is not necessarily as straightforward as it first seems.
For example, Amazon’s stated purpose has evolved from being a simple online retail business, to an e‑commerce business, to something grander. Amazon’s 1998 10‑K (annual report) gave the company’s objective as “to become the best place to buy, find and discover any product or service available online with the goal of creating customers’ preferred online shopping destination, in the United States and around the world.” In 2007, its objective became: “We seek to be Earth’s most customer‑centric company, where customers can find and discover anything they might want to buy online, and endeavor to offer customers the lowest possible prices”. And in 2016, simply: “We seek to be Earth’s most customer‑centric company.” Few today would consider Amazon as simply an online retailer – and its latest statement suggests virtually no limit to its target market. This is why it is critical to understand the market and environment in which the innovation is intended to operate.
Uber
In his book Narrative and Numbers, Professor Damodaran, finance professor at NYU Stern, sets out various valuations for Uber. He initially values it as an urban car service (or to put it in everyday terms, a taxi service). However, on further consideration, he broadens the relevant market to logistics (its non‑taxi offshoots include UberEATS and Uber Freight). Prof Damodaran estimates the logistics market at more than twice the size of the car service market, with stronger growth potential and lower costs of capital but slimmer margins. Along with some other changes to his assumptions, the change in the relevant market increases Professor Damodaran’s initial valuation from $6 billion to something significantly larger.
03
Enabling better decisions | Deloitte Economics, Valuation and Modelling practice

Step 2: What will happen to the market?The art of valuation lies largely in predicting the future – and this involves a trade‑off between realism and ambition. Many forecasts are implicitly biased by the hopes and aspirations underlying new and exciting businesses. What differentiates a valuation from a scenario is taking the aspirations underpinning new business models, turning them into realistic expectations from the point of view of a portfolio investor, and considering the consequences of failure. We often find that this balancing act has not been performed. In these current uncertain times, there is an even stronger case than before for appraising investment decisions using more scenario testing, more careful economic analysis, and more realistic probability weightings and investment simulations.
Having identified the relevant market for the innovation or technology, our next step is to understand what will happen to the market: the impact of the innovation or disruption.
It is helpful to think of markets as pies. We must work out what the pie is, and then how much the pie will grow.
Effect 1: Market Growth The innovation grows the pie. This might be by bringing in new customers, reducing barriers to entry, or changing consumer tastes.
Example: Development of DIY and Home Improvement stores by B&Q, Home Depot etc.
For Illustrative purposes only
Effect 2: Change in market share The innovation allows the entity to grow faster and/or take market share from competitors. This might be through superior product, lower prices, or added sales from complement/substitute products.
Example: Displacement of US car manufacturers by Japanese manufacturers.
For Illustrative purposes only
04
Enabling better decisions | Deloitte Economics, Valuation and Modelling practice

Step 3: Identifying, optimising and monetising value creation opportunities Having taken the first two steps, we can then work back to consider the assumptions that underlie our model:
For the relevant market we can gather data such as growth rate, margins, competitive landscape, cost of capital and other valuation inputs.
If our valuation target is going to grab market share from competitors, it follows that it will grow faster than them. A higher growth rate may be applied to earnings, or a higher market multiple – the relationship between growth in the market as a whole and the company’s earnings growth – can be used. A higher market multiple means the company grows more for a given level of growth in its market. If we are forecasting a step change in market share – because the company has the advantage of a disruptive technology, for example – we must ask further questions, such as: when will this change occur? Is the change priced in? How long can superior market growth be maintained before competitors catch up? Such a step change should be incorporated into any forecast of future cashflows.
After the initial crafting of assumptions, we can refine these assumptions and feed these back into our forecasts. This allows us to challenge, refine and improve the predictions. This model does not merely allow us to break down the complicated task of forecasting. It also gives us a strong starting point for updating models and valuations in responses to changes in the market and wider economy. This process of challenge and refinement helps to remove conscious or unconscious biases that may skew a forecast.
Comment A simple three‑step model can assist in valuing innovative and disruptive technologies. The model acts as a starting point for generating the forecasts and underlying assumptions necessary to value innovations. These assumptions can be refined through challenging and asking questions about market and economic data – testing how these fit with the forecast narrative generated through the model. The narrative should be updated as the market and wider economy changes. It should also be screened to avoid conscious or unconscious biases that skew forecasts.
Case study 2: The iPhone
Nokia Apple For Illustrative purposes only
Step 1
• What is the market? • Smartphones? • Mobile Phones? • All consumer electronics?
Step 2 Impact on the market:
• Market grows, smartphones take off, other consumer electronics are killed off (Walkmans, PDAs etc.)
• Apple takes market share from incumbents: Nokia, Blackberry
05
Enabling better decisions | Deloitte Economics, Valuation and Modelling practice
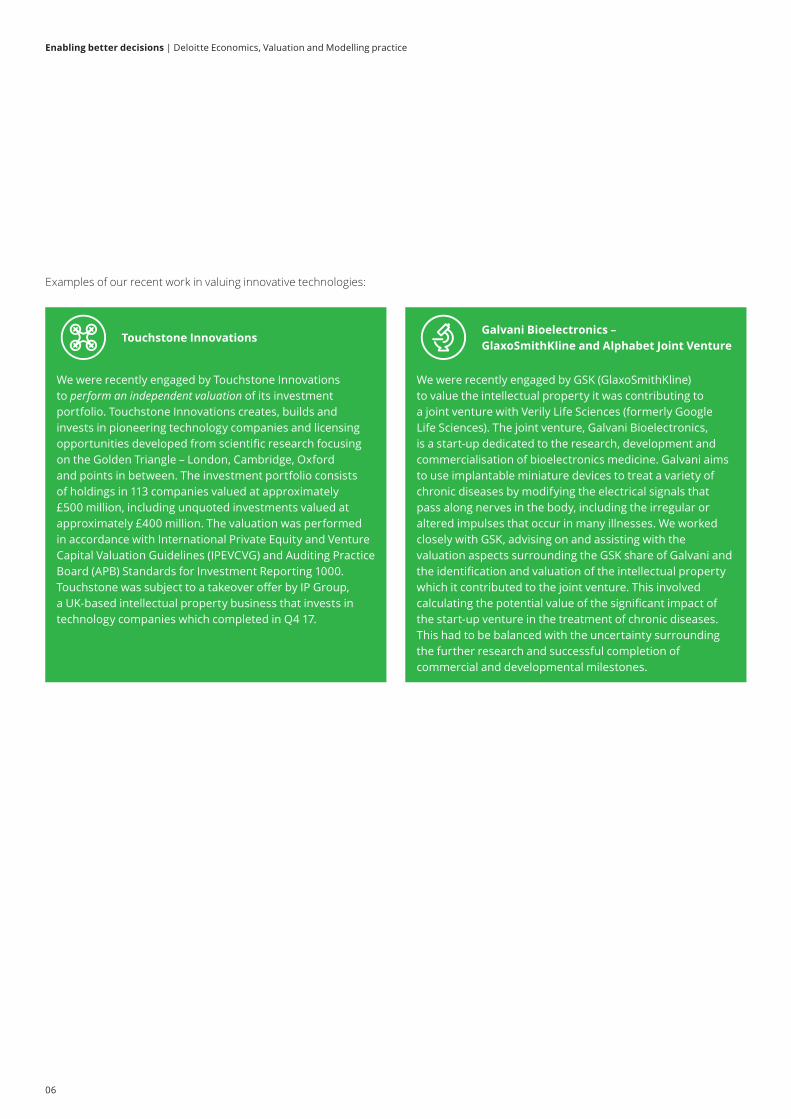
Examples of our recent work in valuing innovative technologies:
Touchstone Innovations
We were recently engaged by Touchstone Innovations to perform an independent valuation of its investment portfolio. Touchstone Innovations creates, builds and invests in pioneering technology companies and licensing opportunities developed from scientific research focusing on the Golden Triangle – London, Cambridge, Oxford and points in between. The investment portfolio consists of holdings in 113 companies valued at approximately £500 million, including unquoted investments valued at approximately £400 million. The valuation was performed in accordance with International Private Equity and Venture Capital Valuation Guidelines (IPEVCVG) and Auditing Practice Board (APB) Standards for Investment Reporting 1000. Touchstone was subject to a takeover offer by IP Group, a UK‑based intellectual property business that invests in technology companies which completed in Q4 17.
Galvani Bioelectronics – GlaxoSmithKline and Alphabet Joint Venture
We were recently engaged by GSK (GlaxoSmithKline) to value the intellectual property it was contributing to a joint venture with Verily Life Sciences (formerly Google Life Sciences). The joint venture, Galvani Bioelectronics, is a start‑up dedicated to the research, development and commercialisation of bioelectronics medicine. Galvani aims to use implantable miniature devices to treat a variety of chronic diseases by modifying the electrical signals that pass along nerves in the body, including the irregular or altered impulses that occur in many illnesses. We worked closely with GSK, advising on and assisting with the valuation aspects surrounding the GSK share of Galvani and the identification and valuation of the intellectual property which it contributed to the joint venture. This involved calculating the potential value of the significant impact of the start‑up venture in the treatment of chronic diseases. This had to be balanced with the uncertainty surrounding the further research and successful completion of commercial and developmental milestones.
06
Enabling better decisions | Deloitte Economics, Valuation and Modelling practice

Parkinson’s law of trivialityThe funniest satire is funny because amid all the jokes lies a kernel of truth. That can certainly be said of Gulliver’s Travels, the comic operas of Gilbert and Sullivan, or the antics of Monty Python.
The various “laws” formulated by C. Northcote Parkinson, the 20th‑century writer, fit snugly into this category.
Parkinson’s Law of Triviality – devised in 1957 but just as relevant today – states that organisations spend excessive time on insignificant issues. The example he used to illustrate his point must provoke a wry smile of recognition in many readers, even if it is a trifle exaggerated. He imagines a meeting of a nuclear plant’s finance committee. Three items on the agenda require a decision about whether and how to proceed:
• a complex multi‑million pound reactor – a key decision not only for the plant, but for the country as a whole, at a pivotal moment in the history of British energy
• a shed for parking bicycles
• coffee
The committee rushes through the plan for the nuclear reactor in a matter of moments, but spends a full 45 minutes pondering the right material for the bike shed, and whether it is needed at all. Discussion on the least important item – what to do about refreshments at committee meetings – lasts for over an hour, with a solemn commitment to continue discussion at the next meeting after further essential research.
Parkinson suggests that this counterintuitive and irrational allocation of time is because the question of the nuclear reactor is complicated. The average committee member can’t understand the issues, so the item prompts little discussion. Instead of thinking about it at length, the committee feels compelled to trust the technical advisers without question. However, many more committee members can understand the ins and outs of the bike shed issue – and when it comes to beverages absolutely all of them have an opinion because zero expertise is required.
There is an amusing lesson here for all CFOs and other finance executives – but it is also a highly important one.
Cyril Northcote Parkinson
1909–1993
Naval historian and academic
Rossem, Wim van / Anefo ; Dutch National Archives
Most famous for Parkinson’s Law: “Work expands so as to fill the time available for its completion.” (more on that in the future…)
The Law was first published in a satirical essay in The Economist in 1955, before being developed in a number of books by Parkinson. From it have grown several corollaries, most famously: “If you wait until the last minute, it only takes a minute to do.”
How models can lead to ineffective decision makingParkinson’s Law of Triviality is commonly found when organisations build models to help them with forecasting. Focus is placed on small or irrelevant items at the expense of the key drivers. For example, there may be much debate on the cost assumptions for some marketing expenses that have an insignificant impact on profits; but there may not be much discussion about key macro indicators that are much more likely to swing a project from profit to loss. This is because these macro indicators, such as estimates of the growth or decline of a particular global market, are hard to quantify and understand.
Executives make “gut decisions” – decisions based on a feeling rather than hard evidence – because of a lack of information and understanding about the most important issues. These decisions are often vulnerable to confirmation bias, where the people making the decisions tend to seek and then give more weight to information that confirms their original belief. Sometimes, the struggle to obtain and/or understand the relevant information leads to “decision fatigue”: the executives can’t grasp what the key drivers to their business, and the relationships between them. Having reached a state of exhaustion, wasting time debating minor issues ad nauseam, they stumble into a poor decision, or fail to make a decision at all.
Decision fatigue is where the quality of decisions deteriorates after a long session of confused discussion.
Modelling for effective decision‑making
07
Enabling better decisions | Deloitte Economics, Valuation and Modelling practice
We have an antidote to confirmation bias, decision fatigue and related ills in the field of modelling. Our medicine consists of three key principles to guide CFOs.
01. Focus on the big drivers: strategic modelling should focus on the key business components and develop the relationships between these drivers and macro factors.
Whatwilltheeffectbeofa 10%fallinthevalueofthepoundontheprofitmarginofa foodprocessingplant,whichsourcesmuchofitsproductabroad?
02. Keep models integrated: drivers should stay integrated so that relationships can be defined and quantified.
Imaginethata bankmodelsa fallinsavingsdepositsifa competitorweretolaunchanaccountwitha higherinterestrate.A goodintegratedmodelwillestimatewhata 0.5%betterrateata competitormeansfordemandforthebank’sexistingsavingsproducts.This canbeusedtocalculatewhetherit’sworthcompetingbyofferinga higherinterest rate.
03. Don’t plan for everything: don’t try to allow for every possible eventuality and variable; restrict your model to what is significant and in line with its purpose.
AnITservicescompanyistryingtoworkoutwhethertotakeoutlong‑termrentalcontractsonnewofficespace–a decisionthatdependsonwhetherdemandforitsserviceslookslikelytoriseconsiderably.It needstomodeltheeffectofvariousfactors,includingdifferingratesofeconomicgrowthintheUKandoverseas,fallsandrisesinitsmarketshare,andtrendsinoutsourcingandremoteworkingintheindustry.
Trendsinresidentialpropertypriceshavesomerelevancetothecompany,becausehighhousingcostsmaydeteremployeeslocatingtonewofficesites.Moreover, almosteveryoneintheUKhasanopiniononhouseprices.However, thisisnota coreissue–theeffectofhousepricesonwhetheremployeesrelocateornotisunclear,andworkersinthisparticularsectoroftheindustryhavelimitedbargainingpower.Finally, focusingonthisrisksdistractingmanagementfromwhatiscore–whetherthenewofficespaceisneededat all.
Applying the principlesGuided by the three principles, we can create a two‑approach model for effective forecasting:
• Driver‑based/“bottom‑up” modelling – suitable for forecasting key items.
• “Top‑down” modelling – suitable for forecasting of other, less significant items.
Both approaches enable quick directional decision‑making: having sufficient information to make a “good enough” decision so that CFOs can move on to the next issue.
Driver‑based modellingIn this approach, the first step is to identify the key drivers, the items that have a major impact on your business or on the issue being modelled. These can be identified by analysing which items have the most significant impact on value. The next step is to develop the relationship between the drivers and their impact on the forecast’s components.
The impact of each driver is assessed and quantified. For example, a manufacturer of a particular machine tool might estimate the effect on its sales, cost of sales and profit margin of a 5% change in global production capacity for the tool, a 5% change in demand for it, and a 10% change in the value of sterling.
This approach has another virtue: it helps to identify what big drivers may be missing, or gaps where the impact of a particular driver is not yet fully understood.
Top‑down modellingIn this approach, the relationship between the macro and market factors and the forecast is developed. For example, what is the effect on the forecast for bad debts owed to a manufacturing company if the UK economy grows by 2% over the coming year, or fails to grow at all? This approach is less data‑intensive than the driver‑based approach. It’s also much quicker to implement because each driver, and its links, is not assessed individually. The focus is, instead, on the combined picture.
The impact of each driver is assessed and quantified. This approach allows for quick directional decision‑making (e.g. does an increase to driver 1 cause a project to become loss‑making). A further benefit is that it helps to identify what may be missing or gaps where the impact is not yet fully understood (i.e. working out what we don’t yet know).
Comment The value of a ‘critical friend’, experienced and expert in strategic modelling can help executives make better decisions and an impact that matters.
08
Enabling better decisions | Deloitte Economics, Valuation and Modelling practice
Pieces of jargon are rarely as charming as the term “unicorn”, the moniker within the venture capital industry for a start‑up company valued at over $1 billion. Any investor that has bought an early‑stage stake in such a business, when it was “cheap”, must feel a sense of excitement almost as great as if they’d seen one of the mythical creatures walking down their local high street.
But there’s another reason why the term “unicorn” fits the bill for such businesses, beyond the sense of awe and wonder they evoke: the valuations are sometimes as fantastical as the creatures themselves.
Crucially, unicorns are far more likely to be overvalued than undervalued, because of a fundamental error in the way that investors work out valuations. This is an extremely important issue to bear in mind in any economic environment. In the current uncertain times, when unicorns are as likely to be facing economic tailwinds that make life harder for them as headwinds that make life easier, understanding this error is all the more important.
The nature of the problemEstimating the value of a large listed company is considerably easier than estimating the value of an unlisted one. The bargaining between a large number of buyers and sellers about the price per share to be paid results in a reasonably accurate valuation of most FTSE 350 companies.
Investors in unicorns receive no such help from the wisdom of crowds. The number of investors and potential investors in the market for a unicorn is extremely small. At first glance, there’s no reason to think that unicorns are overvalued more or less frequently than they are undervalued. In practice, however, they are far more likely to be overvalued.
This is shown in new research from two business school academics, which found that about half of unicorns reach the $1 billion threshold because the valuations made by venture capitalists ignored any consideration of the way that different share classes within start‑ups work. 10% of the companies studied were overvalued by more than 100%1 even if market sentiment for the company is correct.
The problem could be this. The conventional valuation method in the venture capital industry is the “post‑money valuation”. Investors multiply the price per share in the most recent funding round, which is often provided in preference shares, by the fully diluted number of ordinary shares.
1 Gornall and Strebulaev 2017, “Squaring Venture Capital Valuations with Reality”.
This needs some explaining. Ordinary shares are those that give their owner the right to share in the profits of the company and to vote on corporate policy. The fully diluted number includes the ordinary shares already in existence, plus the total number of shares that would be created if all the other securities that might be converted into ordinary shares in the future were, in the end, converted.
But post‑money valuations can be misleading because the starting point is sometimes wrong. The shares issued in the latest funding round may come with valuable additional terms that ordinary shares will not have. In some cases earlier funding rounds do not have them either.
These terms make them worth more than ordinary shares, but it is a zero‑sum game: a situation where if one group of players gains, another group of players loses by the same amount. These shares come with additional terms so they are worth more, but these additional terms might reduce the value of other shares that lack them. For this reason, valuing the entire business on the basis of these more lucrative shares may not make sense. To calculate the worth of unicorns more accurately, people should consider stripping out the value of these additional terms.
Option valueThese additional terms may enhance the shareholder’s return, but then again they may not – it depends on what happens to the business. But the possibility of enhanced return gives them a value. In this way, they work much like option contracts in the derivatives market.
We explain two examples of terms that generate an option value: preferences and ratchets.
PreferencesA preference term gives an investor a preset return on exit, or if certain financial targets are met. This return may be a percentage – for example, if exit is achieved within three years, a minimum return of 10% per annum is paid. It may be a multiple – for example, if the start‑up is acquired for more than $1 billion, the investor will receive double (“2x”) their initial investment. It is called a preference term because the investor usually gets priority, or preference, over other shareholders on exit or liquidation. The option value of a preference term is calculated by estimating the net present value of the cashflows payable to the preferred investor if the particular condition specified in the terms is met, and then estimating the likelihood that this will happen.
Unicorns: Magical Valuations
09
Enabling better decisions | Deloitte Economics, Valuation and Modelling practice
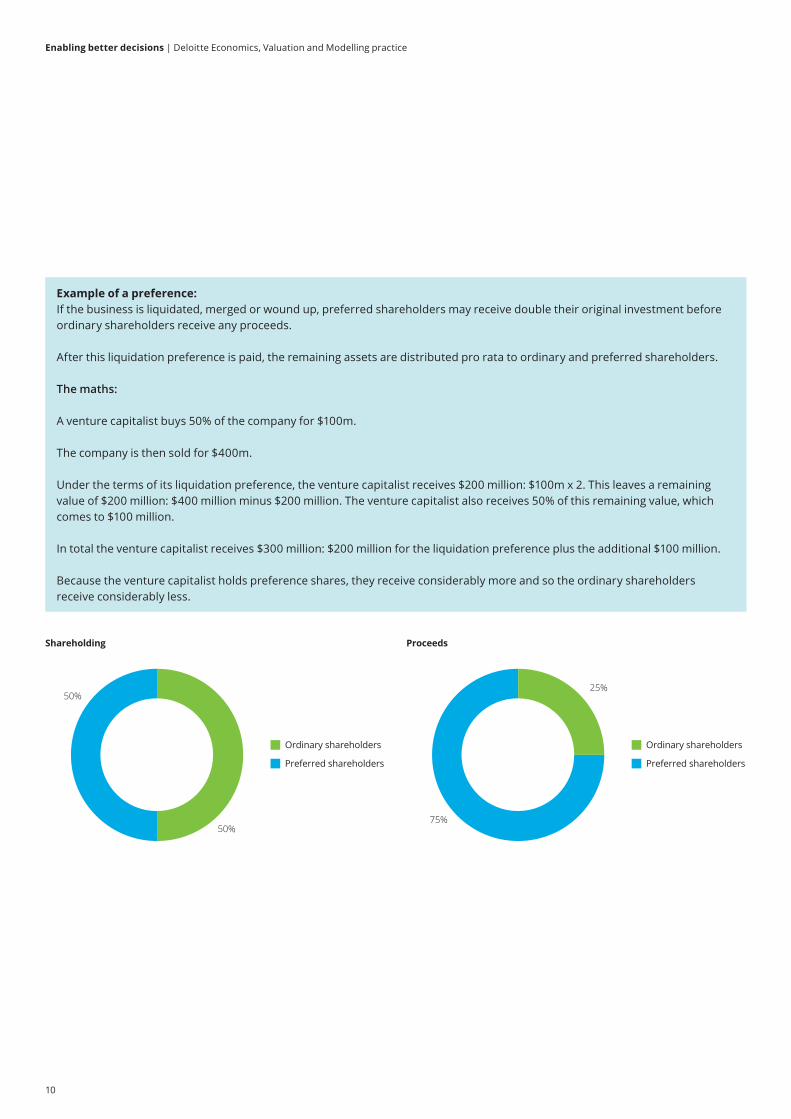
Example of a preference: If the business is liquidated, merged or wound up, preferred shareholders may receive double their original investment before ordinary shareholders receive any proceeds.
After this liquidation preference is paid, the remaining assets are distributed pro rata to ordinary and preferred shareholders.
The maths:
A venture capitalist buys 50% of the company for $100m.
The company is then sold for $400m.
Under the terms of its liquidation preference, the venture capitalist receives $200 million: $100m x 2. This leaves a remaining value of $200 million: $400 million minus $200 million. The venture capitalist also receives 50% of this remaining value, which comes to $100 million.
In total the venture capitalist receives $300 million: $200 million for the liquidation preference plus the additional $100 million.
Because the venture capitalist holds preference shares, they receive considerably more and so the ordinary shareholders receive considerably less.
50%
50%
Shareholding
Ordinary shareholders
Preferred shareholders
75%
Proceeds
Ordinary shareholders
Preferred shareholders
25%
10
Enabling better decisions | Deloitte Economics, Valuation and Modelling practice

RatchetsA ratchet clause ratchets up the number of shares available to a particular party. This can work in two ways:
• For managers: if certain targets are met, management is allotted extra shares.
• For investors: if a later investor pays a lower price for shares in the start‑up than the price paid by an earlier investor, then the earlier investor is allotted extra shares to prevent a dilution in their share of future profits.
Ratchets are similar to option contracts or convertible instruments:
• They often last a specific length of time.
• They have a strike price, as with options contracts, or a conversion price at which they can be turned into shares, as with convertibles.
For this reason, they are valued in a similar way.
As with liquidation preferences, the option value of the ratchet comes at the expense of the other shareholders. Because the other shareholders’ shares will be diluted, they’ll have a right to a lower share of total profits, or proceeds from the sale of the company, than before.
Overvaluation: an exampleIt’s useful to take a closer look at how relying on the value of one particular class of shares inflates the unicorn’s value. Imagine that the price of each share in the third and latest funding round, Round C, is $1,000, after including the value of additional terms. If there are 9,000 shares altogether from all funding rounds, and this $1,000 price is applied to each of the shares, the value of the company is $9 million.
A B C
"Value" = $1,000 x (4,500 + 3,000 +1,500) = $9mBought at $1,000/share
4,500 shares3,000 shares
1,500 shares
But this artificially inflates the value of the business because the Round C shares include an option value based on its special terms.
If we take into account the fact that the option value of Round C shares makes them 33% more valuable than Round B shares, and that Round B shares are 50% more valuable than Round A shares, then the true value of the company is $6 million. Using the last round alone to work out the value of the whole company would overstate value by 50%.
11
Enabling better decisions | Deloitte Economics, Valuation and Modelling practice
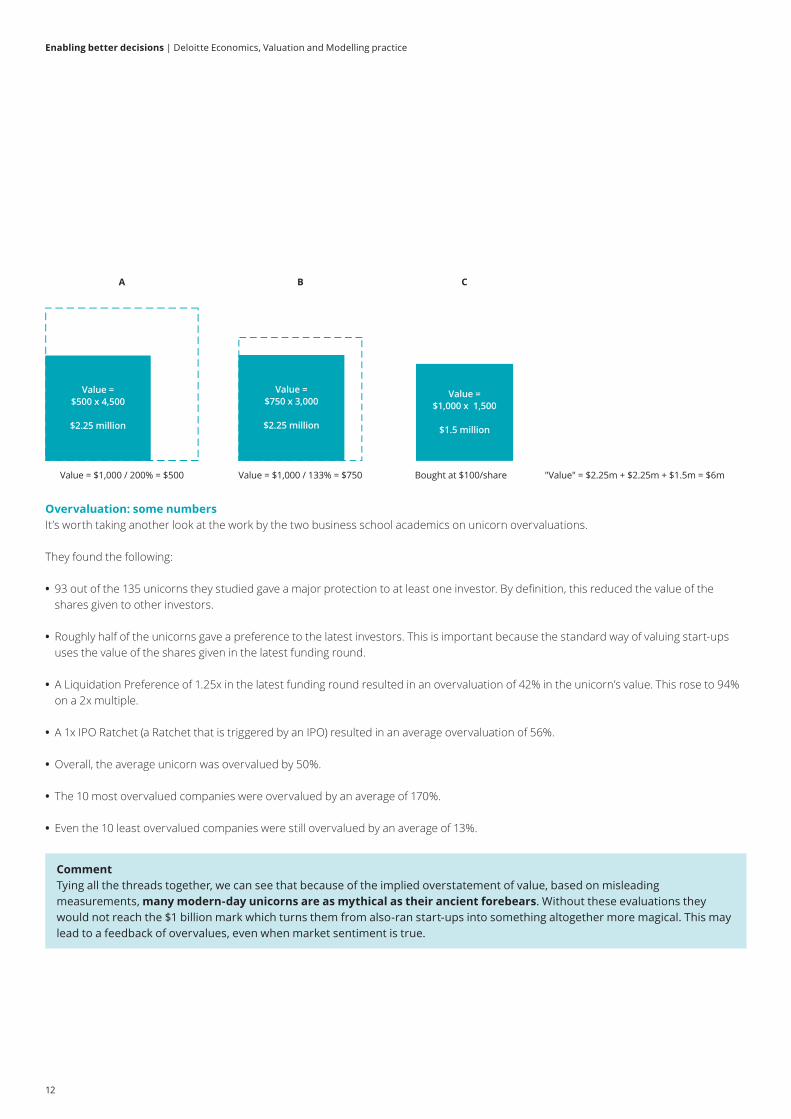
A B C
"Value" = $2.25m + $2.25m + $1.5m = $6mBought at $100/shareValue = $1,000 / 133% = $750Value = $1,000 / 200% = $500
Value = $1,000 x 1,500
$1.5 million
Value = $750 x 3,000
$2.25 million
Value = $500 x 4,500
$2.25 million
Overvaluation: some numbersIt’s worth taking another look at the work by the two business school academics on unicorn overvaluations.
They found the following:
• 93 out of the 135 unicorns they studied gave a major protection to at least one investor. By definition, this reduced the value of the shares given to other investors.
• Roughly half of the unicorns gave a preference to the latest investors. This is important because the standard way of valuing start‑ups uses the value of the shares given in the latest funding round.
• A Liquidation Preference of 1.25x in the latest funding round resulted in an overvaluation of 42% in the unicorn’s value. This rose to 94% on a 2x multiple.
• A 1x IPO Ratchet (a Ratchet that is triggered by an IPO) resulted in an average overvaluation of 56%.
• Overall, the average unicorn was overvalued by 50%.
• The 10 most overvalued companies were overvalued by an average of 170%.
• Even the 10 least overvalued companies were still overvalued by an average of 13%.
Comment Tying all the threads together, we can see that because of the implied overstatement of value, based on misleading measurements, many modern‑day unicorns are as mythical as their ancient forebears. Without these evaluations they would not reach the $1 billion mark which turns them from also‑ran start‑ups into something altogether more magical. This may lead to a feedback of overvalues, even when market sentiment is true.
12
Enabling better decisions | Deloitte Economics, Valuation and Modelling practice

We rely often on our friend Mr or Ms Average when valuing companies. But although they can be a sympathetic friend, they can also be an unreliable and even treacherous one.
The average is often the cornerstone of a well‑established method for valuing companies: the market‑based approach, also known as “relative valuation”.
Let’s call a business Company A. The investor or valuer finds listed companies, or transactions in privately owned companies in the same sector as Company A. They will typically then analyse these to work out the average relationship between a particular financial metric, such as revenue or profit, and each company’s value.
Here is a simplified example based on taking a single item (in reality investors would use several):
Case study:
• We identify 15 companies comparable to the company we wish to value.
• On the X‑axis we plot the item we are analysing (e.g. revenue). On the Y‑axis we plot the stock market value of each company.
• If we know the revenue of our unlisted company, we can use this trend to find its implied price. For example, if revenues are £60 million, the trend shown by the dotted line suggests a value of £60 million.
0 10 20 30 40 50 60 70 80 90 1000
20
40
60
80
100
120
Revenue (£)
Valu
e (£
)
However, in our modern complex economy even companies that look very similar on paper may have several special or hidden characteristics. What if we determine, after visualising our data and applying our knowledge of the industry in question, that all of the companies below the dotted line – those with a lower average value for a given amount of revenue – share a particular characteristic which all the companies above the dotted line do not have? In that case, we can update our graph to look like this:
0 10 20 30 40 50 60 70 80 90 1000
20
40
60
80
100
120
Revenue (£)
Valu
e (£
)
0 10 20 30 40 50 60 70 80 90 1000
20
40
60
80
100
120
Revenue (£)
Valu
e (£
)
If our company has the blue characteristic, its implied value is around £70 million (rather than £60 million). But if it has the green characteristic, its implied value is around £50 million.
Taking simple averages of data, without thinking hard about what these averages mean, can lead us to unreliable valuations.
But how do we go about identifying truly comparable companies?The first step is to identify the market or sector of the company being valued. But that’s merely the first step – we should go further than that, because the company will be within a particular market segment or sub‑sector that forms only a part of its market or sector as a whole. For example, Burberry and Sports Direct are both clothing and personal retailers but they have vastly different operations, target markets, and so on. To consider just one aspect, Burberry sells luxury clothing, selling at low volume and high margin; Sports Direct sells mass‑market goods at high volume and low margin.
The “average” company: traps for the unwary
13
Enabling better decisions | Deloitte Economics, Valuation and Modelling practice
We then must assess the value drivers for the company, industry and similar industries and/or companies. These are often summarised into a multiple: a price or value divided by the key characteristic or variable, such as revenue. At this point, averages can start to fail. We need to understand how the relationship between the key characteristic or variable and the multiple changes. For example, is the change linear – as revenue increases, value increases – or does value increase at a slower rate, the higher revenue gets? We also need to grasp what the pattern and distribution of the relationship looks like. For example, regardless of the average multiple of value over revenue, are the multiples very different for companies with revenue larger than the average, or smaller than the average?
Another important consideration in valuing a company is understanding its risk‑return profile. This is usually described as the relationship between the risks a company takes and the return it achieves for its owners. But aside from the overall level of risk and of return, the nature of the risk faced by companies can be very different, even within the same industry. For example, Ryanair shares many similar risks with British Airways, such as its exposure to oil prices. But their risks also differ in many significant ways, because whilst British Airways serves both long and short‑haul flights worldwide, Ryanair is focused on short‑haul in Europe. It is best, where possible, to concentrate on comparative analysis of companies within the same industry with similar risk and return profiles. However, at times a company in a different industry may have more relevant risk/reward characteristics than the same industry. A good comprehension of risk and return is all the more crucial in these uncertain times.
There is no average pilot In the mid‑1920s the U.S. Air Force designed a standardised cockpit for its growing fleet of planes. To do so, it measured its pilots’ heights, leg lengths, wingspans, and so on. The cockpit’s dimensions were based on the average for each of these figures.
But by the late 1940s USAF officials were scratching their heads. The Force was continually losing pilots in crashes: 17 in one day alone. Investigators initially blamed this on pilot error, after identifying a link to the use of controls. However, they then decided to come up with a new average, on assuming that pilots had grown bigger over the previous 20 years.
However, Lt Gilbert Daniels took a different approach. After sizing up 4,000 pilots in 10 measurements, he found that they were too diverse to fit a standard cockpit: not a single pilot conformed to the average in all 10 measurements. A standardised cockpit would not fit anyone. Eureka! In response, the USAF designed adjustable cockpits. The number of crashes plummeted.
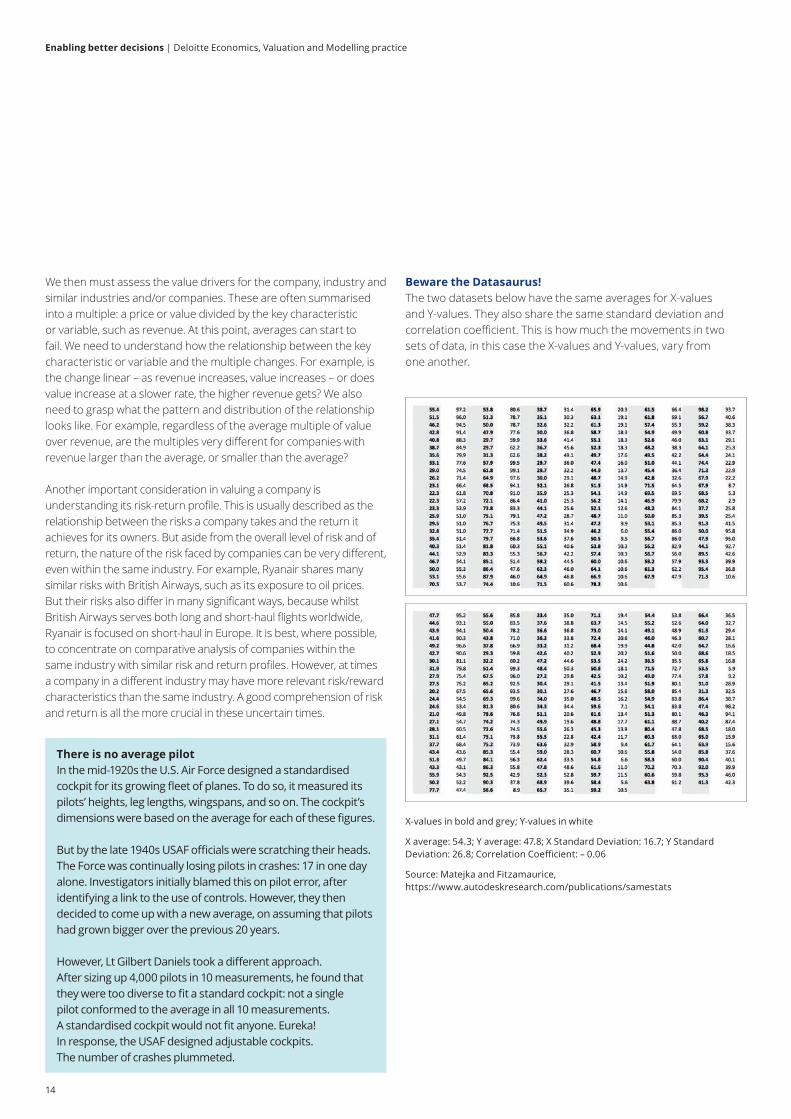
Beware the Datasaurus!The two datasets below have the same averages for X‑values and Y‑values. They also share the same standard deviation and correlation coefficient. This is how much the movements in two sets of data, in this case the X‑values and Y‑values, vary from one another.
X‑values in bold and grey; Y‑values in white
X average: 54.3; Y average: 47.8; X Standard Deviation: 16.7; Y Standard Deviation: 26.8; Correlation Coefficient: – 0.06
Source: Matejka and Fitzamaurice, https://www.autodeskresearch.com/publications/samestats
14
Enabling better decisions | Deloitte Economics, Valuation and Modelling practice
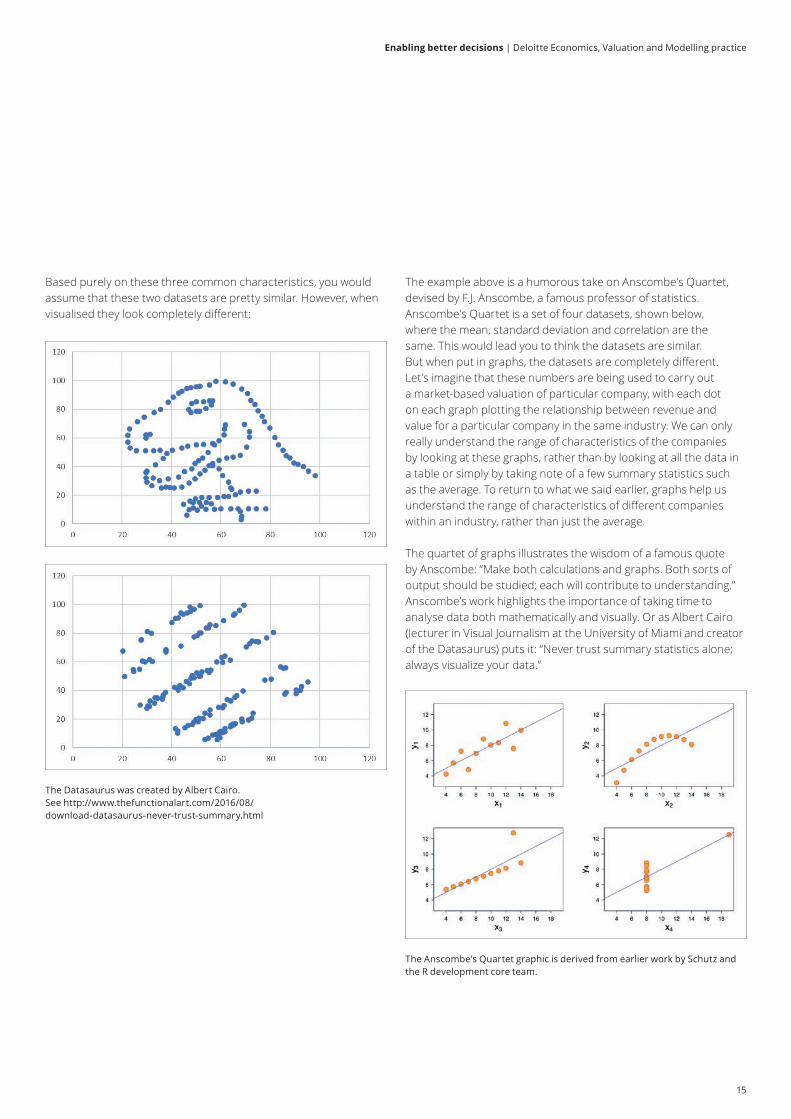
Based purely on these three common characteristics, you would assume that these two datasets are pretty similar. However, when visualised they look completely different:
The Datasaurus was created by Albert Cairo. See http://www.thefunctionalart.com/2016/08/download‑datasaurus‑never‑trust‑summary.html
The example above is a humorous take on Anscombe’s Quartet, devised by F.J. Anscombe, a famous professor of statistics. Anscombe’s Quartet is a set of four datasets, shown below, where the mean, standard deviation and correlation are the same. This would lead you to think the datasets are similar. But when put in graphs, the datasets are completely different. Let’s imagine that these numbers are being used to carry out a market‑based valuation of particular company, with each dot on each graph plotting the relationship between revenue and value for a particular company in the same industry. We can only really understand the range of characteristics of the companies by looking at these graphs, rather than by looking at all the data in a table or simply by taking note of a few summary statistics such as the average. To return to what we said earlier, graphs help us understand the range of characteristics of different companies within an industry, rather than just the average.
The quartet of graphs illustrates the wisdom of a famous quote by Anscombe: “Make both calculations and graphs. Both sorts of output should be studied; each will contribute to understanding.” Anscombe’s work highlights the importance of taking time to analyse data both mathematically and visually. Or as Albert Cairo (lecturer in Visual Journalism at the University of Miami and creator of the Datasaurus) puts it: “Never trust summary statistics alone; always visualize your data.”
The Anscombe’s Quartet graphic is derived from earlier work by Schutz and the R development core team.
15
Enabling better decisions | Deloitte Economics, Valuation and Modelling practice

Should we trust averages?This is not to say we can never trust the average. Where we are working out the value of the company by using a small selection of very similar companies, an average can be appropriate. When using a large selection, the average provides a distorted view of the whole. Instead, we must attempt to control for the difference between companies to adjust the valuation appropriately. However, companies are like people: very few are average across the board. Just as we prefer clothes that fit just right, it often makes sense to concentrate on finding the one multiple that best captures the valuation dynamic of the company. That multiple may be from the company that exhibits the closest risk‑return profile to the company being valued; it may be the multiple that captures the strongest relationship between the company’s key characteristics and value in some other way. Valuation is all about contextualising the data and analysis with industry knowledge and commercial logic.
Average returnsCan you guess the most common return on the US stock market since 1926? In other words, if your great‑grandparents had bought shares in a US company for their descendants in that year and you wanted to sell the shares now, what is the most likely gain your family would have made?
The most common return is negative 100%. In other words, your great‑grandparent’s legacy would be worth nothing at all.
3683
<-75
%
-50%
-25%
836
0.0%
964
25%
1167
50%
840
75%
621
100%
487
125%
448
150%
353
175%
334
200%
364
225%
201
250%
171
275%
179
300%
148
>300
%28
44
915
The chart above shows the total returns of individual US stocks between 1989 and 2015. A disproportionate number of stocks enjoyed huge returns of more than 300%. But a disproportionate number also lost the vast bulk of their value: 75% or more. Source: Longboard Funds
The distribution of returns is not conventional. According to research by Hendrik Bessembinder, a professor in finance at Arizona State University, the entire net gain in the US stock market since 1926 is attributable to just 4% of listed stocks. Simply taking an average of stock returns hides the enormously skewed performance of companies. In private equity returns can be even more extreme, since the alternatives of a total loss of value on the one hand or an exponential gain on the other are often realised in years, or even months, rather than decades.
This teaches us two important things about averages. One is that placing too much weight on the most common outcome among all the possible outcomes – known as the mode – can be unhelpful when valuing companies. Another is that, when it comes to corporate performance, a relatively small number of outliers can generate the bulk of the return. If this is the case, the calculation of average performance is not so relevant.
How useful is the average?Given all the problems with relying on averages to value companies, what’s the best course of action?
Where we have a small selection of very similar companies, taking an average can be appropriate, but we must then consider what kind of average is best. Sometimes that might be the median company – the one sitting in the middle of the results, such as the fifth company out of nine – because the median is less likely to be distorted by large outliers. Sometimes that might be the mean – the mathematical average of all the companies in our dataset.
But using too large a selection to work out the average provides a distorted view. Moreover, sometimes it’s best to dispense with the average altogether when valuing a business. In the end, deciding what the most appropriate average is, or whether to use an average at all to value a business, is a matter of judgement based on intimate knowledge of the company’s fundamentals, risk/reward profile and industry it operates in. Anyone valuing a business can never rely entirely on maths; even the average person could tell you that.
16
Enabling better decisions | Deloitte Economics, Valuation and Modelling practice

Economics
Sam BlackiePartner, Financial Advisory +44 20 7007 [email protected]
Andrew BarrosoDirector, Financial Advisory +44 20 7303 [email protected]
Neil ClementsDirector, Financial Advisory +44 20 7303 [email protected]
Valuations
Andrew RobinsonPartner, Financial Advisory +44 20 7007 [email protected]
Stuart GeddiePartner, Financial Advisory +44 20 7007 [email protected]
Phil ReesPartner, Financial Advisory +44 20 7007 [email protected]
Jonathan DanielDirector, Financial Advisory +44 20 7007 [email protected]
Doug EastmanDirector, Financial Advisory +44 20 7303 [email protected]
Rob GoreDirector, Financial Advisory +44 20 7007 [email protected]
Colin TaitDirector, Financial Advisory +44 131 535 [email protected]
Alexandre Tresgallo PardoDirector, Financial Advisory +44 20 7303 [email protected]
Suzanne TilstoneDirector, Tax +44 115 936 [email protected]
Modelling
Iain Williams Partner, Financial Advisory +44 20 7303 [email protected]
Martyn SullivanPartner, Financial Advisory+44 20 7007 [email protected]
Robert DeePartner, Financial Advisory +44 20 7007 [email protected]
Martin DavittDirector, Financial Advisory +44 20 7007 [email protected]
Steve XingDirector, Financial Advisory +44 20 7303 [email protected]
Danny HeronDirector, Financial Advisory +44 20 7303 7722 [email protected]
John PoultonDirector, Financial Advisory +44 20 7303 [email protected]
UK contacts
17
Enabling better decisions | Deloitte Economics, Valuation and Modelling practice

Valuation and Modelling
Austria
Alexander HohendannerPartner, Financial Advisory [email protected]
Belgium
Cedric PopaPartner, M&A Transactions Services + [email protected]
Central Europe
Jan Marek (V)Partner, Financial Advisory+420246042 [email protected]
Cyprus
Nicos KyriakidesPartner, Financial Advisory [email protected]
Denmark
Tinus Bang ChristensenPartner, Financial Advisory [email protected]
Finland
Kirsi Vuorela Director, Financial Advisory [email protected]
France
Christian PajotPartner, Finance [email protected]
Germany
Andreas Becker (V)Partner, Financial [email protected]
Joerg Niemeyer (M)Partner, Financial [email protected]
Gibraltar
Stephen ReyesPartner, Tax and [email protected]
Greece
Alexis DamalasPartner, Financial Advisory+302106781310 [email protected]
Iceland
Lovisa Anna FinnbjornsdottirPartner, Financial Advisory+354 580 [email protected]
Ireland
David Hegarty (M)Director, Financial Advisory+35 314 [email protected]
Lynda Melady (V) Director, Financial Advisory+35 314 [email protected]
Italy
Marco VulpianiPartner, Financial Advisory+39 [email protected]
Luxembourg
Pierre MassetPartner, Strategy Regulatory & Corporate Finance+35 245 [email protected]
Middle East
Ben Moore (V)Partner, Financial Advisory +971 4 506 [email protected]
Andrew Kirby (M)Director, Financial Advisory Corporate Finance +97 [email protected]
EMEA contacts
(V) = Valuation (M) = Modelling
18
Enabling better decisions | Deloitte Economics, Valuation and Modelling practice

Netherlands
Jeroen Van der WalPartner, Financial Advisory [email protected]
Norway
Remi‑Andre Eliassen (V)Director, Financial Advisory [email protected]
Ragnar Nesdal (M) Partner, Financial [email protected]
Portugal
Joaquim Paulo Partner, Financial [email protected]
Russia/CIS
Alexei Voronkin (V)Partner, Financial [email protected]
Anton Shulga (M)Partner, Financial [email protected]
South Africa
Sean McPheePartner, Financial Advisory +27 11 [email protected]
Spain
Jesus ValeroPartner, Financial Advisory +34 91 438 [email protected]
Sweden
Mats LindqvistPartner, Financial Advisory +46 75 246 [email protected]
Switzerland
Igor Heinzer (V)Director, Financial Advisory+41 58 279 [email protected]
Matt Lock (M)Director, Financial Advisory+41 58 279 [email protected]
Turkey
Gökhan AltunPartner, Financial advisory [email protected]
19
Enabling better decisions | Deloitte Economics, Valuation and Modelling practice

We advise clients on transactions, reorganizations, business planning, investment decisions, regulatory and commercial matters.
Our specialists provide deep industry insights alongside market leading analysis.
Our UK team includes 10 partners and 125 practitioners. Our clients regularly require global solutions and we work closely with our global teams of 200+ partners and 1,500 practitioners
Deloitte Economics, Valuation and Modelling: enabling better decisions
Valuation
ModellingEc
onom
ics
Review
Insight
Opinion
transformations
Strategy &Regulatory &
Competition Tr
ansa
ctio
ns
Using advanced modelling technique and tools to...• Integrate multiple datasets• Build insightful relationships
between historical outcomes and economic and social changes predictions
• Visualise data and forecasting outcomes
Putting a financial analyst lens on...• Investment decisions• Management and board governance
requirements• Merger and JV implementation
Teaming with strategists to...• Provide analytical support for
shareholder return propositions
Providing economic insight and thought leadership for...• Social change and impact of
globalisation• Regulatory developments and
challenges• Impact of behavioural biases on
consumer demand and supply (”Behavioural Economics”)
20
Enabling better decisions | Deloitte Economics, Valuation and Modelling practice


This publication has been written in general terms and we recommend that you obtain professional advice before acting or refraining from action on any of the contents of this publication. Deloitte LLP accepts no liability for any loss occasioned to any person acting or refraining from action as a result of any material in this publication.
Deloitte LLP is a limited liability partnership registered in England and Wales with registered number OC303675 and its registered office at 2 New Street Square, London EC4A 3BZ, United Kingdom.
Deloitte LLP is the United Kingdom affiliate of Deloitte NWE LLP, a member firm of Deloitte Touche Tohmatsu Limited, a UK private company limited by guarantee (“DTTL”). DTTL and each of its member firms are legally separate and independent entities. DTTL and Deloitte NWE LLP do not provide services to clients. Please see www.deloitte.com/about to learn more about our global network of member firms.
© 2018 Deloitte LLP. All rights reserved.
Designed and produced by The Creative Studio at Deloitte, London. J14485