
Organisational learning, strategic rigidity and technology adoption ...

ENABLERS FOR ADOPTION OF E-LEARNING TECHNOLOGY IN ANTI-MONEY
LAUNDERING TRAINING IN UAE BANKS
A THESIS IN ENGINEERING SYSTEMS MANAGEMENT
Presented to the faculty of American University of Sharjah School of Engineering In partial fulfillment of
the requirements for the degree
MASTER OF SCIENCE
by Alya Hussain Al Hammadi
B.S. 2002
Sharjah, UAE May 2007

ii
© 2007
Alya Hussain Al Hammadi
ALL RIGHTS RESERVED

iii
We approve the thesis of Alya Hussain AL Hammadi
Date of signature
__________________ _______________ Imran Zualkernan Assistant Professor Thesis Advisor __________________ _______________ Rana Ahmed Associate Professor Graduate Committee
__________________ _______________ Narasimhaiah Gorla Associate Professor Graduate Committee
__________________ _______________ Ibrahim Y. Al Kattan ESM Program Director
__________________ _______________ Yousef Al-Assaf Dean, School of Engineering
__________________ _______________ Robert Cook Dean, Graduate Studies & Research

iv
Abstract
Like other organization-wide compliance training regimes, e-Learning technologies
also provide an ideal platform for anti-money laundering training in the banking sector.
The past 9/11 environment and the recent monetary penalties borne by banks engaged in
money laundering activities make the adoption of this technology even more impending.
This thesis develops a model for investigating the diffusion of e-Learning technologies in
the banking sector.
The model incorporates factors from a host of theories including Innovation
Characteristics (Relative Advantage, Compatibility, Complexity, Triability and
Observability), Organization Characteristics (Top Management Support, Championship,
Centralization, Formalization, Internal Influence, External Influence and Organization
Slack), Environmental Characteristics (External Pressure, Competition and Coercive
Influence), E-learning Readiness, Stages for Anti-money laundering, Banks Categories
(Innovators, Early Adopters, Early Majority, Late Majority and Laggards) and Degree of
Adoption. This model is subsequently applied to examine the extent to which e-Learning
technologies for anti-money laundering training are being used in UAE banks.
This research uses a qualitative research approach through a questionnaire to conduct
the investigation. The exploratory study incorporating most major banks in the UAE
shows that a host of usual factors related to Innovation, Organization and Environmental
Characteristics do not explain why certain banks have not adopted the technology for e-
Learning in the UAE. However, E-learning Readiness and the perceived Complexity of
the e-Learning technologies seem to explain why banks have not adopted e-Learning.

v
This thesis makes two contributions. First, a detailed model incorporating a large
number of factors to study the diffusion of e-Learning innovations in the banking sector
is developed. Secondly, this model has been applied to banks in the UAE to determine
the characteristics of factors that have led to the adoption of this technology.

vi
Table of Contents
Title Page……………………………………………………………………...i Abstract.……………………………………………………………………...iv Table of Content ……………………………………………………………vi List of Tables ……………………………………………………………....viii List of Figures ……………………………………………………………….ix Chapter 1 – Introduction……………………………………………………...1
1.1 What is Anti-Money Laundering (AML)?............................................1 1.2 Research background………………………………………………....2 1.3 What is E-learning?..............................................................................4 1.4 Structure of the thesis………………………………………………...5 1.5 Summary of Chapter………………………………………………....6
Chapter 2 - Literature Review………………………………………………..7 2.1 The nature of the banking industry in UAE…………………….……7 2.2 History of anti-money laundering (AML) in UAE banks…………….9 2.3 E-learning……………………………………………………………10 2.4 E-learning in the banking sector……………………………………..11 2.5 The benefits of e-learning use in the banking industry………………15 2.6 Research problem statement…………………………………………16 2.7 Research scope and objectives……………………………………….17 2.8 Significance of the Results …………………………………………..17 2.9 Summary of Chapter…………………………………………………18
Chapter 3 - Model Development…………………………………………….19 3.1 Theoretical Background………………………………………………19 3.2 Research Model………………………………………………………24
3.2.1 Innovation Characteristics………………………………….25 3.2.2 Organization Characteristics………………………………..27 3.2.3 Environmental Characteristics……………………………...28 3.2.4 Banks categories……………………………………………29 3.2.5 E-learning Readiness……………………………………….30 3.2.6 Stages for anti-money laundering…………………………..31 3.2.7 Degree of Adoption…………………………………………33
3.3 Summary of Chapter………………………………………………….33 Chapter 4 - Research method and design…………………………………….35
4.1 Survey design and validation…………………………………………35 4.1.1 E-learning Adoption Construct……………………………..36 4.1.2 Banks Categories……………………………………………38 4.1.3 Innovation Characteristics Construct……………………….39 4.1.4 Organization Characteristics Construct……………………..42 4.1.5 Environmental Characteristics Construct……………………44 4.1.6 E-learning Readiness Construct……………………………..45
4.2 Conducting the survey…………………………………………………47 4.3 Summary of Chapter…………………………………………………..50
Chapter 5 - Analysis and Discussion…………………………………………51 5.1 Research Question 1…………………………………………………..53

vii
5.1.1 Analysis of Variance………………………………………..53 5.1.2 Cluster Analysis…………………………………………….54 5.1.3 Banks Categories……………………………………………58
5.1.3.1 Dot plot……………………………………………59 5.1.3.2 Binary Logistic Regression……………………….62
5.2 Research Question 2 ………………………………………………….62 5.2.1 Analysis of Variance………………………………………..64 5.2.2 Binary Logistic Regression …………………………………66
5.2.2.1 Complexity ……………………………………….69 5.2.2.2 E-learning Readiness ……………………………..70
5.2.3 Relating Cluster analysis …………………………………...74 5.2.4 Banks Categories……………………………………………78
5.2.4.1 Dot plot……………………………………………79 5.2.4.2 Binary Logistic Regression………………………..82
5.3 Summary of the chapter……………………………………………….82 Chapter 6 – Conclusion ……………………………………………………….83 References……………………………………..………………………………87 Appendix A: Survey Questionnaire……………...…………………………….91 Appendix B: Detailed Statistics……………………………………………….109

viii
List of Tables
Table 4-1 Structure of the Survey…………………………………………………..41 Table 5-1 Statistics for e-learning variables………………………………………..57 Table 5-2 Statistics for national vs. multinational………………………………….59 Table 5-3 Statistics CG1 vs. CG2…………………………………………………..63 Table 5-4 Statistics for NEL and UEL groups………………………………...…...70 Table 5-5 Significant statistics for E-Learning Readiness for NEL group and UEL group …………………………………….......76 Table 5-6 Non-significant statistics for E-Learning Readiness for NEL group and UEL group…………………………………………77 Table 5-7 Significant statistics for CG1 vs. CG2 (from K-means clustering)………………………………………….79 Table 5-8 Statistics for E-learning Readiness for CG1 vs. CG2………………......80

ix
List of Figures
Figure 2-1 Total number of employees in national banks vs. multinational banks……………………………………………….14 Figure 2-2 Total number of banks and branches in national banks vs. multinational banks…………………………………………….14 Figure 2-3 Percentage of investment in e-learning…………………………………...18 Figure 3-1 Research Model…………………………………………………………..30 Figure 4-1 Respondent’s role in the bank……………………………………………52 Figure 4-2 Number of year’s respondents worked in the bank………………………53 Figure 4-3 Total Number of Employees (2004) – National Banks vs. Multinational Banks……………………………………………54 Figure 4-4 Net Profit Before Tax (2005) – National Banks vs. Multinational Banks……………………..…………………….55 Figure 5-1 Total Number of Employees (2004) for CG1 vs. CG2…….…………….60 Figure 5-2 Net Profit Before Tax for CG1 vs. CG2………………………………….61 Figure 5-3 Probability plot of total number of employees…………………………...61 Figure 5-4 Probability plot of net profit before tax…………………………………..62 Figure 5-5 Dot plot for Innovators vs. Bank Nationality…………………………….64 Figure 5-6 Dot plot for Early Adopters vs. Bank Nationality………………………..65 Figure 5-7 Dot plot for Early Majority vs. Bank Nationality………………………...65 Figure 5-8 Dot plot for Late Majority vs. Bank Nationality………………………….66 Figure 5-9 Dot plot for Laggards vs. Bank Nationality………………………………66 Figure 5-10 Total Number of Employees – UEL group (2) vs. NEL group (1)………………………………………………….68 Figure 5-11 Net Profit Before Tax – UEL group (2) vs. NEL group (1)……………..69 Figure 5-12 dot plot of total number of employees versus using e-learning……………………………………………………73 Figure 5-13 dot plot of net profit before tax versus using e-learning…………………73 Figure 5-14 Dot plot for Complexity variable………………………………………..74 Figure 5-15 Dot plot for E-learning Readiness variable………………………………75 Figure 5-16 Dot plot for Innovators variable………………………………………….84 Figure 5-17 Dot plot for Early Adopters variable…………………………………….84 Figure 5-18 Dot plot for Early Majority variable……………………………………..85 Figure 5-19 Dot plot for Late Majority variable……………………………………...85 Figure 5-20 Dot plot for Laggards variable…………………………………………..86

1
Chapter 1
Introduction
This research studies the use of e-learning for anti-money laundering (AML)
among banks in UAE. The research examines factors that affect the adoption of e-
learning for anti-money laundering training in the banking industry in the UAE. The
primary research objective is to develop a framework for banks to consider when
formulating strategic plans for a successful diffusion of e-learning as a technology within
their organizations. Specifically, this exploratory research examines various factors
affecting the adoption and utilization of e-learning for anti-money laundering in banks in
the UAE. This research uses a qualitative research approach through a questionnaire to
conduct the investigation.
The aim of the research is to determine the extent to which banks in UAE are
using e-learning to address the regulatory compliance issues of anti-money laundering
and identifying the areas in which e-learning might help in achieving the compliance
level. The outcome of the research is a framework that helps improve our understanding
of e-learning diffusion and to develop an improved model for adoption of e-learning for
anti-money laundering (AML) training.
This chapter provides an overview and outlines the scope of the thesis. The
chapter explains what is anti-money laundering, what is e-learning and a background of
the research.
1.1 What is Anti-Money Laundering (AML)?
UAE central bank defines money laundering as “the purchase of securities with funds,
whose source is not identified accurately, or emanating from an unknown or disguised

2
source, so that it appears to have originated from a legitimate source, where in fact it has
not.” [1]
Money laundering is considered one of the vital problems that affects security of the
financial systems of a country. Money laundering is defined as the process of the criminal
profits to cover their illegal origin where this process enables the criminal to use these
profits without jeopardizing their source. When a criminal activity generates large profits,
the individual or group involved must find a way to control the funds without attracting
attention to the underlying activity. Criminals do this by masking the sources, changing
the form, or moving the funds to a place where they are less likely to attract attention [2],
[3].
1.2 Research background
During the last decades, money laundering has emerged in financial systems due to
the evolution of information communication technologies (ICTs). In order to control
money laundering, new international, regional and national organizations have emerged
to provide guidelines and dictate the rules that jurisdictions have to put in place and to
which financial organizations (i.e. banking organizations), have to comply with. Hence, it
is important to understand the way in which regulators and banking organizations interact
to develop and implement anti-money laundering (AML) regulations which are aimed at
minimizing the risk of money laundering activities. [4]
In recent years, and especially since the events of September 11, 2001, worldwide
efforts show heightened importance to combating money laundering. Anti-money
laundering programs are now considered as a key tool to ensure the quality of a bank's

3
reputation and integrity in the market. This is due to the increased risks and penalties of
the USA Patriot Act, and due to a recognition of the importance of identifying suspicious
transactions [5].
The International Monetary Fund (IMF) and the World Bank have now become
vigorously involved in anti-money laundering issues, and they have included anti- money
laundering issues into their country assessments. They are also providing technical
assistance to help strengthen the anti-money laundering and anti-terrorist framework in
member countries. According to Celent Communications, financial institutions spent an
estimated $632 million on anti-money laundering software and related hardware and
services between 2003 and 2005 [4].
In addition, adoption of anti-money laundering technologies is becoming a fact, as
banks around the world increasingly see the need to comply with U.S policies. In Europe,
a number of countries, including the U.K. and Germany, have had anti-money laundering
regulations on the books since the early 1990s [6]. While in Asia, countries that have
recently adopted or are working on new anti-money laundering regulations include
China, Japan, India, Oman, Pakistan, the Philippines, South Korea, Thailand and the
UAE, to name a few [4]. Accordingly, organizations not only have to adapt current
systems and processes to meet these new regulations, but they face a challenge in having
to quickly educate their large and geographically distributed workforce as well [6].
Banks must conduct ongoing education programs for the staff to review money
laundering techniques, anti-money laundering procedures and changes in applicable laws
and regulations. Regular training needs to include procedures on how to identify and
follow up on unusual or suspicious activities. The bank also must train not only all

4
personnel who have account relationships but also train appropriate back-office
personnel. Hence, all new employees need guidelines concerning anti-money laundering
procedures [7].
1.3 What is E-learning?
E-learning uses information and communications technologies (ICTs) to deliver
content (learning, knowledge, skills) on a one-way or two-way basis. One-way
(asynchronous) technologies include broadcast television that delivers learning content,
film, video, digital video disk (DVD), computers, CD-ROMs, internet/intranet/extranet
networks and wireless technologies. Two way (synchronous) technologies, on the other
hand include teleconferencing, internet/intranet networks, web conferencing and wireless
technologies [8].
Since compliance requirements often changes, e-learning provides an effective
method of training bank employees on the newest regulations. However, to use this
technology effectively, banks must ensure that employees are aware of the available
training and that the coursework meets their needs [9]. If banks decide to join and expand
their e-learning intervention, it is important to assess their readiness to utilize technology
in order to implement e-learning successfully and to adjust their e-learning
implementation strategies. Therefore, there should be a complete readiness assessment
for e-learning in order to decrease the risk of any failure in implementing e-learning for
anti-money laundering in the banking industry [10].
Organizations across all industries are adopting rapidly e-learning strategies to meet
compliance issues. By reforming educational content, reducing travel costs and allowing

5
organizations to implement training programs, e-learning is considered as the most
effective solution to educate employees in meeting regulatory compliance as well as
keeping them aware of general industry changes [6].
The research proposed here examines factors that affect the adoption of e-learning for
anti-money laundering in the banking industry in the UAE. The research also develops a
framework for banks to consider when formulating strategic plans for a successful
diffusion of e-learning as a technology within their organizations.
1.4 Structure of the thesis
This thesis consists of seven chapters. Chapter 1 introduces an overall view of this
research. This chapter addresses the research background, the research problem
statement, research questions, research scope, and objectives and aims. Moreover, the
definition of e-learning and anti-money laundering (AML) is given in chapter 1.
Chapter 2 reviews the literature related to e-learning and AML in the banking industry
and in UAE banks. The purpose of this chapter is to review the previous relevant research
studies regarding implementation and diffusion of e-learning innovation for anti-money
laundering training within an organization. Specifically, this chapter aims to provide
basic knowledge on how innovation diffusion theory could assist in explaining e-learning
implementation in the banking industry.
Chapter 3 introduces the theoretical background that helped in developing the research
model and to examine the factors that affect the adoption and diffusion of e-learning into
organizations. This chapter presents the theoretical framework and a model for the
diffusion and adoption of e-learning.

6
Chapter 4 highlights the steps that were used to design and conduct the survey. This
research uses a qualitative research approach through a questionnaire to conduct the
investigation based on the model presented in the earlier chapter. Specifically, the survey
examines various factors affecting the adoption and utilization of e-learning for anti-
money laundering in banks in the UAE.
Chapter 5 presents a detailed analysis and discussion of each variable that was
presented in the survey. Moreover, this chapter demonstrates the findings that related to
the research questions. Chapters 6 and 7 discuss the research contribution made by this
work and present recommendations for further research and practice. It concludes with
suggestions of future research some that needs to be explored.
1.5 Summary of Chapter
This chapter provides an introduction to this research study. The research will focuses
on determining the extent to which banks in UAE are using e-learning to address the
regulatory compliance issues of anti money laundering, identifying the areas in which e-
learning might help in achieving the compliance level. Finally an outline of the thesis
structure is given.

7
Chapter 2
Literature Review
The purpose of this chapter is to review the previous relevant research studies
regarding implementation and diffusion of e-learning innovation for anti-money
laundering training within an organization. Specifically, this chapter aims to provide
basic knowledge on how innovation diffusion theory could assist in explaining e-learning
implementation in the banking industry. This chapter is organized into three sections.
First, the review begins with issues related to the nature of the banking sector in UAE.
Second, the chapter highlights the history of anti-money laundering (AML) in UAE
banks. The last section reviews the relationship between e-learning and anti-money
laundering (AML) and benefits of e-learning. These sections provide a broad view of e-
learning technological innovation and e-learning for AML.
2.1 The nature of the banking industry in UAE
The banking industry makes a significant business contribution to many national
economies and to the economic growth. Adoption of technology in various operational
areas plays a critical role in deciding the leader and the laggard in the banking industry.
Since bank employees typically come from different educational backgrounds it is
essential to enhance their awareness and transfer of knowledge and technology in an easy
and efficient manner. According to the UAE central bank, UAE’s banking sector is one
of the most competitive, with nearly 47 banks operating in the UAE [11]. With intense
competition, banks in the UAE have struggled to improve their customer service levels
and to launch innovative products. According to the UAE central bank, Figure 2-1 shows

8
that there are more than 20,000 people working in the banks who should be trained.
Moreover, Figure 2-2 indicates that for the 47 major bank operating in the UAE are
geographically dispersed because there are more than 500 national banks and branches
and more than 100 multinational banks and branches in the UAE.
Total Number of Employees (2004)
0
2000
4000
6000
8000
10000
12000
14000
16000
National Banks Multinational Banks
Total Number of Employees
(2004)
Figure 2-1 Total number of employees in national banks vs. multinational banks
Source: UAE Central Bank
0
50
100
150
200
250
300
350
400
450
500
550
National Banks Multinational Banks
Total Number of banks and
branches
Head Offices
Branches
Pay Offices
Electronic Banking Service
Units
Figure 2-2 Total number of banks and branches in national banks vs. multinational banks Source: UAE Central Bank

9
2.2 History of anti-money laundering (AML) in UAE banks
The UAE government has been aware of the possibility of banks and other financial
institutions in the country being used for money laundering activities. Accordingly, the
Central Bank of the UAE established a special unit for investigating fraud and suspicious
transactions in July 1998, which was given the title “Anti-Money Laundering and
Suspicious Cases Unit” (AMLSCU) in November 2000. The Unit has access to all
relevant authorities in the UAE as well as those abroad, under the aegis of the National
Anti-Money Laundering Committee. The promulgation of the Federal Law by the UAE
authorities regarding the criminalization of money laundering took place on January 22,
2002. The law defines money-laundering as “any act involving transfer, conversion of
deposit of property, or concealment or disguise of their true nature, knowing that such
property is derived from any of the stated offences which include trade in narcotics,
kidnapping, piracy or terrorism and offences in breach of international conventions to
which the UAE is a signatory, the agency stated” [1], [12], [13].
The UAE government has taken significant steps towards restricting money
laundering by inviting experts and representatives of international and regional bodies
and regulatory and law enforcement agencies as well as bankers and money changers in
Abu Dhabi in May, 2002. The UAE government is aware that money laundering can
harmfully affect the economic wealth and the future of the economic development of the
country [12], [13]. Moreover, UAE was one of the first countries who fought this
problem through assigning and forcing various regulations and procedures [12], [13].

10
2.3 E-learning
Employers can use e-learning to advance the knowledge and skills of their employees.
Employers can assess employees' learning needs, update content on a regular basis to
fulfill those needs, track and recognize employees' learning and deliver it at work or at
home through e-learning applications. One of the important features of e-learning is just-
in-time learning, where employers can integrate individual learning with organizational
needs and provide employees with the knowledge and skills they need when they need
them. Employees don't have to take entire courses; instead, they can receive the modules
of information and learning wherever they are [9].
E-learning is especially effective in linking learning with work. In addition, e-
learning allows employers to build a learning component into their employees' work.
Employers can customize the content design and to meet learning needs. With e-learning,
customization may also be easier and faster, and the quality of the content and instruction
may be improved, due to increased access to experts, multiple program choices and the
availability of different learning delivery methods. In short, e-learning provides the
opportunity for learning on the job what is needed, when it is needed [9].
Jean-Louis Michelet, Managing Director of international e-learning consultancy
(ICUS) indicates that e-learning provides the right platform for organizations to increase
awareness about anti-money laundering and compliance because of its consistency, cost
efficiency and ease of delivery [14]. Dow chemical provides a recent example of the
savings achieved through using e-learning in a largely compliance based training
environment. The company saved $3.4 million in one year using e-learning technology

11
from “WBT Systems” to replace instructor-led training. [15]. Jon Walker, director of IT
for Dow’s Human resources division, described Dow’s attempt in e-learning as “essential
for a company like Dow where health and safety training is mandatory for employees.”
[15]
Another firm, Liberty Group, is using e-learning to improve performance on the sales
side. Liberty Group was able to improve revenues by 20 percent, partly because it was
able to train its sales force on their own choosing prompting exam and testing rates to
increase by 25 percent. Moreover, new sales representatives increased by 35 percent,
because they were no longer spending significant amounts of time in classes, but were
learning electronically while on the job. The results and reviews of e-learning across
financial services and other industries have shown generally positive results [15].
2.4 E-learning in the banking sector
When a technology is new to a country or a region, the readiness of its people to adopt
it is a crucial issue. The related measures also must capture readiness in terms of a
country’s businesses, infrastructure and economy. The kinds of measurement that needs
to be supported are primarily exploratory inquiry and preliminary assessment, as well as
comparative analysis. As Figure 2-3 shows, in the U.S.A, for example, banking sector has
the highest percentage of investment into e-learning technology [9].

12
12%
11%
15%
17%
22%
29%
29%
35%
35%
37%
43%
65%
0% 10% 20% 30% 40% 50% 60% 70%
Other
Education
Transportation
Retail
Utilities
Manufacturing
Communications
Information Technology/high tech
Healthcare
Phamaceuticals
Government
Banking/financial services/insurance
Figure 2-3 Percentage of investment in e-learning
Compliance is a crucial part of the yearend evaluation for all employees in the
banking industry. People get evaluated not only by meeting financial goals, but also how
well they execute their compliance responsibilities. Constant knowledge transfer in the
banking sector is essential for making sure that compliance standards are well known and
not forgotten with a need for additional training. Therefore, the compliance committee in
the banks needs to ensure an ongoing training of the staff and the participation in relevant
seminars, workshops and lectures in order to keep in mind the money laundering-fighting
methods [16].
Banks must ensure that appropriate bank personnel are trained in all aspects of the
compliance and anti-money laundering policies and procedures. All financial institutions,
both banks and non-banks, are vulnerable to money laundering activities. However,
banks have taken the lead in developing programs to prevent and detect money

13
laundering [16]. A Financial Sector Assessment Program (FSAP) was recently conducted
in the UAE by visiting Financial Action Task Force and International Monetary Fund
(IMF) teams that concluded the UAE had established an adequate anti-money laundering
system [1]. According to the Governor of the Central Bank, the UAE is the first Arab
country to establish a Financial Intelligence Unit (FIU) at the Central Bank and to join
the Egmont Group of the world’s financial intelligence units [1].
Many institutions are using e-learning to train employees who must deal with
regulations and market conditions that differ from one country to another. For instance,
Credit Suisse Financial Services is using “TopClass” to provide compliance training for
50,000 employees. As a global institution, Credit Suisse has legal difficulties to clear
their reputation in a number of countries, and this creates a challenge in terms of training
worldwide staff and ensuring they are compliant in the countries in which they are based
and where they do business. The Swiss Federal Banking Commission, for example, has
been increasing the amount of regulatory control and monitoring of the Swiss financial
environment with anti-money laundering and client protection as key areas of concern
[17].
There is an increasing tendency for blended solutions, combining e-learning and
classroom training, highlighted by the global bank Barclays. The bank is reducing the
classroom training over the next couple of years, where they have a split of 90%
classroom and 10% e-learning. Hence, in less than five years, that number will be 40%
classroom and 60% e-learning [17]. According to Nucleus Research, in 2005 the business
technology displaying the highest Rate of Interest (ROI) was e-learning. Moreover,

14
Nucleus found that companies implementing e-learning solutions enjoy reduced travel,
human resources, regulatory compliance and customer support costs, as wells as
increased employee performance [2].
The regulators are also focusing on the role that technology can play in compliance
and in law enforcement. Banks will have to employ or enhance anti-money laundering
tools and technology to satisfy rising regulatory expectations. Banks compliance
challenges have been increasing with new USA Patriot Act regulations [5]. Banks must
understand the law and its impact on their business and take a risk based approach to
compliance. In order for banks to get successful results in this battle, the critical success
factors are consistent, comprehensive, and effective use of technology, and an anti-money
laundering product [2].
One e-learning provider, Englewood Cliffs, N.J.-based Worknowledge for example,
combines learning content, a technology platform, and consulting services into
customized learning solutions. Its tools enable banks to align corporate training with
corporate strategy by analyzing individual, department or company-wide performance
[15].
A South African financial institution, Alexander Forbes, is using compliance-based e-
learning software to help its staff navigate through regulated South African financial
market. New regulations like the Financial Intelligence Center Act and the Financial
Advisory Intermediary Services Act are forcing institutions in the land of Sun City to
ensure that employees are continuously trained to avoid regulatory breaches. Alexander
Forbes already had an extensive library of internal training materials, which is being

15
combined with “WBT's” and “TopClass” Compliance Modules. The institution is using
“TopClass” as an e-learning portal to manage its entire training process from authorizing
courses to registering all forms of learning including development, IT, sales, and legal
and compliance issues [15].
2.5 The benefits of e-learning use in the banking industry
E-learning might be considered as a preferred methodology to train employees for a
variety of reasons. First, e-learning leads to quicker, more accurate and consistent
training from an anti-money laundering compliance viewpoint. Second, e-learning is
considered as a managed approach that allows for continuous learning, which enables the
staff to monitor and report suspicious transactions. Third, from a regulatory perspective,
the audit trails of assessments prove to the regulator that effective training is being
conducted. Finally, from a cost perspective; e-learning is a long-term solution for cost
control if we consider the rising cost of training to achieve the anti- money laundering
focus that regulators want [18].
Another benefit that banks can gain through e-learning tools is the ability to track the
rate at which a user has been trained. Moreover, a major advantage of e-learning is
individualization by accessing a virtual classroom, the employee can move away from the
constraints of time and location [19].
Furthermore, e-learning has the following advantages for both the learner and the
organization. For the learner, retention rates are 25-60% higher in an interactive online
environment, especially for content such as combating money laundering, which has a
variety of compliance issues [18]. Meanwhile, for the organization, e-learning is cost-

16
effective, since the money gets invested in education, and not in logistics. In addition,
content is easily updated, and distributed, therefore keeping up with new laws and
regulations more efficiently on a continuous basis [18]. For example organizations such
as Commerce Bank have enjoyed similar success with their e-learning project, which like
First Niagara's effort, revolves around teaching compliance procedures [2]. The project
Commerce Bank has been effective with over a 95 percent success rate. "If we had to
train 4,000 employees in a classroom setting, the cost, including travel and time away
from their jobs, would be staggering." [2] Compliance training is the goal of yet another
e-learning initiative, at Hypovereins bank (HVB). The bank, the second-largest in
Germany, signed a one-year contract with GTF Systems, Danvers, Mass., to provide
more than 500 employees in its New York office with emagine, GTF's e-learning
management system [2].
Although implementing anti-money laundering solution can be a time consuming and
costly process, the risk of noncompliance and regulatory violations should compensate
the need for immediate investment returns on anti-money laundering technology.
However, with the right strategy in place, financial markets firms can turn their anti-
money laundering compliance systems into identification systems that may deliver
benefits beyond anti-money laundering regulatory demands [16].
2.6 Research problem statement
This research establishes the status of e-learning in the UAE banks and identifies the
specific impediments to diffusion of e-learning in the context of the UAE. More

17
specifically, this research is an explanatory study that explores the following research
questions:
Q1: What are the characteristics that distinguish the national banks from the
multinational banks in adopting the e-learning for anti-money laundering training?
Q2: What are the characteristics that significantly affect the banks who adopt e-
learning from those who did not adopt e-learning for anti-money laundering training?
2.7 Research scope and objectives
The research focuses on determining the extent to which banks in UAE are using e-
learning to address the regulatory compliance issues of anti-money laundering, and
identifying the areas in which e-learning might help in achieving the compliance level.
Specifically, this research examines how e-learning for anti-money laundering get
diffused into banks in the UAE. Factors that affect the adoption of the e-learning
innovation are examined. Finally, a framework of attributes that affect the adoption of e-
learning innovation in this context is introduced.
2.8 Significance of the Results
This research applies existing theories of innovation diffusion to the management of
actual e-learning implementation for anti-money laundering (AML) among banks in
UAE. In specifics, the contributions of the thesis are:
1. Develop a complete model for studying diffusion of e-learning for anti-money
laundering training in the banking industry that includes factors from multiple
perspectives.
2. Apply the model for anti-money laundering training in UAE banks and
formulating its characteristics.

18
2.9 Summary of Chapter
This chapter reviews the nature of the banking industry in the UAE, history of
anti-money laundering (AML) in UAE banks, and relationship between e-learning and
anti-money laundering (AML). Further, this chapter highlights the research problem
statement, research objectives and significance of the results.

19
Chapter 3
Model Development
The purpose of this chapter is to introduce the theoretical background that helped in
developing the research model and to examine the factors that affect the adoption and
diffusion of e-learning into organizations. This chapter presents the theoretical
framework and a model for the diffusion and adoption of e-learning.
3.1 Theoretical Background
The diffusion of innovations (DOI) has been the basis of a wide-ranging body of
research within the fields of information technology and information systems [20]. DOI
was first introduced by Everett Rogers in 1962. Rogers defines an innovation as “an idea,
practice, or object that is perceived as new by an individual…” [21] Everett Rogers
describes diffusion as ‘the process by which an innovation is communicated through
certain channels over time among the members of a social system’ [22]. The process of
diffusion is considered to revolve around four key elements: an idea or innovation,
channels of communication to spread knowledge of the innovation, time during which
diffusion takes place, and a social system of potential adopters in which this occurs [22].
Rogers defines five innovation attributes that are typically identified as being
important for rapid diffusion [22]:
- Relative Advantage: the degree to which the innovation is perceived to have
significant advantages over current alternatives. For example, the benefit
perceived by banks in adopting e-learning to conduct business as measured by
lower business cost or wider market coverage.

20
- Compatibility: the degree to which the innovation is seen as being consistent with
past practices, current values and existing needs. For example, how well banks
think the new innovation (i.e., e-learning) will fit into their existing business
process.
- Complexity: the degree to which the innovation can readily be understood and
easily implemented. For example, what is the perceived difficulty of banks in
adopting e-learning?
- Trialability: the degree to which new ideas that can be tried out at low costs
before adoption are more likely to be taken up. For example, e-learning is more
trialable if business conversion can be carried out in phases and if grant is
provided to cover high start-up costs.
- Observability: the degree to which the use and benefits of the innovation are
visible to others, and therefore act as a further stimulus to uptake by others. For
example, the bank’s ability to see beneficial results of using e-learning by other
businesses.
Rogers’ innovation–decision process provides a basic model for change. It consists of
five steps that typically occur in sequential order. This process involves gaining
awareness of the innovation, forming either a positive or a negative opinion about the
innovation, choosing to adopt or reject the innovation, using the innovation, and seeking
evidence that supports the decision to adopt or reject the innovation [22].
Along with specific strategies and models for change, researchers have looked at the
variables that influence the success or failure of implementing an innovation within an
organization. Bishop, Clark and Grant recommend a “top-down” implementation when

21
introducing computer technology in education. Top-down refers to “the involvement of
powerbrokers who provide a plan that includes needed resources, support, as well as
follow up to ensure the technology is being used correctly” [23]. Dhanarajan found the
lack of existing infrastructure (i.e., resources), lack of commitment from powerbrokers,
low level of skills, and the need to train intended users influenced implementation [24].
Dalton emphasized the importance of training for the adoption and diffusion of
computers in schools [25]. Herson, Sasabowski, LIoyd, Flowers, Paine, & Newton listed
knowledge and skills of users, involvement of the intended users in the development of
the product, and a perceived need to change old methods as factors that influenced
implementation [26]. Jost and Schneberger used information system models as a basis for
implementing educational technology [27]. Using this strategy they determined that
support from upper level management in the form of “funding”, “job redesign,” “rewards
and incentives,” “operational support” and “training” was essential, along with gaining
information from intended users when designing the innovation [28].
On the other hand, Rose identified four groups of barriers that impact implementation
of educational technologies [28]. Ebersole and Vornddam list numerous variables
affecting implementation including insufficient time, insufficient resources, lack of
leadership, and lack of skills and knowledge [29]. Pajo and Wallace reduced barriers to
web based technology in higher education into three [30]. The first factor, labeled
“personal variables,” includes variables related to inadequate time, inadequate skills, and
access to training [28]. The second factor, “attitudinal barriers,” includes variables related
to the general perception and feelings about the innovation [28]. The final factor,

22
“organizational barriers,” includes variables related to hardware, software, and technical
support [28].
Stockdill and Moreshouse [28] identified five factors (i.e. “educational need,” “user
characteristics,” “content characteristics,” “technological considerations,” and
“organizational capcity” p. 57). The factor, “organizational capacity,” refers to the
variables within the organization that influence the adoption of an innovation. These
include “staff,” “linkages,” “equipment,” “expertise,” “rewards,” and the “attitudes and
values of the individuals” (p.57) [28].
Different theories have been formulated to examine the adoption and diffusion of IT
innovations. For example, IT innovation research has investigated a large number of
theories, including Innovation Diffusion Theory, Innovation Diffusion Theory for
organizations, Technology Acceptance Model (TAM), Theory of Planned Behavior,
Perceived Characteristics of Innovating, Unified Theory of Acceptance and Use of
Technology, and Diffusion/Implementation Model [20]. Using these theories, several
innovations have been examined, such as electronic data interchange,
telecommunications technologies, database management systems, smart-card payment
systems, and computer-aided software engineering tools [31].
Moreover, these theories propose different variables, such as innovation
characteristics, organizational characteristics, and environmental characteristics.
Innovation characteristics include Relative Advantage, Complexity, Compatibility,
Observability, and Trialability. Organizational characteristics include Top Management
Support, Championship, Organization Structure, Centralization and Formalization,

23
Internal Influence and External Influence, Organization Size, and Organization Slack [20].
Environmental characteristics include External Pressure, Competition, and Coercive
Influence [31].
From diffusion theory, technology characteristics are an important factor influencing
e-learning adoption. Tornatzky and Klein [32] found that innovation characteristics have
a relationship to innovation adoption. Generally, users are more likely to use technology
that has a high relative advantage to them in performing their job. On the other hand, if
technology cannot provide advantages to users, they will be hesitant to use it. As a result,
the relative advantage attributes have an influence on users’ perception of technology
[32].
In addition, Ramamurthy [33] also found that compatibility has a positive influence on
organizational IT/ICT adoption and implementation. Other technology attributes are
speed, reliability and accessibility. Speed makes users improve their productivity by
using IT/ICT technology compared with manual or previous systems. However, if users
feel that these applications lack speed and reliability, they may not be willing to use them.
Further, users might not be provided with the necessary access to use an ICT application
due to resource limitations which might be a barrier to their ICT use [33].
The IT/ICT diffusion process can be seen as a process of a change within an
organization, so we need commitment from both users’ and their organization [33]. An
organization’s top management also needs to be committed to support and allocate
adequate resources for technology investment [33].

24
3.2 Research Model
To explore the essential factors that influence e-learning diffusion with UAE banks,
figure 3-1 demonstrates the model that was constructed based on the theories discussed
above to be the base of this research.
Figure 3-1 Research Model
This model helps to improve the understanding of e-learning diffusion in UAE banks.
The model consists of seven main entities, namely innovation characteristics,
organization characteristics, environmental characteristics, e-learning readiness, stages
for anti-money laundering, banks categories and degree of adoption.
Adoption of E-
learning in UAE
banks
Environmental
Characteristics • External Pressure
• Competition
• Coercive Influence
Innovation
Characteristics
Degree of
Adoption
• Relative Advantage
• Compatibility
• Complexity
• Triability
• Observability
Banks
Categories Stages for
AML
E-learning
Readiness Organization
Characteristics • Innovators
• Early Adopters
• Early Majority
• Late Majority
• Laggards
• Top Management Support
• Championship
• Centralization
• Formalization
• Internal Influence
• E-learning Adoption
• E-learning for Compliance
• E-learning Content Development
• E-learning for AML Training
•AML Policy
•Human Resources
•AML Training Program
•Management Commitment
•Organization Readiness
•Technology Utilization
•Workforce
•Experience in E-learning
•Management Support

25
3.2.1 Innovation Characteristics
The first entity, innovation characteristics includes the following variables: Relative
Advantage, Compatibility, Complexity, Triability and Observability. This entity is
mainly used to examine the innovation characteristics that will affect the adoption of e-
learning for AML training. Relative Advantage is the degree to which the innovation is
perceived to have significant advantages over existing alternatives. So, e-learning is more
effective when compared to other forms of education/training in addressing the
regulatory compliance issues of anti-money laundering. This variable examines whether
e-learning for anti-money laundering training improves the quality of training when
compared with traditional training methods. Moreover, Relative Advantage checks if e-
learning for anti-money laundering training is more convenient than the traditional
training methods because of 24x7 availability. In addition, this variable test if e-learning
for anti-money laundering training is cheaper than traditional training or education.
Furthermore, Relative Advantage assess if e-learning for anti-money laundering is better
received by bank’s employees than the traditional training or education methods.
Compatibility is the degree to which the innovation is seen as being consistent with
past practices, current values and existing needs. This variable tests if using e-learning for
anti money laundering training is consistent with the bank’s existing values and whether
using e-learning for anti-money laundering training satisfies bank’s current training needs.
Also compatibility checks if using e-learning for anti-money laundering training is
consistent with bank’s past experiences with use of Information Technology and whether
using e-learning for anti-money laundering training will fill specific needs of employees
who need training on anti-money laundering compliance. Further, this variable examines

26
whether using e-learning for anti-money laundering training fits well with the existing
work practices of bank’s employees and if using blended learning involved both
traditional and e-learning for anti-money laundering training will be preferred by bank’s
employees over use of traditional training methods alone.
The third variable in the innovation characteristics is Complexity which is the degree
to which the innovation can readily be understood and easily implemented. This variable
examines whether implementing e-learning to accomplish anti-money laundering
compliance training is easy, whether using e-learning makes it easier for the bank to
fulfill the anti-money laundering training compliance. In addition, Complexity tests if it is
clear how e-learning can be used to conduct anti-money laundering training and if it is
easy for bank employees to learn how to use e-learning for anti money laundering
training and compliance.
Trialability is the degree to which new ideas that can be tried out at low costs before
adoption are more likely to be taken up. This variable looks if it is easy for the bank to try
various e-learning applications for anti-money laundering training before making a
commitment to buying or implementing. Additionally, Triability assess if the bank
employees find it easy to use e-learning for anti-money laundering training and if rolling
out a training program based on e-learning takes very little time.
The last variable in the innovation characteristics is Observability which is the degree
to which the use and benefits of the innovation are visible to others. For example, the
bank’s ability to see beneficial results of using e-learning by other businesses.
Observability examines if the bank’s management has learned new ways of using e-
learning for anti-money laundering training from competitive banks, if bank’s

27
management believes that using e-learning for anti-money laundering training may
increase its social prestige and if employing e-learning for anti-money laundering training
will improve an employee’s or a manager’s image within the bank. In addition, this
variable figures out if people who use e-learning for anti-money laundering training have
a high profile in the bank, if the use of e-learning for anti-money laundering is visible to
everyone in the bank and if the use of e-learning for anti-money laundering is visible to
others outside the bank.
3.2.2 Organization Characteristics
Organization characteristics are the variables that consider organizational level issues
for adoption such as Top Management Support, Championship, Centralization,
Formalization, Internal Influence, External Influence and Organization Slack. Top
Management Support examines if the senior management pressure is one of the key
reasons for adoption of new IT innovations in the bank and whether top management has
a positive attitude towards using IT in general and use of e-learning in specific. Also this
variable explores if top and mid-level management thinks positively toward IT
interventions in daily or routine tasks and if top management in the bank actively
participates in establishing a vision and formulating strategies for utilizing IT systems
and if the immediate supervisor encourages the staff to learn about and/or apply new IT
technologies.
The Championship variable investigates whether there is a well-placed champion who
facilitates the acceptance and implementation of IT initiatives (e.g., introduction of e-
learning for anti-money laundry training) in the bank and whether top management in the

28
bank typically assigns project champions (focal point) for overseeing the utilization of IT
in the bank.
Centralization is defines as the degree to which power and control in a system are
concentrated in the organization. So, this variable test if the bank’s training needs and
delivery solutions (including those for e-learning) are centrally planned. The forth
organization characteristic is formalization which is the degree to which the organization
emphasizes that its members should follow rules and procedures. Formalization
investigates if the anti-money laundering compliance officer or equivalent role has the
authority to chose and select different training models for anti-money laundering and if
the bank has a long process for making decisions about adoption of a technological
intervention such as the use of e-learning for anti-money laundering training.
Internal Influence looks if the bank has a culture and tradition of using IT whenever
appropriate. However, External Influence checks if the bank feels that it will be left
behind if it does not adopt technologies such as e-learning and if employees typically
have the free time to attend workshops and other traditional training events. In addition,
Organization Slack tests if the bank has enough resource to invest in a long-term e-
learning platform to handle the anti-money laundering compliance training.
3.2.3 Environmental Characteristics
The third entity which is the environmental characteristics measures the following
variables: External Pressure, Competition and Coercive Influence. External Pressure
variable tests if there is pressure from banking industry to use technology to address anti-
money laundering compliance and if the employees feel pressured by their colleagues and
peers to be effective in using IT technology in establishing anti-money laundering

29
compliance in the bank. Competition tackles if not using e-Learning for anti-money
laundering training may have an impact on our bank’s competitive edge. Coercive
Influence checks if the bank is under pressure from the government and the international
compliance agencies to implement anti-money laundering training efficiently and in a
timely manner.
3.2.4 Banks categories
The banks categories entity identifies the banks into five categories: Innovators, Early
Adopters, Early Majority, Late Majority and Laggards. Innovators are the first to adopt a
new idea; they are able to deal with a higher degree of uncertainty than the other adopter
categories. They also have the ability to understand and apply complex technical
knowledge. Specifically, the Innovators category tests if the bank’s management is
passionate with trying new IT Technologies, tests if bank’s management is innovative
and eager to be the first to adopt new IT technologies and if bank’s management actively
seeks out new IT innovations.
Early Adopters serve as leaders for individuals to obtain advice and instruction before
adopting a new idea. In specific, this category measures whether the bank’s management
often uses other banks’ experience of innovative uses of IT technology to gain more
information and to make decisions and if the bank’s management often adopts new IT
innovations and influences other banks to do so as well.
The Early Majority are usually the followers in adopting innovations. This category
investigates if the bank’s management is willing to adopt new IT technology but is not
willing to be a leader in the change process among other banks. Early Majority category
tests if the bank’s management is willing to follow the lead of other banks in adopting

30
new IT innovations and if the bank’s management is generally willing to adopt new IT
technology but does not attempt to influence other banks to do so.
Late Majority are doubter and do not adopt new ideas until the majority of the
members in the social system have done so. This category measures if the bank’s
management is generally cautious about introducing new IT technology in the bank and if
bank’s management is generally convinced of the advantage of using IT technology
based on successful use by other banks. Laggards are the last individuals to adopt an
innovation. They should make sure that a new idea will be successful before they will
adopt. Specifically, this category checks if the bank’s management typically show
resistance towards adoption of new IT technology or training program until they are sure
that it will be successful, if the management in the bank is suspicious of using new IT
technologies and if the bank’s management is generally resistant to change.
3.2.5 E-learning Readiness
E-learning Readiness entity measures the readiness of the organization in terms of
technology readiness, resources, cost and management. In particular, this variable checks
how well is the bank using (Internet and Intranet) technology to run its business, how
prepared (skills, knowledge, motivation) is the workforce to compete and win in the high-
tech and new economy and how the bank does define “e-Learning?” (i.e.: traditional
computer Based Training, knowledge management, performance support and other web-
enabled distance learning approaches). Moreover, E-learning Readiness checks how will
the bank overcomes any bad prior experiences you and others have had with technology
based learning? (i.e.: blamed for past disappointments, experiences as lessons learned and
we try to improve over time.). Also, this variable examines how much access do people

31
have to the web (anyone, any time, anywhere), whether the management differentiate
between instructional needs (training) and informational needs (knowledge management),
and does the management make the right decisions about when to use each. Also, E-
learning Readiness tests what is the level of the bank’s expertise in instructional and
information design (pretty weak, growing, strong), is the bank ready to move beyond a
predominant reliance on classroom training to a more balanced approach with e-Learning,
does senior management support e-Learning and does the bank have a change
management plan for introducing e-Learning. Further, E-learning Readiness asks whether
the bank can demonstrate the business benefits of e-Learning, does the bank have a plan
to help the training function reinvent itself for the digital age and what is the climate in
the bank to learning in alternative locations, especially the work site. In addition, this
variable tests if the bank is willing to allow e-Learning to thrive, perhaps at the expense
of some of the more traditional parts of the training organization and how prepared is the
bank to invest in e-learning, and incubate e-Learning for several years in order to get it
firmly established (i.e.: is their a budgeting process). E-learning Readiness explores how
prepared is the bank to deal with a large and increasingly complex e-Learning
marketplace, does the bank has a good handle on what it is buying in the e-Learning
marketplace – can it differentiate quality products and weed out redundancies, and finally
is the bank prepared to outsource its training functions and manage them externally so
that it can concentrate its resources on more valuable areas.
3.2.6 Stages for anti-money laundering
The stages for anti-money laundering entity measure the application of AML in the
banks. This variable checks if the bank requires reporting any suspicious client activities

32
to the regulatory authority immediately and whether the bank has a written policy
designed to combat money laundering. Also, this entity examines if the bank’s written
policy specifies internal controls (e.g.: inspection or investigation) and procedures such
as Know Your Customer (KYC), operations analysis and suspicious activity report (SAR)
and if the bank has an employee training program for the prevention of money laundering.
Further, Stages for AML asks if the bank has a Money Laundering Reporting Officer (or
similar role) responsible for coordinating and monitoring anti-money laundering
arrangements and whether the bank enforces a mandatory anti-money laundering training
program for all management and staff carried out on a regular basis. Additionally, this
variable explores if the bank has an established process to periodically test the adequacy
of AML procedures and policies, whether the bank monitors and reports suspicious
transactions in accordance with applicable regulations and if the bank monitors
transactions and accounts in the name of suspected terrorists and/or terrorist
organizations and reports them to the competent authorities. Moreover, Stages for AML
checks if the bank has implemented an independent testing program that is designed to
assess the bank’s compliance with international anti-money laundering and anti-terrorist
financing policies and procedures and relevant laws regulations. Also, this variable tests
if the bank’s board and senior management consider AML to be a high priority and do
they actively demonstrate their commitment to the bank’s AML effort and if the bank is
confident that their suspicious activity report (SAR) processes are appropriate for the
scale of internal and external reporting that are now in place. Additionally, Stages for
AML variable examines whether the bank regularly assesses the quality, impact, and
effectiveness of AML training for staff and if all of the staff is trained in anti-money

33
laundering compliance. Finally, this variable checks if the bank provides tailored training
for specific groups in the bank (as opposed, to generic information for all) and whether
the bank’s senior management has undertaken the AML training alongside other staff
members, and if the bank periodically updates the content of its AML training.
3.2.7 Degree of Adoption
Finally, Degree of Adoption entity examines whether the organization in ready to
adopt a technology innovation or not. Specifically, this variable identifies if the bank uses
e-learning and in which year they started using it. In addition, the Degree of adoption
variable checks if the bank develops most of the e-learning content internally (as opposed
to buying off-the-shelf) and whether the bank outsource the development of customized
e-learning content. Moreover, this variable test if the bank’s Learning Management
System is tied to the Human Resource Management System to allow managers to track
courses being taken by their employees and whether the bank is aware that e-learning has
been used extensively to deliver anti-money laundering compliance training in the
banking sector. Also, Degree of Adoption variable asks if the bank would like to explore
the use of e-learning to deliver anti-money laundering compliance training, if the bank
has experimented with using e-learning to deliver anti-money laundering compliance
training, and if the e-learning system allows a manager or compliance manager to track
the amount of anti-money laundering training taken by each bank employee.
3.3 Summary of Chapter
This chapter provides the theoretical background and research model that helped in
developing the research model. The following factors were determined to be integrated in
the survey design: innovation characteristics, organization characteristics, environmental

34
characteristics, e-learning readiness, banks categories, degree of adoption, and stages for
AML.

35
Chapter 4
Research method and design
This research uses a qualitative research approach through a questionnaire to conduct
the investigation based on the model presented in the earlier chapter. This chapter
highlights the steps that were used to design and conduct the survey. Specifically, the
survey examines various factors affecting the adoption and utilization of e-learning for
anti-money laundering in banks in the UAE.
4.1 Survey design and validation
Based on the model discussed in the previous chapter, a research question survey was
designed (see Appendix A). The survey tackled the following issues: the bank's general
use of e-learning, the current level of involvement in e-learning, the level of compliance
for anti-money laundering and bank's readiness to the introduction of e-learning. A pilot
test was run first, where a small focus group from three banks was picked and the first
draft of the survey was sent to each member of the group. The purpose of this step was to
get their feedback on the type of questions and whether they are relevant to the banking
sector or not. The survey was judged to be reliable (Kendall's Coefficient of Concordance
is 0.915 and p-value<0.005).
Table 4-1 shows the primary constructs considered in the survey. Most items or
variables in the survey were formed as a five point Likert scale ranging from “strongly
disagree” to “strongly agree”. An overall weighted average was made for each construct.

36
Table 4-1 Structure of the Survey
Constructs / Variables # Questions Source
E-Learning Adoption 12 Moore and Benbasat (1991) [31], Rogers, DOI (1995) [22]
Banks Categories Innovators Early adopters Early majority Late majority Laggards
13 3 2 3 2 3
Rogers, DOI (1995) [22]
Innovation Characteristics Relative Advantage Compatibility Complexity Triability Observability
24 5 6 4 3 6
Rogers, DOI (1995) [22]
Organizational Characteristics Top Management Support Championship Centralization Formalization Internal Influence External Influence Organization Slack
14 5 2 1 2 1 2 1
Rai, Howard, Lai and Guynes (1994) [34], Grover (1993) [35,36], Loh and Venkatraman (1992) [37], Teng (2002) [38]
Environmental Characteristics External Pressure Competition Coercive influence
4 2 1 1
Iacovou (1995) [39], Grover (1993) [35,36], Neo (1994) [40]
E-Learning Readiness 20 The E-Learning Readiness Survey (2000), Marc J. Rosenberg, P.h.D [41]
Stages for AML Program 16 Global AML Survey (2004), KPMG [3]
Total 103
4.1.1 E-learning Adoption Construct
E-learning Adoption questions asked the respondents whether their organizations used
e-learning or not and in which year they started using this innovation. Also they were
asked whether they used or planning to use e-learning for AML training and in which

37
year [22], [31]. Moreover, this construct covered the following items on a five point likert
scale (1=strongly disagree and 5=strongly agree):
1. The bank develop most of the e-learning content internally (as opposed to buying
off-the-shelf)
2. The bank outsource the development of customized e-learning content
3. The bank’s Learning Management System is tied to the Human Resource
Management System to allow managers to track courses being taken by their
employees
4. The bank is aware that e-learning has been used extensively to deliver anti-money
laundering compliance training in the banking sector
5. The bank is intrigued and would like to explore the use of e-learning to deliver
anti-money laundering compliance training
6. The bank has experimented with using e-learning to deliver anti-money
laundering compliance training
7. The e-learning system allows a manager or compliance manager to track the
amount of anti-money laundering training taken by each bank employee
Also, this variable asks the respondent if the bank is using e-learning and in which
year did the bank starts using it. Further, this variable asks if the bank decided to adopt e-
learning for AML training after evaluating e-learning innovation and in which year they
are planning to do so. Moreover, E-learning Adoption asks the respondents whether the
bank does not use a learning management system, or the bank uses an internally installed
learning management system, or the bank hosts a learning management system.

38
4.1.2 Banks Categories
In addition, this construct classifies the banks into the five categories [22], the
following questions were asked on a five points likert scale (1=strongly disagree and
5=strongly agree):
- Innovators are the first to adopt a new idea; they are able to deal with a higher degree of
uncertainty than the other adopter categories. They also have the ability to understand and
apply complex technical knowledge. The following questions were used to determine this
variable:
1. Bank’s management is passionate with trying new IT Technologies.
2. Bank’s management is innovative and eager to be the first to adopt new IT
technologies.
3. Bank’s management actively seeks out new IT innovations.
- Early Adopters serve as leaders for individuals to obtain advice and instruction before
adopting a new idea. The following questions were used to determine this variable:
1. Bank’s management often uses other banks’ experience of innovative uses of IT
technology to gain more information and to make decisions.
2. Bank’s management often adopts new IT innovations and influences other banks
to do so as well.
- Early Majority are usually the followers in adopting innovations. The following
questions were used to determine this variable:
1. Bank’s management is willing to adopt new IT technology but is not willing to be
a leader in the change process among other banks.

39
2. Bank’s management is willing to follow the lead of other banks in adopting new
IT innovations.
3. Bank’s management is generally willing to adopt new IT technology but does not
attempt to influence other banks to do so.
- Late Majority is doubter and do not adopt new ideas until the majority of the members
in the social system have done so. The following questions were used to determine this
variable:
1. Bank’s management is generally cautious about introducing new IT technology in
the bank.
2. Bank’s management is generally convinced of the advantage of using IT
technology based on successful use by other banks.
- Laggards are the last individuals to adopt an innovation. They should make sure that a
new idea will be successful before they will adopt. The following questions were used to
determine this variable:
1. Bank’s management typically show resistance towards adoption of new IT
technology or training program until they are sure that it will be successful.
2. The management in the bank is suspicious of using new IT technologies.
3. Bank’s management is generally resistant to change.
4.1.3 Innovation Characteristics Construct
Innovation characteristics were measured according to the following variables on a
five point likert scale (1=strongly disagree and 5=strongly agree):

40
- Relative Advantage is the degree to which the innovation is perceived to have
significant advantages over existing alternatives. The following questions were used to
determine this variable:
1. E-learning is more effective when compared to other forms of education/training
in addressing the regulatory compliance issues of anti-money laundering.
2. E-learning for anti-money laundering training improves the quality of training
when compared with traditional training methods.
3. E-learning for anti-money laundering training is more convenient than the
traditional training methods because of 24x7 availability.
4. E-learning for anti-money laundering training is cheaper than traditional
training/education.
5. E-learning for anti-money laundering is better received by Bank’s employees than
the traditional training/education.
- Compatibility is the degree to which the innovation is seen as being consistent with past
practices, current values and existing needs. The following questions were used to
determine this variable:
1. Using e-learning for anti money laundering training is consistent with the bank’s
existing values.
2. Using e-learning for anti-money laundering training satisfies bank’s current
training needs.
3. Using e-learning for anti-money laundering training is consistent with bank’s past
experiences with use of Information Technology.

41
4. Using e-learning for anti-money laundering training will fill specific needs of
employees who need training on anti-money laundering compliance.
5. Using e-learning for anti-money laundering training fits well with the existing
work practices of bank’s employees.
6. Using blended learning involved both traditional and e-learning for anti-money
laundering training will be preferred by bank’s employees over use of traditional
training methods alone.
- Complexity is the degree to which the innovation can readily be understood and easily
implemented. The following questions were used to determine this variable:
1. Implementing e-learning to accomplish anti-money laundering compliance
training is easy.
2. Using e-learning makes it easier for the bank to fulfill the anti-money laundering
training compliance.
3. It is fairly clear how e-learning can be used to conduct anti-money laundering
training.
4. It is easy for bank employees to learn how to use e-learning for anti money
laundering training and compliance.
- Triability is the degree to which new ideas that can be tried out at low costs before
adoption are more likely to be taken up. The following questions were used to determine
this variable:
1. It is easy for the bank to try various e-learning applications for anti-money
laundering training before making a commitment to buying or implementing.

42
2. The bank employees find it easy to use e-learning for anti-money laundering
training.
3. Rolling out a training program based on e-learning takes very little time.
- Observability is the degree to which the use and benefits of the innovation are visible to
others. The following questions were used to determine this variable:
1. Bank’s management has learned new ways of using e-learning for anti-money
laundering training from competitive banks.
2. Bank’s management believes that using e-learning for anti-money laundering
training may increase its social prestige.
3. Employing e-learning for anti-money laundering training will improve an
employee’s or a manager’s image within the bank.
4. People who use e-learning for anti-money laundering training have a high profile
in the bank.
5. The use of e-learning for anti-money laundering is visible to everyone in the bank.
6. The use of e-learning for anti-money laundering is visible to others outside the
bank.
4.1.4 Organization Characteristics Construct
Organization characteristics were measured according to the following variables on a five
point likert scale (1=strongly disagree and 5=strongly agree).
- Top management support is where the innovation gets and maintains the support from
different levels of management in the organization. The following questions were used to
determine this variable:

43
1. Senior management pressure is one of the key reasons for adoption of new IT
innovations in our bank.
2. Top Management has a positive attitude towards using information technology in
general and use of e-learning in specific.
3. Top and mid level management thinks positively toward information technology
interventions in daily/routine tasks.
4. Top management in the bank actively participates in establishing a vision and
formulating strategies for utilizing information technology systems.
5. My immediate supervisor encourages me to learn about and/or apply new IT
technologies.
- Championship is whether the management has identified a key person to hold the
responsibility and be a focal point for the innovation. The following questions were used
to determine this variable:
1. There is a well-placed champion who facilitates the acceptance and
implementation of information technology initiatives (e.g., introduction of e-
learning for anti-money laundry training) in the bank.
2. Top management in the bank typically assigns project champions (focal point) for
overseeing the utilization of information technology in the bank.
- Centralization is defines as the degree to which power and control in a system are
concentrated in the organization. The following questions were used to determine this
variable:
1. The bank’s training needs and delivery solutions (including those for e-learning)
are centrally planned.

44
- Formalization, the following questions were used to determine this variable:
1. The anti-money laundering compliance officer (or equivalent role) has the
authority to chose and select different training modalities for anti-money
laundering.
2. Our bank has a long bureaucratic process for making decisions about adoption of
a technological intervention such as the use of e-learning for anti-money
laundering training.
- Internal influence, the following questions were used to determine this variable:
1. Our bank has a culture and tradition of using information technology whenever
appropriate.
- External influence, the following questions were used to determine this variable:
1. Our bank feels that it will be left behind if it does not adopt technologies such as
e-learning.
2. Our employees typically have the free time to attend workshops and other
traditional training events.
- Organization slack, the following questions were used to determine this variable:
1. Our bank has enough resource to invest in a long-term e-learning platform to
handle the anti-money laundering compliance training.
4.1.5 Environmental Characteristics Construct
Environmental characteristics were measured according to the following variables on
a five point likert scale (1=strongly disagree and 5=strongly agree):
- External Pressure, the following questions were used to determine this variable:

45
1. There is pressure from our industry to use technology to address anti-money
laundering compliance.
2. I feel pressured by my colleagues and peers to be effective in using IT technology
in establishing anti-money laundering compliance in the bank.
- Competition, the following questions were used to determine this variable:
1. Not using e-Learning for anti-money laundering training may have an impact on
our bank’s competitive edge.
- Coercive Influence, the following questions were used to determine this variable:
1. The bank is under pressure from the government and the international compliance
agencies to implement anti-money laundering training efficiently and in a timely
manner.
4.1.6 E-learning Readiness Construct
E-learning Readiness was measured according to the following questions based on a
six point likert scale (0=Low importance, 5=High importance) [41]:
1. How well is the bank using (Internet and Intranet) technology to run its business?
2. How prepared (skills, knowledge, motivation) is your workforce to compete and
win in the high-tech, new economy?
3. How the bank does define “e-Learning?” (i.e.: traditional computer Based
Training, knowledge management, performance support and other web-enabled
distance learning approaches)
4. How will the bank overcomes any bad prior experiences you and others have had
with technology based learning? (i.e.: blamed for past disappointments,
experiences as lessons learned and we try to improve over time.)

46
5. How much access do people have to the web (anyone, any time, anywhere)?
6. Do you differentiate between instructional needs (training) and informational
needs (knowledge management), and do you make the right decisions about when
to use each?
7. What is the level of the bank’s expertise in instructional and information design?
(pretty weak, growing, strong)
8. Is the bank ready to move beyond a predominant reliance on classroom training to
a more balanced approach with e-Learning?
9. Does senior management support e-Learning?
10. Does the bank have a change management plan for introducing e-Learning?
11. Can the bank demonstrate the business benefits of e-Learning?
12. Does the bank have a plan to help the training function reinvent itself for the
digital age?
13. What is the climate in the bank to learning in alternative locations, especially the
work site?
14. Is the bank willing to allow e-Learning to thrive, perhaps at the expense of some
of the more traditional parts of the training organization?
15. How prepared is the bank to invest in, and incubate e-Learning for several years
in order to get it firmly established? (i.e.: is their a budgeting process)
16. How prepared is the bank to deal with a large and increasingly complex e-
Learning marketplace?
17. Does the bank has a good handle on what it is buying in the e-Learning
marketplace – can it differentiate quality products and weed out redundancies?

47
18. Is the bank prepared to outsource its training functions and manage them
externally so that it can concentrate its resources on more valuable areas?
19. How committed are you, personally, to e-Learning? Are you ready?
4.2 Conducting the survey
The research question survey was conducted among leading banks operating in the
UAE (about 47 banks according to UAE Central Bank). The survey was send to all banks
via e-mail, post and courier. Responses were stored in a database for subsequent analysis.
The final survey return rate for the study was 25 out of 47 (53%) surveys returned and
10 banks (21.3%) refused to answer the survey. Figure 4-1 illustrates the respondent’s
role in the bank. 44% (11) of the respondents were compliance officers, 24% (6) were
managers, 16% (4) were senior executives, 12% (3) were training managers, and 4% (1)
were HR managers.
0%
5%
10%
15%
20%
25%
30%
35%
40%
45%
50%
Management Senior Executive Compliance
Officer
HR Manager Training Manager
Role in the bank
Perc
en
tag
e
Figure 4-1 Respondent’s role in the bank

48
Figure 4-2 illustrates the total number of years the respondents had worked in the bank.
32% (8) of the respondents had worked for greater than 15 years, 32% (8) had worked for
1-5 years, 20% (5) had worked for less than 1 year, 12% (3) had worked for 6 – 10 years
and 4% (1) had worked for 11 – 15 years.
0%
5%
10%
15%
20%
25%
30%
35%
> 15 11--15 6--10 1--5 < 1
Years
Perc
en
tag
e
Figure 4-2 Number of year’s respondents worked in the bank

49
Figure 4-3 shows the total number of employees in national banks versus
multinational banks according to the Central Bank of UAE. Figure 4-4 shows the net
profit before tax for national banks versus multinational banks according to the Emirates
Bank Association [43].
National Banks vs. Multinational Banks
0
2,000
4,000
6,000
8,000
10,000
12,000
14,000
16,000
National Multinational
Nationality
To
tal N
um
be
r o
f E
mp
loy
ee
s
Total number of employees(2004)
Figure 4-3 Total Number of Employees (2004) – National Banks vs. Multinational Banks Source: Emirates Bank Association

50
National Banks vs. Multinational Banks
0
2,000,000
4,000,000
6,000,000
8,000,000
10,000,000
12,000,000
14,000,000
16,000,000
18,000,000
National Multinational
Nationality
Ne
t P
rofi
t B
efo
re T
ax
(20
05
)
Net Profit Before Tax (2005)
Figure 4-4 Net Profit Before Tax (2005) – National Banks vs. Multinational Banks
Source: Emirates Bank Association
4.3 Summary of Chapter
This chapter reviews the research design and validation based on the diffusion
theories discussed in the previous chapter. An overall structure of the survey with the
questions is also illustrated in this chapter. Finally, general information about the
respondents is highlighted.

51
Chapter 5
Analysis and Discussion
Data were collected over a six-month period and Minitab was used as a statistical
analysis tool. Due to the small sample size (n=25), Binary Logistic Regression and
ANOVA were used as the primary analytical tools. The items or variables in the survey
were formed as a five point Likert scale ranging from “strongly disagree” to “strongly
agree”, where the minimum = 1 and the maximum = 5. An overall weighted average was
used for each construct. For example, Relative Advantage variable had 5 questions.
Weighted average of the likert score (e.g. 3) for each question was calculated to get one
number that describes this variable. Table 5-1 describes the statistics of the survey. The
Kolmogorov – Smirov p-value indicates that there is no evidence to reject the hypothesis
that the data follows a normal distribution at α (0.05) as shown. Appendix B shows the
detailed analysis for each variable.

52
Table 5-1 Statistics for e-learning variables
Factors Variables Mean S.D Kolmogorov -Smirov P-Value
Relative Advantage 3.6 0.81 >0.15
Compatibility 4.608 0.926 >0.15
Complexity 2.968 0.579 >0.15
Triability 2.048 0.371 >0.15
Innovation Characteristics
Observability 3.832 0.816 >0.15
Top Mgmt. Support 4.176 0.578 >0.15
Championship 1.568 0.293 >0.15
Centralization 4.16 0.688 >0.15
Formalization 1.256 0.262 >0.15
Internal Influence 3.92 1.077 >0.15
External Influence 1.336 0.399 >0.15
Organization Characteristics
Organization Slack 4.04 0.841 >0.15
External Pressure 1.4 0.231 >0.15
Competition 3.68 0.802 >0.15
Environmental Characteristics
Coercive Influence 4.2 1 >0.15
E-learning Readiness
3.152 0.856 >0.15
As Table 5-1 shows, with respect to the innovation characteristics, Triability (2.084/5)
and Complexity (2.968/5) were generally not considered important for the adoption of e-
learning for anti-money laundering. On the other hand, there is a perception that e-
learning has high Compatibility (4.608/5) from the perspective of its adoption. At the
organization level, Championship (1.568/5) and Formalization (1.256/5) of roles were not
present for e-learning adoption. This means that banks in the UAE are generally
perceived to lack a champion who will facilitate the acceptance and implementation of
the e-learning innovation and the bank staff such as the compliance officer is not given
the authority to select different training models for the anti-money laundering. In contrast,
Top Management Support (4.176/5), Centralization (4.16/5) and Organization Slack
(4.04/5) are perceived to be high. This implies, the bank’s management knows well and

53
supports e-learning for anti-money laundering training but still lacks a champion and due
to high centralization of e-learning and high availabilities of resources, it is assumed that
banks will adopt e-learning quickly.
In addition, Coercive Influence (4.2/5) was high meaning that banks feel that they are
under pressure from the government and the international compliance agencies to
implement anti-money laundering training efficiently and in a timely manner. This is in
contract to External Influence (1.336/5) which was low meaning that banks do not feel
that they should adopt e-learning because their competitors have done so. The E-learning
Readiness (3.152/5) was some where in the middle, where some banks think that they are
ready to use e-learning and others are not.
5.1 Research Question 1
Q1: What are the characteristics that distinguish the national banks from the
multinational banks in adopting the e-learning innovation?
5.1.1 Analysis of Variance
To answer this question, ANOVA F(1,22) was run on each variable where NB group
included 13 national banks and MNB group included 11 multinational banks. Table 5-2
shows that none of the variables significantly differed between the national banks from
the multination banks.

54
Table 5-2 Statistics for national vs. multinational
Factors Variables F (1,22) P-value
Relative Advantage 0.69 0.414
Compatibility 1.63 0.215
Complexity 0.00 0.960
Triability 0.15 0.705
Innovation Characteristics
Observability 0.02 0.877
Top Mgmt Support 0.03 0.854
Championship 0.34 0.564
Centralization 0.03 0.861
Formalization 3.51 0.075
Internal Influence 1.62 0.216
External Influence 1.67 0.209
Organization Characteristics
Organization Slack 0.20 0.661
External Pressure 1.61 0.218
Competition 0.44 0.516
Environmental Characteristics
Coercive Influence 0.46 0.505
E-Learning Readiness 0.17 0.680
Stages for AML 0.20 0.656
Degree of Adoption 0.41 0.527
5.1.2 Cluster Analysis
Since the results from ANOVA test showed no significant evidence on the
characteristics that distinguish the national from the multinational banks, a K-means
cluster analysis was carried out to define a new grouping schema [42]. K-means
clustering is an algorithm that classifies or groups the objects based on given attributes
into a number of group. The grouping is done by minimizing the sum of squares of
distances between data and the corresponding cluster centroid. Thus the purpose of K-
mean clustering is to classify the data based on selected characteristics, using an
algorithm that can handle a large numbers of cases.
Multiple clusters was tried out using the 18 variables and the best distance centroid of
clusters was for 2 clusters which was used to identify the groups where CG1 (Cluster

55
Group 1) includes 12 banks (7 national banks and 5 multinational banks) and CG2
(Cluster Group 2) includes 12 other banks (6 national banks and 6 multinational banks).
One bank was excluded because it was an outlier to the cluster of observation. The
groups included a combination of national and multinational banks where there were no
obvious similarities in the banks and the number of employees ranged from 100 to more
than a thousand.
Figure 5-1 shows the total number of employees in CG1 versus CG2 and Figure 5-2
shows the net profit before tax for CG1 versus CG2 according to the Emirates Bank
Association [43].
Total Number of Employees (2004
Frequency
160012008004000-400
4
3
2
1
0
160012008004000-400
Group 1 Group 2 Group 1
453.9
StDev 420.5
N 12
Mean 644.2
StDev 440.7
N 12
Group 2
Mean
(with Normal Curve) of Total Number of Employees (2004 by K-means Cluster
Panel variable: K-means Clustering groups
Figure 5-1 Total Number of Employees (2004) for CG1 vs. CG2

56
Net Profit Before Tax (2005)
Frequency
2000
000
1500
000
1000
000
5000
000
-500
000
4
3
2
1
0
2000
000
1500
000
1000
000
5000
00
0-500
000
Group 1 Group 2 Group 1
406893
StDev 571803
N 12
Mean 707186
StDev 619918
N 12
Group 2
Mean
am (with Normal Curve) of Net Profit Before Tax (2005) by K-means Clustering
Panel variable: K-means Clustering groups
Figure 5-2 Net Profit Before Tax for CG1 vs. CG2
The Kolmogorov – Smirov p-value (p <0.01) indicates that there is an evidence to
reject the hypothesis that the data does not follow a normal distribution at α (0.05) as
shown in Figure 5-3 and Figure 5-4.
Total Number of Employees (2004
Percent
150010005000-500
99
95
90
80
70
60
50
40
30
20
10
5
1
Mean
<0.010
549.0
StDev 432.3
N 24
KS 0.213
P-Value
Probability Plot of Total Number of Employees (2004Normal
Figure 5-3 Probability plot of total number of employees

57
Net Profit Before Tax (2005)
Percent
2000000150000010000005000000-500000-1000000
99
95
90
80
70
60
50
40
30
20
10
5
1
Mean
<0.010
557039
StDev 603068
N 24
KS 0.231
P-Value
Probability Plot of Net Profit Before Tax (2005)Normal
Figure 5-4 Probability plot of net profit before tax
Accordingly, Kruskal-Wallis Test as non-parametric test was run on the total number
of employees versus k-means clustering groups. The test showed that there is no
difference in the median (p-value<0.204). Another Kruskal-Wallis Test as was run on the
net profit before tax versus k-means clustering groups. The test showed again that there is
no difference in the median (p-value<0.149)
ANOVA was run on the new grouping to explore if there are any characteristics that
will distinguish between the groups and Table 5-3 shows the result. The analysis revealed
that Top Management Support, Formalization, Internal Influence, External Influence,
Organization Slack, E-learning Readiness and Stages for AML are the significant
variables that distinguish CG1 from CG2.

58
Table 5-3 Statistics CG1 vs. CG2
Factors Variables F (1,22) P-value
Relative Advantage 0.41 0.528
Compatibility 3.60 0.071
Complexity 1.08 0.310
Triability 0.29 0.598
Innovation Characteristics
Observability 0.28 0.601
Top Mgmt Support 13.71 0.001*
Championship 1.94 0.177
Centralization 2.57 0.123
Formalization 9.16 0.006*
Internal Influence 5.14 0.034*
External Influence 5.90 0.024*
Organization Characteristics
Organization Slack 13.42 0.001*
External Pressure 0.77 0.391
Competition 0.00 1.000
Environmental Characteristics
Coercive Influence 0.35 0.560
E-Learning Readiness 9.63 0.005*
Stages for AML 14.75 0.001*
Degree of Adoption 1.79 0.195
It seems that CG1 has more Top Management Support F(1,22) P<0.001, less
Formalization F(1,22) P<0.006, more Internal Influence F(1,22) P<0.034 and External
Influence F(1,22) P<0.024, more Organization Slack F(1,22) P<0.001, more E-learning
Readiness F(1,22) P<0.005 and is advanced in Stages for AML F(1,22) P<0.001 while
CG2 had a higher Formalization F(1,22) P<0.006. It seems that from the perspective of
anti-money laundering, banks in the UAE are committed to it which raises the question of
what is not clear in the adoption.
5.1.3 Banks Categories
The banks categories variable identifies the banks into five categories: Innovators,
Early Adopters, Early Majority, Late Majority and Laggards. Innovators are the first to
adopt a new idea; they are able to deal with a higher degree of uncertainty than the other
adopter categories. They also have the ability to understand and apply complex technical

59
knowledge. Early Adopters serve as leaders for individuals to obtain advice and
instruction before adopting a new idea. The Early Majority are usually the followers in
adopting innovations. Late Majority are doubter and do not adopt new ideas until the
majority of the members in the social system have done so. Laggards are the last
individuals to adopt an innovation. They should make sure that a new idea will be
successful before they will adopt.
5.1.3.1 Dot plot
The dot plot illustrated in Figure 5-5 shows that multinational banks think that they
are Innovators towards adopting an innovation. Local banks scored low results in this
category.
Innovators
Banks Nationality
3.02.72.42.11.81.5
Foreign
Local
Banks
Nationality
Foreign
Local
Dotplot of Innovators vs Banks Nationality
Figure 5-5 Dot plot for Innovators vs. Bank Nationality
The dot plot illustrated in Figure 5-6 shows that there is no huge difference between the
local and the multinational banks and the overall scores were low.

60
Early Adopters
Banks Nationality
2.01.81.61.41.21.00.8
Foreign
Local
Banks
Nationality
Foreign
Local
Dotplot of Early Adopters vs Banks Nationality
Figure 5-6 Dot plot for Early Adopters vs. Bank Nationality
The dot plot illustrated in Figure 5-7 shows that there is no huge difference between the
local and the multinational banks and the overall scores were low.
Early Majority
Banks Nationality
2.42.22.01.81.61.4
Foreign
Local
Banks
Nationality
Foreign
Local
Dotplot of Early Majority vs Banks Nationality
Figure 5-7 Dot plot for Early Majority vs. Bank Nationality
The dot plot illustrated in Figure 5-8 shows that there is no huge difference between the
local and the multinational banks and the overall scores were very low.

61
Late Majority
Banks Nationality
1.81.51.20.90.6
Foreign
Local
Banks
Nationality
Foreign
Local
Dotplot of Late Majority vs Banks Nationality
Figure 5-8 Dot plot for Late Majority vs. Bank Nationality
The dot plot illustrated in Figure 5-9 shows that most of the local banks classify
themselves in the Laggards category.
Laggards
Banks Nationality
2.42.11.81.51.20.90.6
Foreign
Local
Banks
Nationality
Foreign
Local
Dotplot of Laggards vs Banks Nationality
Figure 5-9 Dot plot for Laggards vs. Bank Nationality

62
5.1.3.2 Binary Logistic Regression
In order to determine the causal relationship between Banks Categories and Banks
Nationality, Binary Logistic Regression (BLR) [42] was carried out on each of the
variables in the survey. Binary logistic regression is a technique for predicting the mean
value of a binary response variable as a function of one or more covariates. This is used
to determine factors that affect the presence or absence of a characteristic when the
dependent variable has two levels. The result of the analysis revealed that there is no
causal relationship between the Banks Categories (Innovators (p-value = 0.336), Early
Adopters (p-value = 0.942), Early Majority (p-value = 0.193), Late Majority (p-value =
0.984) and Laggards (p-value = 0.141)) and the banks nationality.
5.2 Research Question 2
Q2: What are the characteristics that significantly affect the banks that are using e-
learning for anti-money laundering training from those who are not using e-learning?
Out of the twenty five banks that responded to the survey, five banks were using e-
Learning for anti-money laundering training and twenty were not. There were no
obvious similarities in the banks that had adopted e-Learning; this group included both
local and foreign banks and the number of employees ranged from 300 to more than a
thousand.

63
Figure 5-10 shows the total number of employees in UEL versus NEL group and
Figure 5-11 shows the net profit before tax for UEL versus NEL group according to the
Emirates Bank Association [43].
Total Number of Employees (2004
Frequency
160012008004000-400
7
6
5
4
3
2
1
0
160012008004000-400
1 2 1
876.8
StDev 337.0
N 5
Mean 441.8
StDev 418.8
N 20
2
Mean
(with Normal Curve) of Total Number of Employees (2004 by Currently Using
Panel variable: Currently Using e-learning
Figure 5-10 Total Number of Employees – UEL group (2) vs. NEL group (1)

64
Net Profit Before Tax (2005)
Frequency
2500
000
2000
000
1500
000
1000
000
5000
000
-500
000
7
6
5
4
3
2
1
0
2500
000
2000
000
1500
000
1000
000
5000
00
0-500
000
1 2 1
902042
StDev 689033
N 5
Mean 443024
StDev 558148
N 20
2
Mean
am (with Normal Curve) of Net Profit Before Tax (2005) by Currently Using e-l
Panel variable: Currently Using e-learning
Figure 5-11 Net Profit Before Tax – UEL group (2) vs. NEL group (1)
The Kolmogorov – Smirov p-value (p <0.01) indicates that there is an evidence to
reject the hypothesis that the data does not follow a normal distribution at α (0.05) as
shown in Figure 5-3 and Figure 5-4. Accordingly, Kruskal-Wallis Test as non-parametric
test was run on the total number of employees versus UEL group and NEL group. The
test showed that there is no difference in the median (p-value<0.118). Another Kruskal-
Wallis Test as was run on the net profit before tax versus UEL group and NEL group.
The test showed that there is difference in the median (p-value<0.035) but this result does
not indicate anything since this test is just comparing medians.
5.2.1 Analysis of Variance
In order to determine factors that distinguished banks that do not use e-Learning (NEL
group) from those who do use e-Learning (UEL group), ANOVA [42] was carried out on
each of the variables in the survey. The analysis revealed that Complexity (ANOVA

65
F(1,23)=4.81,p<0.039) and e-Learning Readiness (ANOVA F(1,23)=9.64,p<0.005) are
the significant factors that distinguished NEL group from UEL group. Table 5-4 shows
the ANOAVA results.
Table 5-4 Statistics for NEL and UEL groups
Factors Variables F (1,23) P-value
Relative Advantage 0.24 0.632
Compatibility 1.38 0.252
Complexity 4.81 0.039*
Triability 0.56 0.462
Innovation Characteristics
Observability 0.21 0.651
Top Mgmt Support 0.94 0.344
Championship 1.74 0.200
Centralization 0.75 0.395
Formalization 0.05 0.824
Internal Influence 0.41 0.527
External Influence 0.16 0.697
Organization Characteristics
Organization Slack 3.01 0.096
External Pressure 0.00 1.000
Competition 0.99 0.329
Environmental Characteristics
Coercive Influence 1.00 0.328
E-Learning Readiness 9.64 0.005*
Stages for AML 2.32 0.141
Degree of Adoption 3.08 0.092
Since no prior research in the area of adopting e-learning for anti-money laundering
training in banks was found at the time of writing this thesis, the research findings will be
related with previous research that was done on the adoption of IT/ICT. Accordingly,
Bishop, Clark and Grand [23] recommended that available resources are management
support and follow up are important for the adoption of IT/ICT, and these variables
showed no significant in this analysis. Moreover, Dhanarajan [24] indicated that lack of
existing infrastructure, lack of commitment from top management, low level of
knowledge and skills and need to train intended users influence the adoption. These

66
results are consistent with this study where these factors are considered in the E-learning
Readiness variable. Ebersole and venddam [29] had the same contribution as Dhanarajan
[24] as well. On the other hand, Tronatzky and Klein [32] found that innovation
characteristics have a relationship to the innovation adoption. So, they proposed that
users are more likely to use the technology that has a high Relative Advantage. However,
in this research, Relative Advantage seem to have no effect of the adoption of the e-
learning innovation. Finally, Ramamurthy [33] emphasized that Compatibility has a
positive influence on the adoption, but the analysis showed that this variable has no
influence in the adoption as well. Furthermore, Ramamurthy [33] also found that
technology attributes such as speed, reliability, accessibility and top management support
and allocation of adequate resources for technology investment have influenced the
adoption. Similarly, this research showed that speed, reliability and accessibility which
are part of the E-learning Readiness variable, have a significant impact on the adoption.
However, top management support was not significant in the analysis.
5.2.2 Binary Logistic Regression
In order to determine the causal relationship between Complexity, E-learning
Readiness and e-learning adoption Binary Logistic Regression (BLR) [42] was carried
out on each of the variables in the survey. Binary logistic regression is a technique for
predicting the mean value of a binary response variable as a function of one or more
covariates. This is used to determine factors that affect the presence or absence of a
characteristic when the dependent variable has two levels.

67
The analysis revealed that Complexity (p-value=0.056) and E-Learning Readiness (p-
value=0.045) are the significant factors that distinguished NEL group from UEL group.
The binary logistic regression was used as shown in equation 1, where a, b are parameters
coefficient of the module and X is each one of the variables (Complexity, E-learning
Readiness) and Y is either 0 (not using e-learning) or 1 (using e-learning):
The results of Binary Logistic Regression showed that there is a clear causal
relationship between the two factors and the two groups and whether they are using e-
learning for anti-money laundering. The odd ratio for Complexity is 7.38 and for E-
learning Readiness is 25.07 which is considered very high for the later case.
Moreover, a binary logistic regression was run on the total number of employees and
the net profit before tax, where the results revealed that there is no relation between using
e-learning and the total number of employees (p-value<0.188) and the net profit before
tax (p-value<0.573).
e
1 + e
=Y
(a+bX)
(a+bX) (1)

68
Figure 5-12 illustrates the dot plot of total number of employees versus using e-
learning and Figure 5-13 illustrates the dot plot of net profit before tax versus using e-
learning.
Total Number of Employees (2004
Currently Using e-learning
12601080900720540360180
1
2
Currently
Using
e-learning
1
2
Dotplot of Total Number of vs Currently Using
Figure 5-12 dot plot of total number of employees versus using e-learning
Net Profit Before Tax (2005)
Currently Using e-learning
1800000150000012000009000006000003000000
1
2
Currently
Using
e-learning
1
2
Dotplot of Net Profit Before Tax (2005) vs Currently Using e-learning
Figure 5-13 dot plot of net profit before tax versus using e-learning

69
5.2.2.1 Complexity
Figure 5-14 shows a dot plot for Complexity where it is obvious that banks who
perceive high Complexity uses e-learning for AML since the way the complexity
questions were formulated, low results mean high Complexity and high results mean low
Complexity. The Complexity variable, is concerned with the ease of using, learning, and
implementing the innovation. So, banks who perceive e-learning to be of low Complexity
(i.e., high score of complexity in the dot plot), tend to use or implement e-learning to
accomplish anti-money laundering training.
Complexity
Currently Using e-learning
4.0
3.9
3.8
3.7
3.6
3.5
3.4
3.3
3.2
3.1
3.0
2.9
2.8
2.7
2.6
2.5
2.4
2.3
2.2
2.1
2.0
1
2
Currently
Using
e-learning
1
2
Dotplot of Complexity vs Currently Using e-learning
Figure 5-14 Dot plot for Complexity variable
The dot plot shows that using e-learning becomes very high as the perceived
Complexity becomes lower (beyond 3.3). The two banks that are not using e-learning
(who scored 4) were local banks and they were in CG2 of the k-means clustering.

70
5.2.2.2 E-learning Readiness
Figure 5-15 shows the dot plot for E-learning Readiness, where banks who perceive
high E-learning Readiness tend to use e-learning for anti-money laundering training. Also,
E-learning Readiness indicates that the bank top management supports e-learning, the
bank have enough resources, the existing IT infrastructure of the bank is ready and
implemented, knowledge and skill of the employee bank is good enough, and a change
management plan have been implemented. The three banks that are not using e-learning
(who scored 4) were national banks.
E-learning Readiness
Currently Using e-learning
5.04.54.03.53.02.52.01.5
1
2
Currently
Using
e-learning
1
2
Dotplot of E-learning Readiness vs Currently Using e-learning
Figure 5-15 Dot plot for E-learning Readiness variable
Since e-Learning Readiness appears to be a common factor that distinguishes the
groups, further in-depth analysis (ANOVA) was run on each question between the banks
that are using e-learning for anti-money laundering training versus the banks that are not
using e-learning for anti-money laundering training as shown in Table 5-5. From the
results it seems that banks that are not using e-Learning for anti-money laundering

71
training differed from those that did even in the way they defined e-Learning (ANOVA
F(1,23)=8.85,p<0.007). Access to the web (ANOVA F(1,23)=4.90,p<0.037) and bad
prior experiences with e-Learning (ANOVA F(1,23)=6.68,p<0.017) were some other
factors. These banks also tend to be laggards in training their employees for the digital
age (ANOVA F(1,23)=5.50,p<0.028). These also have a perceived risk of e-learning
threatening the traditional learning mechanisms within the bank (ANOVA
F(1,23)=4.07,p<0.055). The banks not adopting e-Learning for AML training are also not
clear on how to go about acquiring this technology in an intelligent manner (ANOVA
F(1,23)=7.43,p<0.012). There is no clear change management plan for introducing e-
learning for these banks (ANOVA F(1,23)=4.26,p<0.05). There is no budgeting process
for these banks in order to invest in this technology (ANOVA F(1,23)=6.68,p<0.017).
Finally, banks not using e-Learning were not convinced that e-Learning was the right
way for their banks (ANOVA F(1,23)=4.73,p<0.040). Other factor such as bank’s ability
to demonstrate business benefits of e-Learning do not seem to be significant. Business
benefits involved the investment in cost, quality of the product, service and speed.
Finally, the use of internet and intranets for normal business functions of the bank was
not a distinguishing factor. This means that not all the core business functions are web-
enabled and most internal work and communications in the banks is not online.
Table 5-5 Significant statistics for E-Learning Readiness for NEL group and UEL group
Questions F(1,23) P-value UEL group
How the bank does define “e-Learning?” (i.e.: traditional computer Based Training, knowledge management, performance support and other web-enabled distance learning approaches)
8.85
0.007*

72
How will the bank overcomes any bad prior experiences you and others have had with technology based learning? (i.e.: blamed for past disappointments, experiences as lessons learned and we try to improve over time.)
6.68
0.017*
How much access do people have to the web (anyone, any time, anywhere)?
4.90
0.037*
What is the level of the bank’s expertise in instructional and information design? (pretty weak, growing, strong)
15.05
0.001*
Is the bank ready to move beyond a predominant reliance on classroom training to a more balanced approach with e-Learning?
4.07
0.055*
Does senior management support e-Learning?
12.60
0.002*
Does the bank have a Change management plan for introducing e-Learning?
4.26
0.050*
Does the bank have a plan to help the training function reinvent itself for the digital age?
5.50 0.028*
What is the climate in the bank to learning in alternative locations, especially the work site?
9.66 0.005*
Is the bank willing to allow e-Learning to thrive, perhaps at the expense of some of the more traditional parts of the training organization?
7.85 0.010*
How prepared is the bank to invest in, and incubate e-Learning for several years in order to get it firmly established? (i.e.: is their a budgeting process)
6.68 0.017*
Does the bank has a good handle on what it is buying in the e-Learning marketplace – can it differentiate quality products and weed out redundancies?
7.43 0.012*
How committed are you, personally, to e-Learning? Are you ready?
4.73 0.040*

73
Table 5-6 Non-significant statistics for E-Learning Readiness for NEL group and UEL group
Questions F(1,23) P-value UEL
How well is the bank using (Internet and Intranet) technology to run its business?
2.35
0.139
How prepared (skills, knowledge, motivation) is your workforce to compete and win in the high-tech, new economy?
0.56
0.462
Do you differentiate between instructional needs (training) and informational needs (knowledge management), and do you make the right decisions about when to use each?
2.78
0.109
Can the bank demonstrate the business benefits of e-Learning?
1.65 0.212
How prepared is the bank to deal with a large and increasingly complex e-Learning marketplace?
3.59 0.071
Is the bank prepared to outsource its training functions and manage them externally so that it can concentrate its resources on more valuable areas?
0.53 0.473
From tables 5-5 and 5-6 it seems that the banks that are classified in group NEL are:
• Not aware of the existence of this technology.
• Have had prior bad experience in using technology based training.
• Have limited access to the web which makes it complicated for them to use the
technology.
• Have issues with their staff skills, so they need to focus on spending more time and
money to upgrade their skills either through hiring or training.
• Prefer classroom training as a default delivery approach, so they have to start using a
combined e-Learning and classroom strategy.
• Have minimum support from their senior management as they don’t appear to be
interested, since it is a new approach.
74
• Do not have a change management plan to help the staff to adapt to the changes that
are coming.
• Show a kind of resistance to learning at the work site due to their lack in
understanding that work and learning go hand-in-hand and learning can take place
anywhere.
• Show that if e-Learning is going to affect or cut off the classroom business then they
are not willing to implement it since they don’t have a plan to re-allocate their
resources.
• Have not structured a budgeting process with their senior management to allow long-
term funding of e-Learning.
• Do not have a good approach to vendor relationships and purchasing to evaluate
quality which will achieve increase in cost and avoid redundancy.
• Finally individuals were asked if they are committed to e-Learning, so group NEL
answered that they are not convinced that e-Learning is the right way for their banks,
or they don’t have enough capability to move forward towards implementing e-
Learning strategy.
5.2.3 Relating Cluster analysis
It was discovered that the 4 banks (out of 5) that use e-learning for AML training
were in the same k-means group (CG1). This suggests that CG1 represent a set of
variables that separates the banks who will adopt e-learning from those who will not
adopt e-learning as shown in Table 5-7. One bank was considered as an outlier.

75
Table 5-7 Significant statistics for CG1 vs. CG2 (from K-means clustering)
Factors Variables F(1,22) P-value
Top Mgmt Support 13.71 0.001*
Internal Influence 5.14 0.034*
External Influence 5.90 0.024*
Organization Characteristics
Organization Slack 13.42 0.001*
E-Learning Readiness 9.63 0.005*
Stages for AML 14.75 0.001*
From Table 5-7, Complexity variable was not significantly distinguishing CG1 and
CG2 although this variable was significantly distinguishing NEL group and UEL group.
Another in-depth analysis (ANOVA) was run on each question of the e-learning
readiness for the k-means groups (CG1 and CG2) and table 5-8 shows the result.
Table 5-8 Statistics for E-learning Readiness for CG1 vs. CG2
Questions F(1,23) P-value
How well is the bank using (Internet and Intranet) technology to run its business?
4.77 0.040*
How prepared (skills, knowledge, motivation) is your workforce to compete and win in the high-tech, new economy?
2.43 0.133
How the bank does define “e-Learning?” (i.e.: traditional computer Based Training, knowledge management, performance support and other web-enabled distance learning approaches)
7.97 0.010*
How will the bank overcomes any bad prior experiences you and others have had with technology based learning? (i.e.: blamed for past disappointments, experiences as lessons learned and we try to improve over time.)
1.18 0.288
How much access do people have to the web (anyone, any time, anywhere)?
1.74 0.201
Do you differentiate between instructional needs (training) and informational needs (knowledge management), and do you make the right decisions about when to use each?
1.01 0.325
What is the level of the bank’s expertise in instructional and information design? (pretty weak, growing, strong)
4.96 0.037*
Is the bank ready to move beyond a predominant reliance on classroom training to a more balanced
2.78 0.110

76
approach with e-Learning?
Does senior management support e-Learning? 4.78 0.040*
Does the bank have a change management plan for introducing e-Learning?
4.02 0.057
Can the bank demonstrate the business benefits of e-Learning?
7.18 0.014*
Does the bank have a plan to help the training function reinvent itself for the digital age?
9.27 0.006*
What is the climate in the bank to learning in alternative locations, especially the work site?
7.44 0.012*
Is the bank willing to allow e-Learning to thrive, perhaps at the expense of some of the more traditional parts of the training organization?
5.86 0.024*
How prepared is the bank to invest in, and incubate e-Learning for several years in order to get it firmly established? (i.e.: is their a budgeting process)
10.13 0.004*
How prepared is the bank to deal with a large and increasingly complex e-Learning marketplace?
7.54 0.012*
Does the bank has a good handle on what it is buying in the e-Learning marketplace – can it differentiate quality products and weed out redundancies?
9.32 0.006*
Is the bank prepared to outsource its training functions and manage them externally so that it can concentrate its resources on more valuable areas?
7.86 0.010*
How committed are you, personally, to e-Learning? Are you ready?
2.01 0.170
Table 5-8 illustrates the statistics for E-learning Readiness for CG1 vs. CG2 and by
comparing these results with the statistics for NEL vs. UEL, both groups agreed that the
following variables were significantly important for the e-learning adoption for anti-
money laundering training:
- Having a definition for e-learning that includes alternatives such as knowledge
management, performance support and other web-enabled distance learning
approaches.

77
- Establishing a strong competency in the instructional and information design and
maintaining the expertise in these fields.
- Top Management Support and commitment.
- Having and implementing e-learning and change management strategies to help
bank employees adapt to the changes that are coming.
- Creating the environment for e-learning in the matter of location, especially at the
work site.
- Bank management knows that e-learning will reduce the classroom business and
they are prepared to re-allocate the resources accordingly.
- Having a well structured budgeting process to allow a long-term investment for e-
learning with the support from the top management support.
- Implementing an agreement and good relationship with the vendors of e-learning
where it will yield to an increased cost savings and experiencing less redundancy.
Moreover, both groups agreed that the following variables were not significantly
important for the e-learning adoption for anti-money laundering training:
- Well prepared in the case of skills and knowledge.
- Differentiating between instructional needs (training) and informational needs
(knowledge management) and making the right decisions about when to use each.
In addition, the following variables were significantly important for CG1 vs. CG2, while
they were not important for NEL group vs. UEL group:
- Most core business functions are web-enabled and most internal work and
communications are online.

78
- Demonstrating the business benefits of e-learning in the mater of cost savings and
quality.
- Dedicating more time and resources to get the most out of the large e-learning
industry.
- Outsourcing the training functions and managing them externally so that they can
concentrate the bank’s resources on more valuable areas.
The following variables were significantly important for NEL group vs. UEL group,
while they were not important for CG1 vs. CG2:
- Overcoming any bad prior experiences have had with technology based learning
and look at prior bad experiences as lessons learned and seek improvements over
time.
- Accessibility to the applications and functions any time and anywhere.
- Implementing a balanced approach between e-learning and classroom learning.
- Having a change management plan for introducing e-learning.
- Personal commitment from the bank’s employees to adopt the e-learning
innovation.
5.2.4 Banks Categories
The banks categories variable identifies the banks into five categories: Innovators,
Early Adopters, Early Majority, Late Majority and Laggards. Innovators are the first to
adopt a new idea; they are able to deal with a higher degree of uncertainty than the other
adopter categories. They also have the ability to understand and apply complex technical
knowledge. Early Adopters serve as leaders for individuals to obtain advice and
instruction before adopting a new idea. The Early Majority are usually the followers in

79
adopting innovations. Late Majority are doubter and do not adopt new ideas until the
majority of the members in the social system have done so. Laggards are the last
individuals to adopt an innovation. They should make sure that a new idea will be
successful before they will adopt.
5.2.4.1 Dot plot
Figure 5-16 shows that banks that are using e-learning for anti-money laundering training
did not score high results as Innovators. Hence is it not true to say that there is a
relationship between the Innovator category and the adoption of e-learning.
Innovators
Currently Using e-learning
3.02.72.42.11.81.5
1
2
Currently
Using
e-learning
1
2
Dotplot of Innovators vs Currently Using e-learning
Figure 5-16 Dot plot for Innovators variable
Figure 5-17 shows that banks that are using e-learning for anti-money laundering training
scored low results as Early Adopters category.

80
Early Adopters
Currently Using e-learning
2.01.81.61.41.21.00.8
1
2
Currently
Using
e-learning
1
2
Dotplot of Early Adopters vs Currently Using e-learning
Figure 5-17 Dot plot for Early Adopters variable
Figure 5-18 shows that banks that are using e-learning for anti-money laundering training
again scored low results for the Early Majority category.
Early Majority
Currently Using e-learning
2.42.22.01.81.61.4
1
2
Currently
Using
e-learning
1
2
Dotplot of Early Majority vs Currently Using e-learning
Figure 5-18 Dot plot for Early Majority variable
Figure 5-19 shows that banks that are using e-learning for anti-money laundering training
scored very low results for the Late Majority category.

81
Late Majority
Currently Using e-learning
1.81.51.20.90.6
1
2
Currently
Using
e-learning
1
2
Dotplot of Late Majority vs Currently Using e-learning
Figure 5-19 Dot plot for Late Majority variable
Figure 5-20 shows that banks that are using e-learning for anti-money laundering training
score very low results as Laggards. Hence these banks might fall under the Innovators
category or the Early Adopters category.
Laggards
Currently Using e-learning
2.42.11.81.51.20.90.6
1
2
Currently
Using
e-learning
1
2
Dotplot of Laggards vs Currently Using e-learning
Figure 5-20 Dot plot for Laggards variable

82
5.2.4.2 Binary Logistic Regression
In order to determine the causal relationship between Banks Categories and Adoption
of e-learning Binary Logistic Regression (BLR) [42] was carried out on each of the
variables in the survey. Binary logistic regression is a technique for predicting the mean
value of a binary response variable as a function of one or more covariates. This is used
to determine factors that affect the presence or absence of a characteristic when the
dependent variable has two levels. The result of the analysis revealed that there is no
causal relationship between the Banks Categories (Innovators (p-value = 0.919), Early
Adopters (p-value = 0.719), Early Majority (p-value = 0.587), Late Majority (p-value =
0.713) and Laggards (p-value = 0.235)) and the Adoption of e-learning.
5.3 Summary of the chapter
This chapter discusses in-depth the analysis of the data and answers the research
questions. The analysis indicates that there were no difference in e-learning adoption
between the national and the multinational banks. Also, various factors were investigated
to distinguish between the banks that use e-learning and the banks that don’t use e-
learning. Since it was difficult to find something common between the groups, K-means
was used to cluster the data and examine the adoption factors.

83
Chapter 6
Conclusion
This research studies the use of e-learning for anti-money laundering (AML) among
banks in UAE. The primary research objective is to develop a framework for banks to
consider when formulating strategic plans for a successful diffusion of e-learning as a
technology within their organizations. Specifically, this exploratory research examines
various factors affecting the adoption and utilization of e-learning for anti-money
laundering training in banks in the UAE. This research uses a qualitative research
approach through a questionnaire to conduct the investigation. This research has some
limitation that need to be acknowledged; that is the sample size of the data is small since
the number of banks operating in UAE is small.
A review of the literature suggested that available resources and management support
and follow up are important variables for the adoption of IT/ICT, where these variables
showed no significant in this analysis. Moreover, lack of existing infrastructure, lack of
commitment from top management, low level of knowledge and skills and need to train
intended users influenced the adoption. These results are consistent with this study where
these factors are considered in the E-learning Readiness variable.
The study shows that most Innovation Characteristics (Relative Advantage,
Compatibility, Triability and Observability), Organization Characteristics and
Environmental Characteristics of the banks do not seem to have a significant impact on
the adoption of e-Learning. However, the Complexity and E-Learning Readiness
variables appeared to be the most useful factor to not only separate the banks that used e-
Learning versus those that did not but to also measure the adoption characteristics of
banks in UAE.

84
On the other hand, in the literature it was found that Innovation Characteristics have a
relationship to the innovation adoption. So, users are more likely to use the technology
that has a high Relative Advantage. However, in this research Relative Advantage seem
to have no effect on the adoption of the e-learning innovation. Further, the literature
indicates that Compatibility has a positive influence on the adoption, but the analysis
showed that this variable has no influence in the adoption as well. Furthermore,
reviewing the literature showed that technology attributes such as speed, reliability,
accessibility and top management support and allocation of adequate resources for
technology investment have influenced the adoption. Similarly, this research showed that
speed, reliability and accessibility which are part of the E-learning Readiness variable,
have a significant impact on the adoption. However, top management support was not
significant in the analysis.
Accordingly, the primary and important research finding is that only two factors affect
the use of e-learning for anti-money laundering in UAE banks and these factors are
Complexity and E-learning Readiness. To elaborate more on the Complexity factor, it is
concerned with the ease of using, learning, and implementing the innovation. In the
context of our sample, e-Learning is relatively new to the banking industry in UAE and at
this stage they may be unfamiliar with it. As such, the senior management may adopt a
number of strategies to assist the bank’s perceptions during this initial phase including
increased time for professional development, the hiring of competent e-Learning resource
developers and experts, and the provision of adequate user friendly infrastructure to
facilitate the implementation and usage process.

85
The E-Learning Readiness factor appeared to be the most useful variable to measure
the adoption of the technology in UAE banks. As such, the bank’s management may
adopt a number of strategies to assist the bank’s perceptions during this initial phase
including increased time for professional development, the hiring of competent e-
Learning resource developers and experts, and the provision of adequate user friendly
infrastructure to facilitate the implementation and usage process. Form the banking
perspective; it is important to set-up a human-support system that will back up the e-
learning adoption in the organization. Although e- Learning helps to decrease costs in
training function, it requires a significant investment to initialize and be maintained and
the bank’s management should be aware of this matter.
These results suggest that both local and multi-national banks in the UAE are at fairly
early stages of e-Learning adoption for training. The banks that are not adopting e-
Learning are either not ready for e-Learning or perceive the introduction of e-Learning to
be a complex and cumbersome process. Consequently, this exploratory study using
survey data indicates that the banks surveyed, are, overall, not ready for e-Learning and
especially for AML, since they need to improve themselves, particularly in the area of
human resources, management, planning, budgeting, and the infrastructure, in order to be
able to successfully implement e-Learning. In specifics, the contribution of the thesis is to
develop a complete model for studying diffusion of e-learning for anti-money laundering
training in the banking industry that includes factors from multiple perspectives. Then
apply the survey instrument to examine the factors that affects the adoption of e-learning
for anti-money laundering training in UAE banks.

86
This survey can be used as a starting point for discussing the readiness and
effectiveness of e-Learning in UAE banks and the improvements needed to launch and
maintain a successful e-Learning initiative. Moreover, if the sample size was large
enough then it might provide more reliable and verifiable data on its E-Learning
Readiness. Additionally, a factor analysis of the survey might also be beneficial if the
required participant size can be achieved.
This thesis develops a model for investigating the diffusion of e-Learning technologies
in the banking sector. The model incorporates factors from a host of theories including
Innovation Characteristics (Relative Advantage, Compatibility, Complexity, Triability
and Observability), Organization Characteristics (Top Management Support,
Championship, Centralization, Formalization, Internal Influence, External Influence and
Organization Slack), Environmental Characteristics (External Pressure, Competition and
Coercive Influence), E-learning Readiness (measures the readiness of the organization in
terms of technology readiness, resources, cost and management), Stages for Anti-money
laundering (measure the application of AML in the banks), Banks Categories (Innovators,
Early Adopters, Early Majority, Late Majority and Laggards) and Degree of Adoption.
In conclusion, this thesis makes two contributions. First, a detailed model
incorporating a large number of factors to study the diffusion of e-Learning innovations
in the banking sector is developed. Secondly, this model has been applied to banks in the
UAE to determine the characteristics of factors that have led to the adoption of this
technology.

87
References
[1] Vimala V, “UAE steps up drive against money laundering,” Financial Daily, from THE HINDU group of publications, Abu Dhabi, Oct. 2001.
[2] Marlin, Steven, "Class Act, FEATURE STORY," 2002. Journal of Bank Systems &
Technology. [e-journal] Available at http://www.banktech.com/features/showArticle.jhtml?articleID=14701341 [3] KPMG, Global Anti-Money Laundering Survey 2004, KPMG. Available at http://www.kpmg.se/pages/102715.html, Accessed February 23, 2007. [4] InformationWeek. "Banks Turn To New Anti-Money Laundering Software," 2004. InformationWeek online. Home page on-line. Available at http://www.compliancepipeline.com/trends/ [5] Middlemiss J., “What To Look For In Anti-Money-Laundering Vendors,” InformationWeek. October 6, 2003. [6] Driscoll M., "Contributed article: Making the Grade with e-Learning—How e-Learning can facilitate rapid compliance," March 17, 2003. Available at http://www.banktech.com/story/enews/BNK20030317S0004, Accessed February 23, 2007. [7] Jose, C.L, “Money laundering a global issue”, Gulf News, Dubai, Nov. 2002. [8] Learnframe. "Facts, Figures & Forces behind e-Learning," 2000. Learnframe online. Home page on-line. Available at http://www.learnframe.com [9] Kendler, P., "E-Learning," 2004. Journal of Bank Systems & Technology. [e-journal] Available at http://www.banktech.com/showArticle.jhtml;jsessionid=EQCHAMWLSV11CQSNDBOCKH0CJUMEKJVN?articleID=46200206 [10] Borotis, Spiros and Poulymenakou, “E-Learning Readiness Components: Key Issues to Consider Before Adopting, e-Learning Interventions,” 2004. Available at http://www.eltrun.gr/papers/eLReadiness_ELEARN2004.pdf, Accessed May 07, 2005.
[11] “Banks & Other financial Institutions,” Available at http://www.centralbank.ae/banksandoth.php.
[12] Carvalho S, “Anti-money laundering panel to be set up”, Gulf News, Abu Dhabi, Nov. 2001. [13] “Drive against money laundering hailed”, Gulf News, Dubai, Oct. 2002.

88
[14] Low J., “PwC Launches Anti-Money Laundering E-learning Programme,” PriceWaterHouseCoopers, Feb. 2003. [15] “Dow Achieves $34 Million Annual Savings with WBT Systems,” Boston, MA. August, 2001. Available at http://www.wbtsystems.com/news/release/1320. [16] Kendler P., "e-Learning to Address Regulatory Compliance," Journal of Bank
Systems & Technology, August 17, 2004. Available at http://www.banktech.com/news/showArticle.jhtml?articleID=29100850, Accessed February 23, 2007. [17] Adams J., "Employee Management: Keeping Staff in Step with Regs, Economics," Bank Technology News Magazine, September 2004, 01. [18] Nixon, Dominic and Bedi, Rohan. "Cleaning up the System." Asia Risk Magazine, December 2002. [19] Gallagher, J., "E-Learning Success Depends on Employee's Role Workforce," Journal of Insurance & Technology. [e-journal] 2001. Available at http://www.insurancetech.com/story/IST20010509S0004 [20] Jeyaraj, Rottman and Lacity, “Research review: A review of the predictors, linkages and biases in IT innovation adoption research,” Journal of Information Technology 2006, 21, 1-23. [21] Rogers, Everett M, “New Product Adoption and Diffusion,” Journal of Consumer
Research 1976: 290 -301. [22] Rogers E. R., Diffusion of Innovations. The free press: New York 4th Edition. 1995. [23] Bishop, Clark & Grant, R, "Implementing computer technology in educational settings," Journal of Educational Technology Systems, 1991, 19 (4), 313-326. [24] Dhanarajan, G, "Distance Education: promise, performance and potential," 2001. Turkish Online Journal for Distance Education. [e-journal]. Available at http://tojde.anadolu.edu.tr/tojde18/articles/article8.htm [25] Dalton, D. W, "Computers in schools: a diffusion/adoption perspective," 1989 Educational Technology. [e-journal]. Available at http://www2.gsu.edu/~wwwitr/docs/diffusion/index.html. [26] Herson, K., Sasabowski, M., Lloyd, A., Flowers, S., Paine, C., & Newton, B. "Implementation strategies for educational intranet resources," 2000. British Journal Of
Educational Technology. [e-journal]. Available at http://www.blackwell-synergy.com/links/doi/10.1111%2F1467-8535.00134

89
[27] Jost, L. & Schneberger, L., "Educational technology adoption and implementation: learning from information systems research," 1994. Canadian Journal of educational
Communication, [e-journal] Available at http://www.cjlt.ca/index.html [28] Ensminger, Surry, Porter and Wright, “Factors Contributing to the Successful Implementation of Technology Innovations,” 2004, No 7: 61-72. Available at Educational Technology & Society, http://ifets.ieee.org/periodical/7_3/7.html Accessed May 14, 2005). [29] Ebersole, S., & Vordan, M. 2003. "Adoption of computer based Instructional Methodologies: A case study," International Journal of e-Learning. [e-journal]. Available at http://www.aace.org/pubs/IJEL/default.htm [30] Pajo, K. & Wallace, C. "Barriers to the uptake of web based technology by university teachers," 2001. Journal of Distance Education. [e-journal] Available at http://cade.athabascau.ca/ [31] Moore G.C and Benbasat I., ”Development of an instrument to measure the perceptions of adopting an information technology innovation,” Information Systems
Research, vol 2(3). 1991. pp. 173-191. [32] Tronatzky, L.G., and Klein, K.J., “Innovation characteristics and innovation adoption implementation: A meta-analysis of findings,” IEEE Transactions on Engineering Management, 29, 1, 28-45, 1982. [33] Peansupap V. and Walker D., “Factors enabling information and communication technology diffusion and actual implementation in construction organizations,” ITcon Vol.10, 193-218, 2005. [34] Rai A. and Howard G. S.,”Propagating CASE usage for Software Development: An empirical investigation of key organizational correlates,” OMEGA, 22(2), pp. 133-147, 1994. [35] Grover V., and Goslar, M. B., “The intiation, adoption, and implementation of telecommunication technologies in U.S. organizations,” Journal of Management
Information Systems, 23(5), pp. 239-248, 1993. [36] Grover V. and Teng J. T.C., “An Examination of DBMS Adoption and Success in American Organizations,” Information & Management, 23(5), 239-248. [37] Loh L., Vankatraman N., “Diffusion of Information Technology Oursourcing: Influence sources and the Kodak effect,” Information Systems Research, 3(4), pp. 334-358, 1992.

90
[38] Teng J.T.C., Grover V. and Guttler W., “Information Technology Innovation: General Diffusion patterns and its relationships to innovation characteristics,” IEEE
Transactions on Engineering Management, 49(1), pp. 13-27, 2002. [39] Iacouou C. L., Benbasat I., and Dexter A. S., ”Electroinc Data Exchange and Small Organizations: Adoption and impact of technology,” MIS Quarterly, 19(4), pp. 465-485, 1995. [40] Neo B. S., Khoo P. E., and Ang S., “The Adoption of TradeNet by the Trading community: An empirical Analysis,” in the Fifteenth International Conference on
Information Systems, Vancouver, Canada, pp. 159-175, 1994. [41] Rosenberg Marc J., “The E-learning Readiness Survey,” version 1, 2000.
[42] Miller R. G., Beyond anova, basics of applied statistics, Wiley series in Probability and Mathematical Statistics, Wiley, New York. 1998. [43] Emirates Bank Association, Available at http://www.eba-ae.com/FINANCIAL%20POSITION%202006.HTML

91
Appendix A – Survey Questionnaire
Introduction
E-learning uses information and communications technologies to typically deliver
training through the intra- or internet. E-learning is increasingly a preferred methodology
to train employees. Many institutions are using e-learning to train employees who must
deal with regulations and market conditions that differ from one nation to another. For
example, Credit Suisse Financial Services is using TopClass to provide compliance
training for 50,000 employees.
The objective of this survey is to determine the extent to which banks in the UAE are
using e-learning to address the regulatory compliance issues of anti-money laundering.
Your participation is voluntary but vital. All responses will be kept anonymous and
confidential. The names of institutions or individuals will not be revealed in any public
document.
The results of this survey will be shared with all survey participants. These results
should help your institution benchmark itself against others in region with respect to anti-
money laundering compliance.
This survey will take approximately 20 minutes of your time. Thank you for help.

92
Q1.1) What is your role in the bank? 1. Management 2. Senior executive 3. Consultant 4. Compliance officer 5. HR Manager 6. Training Manager
Q1.2) How long have you worked for this bank? _____________________________________________ Q1.3) My job function is directly related to training in the bank.
• Yes No
Q1.4) My job function is directly related to establishing anti-money laundering
compliance in the bank.
• Yes No Q1.5) Does your organization use e-learning?
• Yes No If “No” then skip to Q1.11 Q1.6) What year did your organization begin to use e-learning courses?
• Pre-2000
• 2000
• 2001
• 2002
• 2003
• 2004
• 2005
• 2006 Q1.7) Please check one of the following statements:
- Our bank does not use a Learning Management System (LMS).
- Our bank uses an internally installed LMS.
- Our bank uses a hosted LMS.
- Don’t know

93
For each statement, please indicate an answer using a 1-5 scale where (5) is you
would "strongly agree" and (1) is you would "strongly disagree" (3) is you have "no
opinion" or you are "neutral". Q1.8) Our bank develops most of the e-learning content internally (as opposed to
buying off-the-shelf). strongly disagree strongly agree 1 2 3 4 5 Q1.9) Our bank outsource the development of customized e-learning content. strongly disagree strongly agree 1 2 3 4 5 Q1.10) Our bank’s Learning Management System is tied to the Human Resource
Management System to allow managers to track courses being taken by their
employees. strongly disagree strongly agree 1 2 3 4 5 Q1.11) Our bank is aware that e-learning has been used extensively to deliver anti-
money laundering compliance training in the banking sector. strongly disagree strongly agree 1 2 3 4 5 Q1.12) Our bank is intrigued and would like to explore the use of e-learning to
deliver anti-money laundering compliance training. strongly disagree strongly agree 1 2 3 4 5 Q1.13) Our bank has experimented with using e-learning to deliver anti-money
laundering compliance training. strongly disagree strongly agree 1 2 3 4 5
Q1.14) After evaluating e-learning for anti-money laundering training, our bank
has decided to adopt the technology.
• Yes No If you answered “No”, please briefly describe the reasons behind the decision not to
adopt this technology:

94
If you answered “No”, then SKIP TO Q2.1 Q1.15) When did your organization start using e-learning for anti-money
laundering training?
• 2006
• 2005
• 2004
• 2003
• 2002
• 2001
• 2000
• Before 2000 Q 1.16) Our e-learning system allows a manager or compliance manager to track
the amount of anti-money laundering training taken by each bank employee. strongly disagree strongly agree 1 2 3 4 5 Q2.1) Bank’s management typically show resistance towards adoption of new IT
technology or training program until they are sure that it will be successful. strongly disagree strongly agree 1 2 3 4 5 Q2.2) Bank’s management is generally cautious about introducing new IT
technology in the bank. strongly disagree strongly agree 1 2 3 4 5 Q2.3) Bank’s management is willing to adopt new IT technology but is not willing to
be a leader in the change process among other banks. strongly disagree strongly agree 1 2 3 4 5 Q2.4) Bank’s management often uses other banks’ experience of innovative uses of
IT technology to gain more information and to make decisions. strongly disagree strongly agree 1 2 3 4 5 Q2.5) Bank’s management is passionate with trying new IT Technologies.

95
strongly disagree strongly agree 1 2 3 4 5 Q2.6) Bank’s management is innovative and eager to be the first to adopt new IT
technologies. strongly disagree strongly agree 1 2 3 4 5 Q2.7) Bank’s management actively seeks out new IT innovations. strongly disagree strongly agree 1 2 3 4 5 Q2.8) Bank’s management often adopts new IT innovations and influences other
banks to do so as well. strongly disagree strongly agree 1 2 3 4 5 Q2.9) Bank’s management is willing to follow the lead of other banks in adopting
new IT innovations. strongly disagree strongly agree 1 2 3 4 5 Q2.10) Bank’s management is generally willing to adopt new IT technology but does
not attempt to influence other banks to do so. strongly disagree strongly agree 1 2 3 4 5 Q2.11) Bank’s management is generally convinced of the advantage of using IT
technology based on successful use by other banks. strongly disagree strongly agree 1 2 3 4 5 Q2.12) The management in the bank is suspicious of using new IT technologies. strongly disagree strongly agree 1 2 3 4 5 Q2.13) Bank’s management is generally resistant to change. strongly disagree strongly agree

96
1 2 3 4 5 Q3.1) E-learning is more effective when compared to other forms of
education/training in addressing the regulatory compliance issues of anti-money
laundering. strongly disagree strongly agree 1 2 3 4 5 Q3.2) E-learning for anti-money laundering training improves the quality of
training when compared with traditional training methods. strongly disagree strongly agree 1 2 3 4 5 Q3.3) E-learning for anti-money laundering training is more convenient than the
traditional training methods because of 24x7 availability. strongly disagree strongly agree 1 2 3 4 5 Q3.4) E-learning for anti-money laundering training is cheaper than traditional
training/education. strongly disagree strongly agree 1 2 3 4 5 Q3.5) E-learning for anti-money laundering is better received by Bank’s employees
than the traditional training/education. strongly disagree strongly agree 1 2 3 4 5 Q4.1) Using e-learning for anti money laundering training is consistent with the
bank’s existing values. strongly disagree strongly agree 1 2 3 4 5 Q4.2) Using e-learning for anti-money laundering training satisfies bank’s current
training needs.
strongly disagree strongly agree 1 2 3 4 5
Q4.3) Using e-learning for anti-money laundering training is consistent with bank’s
past experiences with use of Information Technology.

97
strongly disagree strongly agree 1 2 3 4 5 Q4.4) Using e-learning for anti-money laundering training will fill specific needs of
employees who need training on anti-money laundering compliance. strongly disagree strongly agree 1 2 3 4 5 Q4.5) Using e-learning for anti-money laundering training fits well with the existing
work practices of bank’s employees. strongly disagree strongly agree 1 2 3 4 5 Q4.6) Using blended learning involved both traditional and e-learning for anti-
money laundering training will be preferred by bank’s employees over use of
traditional training methods alone. strongly disagree strongly agree 1 2 3 4 5 Q5.1) Implementing e-learning to accomplish anti-money laundering compliance
training is easy. strongly disagree strongly agree 1 2 3 4 5
Q5.2) Using e-learning makes it easier for the bank to fulfill the anti-money
laundering training compliance. strongly disagree strongly agree 1 2 3 4 5 Q5.3) It fairly clear how e-learning can be used to conduct anti-money laundering
training. strongly disagree strongly agree 1 2 3 4 5 Q5.4) It is easy for bank employees to learn how to use e-learning for anti money
laundering training and compliance. strongly disagree strongly agree 1 2 3 4 5

98
Q6.1) It is easy for the bank to try various e-learning applications for anti-money
laundering training before making a commitment to buying or implementing. strongly disagree strongly agree 1 2 3 4 5 Q6.2) The bank employees find it easy to use e-learning for anti-money laundering
training. strongly disagree strongly agree 1 2 3 4 5 Q6.3) Rolling out a training program based on e-learning takes very little time. strongly disagree strongly agree 1 2 3 4 5 Q7.1) Bank’s management has learned new ways of using e-learning for anti-money
laundering training from competitive banks. strongly disagree strongly agree 1 2 3 4 5 Q7.2) Bank’s management believes that using e-learning for anti-money laundering
training may increase its social prestige. strongly disagree strongly agree 1 2 3 4 5 Q7.3) Employing e-learning for anti-money laundering training will improve an
employee’s or a manager’s image within the bank. strongly disagree strongly agree 1 2 3 4 5 Q7.4) People who use e-learning for anti-money laundering training have a high
profile in the bank. strongly disagree strongly agree 1 2 3 4 5 Q7.5) The use of e-learning for anti-money laundering is visible to everyone in the
bank. strongly disagree strongly agree 1 2 3 4 5 Q7.6) The use of e-learning for anti-money laundering is visible to others outside the
bank.

99
strongly disagree strongly agree 1 2 3 4 5 Q8.1) Senior management pressure is one of the key reasons for adoption of new IT
innovations in our bank. strongly disagree strongly agree 1 2 3 4 5 Q8.2) Top Management has a positive attitude towards using information
technology in general and use of e-learning in specific. strongly disagree strongly agree 1 2 3 4 5 Q8.3) Top and mid level management thinks positively toward information
technology interventions in daily/routine tasks. strongly disagree strongly agree 1 2 3 4 5 Q8.4) Top management in the bank actively participates in establishing a vision and
formulating strategies for utilizing information technology systems. strongly disagree strongly agree 1 2 3 4 5 Q8.5) My immediate supervisor encourages me to learn about and/or apply new IT
technologies. strongly disagree strongly agree 1 2 3 4 5
Q8.6) There is a well-placed champion who facilitates the acceptance and
implementation of information technology initiatives (e.g., introduction of e-learning
for anti-money laundry training) in the bank. strongly disagree strongly agree 1 2 3 4 5 Q8.7) Top management in the bank typically assigns project champions (focal point)
for overseeing the utilization of information technology in the bank. strongly disagree strongly agree 1 2 3 4 5 Q8.8) The bank’s training needs and delivery solutions (including those for e-
learning) are centrally planned.

100
strongly disagree strongly agree 1 2 3 4 5 Q8.9) The anti-money laundering compliance officer (or equivalent role) has the
authority to chose and select different training modalities for anti-money laundering. strongly disagree strongly agree 1 2 3 4 5 Q8.10) Our bank has a long bureaucratic process for making decisions about
adoption of a technological intervention such as the use of e-learning for anti-money
laundering training. strongly disagree strongly agree 1 2 3 4 5 Q8.11) Our bank has a culture and tradition of using information technology
whenever appropriate. strongly disagree strongly agree 1 2 3 4 5
Q8.12) Our bank feels that it will be left behind if it does not adopt technologies
such as e-learning. strongly disagree strongly agree 1 2 3 4 5 Q8.13) Our employees typically have the free time to attend workshops and other
traditional training events. strongly disagree strongly agree 1 2 3 4 5 Q8.14) Our bank has enough resource to invest in a long-term e-learning platform
to handle the anti-money laundering compliance training. strongly disagree strongly agree 1 2 3 4 5 Q9.1) There is pressure from our industry to use technology to address anti-money
laundering compliance. strongly disagree strongly agree

101
1 2 3 4 5 Q9.2) I feel pressured by my colleagues and peers to be effective in using IT
technology in establishing anti-money laundering compliance in the bank. strongly disagree strongly agree 1 2 3 4 5 Q9.3) Not using e-Learning for anti-money laundering training may have an impact
on our bank’s competitive edge. strongly disagree strongly agree 1 2 3 4 5 Q9.4) The bank is under pressure from the government and the international
compliance agencies to implement anti-money laundering training efficiently and in
a timely manner. strongly disagree strongly agree 1 2 3 4 5 Q10.1) What is the fastest external connection to the Internet your bank has?
• Not connected to the Internet
• Dial-up at 14.4 Kbps or less
• Dial-up at 28.8 Kbps
• Dial-up at 56 Kbps
• Dial-up - not sure of speed
• ISDN at 64 Kbps
• ISDN at 128 Kbps
• ISDN at 256 Kbps
• ISDN - not sure of speed
• Dedicated 56 Kbps
• Business 1
• Frame Relay
• DSL
• Wireless
• Other (Please specify: ______________________________) Please circle a number that best reflects your organization.
0 1 2 3 4 5
Q10.2) How well is
the bank using
(Internet and
Intranet)
Few, if any of our core business processes are web- enabled.
One or more core business functions are web-based, but most internal work
Most core business functions are web-enabled, and most internal work and

102
technology to run
its business?
and communication is done offline.
communication, even by senior management, is online.
0 1 2 3 4 5
Q10.3) How
prepared (skills,
knowledge,
motivation) is your
workforce to
compete and win in
the high-tech, new
economy?
Most of the workforce is new to the new economy. Many are not computer literate. We have a lot of work to do.
Our workforce is becoming more high-tech all the time. However, there are still significant numbers of people who are not prepared.
Our workforce is quite well prepared to succeed in the new economy. I would consider us technologically advanced.
0 1 2 3 4 5
Q10.4) How the
bank does define
“e-learning?”
We tend to define it mostly in terms of traditional Computer Based Training; new ideas about e-learning are hard to sell.
E-Learning is new to us so there is an opportunity and an openness to broadly define e-learning; we’re working on it.
We have a broad-based definition of e-learning that includes alternatives such as knowledge management, performance support and other web-enabled distance learning approaches.
0 1 2 3 4 5
Q10.5) How will
the bank
overcomes any bad
prior experiences
you and others
have had with
technology based
learning?
We have a lot of convincing to do, there’s a lot of bad feeling regarding prior experiences; we tend to be blamed for past disappointments. Some people are using past experiences as reason for not getting into e-learning.
We haven’t done much in technology-base learning so there’s very little prior experience; there doesn’t appear to be any feelings one way or the other.
We understand that this is a marathon, not a sprint. Our clients and stakeholders look at prior bad experiences as lessons learned and we try to improve over time.
0 1 2 3 4 5
Q10.6) How much
access do people
have to the web
(anyone, any time,
anywhere)?
Access to the web is a problem; we are still building out our infrastructure.
We are working with I.T., the CIO and business leaders to assure that people can access the web for
We have already attained almost universal access in office, field, home environments.

103
learning as well as key business applications.
0 1 2 3 4 5
Q10.7) Do you
differentiate
between
instructional needs
(training) and
informational
needs (knowledge
management), and
do you make the
right decisions
about when to use
each?
We don’t think of informational needs as within our responsibility; we have a focus on instruction only.
We are beginning to become involved in the delivery of information as a form of learning; it’s difficult, but we are making some progress in selling this concept.
We are actively involved in both instructional and informational programs; we are constantly evaluating learning needs to determine which is most appropriate for a given situation.
0 1 2 3 4 5
Q10.8) What is the
level of the bank’s
expertise in
instructional and
information
design?
Pretty weak. We have some people who have basic skills but these skills are neither widespread enough nor deep enough to make a fundamental impact.
Growing. We are aware of the increasing importance of these professional skills and we’re spending the time and money to significantly upgrade our skills through hiring and/or retraining.
Strong. We have established a strong competency in these areas and are committed to maintaining state-of-the-art expertise in these fields.
0 1 2 3 4 5
Q10.9) Is the bank
ready to move
beyond a
predominant
reliance on
classroom training
to a more balanced
approach with e-
learning?
We’re struggling with this. In most cases, classroom learning is the default delivery approach. We still oversell e-learning to people who are predominately classroom focused.
We have demonstrated the viability of a combined e-learning and classroom strategy, but it’s still a tough sell.
We have implemented a balanced approach between e-learning and classroom learning – our value is making the right decision.
0 1 2 3 4 5
Q10.10) Does
senior
management
support e-
learning?
We don’t have much access to or support from senior management regarding e-
We have access, but maintaining their interest and gaining long-term support for this new
We have access and Growing management commitment; we work on it every

104
learning. They don’t appear To be interested.
approach to learning is difficult.
day.
0 1 2 3 4 5
Q10.11) Does the
bank have a
Change
management plan
for introducing e-
learning?
We have no change management plan; unfortunately, we tend to move unsystematically from event to event.
We are developing a change management plan, but we’re not sure if it will work or if it’s complete.
Change management is an integral part of our deployment strategy.
0 1 2 3 4 5
Q10.12) Can the
bank demonstrate
the business
benefits of e-
learning?
Not really; we are way behind in demonstrating business benefits. We tend to hype the technology and multimedia elements rather than performance benefits. Our measurements are mostly “customer satisfaction” related.
We are working to demonstrate business benefits of e-learning, and we’ve made some progress in cost, quality, service and speed metrics. But there is a long way to go.
We have been successful in demonstrating business benefits of e-learning and are moving to scale up our capability in this area.
0 1 2 3 4 5
Q10.13) Does the
bank have a
plan to help the
training function
reinvent itself for
the digital age?
We don’t really have a plan to change the training organization, although we know we need one.
We are building e-learning components within our organization, but haven’t given much thought yet to helping our people change.
We are implementing both e-learning and change management strategies to help our people adapt to the changes that are coming.
0 1 2 3 4 5
Q10.14) What is
the climate in the
bank to learning in
alternative
locations,
especially the work
site?
There is a great deal of resistance to learning at the work site. Many people do not view learning as important as work, or don’t see how they’re related.
There is an understanding that work and learning go hand-in-hand, and that learning can take place anywhere. However, people still need support to find time to learn, free of interruptions.
We are moving quickly to a culture that accepts e-learning at the work site and we’re working with employees and managers to create the right environment for learning to take place.

105
0 1 2 3 4 5
Q10.15) Is the
bank willing to
allow e-learning to
thrive, perhaps at
the expense of
some of the more
traditional parts of
the training
organization?
We’re willing to implement e-learning, but if it cuts too far into our classroom business, we will have to re-evaluate our classroom business is essential to our survival.
We’re willing to implement e-learning only in areas that do not conflict with our classroom business.
We’re well aware that e-learning will reduce our classroom business, and we’re prepared to re-allocate our resources accordingly.
0 1 2 3 4 5
Q10.16) How
prepared is the
bank to invest in,
and incubate e-
learning for
several years in
order to get it
firmly established?
This will be a very difficult sell, as our bank’s budgeting process is on an annualized basis. If we don’t spend it in the year, we lose it.
We are working to set up a process that will fund e-learning on a multi-year basis, but we still have to convince senior management.
We have successfully restructured our budgeting process, with senior management support, to allow long-term funding of e-learning.
0 1 2 3 4 5
Q10.17) How
prepared is the
bank to deal with a
large and
increasingly
complex e-learning
marketplace?
We’ve been primarily internally focused; we really don’t know much about what’s going on in the industry.
We’ve been purchasing products and services from the e-learning industry for years, but mostly from our traditional vendors. We really need to update our industry knowledge.
We are devoting more time and resources to getting the most out of the increasingly sophisticated e-learning industry.
0 1 2 3 4 5
Q10.18) Does the
bank have a
good handle on
what it is buying in
the e-learning
marketplace – can
it differentiate
quality products
and weed out
redundancies?
Purchasing is haphazard and uncoordinated. We have no strategy for evaluating quality and avoiding redundancy. It’s extremely difficult to even know who is buying what.
Everyone involved recognizes the need for better vendor management and more coordinated purchasing. We’re just not there yet.
We have implemented an agreed upon approach to vendor relationships and purchasing, and we are achieving increased cost savings and experiencing less redundancy
0 1 2 3 4 5
Q10.19) Is the We’re not prepared We are We have included

106
bank prepared to
outsource its
training functions
and manage them
externally so that it
can concentrate its
resources on more
valuable areas?
to significantly outsource any of our major functions.
experimenting with outsourcing some of the bank’s functions so that we can focus on more valuable areas.
outsourcing as a key component of our strategic plan – how we will manage the organization in the future.
0 1 2 3 4 5
Q10.20) How
committed are you,
personally, to e-
learning? Are
you ready?
I really haven’t paid much attention. Besides, I’m not totally convinced that this is the right way to go for our bank.
I believe this is the right way to go, but I don’t have enough capability to move forward towards implementing an e-learning strategy.
I am totally committed to e-learning and have taken the time to educate myself with the major issues. I am ready to implement durable e-learning strategy.
Q11.1) Our bank requires us to report any suspicious client activities to the
regulatory authority immediately? strongly disagree strongly agree 1 2 3 4 5 Q11.2) Our bank has a written policy designed to combat money laundering?
• Yes No
Q11.3) Our bank’s written policy specifies internal controls (e.g.: inspection or
investigation) and procedures such as Know Your Customer (KYC), operations
analysis and suspicious activity report (SAR) strongly disagree strongly agree 1 2 3 4 5 Q11.4) Our bank has an employee training program for the prevention of money
laundering. strongly disagree strongly agree 1 2 3 4 5
Q11.5) Our bank has a Money Laundering Reporting Officer (or similar role)
responsible for coordinating and monitoring anti-money laundering arrangements. strongly disagree strongly agree

107
1 2 3 4 5 Q11.6) Our bank enforces a mandatory anti-money laundering training program
for all management and staff carried out on a regular basis. strongly disagree strongly agree 1 2 3 4 5 Q11.7) Our bank has an established process to periodically test the adequacy of
AML procedures and policies. strongly disagree strongly agree 1 2 3 4 5 Q11.8) Our bank monitors and reports suspicious transactions in accordance with
applicable regulations. strongly disagree strongly agree 1 2 3 4 5 Q11.9) Our bank monitors transactions and accounts in the name of suspected
terrorists and/or terrorist organizations and reports them to the competent
authorities. strongly disagree strongly agree 1 2 3 4 5 Q11.10) Our bank has implemented an independent testing program that is
designed to assess our bank’s compliance with international anti-money laundering
and anti-terrorist financing policies and procedures and relevant laws regulations. strongly disagree strongly agree 1 2 3 4 5 Q11.11) Our bank’s board and senior management consider AML to be a high
priority and do they actively demonstrate their commitment to the bank’s AML
effort. strongly disagree strongly agree 1 2 3 4 5 Q11.12) Our bank is confident that our suspicious activity report (SAR) processes
are appropriate for the scale of internal and external reporting that are now in place. strongly disagree strongly agree 1 2 3 4 5 Q11.13) The bank regularly assesses the quality, impact, and effectiveness of AML
training for staff.

108
strongly disagree strongly agree 1 2 3 4 5 Q11.14) All of our staff is trained in anti-money laundering compliance. strongly disagree strongly agree 1 2 3 4 5 Q11.15) Our bank provides tailored training for specific groups in the bank (as
opposed, to generic information for all). strongly disagree strongly agree 1 2 3 4 5 Q11.16) Our bank’s senior management has undertaken the AML training
alongside other staff members. strongly disagree strongly agree 1 2 3 4 5 Q11.17) Our bank periodically updates the content of its AML training. strongly disagree strongly agree 1 2 3 4 5

109
Appendix B
Appendix B – 1: Normality Test
- Innovation Characteristics
Relative Advantage
Percent
65432
99
95
90
80
70
60
50
40
30
20
10
5
1
Mean
>0.150
3.6
StDev 0.8103
N 25
KS 0.090
P-Value
Probability Plot of Relative AdvantageNormal
Compatibility
Percent
765432
99
95
90
80
70
60
50
40
30
20
10
5
1
Mean
>0.150
4.608
StDev 0.9264
N 25
KS 0.111
P-Value
Probability Plot of CompatibilityNormal

110
Complexity
Percent
4.54.03.53.02.52.01.5
99
95
90
80
70
60
50
40
30
20
10
5
1
Mean
>0.150
2.968
StDev 0.5793
N 25
KS 0.085
P-Value
Probability Plot of ComplexityNormal
Triability
Percent
3.02.52.01.51.0
99
95
90
80
70
60
50
40
30
20
10
5
1
Mean
>0.150
2.048
StDev 0.3709
N 25
KS 0.051
P-Value
Probability Plot of TriabilityNormal

111
Observability
Percent
65432
99
95
90
80
70
60
50
40
30
20
10
5
1
Mean
>0.150
3.832
StDev 0.8158
N 25
KS 0.094
P-Value
Probability Plot of ObservabilityNormal
- E-learning Adoption
E-learning Adoption
Percent
65432
99
95
90
80
70
60
50
40
30
20
10
5
1
Mean
>0.150
4.152
StDev 0.8563
N 25
KS 0.087
P-Value
Probability Plot of E-learning AdoptionNormal

112
- Stages for AML Program
Stages for AML Program
Percent
5.55.04.54.03.5
99
95
90
80
70
60
50
40
30
20
10
5
1
Mean
0.097
4.357
StDev 0.4465
N 25
KS 0.160
P-Value
Probability Plot of Stages for AML ProgramNormal
- Organization Characteristics
Top Mgmt Support
Percent
5.55.04.54.03.53.0
99
95
90
80
70
60
50
40
30
20
10
5
1
Mean
>0.150
4.176
StDev 0.5783
N 25
KS 0.148
P-Value
Probability Plot of Top Mgmt SupportNormal

113
Championship
Percent
2.42.22.01.81.61.41.21.0
99
95
90
80
70
60
50
40
30
20
10
5
1
Mean
>0.150
1.568
StDev 0.2926
N 25
KS 0.050
P-Value
Probability Plot of ChampionshipNormal
Centralizaion
Percent
6.05.55.04.54.03.53.02.5
99
95
90
80
70
60
50
40
30
20
10
5
1
Mean
>0.150
4.16
StDev 0.6880
N 25
KS 0.069
P-Value
Probability Plot of CentralizaionNormal

114
Formalization
Percent
2.001.751.501.251.000.750.50
99
95
90
80
70
60
50
40
30
20
10
5
1
Mean
>0.150
1.256
StDev 0.2615
N 25
KS 0.066
P-Value
Probability Plot of FormalizationNormal
Internal Influence
Percent
7654321
99
95
90
80
70
60
50
40
30
20
10
5
1
Mean
>0.150
3.92
StDev 1.077
N 25
KS 0.070
P-Value
Probability Plot of Internal InfluenceNormal

115
External Influence
Percent
2.52.01.51.00.5
99
95
90
80
70
60
50
40
30
20
10
5
1
Mean
>0.150
1.336
StDev 0.3988
N 25
KS 0.046
P-Value
Probability Plot of External InfluenceNormal
Organization Slack
Percent
65432
99
95
90
80
70
60
50
40
30
20
10
5
1
Mean
>0.150
4.04
StDev 0.8406
N 25
KS 0.073
P-Value
Probability Plot of Organization SlackNormal

116
- Environmental Characteristics
External Pressure
Percent
2.01.81.61.41.21.00.8
99
95
90
80
70
60
50
40
30
20
10
5
1
Mean
>0.150
1.4
StDev 0.2309
N 25
KS 0.060
P-Value
Probability Plot of External PressureNormal
Competition
Percent
65432
99
95
90
80
70
60
50
40
30
20
10
5
1
Mean
>0.150
3.68
StDev 0.8021
N 25
KS 0.075
P-Value
Probability Plot of CompetitionNormal

117
Coerive Influence
Percent
7654321
99
95
90
80
70
60
50
40
30
20
10
5
1
Mean
>0.150
4.2
StDev 1
N 25
KS 0.081
P-Value
Probability Plot of Coerive InfluenceNormal

118
Appendix B -2: Analysis o Variance (NB vs. MNB)
- Innovation Characteristics
One-way ANOVA: Relative Advantage versus Bank Nationality Source DF SS MS F P
Bank Nationality 1 0.471 0.471 0.69 0.414
Error 22 14.914 0.678
Total 23 15.385
S = 0.8234 R-Sq = 3.06% R-Sq(adj) = 0.00%
Individual 95% CIs For Mean Based on
Pooled StDev
Level N Mean StDev -----+---------+---------+---------+----
1 13 3.7538 0.8333 (------------*-------------)
2 11 3.4727 0.8113 (-------------*--------------)
-----+---------+---------+---------+----
3.15 3.50 3.85 4.20
Pooled StDev = 0.8234
One-way ANOVA: Compatibility versus Bank Nationality Source DF SS MS F P
Bank Nationality 1 1.371 1.371 1.63 0.215
Error 22 18.547 0.843
Total 23 19.918
S = 0.9182 R-Sq = 6.88% R-Sq(adj) = 2.65%
Individual 95% CIs For Mean Based on
Pooled StDev
Level N Mean StDev -----+---------+---------+---------+----
1 13 4.8615 0.9500 (-------------*------------)
2 11 4.3818 0.8784 (--------------*-------------)
-----+---------+---------+---------+----
4.00 4.40 4.80 5.20
Pooled StDev = 0.9182
One-way ANOVA: Complexity versus Bank Nationality Source DF SS MS F P
Bank Nationality 1 0.001 0.001 0.00 0.960
Error 22 8.024 0.365
Total 23 8.025
S = 0.6039 R-Sq = 0.01% R-Sq(adj) = 0.00%
Individual 95% CIs For Mean Based on
Pooled StDev
Level N Mean StDev +---------+---------+---------+---------
1 13 2.9692 0.5936 (----------------*-----------------)
2 11 2.9818 0.6161 (------------------*------------------)

119
+---------+---------+---------+---------
2.60 2.80 3.00 3.20
Pooled StDev = 0.6039
One-way ANOVA: Triability versus Bank Nationality Source DF SS MS F P
Bank Nationality 1 0.022 0.022 0.15 0.705
Error 22 3.217 0.146
Total 23 3.238
S = 0.3824 R-Sq = 0.67% R-Sq(adj) = 0.00%
Individual 95% CIs For Mean Based on
Pooled StDev
Level N Mean StDev ---------+---------+---------+---------+
1 13 2.0308 0.4231 (-------------*--------------)
2 11 2.0909 0.3270 (---------------*---------------)
---------+---------+---------+---------+
1.95 2.10 2.25 2.40
Pooled StDev = 0.3824
One-way ANOVA: Observability versus Bank Nationality Source DF SS MS F P
Bank Nationality 1 0.018 0.018 0.02 0.877
Error 22 15.927 0.724
Total 23 15.945
S = 0.8509 R-Sq = 0.11% R-Sq(adj) = 0.00%
Individual 95% CIs For Mean Based on
Pooled StDev
Level N Mean StDev +---------+---------+---------+---------
1 13 3.8000 0.8981 (----------------*---------------)
2 11 3.8545 0.7904 (----------------*-----------------)
+---------+---------+---------+---------
3.30 3.60 3.90 4.20
Pooled StDev = 0.8509
- E-learning Readiness
One-way ANOVA: E-learning Readiness versus Bank Nationality Source DF SS MS F P
Bank Nationality 1 0.135 0.135 0.17 0.680
Error 22 17.059 0.775
Total 23 17.194
S = 0.8806 R-Sq = 0.79% R-Sq(adj) = 0.00%
Individual 95% CIs For Mean Based on
Pooled StDev

120
Level N Mean StDev -------+---------+---------+---------+--
1 13 3.2469 0.6895 (--------------*-------------)
2 11 3.0964 1.0656 (--------------*---------------)
-------+---------+---------+---------+--
2.80 3.15 3.50 3.85
Pooled StDev = 0.8806
- Stages for AML Program
One-way ANOVA: Stages for AML Program versus Bank Nationality Source DF SS MS F P
Bank Nationality 1 0.036 0.036 0.20 0.656
Error 22 3.929 0.179
Total 23 3.965
S = 0.4226 R-Sq = 0.92% R-Sq(adj) = 0.00%
Individual 95% CIs For Mean Based on
Pooled StDev
Level N Mean StDev -------+---------+---------+---------+--
1 13 4.4300 0.4602 (---------------*----------------)
2 11 4.3518 0.3725 (----------------*-----------------)
-------+---------+---------+---------+--
4.20 4.35 4.50 4.65
Pooled StDev = 0.4226
- Organization Characteristics
One-way ANOVA: Top Mgmt Support versus Bank Nationality Source DF SS MS F P
Bank Nationality 1 0.013 0.013 0.03 0.854
Error 22 8.012 0.364
Total 23 8.025
S = 0.6035 R-Sq = 0.16% R-Sq(adj) = 0.00%
Individual 95% CIs For Mean Based on
Pooled StDev
Level N Mean StDev +---------+---------+---------+---------
1 13 4.1538 0.5724 (-----------------*----------------)
2 11 4.2000 0.6387 (------------------*------------------)
+---------+---------+---------+---------
3.80 4.00 4.20 4.40
Pooled StDev = 0.6035
One-way ANOVA: Championship versus Bank Nationality Source DF SS MS F P
Bank Nationality 1 0.0315 0.0315 0.34 0.564
Error 22 2.0218 0.0919
Total 23 2.0533
S = 0.3032 R-Sq = 1.53% R-Sq(adj) = 0.00%

121
Individual 95% CIs For Mean Based on
Pooled StDev
Level N Mean StDev ---------+---------+---------+---------+
1 13 1.6000 0.3367 (-------------*--------------)
2 11 1.5273 0.2573 (---------------*---------------)
---------+---------+---------+---------+
1.44 1.56 1.68 1.80
Pooled StDev = 0.3032
One-way ANOVA: Centralization versus Bank Nationality Source DF SS MS F P
Bank Nationality 1 0.014 0.014 0.03 0.861
Error 22 9.944 0.452
Total 23 9.958
S = 0.6723 R-Sq = 0.14% R-Sq(adj) = 0.00%
Individual 95% CIs For Mean Based on
Pooled StDev
Level N Mean StDev +---------+---------+---------+---------
1 13 4.2308 0.5991 (--------------*---------------)
2 11 4.1818 0.7508 (----------------*----------------)
+---------+---------+---------+---------
3.75 4.00 4.25 4.50
Pooled StDev = 0.6723
One-way ANOVA: Formalization versus Bank Nationality Source DF SS MS F P
Bank Nationality 1 0.2252 0.2252 3.51 0.075
Error 22 1.4131 0.0642
Total 23 1.6383
S = 0.2534 R-Sq = 13.74% R-Sq(adj) = 9.82%
Individual 95% CIs For Mean Based on
Pooled StDev
Level N Mean StDev --+---------+---------+---------+-------
1 13 1.1692 0.2287 (---------*---------)
2 11 1.3636 0.2803 (----------*---------)
--+---------+---------+---------+-------
1.05 1.20 1.35 1.50
Pooled StDev = 0.2534
One-way ANOVA: Internal Influence versus Bank Nationality Source DF SS MS F P
Bank Nationality 1 1.510 1.510 1.62 0.216
Error 22 20.490 0.931
Total 23 22.000
S = 0.9651 R-Sq = 6.87% R-Sq(adj) = 2.63%

122
Individual 95% CIs For Mean Based on
Pooled StDev
Level N Mean StDev --------+---------+---------+---------+-
1 13 4.2308 0.9268 (----------*----------)
2 11 3.7273 1.0090 (------------*-----------)
--------+---------+---------+---------+-
3.50 4.00 4.50 5.00
Pooled StDev = 0.9651
One-way ANOVA: External Influence versus Bank Nationality Source DF SS MS F P
Bank Nationality 1 0.269 0.269 1.67 0.209
Error 22 3.544 0.161
Total 23 3.813
S = 0.4014 R-Sq = 7.06% R-Sq(adj) = 2.84%
Individual 95% CIs For Mean Based on
Pooled StDev
Level N Mean StDev --+---------+---------+---------+-------
1 13 1.4308 0.3250 (-----------*----------)
2 11 1.2182 0.4771 (------------*-----------)
--+---------+---------+---------+-------
1.00 1.20 1.40 1.60
Pooled StDev = 0.4014
One-way ANOVA: Organization Slack versus Bank Nationality Source DF SS MS F P
Bank Nationality 1 0.141 0.141 0.20 0.661
Error 22 15.692 0.713
Total 23 15.833
S = 0.8446 R-Sq = 0.89% R-Sq(adj) = 0.00%
Individual 95% CIs For Mean Based on
Pooled StDev
Level N Mean StDev ----+---------+---------+---------+-----
1 13 4.1538 0.8987 (---------------*----------------)
2 11 4.0000 0.7746 (----------------*-----------------)
----+---------+---------+---------+-----
3.60 3.90 4.20 4.50
Pooled StDev = 0.8446
- Environmental Characteristics
One-way ANOVA: External Pressure versus Bank Nationality Source DF SS MS F P
Bank Nationality 1 0.0842 0.0842 1.61 0.218
Error 22 1.1541 0.0525
Total 23 1.2383

123
S = 0.2290 R-Sq = 6.80% R-Sq(adj) = 2.56%
Individual 95% CIs For Mean Based on
Pooled StDev
Level N Mean StDev --------+---------+---------+---------+-
1 13 1.3538 0.1664 (------------*-------------)
2 11 1.4727 0.2867 (-------------*--------------)
--------+---------+---------+---------+-
1.30 1.40 1.50 1.60
Pooled StDev = 0.2290
One-way ANOVA: Competition versus Bank Nationality Source DF SS MS F P
Bank Nationality 1 0.298 0.298 0.44 0.516
Error 22 15.035 0.683
Total 23 15.333
S = 0.8267 R-Sq = 1.95% R-Sq(adj) = 0.00%
Individual 95% CIs For Mean Based on
Pooled StDev
Level N Mean StDev ---+---------+---------+---------+------
1 13 3.7692 0.8321 (-------------*------------)
2 11 3.5455 0.8202 (-------------*--------------)
---+---------+---------+---------+------
3.15 3.50 3.85 4.20
Pooled StDev = 0.8267
One-way ANOVA: Coercive Influence versus Bank Nationality Source DF SS MS F P
Bank Nationality 1 0.49 0.49 0.46 0.505
Error 22 23.47 1.07
Total 23 23.96
S = 1.033 R-Sq = 2.04% R-Sq(adj) = 0.00%
Individual 95% CIs For Mean Based on
Pooled StDev
Level N Mean StDev ---+---------+---------+---------+------
1 13 4.077 0.862 (--------------*--------------)
2 11 4.364 1.206 (---------------*---------------)
---+---------+---------+---------+------
3.60 4.00 4.40 4.80
Pooled StDev = 1.033
- Degree of Adoption One-way ANOVA: Degree of Adoption versus Bank Nationality Source DF SS MS F P
Bank Nationality 1 0.221 0.221 0.41 0.527
Error 22 11.784 0.536

124
Total 23 12.005
S = 0.7319 R-Sq = 1.84% R-Sq(adj) = 0.00%
Individual 95% CIs For Mean Based on
Pooled StDev
Level N Mean StDev -+---------+---------+---------+--------
1 13 3.3838 0.8044 (-------------*-------------)
2 11 3.5764 0.6340 (--------------*--------------)
-+---------+---------+---------+--------
3.00 3.30 3.60 3.90
Pooled StDev = 0.7319
Appendix B – 3: K-means Cluster Analysis
- Innovation Characteristics Number of clusters: 2
Within Average Maximum
cluster distance distance
Number of sum of from from
observations squares centroid centroid
Cluster1 16 22.303 1.114 1.949
Cluster2 9 9.618 0.998 1.356
Cluster Centroids
Grand
Variable Cluster1 Cluster2 centroid
Relative Advantage 4.1000 2.7111 3.6000
Compatibility 5.1375 3.6667 4.6080
Complexity 3.2125 2.5333 2.9680
Triability 2.2250 1.7333 2.0480
Observability 4.1375 3.2889 3.8320
Distances Between Cluster Centroids
Cluster1 Cluster2
Cluster1 0.0000 2.3485
Cluster2 2.3485 0.0000
Number of clusters: 3
Within Average Maximum
cluster distance distance
Number of sum of from from
observations squares centroid centroid
Cluster1 7 4.297 0.745 1.138
Cluster2 4 2.940 0.847 0.962
Cluster3 14 20.163 1.143 1.845
Cluster Centroids
Grand

125
Variable Cluster1 Cluster2 Cluster3 centroid
Relative Advantage 3.0571 2.5500 4.1714 3.6000
Compatibility 4.0857 3.3500 5.2286 4.6080
Complexity 2.6571 2.6000 3.2286 2.9680
Triability 1.8571 1.6000 2.2714 2.0480
Observability 3.8571 2.6000 4.1714 3.8320
Distances Between Cluster Centroids
Cluster1 Cluster2 Cluster3
Cluster1 0.0000 1.5647 1.7733
Cluster2 1.5647 0.0000 3.0779
Cluster3 1.7733 3.0779 0.0000
Number of clusters: 4
Within Average Maximum
cluster distance distance
Number of sum of from from
observations squares centroid centroid
Cluster1 5 2.192 0.639 0.917
Cluster2 4 2.940 0.847 0.962
Cluster3 5 6.224 1.077 1.553
Cluster4 11 9.622 0.884 1.470
Cluster Centroids
Grand
Variable Cluster1 Cluster2 Cluster3 Cluster4 centroid
Relative Advantage 2.8400 2.5500 4.4800 3.9273 3.6000
Compatibility 3.9200 3.3500 5.6000 4.9273 4.6080
Complexity 2.4800 2.6000 3.8800 2.9091 2.9680
Triability 1.8400 1.6000 2.4800 2.1091 2.0480
Observability 3.8400 2.6000 4.0000 4.2000 3.8320
Distances Between Cluster Centroids
Cluster1 Cluster2 Cluster3 Cluster4
Cluster1 0.0000 1.4208 2.8120 1.6071
Cluster2 1.4208 0.0000 3.6277 2.7017
Cluster3 2.8120 3.6277 0.0000 1.3705
Cluster4 1.6071 2.7017 1.3705 0.0000
- Organization Characteristics
Number of clusters: 2
Within Average Maximum
cluster distance distance
Number of sum of from from
observations squares centroid centroid
Cluster1 15 29.589 1.295 2.801
Cluster2 10 9.316 0.927 1.437

126
Cluster Centroids
Grand
Variable Cluster1 Cluster2 centroid
Top Mgmt Support 3.9467 4.5200 4.1760
Championship 1.4267 1.7800 1.5680
Centralization 3.8000 4.7000 4.1600
Formalization 1.3600 1.1000 1.2560
Internal Influence 3.2667 4.9000 3.9200
External Influence 1.1333 1.6400 1.3360
Organization Slack 3.6000 4.7000 4.0400
Distances Between Cluster Centroids
Cluster1 Cluster2
Cluster1 0.0000 2.3379
Cluster2 2.3379 0.0000
Number of clusters: 3
Within Average Maximum
cluster distance distance
Number of sum of from from
observations squares centroid centroid
Cluster1 12 18.900 1.111 2.823
Cluster2 3 2.587 0.913 1.073
Cluster3 10 9.316 0.927 1.437
Cluster Centroids
Grand
Variable Cluster1 Cluster2 Cluster3 centroid
Top Mgmt Support 3.7500 4.7333 4.5200 4.1760
Championship 1.4667 1.2667 1.7800 1.5680
Centralization 3.8333 3.6667 4.7000 4.1600
Formalization 1.3667 1.3333 1.1000 1.2560
Internal Influence 3.4167 2.6667 4.9000 3.9200
External Influence 1.1333 1.1333 1.6400 1.3360
Organization Slack 3.3333 4.6667 4.7000 4.0400
Distances Between Cluster Centroids
Cluster1 Cluster2 Cluster3
Cluster1 0.0000 1.8374 2.4162
Cluster2 1.8374 0.0000 2.5840
Cluster3 2.4162 2.5840 0.0000
Number of clusters: 4
Within Average Maximum
cluster distance distance
Number of sum of from from
observations squares centroid centroid
Cluster1 6 9.253 1.156 2.057
Cluster2 2 0.860 0.656 0.656
Cluster3 9 7.867 0.879 1.463

127
Cluster4 8 6.800 0.871 1.378
Cluster Centroids
Grand
Variable Cluster1 Cluster2 Cluster3 Cluster4 centroid
Top Mgmt Support 3.8333 4.7000 4.5778 3.8500 4.1760
Championship 1.4000 1.2000 1.8000 1.5250 1.5680
Centralization 3.6667 3.5000 4.7778 4.0000 4.1600
Formalization 1.3667 1.4000 1.0889 1.3250 1.2560
Internal Influence 2.5000 3.0000 4.8889 4.1250 3.9200
External Influence 1.1000 1.3000 1.6444 1.1750 1.3360
Organization Slack 3.3333 5.0000 4.7778 3.5000 4.0400
Distances Between Cluster Centroids
Cluster1 Cluster2 Cluster3 Cluster4
Cluster1 0.0000 1.9717 3.1805 1.6741
Cluster2 1.9717 0.0000 2.4167 2.1483
Cluster3 3.1805 2.4167 0.0000 1.9242
Cluster4 1.6741 2.1483 1.9242 0.0000
- Environmental Characteristics
Number of clusters: 2
Within Average Maximum
cluster distance distance
Number of sum of from from
observations squares centroid centroid
Cluster1 18 12.547 0.762 1.399
Cluster2 7 13.543 1.182 2.748
Cluster Centroids
Grand
Variable Cluster1 Cluster2 centroid
External Pressure 1.4778 1.2000 1.4000
Competition 4.1111 2.5714 3.6800
Coercive Influence 4.3889 3.7143 4.2000
Distances Between Cluster Centroids
Cluster1 Cluster2
Cluster1 0.0000 1.7038
Cluster2 1.7038 0.0000
Number of clusters: 3
Within Average Maximum
cluster distance distance
Number of sum of from from
observations squares centroid centroid
Cluster1 8 2.015 0.489 0.643
Cluster2 7 13.543 1.182 2.748
Cluster3 10 1.940 0.372 0.854

128
Cluster Centroids
Grand
Variable Cluster1 Cluster2 Cluster3 centroid
External Pressure 1.4500 1.2000 1.5000 1.4000
Competition 4.0000 2.5714 4.2000 3.6800
Coercive Influence 3.6250 3.7143 5.0000 4.2000
Distances Between Cluster Centroids
Cluster1 Cluster2 Cluster3
Cluster1 0.0000 1.4530 1.3904
Cluster2 1.4530 0.0000 2.0965
Cluster3 1.3904 2.0965 0.0000
Number of clusters: 4
Within Average Maximum
cluster distance distance
Number of sum of from from
observations squares centroid centroid
Cluster1 8 2.015 0.489 0.643
Cluster2 7 13.543 1.182 2.748
Cluster3 2 0.080 0.200 0.200
Cluster4 8 0.235 0.144 0.325
Cluster Centroids
Grand
Variable Cluster1 Cluster2 Cluster3 Cluster4 centroid
External Pressure 1.4500 1.2000 1.4000 1.5250 1.4000
Competition 4.0000 2.5714 5.0000 4.0000 3.6800
Coercive Influence 3.6250 3.7143 5.0000 5.0000 4.2000
Distances Between Cluster Centroids
Cluster1 Cluster2 Cluster3 Cluster4
Cluster1 0.0000 1.4530 1.7009 1.3770
Cluster2 1.4530 0.0000 2.7552 1.9492
Cluster3 1.7009 2.7552 0.0000 1.0078
Cluster4 1.3770 1.9492 1.0078 0.0000

129
Appendix B – 4: Analysis of Variance (CG1 vs. CG2)
- Innovation Characteristics
One-way ANOVA: Relative Advantage versus K-means Clustering groups Source DF SS MS F P
K-means Clustering 1 0.282 0.282 0.41 0.528
Error 22 15.103 0.687
Total 23 15.385
S = 0.8286 R-Sq = 1.83% R-Sq(adj) = 0.00%
Individual 95% CIs For Mean Based on
Pooled StDev
Level N Mean StDev ----+---------+---------+---------+-----
Group 1 12 3.7333 0.7644 (--------------*-------------)
Group 2 12 3.5167 0.8881 (-------------*--------------)
----+---------+---------+---------+-----
3.15 3.50 3.85 4.20
Pooled StDev = 0.8286
One-way ANOVA: Compatibility versus K-means Clustering groups Source DF SS MS F P
K-means Clustering 1 2.802 2.802 3.60 0.071
Error 22 17.117 0.778
Total 23 19.918
S = 0.8821 R-Sq = 14.07% R-Sq(adj) = 10.16%
Individual 95% CIs For Mean Based on
Pooled StDev
Level N Mean StDev -----+---------+---------+---------+----
Group 1 12 4.9833 0.8548 (----------*---------)
Group 2 12 4.3000 0.9085 (----------*----------)
-----+---------+---------+---------+----
4.00 4.50 5.00 5.50
Pooled StDev = 0.8821
One-way ANOVA: Complexity versus K-means Clustering groups Source DF SS MS F P
K-means Clustering 1 0.375 0.375 1.08 0.310
Error 22 7.650 0.348
Total 23 8.025
S = 0.5897 R-Sq = 4.67% R-Sq(adj) = 0.34%
Individual 95% CIs For Mean Based on
Pooled StDev
Level N Mean StDev +---------+---------+---------+---------
Group 1 12 3.1000 0.6633 (-------------*-------------)

130
Group 2 12 2.8500 0.5054 (-------------*-------------)
+---------+---------+---------+---------
2.50 2.75 3.00 3.25
Pooled StDev = 0.5897
One-way ANOVA: Triability versus K-means Clustering groups Source DF SS MS F P
K-means Clustering 1 0.042 0.042 0.29 0.598
Error 22 3.197 0.145
Total 23 3.238
S = 0.3812 R-Sq = 1.29% R-Sq(adj) = 0.00%
Individual 95% CIs For Mean Based on
Pooled StDev
Level N Mean StDev -+---------+---------+---------+--------
Group 1 12 2.1000 0.3568 (--------------*--------------)
Group 2 12 2.0167 0.4041 (--------------*---------------)
-+---------+---------+---------+--------
1.80 1.95 2.10 2.25
Pooled StDev = 0.3812
One-way ANOVA: Observability versus K-means Clustering groups Source DF SS MS F P
K-means Clustering 1 0.202 0.202 0.28 0.601
Error 22 15.743 0.716
Total 23 15.945
S = 0.8459 R-Sq = 1.26% R-Sq(adj) = 0.00%
Individual 95% CIs For Mean Based on
Pooled StDev
Level N Mean StDev --+---------+---------+---------+-------
Group 1 12 3.9167 0.9514 (----------------*---------------)
Group 2 12 3.7333 0.7253 (---------------*----------------)
--+---------+---------+---------+-------
3.30 3.60 3.90 4.20
Pooled StDev = 0.8459
- E-learning Readiness
One-way ANOVA: E-learning Readiness versus K-means Clustering groups Source DF SS MS F P
K-means Clustering 1 5.236 5.236 9.63 0.005
Error 22 11.958 0.544
Total 23 17.194
S = 0.7373 R-Sq = 30.45% R-Sq(adj) = 27.29%
Individual 95% CIs For Mean Based on

131
Pooled StDev
Level N Mean StDev -----+---------+---------+---------+----
Group 1 12 3.6450 0.7331 (--------*--------)
Group 2 12 2.7108 0.7414 (--------*--------)
-----+---------+---------+---------+----
2.50 3.00 3.50 4.00
Pooled StDev = 0.7373
- Stages for AML Program
One-way ANOVA: Stages for AML Program versus K-means Clustering groups Source DF SS MS F P
K-means Clustering 1 1.591 1.591 14.75 0.001
Error 22 2.374 0.108
Total 23 3.965
S = 0.3285 R-Sq = 40.13% R-Sq(adj) = 37.41%
Individual 95% CIs For Mean Based on
Pooled StDev
Level N Mean StDev --+---------+---------+---------+-------
Group 1 12 4.6517 0.1997 (-------*-------)
Group 2 12 4.1367 0.4195 (------*-------)
--+---------+---------+---------+-------
4.00 4.25 4.50 4.75
Pooled StDev = 0.3285
- Organization Characteristics
One-way ANOVA: Top Mgmt Support versus K-means Clustering groups Source DF SS MS F P
K-means Clustering 1 3.082 3.082 13.71 0.001
Error 22 4.943 0.225
Total 23 8.025
S = 0.4740 R-Sq = 38.40% R-Sq(adj) = 35.60%
Individual 95% CIs For Mean Based on
Pooled StDev
Level N Mean StDev ---------+---------+---------+---------+
Group 1 12 4.5333 0.5069 (--------*-------)
Group 2 12 3.8167 0.4387 (-------*-------)
---------+---------+---------+---------+
3.85 4.20 4.55 4.90
Pooled StDev = 0.4740
One-way ANOVA: Championship versus K-means Clustering groups Source DF SS MS F P
K-means Clustering 1 0.1667 0.1667 1.94 0.177
Error 22 1.8867 0.0858
Total 23 2.0533

132
S = 0.2928 R-Sq = 8.12% R-Sq(adj) = 3.94%
Individual 95% CIs For Mean Based on
Pooled StDev
Level N Mean StDev ---+---------+---------+---------+------
Group 1 12 1.6500 0.3317 (-----------*-----------)
Group 2 12 1.4833 0.2480 (-----------*-----------)
---+---------+---------+---------+------
1.35 1.50 1.65 1.80
Pooled StDev = 0.2928
One-way ANOVA: Centralization versus K-means Clustering groups Source DF SS MS F P
K-means Clustering 1 1.042 1.042 2.57 0.123
Error 22 8.917 0.405
Total 23 9.958
S = 0.6366 R-Sq = 10.46% R-Sq(adj) = 6.39%
Individual 95% CIs For Mean Based on
Pooled StDev
Level N Mean StDev ---------+---------+---------+---------+
Group 1 12 4.4167 0.6686 (-----------*------------)
Group 2 12 4.0000 0.6030 (-----------*------------)
---------+---------+---------+---------+
3.90 4.20 4.50 4.80
Pooled StDev = 0.6366
One-way ANOVA: Formalization versus K-means Clustering groups Source DF SS MS F P
K-means Clustering 1 0.4817 0.4817 9.16 0.006
Error 22 1.1567 0.0526
Total 23 1.6383
S = 0.2293 R-Sq = 29.40% R-Sq(adj) = 26.19%
Individual 95% CIs For Mean Based on
Pooled StDev
Level N Mean StDev -----+---------+---------+---------+----
Group 1 12 1.1167 0.2167 (--------*---------)
Group 2 12 1.4000 0.2412 (--------*--------)
-----+---------+---------+---------+----
1.05 1.20 1.35 1.50
Pooled StDev = 0.2293
One-way ANOVA: Internal Influence versus K-means Clustering groups Source DF SS MS F P
K-means Clustering 1 4.167 4.167 5.14 0.034
Error 22 17.833 0.811
Total 23 22.000

133
S = 0.9003 R-Sq = 18.94% R-Sq(adj) = 15.25%
Individual 95% CIs For Mean Based on
Pooled StDev
Level N Mean StDev ---------+---------+---------+---------+
Group 1 12 4.4167 0.9962 (---------*----------)
Group 2 12 3.5833 0.7930 (----------*---------)
---------+---------+---------+---------+
3.50 4.00 4.50 5.00
Pooled StDev = 0.9003
One-way ANOVA: External Influence versus K-means Clustering groups Source DF SS MS F P
K-means Clustering 1 0.807 0.807 5.90 0.024
Error 22 3.007 0.137
Total 23 3.813
S = 0.3697 R-Sq = 21.15% R-Sq(adj) = 17.57%
Individual 95% CIs For Mean Based on
Pooled StDev
Level N Mean StDev ---+---------+---------+---------+------
Group 1 12 1.5167 0.3353 (--------*--------)
Group 2 12 1.1500 0.4011 (--------*--------)
---+---------+---------+---------+------
1.00 1.25 1.50 1.75
Pooled StDev = 0.3697
One-way ANOVA: Organization Slack versus K-means Clustering groups Source DF SS MS F P
K-means Clustering 1 6.000 6.000 13.42 0.001
Error 22 9.833 0.447
Total 23 15.833
S = 0.6686 R-Sq = 37.89% R-Sq(adj) = 35.07%
Individual 95% CIs For Mean Based on
Pooled StDev
Level N Mean StDev ------+---------+---------+---------+---
Group 1 12 4.5833 0.5149 (-------*-------)
Group 2 12 3.5833 0.7930 (-------*-------)
------+---------+---------+---------+---
3.50 4.00 4.50 5.00
Pooled StDev = 0.6686

134
- Environmental Characteristics
One-way ANOVA: External Pressure versus K-means Clustering groups Source DF SS MS F P
K-means Clustering 1 0.0417 0.0417 0.77 0.391
Error 22 1.1967 0.0544
Total 23 1.2383
S = 0.2332 R-Sq = 3.36% R-Sq(adj) = 0.00%
Individual 95% CIs For Mean Based on
Pooled StDev
Level N Mean StDev -------+---------+---------+---------+--
Group 1 12 1.4500 0.1931 (-------------*-------------)
Group 2 12 1.3667 0.2674 (-------------*-------------)
-------+---------+---------+---------+--
1.30 1.40 1.50 1.60
Pooled StDev = 0.2332
One-way ANOVA: Competition versus K-means Clustering groups Source DF SS MS F P
K-means Clustering 1 0.000 0.000 0.00 1.000
Error 22 15.333 0.697
Total 23 15.333
S = 0.8348 R-Sq = 0.00% R-Sq(adj) = 0.00%
Individual 95% CIs For Mean Based on
Pooled StDev
Level N Mean StDev ---+---------+---------+---------+------
Group 1 12 3.6667 0.7785 (-------------------*-------------------)
Group 2 12 3.6667 0.8876 (-------------------*-------------------)
---+---------+---------+---------+------
3.25 3.50 3.75 4.00
Pooled StDev = 0.8348
One-way ANOVA: Coercive Influence versus K-means Clustering groups Source DF SS MS F P
K-means Clustering 1 0.38 0.38 0.35 0.560
Error 22 23.58 1.07
Total 23 23.96
S = 1.035 R-Sq = 1.57% R-Sq(adj) = 0.00%
Individual 95% CIs For Mean Based on
Pooled StDev
Level N Mean StDev ---+---------+---------+---------+------
Group 1 12 4.083 1.311 (--------------*---------------)
Group 2 12 4.333 0.651 (--------------*---------------)
---+---------+---------+---------+------
3.60 4.00 4.40 4.80

135
Pooled StDev = 1.035
- Degree of Adoption
One-way ANOVA: Degree of Adoption versus K-means Clustering groups Source DF SS MS F P
K-means Clustering 1 0.901 0.901 1.79 0.195
Error 22 11.104 0.505
Total 23 12.005
S = 0.7104 R-Sq = 7.50% R-Sq(adj) = 3.30%
Individual 95% CIs For Mean Based on
Pooled StDev
Level N Mean StDev --------+---------+---------+---------+-
Group 1 12 3.6658 0.7398 (-----------*-----------)
Group 2 12 3.2783 0.6798 (-----------*-----------)
--------+---------+---------+---------+-
3.15 3.50 3.85 4.20
Pooled StDev = 0.7104
Appendix B – 5: Bank Categories - Binary Logistic Regression (NB vs. MNB)
Link Function: Logit
Response Information
Variable Value Count
Banks Nationality Local 13 (Event)
Foreign 12
Total 25
Logistic Regression Table
Odds 95% CI
Predictor Coef SE Coef Z P Ratio Lower Upper
Constant 8.50655 4.21375 2.02 0.044
Innovators -1.31370 1.36547 -0.96 0.336 0.27 0.02 3.91
Early Adopters 0.130242 1.80556 0.07 0.942 1.14 0.03 39.22
Early Majority -2.01264 1.54562 -1.30 0.193 0.13 0.01 2.76
Late Majority -0.0271862 1.39262 -0.02 0.984 0.97 0.06 14.91
Laggards -1.64777 1.11818 -1.47 0.141 0.19 0.02 1.72
Log-Likelihood = -14.280
Test that all slopes are zero: G = 6.058, DF = 5, P-Value = 0.301
Goodness-of-Fit Tests
Method Chi-Square DF P
Pearson 24.3043 17 0.111
Deviance 28.5595 17 0.039
Hosmer-Lemeshow 7.5963 8 0.474

136
Table of Observed and Expected Frequencies:
(See Hosmer-Lemeshow Test for the Pearson Chi-Square Statistic)
Group
Value 1 2 3 4 5 6 7 8 9 10 Total
Local
Obs 0 1 1 0 1 4 1 1 1 3 13
Exp 0.2 0.7 0.6 1.2 1.0 2.4 1.3 1.5 1.6 2.5
Foreign
Obs 2 2 1 3 1 0 1 1 1 0 12
Exp 1.8 2.3 1.4 1.8 1.0 1.6 0.7 0.5 0.4 0.5
Total 2 3 2 3 2 4 2 2 2 3 25
Measures of Association:
(Between the Response Variable and Predicted Probabilities)
Pairs Number Percent Summary Measures
Concordant 118 75.6 Somers' D 0.52
Discordant 37 23.7 Goodman-Kruskal Gamma 0.52
Ties 1 0.6 Kendall's Tau-a 0.27
Total 156 100.0
Appendix B: Analysis of Variance (UEL vs. NEL)
- Innovation Characteristics
One-way ANOVA: Relative Advantage versus Currently Using e-learning
Source DF SS MS F P
Currently Using 1 0.160 0.160 0.24 0.632
Error 23 15.600 0.678
Total 24 15.760
S = 0.8236 R-Sq = 1.02% R-Sq(adj) = 0.00%
Individual 95% CIs For Mean Based on
Pooled StDev
Level N Mean StDev -----+---------+---------+---------+----
1 20 3.5600 0.8599 (---------*---------)
2 5 3.7600 0.6229 (------------------*------------------)
-----+---------+---------+---------+----
3.20 3.60 4.00 4.40
Pooled StDev = 0.8236
One-way ANOVA: Compatibility versus Currently Using e-learning
Source DF SS MS F P
Currently Using 1 1.166 1.166 1.38 0.252
Error 23 19.432 0.845
Total 24 20.598
S = 0.9192 R-Sq = 5.66% R-Sq(adj) = 1.56%
Individual 95% CIs For Mean Based on
Pooled StDev

137
Level N Mean StDev ---------+---------+---------+---------+
1 20 4.5000 0.9873 (--------*--------)
2 5 5.0400 0.4775 (----------------*----------------)
---------+---------+---------+---------+
4.50 5.00 5.50 6.00
Pooled StDev = 0.9192
One-way ANOVA: Complexity versus Currently Using e-learning
Source DF SS MS F P
Currently Using 1 1.392 1.392 4.81 0.039
Error 23 6.662 0.290
Total 24 8.054
S = 0.5382 R-Sq = 17.29% R-Sq(adj) = 13.69%
Individual 95% CIs For Mean Based on
Pooled StDev
Level N Mean StDev ------+---------+---------+---------+---
1 20 2.8500 0.5346 (------*-------)
2 5 3.4400 0.5550 (-------------*--------------)
------+---------+---------+---------+---
2.80 3.15 3.50 3.85
Pooled StDev = 0.5382
One-way ANOVA: Triability versus Currently Using e-learning
Source DF SS MS F P
Currently Using 1 0.078 0.078 0.56 0.462
Error 23 3.224 0.140
Total 24 3.302
S = 0.3744 R-Sq = 2.37% R-Sq(adj) = 0.00%
Individual 95% CIs For Mean Based on
Pooled StDev
Level N Mean StDev ---------+---------+---------+---------+
1 20 2.0200 0.3722 (--------*--------)
2 5 2.1600 0.3847 (----------------*----------------)
---------+---------+---------+---------+
2.00 2.20 2.40 2.60
Pooled StDev = 0.3744
One-way ANOVA: Observability versus Currently Using e-learning
Source DF SS MS F P
Currently Using 1 0.144 0.144 0.21 0.651
Error 23 15.830 0.688
Total 24 15.974
S = 0.8296 R-Sq = 0.90% R-Sq(adj) = 0.00%
Individual 95% CIs For Mean Based on
Pooled StDev

138
Level N Mean StDev -------+---------+---------+---------+--
1 20 3.8700 0.8736 (---------*--------)
2 5 3.6800 0.5762 (------------------*------------------)
-------+---------+---------+---------+--
3.20 3.60 4.00 4.40
Pooled StDev = 0.8296
- E-learning Readiness
One-way ANOVA: E-learning Readiness versus Currently Using e-learning
Source DF SS MS F P
Currently Using 1 5.198 5.198 9.64 0.005
Error 23 12.399 0.539
Total 24 17.597
S = 0.7342 R-Sq = 29.54% R-Sq(adj) = 26.48%
Individual 95% CIs For Mean Based on
Pooled StDev
Level N Mean StDev -------+---------+---------+---------+--
1 20 2.9240 0.7516 (-----*----)
2 5 4.0640 0.6455 (-----------*----------)
-------+---------+---------+---------+--
3.00 3.60 4.20 4.80
Pooled StDev = 0.7342
- Stages for AML Program
One-way ANOVA: Stages for AML Program versus Currently Using e-learning
Source DF SS MS F P
Currently Using 1 0.438 0.438 2.32 0.141
Error 23 4.347 0.189
Total 24 4.785
S = 0.4347 R-Sq = 9.16% R-Sq(adj) = 5.21%
Individual 95% CIs For Mean Based on
Pooled StDev
Level N Mean StDev ------+---------+---------+---------+---
1 20 4.2910 0.4586 (-------*-------)
2 5 4.6220 0.2960 (---------------*---------------)
------+---------+---------+---------+---
4.25 4.50 4.75 5.00
Pooled StDev = 0.4347
- Organization Characteristics
One-way ANOVA: Top Mgmt Support versus Currently Using e-learning
Source DF SS MS F P
Currently Using 1 0.314 0.314 0.94 0.344
Error 23 7.712 0.335
Total 24 8.026
S = 0.5791 R-Sq = 3.91% R-Sq(adj) = 0.00%

139
Individual 95% CIs For Mean Based on
Pooled StDev
Level N Mean StDev --+---------+---------+---------+-------
1 20 4.1200 0.5634 (--------*--------)
2 5 4.4000 0.6481 (-----------------*-----------------)
--+---------+---------+---------+-------
3.90 4.20 4.50 4.80
Pooled StDev = 0.5791
One-way ANOVA: Championship versus Currently Using e-learning
Source DF SS MS F P
Currently Using 1 0.1444 0.1444 1.74 0.200
Error 23 1.9100 0.0830
Total 24 2.0544
S = 0.2882 R-Sq = 7.03% R-Sq(adj) = 2.99%
Individual 95% CIs For Mean Based on
Pooled StDev
Level N Mean StDev -------+---------+---------+---------+--
1 20 1.5300 0.2774 (--------*--------)
2 5 1.7200 0.3347 (-----------------*----------------)
-------+---------+---------+---------+--
1.50 1.65 1.80 1.95
Pooled StDev = 0.2882
One-way ANOVA: Centralization versus Currently Using e-learning
Source DF SS MS F P
Currently Using 1 0.360 0.360 0.75 0.395
Error 23 11.000 0.478
Total 24 11.360
S = 0.6916 R-Sq = 3.17% R-Sq(adj) = 0.00%
Individual 95% CIs For Mean Based on
Pooled StDev
Level N Mean StDev ---+---------+---------+---------+------
1 20 4.1000 0.7182 (--------*--------)
2 5 4.4000 0.5477 (------------------*-----------------)
---+---------+---------+---------+------
3.85 4.20 4.55 4.90
Pooled StDev = 0.6916
One-way ANOVA: Formalization versus Currently Using e-learning
Source DF SS MS F P
Currently Using 1 0.0036 0.0036 0.05 0.824
Error 23 1.6380 0.0712
Total 24 1.6416
S = 0.2669 R-Sq = 0.22% R-Sq(adj) = 0.00%
Individual 95% CIs For Mean Based on

140
Pooled StDev
Level N Mean StDev -+---------+---------+---------+--------
1 20 1.2500 0.2503 (-------*--------)
2 5 1.2800 0.3347 (---------------*----------------)
-+---------+---------+---------+--------
1.05 1.20 1.35 1.50
Pooled StDev = 0.2669
One-way ANOVA: Internal Influence versus Currently Using e-learning
Source DF SS MS F P
Currently Using 1 0.49 0.49 0.41 0.527
Error 23 27.35 1.19
Total 24 27.84
S = 1.090 R-Sq = 1.76% R-Sq(adj) = 0.00%
Individual 95% CIs For Mean Based on
Pooled StDev
Level N Mean StDev -------+---------+---------+---------+--
1 20 3.850 1.137 (-------*--------)
2 5 4.200 0.837 (----------------*----------------)
-------+---------+---------+---------+--
3.60 4.20 4.80 5.40
Pooled StDev = 1.090
One-way ANOVA: External Influence versus Currently Using e-learning
Source DF SS MS F P
Currently Using 1 0.026 0.026 0.16 0.697
Error 23 3.792 0.165
Total 24 3.818
S = 0.4060 R-Sq = 0.67% R-Sq(adj) = 0.00%
Individual 95% CIs For Mean Based on
Pooled StDev
Level N Mean StDev ---------+---------+---------+---------+
1 20 1.3200 0.4124 (--------*--------)
2 5 1.4000 0.3742 (------------------*------------------)
---------+---------+---------+---------+
1.20 1.40 1.60 1.80
Pooled StDev = 0.4060
One-way ANOVA: Organization Slack versus Currently Using e-learning
Source DF SS MS F P
Currently Using 1 1.960 1.960 3.01 0.096
Error 23 15.000 0.652
Total 24 16.960
S = 0.8076 R-Sq = 11.56% R-Sq(adj) = 7.71%
Individual 95% CIs For Mean Based on
Pooled StDev
Level N Mean StDev ---------+---------+---------+---------+
1 20 3.9000 0.8522 (------*------)

141
2 5 4.6000 0.5477 (--------------*--------------)
---------+---------+---------+---------+
4.00 4.50 5.00 5.50
Pooled StDev = 0.8076
- Environmental Characteristics
One-way ANOVA: External Pressure versus Currently Using e-learning
Source DF SS MS F P
Currently Using 1 0.0000 0.0000 0.00 1.000
Error 23 1.2800 0.0557
Total 24 1.2800
S = 0.2359 R-Sq = 0.00% R-Sq(adj) = 0.00%
Individual 95% CIs For Mean Based on
Pooled StDev
Level N Mean StDev --+---------+---------+---------+-------
1 20 1.4000 0.2428 (--------*--------)
2 5 1.4000 0.2000 (------------------*-----------------)
--+---------+---------+---------+-------
1.20 1.32 1.44 1.56
Pooled StDev = 0.2359
One-way ANOVA: Competition versus Currently Using e-learning
Source DF SS MS F P
Currently Using 1 0.640 0.640 0.99 0.329
Error 23 14.800 0.643
Total 24 15.440
S = 0.8022 R-Sq = 4.15% R-Sq(adj) = 0.00%
Individual 95% CIs For Mean Based on
Pooled StDev
Level N Mean StDev ---------+---------+---------+---------+
1 20 3.6000 0.8208 (--------*--------)
2 5 4.0000 0.7071 (------------------*------------------)
---------+---------+---------+---------+
3.60 4.00 4.40 4.80
Pooled StDev = 0.8022
One-way ANOVA: Coercive Influence versus Currently Using e-learning
Source DF SS MS F P
Currently Using 1 1.00 1.00 1.00 0.328
Error 23 23.00 1.00
Total 24 24.00
S = 1 R-Sq = 4.17% R-Sq(adj) = 0.00%
Individual 95% CIs For Mean Based on
Pooled StDev

142
Level N Mean StDev ---+---------+---------+---------+------
1 20 4.300 0.733 (--------*--------)
2 5 3.800 1.789 (------------------*------------------)
---+---------+---------+---------+------
3.00 3.50 4.00 4.50
Pooled StDev = 1.000
- Degree of Adoption
One-way ANOVA: Degree of Adoption versus Currently Using e-learning
Source DF SS MS F P
Currently Using 1 1.445 1.445 3.08 0.092
Error 23 10.774 0.468
Total 24 12.219
S = 0.6844 R-Sq = 11.82% R-Sq(adj) = 7.99%
Individual 95% CIs For Mean Based on
Pooled StDev
Level N Mean StDev -----+---------+---------+---------+----
1 20 3.3330 0.4967 (-------*-------)
2 5 3.9340 1.2336 (--------------*---------------)
-----+---------+---------+---------+----
3.20 3.60 4.00 4.40
Pooled StDev = 0.6844
Appendix B – 7: Binary Logistic Regression (UEL vs. NEL)
- Innovation Characteristics
Binary Logistic Regression: Currently Using versus Relative Advantage
Link Function: Logit
Response Information
Variable Value Count
Currently Using e-learning 2 5 (Event)
1 20
Total 25
Logistic Regression Table
Odds 95% CI
Predictor Coef SE Coef Z P Ratio Lower Upper
Constant -2.55472 2.42206 -1.05 0.292
Relative Advantage 0.319243 0.637056 0.50 0.616 1.38 0.39 4.80
Log-Likelihood = -12.383
Test that all slopes are zero: G = 0.254, DF = 1, P-Value = 0.614
Goodness-of-Fit Tests
Method Chi-Square DF P
Pearson 8.11203 8 0.423
Deviance 9.85627 8 0.275

143
Hosmer-Lemeshow 3.21466 6 0.781
Table of Observed and Expected Frequencies:
(See Hosmer-Lemeshow Test for the Pearson Chi-Square Statistic)
Group
Value 1 2 3 4 5 6 7 8 Total
2
Obs 0 1 0 1 1 0 1 1 5
Exp 0.3 0.6 0.5 0.8 0.6 0.7 0.5 1.1
1
Obs 2 3 3 3 2 3 1 3 20
Exp 1.7 3.4 2.5 3.2 2.4 2.3 1.5 2.9
Total 2 4 3 4 3 3 2 4 25
Measures of Association:
(Between the Response Variable and Predicted Probabilities)
Pairs Number Percent Summary Measures
Concordant 55 55.0 Somers' D 0.18
Discordant 37 37.0 Goodman-Kruskal Gamma 0.20
Ties 8 8.0 Kendall's Tau-a 0.06
Total 100 100.0
Binary Logistic Regression: Currently Using versus Compatibility
Link Function: Logit
Response Information
Variable Value Count
Currently Using e-learning 2 5 (Event)
1 20
Total 25
Logistic Regression Table
Odds 95% CI
Predictor Coef SE Coef Z P Ratio Lower Upper
Constant -4.83172 3.11981 -1.55 0.121
Compatibility 0.721108 0.623686 1.16 0.248 2.06 0.61 6.98
Log-Likelihood = -11.764
Test that all slopes are zero: G = 1.493, DF = 1, P-Value = 0.222
Goodness-of-Fit Tests
Method Chi-Square DF P
Pearson 13.8744 10 0.179
Deviance 15.7508 10 0.107
Hosmer-Lemeshow 7.1347 5 0.211
Table of Observed and Expected Frequencies:
(See Hosmer-Lemeshow Test for the Pearson Chi-Square Statistic)

144
Group
Value 1 2 3 4 5 6 7 Total
2
Obs 0 0 0 1 1 2 1 5
Exp 0.1 0.3 0.2 1.0 1.0 0.5 1.8
1
Obs 2 3 2 5 4 0 4 20
Exp 1.9 2.7 1.8 5.0 4.0 1.5 3.2
Total 2 3 2 6 5 2 5 25
Measures of Association:
(Between the Response Variable and Predicted Probabilities)
Pairs Number Percent Summary Measures
Concordant 67 67.0 Somers' D 0.39
Discordant 28 28.0 Goodman-Kruskal Gamma 0.41
Ties 5 5.0 Kendall's Tau-a 0.13
Total 100 100.0
Binary Logistic Regression: Currently Using e-learning versus Complexity
Link Function: Logit
Response Information
Variable Value Count
Currently Using e-learning 2 5 (Event)
1 20
Total 25
Logistic Regression Table
Odds 95% CI
Predictor Coef SE Coef Z P Ratio Lower Upper
Constant -7.66239 3.47770 -2.20 0.028
Complexity 1.99895 1.04786 1.91 0.056 7.38 0.95 57.56
Log-Likelihood = -10.290
Test that all slopes are zero: G = 4.440, DF = 1, P-Value = 0.035
Goodness-of-Fit Tests
Method Chi-Square DF P
Pearson 9.90632 8 0.272
Deviance 9.48993 8 0.303
Hosmer-Lemeshow 9.84692 6 0.131
Table of Observed and Expected Frequencies:
(See Hosmer-Lemeshow Test for the Pearson Chi-Square Statistic)
Group
Value 1 2 3 4 5 6 7 8 Total
2
Obs 0 0 1 0 0 1 2 1 5
Exp 0.0 0.1 0.2 0.7 0.5 0.9 0.9 1.7
1
Obs 2 3 1 6 3 3 0 2 20

145
Exp 2.0 2.9 1.8 5.3 2.5 3.1 1.1 1.3
Total 2 3 2 6 3 4 2 3 25
Measures of Association:
(Between the Response Variable and Predicted Probabilities)
Pairs Number Percent Summary Measures
Concordant 74 74.0 Somers' D 0.54
Discordant 20 20.0 Goodman-Kruskal Gamma 0.57
Ties 6 6.0 Kendall's Tau-a 0.18
Total 100 100.0
Binary Logistic Regression: Currently Using e-learning versus Triability
Link Function: Logit
Response Information
Variable Value Count
Currently Using e-learning 2 5 (Event)
1 20
Total 25
Logistic Regression Table
Odds 95% CI
Predictor Coef SE Coef Z P Ratio Lower Upper
Constant -3.60496 3.01598 -1.20 0.232
Triability 1.06216 1.39774 0.76 0.447 2.89 0.19 44.78
Log-Likelihood = -12.214
Test that all slopes are zero: G = 0.592, DF = 1, P-Value = 0.442
Goodness-of-Fit Tests
Method Chi-Square DF P
Pearson 5.12164 6 0.528
Deviance 5.97675 6 0.426
Hosmer-Lemeshow 1.78812 4 0.775
Table of Observed and Expected Frequencies:
(See Hosmer-Lemeshow Test for the Pearson Chi-Square Statistic)
Group
Value 1 2 3 4 5 6 Total
2
Obs 1 0 1 1 1 1 5
Exp 0.5 0.6 1.1 1.3 0.8 0.7
1
Obs 3 4 5 5 2 1 20
Exp 3.5 3.4 4.9 4.7 2.2 1.3
Total 4 4 6 6 3 2 25
Measures of Association:
(Between the Response Variable and Predicted Probabilities)

146
Pairs Number Percent Summary Measures
Concordant 56 56.0 Somers' D 0.26
Discordant 30 30.0 Goodman-Kruskal Gamma 0.30
Ties 14 14.0 Kendall's Tau-a 0.09
Total 100 100.0
Binary Logistic Regression: Currently Using versus Observability
Link Function: Logit
Response Information
Variable Value Count
Currently Using e-learning 2 5 (Event)
1 20
Total 25
Logistic Regression Table
Odds 95% CI
Predictor Coef SE Coef Z P Ratio Lower Upper
Constant -0.281642 2.35529 -0.12 0.905
Observability -0.292529 0.618394 -0.47 0.636 0.75 0.22 2.51
Log-Likelihood = -12.398
Test that all slopes are zero: G = 0.223, DF = 1, P-Value = 0.637
Goodness-of-Fit Tests
Method Chi-Square DF P
Pearson 12.7972 12 0.384
Deviance 14.3862 12 0.277
Hosmer-Lemeshow 7.9865 8 0.435
Table of Observed and Expected Frequencies:
(See Hosmer-Lemeshow Test for the Pearson Chi-Square Statistic)
Group
Value 1 2 3 4 5 6 7 8 9 10 Total
2
Obs 0 0 1 0 2 1 0 0 1 0 5
Exp 0.3 0.7 0.5 0.4 0.8 0.4 0.7 0.5 0.5 0.3
1
Obs 2 4 2 2 2 1 3 2 1 1 20
Exp 1.7 3.3 2.5 1.6 3.2 1.6 2.3 1.5 1.5 0.7
Total 2 4 3 2 4 2 3 2 2 1 25
Measures of Association:
(Between the Response Variable and Predicted Probabilities)
Pairs Number Percent Summary Measures
Concordant 58 58.0 Somers' D 0.21
Discordant 37 37.0 Goodman-Kruskal Gamma 0.22
Ties 5 5.0 Kendall's Tau-a 0.07
Total 100 100.0

147
- E-learning Readiness
Binary Logistic Regression: Currently Using versus E-learning Readiness
Link Function: Logit
Response Information
Variable Value Count
Currently Using e-learning 2 5 (Event)
1 20
Total 25
Logistic Regression Table
Odds 95% CI
Predictor Coef SE Coef Z P Ratio Lower Upper
Constant -12.8687 6.07003 -2.12 0.034
E-learning Rediness 3.22165 1.60606 2.01 0.045 25.07 1.08 583.78
Log-Likelihood = -7.521
Test that all slopes are zero: G = 9.978, DF = 1, P-Value = 0.002
Goodness-of-Fit Tests
Method Chi-Square DF P
Pearson 19.2136 17 0.316
Deviance 15.0418 17 0.592
Hosmer-Lemeshow 9.8971 8 0.272
Table of Observed and Expected Frequencies:
(See Hosmer-Lemeshow Test for the Pearson Chi-Square Statistic)
Group
Value 1 2 3 4 5 6 7 8 9 10 Total
2
Obs 0 0 0 0 1 0 0 1 2 1 5
Exp 0.0 0.0 0.0 0.0 0.1 0.4 0.4 1.8 1.2 1.0
1
Obs 2 4 2 2 1 4 2 3 0 0 20
Exp 2.0 4.0 2.0 2.0 1.9 3.6 1.6 2.2 0.8 0.0
Total 2 4 2 2 2 4 2 4 2 1 25
Measures of Association:
(Between the Response Variable and Predicted Probabilities)
Pairs Number Percent Summary Measures
Concordant 88 88.0 Somers' D 0.76
Discordant 12 12.0 Goodman-Kruskal Gamma 0.76
Ties 0 0.0 Kendall's Tau-a 0.25
Total 100 100.0

148
- Stages for AML Program
Binary Logistic Regression: Currently Using versus Stages for AML Program
Link Function: Logit
Response Information
Variable Value Count
Currently Using e-learning 2 5 (Event)
1 20
Total 25
Logistic Regression Table
Odds 95% CI
Predictor Coef SE Coef Z P Ratio Lower Upper
Constant -14.1189 9.75812 -1.45 0.148
Stages for AML Program 2.83350 2.12125 1.34 0.182 17.00 0.27 1086.97
Log-Likelihood = -11.016
Test that all slopes are zero: G = 2.988, DF = 1, P-Value = 0.084
Goodness-of-Fit Tests
Method Chi-Square DF P
Pearson 15.4482 13 0.280
Deviance 10.9416 13 0.616
Hosmer-Lemeshow 9.6404 8 0.291
Table of Observed and Expected Frequencies:
(See Hosmer-Lemeshow Test for the Pearson Chi-Square Statistic)
Group
Value 1 2 3 4 5 6 7 8 9 10 Total
2
Obs 0 0 1 0 0 1 0 0 1 2 5
Exp 0.0 0.1 0.1 0.4 0.4 1.0 0.6 0.6 0.7 1.2
1
Obs 3 2 1 3 2 3 2 2 1 1 20
Exp 3.0 1.9 1.9 2.6 1.6 3.0 1.4 1.4 1.3 1.8
Total 3 2 2 3 2 4 2 2 2 3 25
Measures of Association:
(Between the Response Variable and Predicted Probabilities)
Pairs Number Percent Summary Measures
Concordant 73 73.0 Somers' D 0.52
Discordant 21 21.0 Goodman-Kruskal Gamma 0.55
Ties 6 6.0 Kendall's Tau-a 0.17
Total 100 100.0

149
- Organization Characteristics
Binary Logistic Regression: Currently Using versus Top Mgmt Support
Link Function: Logit
Response Information
Variable Value Count
Currently Using e-learning 2 5 (Event)
1 20
Total 25
Logistic Regression Table
Odds 95% CI
Predictor Coef SE Coef Z P Ratio Lower Upper
Constant -5.49125 4.35167 -1.26 0.207
Top Mgmt Support 0.962299 0.993289 0.97 0.333 2.62 0.37 18.34
Log-Likelihood = -11.993
Test that all slopes are zero: G = 1.035, DF = 1, P-Value = 0.309
Goodness-of-Fit Tests
Method Chi-Square DF P
Pearson 11.9424 7 0.102
Deviance 10.6052 7 0.157
Hosmer-Lemeshow 6.2358 5 0.284
Table of Observed and Expected Frequencies:
(See Hosmer-Lemeshow Test for the Pearson Chi-Square Statistic)
Group
Value 1 2 3 4 5 6 7 Total
2
Obs 0 2 0 0 0 2 1 5
Exp 0.3 0.8 0.6 0.4 0.5 2.1 0.3
1
Obs 3 4 4 2 2 5 0 20
Exp 2.7 5.2 3.4 1.6 1.5 4.9 0.7
Total 3 6 4 2 2 7 1 25
Measures of Association:
(Between the Response Variable and Predicted Probabilities)
Pairs Number Percent Summary Measures
Concordant 56 56.0 Somers' D 0.26
Discordant 30 30.0 Goodman-Kruskal Gamma 0.30
Ties 14 14.0 Kendall's Tau-a 0.09
Total 100 100.0

150
Binary Logistic Regression: Currently Using versus Championship
Link Function: Logit
Response Information
Variable Value Count
Currently Using e-learning 2 5 (Event)
1 20
Total 25
Logistic Regression Table
Odds 95% CI
Predictor Coef SE Coef Z P Ratio Lower Upper
Constant -5.54352 3.38662 -1.64 0.102
Championship 2.55459 1.99134 1.28 0.200 12.87 0.26 637.54
Log-Likelihood = -11.583
Test that all slopes are zero: G = 1.855, DF = 1, P-Value = 0.173
Goodness-of-Fit Tests
Method Chi-Square DF P
Pearson 8.89249 4 0.064
Deviance 7.16109 4 0.128
Hosmer-Lemeshow 1.10180 2 0.576
Table of Observed and Expected Frequencies:
(See Hosmer-Lemeshow Test for the Pearson Chi-Square Statistic)
Group
Value 1 2 3 4 Total
2
Obs 0 1 1 3 5
Exp 0.1 0.8 1.9 2.2
1
Obs 2 6 9 3 20
Exp 1.9 6.2 8.1 3.8
Total 2 7 10 6 25
Measures of Association:
(Between the Response Variable and Predicted Probabilities)
Pairs Number Percent Summary Measures
Concordant 61 61.0 Somers' D 0.38
Discordant 23 23.0 Goodman-Kruskal Gamma 0.45
Ties 16 16.0 Kendall's Tau-a 0.13
Total 100 100.0

151
Binary Logistic Regression: Currently Using versus Centralization
Link Function: Logit
Response Information
Variable Value Count
Currently Using e-learning 2 5 (Event)
1 20
Total 25
Logistic Regression Table
Odds 95% CI
Predictor Coef SE Coef Z P Ratio Lower Upper
Constant -4.37502 3.52187 -1.24 0.214
Centralization 0.702622 0.802328 0.88 0.381 2.02 0.42 9.73
Log-Likelihood = -12.100
Test that all slopes are zero: G = 0.821, DF = 1, P-Value = 0.365
Goodness-of-Fit Tests
Method Chi-Square DF P
Pearson 0.80213 1 0.370
Deviance 1.15648 1 0.282
Hosmer-Lemeshow 0.80213 1 0.370
Table of Observed and Expected Frequencies:
(See Hosmer-Lemeshow Test for the Pearson Chi-Square Statistic)
Group
Value 1 2 3 Total
2
Obs 0 3 2 5
Exp 0.4 2.2 2.4
1
Obs 4 10 6 20
Exp 3.6 10.8 5.6
Total 4 13 8 25
Measures of Association:
(Between the Response Variable and Predicted Probabilities)
Pairs Number Percent Summary Measures
Concordant 40 40.0 Somers' D 0.22
Discordant 18 18.0 Goodman-Kruskal Gamma 0.38
Ties 42 42.0 Kendall's Tau-a 0.07
Total 100 100.0

152
Binary Logistic Regression: Currently Using versus Formalization
Link Function: Logit
Response Information
Variable Value Count
Currently Using e-learning 2 5 (Event)
1 20
Total 25
Logistic Regression Table
Odds 95% CI
Predictor Coef SE Coef Z P Ratio Lower Upper
Constant -1.96017 2.52121 -0.78 0.437
Formalization 0.453684 1.93983 0.23 0.815 1.57 0.04 70.51
Log-Likelihood = -12.483
Test that all slopes are zero: G = 0.055, DF = 1, P-Value = 0.815
Goodness-of-Fit Tests
Method Chi-Square DF P
Pearson 4.19329 4 0.380
Deviance 5.03180 4 0.284
Hosmer-Lemeshow 4.19329 4 0.380
Table of Observed and Expected Frequencies:
(See Hosmer-Lemeshow Test for the Pearson Chi-Square Statistic)
Group
Value 1 2 3 4 5 6 Total
2
Obs 1 0 2 0 2 0 5
Exp 0.3 0.7 2.1 0.4 1.1 0.2
1
Obs 1 4 9 2 3 1 20
Exp 1.7 3.3 8.9 1.6 3.9 0.8
Total 2 4 11 2 5 1 25
Measures of Association:
(Between the Response Variable and Predicted Probabilities)
Pairs Number Percent Summary Measures
Concordant 42 42.0 Somers' D 0.09
Discordant 33 33.0 Goodman-Kruskal Gamma 0.12
Ties 25 25.0 Kendall's Tau-a 0.03
Total 100 100.0
Binary Logistic Regression: Currently Using versus Internal Influence
Link Function: Logit
Response Information

153
Variable Value Count
Currently Using e-learning 2 5 (Event)
1 20
Total 25
Logistic Regression Table
Odds 95% CI
Predictor Coef SE Coef Z P Ratio Lower Upper
Constant -2.81088 2.28785 -1.23 0.219
Internal Influence 0.353094 0.538531 0.66 0.512 1.42 0.50 4.09
Log-Likelihood = -12.273
Test that all slopes are zero: G = 0.473, DF = 1, P-Value = 0.492
Goodness-of-Fit Tests
Method Chi-Square DF P
Pearson 0.427414 3 0.935
Deviance 0.608147 3 0.895
Hosmer-Lemeshow 0.426819 2 0.808
Table of Observed and Expected Frequencies:
(See Hosmer-Lemeshow Test for the Pearson Chi-Square Statistic)
Group
Value 1 2 3 4 Total
2
Obs 0 1 2 2 5
Exp 0.2 0.9 1.6 2.3
1
Obs 2 5 6 7 20
Exp 1.8 5.1 6.4 6.7
Total 2 6 8 9 25
Measures of Association:
(Between the Response Variable and Predicted Probabilities)
Pairs Number Percent Summary Measures
Concordant 42 42.0 Somers' D 0.15
Discordant 27 27.0 Goodman-Kruskal Gamma 0.22
Ties 31 31.0 Kendall's Tau-a 0.05
Total 100 100.0
Binary Logistic Regression: Currently Using versus External Influence
Link Function: Logit
Response Information
Variable Value Count
Currently Using e-learning 2 5 (Event)
1 20
Total 25
Logistic Regression Table

154
Odds 95% CI
Predictor Coef SE Coef Z P Ratio Lower Upper
Constant -2.11391 1.88266 -1.12 0.262
External Influence 0.534876 1.31073 0.41 0.683 1.71 0.13 22.28
Log-Likelihood = -12.425
Test that all slopes are zero: G = 0.170, DF = 1, P-Value = 0.680
Goodness-of-Fit Tests
Method Chi-Square DF P
Pearson 5.55594 6 0.475
Deviance 7.02987 6 0.318
Hosmer-Lemeshow 5.55521 5 0.352
Table of Observed and Expected Frequencies:
(See Hosmer-Lemeshow Test for the Pearson Chi-Square Statistic)
Group
Value 1 2 3 4 5 6 7 Total
2
Obs 0 1 1 2 0 0 1 5
Exp 0.4 0.7 0.9 0.8 0.9 0.7 0.5
1
Obs 3 3 4 2 4 3 1 20
Exp 2.6 3.3 4.1 3.2 3.1 2.3 1.5
Total 3 4 5 4 4 3 2 25
Measures of Association:
(Between the Response Variable and Predicted Probabilities)
Pairs Number Percent Summary Measures
Concordant 48 48.0 Somers' D 0.08
Discordant 40 40.0 Goodman-Kruskal Gamma 0.09
Ties 12 12.0 Kendall's Tau-a 0.03
Total 100 100.0
Binary Logistic Regression: Currently Using versus Organization Slack
Link Function: Logit
Response Information
Variable Value Count
Currently Using e-learning 2 5 (Event)
1 20
Total 25
Logistic Regression Table
Odds 95% CI
Predictor Coef SE Coef Z P Ratio Lower Upper
Constant -6.63424 3.55776 -1.86 0.062
Organization Slack 1.22670 0.782684 1.57 0.117 3.41 0.74 15.81

155
Log-Likelihood = -10.937
Test that all slopes are zero: G = 3.147, DF = 1, P-Value = 0.076
Goodness-of-Fit Tests
Method Chi-Square DF P
Pearson 1.10419 1 0.293
Deviance 1.41845 1 0.234
Hosmer-Lemeshow 1.10419 1 0.293
Table of Observed and Expected Frequencies:
(See Hosmer-Lemeshow Test for the Pearson Chi-Square Statistic)
Group
Value 1 2 3 Total
2
Obs 0 2 3 5
Exp 0.4 1.2 3.4
1
Obs 8 6 6 20
Exp 7.6 6.8 5.6
Total 8 8 9 25
Measures of Association:
(Between the Response Variable and Predicted Probabilities)
Pairs Number Percent Summary Measures
Concordant 58 58.0 Somers' D 0.46
Discordant 12 12.0 Goodman-Kruskal Gamma 0.66
Ties 30 30.0 Kendall's Tau-a 0.15
Total 100 100.0
- Environmental Characteristics
Binary Logistic Regression: Currently Using versus External Pressure
Link Function: Logit
Response Information
Variable Value Count
Currently Using e-learning 2 5 (Event)
1 20
Total 25
Logistic Regression Table
Odds 95% CI
Predictor Coef SE Coef Z P Ratio Lower Upper
Constant -1.38629 3.13374 -0.44 0.658
External Pressure 0.0000000 2.20971 0.00 1.000 1.00 0.01 76.02
Log-Likelihood = -12.510
Test that all slopes are zero: G = 0.000, DF = 1, P-Value = 1.000
Goodness-of-Fit Tests

156
Method Chi-Square DF P
Pearson 1.58730 4 0.811
Deviance 2.10561 4 0.716
Hosmer-Lemeshow 1.58730 3 0.662
Table of Observed and Expected Frequencies:
(See Hosmer-Lemeshow Test for the Pearson Chi-Square Statistic)
Group
Value 1 2 3 4 5 Total
2
Obs 0 2 1 2 0 5
Exp 0.4 1.2 1.4 1.8 0.2
1
Obs 2 4 6 7 1 20
Exp 1.6 4.8 5.6 7.2 0.8
Total 2 6 7 9 1 25
Measures of Association:
(Between the Response Variable and Predicted Probabilities)
Pairs Number Percent Summary Measures
Concordant 0 0.0 Somers' D 0.00
Discordant 0 0.0 Goodman-Kruskal Gamma *
Ties 100 100.0 Kendall's Tau-a 0.00
Total 100 100.0
Binary Logistic Regression: Currently Using versus Competition
Link Function: Logit
Response Information
Variable Value Count
Currently Using e-learning 2 5 (Event)
1 20
Total 25
Logistic Regression Table
Odds 95% CI
Predictor Coef SE Coef Z P Ratio Lower Upper
Constant -4.46112 3.26822 -1.37 0.172
Competition 0.805343 0.819780 0.98 0.326 2.24 0.45 11.16
Log-Likelihood = -11.920
Test that all slopes are zero: G = 1.180, DF = 1, P-Value = 0.277
Goodness-of-Fit Tests
Method Chi-Square DF P
Pearson 1.11853 2 0.572
Deviance 1.12674 2 0.569
Hosmer-Lemeshow 1.11853 2 0.572

157
Table of Observed and Expected Frequencies:
(See Hosmer-Lemeshow Test for the Pearson Chi-Square Statistic)
Group
Value 1 2 3 4 Total
2
Obs 0 1 3 1 5
Exp 0.2 0.5 3.6 0.8
1
Obs 3 3 13 1 20
Exp 2.8 3.5 12.4 1.2
Total 3 4 16 2 25
Measures of Association:
(Between the Response Variable and Predicted Probabilities)
Pairs Number Percent Summary Measures
Concordant 40 40.0 Somers' D 0.23
Discordant 17 17.0 Goodman-Kruskal Gamma 0.40
Ties 43 43.0 Kendall's Tau-a 0.08
Total 100 100.0
Binary Logistic Regression: Currently Using versus Coercive Influence
Link Function: Logit
Response Information
Variable Value Count
Currently Using e-learning 2 5 (Event)
1 20
Total 25
Logistic Regression Table
Odds 95% CI
Predictor Coef SE Coef Z P Ratio Lower Upper
Constant 0.489109 1.93489 0.25 0.800
Coercive Influence -0.460207 0.470434 -0.98 0.328 0.63 0.25 1.59
Log-Likelihood = -12.037
Test that all slopes are zero: G = 0.945, DF = 1, P-Value = 0.331
Goodness-of-Fit Tests
Method Chi-Square DF P
Pearson 4.26836 2 0.118
Deviance 6.07992 2 0.048
Hosmer-Lemeshow 4.26836 2 0.118
Table of Observed and Expected Frequencies:
(See Hosmer-Lemeshow Test for the Pearson Chi-Square Statistic)
Group
Value 1 2 3 4 Total

158
2
Obs 3 0 1 1 5
Exp 1.7 1.6 1.2 0.5
1
Obs 9 8 3 0 20
Exp 10.3 6.4 2.8 0.5
Total 12 8 4 1 25
Measures of Association:
(Between the Response Variable and Predicted Probabilities)
Pairs Number Percent Summary Measures
Concordant 37 37.0 Somers' D 0.04
Discordant 33 33.0 Goodman-Kruskal Gamma 0.06
Ties 30 30.0 Kendall's Tau-a 0.01
Total 100 100.0
- Degree of Adoption
Binary Logistic Regression: Currently Using versus Degree of Adoption
Link Function: Logit
Response Information
Variable Value Count
Currently Using e-learning 2 5 (Event)
1 20
Total 25
Logistic Regression Table
Odds 95% CI
Predictor Coef SE Coef Z P Ratio Lower Upper
Constant -6.29200 3.22680 -1.95 0.051
Degree of Adoption 1.35385 0.849337 1.59 0.111 3.87 0.73 20.46
Log-Likelihood = -10.975
Test that all slopes are zero: G = 3.070, DF = 1, P-Value = 0.080
Goodness-of-Fit Tests
Method Chi-Square DF P
Pearson 38.8612 6 0.000
Deviance 12.0443 6 0.061
Hosmer-Lemeshow 10.2055 4 0.037
Table of Observed and Expected Frequencies:
(See Hosmer-Lemeshow Test for the Pearson Chi-Square Statistic)
Group
Value 1 2 3 4 5 6 Total
2
Obs 1 0 0 1 1 2 5
Exp 0.1 0.4 0.9 1.3 1.2 1.2
1
Obs 2 4 6 5 3 0 20

159
Exp 2.9 3.6 5.1 4.7 2.8 0.8
Total 3 4 6 6 4 2 25
Measures of Association:
(Between the Response Variable and Predicted Probabilities)
Pairs Number Percent Summary Measures
Concordant 69 69.0 Somers' D 0.46
Discordant 23 23.0 Goodman-Kruskal Gamma 0.50
Ties 8 8.0 Kendall's Tau-a 0.15
Total 100 100.0
Appendix B – 8: Analysis of Variance for E-learning Readiness Questions (UEL vs.
NEL) One-way ANOVA: Q. How well is the bank using (Internet and Intranet) technology to run its
business? versus Currently Using e-learning
Source DF SS MS F P
Currently Using 1 5.29 5.29 2.35 0.139
Error 23 51.75 2.25
Total 24 57.04
S = 1.5 R-Sq = 9.27% R-Sq(adj) = 5.33%
Individual 95% CIs For Mean Based on
Pooled StDev
Level N Mean StDev ------+---------+---------+---------+---
1 20 3.050 1.605 (-----*------)
2 5 4.200 0.837 (-------------*-------------)
------+---------+---------+---------+---
3.0 4.0 5.0 6.0
Pooled StDev = 1.500
One-way ANOVA: Q. How prepared (skills, knowledge, motivation) is your workforce to compete
and win in the high-tech, new economy? versus Currently Using e-learning
Source DF SS MS F P
Currently Using 1 0.81 0.81 0.56 0.462
Error 23 33.35 1.45
Total 24 34.16
S = 1.204 R-Sq = 2.37% R-Sq(adj) = 0.00%
Individual 95% CIs For Mean Based on
Pooled StDev
Level N Mean StDev -----+---------+---------+---------+----
1 20 3.350 1.268 (--------*--------)
2 5 3.800 0.837 (-----------------*------------------)
-----+---------+---------+---------+----
3.00 3.60 4.20 4.80
Pooled StDev = 1.204

160
One-way ANOVA: Q. How the bank does define “e-learning?” versus Currently Using e-learning
Source DF SS MS F P
Currently Using 1 5.290 5.290 8.85 0.007
Error 23 13.750 0.598
Total 24 19.040
S = 0.7732 R-Sq = 27.78% R-Sq(adj) = 24.64%
Individual 95% CIs For Mean Based on
Pooled StDev
Level N Mean StDev -----+---------+---------+---------+----
1 20 3.0500 0.8256 (-----*-----)
2 5 4.2000 0.4472 (-----------*-----------)
-----+---------+---------+---------+----
3.00 3.60 4.20 4.80
Pooled StDev = 0.7732
One-way ANOVA: Q. How will the bank overcomes any bad prior experiences you and others have
had with technology based learning? versus Currently Using e-learning
Source DF SS MS F P
Currently Using 1 9.00 9.00 6.68 0.017
Error 23 31.00 1.35
Total 24 40.00
S = 1.161 R-Sq = 22.50% R-Sq(adj) = 19.13%
Individual 95% CIs For Mean Based on
Pooled StDev
Level N Mean StDev +---------+---------+---------+---------
1 20 2.900 1.252 (-----*------)
2 5 4.400 0.548 (------------*------------)
+---------+---------+---------+---------
2.40 3.20 4.00 4.80
Pooled StDev = 1.161
One-way ANOVA: Q. How much access do people have to the web (anyone, any time, anywhere)?
versus Currently Using e-learning
Source DF SS MS F P
Currently Using 1 3.610 3.610 4.90 0.037
Error 23 16.950 0.737
Total 24 20.560
S = 0.8585 R-Sq = 17.56% R-Sq(adj) = 13.97%
Individual 95% CIs For Mean Based on
Pooled StDev
Level N Mean StDev ------+---------+---------+---------+---
1 20 3.0500 0.7592 (------*-----)
2 5 4.0000 1.2247 (-------------*------------)
------+---------+---------+---------+---
3.00 3.60 4.20 4.80

161
Pooled StDev = 0.8585
One-way ANOVA: Q. Do you differentiate between instructional needs (training) and informational
needs (knowledge management), and do you make the right decisions about when to use each? versus
Currently Using e-learning
Source DF SS MS F P
Currently Using 1 2.560 2.560 2.78 0.109
Error 23 21.200 0.922
Total 24 23.760
S = 0.9601 R-Sq = 10.77% R-Sq(adj) = 6.90%
Individual 95% CIs For Mean Based on
Pooled StDev
Level N Mean StDev ----+---------+---------+---------+-----
1 20 3.2000 1.0052 (------*-------)
2 5 4.0000 0.7071 (--------------*-------------)
----+---------+---------+---------+-----
3.00 3.60 4.20 4.80
Pooled StDev = 0.9601
One-way ANOVA: Q. What is the level of the bank’s expertise in instructional and information
design? versus Currently Using e-learning
Source DF SS MS F P
Currently Using 1 5.760 5.760 15.05 0.001
Error 23 8.800 0.383
Total 24 14.560
S = 0.6186 R-Sq = 39.56% R-Sq(adj) = 36.93%
Individual 95% CIs For Mean Based on
Pooled StDev
Level N Mean StDev -----+---------+---------+---------+----
1 20 3.0000 0.6489 (----*----)
2 5 4.2000 0.4472 (---------*---------)
-----+---------+---------+---------+----
3.00 3.60 4.20 4.80
Pooled StDev = 0.6186
One-way ANOVA: Q. Is the bank ready to move beyond a predominant reliance on classroom
training to a more balanced approach with e-learning? versus Currently Using e-learning
Source DF SS MS F P
Currently Using 1 6.76 6.76 4.07 0.055
Error 23 38.20 1.66
Total 24 44.96
S = 1.289 R-Sq = 15.04% R-Sq(adj) = 11.34%
Individual 95% CIs For Mean Based on
Pooled StDev

162
Level N Mean StDev ----+---------+---------+---------+-----
1 20 2.700 1.342 (-------*------)
2 5 4.000 1.000 (--------------*--------------)
----+---------+---------+---------+-----
2.40 3.20 4.00 4.80
Pooled StDev = 1.289
One-way ANOVA: Q. Does senior management support e-learning? versus Currently Using e-
learning
Source DF SS MS F P
Currently Using 1 8.410 8.410 12.60 0.002
Error 23 15.350 0.667
Total 24 23.760
S = 0.8169 R-Sq = 35.40% R-Sq(adj) = 32.59%
Individual 95% CIs For Mean Based on
Pooled StDev
Level N Mean StDev --------+---------+---------+---------+-
1 20 3.3500 0.8751 (-----*----)
2 5 4.8000 0.4472 (----------*---------)
--------+---------+---------+---------+-
3.50 4.20 4.90 5.60
Pooled StDev = 0.8169
One-way ANOVA: Q. Does the bank have a Change management plan for introducing e-learning?
versus Currently Using e-learning
Source DF SS MS F P
Currently Using 1 5.29 5.29 4.26 0.050
Error 23 28.55 1.24
Total 24 33.84
S = 1.114 R-Sq = 15.63% R-Sq(adj) = 11.96%
Individual 95% CIs For Mean Based on
Pooled StDev
Level N Mean StDev -------+---------+---------+---------+--
1 20 2.850 1.182 (-------*------)
2 5 4.000 0.707 (--------------*--------------)
-------+---------+---------+---------+--
2.80 3.50 4.20 4.90
Pooled StDev = 1.114
One-way ANOVA: Q. Can the bank demonstrate the business benefits of e-learning? versus
Currently Using e-learning
Source DF SS MS F P
Currently Using 1 1.96 1.96 1.65 0.212
Error 23 27.40 1.19
Total 24 29.36
S = 1.091 R-Sq = 6.68% R-Sq(adj) = 2.62%

163
Individual 95% CIs For Mean Based on
Pooled StDev
Level N Mean StDev ---+---------+---------+---------+------
1 20 2.700 1.031 (-------*-------)
2 5 3.400 1.342 (----------------*---------------)
---+---------+---------+---------+------
2.40 3.00 3.60 4.20
Pooled StDev = 1.091
One-way ANOVA: Q. Does the bank have a plan to help the training function reinvent itself for the
digital age? versus Currently Using e-learning
Source DF SS MS F P
Currently Using 1 7.84 7.84 5.50 0.028
Error 23 32.80 1.43
Total 24 40.64
S = 1.194 R-Sq = 19.29% R-Sq(adj) = 15.78%
Individual 95% CIs For Mean Based on
Pooled StDev
Level N Mean StDev ----+---------+---------+---------+-----
1 20 2.600 1.273 (-----*------)
2 5 4.000 0.707 (-------------*-------------)
----+---------+---------+---------+-----
2.40 3.20 4.00 4.80
Pooled StDev = 1.194
One-way ANOVA: Q. What is the climate in the bank to learning in alternative locations, especially
the work site? versus Currently Using e-learning
Source DF SS MS F P
Currently Using 1 7.290 7.290 9.66 0.005
Error 23 17.350 0.754
Total 24 24.640
S = 0.8685 R-Sq = 29.59% R-Sq(adj) = 26.52%
Individual 95% CIs For Mean Based on
Pooled StDev
Level N Mean StDev -----+---------+---------+---------+----
1 20 2.8500 0.8751 (-----*----)
2 5 4.2000 0.8367 (----------*----------)
-----+---------+---------+---------+----
2.80 3.50 4.20 4.90
Pooled StDev = 0.8685
One-way ANOVA: Q. Is the bank willing to allow e-learning to thrive, perhaps at the expense of
some of the more traditional parts of the training organization? versus Currently Using e-learning
Source DF SS MS F P
Currently Using 1 7.290 7.290 7.85 0.010

164
Error 23 21.350 0.928
Total 24 28.640
S = 0.9635 R-Sq = 25.45% R-Sq(adj) = 22.21%
Individual 95% CIs For Mean Based on
Pooled StDev
Level N Mean StDev ------+---------+---------+---------+---
1 20 2.8500 0.9881 (------*-----)
2 5 4.2000 0.8367 (------------*------------)
------+---------+---------+---------+---
2.80 3.50 4.20 4.90
Pooled StDev = 0.9635
One-way ANOVA: Q. How prepared is the bank to invest in, and incubate e learning for several
years in order to get it firmly established? versus Currently Using e-learning
Source DF SS MS F P
Currently Using 1 8.41 8.41 6.68 0.017
Error 23 28.95 1.26
Total 24 37.36
S = 1.122 R-Sq = 22.51% R-Sq(adj) = 19.14%
Individual 95% CIs For Mean Based on
Pooled StDev
Level N Mean StDev -----+---------+---------+---------+----
1 20 2.550 1.191 (------*-----)
2 5 4.000 0.707 (------------*------------)
-----+---------+---------+---------+----
2.40 3.20 4.00 4.80
Pooled StDev = 1.122
One-way ANOVA: Q. How prepared is the bank to deal with a large and increasingly complex e-
learning marketplace? versus Currently Using e-learning
Source DF SS MS F P
Currently Using 1 4.84 4.84 3.59 0.071
Error 23 31.00 1.35
Total 24 35.84
S = 1.161 R-Sq = 13.50% R-Sq(adj) = 9.74%
Individual 95% CIs For Mean Based on
Pooled StDev
Level N Mean StDev ---------+---------+---------+---------+
1 20 2.700 1.218 (-------*------)
2 5 3.800 0.837 (--------------*---------------)
---------+---------+---------+---------+
2.80 3.50 4.20 4.90
Pooled StDev = 1.161

165
One-way ANOVA: Q. Does the bank have a good handle on what it is buying in the e-learning
marketplace – can it differentiate quality products and weed out redundancies? versus Currently
Using e-learning
Source DF SS MS F P
Currently Using 1 9.61 9.61 7.43 0.012
Error 23 29.75 1.29
Total 24 39.36
S = 1.137 R-Sq = 24.42% R-Sq(adj) = 21.13%
Individual 95% CIs For Mean Based on
Pooled StDev
Level N Mean StDev -+---------+---------+---------+--------
1 20 2.850 1.226 (------*-----)
2 5 4.400 0.548 (------------*------------)
-+---------+---------+---------+--------
2.40 3.20 4.00 4.80
Pooled StDev = 1.137
One-way ANOVA: Q. Is the bank prepared to outsource some of its functions and manage them
externally so that it can concentrate its resources on more valuable areas? versus Currently Using e-
learning
Source DF SS MS F P
Currently Using 1 0.81 0.81 0.53 0.473
Error 23 34.95 1.52
Total 24 35.76
S = 1.233 R-Sq = 2.27% R-Sq(adj) = 0.00%
Individual 95% CIs For Mean Based on
Pooled StDev
Level N Mean StDev ---------+---------+---------+---------+
1 20 2.550 1.146 (--------*---------)
2 5 3.000 1.581 (------------------*------------------)
---------+---------+---------+---------+
2.40 3.00 3.60 4.20
Pooled StDev = 1.233
One-way ANOVA: Q. How committed are you, personally, to e-learning? Are you ready? versus
Currently Using e-learning
Source DF SS MS F P
Currently Using 1 5.76 5.76 4.73 0.040
Error 23 28.00 1.22
Total 24 33.76
S = 1.103 R-Sq = 17.06% R-Sq(adj) = 13.46%
Individual 95% CIs For Mean Based on
Pooled StDev
Level N Mean StDev ---------+---------+---------+---------+
1 20 3.400 1.188 (-------*------)

166
2 5 4.600 0.548 (--------------*-------------)
---------+---------+---------+---------+
3.50 4.20 4.90 5.60
Pooled StDev = 1.103
Appendix B – 9: Analysis of Variance for E-learning Readiness Questions (CG1 vs. CG2) One-way ANOVA: Q. How well is the bank using (Internet and Intranet) technology to run its
business? versus K-means Clustering groups
Source DF SS MS F P
K-means Clustering 1 8.17 8.17 4.77 0.040
Error 22 37.67 1.71
Total 23 45.83
S = 1.308 R-Sq = 17.82% R-Sq(adj) = 14.08%
Individual 95% CIs For Mean Based on
Pooled StDev
Level N Mean StDev -+---------+---------+---------+--------
Group 1 12 4.000 0.953 (----------*----------)
Group 2 12 2.833 1.586 (----------*-----------)
-+---------+---------+---------+--------
2.10 2.80 3.50 4.20
Pooled StDev = 1.308
One-way ANOVA: Q. How prepared (skills, knowledge, motivation) is your workforce to compete
and win in the high-tech, new economy? versus K-means Clustering groups
Source DF SS MS F P
K-means Clustering 1 3.38 3.38 2.43 0.133
Error 22 30.58 1.39
Total 23 33.96
S = 1.179 R-Sq = 9.94% R-Sq(adj) = 5.84%
Individual 95% CIs For Mean Based on
Pooled StDev
Level N Mean StDev +---------+---------+---------+---------
Group 1 12 3.833 0.835 (-----------*-----------)
Group 2 12 3.083 1.443 (----------*-----------)
+---------+---------+---------+---------
2.40 3.00 3.60 4.20
Pooled StDev = 1.179
One-way ANOVA: Q. How the bank does define “e-learning?” versus K-means Clustering groups
Source DF SS MS F P
K-means Clustering 1 5.042 5.042 7.97 0.010
Error 22 13.917 0.633
Total 23 18.958
S = 0.7953 R-Sq = 26.59% R-Sq(adj) = 23.26%

167
Individual 95% CIs For Mean Based on
Pooled StDev
Level N Mean StDev ---+---------+---------+---------+------
Group 1 12 3.7500 0.7538 (---------*---------)
Group 2 12 2.8333 0.8348 (---------*--------)
---+---------+---------+---------+------
2.50 3.00 3.50 4.00
Pooled StDev = 0.7953
One-way ANOVA: Q. How will the bank overcomes any bad prior experiences you and others have
had with technology based learning? versus K-means Clustering groups
Source DF SS MS F P
K-means Clustering 1 2.04 2.04 1.18 0.288
Error 22 37.92 1.72
Total 23 39.96
S = 1.313 R-Sq = 5.11% R-Sq(adj) = 0.80%
Individual 95% CIs For Mean Based on
Pooled StDev
Level N Mean StDev ----+---------+---------+---------+-----
Group 1 12 3.500 1.382 (------------*------------)
Group 2 12 2.917 1.240 (------------*------------)
----+---------+---------+---------+-----
2.40 3.00 3.60 4.20
Pooled StDev = 1.313
One-way ANOVA: Q. How much access do people have to the web (anyone, any time, anywhere)?
versus K-means Clustering groups
Source DF SS MS F P
K-means Clustering 1 1.500 1.500 1.74 0.201
Error 22 19.000 0.864
Total 23 20.500
S = 0.9293 R-Sq = 7.32% R-Sq(adj) = 3.10%
Individual 95% CIs For Mean Based on
Pooled StDev
Level N Mean StDev -+---------+---------+---------+--------
Group 1 12 3.5000 1.0000 (----------*----------)
Group 2 12 3.0000 0.8528 (----------*----------)
-+---------+---------+---------+--------
2.50 3.00 3.50 4.00
Pooled StDev = 0.9293

168
One-way ANOVA: Q. Do you differentiate between instructional needs (training) and informational
needs (knowledge management), and do you make the right decisions about when to use each? versus
K-means Clustering groups
Source DF SS MS F P
K-means Clustering 1 1.04 1.04 1.01 0.325
Error 22 22.58 1.03
Total 23 23.63
S = 1.013 R-Sq = 4.41% R-Sq(adj) = 0.06%
Individual 95% CIs For Mean Based on
Pooled StDev
Level N Mean StDev ---------+---------+---------+---------+
Group 1 12 3.583 0.900 (-----------*-----------)
Group 2 12 3.167 1.115 (-----------*-----------)
---------+---------+---------+---------+
3.00 3.50 4.00 4.50
Pooled StDev = 1.013
One-way ANOVA: Q. What is the level of the bank’s expertise in instructional and information
design? versus K-means Clustering groups
Source DF SS MS F P
K-means Clustering 1 2.667 2.667 4.96 0.037
Error 22 11.833 0.538
Total 23 14.500
S = 0.7334 R-Sq = 18.39% R-Sq(adj) = 14.68%
Individual 95% CIs For Mean Based on
Pooled StDev
Level N Mean StDev --------+---------+---------+---------+-
Group 1 12 3.5833 0.7930 (----------*----------)
Group 2 12 2.9167 0.6686 (----------*----------)
--------+---------+---------+---------+-
2.80 3.20 3.60 4.00
Pooled StDev = 0.7334
One-way ANOVA: Q. Is the bank ready to move beyond a predominant reliance on classroom
training to a more balanced approach with e-learning? versus K-means Clustering groups
Source DF SS MS F P
K-means Clustering 1 5.04 5.04 2.78 0.110
Error 22 39.92 1.81
Total 23 44.96
S = 1.347 R-Sq = 11.21% R-Sq(adj) = 7.18%
Individual 95% CIs For Mean Based on
Pooled StDev
Level N Mean StDev ------+---------+---------+---------+---
Group 1 12 3.417 1.240 (-----------*----------)
Group 2 12 2.500 1.446 (-----------*----------)

169
------+---------+---------+---------+---
2.10 2.80 3.50 4.20
Pooled StDev = 1.347
One-way ANOVA: Q. Does senior management support e-learning? versus K-means Clustering
groups
Source DF SS MS F P
K-means Clustering 1 4.167 4.167 4.78 0.040
Error 22 19.167 0.871
Total 23 23.333
S = 0.9334 R-Sq = 17.86% R-Sq(adj) = 14.12%
Individual 95% CIs For Mean Based on
Pooled StDev
Level N Mean StDev ------+---------+---------+---------+---
Group 1 12 4.0833 0.9003 (-----------*----------)
Group 2 12 3.2500 0.9653 (----------*----------)
------+---------+---------+---------+---
3.00 3.50 4.00 4.50
Pooled StDev = 0.9334
One-way ANOVA: Q. Does the bank have a Change management plan for introducing e-learning?
versus K-means Clustering groups
Source DF SS MS F P
K-means Clustering 1 5.04 5.04 4.02 0.057
Error 22 27.58 1.25
Total 23 32.63
S = 1.120 R-Sq = 15.45% R-Sq(adj) = 11.61%
Individual 95% CIs For Mean Based on
Pooled StDev
Level N Mean StDev -------+---------+---------+---------+--
Group 1 12 3.583 0.793 (----------*----------)
Group 2 12 2.667 1.371 (----------*-----------)
-------+---------+---------+---------+--
2.40 3.00 3.60 4.20
Pooled StDev = 1.120
One-way ANOVA: Q. Can the bank demonstrate the business benefits of e-learning? versus K-means
Clustering groups
Source DF SS MS F P
K-means Clustering 1 7.042 7.042 7.18 0.014
Error 22 21.583 0.981
Total 23 28.625
S = 0.9905 R-Sq = 24.60% R-Sq(adj) = 21.17%
Individual 95% CIs For Mean Based on

170
Pooled StDev
Level N Mean StDev -+---------+---------+---------+--------
Group 1 12 3.4167 0.9003 (---------*---------)
Group 2 12 2.3333 1.0731 (---------*---------)
-+---------+---------+---------+--------
1.80 2.40 3.00 3.60
Pooled StDev = 0.9905
One-way ANOVA: Q. Does the bank have a plan to help the training function reinvent itself for the
digital age? versus K-means Clustering groups
Source DF SS MS F P
K-means Clustering 1 12.04 12.04 9.27 0.006
Error 22 28.58 1.30
Total 23 40.63
S = 1.140 R-Sq = 29.64% R-Sq(adj) = 26.44%
Individual 95% CIs For Mean Based on
Pooled StDev
Level N Mean StDev ---------+---------+---------+---------+
Group 1 12 3.583 0.793 (---------*---------)
Group 2 12 2.167 1.403 (---------*---------)
---------+---------+---------+---------+
2.10 2.80 3.50 4.20
Pooled StDev = 1.140
One-way ANOVA: Q. What is the climate in the bank to learning in alternative locations, especially
the work site? versus K-means Clustering groups
Source DF SS MS F P
K-means Clustering 1 5.042 5.042 7.44 0.012
Error 22 14.917 0.678
Total 23 19.958
S = 0.8234 R-Sq = 25.26% R-Sq(adj) = 21.86%
Individual 95% CIs For Mean Based on
Pooled StDev
Level N Mean StDev -----+---------+---------+---------+----
Group 1 12 3.6667 0.8876 (---------*---------)
Group 2 12 2.7500 0.7538 (---------*---------)
-----+---------+---------+---------+----
2.50 3.00 3.50 4.00
Pooled StDev = 0.8234
One-way ANOVA: Q. Is the bank willing to allow e-learning to thrive, perhaps at the expense of
some of the more traditional parts of the training organization? versus K-means Clustering groups
Source DF SS MS F P
K-means Clustering 1 5.042 5.042 5.86 0.024
Error 22 18.917 0.860
Total 23 23.958

171
S = 0.9273 R-Sq = 21.04% R-Sq(adj) = 17.45%
Individual 95% CIs For Mean Based on
Pooled StDev
Level N Mean StDev ---+---------+---------+---------+------
Group 1 12 3.6667 0.9847 (--------*--------)
Group 2 12 2.7500 0.8660 (--------*--------)
---+---------+---------+---------+------
2.40 3.00 3.60 4.20
Pooled StDev = 0.9273
One-way ANOVA: Q. How prepared is the bank to invest in, and incubate e learning for several
years in order to get it firmly established? versus K-means Clustering groups
Source DF SS MS F P
K-means Clustering 1 10.67 10.67 10.13 0.004
Error 22 23.17 1.05
Total 23 33.83
S = 1.026 R-Sq = 31.53% R-Sq(adj) = 28.41%
Individual 95% CIs For Mean Based on
Pooled StDev
Level N Mean StDev -------+---------+---------+---------+--
Group 1 12 3.583 0.900 (--------*--------)
Group 2 12 2.250 1.138 (--------*--------)
-------+---------+---------+---------+--
2.10 2.80 3.50 4.20
Pooled StDev = 1.026
One-way ANOVA: Q. How prepared is the bank to deal with a large and increasingly complex e-
learning marketplace? versus K-means Clustering groups
Source DF SS MS F P
K-means Clustering 1 8.17 8.17 7.54 0.012
Error 22 23.83 1.08
Total 23 32.00
S = 1.041 R-Sq = 25.52% R-Sq(adj) = 22.14%
Individual 95% CIs For Mean Based on
Pooled StDev
Level N Mean StDev ----+---------+---------+---------+-----
Group 1 12 3.583 0.793 (--------*--------)
Group 2 12 2.417 1.240 (--------*-------)
----+---------+---------+---------+-----
2.10 2.80 3.50 4.20
Pooled StDev = 1.041

172
One-way ANOVA: Q. Does the bank have a good handle on what it is buying in the e-learning
marketplace – can it differentiate quality products and weed out redundancies? versus K-means
Clustering groups
Source DF SS MS F P
K-means Clustering 1 10.67 10.67 9.32 0.006
Error 22 25.17 1.14
Total 23 35.83
S = 1.070 R-Sq = 29.77% R-Sq(adj) = 26.58%
Individual 95% CIs For Mean Based on
Pooled StDev
Level N Mean StDev -----+---------+---------+---------+----
Group 1 12 3.750 0.866 (---------*--------)
Group 2 12 2.417 1.240 (---------*--------)
-----+---------+---------+---------+----
2.10 2.80 3.50 4.20
Pooled StDev = 1.070
One-way ANOVA: Q. Is the bank prepared to outsource some of its functions and manage them
externally so that it can concentrate its resources on more valuable areas? versus K-means
Clustering groups
Source DF SS MS F P
K-means Clustering 1 9.38 9.38 7.86 0.010
Error 22 26.25 1.19
Total 23 35.63
S = 1.092 R-Sq = 26.32% R-Sq(adj) = 22.97%
Individual 95% CIs For Mean Based on
Pooled StDev
Level N Mean StDev -+---------+---------+---------+--------
Group 1 12 3.250 0.866 (--------*---------)
Group 2 12 2.000 1.279 (---------*--------)
-+---------+---------+---------+--------
1.40 2.10 2.80 3.50
Pooled StDev = 1.092
One-way ANOVA: Q. How committed are you, personally, to e-learning? Are you ready? versus K-
means Clustering groups
Source DF SS MS F P
K-means Clustering 1 2.67 2.67 2.01 0.170
Error 22 29.17 1.33
Total 23 31.83
S = 1.151 R-Sq = 8.38% R-Sq(adj) = 4.21%
Individual 95% CIs For Mean Based on
Pooled StDev
Level N Mean StDev -------+---------+---------+---------+--
Group 1 12 3.917 0.996 (----------*-----------)

173
Group 2 12 3.250 1.288 (----------*-----------)
-------+---------+---------+---------+--
3.00 3.60 4.20 4.80
Pooled StDev = 1.151
Appendix B – 10: Binary Logistic Regression on Bank Categories (UEL vs. NEL) Link Function: Logit
Response Information
Variable Value Count
Currently Using e-learning 2 5 (Event)
1 20
Total 25
Logistic Regression Table
Odds 95% CI
Predictor Coef SE Coef Z P Ratio Lower Upper
Constant -3.86547 4.80525 -0.80 0.421
Innovators 0.182773 1.78924 0.10 0.919 1.20 0.04 40.03
Early Adopters 0.808249 2.24627 0.36 0.719 2.24 0.03 183.27
Early Majority 1.07622 1.98059 0.54 0.587 2.93 0.06 142.34
Late Majority 0.604397 1.64053 0.37 0.713 1.83 0.07 45.60
Laggards -1.82334 1.53591 -1.19 0.235 0.16 0.01 3.28
Log-Likelihood = -10.745
Test that all slopes are zero: G = 3.530, DF = 5, P-Value = 0.619
Goodness-of-Fit Tests
Method Chi-Square DF P
Pearson 28.8650 17 0.036
Deviance 21.4902 17 0.205
Hosmer-Lemeshow 8.9749 8 0.344
Table of Observed and Expected Frequencies:
(See Hosmer-Lemeshow Test for the Pearson Chi-Square Statistic)
Group
Value 1 2 3 4 5 6 7 8 9 10 Total
2
Obs 0 1 0 0 0 0 0 2 1 1 5
Exp 0.0 0.2 0.1 0.4 0.2 0.4 0.5 1.0 0.8 1.3
1
Obs 2 2 2 4 2 2 2 1 1 2 20
Exp 2.0 2.8 1.9 3.6 1.8 1.6 1.5 2.0 1.2 1.7
Total 2 3 2 4 2 2 2 3 2 3 25
Measures of Association:
(Between the Response Variable and Predicted Probabilities)
Pairs Number Percent Summary Measures

174
Concordant 75 75.0 Somers' D 0.50
Discordant 25 25.0 Goodman-Kruskal Gamma 0.50
Ties 0 0.0 Kendall's Tau-a 0.17
Total 100 100.0
Appendix B – 11: Kruskal-Wallis Test Kruskal-Wallis Test on Total Number of Employees (2004
K-means
Clustering
groups N Median Ave Rank Z
Group 1 12 415.5 14.3 1.27
Group 2 12 300.5 10.7 -1.27
Overall 24 12.5
H = 1.61 DF = 1 P = 0.204
H = 1.61 DF = 1 P = 0.204 (adjusted for ties)
Kruskal-Wallis Test on Net Profit Before Tax (2005)
K-means
Clustering
groups N Median Ave Rank Z
Group 1 12 742760 14.6 1.44
Group 2 12 180521 10.4 -1.44
Overall 24 12.5
H = 2.08 DF = 1 P = 0.149
H = 2.08 DF = 1 P = 0.149 (adjusted for ties)
Kruskal-Wallis Test on Net Profit Before Tax (2005)
Currently
Using
e-learning N Median Ave Rank Z
1 20 180521 11.9 -1.56
2 5 882713 17.6 1.56
Overall 25 13.0
H = 2.44 DF = 1 P = 0.118
H = 2.44 DF = 1 P = 0.118 (adjusted for ties)
Kruskal-Wallis Test on Total Number of Employees (2004
Currently
Using
e-learning N Median Ave Rank Z
1 20 300.5 11.5 -2.11
2 5 1036.0 19.2 2.11
Overall 25 13.0
H = 4.44 DF = 1 P = 0.035
H = 4.44 DF = 1 P = 0.035 (adjusted for ties)

175
Appendix B – 12: Descriptive Statistics and Histograms on each question of the survey
Q. Bank’s management is passionate with trying new IT Technologies. Descriptive Statistics: Currently
Using Total
Variable e-learning Count N N* Mean SE Mean StDev Variance Minimum
Q2.5 1 20 20 0 3.400 0.234 1.046 1.095 1.000
2 5 5 0 4.000 0.447 1.000 1.000 3.000
Currently
Using
Variable e-learning Median Maximum
Q2.5 1 3.000 5.000
2 4.000 5.000
Q2.5
Frequency
654321
9
8
7
6
5
4
3
2
1
0
654321
1 2 1
4
StDev 1
N 5
Mean 3.4
StDev 1.046
N 20
2
Mean
Histogram (with Normal Curve) of Q2.5 by Currently Using e-learning
Panel variable: Currently Using e-learning
Q. Bank’s management is innovative and eager to be the first to adopt new IT
technologies. Currently
Using Total
Variable e-learning Count N N* Mean SE Mean StDev Variance Minimum
Q2.6 1 20 20 0 3.450 0.256 1.146 1.313 1.000
2 5 5 0 4.000 0.548 1.225 1.500 2.000
Currently
Using
Variable e-learning Median Maximum
Q2.6 1 4.000 5.000
2 4.000 5.000

176
Q2.6
Frequency
654321
9
8
7
6
5
4
3
2
1
0
654321
1 2 1
4
StDev 1.225
N 5
Mean 3.45
StDev 1.146
N 20
2
Mean
Histogram (with Normal Curve) of Q2.6 by Currently Using e-learning
Panel variable: Currently Using e-learning
Q. Bank’s management actively seeks out new IT innovations. Currently
Using Total
Variable e-learning Count N N* Mean SE Mean StDev Variance Minimum
Q2.7 1 20 20 0 3.900 0.204 0.912 0.832 2.000
2 5 5 0 4.200 0.374 0.837 0.700 3.000
Currently
Using
Variable e-learning Median Maximum
Q2.7 1 4.000 5.000
2 4.000 5.000
Q2.7
Frequency
65432
9
8
7
6
5
4
3
2
1
0
65432
1 2 1
4.2
StDev 0.8367
N 5
Mean 3.9
StDev 0.9119
N 20
2
Mean
Histogram (with Normal Curve) of Q2.7 by Currently Using e-learning
Panel variable: Currently Using e-learning

177
Q. Bank’s management often uses other banks’ experience of innovative uses of IT
technology to gain more information and to make decisions. Currently
Using Total
Variable e-learning Count N N* Mean SE Mean StDev Variance Minimum
Q2.4 1 20 20 0 3.250 0.270 1.209 1.461 1.000
2 5 5 0 3.400 0.678 1.517 2.300 1.000
Currently
Using
Variable e-learning Median Maximum
Q2.4 1 3.000 5.000
2 4.000 5.000
Q2.4
Frequency
76543210
7
6
5
4
3
2
1
0
76543210
1 2 1
3.4
StDev 1.517
N 5
Mean 3.25
StDev 1.209
N 20
2
Mean
Histogram (with Normal Curve) of Q2.4 by Currently Using e-learning
Panel variable: Currently Using e-learning
Q. Bank’s management often adopts new IT innovations and influences other banks
to do so as well. Currently
Using Total
Variable e-learning Count N N* Mean SE Mean StDev Variance Minimum
Q2.8 1 20 20 0 3.400 0.266 1.188 1.411 1.000
2 5 5 0 4.000 0.447 1.000 1.000 3.000
Currently
Using
Variable e-learning Median Maximum
Q2.8 1 4.000 5.000
2 4.000 5.000

178
Q2.8
Frequency
654321
9
8
7
6
5
4
3
2
1
0
654321
1 2 1
4
StDev 1
N 5
Mean 3.4
StDev 1.188
N 20
2
Mean
Histogram (with Normal Curve) of Q2.8 by Currently Using e-learning
Panel variable: Currently Using e-learning
Q. Bank’s management is willing to adopt new IT technology but is not willing to be
a leader in the change process among other banks. Currently
Using Total
Variable e-learning Count N N* Mean SE Mean StDev Variance Minimum
Q2.3 1 20 20 0 2.150 0.233 1.040 1.082 1.000
2 5 5 0 2.400 0.678 1.517 2.300 1.000
Currently
Using
Variable e-learning Median Maximum
Q2.3 1 2.000 4.000
2 2.000 5.000
Q2.3
Frequency
6543210-1
9
8
7
6
5
4
3
2
1
0
6543210-1
1 2 1
2.4
StDev 1.517
N 5
Mean 2.15
StDev 1.040
N 20
2
Mean
Histogram (with Normal Curve) of Q2.3 by Currently Using e-learning
Panel variable: Currently Using e-learning

179
Q. Bank’s management is willing to follow the lead of other banks in adopting new
IT innovations. Currently
Using Total
Variable e-learning Count N N* Mean SE Mean StDev Variance Minimum
Q2.9 1 20 20 0 3.900 0.228 1.021 1.042 1.000
2 5 5 0 4.000 0.316 0.707 0.500 3.000
Currently
Using
Variable e-learning Median Maximum
Q2.9 1 4.000 5.000
2 4.000 5.000
Q2.9
Frequency
654321
9
8
7
6
5
4
3
2
1
0
654321
1 2 1
4
StDev 0.7071
N 5
Mean 3.9
StDev 1.021
N 20
2
Mean
Histogram (with Normal Curve) of Q2.9 by Currently Using e-learning
Panel variable: Currently Using e-learning
Q. Bank’s management is generally willing to adopt new IT technology but does not
attempt to influence other banks to do so. Currently
Using Total
Variable e-learning Count N N* Mean SE Mean StDev Variance Minimum
Q2.10 1 20 20 0 3.150 0.274 1.226 1.503 1.000
2 5 5 0 3.200 0.490 1.095 1.200 2.000
Currently
Using
Variable e-learning Median Maximum
Q2.10 1 3.000 5.000
2 3.000 5.000

180
Q2.10
Frequency
654321
7
6
5
4
3
2
1
0
654321
1 2 1
3.2
StDev 1.095
N 5
Mean 3.15
StDev 1.226
N 20
2
Mean
Histogram (with Normal Curve) of Q2.10 by Currently Using e-learning
Panel variable: Currently Using e-learning
Q. Bank’s management is generally cautious about introducing new IT technology
in the bank. Currently
Using Total
Variable e-learning Count N N* Mean SE Mean StDev Variance Minimum
Q2.2 1 20 20 0 2.800 0.304 1.361 1.853 1.000
2 5 5 0 2.600 0.510 1.140 1.300 1.000
Currently
Using
Variable e-learning Median Maximum
Q2.2 1 3.000 5.000
2 3.000 4.000

181
Q2.2
Frequency
6543210
6
5
4
3
2
1
0
6543210
1 2 1
2.6
StDev 1.140
N 5
Mean 2.8
StDev 1.361
N 20
2
Mean
Histogram (with Normal Curve) of Q2.2 by Currently Using e-learning
Panel variable: Currently Using e-learning
Q. Bank’s management is generally convinced of the advantage of using IT
technology based on successful use by other banks. Currently
Using Total
Variable e-learning Count N N* Mean SE Mean StDev Variance Minimum
Q2.11 1 20 20 0 3.850 0.196 0.875 0.766 1.000
2 5 5 0 4.200 0.490 1.095 1.200 3.000
Currently
Using
Variable e-learning Median Maximum
Q2.11 1 4.000 5.000
2 5.000 5.000

182
Q2.11
Frequency
654321
14
12
10
8
6
4
2
0
654321
1 2 1
4.2
StDev 1.095
N 5
Mean 3.85
StDev 0.8751
N 20
2
Mean
Histogram (with Normal Curve) of Q2.11 by Currently Using e-learning
Panel variable: Currently Using e-learning
Q. Bank’s management typically show resistance towards adoption of new IT
technology or training program until they are sure that it will be successful. Currently
Using Total
Variable e-learning Count N N* Mean SE Mean StDev Variance Minimum
Q2.1 1 20 20 0 2.600 0.320 1.429 2.042 1.000
2 5 5 0 1.400 0.400 0.894 0.800 1.000
Currently
Using
Variable e-learning Median Maximum
Q2.1 1 3.000 5.000
2 1.000 3.000

183
Q2.1
Frequency
6543210
7
6
5
4
3
2
1
0
6543210
1 2 1
1.4
StDev 0.8944
N 5
Mean 2.6
StDev 1.429
N 20
2
Mean
Histogram (with Normal Curve) of Q2.1 by Currently Using e-learning
Panel variable: Currently Using e-learning
Q. The management in the bank is suspicious of using new IT technologies. Currently
Using Total
Variable e-learning Count N N* Mean SE Mean StDev Variance Minimum
Q2.12 1 20 20 0 1.700 0.179 0.801 0.642 1.000
2 5 5 0 1.600 0.400 0.894 0.800 1.000
Currently
Using
Variable e-learning Median Maximum
Q2.12 1 2.000 4.000
2 1.000 3.000
Q2.12
Frequency
43210
10
8
6
4
2
0
43210
1 2 1
1.6
StDev 0.8944
N 5
Mean 1.7
StDev 0.8013
N 20
2
Mean
Histogram (with Normal Curve) of Q2.12 by Currently Using e-learning
Panel variable: Currently Using e-learning

184
Q. Bank’s management is generally resistant to change. Currently
Using Total
Variable e-learning Count N N* Mean SE Mean StDev Variance Minimum
Q2.13 1 20 20 0 2.050 0.266 1.191 1.418 1.000
2 5 5 0 1.400 0.400 0.894 0.800 1.000
Currently
Using
Variable e-learning Median Maximum
Q2.13 1 2.000 5.000
2 1.000 3.000
Q2.13
Frequency
543210
9
8
7
6
5
4
3
2
1
0
543210
1 2 1
1.4
StDev 0.8944
N 5
Mean 2.05
StDev 1.191
N 20
2
Mean
Histogram (with Normal Curve) of Q2.13 by Currently Using e-learning
Panel variable: Currently Using e-learning
Q. E-learning is more effective when compared to other forms of education/training
in addressing the regulatory compliance issues of anti-money laundering. Currently
Using Total
Variable e-learning Count N N* Mean SE Mean StDev Variance Minimum
Q3.1 1 20 20 0 3.550 0.223 0.999 0.997 2.000
2 5 5 0 3.600 0.510 1.140 1.300 2.000
Currently
Using
Variable e-learning Median Maximum
Q3.1 1 4.000 5.000
2 4.000 5.000

185
Q3.1
Frequency
654321
9
8
7
6
5
4
3
2
1
0
654321
1 2 1
3.6
StDev 1.140
N 5
Mean 3.55
StDev 0.9987
N 20
2
Mean
Histogram (with Normal Curve) of Q3.1 by Currently Using e-learning
Panel variable: Currently Using e-learning
Q. E-learning for anti-money laundering training improves the quality of training
when compared with traditional training methods. Currently
Using Total
Variable e-learning Count N N* Mean SE Mean StDev Variance Minimum
Q3.2 1 20 20 0 3.450 0.235 1.050 1.103 2.000
2 5 5 0 3.600 0.510 1.140 1.300 2.000
Currently
Using
Variable e-learning Median Maximum
Q3.2 1 4.000 5.000
2 4.000 5.000

186
Q3.2
Frequency
654321
9
8
7
6
5
4
3
2
1
0
654321
1 2 1
3.6
StDev 1.140
N 5
Mean 3.45
StDev 1.050
N 20
2
Mean
Histogram (with Normal Curve) of Q3.2 by Currently Using e-learning
Panel variable: Currently Using e-learning
Q. E-learning for anti-money laundering training is more convenient than the
traditional training methods because of 24x7 availability. Currently
Using Total
Variable e-learning Count N N* Mean SE Mean StDev Variance Minimum
Q3.3 1 20 20 0 3.700 0.231 1.031 1.063 2.000
2 5 5 0 4.400 0.245 0.548 0.300 4.000
Currently
Using
Variable e-learning Median Maximum
Q3.3 1 4.000 5.000
2 4.000 5.000

187
Q3.3
Frequency
65432
8
7
6
5
4
3
2
1
0
65432
1 2 1
4.4
StDev 0.5477
N 5
Mean 3.7
StDev 1.031
N 20
2
Mean
Histogram (with Normal Curve) of Q3.3 by Currently Using e-learning
Panel variable: Currently Using e-learning
Q. E-learning for anti-money laundering training is cheaper than traditional
training/education. Currently
Using Total
Variable e-learning Count N N* Mean SE Mean StDev Variance Minimum
Q3.4 1 20 20 0 3.750 0.176 0.786 0.618 2.000
2 5 5 0 4.400 0.400 0.894 0.800 3.000
Currently
Using
Variable e-learning Median Maximum
Q3.4 1 4.000 5.000
2 5.000 5.000

188
Q3.4
Frequency
65432
10
8
6
4
2
0
65432
1 2 1
4.4
StDev 0.8944
N 5
Mean 3.75
StDev 0.7864
N 20
2
Mean
Histogram (with Normal Curve) of Q3.4 by Currently Using e-learning
Panel variable: Currently Using e-learning
Q. E-learning for anti-money laundering is better received by Bank’s employees
than the traditional training/education. Currently
Using Total
Variable e-learning Count N N* Mean SE Mean StDev Variance Minimum
Q3.5 1 20 20 0 3.350 0.209 0.933 0.871 2.000
2 5 5 0 3.200 0.200 0.447 0.200 3.000
Currently
Using
Variable e-learning Median Maximum
Q3.5 1 3.000 5.000
2 3.000 4.000
Q3.5
Frequency
5432
10
8
6
4
2
0
5432
1 2 1
3.2
StDev 0.4472
N 5
Mean 3.35
StDev 0.9333
N 20
2
Mean
Histogram (with Normal Curve) of Q3.5 by Currently Using e-learning
Panel variable: Currently Using e-learning

189
Q. Using e-learning for anti money laundering training is consistent with the bank’s
existing values. Currently
Using Total
Variable e-learning Count N N* Mean SE Mean StDev Variance Minimum
Q4.1 1 20 20 0 3.800 0.186 0.834 0.695 2.000
2 5 5 0 4.000 0.316 0.707 0.500 3.000
Currently
Using
Variable e-learning Median Maximum
Q4.1 1 4.000 5.000
2 4.000 5.000
Q4.1
Frequency
5432
10
8
6
4
2
0
5432
1 2 1
4
StDev 0.7071
N 5
Mean 3.8
StDev 0.8335
N 20
2
Mean
Histogram (with Normal Curve) of Q4.1 by Currently Using e-learning
Panel variable: Currently Using e-learning
Q. Using e-learning for anti-money laundering training satisfies bank’s current
training needs. Currently
Using Total
Variable e-learning Count N N* Mean SE Mean StDev Variance Minimum
Q4.2 1 20 20 0 3.600 0.245 1.095 1.200 1.000
2 5 5 0 3.800 0.374 0.837 0.700 3.000
Currently
Using
Variable e-learning Median Maximum
Q4.2 1 4.000 5.000
2 4.000 5.000

190
Q4.2
Frequency
654321
9
8
7
6
5
4
3
2
1
0
654321
1 2 1
3.8
StDev 0.8367
N 5
Mean 3.6
StDev 1.095
N 20
2
Mean
Histogram (with Normal Curve) of Q4.2 by Currently Using e-learning
Panel variable: Currently Using e-learning
Q. Using e-learning for anti-money laundering training is consistent with bank’s
past experiences with use of Information Technology. Currently
Using Total
Variable e-learning Count N N* Mean SE Mean StDev Variance Minimum
Q4.3 1 20 20 0 3.550 0.256 1.146 1.313 1.000
2 5 5 0 4.000 0.447 1.000 1.000 3.000
Currently
Using
Variable e-learning Median Maximum
Q4.3 1 4.000 5.000
2 4.000 5.000

191
Q4.3
Frequency
654321
9
8
7
6
5
4
3
2
1
0
654321
1 2 1
4
StDev 1
N 5
Mean 3.55
StDev 1.146
N 20
2
Mean
Histogram (with Normal Curve) of Q4.3 by Currently Using e-learning
Panel variable: Currently Using e-learning
Q. Using e-learning for anti-money laundering training will fill specific needs of
employees who need training on anti-money laundering compliance. Currently
Using Total
Variable e-learning Count N N* Mean SE Mean StDev Variance Minimum
Q4.4 1 20 20 0 3.850 0.196 0.875 0.766 2.000
2 5 5 0 4.600 0.245 0.548 0.300 4.000
Currently
Using
Variable e-learning Median Maximum
Q4.4 1 4.000 5.000
2 5.000 5.000

192
Q4.4
Frequency
5432
9
8
7
6
5
4
3
2
1
0
5432
1 2 1
4.6
StDev 0.5477
N 5
Mean 3.85
StDev 0.8751
N 20
2
Mean
Histogram (with Normal Curve) of Q4.4 by Currently Using e-learning
Panel variable: Currently Using e-learning
Q. Using e-learning for anti-money laundering training fits well with the existing
work practices of bank’s employees. Currently
Using Total
Variable e-learning Count N N* Mean SE Mean StDev Variance Minimum
Q4.5 1 20 20 0 3.550 0.235 1.050 1.103 2.000
2 5 5 0 4.400 0.245 0.548 0.300 4.000
Currently
Using
Variable e-learning Median Maximum
Q4.5 1 4.000 5.000
2 4.000 5.000
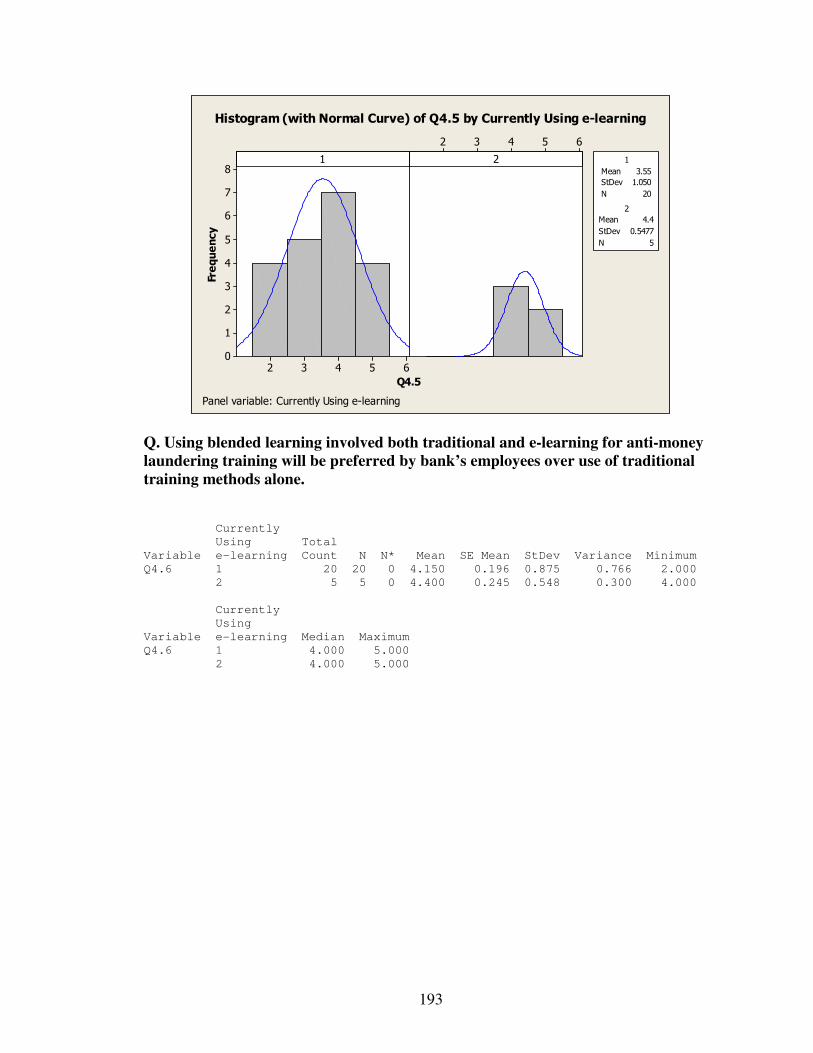
193
Q4.5
Frequency
65432
8
7
6
5
4
3
2
1
0
65432
1 2 1
4.4
StDev 0.5477
N 5
Mean 3.55
StDev 1.050
N 20
2
Mean
Histogram (with Normal Curve) of Q4.5 by Currently Using e-learning
Panel variable: Currently Using e-learning
Q. Using blended learning involved both traditional and e-learning for anti-money
laundering training will be preferred by bank’s employees over use of traditional
training methods alone. Currently
Using Total
Variable e-learning Count N N* Mean SE Mean StDev Variance Minimum
Q4.6 1 20 20 0 4.150 0.196 0.875 0.766 2.000
2 5 5 0 4.400 0.245 0.548 0.300 4.000
Currently
Using
Variable e-learning Median Maximum
Q4.6 1 4.000 5.000
2 4.000 5.000

194
Q4.6
Frequency
65432
9
8
7
6
5
4
3
2
1
0
65432
1 2 1
4.4
StDev 0.5477
N 5
Mean 4.15
StDev 0.8751
N 20
2
Mean
Histogram (with Normal Curve) of Q4.6 by Currently Using e-learning
Panel variable: Currently Using e-learning
Q. Implementing e-learning to accomplish anti-money laundering compliance
training is easy. Currently
Using Total
Variable e-learning Count N N* Mean SE Mean StDev Variance Minimum
Q5.1 1 20 20 0 3.300 0.231 1.031 1.063 1.000
2 5 5 0 4.600 0.245 0.548 0.300 4.000
Currently
Using
Variable e-learning Median Maximum
Q5.1 1 3.000 5.000
2 5.000 5.000

195
Q5.1
Frequency
54321
8
7
6
5
4
3
2
1
0
54321
1 2 1
4.6
StDev 0.5477
N 5
Mean 3.3
StDev 1.031
N 20
2
Mean
Histogram (with Normal Curve) of Q5.1 by Currently Using e-learning
Panel variable: Currently Using e-learning
Q. Using e-learning makes it easier for the bank to fulfill the anti-money laundering
training compliance. Currently
Using Total
Variable e-learning Count N N* Mean SE Mean StDev Variance Minimum
Q5.2 1 20 20 0 3.750 0.160 0.716 0.513 3.000
2 5 5 0 4.200 0.374 0.837 0.700 3.000
Currently
Using
Variable e-learning Median Maximum
Q5.2 1 4.000 5.000
2 4.000 5.000
Q5.2
Frequency
6543
12
10
8
6
4
2
0
6543
1 2 1
4.2
StDev 0.8367
N 5
Mean 3.75
StDev 0.7164
N 20
2
Mean
Histogram (with Normal Curve) of Q5.2 by Currently Using e-learning
Panel variable: Currently Using e-learning

196
Q. It fairly clear how e-learning can be used to conduct anti-money laundering
training. Currently
Using Total
Variable e-learning Count N N* Mean SE Mean StDev Variance Minimum
Q5.3 1 20 20 0 3.800 0.172 0.768 0.589 2.000
2 5 5 0 4.200 0.374 0.837 0.700 3.000
Currently
Using
Variable e-learning Median Maximum
Q5.3 1 4.000 5.000
2 4.000 5.000
Q5.3
Frequency
65432
12
10
8
6
4
2
0
65432
1 2 1
4.2
StDev 0.8367
N 5
Mean 3.8
StDev 0.7678
N 20
2
Mean
Histogram (with Normal Curve) of Q5.3 by Currently Using e-learning
Panel variable: Currently Using e-learning
Q. It is easy for bank employees to learn how to use e-learning for anti money
laundering training and compliance. Currently
Using Total
Variable e-learning Count N N* Mean SE Mean StDev Variance Minimum
Q5.4 1 20 20 0 3.400 0.197 0.883 0.779 2.000
2 5 5 0 4.400 0.400 0.894 0.800 3.000
Currently
Using
Variable e-learning Median Maximum
Q5.4 1 3.000 5.000
2 5.000 5.000

197
Q5.4
Frequency
65432
9
8
7
6
5
4
3
2
1
0
65432
1 2 1
4.4
StDev 0.8944
N 5
Mean 3.4
StDev 0.8826
N 20
2
Mean
Histogram (with Normal Curve) of Q5.4 by Currently Using e-learning
Panel variable: Currently Using e-learning
Q. It is easy for the bank to try various e-learning applications for anti-money
laundering training before making a commitment to buying or implementing. Currently
Using Total
Variable e-learning Count N N* Mean SE Mean StDev Variance Minimum
Q6.1 1 20 20 0 3.500 0.224 1.000 1.000 1.000
2 5 5 0 3.600 0.510 1.140 1.300 2.000
Currently
Using
Variable e-learning Median Maximum
Q6.1 1 4.000 5.000
2 4.000 5.000
Q6.1
Frequency
654321
10
8
6
4
2
0
654321
1 2 1
3.6
StDev 1.140
N 5
Mean 3.5
StDev 1
N 20
2
Mean
Histogram (with Normal Curve) of Q6.1 by Currently Using e-learning
Panel variable: Currently Using e-learning

198
Q. The bank employees find it easy to use e-learning for anti-money laundering
training. Currently
Using Total
Variable e-learning Count N N* Mean SE Mean StDev Variance Minimum
Q6.2 1 20 20 0 3.350 0.167 0.745 0.555 2.000
2 5 5 0 4.200 0.374 0.837 0.700 3.000
Currently
Using
Variable e-learning Median Maximum
Q6.2 1 3.000 5.000
2 4.000 5.000
Q6.2
Frequency
65432
12
10
8
6
4
2
0
65432
1 2 1
4.2
StDev 0.8367
N 5
Mean 3.35
StDev 0.7452
N 20
2
Mean
Histogram (with Normal Curve) of Q6.2 by Currently Using e-learning
Panel variable: Currently Using e-learning
Q6.3) Rolling out a training program based on e-learning takes very little time. Currently
Using Total
Variable e-learning Count N N* Mean SE Mean StDev Variance Minimum
Q6.3 1 20 20 0 3.250 0.204 0.910 0.829 2.000
2 5 5 0 3.000 0.316 0.707 0.500 2.000
Currently
Using
Variable e-learning Median Maximum
Q6.3 1 3.000 5.000
2 3.000 4.000

199
Q6.3
Frequency
5432
9
8
7
6
5
4
3
2
1
0
5432
1 2 1
3
StDev 0.7071
N 5
Mean 3.25
StDev 0.9105
N 20
2
Mean
Histogram (with Normal Curve) of Q6.3 by Currently Using e-learning
Panel variable: Currently Using e-learning
Q. Bank’s management has learned new ways of using e-learning for anti-money
laundering training from competitive banks. Currently
Using Total
Variable e-learning Count N N* Mean SE Mean StDev Variance Minimum
Q7.1 1 20 20 0 3.100 0.191 0.852 0.726 2.000
2 5 5 0 2.600 0.510 1.140 1.300 1.000
Currently
Using
Variable e-learning Median Maximum
Q7.1 1 3.000 5.000
2 3.000 4.000
Q7.1
Frequency
543210
12
10
8
6
4
2
0
543210
1 2 1
2.6
StDev 1.140
N 5
Mean 3.1
StDev 0.8522
N 20
2
Mean
Histogram (with Normal Curve) of Q7.1 by Currently Using e-learning
Panel variable: Currently Using e-learning

200
Q. Bank’s management believes that using e-learning for anti-money laundering
training may increase its social prestige. Currently
Using Total
Variable e-learning Count N N* Mean SE Mean StDev Variance Minimum
Q7.2 1 20 20 0 3.350 0.244 1.089 1.187 1.000
2 5 5 0 2.800 0.490 1.095 1.200 1.000
Currently
Using
Variable e-learning Median Maximum
Q7.2 1 3.500 5.000
2 3.000 4.000
Q7.2
Frequency
54321
9
8
7
6
5
4
3
2
1
0
54321
1 2 1
2.8
StDev 1.095
N 5
Mean 3.35
StDev 1.089
N 20
2
Mean
Histogram (with Normal Curve) of Q7.2 by Currently Using e-learning
Panel variable: Currently Using e-learning
Q. Employing e-learning for anti-money laundering training will improve an
employee’s or a manager’s image within the bank. Currently
Using Total
Variable e-learning Count N N* Mean SE Mean StDev Variance Minimum
Q7.3 1 20 20 0 3.500 0.224 1.000 1.000 1.000
2 5 5 0 2.600 0.510 1.140 1.300 1.000
Currently
Using
Variable e-learning Median Maximum
Q7.3 1 4.000 5.000
2 3.000 4.000

201
Q7.3
Frequency
543210
10
8
6
4
2
0
543210
1 2 1
2.6
StDev 1.140
N 5
Mean 3.5
StDev 1
N 20
2
Mean
Histogram (with Normal Curve) of Q7.3 by Currently Using e-learning
Panel variable: Currently Using e-learning
Q. People who use e-learning for anti-money laundering training have a high profile
in the bank. Currently
Using Total
Variable e-learning Count N N* Mean SE Mean StDev Variance Minimum
Q7.4 1 20 20 0 3.150 0.233 1.040 1.082 1.000
2 5 5 0 3.000 0.548 1.225 1.500 1.000
Currently
Using
Variable e-learning Median Maximum
Q7.4 1 3.000 5.000
2 3.000 4.000
Q7.4
Frequency
54321
9
8
7
6
5
4
3
2
1
0
54321
1 2 1
3
StDev 1.225
N 5
Mean 3.15
StDev 1.040
N 20
2
Mean
Histogram (with Normal Curve) of Q7.4 by Currently Using e-learning
Panel variable: Currently Using e-learning

202
Q. The use of e-learning for anti-money laundering is visible to everyone in the bank. Currently
Using Total
Variable e-learning Count N N* Mean SE Mean StDev Variance Minimum
Q7.5 1 20 20 0 3.400 0.234 1.046 1.095 1.000
2 5 5 0 4.000 0.316 0.707 0.500 3.000
Currently
Using
Variable e-learning Median Maximum
Q7.5 1 4.000 5.000
2 4.000 5.000
Q7.5
Frequency
54321
9
8
7
6
5
4
3
2
1
0
54321
1 2 1
4
StDev 0.7071
N 5
Mean 3.4
StDev 1.046
N 20
2
Mean
Histogram (with Normal Curve) of Q7.5 by Currently Using e-learning
Panel variable: Currently Using e-learning
Q. The use of e-learning for anti-money laundering is visible to others outside the
bank. Currently
Using Total
Variable e-learning Count N N* Mean SE Mean StDev Variance Minimum
Q7.6 1 20 20 0 2.850 0.264 1.182 1.397 1.000
2 5 5 0 3.400 0.510 1.140 1.300 2.000
Currently
Using
Variable e-learning Median Maximum
Q7.6 1 3.000 4.000
2 3.000 5.000

203
Q7.6
Frequency
6543210
9
8
7
6
5
4
3
2
1
0
6543210
1 2 1
3.4
StDev 1.140
N 5
Mean 2.85
StDev 1.182
N 20
2
Mean
Histogram (with Normal Curve) of Q7.6 by Currently Using e-learning
Panel variable: Currently Using e-learning
Q. Our bank requires us to report any suspicious client activities to the regulatory
authority immediately? Currently
Using Total
Variable e-learning Count N N* Mean SE Mean StDev
Q11.1 1 20 20 0 4.750 0.123 0.550
2 5 5 0 5.0000 0.000000000 0.000000000
Currently
Using
Variable e-learning Variance Minimum Median Maximum
Q11.1 1 0.303 3.000 5.000 5.000
2 0.000000000 5.0000 5.0000 5.0000
Q11.1
Frequency
6543
18
16
14
12
10
8
6
4
2
0
6543
1 2 1
*
StDev *
N 5
Mean 4.75
StDev 0.5501
N 20
2
Mean
Histogram (with Normal Curve) of Q11.1 by Currently Using e-learning
Panel variable: Currently Using e-learning

204
Q. Our bank has an employee training program for the prevention of money
laundering. Currently
Using Total
Variable e-learning Count N N* Mean SE Mean StDev Variance Minimum
Q11.4 1 20 20 0 4.550 0.135 0.605 0.366 3.000
2 5 5 0 4.800 0.200 0.447 0.200 4.000
Currently
Using
Variable e-learning Median Maximum
Q11.4 1 5.000 5.000
2 5.000 5.000
Q11.4
Frequency
6543
14
12
10
8
6
4
2
0
6543
1 2 1
4.8
StDev 0.4472
N 5
Mean 4.55
StDev 0.6048
N 20
2
Mean
Histogram (with Normal Curve) of Q11.4 by Currently Using e-learning
Panel variable: Currently Using e-learning
Q. Our bank has a Money Laundering Reporting Officer (or similar role)
responsible for coordinating and monitoring anti-money laundering arrangements. Currently
Using Total
Variable e-learning Count N N* Mean SE Mean StDev
Q11.5 1 20 20 0 4.700 0.128 0.571
2 5 5 0 5.0000 0.000000000 0.000000000
Currently
Using
Variable e-learning Variance Minimum Median Maximum
Q11.5 1 0.326 3.000 5.000 5.000
2 0.000000000 5.0000 5.0000 5.0000

205
Q11.5
Frequency
6543
16
14
12
10
8
6
4
2
0
6543
1 2 1
*
StDev *
N 5
Mean 4.7
StDev 0.5712
N 20
2
Mean
Histogram (with Normal Curve) of Q11.5 by Currently Using e-learning
Panel variable: Currently Using e-learning
Q. Our bank enforces a mandatory anti-money laundering training program for all
management and staff carried out on a regular basis. Currently
Using Total
Variable e-learning Count N N* Mean SE Mean StDev Variance Minimum
Q11.6 1 20 20 0 4.450 0.153 0.686 0.471 3.000
2 5 5 0 4.800 0.200 0.447 0.200 4.000
Currently
Using
Variable e-learning Median Maximum
Q11.6 1 5.000 5.000
2 5.000 5.000
Q11.6
Frequency
6543
12
10
8
6
4
2
0
6543
1 2 1
4.8
StDev 0.4472
N 5
Mean 4.45
StDev 0.6863
N 20
2
Mean
Histogram (with Normal Curve) of Q11.6 by Currently Using e-learning
Panel variable: Currently Using e-learning

206
Q. Our bank has an established process to periodically test the adequacy of AML
procedures and policies. Currently
Using Total
Variable e-learning Count N N* Mean SE Mean StDev Variance Minimum
Q11.7 1 20 20 0 4.400 0.169 0.754 0.568 3.000
2 5 5 0 4.800 0.200 0.447 0.200 4.000
Currently
Using
Variable e-learning Median Maximum
Q11.7 1 5.000 5.000
2 5.000 5.000
Q11.7
Frequency
6543
12
10
8
6
4
2
0
6543
1 2 1
4.8
StDev 0.4472
N 5
Mean 4.4
StDev 0.7539
N 20
2
Mean
Histogram (with Normal Curve) of Q11.7 by Currently Using e-learning
Panel variable: Currently Using e-learning
Q. Our bank monitors and reports suspicious transactions in accordance with
applicable regulations. Currently
Using Total
Variable e-learning Count N N* Mean SE Mean StDev Variance Minimum
Q11.8 1 20 20 0 4.700 0.105 0.470 0.221 4.000
2 5 5 0 4.800 0.200 0.447 0.200 4.000
Currently
Using
Variable e-learning Median Maximum
Q11.8 1 5.000 5.000
2 5.000 5.000

207
Q11.8
Frequency
54
18
16
14
12
10
8
6
4
2
0
54
1 2 1
4.8
StDev 0.4472
N 5
Mean 4.7
StDev 0.4702
N 20
2
Mean
Histogram (with Normal Curve) of Q11.8 by Currently Using e-learning
Panel variable: Currently Using e-learning
Q. Our bank monitors transactions and accounts in the name of suspected terrorists
and/or terrorist organizations and reports them to the competent authorities. Currently
Using Total
Variable e-learning Count N N* Mean SE Mean StDev Variance Minimum
Q11.9 1 20 20 0 4.7500 0.0993 0.4443 0.1974 4.0000
2 5 5 0 4.800 0.200 0.447 0.200 4.000
Currently
Using
Variable e-learning Median Maximum
Q11.9 1 5.0000 5.0000
2 5.000 5.000
Q11.9
Frequency
54
20
15
10
5
0
54
1 2 1
4.8
StDev 0.4472
N 5
Mean 4.75
StDev 0.4443
N 20
2
Mean
Histogram (with Normal Curve) of Q11.9 by Currently Using e-learning
Panel variable: Currently Using e-learning

208
Q. Our bank has implemented an independent testing program that is designed to
assess our bank’s compliance with international anti-money laundering and anti-
terrorist financing policies and procedures and relevant laws regulations. Currently
Using Total
Variable e-learning Count N N* Mean SE Mean StDev Variance Minimum
Q11.10 1 20 20 0 4.150 0.233 1.040 1.082 1.000
2 5 5 0 4.800 0.200 0.447 0.200 4.000
Currently
Using
Variable e-learning Median Maximum
Q11.10 1 4.000 5.000
2 5.000 5.000
Q11.10
Frequency
654321
9
8
7
6
5
4
3
2
1
0
654321
1 2 1
4.8
StDev 0.4472
N 5
Mean 4.15
StDev 1.040
N 20
2
Mean
Histogram (with Normal Curve) of Q11.10 by Currently Using e-learning
Panel variable: Currently Using e-learning
Q. Our bank’s board and senior management consider AML to be a high priority
and do they actively demonstrate their commitment to the bank’s AML effort. Currently
Using Total
Variable e-learning Count N N* Mean SE Mean StDev
Q11.11 1 20 20 0 4.700 0.105 0.470
2 5 5 0 5.0000 0.000000000 0.000000000
Currently
Using
Variable e-learning Variance Minimum Median Maximum
Q11.11 1 0.221 4.000 5.000 5.000
2 0.000000000 5.0000 5.0000 5.0000

209
Q11.11
Frequency
54
18
16
14
12
10
8
6
4
2
0
54
1 2 1
*
StDev *
N 5
Mean 4.7
StDev 0.4702
N 20
2
Mean
Histogram (with Normal Curve) of Q11.11 by Currently Using e-learning
Panel variable: Currently Using e-learning
Q. Our bank is confident that our suspicious activity report (SAR) processes are
appropriate for the scale of internal and external reporting that are now in place. Currently
Using Total
Variable e-learning Count N N* Mean SE Mean StDev Variance Minimum
Q11.12 1 20 20 0 4.600 0.169 0.754 0.568 3.000
2 5 5 0 4.800 0.200 0.447 0.200 4.000
Currently
Using
Variable e-learning Median Maximum
Q11.12 1 5.000 5.000
2 5.000 5.000
Q11.12
Frequency
6543
16
14
12
10
8
6
4
2
0
6543
1 2 1
4.8
StDev 0.4472
N 5
Mean 4.6
StDev 0.7539
N 20
2
Mean
Histogram (with Normal Curve) of Q11.12 by Currently Using e-learning
Panel variable: Currently Using e-learning

210
Q. The bank regularly assesses the quality, impact, and effectiveness of AML
training for staff. Currently
Using Total
Variable e-learning Count N N* Mean SE Mean StDev Variance Minimum
Q11.13 1 20 20 0 4.500 0.154 0.688 0.474 3.000
2 5 5 0 4.800 0.200 0.447 0.200 4.000
Currently
Using
Variable e-learning Median Maximum
Q11.13 1 5.000 5.000
2 5.000 5.000
Q11.13
Frequency
6543
12
10
8
6
4
2
0
6543
1 2 1
4.8
StDev 0.4472
N 5
Mean 4.5
StDev 0.6882
N 20
2
Mean
Histogram (with Normal Curve) of Q11.13 by Currently Using e-learning
Panel variable: Currently Using e-learning
Q. All of our staff is trained in anti-money laundering compliance. Currently
Using Total
Variable e-learning Count N N* Mean SE Mean StDev Variance Minimum
Q11.14 1 20 20 0 4.050 0.170 0.759 0.576 2.000
2 5 5 0 4.800 0.200 0.447 0.200 4.000
Currently
Using
Variable e-learning Median Maximum
Q11.14 1 4.000 5.000
2 5.000 5.000

211
Q11.14
Frequency
5432
12
10
8
6
4
2
0
5432
1 2 1
4.8
StDev 0.4472
N 5
Mean 4.05
StDev 0.7592
N 20
2
Mean
Histogram (with Normal Curve) of Q11.14 by Currently Using e-learning
Panel variable: Currently Using e-learning
Q. Our bank provides tailored training for specific groups in the bank (as opposed,
to generic information for all). Currently
Using Total
Variable e-learning Count N N* Mean SE Mean StDev Variance Minimum
Q11.15 1 20 20 0 3.650 0.293 1.309 1.713 1.000
2 5 5 0 4.600 0.245 0.548 0.300 4.000
Currently
Using
Variable e-learning Median Maximum
Q11.15 1 4.000 5.000
2 5.000 5.000
Q11.15
Frequency
654321
10
8
6
4
2
0
654321
1 2 1
4.6
StDev 0.5477
N 5
Mean 3.65
StDev 1.309
N 20
2
Mean
Histogram (with Normal Curve) of Q11.15 by Currently Using e-learning
Panel variable: Currently Using e-learning

212
Q. Our bank’s senior management has undertaken the AML training alongside
other staff members. Currently
Using Total
Variable e-learning Count N N* Mean SE Mean StDev Variance Minimum
Q11.16 1 20 20 0 4.200 0.200 0.894 0.800 2.000
2 5 5 0 4.400 0.400 0.894 0.800 3.000
Currently
Using
Variable e-learning Median Maximum
Q11.16 1 4.000 5.000
2 5.000 5.000
Q11.16
Frequency
65432
10
8
6
4
2
0
65432
1 2 1
4.4
StDev 0.8944
N 5
Mean 4.2
StDev 0.8944
N 20
2
Mean
Histogram (with Normal Curve) of Q11.16 by Currently Using e-learning
Panel variable: Currently Using e-learning
Q. Our bank periodically updates the content of its AML training. Currently
Using Total
Variable e-learning Count N N* Mean SE Mean StDev Variance Minimum
Q11.17 1 20 20 0 4.000 0.251 1.124 1.263 2.000
2 5 5 0 4.400 0.245 0.548 0.300 4.000
Currently
Using
Variable e-learning Median Maximum
Q11.17 1 4.000 5.000
2 4.000 5.000

213
Q11.17
Frequency
65432
9
8
7
6
5
4
3
2
1
0
65432
1 2 1
4.4
StDev 0.5477
N 5
Mean 4
StDev 1.124
N 20
2
Mean
Histogram (with Normal Curve) of Q11.17 by Currently Using e-learning
Panel variable: Currently Using e-learning
Q. Senior management pressure is one of the key reasons for adoption of new IT
innovations in our bank. Currently
Using Total
Variable e-learning Count N N* Mean SE Mean StDev Variance Minimum
Q8.1 1 20 20 0 3.550 0.246 1.099 1.208 1.000
2 5 5 0 4.000 0.316 0.707 0.500 3.000
Currently
Using
Variable e-learning Median Maximum
Q8.1 1 4.000 5.000
2 4.000 5.000
Q8.1
Frequency
654321
12
10
8
6
4
2
0
654321
1 2 1
4
StDev 0.7071
N 5
Mean 3.55
StDev 1.099
N 20
2
Mean
Histogram (with Normal Curve) of Q8.1 by Currently Using e-learning
Panel variable: Currently Using e-learning

214
Q. Top Management has a positive attitude towards using information technology in
general and use of e-learning in specific. Currently
Using Total
Variable e-learning Count N N* Mean SE Mean StDev Variance Minimum
Q8.2 1 20 20 0 4.150 0.167 0.745 0.555 3.000
2 5 5 0 4.600 0.245 0.548 0.300 4.000
Currently
Using
Variable e-learning Median Maximum
Q8.2 1 4.000 5.000
2 5.000 5.000
Q8.2
Frequency
543
12
10
8
6
4
2
0
543
1 2 1
4.6
StDev 0.5477
N 5
Mean 4.15
StDev 0.7452
N 20
2
Mean
Histogram (with Normal Curve) of Q8.2 by Currently Using e-learning
Panel variable: Currently Using e-learning
Q. Top and mid level management thinks positively toward information technology interventions in daily/routine tasks. Currently
Using Total
Variable e-learning Count N N* Mean SE Mean StDev Variance Minimum
Q8.3 1 20 20 0 4.400 0.152 0.681 0.463 3.000
2 5 5 0 4.600 0.245 0.548 0.300 4.000
Currently
Using
Variable e-learning Median Maximum
Q8.3 1 4.500 5.000
2 5.000 5.000

215
Q8.3
Frequency
6543
12
10
8
6
4
2
0
6543
1 2 1
4.6
StDev 0.5477
N 5
Mean 4.4
StDev 0.6806
N 20
2
Mean
Histogram (with Normal Curve) of Q8.3 by Currently Using e-learning
Panel variable: Currently Using e-learning
Q. Top management in the bank actively participates in establishing a vision and formulating strategies for utilizing information technology systems. Currently
Using Total
Variable e-learning Count N N* Mean SE Mean StDev Variance Minimum
Q8.4 1 20 20 0 4.350 0.167 0.745 0.555 3.000
2 5 5 0 4.400 0.400 0.894 0.800 3.000
Currently
Using
Variable e-learning Median Maximum
Q8.4 1 4.500 5.000
2 5.000 5.000
Q8.4
Frequency
6543
12
10
8
6
4
2
0
6543
1 2 1
4.4
StDev 0.8944
N 5
Mean 4.35
StDev 0.7452
N 20
2
Mean
Histogram (with Normal Curve) of Q8.4 by Currently Using e-learning
Panel variable: Currently Using e-learning

216
Q. My immediate supervisor encourages me to learn about and/or apply new IT technologies. Currently
Using Total
Variable e-learning Count N N* Mean SE Mean StDev Variance Minimum
Q8.5 1 20 20 0 4.150 0.196 0.875 0.766 3.000
2 5 5 0 4.400 0.400 0.894 0.800 3.000
Currently
Using
Variable e-learning Median Maximum
Q8.5 1 4.000 5.000
2 5.000 5.000
Q8.5
Frequency
6543
9
8
7
6
5
4
3
2
1
0
6543
1 2 1
4.4
StDev 0.8944
N 5
Mean 4.15
StDev 0.8751
N 20
2
Mean
Histogram (with Normal Curve) of Q8.5 by Currently Using e-learning
Panel variable: Currently Using e-learning
Q. There is a well-placed champion who facilitates the acceptance and implementation of information technology initiatives (e.g., introduction of e-learning for anti-money laundry training) in the bank. Currently
Using Total
Variable e-learning Count N N* Mean SE Mean StDev Variance Minimum
Q8.6 1 20 20 0 3.750 0.176 0.786 0.618 2.000
2 5 5 0 4.200 0.374 0.837 0.700 3.000
Currently
Using
Variable e-learning Median Maximum
Q8.6 1 4.000 5.000
2 4.000 5.000

217
Q8.6
Frequency
65432
10
8
6
4
2
0
65432
1 2 1
4.2
StDev 0.8367
N 5
Mean 3.75
StDev 0.7864
N 20
2
Mean
Histogram (with Normal Curve) of Q8.6 by Currently Using e-learning
Panel variable: Currently Using e-learning
Q. Top management in the bank typically assigns project champions (focal point) for overseeing the utilization of information technology in the bank. Currently
Using Total
Variable e-learning Count N N* Mean SE Mean StDev Variance Minimum
Q8.7 1 20 20 0 3.900 0.161 0.718 0.516 2.000
2 5 5 0 4.400 0.400 0.894 0.800 3.000
Currently
Using
Variable e-learning Median Maximum
Q8.7 1 4.000 5.000
2 5.000 5.000
Q8.7
Frequency
65432
14
12
10
8
6
4
2
0
65432
1 2 1
4.4
StDev 0.8944
N 5
Mean 3.9
StDev 0.7182
N 20
2
Mean
Histogram (with Normal Curve) of Q8.7 by Currently Using e-learning
Panel variable: Currently Using e-learning

218
Q. The bank’s training needs and delivery solutions (including those for e-learning) are centrally planned. Currently
Using Total
Variable e-learning Count N N* Mean SE Mean StDev Variance Minimum
Q8.8 1 20 20 0 4.100 0.161 0.718 0.516 3.000
2 5 5 0 4.400 0.245 0.548 0.300 4.000
Currently
Using
Variable e-learning Median Maximum
Q8.8 1 4.000 5.000
2 4.000 5.000
Q8.8
Frequency
543
12
10
8
6
4
2
0
543
1 2 1
4.4
StDev 0.5477
N 5
Mean 4.1
StDev 0.7182
N 20
2
Mean
Histogram (with Normal Curve) of Q8.8 by Currently Using e-learning
Panel variable: Currently Using e-learning
Q. The anti-money laundering compliance officer (or equivalent role) has the authority to chose and select different training modalities for anti-money laundering. Currently
Using Total
Variable e-learning Count N N* Mean SE Mean StDev Variance Minimum
Q8.9 1 20 20 0 3.700 0.164 0.733 0.537 2.000
2 5 5 0 4.200 0.374 0.837 0.700 3.000
Currently
Using
Variable e-learning Median Maximum
Q8.9 1 4.000 5.000
2 4.000 5.000

219
Q8.9
Frequency
65432
12
10
8
6
4
2
0
65432
1 2 1
4.2
StDev 0.8367
N 5
Mean 3.7
StDev 0.7327
N 20
2
Mean
Histogram (with Normal Curve) of Q8.9 by Currently Using e-learning
Panel variable: Currently Using e-learning
Q. Our bank has a long bureaucratic process for making decisions about adoption
of a technological intervention such as the use of e-learning for anti-money
laundering training. Currently
Using Total
Variable e-learning Count N N* Mean SE Mean StDev Variance Minimum
Q8.10 1 20 20 0 2.550 0.256 1.146 1.313 1.000
2 5 5 0 2.200 0.583 1.304 1.700 1.000
Currently
Using
Variable e-learning Median Maximum
Q8.10 1 2.500 5.000
2 2.000 4.000

220
Q8.10
Frequency
543210
7
6
5
4
3
2
1
0
543210
1 2 1
2.2
StDev 1.304
N 5
Mean 2.55
StDev 1.146
N 20
2
Mean
Histogram (with Normal Curve) of Q8.10 by Currently Using e-learning
Panel variable: Currently Using e-learning
Q. Our bank has a culture and tradition of using information technology whenever
appropriate. Currently
Using Total
Variable e-learning Count N N* Mean SE Mean StDev Variance Minimum
Q8.11 1 20 20 0 3.900 0.228 1.021 1.042 2.000
2 5 5 0 4.200 0.374 0.837 0.700 3.000
Currently
Using
Variable e-learning Median Maximum
Q8.11 1 4.000 5.000
2 4.000 5.000
Q8.11
Frequency
65432
8
7
6
5
4
3
2
1
0
65432
1 2 1
4.2
StDev 0.8367
N 5
Mean 3.9
StDev 1.021
N 20
2
Mean
Histogram (with Normal Curve) of Q8.11 by Currently Using e-learning
Panel variable: Currently Using e-learning

221
Q. Our bank feels that it will be left behind if it does not adopt technologies such as
e-learning. Currently
Using Total
Variable e-learning Count N N* Mean SE Mean StDev Variance Minimum
Q8.12 1 20 20 0 3.500 0.256 1.147 1.316 1.000
2 5 5 0 4.000 0.447 1.000 1.000 3.000
Currently
Using
Variable e-learning Median Maximum
Q8.12 1 3.000 5.000
2 4.000 5.000
Q8.12
Frequency
654321
9
8
7
6
5
4
3
2
1
0
654321
1 2 1
4
StDev 1
N 5
Mean 3.5
StDev 1.147
N 20
2
Mean
Histogram (with Normal Curve) of Q8.12 by Currently Using e-learning
Panel variable: Currently Using e-learning
Q. Our employees typically have the free time to attend workshops and other
traditional training events. Currently
Using Total
Variable e-learning Count N N* Mean SE Mean StDev Variance Minimum
Q8.13 1 20 20 0 3.200 0.287 1.281 1.642 1.000
2 5 5 0 3.000 0.548 1.225 1.500 2.000
Currently
Using
Variable e-learning Median Maximum
Q8.13 1 3.000 5.000
2 3.000 5.000

222
Q8.13
Frequency
654321
7
6
5
4
3
2
1
0
654321
1 2 1
3
StDev 1.225
N 5
Mean 3.2
StDev 1.281
N 20
2
Mean
Histogram (with Normal Curve) of Q8.13 by Currently Using e-learning
Panel variable: Currently Using e-learning
Q. Our bank has enough resource to invest in a long-term e-learning platform to
handle the anti-money laundering compliance training. Currently
Using Total
Variable e-learning Count N N* Mean SE Mean StDev Variance Minimum
Q8.14 1 20 20 0 3.900 0.191 0.852 0.726 3.000
2 5 5 0 4.600 0.245 0.548 0.300 4.000
Currently
Using
Variable e-learning Median Maximum
Q8.14 1 4.000 5.000
2 5.000 5.000

223
Q8.14
Frequency
5432
9
8
7
6
5
4
3
2
1
0
5432
1 2 1
4.6
StDev 0.5477
N 5
Mean 3.9
StDev 0.8522
N 20
2
Mean
Histogram (with Normal Curve) of Q8.14 by Currently Using e-learning
Panel variable: Currently Using e-learning
Q. There is pressure from our industry to use technology to address anti-money
laundering compliance. Currently
Using Total
Variable e-learning Count N N* Mean SE Mean StDev Variance Minimum
Q9.1 1 20 20 0 3.650 0.167 0.745 0.555 2.000
2 5 5 0 3.800 0.374 0.837 0.700 3.000
Currently
Using
Variable e-learning Median Maximum
Q9.1 1 4.000 5.000
2 4.000 5.000
Q9.1
Frequency
5432
12
10
8
6
4
2
0
5432
1 2 1
3.8
StDev 0.8367
N 5
Mean 3.65
StDev 0.7452
N 20
2
Mean
Histogram (with Normal Curve) of Q9.1 by Currently Using e-learning
Panel variable: Currently Using e-learning

224
Q. I feel pressured by my colleagues and peers to be effective in using IT technology
in establishing anti-money laundering compliance in the bank. Currently
Using Total
Variable e-learning Count N N* Mean SE Mean StDev Variance Minimum
Q9.2 1 20 20 0 3.350 0.221 0.988 0.976 1.000
2 5 5 0 3.200 0.200 0.447 0.200 3.000
Currently
Using
Variable e-learning Median Maximum
Q9.2 1 4.000 4.000
2 3.000 4.000
Q9.2
Frequency
54321
12
10
8
6
4
2
0
54321
1 2 1
3.2
StDev 0.4472
N 5
Mean 3.35
StDev 0.9881
N 20
2
Mean
Histogram (with Normal Curve) of Q9.2 by Currently Using e-learning
Panel variable: Currently Using e-learning
Q. Not using e-Learning for anti-money laundering training may have an impact on
our bank’s competitive edge. Currently
Using Total
Variable e-learning Count N N* Mean SE Mean StDev Variance Minimum
Q9.3 1 20 20 0 3.600 0.184 0.821 0.674 2.000
2 5 5 0 4.000 0.316 0.707 0.500 3.000
Currently
Using
Variable e-learning Median Maximum
Q9.3 1 4.000 5.000
2 4.000 5.000

225
Q9.3
Frequency
5432
14
12
10
8
6
4
2
0
5432
1 2 1
4
StDev 0.7071
N 5
Mean 3.6
StDev 0.8208
N 20
2
Mean
Histogram (with Normal Curve) of Q9.3 by Currently Using e-learning
Panel variable: Currently Using e-learning
Q. The bank is under pressure from the government and the international
compliance agencies to implement anti-money laundering training efficiently and in
a timely manner. Currently
Using Total
Variable e-learning Count N N* Mean SE Mean StDev Variance Minimum
Q9.4 1 20 20 0 4.300 0.164 0.733 0.537 3.000
2 5 5 0 3.800 0.800 1.789 3.200 1.000
Currently
Using
Variable e-learning Median Maximum
Q9.4 1 4.000 5.000
2 5.000 5.000

226
Q9.4
Frequency
86420
12
10
8
6
4
2
0
86420
1 2 1
3.8
StDev 1.789
N 5
Mean 4.3
StDev 0.7327
N 20
2
Mean
Histogram (with Normal Curve) of Q9.4 by Currently Using e-learning
Panel variable: Currently Using e-learning
Q. How well is the bank using (Internet and Intranet) technology to run its business? Currently
Using Total
Variable e-learning Count N N* Mean SE Mean StDev Variance
Q 10.2 1 20 20 0 3.050 0.359 1.605 2.576
2 5 5 0 4.200 0.374 0.837 0.700
Currently
Using
Variable e-learning Minimum Median Maximum
Q 10.2 1 0.000000000 3.000 5.000
2 3.000 4.000 5.000
Q 10.2
Frequency
6543210
5
4
3
2
1
0
6543210
1 2 1
4.2
StDev 0.8367
N 5
Mean 3.05
StDev 1.605
N 20
2
Mean
Histogram (with Normal Curve) of Q 10.2 by Currently Using e-learning
Panel variable: Currently Using e-learning

227
Q. How prepared (skills, knowledge, motivation) is your workforce to compete and
win in the high-tech, new economy? Currently
Using Total
Variable e-learning Count N N* Mean SE Mean StDev Variance
Q 10.3 1 20 20 0 3.350 0.284 1.268 1.608
2 5 5 0 3.800 0.374 0.837 0.700
Currently
Using
Variable e-learning Minimum Median Maximum
Q 10.3 1 0.000000000 4.000 5.000
2 3.000 4.000 5.000
Q 10.3
Frequency
6543210
10
8
6
4
2
0
6543210
1 2 1
3.8
StDev 0.8367
N 5
Mean 3.35
StDev 1.268
N 20
2
Mean
Histogram (with Normal Curve) of Q 10.3 by Currently Using e-learning
Panel variable: Currently Using e-learning
Q. How the bank does define “e-learning?” Currently
Using Total
Variable e-learning Count N N* Mean SE Mean StDev Variance Minimum
Q 10.4 1 20 20 0 3.050 0.185 0.826 0.682 1.000
2 5 5 0 4.200 0.200 0.447 0.200 4.000
Currently
Using
Variable e-learning Median Maximum
Q 10.4 1 3.000 4.000
2 4.000 5.000

228
Q 10.4
Frequency
54321
10
8
6
4
2
0
54321
1 2 1
4.2
StDev 0.4472
N 5
Mean 3.05
StDev 0.8256
N 20
2
Mean
Histogram (with Normal Curve) of Q 10.4 by Currently Using e-learning
Panel variable: Currently Using e-learning
Q. How will the bank overcomes any bad prior experiences you and others have had
with technology based learning? Currently
Using Total
Variable e-learning Count N N* Mean SE Mean StDev Variance
Q 10.5 1 20 20 0 2.900 0.280 1.252 1.568
2 5 5 0 4.400 0.245 0.548 0.300
Currently
Using
Variable e-learning Minimum Median Maximum
Q 10.5 1 0.000000000 3.000 5.000
2 4.000 4.000 5.000
Q 10.5
Frequency
543210
7
6
5
4
3
2
1
0
543210
1 2 1
4.4
StDev 0.5477
N 5
Mean 2.9
StDev 1.252
N 20
2
Mean
Histogram (with Normal Curve) of Q 10.5 by Currently Using e-learning
Panel variable: Currently Using e-learning

229
Q. How much access do people have to the web (anyone, any time, anywhere)? Currently
Using Total
Variable e-learning Count N N* Mean SE Mean StDev Variance Minimum
Q 10.6 1 20 20 0 3.050 0.170 0.759 0.576 2.000
2 5 5 0 4.000 0.548 1.225 1.500 2.000
Currently
Using
Variable e-learning Median Maximum
Q 10.6 1 3.000 4.000
2 4.000 5.000
Q 10.6
Frequency
65432
12
10
8
6
4
2
0
65432
1 2 1
4
StDev 1.225
N 5
Mean 3.05
StDev 0.7592
N 20
2
Mean
Histogram (with Normal Curve) of Q 10.6 by Currently Using e-learning
Panel variable: Currently Using e-learning
Q. Do you differentiate between instructional needs (training) and informational
needs (knowledge management), and do you make the right decisions about when to
use each? Currently
Using Total
Variable e-learning Count N N* Mean SE Mean StDev Variance Minimum
Q 10.7 1 20 20 0 3.200 0.225 1.005 1.011 2.000
2 5 5 0 4.000 0.316 0.707 0.500 3.000
Currently
Using
Variable e-learning Median Maximum
Q 10.7 1 3.500 5.000
2 4.000 5.000

230
Q 10.7
Frequency
54321
9
8
7
6
5
4
3
2
1
0
54321
1 2 1
4
StDev 0.7071
N 5
Mean 3.2
StDev 1.005
N 20
2
Mean
Histogram (with Normal Curve) of Q 10.7 by Currently Using e-learning
Panel variable: Currently Using e-learning
Q. What is the level of the bank’s expertise in instructional and information design? Currently
Using Total
Variable e-learning Count N N* Mean SE Mean StDev Variance Minimum
Q 10.8 1 20 20 0 3.000 0.145 0.649 0.421 2.000
2 5 5 0 4.200 0.200 0.447 0.200 4.000
Currently
Using
Variable e-learning Median Maximum
Q 10.8 1 3.000 4.000
2 4.000 5.000
Q 10.8
Frequency
5432
12
10
8
6
4
2
0
5432
1 2 1
4.2
StDev 0.4472
N 5
Mean 3
StDev 0.6489
N 20
2
Mean
Histogram (with Normal Curve) of Q 10.8 by Currently Using e-learning
Panel variable: Currently Using e-learning

231
Q. Is the bank ready to move beyond a predominant reliance on classroom training
to a more balanced approach with e-learning? Currently
Using Total
Variable e-learning Count N N* Mean SE Mean StDev Variance
Q 10.9 1 20 20 0 2.700 0.300 1.342 1.800
2 5 5 0 4.000 0.447 1.000 1.000
Currently
Using
Variable e-learning Minimum Median Maximum
Q 10.9 1 0.000000000 3.000 4.000
2 3.000 4.000 5.000
Q 10.9
Frequency
6543210
7
6
5
4
3
2
1
0
6543210
1 2 1
4
StDev 1
N 5
Mean 2.7
StDev 1.342
N 20
2
Mean
Histogram (with Normal Curve) of Q 10.9 by Currently Using e-learning
Panel variable: Currently Using e-learning
Q10.10) Does senior management support e-learning? Currently
Using Total
Variable e-learning Count N N* Mean SE Mean StDev Variance Minimum
Q 10.10 1 20 20 0 3.350 0.196 0.875 0.766 1.000
2 5 5 0 4.800 0.200 0.447 0.200 4.000
Currently
Using
Variable e-learning Median Maximum
Q 10.10 1 4.000 4.000
2 5.000 5.000

232
Q 10.10
Frequency
54321
12
10
8
6
4
2
0
54321
1 2 1
4.8
StDev 0.4472
N 5
Mean 3.35
StDev 0.8751
N 20
2
Mean
Histogram (with Normal Curve) of Q 10.10 by Currently Using e-learning
Panel variable: Currently Using e-learning
Q. Does the bank have a Change management plan for introducing e-learning? Currently
Using Total
Variable e-learning Count N N* Mean SE Mean StDev Variance
Q 10.11 1 20 20 0 2.850 0.264 1.182 1.397
2 5 5 0 4.000 0.316 0.707 0.500
Currently
Using
Variable e-learning Minimum Median Maximum
Q 10.11 1 0.000000000 3.000 4.000
2 3.000 4.000 5.000
Q 10.11
Frequency
543210
7
6
5
4
3
2
1
0
543210
1 2 1
4
StDev 0.7071
N 5
Mean 2.85
StDev 1.182
N 20
2
Mean
Histogram (with Normal Curve) of Q 10.11 by Currently Using e-learning
Panel variable: Currently Using e-learning

233
Q. Can the bank demonstrate the business benefits of e-learning? Currently
Using Total
Variable e-learning Count N N* Mean SE Mean StDev Variance
Q 10.12 1 20 20 0 2.700 0.231 1.031 1.063
2 5 5 0 3.400 0.600 1.342 1.800
Currently
Using
Variable e-learning Minimum Median Maximum
Q 10.12 1 0.000000000 3.000 4.000
2 2.000 4.000 5.000
Q 10.12
Frequency
6543210
9
8
7
6
5
4
3
2
1
0
6543210
1 2 1
3.4
StDev 1.342
N 5
Mean 2.7
StDev 1.031
N 20
2
Mean
Histogram (with Normal Curve) of Q 10.12 by Currently Using e-learning
Panel variable: Currently Using e-learning
Q. Does the bank have a plan to help the training function reinvent itself for the
digital age? Currently
Using Total
Variable e-learning Count N N* Mean SE Mean StDev Variance
Q 10.13 1 20 20 0 2.600 0.285 1.273 1.621
2 5 5 0 4.000 0.316 0.707 0.500
Currently
Using
Variable e-learning Minimum Median Maximum
Q 10.13 1 0.000000000 3.000 4.000
2 3.000 4.000 5.000

234
Q 10.13
Frequency
543210
9
8
7
6
5
4
3
2
1
0
543210
1 2 1
4
StDev 0.7071
N 5
Mean 2.6
StDev 1.273
N 20
2
Mean
Histogram (with Normal Curve) of Q 10.13 by Currently Using e-learning
Panel variable: Currently Using e-learning
Q. What is the climate in the bank to learning in alternative locations, especially the
work site? Currently
Using Total
Variable e-learning Count N N* Mean SE Mean StDev Variance Minimum
Q 10.14 1 20 20 0 2.850 0.196 0.875 0.766 1.000
2 5 5 0 4.200 0.374 0.837 0.700 3.000
Currently
Using
Variable e-learning Median Maximum
Q 10.14 1 3.000 4.000
2 4.000 5.000
Q 10.14
Frequency
654321
9
8
7
6
5
4
3
2
1
0
654321
1 2 1
4.2
StDev 0.8367
N 5
Mean 2.85
StDev 0.8751
N 20
2
Mean
Histogram (with Normal Curve) of Q 10.14 by Currently Using e-learning
Panel variable: Currently Using e-learning

235
Q. Is the bank willing to allow e-learning to thrive, perhaps at the expense of some
of the more traditional parts of the training
organization? Currently
Using Total
Variable e-learning Count N N* Mean SE Mean StDev Variance Minimum
Q 10.15 1 20 20 0 2.850 0.221 0.988 0.976 1.000
2 5 5 0 4.200 0.374 0.837 0.700 3.000
Currently
Using
Variable e-learning Median Maximum
Q 10.15 1 3.000 4.000
2 4.000 5.000
Q 10.15
Frequency
654321
9
8
7
6
5
4
3
2
1
0
654321
1 2 1
4.2
StDev 0.8367
N 5
Mean 2.85
StDev 0.9881
N 20
2
Mean
Histogram (with Normal Curve) of Q 10.15 by Currently Using e-learning
Panel variable: Currently Using e-learning
Q. How prepared is the bank to invest in, and incubate e-learning for several years
in order to get it firmly established? Currently
Using Total
Variable e-learning Count N N* Mean SE Mean StDev Variance
Q 10.16 1 20 20 0 2.550 0.266 1.191 1.418
2 5 5 0 4.000 0.316 0.707 0.500
Currently
Using
Variable e-learning Minimum Median Maximum
Q 10.16 1 0.000000000 3.000 4.000
2 3.000 4.000 5.000

236
Q 10.16
Frequency
543210
7
6
5
4
3
2
1
0
543210
1 2 1
4
StDev 0.7071
N 5
Mean 2.55
StDev 1.191
N 20
2
Mean
Histogram (with Normal Curve) of Q 10.16 by Currently Using e-learning
Panel variable: Currently Using e-learning
Q. How prepared is the bank to deal with a large and increasingly complex e-
learning marketplace? Currently
Using Total
Variable e-learning Count N N* Mean SE Mean StDev Variance
Q 10.17 1 20 20 0 2.700 0.272 1.218 1.484
2 5 5 0 3.800 0.374 0.837 0.700
Currently
Using
Variable e-learning Minimum Median Maximum
Q 10.17 1 0.000000000 3.000 4.000
2 3.000 4.000 5.000

237
Q 10.17
Frequency
543210
7
6
5
4
3
2
1
0
543210
1 2 1
3.8
StDev 0.8367
N 5
Mean 2.7
StDev 1.218
N 20
2
Mean
Histogram (with Normal Curve) of Q 10.17 by Currently Using e-learning
Panel variable: Currently Using e-learning
Q. Does the bank have a good handle on what it is buying in the e-learning
marketplace – can it differentiate quality products and weed out redundancies? Currently
Using Total
Variable e-learning Count N N* Mean SE Mean StDev Variance
Q 10.18 1 20 20 0 2.850 0.274 1.226 1.503
2 5 5 0 4.400 0.245 0.548 0.300
Currently
Using
Variable e-learning Minimum Median Maximum
Q 10.18 1 0.000000000 3.000 5.000
2 4.000 4.000 5.000
Q 10.18
Frequency
543210
7
6
5
4
3
2
1
0
543210
1 2 1
4.4
StDev 0.5477
N 5
Mean 2.85
StDev 1.226
N 20
2
Mean
Histogram (with Normal Curve) of Q 10.18 by Currently Using e-learning
Panel variable: Currently Using e-learning

238
Q. Is the bank prepared to outsource its training functions and manage them
externally so that it can concentrate its resources on more valuable areas? Currently
Using Total
Variable e-learning Count N N* Mean SE Mean StDev Variance
Q 10.19 1 20 20 0 2.550 0.256 1.146 1.313
2 5 5 0 3.000 0.707 1.581 2.500
Currently
Using
Variable e-learning Minimum Median Maximum
Q 10.19 1 0.000000000 3.000 4.000
2 1.000 3.000 5.000
Q 10.19
Frequency
6543210
9
8
7
6
5
4
3
2
1
0
6543210
1 2 1
3
StDev 1.581
N 5
Mean 2.55
StDev 1.146
N 20
2
Mean
Histogram (with Normal Curve) of Q 10.19 by Currently Using e-learning
Panel variable: Currently Using e-learning
Q. How committed are you, personally, to e-learning? Are you ready? Currently
Using Total
Variable e-learning Count N N* Mean SE Mean StDev Variance Minimum
Q 10.20 1 20 20 0 3.400 0.266 1.188 1.411 1.000
2 5 5 0 4.600 0.245 0.548 0.300 4.000
Currently
Using
Variable e-learning Median Maximum
Q 10.20 1 4.000 5.000
2 5.000 5.000

239
Q 10.20
Frequency
654321
9
8
7
6
5
4
3
2
1
0
654321
1 2 1
4.6
StDev 0.5477
N 5
Mean 3.4
StDev 1.188
N 20
2
Mean
Histogram (with Normal Curve) of Q 10.20 by Currently Using e-learning
Panel variable: Currently Using e-learning


