En experimentell studie av provtagning av flytande stål · · 2014-10-29En experimentell studie...
30
D 831 TO45-39 Rapport JK 45016 2010-04-26 (ISSN 0280-249X) En experimentell studie av provtagning av flytande stål Ola Ericsson Nyckelord: Provtagning, flytande stål, slaggskydd, fyllningshastighet, stelningshastighet, provhomogenitet
-
Upload
duongthien -
Category
Documents
-
view
215 -
download
0
Transcript of En experimentell studie av provtagning av flytande stål · · 2014-10-29En experimentell studie...
D 831
TO45-39
Rapport JK 45016 2010-04-26 (ISSN 0280-249X)
En experimentell studie av provtagning av flytande stål
Ola Ericsson
Nyckelord: Provtagning, flytande stål, slaggskydd, fyllningshastighet, stelningshastighet, provhomogenitet

1
Sammanfattning Provtagning av flytande stål är mycket viktig för att kunna kontrollera ståltillverkningsprocessen. Det finns dock ingen gemensam standard för provtagning och dessutom finns en mängd olika provtagare tillgängliga på marknaden. Målet i detta arbete är att undersöka effekt av slaggskydd och provgeometri på provtagningsparametrar och provhomogenitet. Tre olika provgeometrier valdes ut: i ) Björneborg ii) 6 mm tjock Lollipop och iii) 12 mm tjock Lollipop. Dessa provgeometrier har testats med två olika typer av slaggskydd: a) konventionellt slaggskydd med stålhätta och b) argongas. Fyllningshastighet och stelningshastighet har mätts experimentellt under industriella förhållanden. Provhomogenitet med avseende på totalsyre och storleksfördelning av inneslutningar har bestämts i olika zoner av proverna. Studien visar att argonskyddade prover har en lägre och jämnare fyllningshastighet (0.19±0.09 m/s) jämfört med konventionella provtagare (1.28±2.23 m/s). Resultat från mätningar av stelningshastighet visar att 6 mm tjock Lollipop stelnar snabbast (99~105 °C/s). Totalsyrebestämningar visar att argonskyddade prover har låg variation av totalsyre medan konventionella provtagare visar väldigt hög variation. Utvärdering med optisk mikroskopi visar att de höga syrehalterna i konventionella prover troligen orsakas av toppslagg som kontaminerat provet. Dessutom påvisas att prover med mindre volym kontamineras till större grad än prover med större volym. Bestämning av storleksfördelning i argonskyddade prover visar att antalet inneslutningar är större i den övre delen av provet medan mitten och bottenzonen innehåller ungefär lika antal. Nyckelord: provtagning, flytande stål, slaggskydd, fyllningshastighet, stelningshastighet, provhomogenitet.

2
Abstract Sampling of liquid steel to control the steel making process is very important in the steel industry. However, there are numerous types of disposable samplers and no standard for sampling. The goal in this study is to investigate the effect of slag protection type and sample geometry on sampling parameters and sample homogeneity. Three sample geometries were selected: i) Björneborg ii) Lollipop with a 6 mm thickness and iii) Lollipop with a 12 mm thickness. These sample geometries have been tested with two types of slag protection: metal-cap-protection and argon-protection. The filling velocity and solidification rate of steel samples have been experimentally measured during plant trials. The sample homogeneity with respect to total oxygen content and inclusion size distribution has been determined in different parts of the samples. The study shows that argon-protected samplers have lower, more even, filling velocities (0.19±0.09 m/s) compared to metal-cap-protected samplers (1.28±2.23 m/s). The solidification rate measurements of the different samplers show that the 6 mm thick Lollipop has the highest solidification rate (99~105 °C/s). Measurements of total oxygen content in argon-protected samples showed little variation between different zones of the samples. However, metal-cap-protected samples contained much higher total oxygen contents. Light optical microscope studies showed that the increase in total oxygen content was probably caused by entrapment of top slag during sampling. Furthermore, it was found that the contamination of top slag in the metal samples increased with a decreased sample weight. Determination of inclusion size distribution in argon-protected Lollipop samples showed that a larger number of primary inclusions are found in the top part compared to the middle and the bottom part of the samples. Keywords: liquid steel sampling, slag protection, filling velocity, solidification rate, sample homogeneity.

3
An Experimental Study of Liquid Steel Sampling En experimentell studie av provtagning av flytande stål Ola Ericsson Detta arbete är en del av JK45016 Innestyr Fas 1 inom Strategiskt Stålforskningsprogram för Sverige 2007-2012 finansierat av VINNOVA och Jernkontoret. Framlades som Licentiatavhandling den 15:e juni 2009 vid Kungliga Tekniska Högskolan, Stockholm.

4
1 Introduction During steelmaking it is of utmost importance to control the secondary refining process in order to obtain the most optimum conditions for casting as well as the optimum material properties for each specific application. Specifically, the following main parameters need to be controlled during ladle treatment:
1. Temperature 2. Chemical composition of the steel 3. Level of impurities such as S, H, N 4. Inclusion characteristics
The temperature of the melt can be controlled with disposable temperature probes. The chemical composition, as well as the level of impurities during different periods of the ladle refining and casting, can be monitored by determining the composition of steel samples taken from the liquid steel with disposable samplers. Furthermore, as samples from liquid steel often are used for determination of inclusion characteristics and process development it is very important that they are representative of the melt at the steelmaking temperature1,2. Today, there is no united standard for liquid steel sampling in different countries and companies. In fact, a large variety of sample geometries and sampling procedures are available on the market. Overall, very little fundamental knowledge is presented in the open literature regarding the influence of sampling parameters, such as dipping depth and filling velocity, on the final quality of the steel sample. Instead, adjustments of sampling parameters are based on empirical studies performed at the different steel plants. It is believed that an increased knowledge regarding filling velocity and solidification rate of different samples could be used to improve sampling of liquid steel and lead to steel samples of higher quality. Moreover, the experimentally measured values of filling velocity and solidification rate are very important for development and validation of mathematical models for filling and solidification of different sample shapes3. Recently, Pulse Distribution Analysis (OES-PDA) has been developed for rapid determination of inclusion characteristics in steel samples1-2,4-7. In order for the steelmaking community to implement this technique it is necessary to have a deep understanding of the following two aspects:
• how to design a sampler so that the inclusion population is homogeneously distributed in the sample and
• how to design a sampler so that only the inclusions that exist at steelmaking temperatures, are detected in the OES-PDA analysis.
Different sample geometries will influence the fluid flow of melt during sampling. Depending on the fluid flow, inclusions can be heterogeneously dispersed in different parts of the sample
5
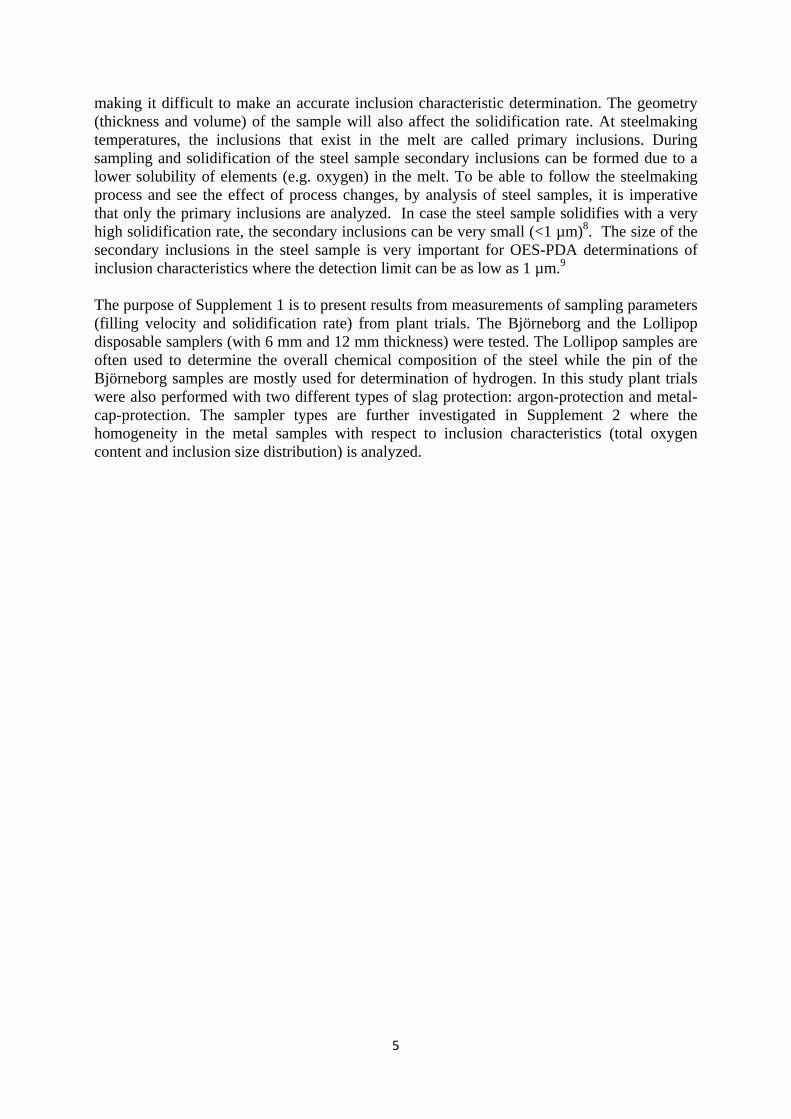
making it difficult to make an accurate inclusion characteristic determination. The geometry (thickness and volume) of the sample will also affect the solidification rate. At steelmaking temperatures, the inclusions that exist in the melt are called primary inclusions. During sampling and solidification of the steel sample secondary inclusions can be formed due to a lower solubility of elements (e.g. oxygen) in the melt. To be able to follow the steelmaking process and see the effect of process changes, by analysis of steel samples, it is imperative that only the primary inclusions are analyzed. In case the steel sample solidifies with a very high solidification rate, the secondary inclusions can be very small (<1 µm)8. The size of the secondary inclusions in the steel sample is very important for OES-PDA determinations of inclusion characteristics where the detection limit can be as low as 1 µm.9
The purpose of Supplement 1 is to present results from measurements of sampling parameters (filling velocity and solidification rate) from plant trials. The Björneborg and the Lollipop disposable samplers (with 6 mm and 12 mm thickness) were tested. The Lollipop samples are often used to determine the overall chemical composition of the steel while the pin of the Björneborg samples are mostly used for determination of hydrogen. In this study plant trials were also performed with two different types of slag protection: argon-protection and metal-cap-protection. The sampler types are further investigated in Supplement 2 where the homogeneity in the metal samples with respect to inclusion characteristics (total oxygen content and inclusion size distribution) is analyzed.

7
2 Experimental Work The plant trials were carried out at Outokumpu Stainless in Avesta. They produce stainless steel with special steels as niche. In this study, samples form three different steel grades denoted with following ASTM standards were investigated: 304L, 316L and S32304. Typical compositions of these steel grades are found in Table 1. Table 1. Typical composition in weight percent of studied steel grades.
C N Cr Ni Mo304L 0.02 - 18.2 10.1 -316L 0.02 - 17.2 10.1 2.1S32304 0.02 0.1 23 4.8 0.3
The analyses of the steel samples were carried out at Sandvik Materials Technology in Sandviken and at IMRAM, Tohoku University in Sendai, Japan.

8
2.1 Sampling procedure of liquid steel In order to keep sampling parameters as constant as possible, an automatic sampling system at the ladle treatment was used. It made it possible to control the argon gas pressure, dipping depth, dipping time and suction rate during sampling. All samples were thereby taken using the same conditions. In this study, two different types of slag protection approaches were used to prevent top slag from entering the sampler during sampling of liquid steel: argon-protection and metal-cap-protection. A schematic sketch of the different slag protection types and samplers are shown in Figure 1.
Figure 1. Schematic sketch of metal-cap-protected (a, c) and argon-protected (b, d)
samplers, and photograph of finished samplers (e). The sampling system at Outokumpu Stainless is normally used with argon-protected samplers, but by disconnecting the argon supply from the sampling lance it functions in the same manner as a metal-cap-protected system. A sketch of the sampling system and sampling location is shown in Figure 2. The sampling lance has two sensors. The first one raises the lance in case the sampler falls off. The other detects the bath level of the molten steel, which makes the lance stop at the desired dipping depth.
Björneborg Lollipop Björneborg
Argon
Argon
Metal cap Metal cap

9
Figure 2. Sketch of sampling of liquid steel during ladle treatment.
The procedure for argon-protected sampling in this study is as follows: first the argon flow (argon pressure 2~3 bar) is started and air is flushed from the lance. Then the lance moves down with a constant velocity of ~0.5 m/s and stop shortly after it has reached the desired dipping depth (0.30~0.45 m). After stopping, the argon flow is shut off and the gas is sucked out (suction pressure ~0.5 bar) from the lance. When the dipping time (~3 s) is reached the lance is raised and returns to the starting position. In case metal-cap-protected samplers were used, the argon supply was disconnected from the lance. All other settings remained the same.
2.2 Measurement of filling velocity and solidification rate in steel samples To measure filling velocity and solidification rate thermocouples (type B) were mounted into standard samplers. The Björneborg, Lollipop with 6 mm thickness (LP-6) and Lollipop with 12 mm thickness (LP-12) samplers were used. The experiments are summarized in Table 2. Table 2. Measurement of filling velocity and solidification rate in the different types of samplers in this study.
LP-6 LP-12 BBMeasurement AP MCP AP MCP AP MCPFilling velocity + + + +Solidification rate + + + + + +AP = argon-protected, MCP = metal-cap-protected, + = MeasuredLP-6 = 6 mm thick Lollipop, LP-12 = 12 mm thick Lollipop, BB = Björneborg
Sampling lance
Top slag Dipping depth 30~45 cm
Disposable sampler
Melt

10
To be able to read the signals from the thermocouples, the sampling lance was modified with an electric connector block. From the connector block copper wires were drawn to the measuring instrument. Depending on the measurement purpose (filling velocity or solidification rate) the thermocouples were placed at different positions in the samplers. Schematic locations of the thermocouples are shown in Figure 3. For velocity measurements (Björneborg and LP-12), two thermocouples were used in each mold. Only one thermocouple in every mold was used to measure the solidification rate. The Lollipop samplers were constructed as double Lollipop samplers, containing one LP-6 mold and one LP-12 mold in each sampler.
Figure 3. Location of thermocouples in the molds and sketch of filled samples. The samplers were manufactured, as much as possible, in the same way as the standard production samplers as to resemble normal sampling conditions. Thermocouple wires of type B (Pt-30%Rh/Pt-6%Rh) with a diameter of 0.35 mm were cut in suitable lengths for connection to an electrical socket. One end of the thermocouple was welded together. The thermocouples were mounted into one of the mold halves. A quartz tube was placed between the two mold halves. Thereafter, it was baked into sand. The sand body was placed into a paper sleeve and on the end of the paper sleeve a fibrous non-splash layer was attached. Metal caps where glued over the inlet for the metal-cap-protected samplers, one small at the Björneborg sampler and one small for each quartz tube in the double Lollipop sampler. A large metal cap covering both inlets where added to the double Lollipop samplers. An illustration of the finished samplers is shown in Figure 1. The measuring instrument was connected to a 50 Hz filter next to the ladle furnace to avoid electrical noise from the power grid. Then, the wires from the modified sampling lance were
Björneborg Lollipop
Björneborg LP-6 LP-12

11
attached to two different channels. When sampling for solidification rate measurement, a temperature measurement (Positherm by Heraeus Electro-Nite10) was made directly before sampling. Otherwise, only one temperature measurement per sampling sequence was done.
2.3 Analysis of total oxygen content in different samples An analysis of the total oxygen content in the different zones of the metal sample provides a rough estimation of the homogeneity of oxidic inclusions. Therefore, the body and the pin part of Björneborg and Lollipop samples were cut into small sections and analyzed with the melt extraction method. Total oxygen determinations were made on samples from a total of three melts of the S32304 steel grade, taken both with argon-protection and metal-cap-protection. See Table 3 for a summary of the studied sample types. Table 3. Total oxygen analysis on samples from plant trials.
LP-6 LP-12 BBAnalysis AP MCP AP MCP AP MCPTotal oxygen content-body + + + + + +-pin + + + + + +-inlet + +AP = argon-protected, MCP = metal-cap-protected, + = MeasuredLP-6 = 6 mm thick Lollipop, LP-12 = 12 mm thick Lollipop, BB = Björneborg A slice was cut from the middle of the sample bodies. The pins of the Björneborg samples were milled to 4 mm diameter to ease cutting. From each position, see Figure 4, a piece of 0.5-1.5 g was taken.
Lollipop
body pin
body pin inlet
Björneborg
0 50 100 150 200 mm

12
Figure 4. Schematic illustration of different sample zones for analysis of total oxygen content in metal. Sample positions for total oxygen determinations are marked by squares.
To remove surface oxides, the surface of the pieces were prepared by filing, cleaning in alcohol in an ultrasonic bath, and drying at a low temperature. Thereafter, the pieces were analyzed with melt extraction method using a Leco TC600 instrument. During the analysis the repeatability was checked with reference standard samples (AR 646) representing a total oxygen content of 31±3 ppm.
2.4 Light Optical Microscope observations of slag particles After cutting pieces for total oxygen analysis one of the metal-cap-protected LP-6 samples was cut in the middle. This resulted in a top and bottom part. The vertical cross- section of the top part was ground, polished and used for observation of slag particles using a Light Optical Microscope.
2.5 Determination of inclusion size distribution Samples for determination of homogeneity of primary inclusions were taken at the end of the ladle treatment for a 316L stainless steel grade. A double Lollipop sampler (one LP-6 and one LP-12) was stored in a drying oven for 24 hours before sampling to minimize the moist content and reoxidation of the melt during sampling. In Table 4 the sample types used for determination of inclusion size distribution are listed. Pieces approximately 12×8×5 mm (l×w×d) were cut from the top, middle and bottom parts of the 6 mm and 12 mm Lollipop samples, as illustrated in Figure 5. Table 4. Sample types for electrolytic extraction.
LP-6 LP-12 BBAnalysis AP MCP AP MCP AP MCPInclusion size distribution< 0.5 µm + +> 0.8 µm + +AP = argon-protected, MCP = metal-cap-protected, + = MeasuredLP-6 = 6 mm thick Lollipop, LP-12 = 12 mm thick Lollipop, BB = Björneborg

13
Figure 5. Schematic illustration of different zones in Lollipop samples for electrolytic
extraction and analysis of inclusion size distribution. The pieces were ground with a fine grinding machine to remove possible oxides and defects on the surface. After grinding, the pieces were put in acetone and cleaned in an ultrasonic bath. A sketch of the equipment used for galvanostatic electrolytic extraction and filtration is shown in Figure 6. The steel contained high amounts of chromium and Ca-Si-Al-Mg-O inclusions. Previous research11 has shown that for these conditions the 10%AA solution is suitable. It consists of 1 w/v% tetramethylammonium chloride, 10 v/v% acetyl acetone and methanol. For extraction of small size inclusions, it was found that 150 Coulombs was suitable. For large size inclusions 600 Coulombs was found to be more appropriate.
middle bottom
LP-6 LP-12
top

14
Figure 6. Sketch of equipment for galvanostatic electrolytic extraction (a) and filtration (b). As some pieces contained shrinkage pores it was decided to cover all surfaces of the samples except the extracted top surface (surface illustrated in Figure 5) for insulation by laboratory film. Each sample was extracted with 50 C (Coulombs), 150 C and 600 C consecutively. A 50 C setting was used to remove any remaining surface defects deriving from the sample preparation. The current during the galvanostatic extraction was 50 mA. At each extraction 0.008~0.012 g (50 C), 0.026~0.035 g (150 C) and 0.104~0.138 g (600 C) of metal was dissolved. After extraction, the solute was filtrated. Polycarbonate film filters with an open pore size of 0.05 µm and 1 µm were used for filtration of small and large size inclusions, respectively. Different settings were used because if a lot of material is dissolved, the film filter with a 0.05 µm pore size was clogged. Thereby, it was impossible to visually separate the inclusions. Before the metallographic study a part of the film filter with inclusions was cut and then pasted onto an aluminum holder with graphite tape. Thereafter, the sample was coated with Pt before the Scanning Electron Microscope (SEM) studies. At first, the homogeneity of inclusion dispersion on film filter was checked visually by comparing the center, middle and outer areas using SEM. The inclusion size distribution was determined with a magnification of x5000 for the 0.05 µm film filter and a magnification of x1000 for the 1 µm film filter. On each film filter 20 views were photographed (divided into two areas of the filter). The inclusions on each view were copied on paper and analyzed with an image analyzer to obtain the equivalent circle diameter of the inclusions (dv), which in this study is referred to as the inclusion size. After analysis, they were separated into classes with a 0.1 µm size interval. A qualitative analysis of inclusion composition was determined with Energy Dispersive Spectroscopy (EDS). Finally, the number of inclusions per volume unit (Nv) was calculated according to Equation 1.
(1)
Platinum cathode (-)
Clamp Anode (+)
Metal sample
Electrolyte
Glass beaker
Film filters
Vacuum pump
Filtrated solute
(a) (b)

15
where n is the number of inclusions in the size interval, is the filter area with inclusions (~1245 mm2), is the total observed area (~0.2 mm2 for x1000 and ~0.01 mm2 for x5000),
is the density of the metal (density for iron was used=0.0078 g/mm3) and is the weight of the dissolved metal during extraction

17
3 Results and Discussion First, the experimentally measured filling velocity and solidification rate during the plant trials will be discussed. Thereafter, the homogeneity with respect to total oxygen and inclusion characteristics in steel samples will be discussed in detail.
3.1 Filling velocity In order to optimize sampling conditions the filling velocity in both argon-protected and metal-cap-protected Lollipop and Björneborg samplers were measured, see Table 2. The thermocouples in both sampler types where placed as shown in Figure 3. Figure 7 shows a typical time-temperature profile during sampling of liquid steel by LP-12 sampler with argon-protection.
Figure 7. Typical time-temperature profile measured in 12 mm thick Lollipop sampler with
argon-protection.
The data from both the lower and upper thermocouples are plotted in the same diagram. By using this data, the experimental filling velocity, , in the pin part of the sampler was determined using Equation 2.
(2)
Time [s]
Tem
pera
ture
[°C
]

18
where is the distance between the two thermocouples and t is the time difference between the response of the lower and upper thermocouple. Table 5 summarizes the measured filling velocities.
Table 5. Experimental values of filling velocity in different samplers. Measurement No. Sample Slag protection Zone of sampler Average velocity [m/s]
1 BB AP Body 0.262 BB AP Body 0.113 BB AP Body 0.124 BB AP Body 0.125 BB AP Mean of pin 0.236 BB AP Mean of pin 0.327 BB AP Mean of pin 0.248 BB AP Bottom of pin 0.299 BB AP Bottom of pin 0.28
10 BB AP Middle of pin 0.4811 BB AP Middle of pin 0.3312 BB AP Top of pin 0.3413 BB AP Top of pin 0.5014 BB AP Top of pin 0.7115 BB MCP Body 0.2416 BB MCP Body 6.0017 BB MCP Body 0.3718 BB MCP Mean of pin 0.5619 BB MCP Bottom of pin 0.3820 BB MCP Bottom of pin 0.1821 BB MCP Bottom of pin 0.5222 LP-12 MCP Body 0.5923 LP-12 MCP Body 0.3924 LP-12 MCP Body 0.0825 LP-12 AP Body 0.1626 LP-12 AP Body 0.2127 LP-12 AP Body 0.35
AP = argon-protected, MCP = metal-cap-protectedLP-12 = 12 mm thick Lollipop, BB = Björneborg The mean values of the filling velocities in the body part of the samplers together with their minimum and maximum values are shown in Figure 8.
19
0
1
2
3
4
5
6
7
BB MCP BB AP LP-12 MCP LP-12 AP
Vel
ocity
[m/s
]
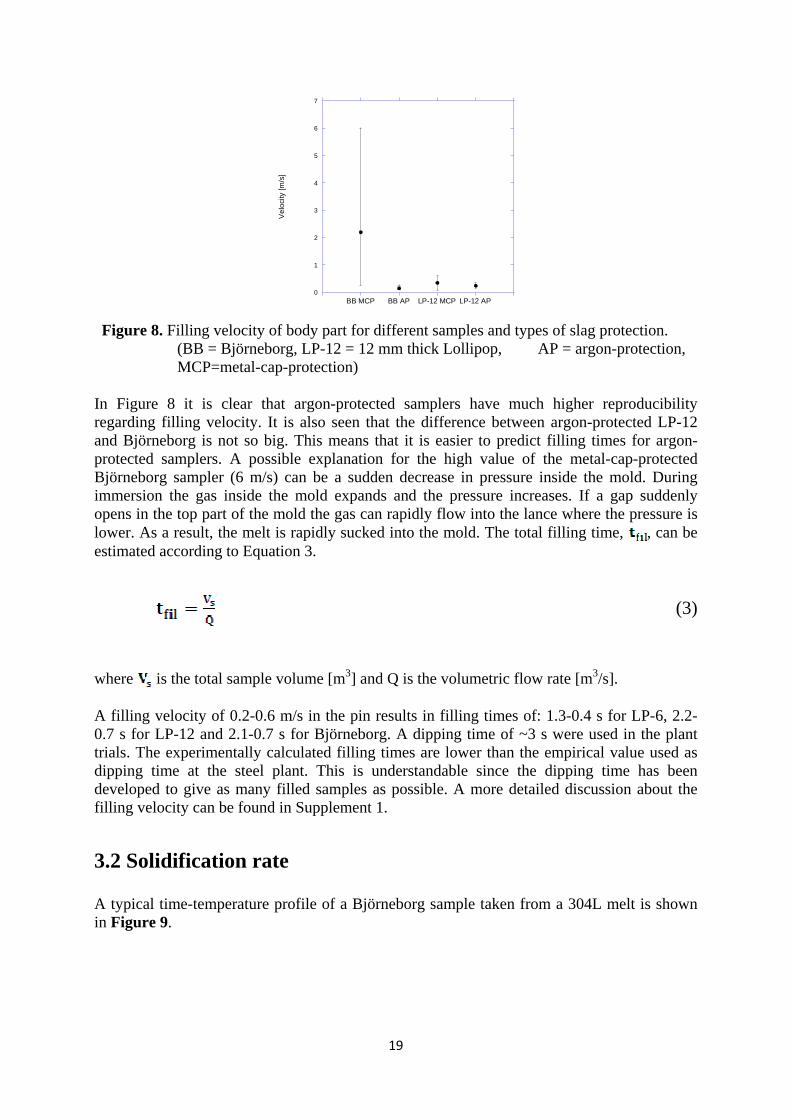
Figure 8. Filling velocity of body part for different samples and types of slag protection.
(BB = Björneborg, LP-12 = 12 mm thick Lollipop, AP = argon-protection, MCP=metal-cap-protection)
In Figure 8 it is clear that argon-protected samplers have much higher reproducibility regarding filling velocity. It is also seen that the difference between argon-protected LP-12 and Björneborg is not so big. This means that it is easier to predict filling times for argon-protected samplers. A possible explanation for the high value of the metal-cap-protected Björneborg sampler (6 m/s) can be a sudden decrease in pressure inside the mold. During immersion the gas inside the mold expands and the pressure increases. If a gap suddenly opens in the top part of the mold the gas can rapidly flow into the lance where the pressure is lower. As a result, the melt is rapidly sucked into the mold. The total filling time, , can be estimated according to Equation 3.
(3)
where is the total sample volume [m3] and Q is the volumetric flow rate [m3/s]. A filling velocity of 0.2-0.6 m/s in the pin results in filling times of: 1.3-0.4 s for LP-6, 2.2-0.7 s for LP-12 and 2.1-0.7 s for Björneborg. A dipping time of ~3 s were used in the plant trials. The experimentally calculated filling times are lower than the empirical value used as dipping time at the steel plant. This is understandable since the dipping time has been developed to give as many filled samples as possible. A more detailed discussion about the filling velocity can be found in Supplement 1.
3.2 Solidification rate A typical time-temperature profile of a Björneborg sample taken from a 304L melt is shown in Figure 9.

20
Figure 9. Typical time-temperature profile for Björneborg sampler.
In Figure 9 it can be seen that the temperature reaches a maximum value at the liquidus temperature and not the melt temperature. If this is correct or not is not known at this stage of the project. It may be due to cooling during filling or slow response of the thermocouple. In this study, an estimation of the solidification rate, , was calculated according to Equation
4.
(4)
where is the measured temperature of the melt in the ladle, is the solidus
temperature for the given steel grade, is the time when the thermocouple reaches the
solidus temperature and is the time when the melt reaches the thermocouple, as shown in
Figure 9. For some reason the measured temperatures did not reach the solidus temperature in all cases. This makes it impossible to use Equation 4 to calculate the solidification rate. Instead, a normalized solidification rate, was used in this study. Using Equation 5 and Equation 6 to
calculate the assumption is made that the maximum registered temperature was too low
and in reality should be approximately the same as the liquidus temperature.
(5)
(6)
where is the maximum temperature registered by the thermocouple and is the time
where the thermocouple reaches a temperature of .

21
In the case when the maximum temperature and liquidus temperature are the same then give
the same result as . The estimated solidification rate and solidification time for the different
samples are summarized in Table 6. Table 6. Solidification rate and solidification time of steel samples.
Mold Steel grade Thickness [mm] Weight [g]Solidification
rate [°C/s]Solidification
time [s]Solidification
rate [°C/s]Solidification
time [s]LP-6 S32304 6 40 - - 99 1.3LP-12 S32304 12 80 55 2.3 45 2.9BB S32304 14 170 53 2.5 46 2.9LP-6 304L 6 40 - - 105 0.9LP-12 304L 12 80 - - - -BB 304L 14 170 23 4.0 21 4.5LP-6 = 6 mm thick Lollipop, LP-12 = 12 mm thick Lollipop, BB = Björneborg
r rn
It can be seen that the Björneborg and the LP-12 samples have approximately the same solidification rate (45~55 °C/s) and solidification time (2.3~2.9 s) for a S32304 steel grade. The solidification rate in a 304L grade for a Björneborg sample was 21~23 °C/s and solidification time was 4~4.5 s. The LP-6 measurements were all below liquidus, forcing the use of Equation 5. The LP-6 sample solidifies with a rate of 99~105 °C/s within 0.9~1.3 s for 304L and S32304 steel grades. Unfortunately, no measurements with LP-12 were successful on a 304L steel grade. However, since the Björneborg and the LP-12 samples have almost the same thickness in the body part, it is reasonable that the solidification rates are close to each other. The solidification rate and solidification time is measured where it is believed that the last solidified melt exist in the sample. The inlet part of the samples will probably solidify in less time. Thus, the solidification time in the body part can be longer than the dipping time (~3 s).
3.3 Total oxygen content The total oxygen content in different zones of the Björneborg and Lollipop samples were determined using melt extraction method. It was found that the last part of the pin in all samples contained very high amounts of total oxygen. This is probably an effect of slag entrapment and/or reoxidation during withdrawal of the sampler from the melt. Therefore, that part is excluded from the following results. An overall comparison of the total oxygen in samples depending on slag protection systems is made in Figure 10 by comparing the average total oxygen for different samplers. The horizontal axis in Figure 10 shows the different sample types and their respective weights. The vertical axis shows the average difference between the total oxygen content in each zone of the sample and the lowest total oxygen content found in the entire sample. This value is used instead of average total oxygen content in the samples because each melt differs a little bit with respect to the total oxygen content. The error bars show standard deviation of the total oxygen determinations.
22
-20
0
20
40
60
80
100
120
O(i)
-O(m
in)
(ppm
)
LP-6(40)
LP-12(80)
BB(160)
Sample :Weight, g:
without Ar
with Ar
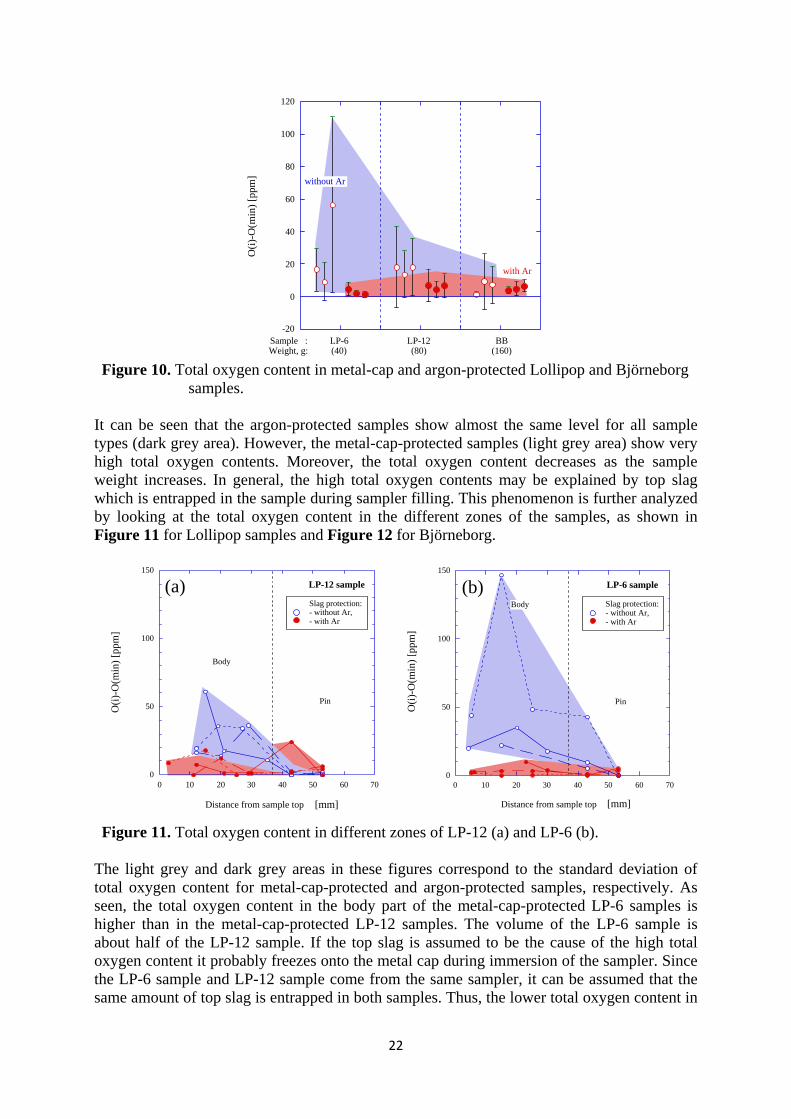
Figure 10. Total oxygen content in metal-cap and argon-protected Lollipop and Björneborg
samples. It can be seen that the argon-protected samples show almost the same level for all sample types (dark grey area). However, the metal-cap-protected samples (light grey area) show very high total oxygen contents. Moreover, the total oxygen content decreases as the sample weight increases. In general, the high total oxygen contents may be explained by top slag which is entrapped in the sample during sampler filling. This phenomenon is further analyzed by looking at the total oxygen content in the different zones of the samples, as shown in Figure 11 for Lollipop samples and Figure 12 for Björneborg.
0
50
100
150
0 10 20 30 40 50 60 70
O(i)
-O(m
in)
(ppm
)
Distance from sample top (mm)
LP-12 sample
Body
Pin
Figure 11. Total oxygen content in different zones of LP-12 (a) and LP-6 (b).
The light grey and dark grey areas in these figures correspond to the standard deviation of total oxygen content for metal-cap-protected and argon-protected samples, respectively. As seen, the total oxygen content in the body part of the metal-cap-protected LP-6 samples is higher than in the metal-cap-protected LP-12 samples. The volume of the LP-6 sample is about half of the LP-12 sample. If the top slag is assumed to be the cause of the high total oxygen content it probably freezes onto the metal cap during immersion of the sampler. Since the LP-6 sample and LP-12 sample come from the same sampler, it can be assumed that the same amount of top slag is entrapped in both samples. Thus, the lower total oxygen content in
0
50
100
150
O(i)
-O(m
in)
(ppm
)
LP-6 sample
Body
Pin
Slag protection:- without Ar,- with Ar
0 10 20 30 40 50 60 70
Distance from sample top (mm)
(a) (b) Slag protection:- without Ar,- with Ar
O(i)
-O(m
in) [
ppm
]
O(i)
-O(m
in) [
ppm
]
O(i)
-O(m
in) [
ppm
]
[mm] [mm]

23
the LP-12 can be explained by a higher metal to slag ratio. This is further supported by the results from the Björneborg samples in Figure 12.
0
10
20
30
40
50
60
0 50 100 150 200
O(i)
-O(m
in)
(ppm
)
Distance from sample top (mm)
Slag protection:- without Ar,- with Ar
Body
Pin Inlet
BB sample
Figure 12. Total oxygen content in different zones of Björneborg sample.
The Björneborg samples show the smallest difference in total oxygen content between argon-protected and metal-cap-protected samplers. The later part of the pin part show almost the same total oxygen content for both types of slag protection. Judging from the results from the LP-6, LP-12 and Björneborg, it is probable that top slag freezes on the metal cap. When the metal cap melts during sampling, the top slag is mixed into the melt that fills the sample. The melt that enters first contains most slag and end up in the top of the sample body. As a result, the pin part and the inlet part show lower total oxygen content than the body part. Overall, this information shows that it is very difficult to get a realistic result of the total oxygen content with metal-cap-protected samples. Even if the analyzed value is within the expected ppm-range small particles from the top slag could be present. More homogenous and reliable results are obtained by using argon-protected samples. This is especially critical for Lollipop samples with a lower sample weight. Therefore, it can be concluded that argon-protected sampling is better than metal-cap-protected sampling when the steel samples should be used for determination of the total oxygen content. In this case, the dispersion of O(i)-O(min) values in argon-protected samples are usually lower than 10 ppm.
3.4 Slag particles The big difference in total oxygen content between argon-protected and metal-cap-protected samplers is probably due to slag entrapment. Some reoxidation can occur for metal-cap-protected samplers because of the air in the sampler. But this cannot explain such large difference of total oxygen content in different zones of metal sample. Figure 13 show typical photographs of the surface on LP-6 samples taken with metal-cap-protection (a) and argon-protection (b).
O(i)
-O(m
in) [
ppm
]
[mm]

24
Figure 13. Typical photographs of surface for LP-6 samples with metal-cap-protection (a)
and argon-protection (b). The dark areas in the metal-cap-protected sample were believed to be entrapped top slag. To validate that slag caused these high total oxygen contents, a vertical slice of one metal-cap-protected LP-6 sample was examined in Light Optical Microscope. In most parts of the sample dark particles could be seen, both spherical particles (Figure 14 (a)) up to almost 400 µm in diameter and large irregular shaped particles (Figure 14 (b)).
Figure 14. Typical photographs of spherical (a) and irregular shaped (b) slag particles in
metal-cap-protected LP-6 sample.
These particles probably originate from the top slag due to their large size. As seen from the high total oxygen contents measured in the top part of the metal-cap-protected samples in section 3.3, particles of this size significantly affect the total oxygen content in the sample. Future SEM-EDS studies should be performed to validate that the composition of the particles correspond to the top slag.
(a) (b)
(b) (a)
20 mm

25
3.5 Inclusion homogeneity in Lollipop samples According to analysis of small and large size inclusions on film filters after electrolytic extraction, it was found that the inclusion size distribution had two peaks. As shown in Figure 15 the peak in Figure 15 (a) corresponded to primary inclusions and the peak in Figure 15 (b) to secondary inclusions. The primary inclusions consisted mainly of Ca-Al-Si-Mg-O. The secondary inclusions were found to consist mainly of Al-O and Ti-O. In addition, some inclusions also contained small amounts of Mg, Cr and Fe.
0 100
2 103
4 103
6 103
8 103
1 104
N
(m
m
)V
-3
(a)
0
5 106
1 107
1.5 107
0 1 2 3
d ( m)V µ
N
(m
m
)V
-3
(b)
Figure 15. Example on inclusion size distribution of primary inclusions (a) and secondary
inclusions (b) in Lollipop samples.
The inclusions were roughly divided into primary (dv > 0.8 µm) and secondary (dv > 0.5 µm). The total number of primary inclusions per unit volume is plotted for different zones of Lollipop samples in Figure 16 (a). This diagram shows that the top part of both LP-6 and the LP-12 contains more inclusions than the middle and bottom part, where the results are quite close to each other. Since there was little difference in diameter this may imply that larger inclusions is pushed toward the top by the fluid flow but that there is not much agglomeration within this size range. The volume fraction of primary inclusions in the top part is also larger than that in the middle and bottom part of samples, as shown in Figure 16 (b).
0
2 104
4 104
6 104
Analyzed zones of sample
top middle bottom
LP-6
LP-12
d > 0.8 mµV
Tota
l N
(m
m
)V
-3
0 100
1 10-4
2 10-4
Analyzed zones of sample
top middle bottom
LP-6
LP-12
d > 0.8 mV µ
f V
Figure 16. Total number per volume unit (a) and volume fraction (b) of primary inclusions
in different zones of Lollipop samples.
0 1 2 3
d ( m)V µ
(a) (b)
(a) (b)
[mm
-3]
[mm
-3]
[mm
-3]
[µm] [µm]

26
4 Final Discussion This study can hopefully be used as a general guideline for sampling of liquid steel. In Supplement 1 it has been shown that the filling velocity and filling time highly depend on the type of slag protection. The reproducibility for argon-protected samplers is much higher, making it easier to find a suitable dipping time for each type of sampler. As mentioned in the experimental work, the samplers in this study have molds that are baked into sand. Some pressure was built up in the mold, but the gas was ventilated from the mold after a while. The choice of material in the sampler may very well influence the sample quality negatively if it is too tight. First, it must be porous enough to provide an argon flow that is able to push the top slag away. Second, it must be porous enough to let the air or argon to be evacuated from the mold, making it possible for the melt to fill the sample. A study of different argon-protected samplers may be needed to investigate this effect. The homogeneity with respect to inclusion characteristics, e.g. total oxygen and inclusion size distribution, in the metal sample was studied in Supplement 2. With respect to the results, argon-protected samplers are recommended since metal-cap-protected samplers are contaminated by top slag. The top slag increases the total oxygen content to a large degree, especially in Lollipop samples because they have a small sample volume. The Björneborg samples are not affected as much and it might be possible to use the pin part for total oxygen determination. However, when the determined value of the total oxygen content is trustworthy low for the steel grade in question, the metal-cap-protected samples can still be contaminated by top slag. As a result, the increase in total oxygen content is small and the value might be taken as true. To minimize the risk for misinterpreted total oxygen content determinations, argon-protected-sampling is recommended in all cases. The inclusion size distribution in different parts of argon-protected Lollipop samples was determined in Supplement 2. No clear difference could be seen between the two thicknesses. Both the 6 mm thick and the 12 mm thick Lollipop sample contained a larger number of primary inclusions in the top part of the sample compared to the middle and bottom part. In Supplement 1 it was found that the solidification rate of the 6 mm thick Lollipop sample was about twice as high as for the 12 mm thick Lollipop sample. This does not seem to influence the homogeneity of primary inclusions on the surface of the sample. Further studies should be made to determine the inclusion size distribution at different depths of the sample. Since the sample solidifies from the surface and into the middle it is quite possible that the solidification rate has a larger effect on the homogeneity in that direction. Overall, the argon-protected 6 mm thick Lollipop sample can be recommended for determination of both total oxygen content and inclusion size distribution. For practical reasons, it is best to use the pin part of the sample for total oxygen determination. However, it is very important that the sample preparation is made thoroughly. Often there are pits of varying size on the surface and these must be removed. Since the number of inclusions is larger in the top part of the sample it may be recommended to determine the inclusion size distribution in that part of the sample to obtain a worst case scenario.

27
5 Conclusions Filling velocity and solidification rate have been measured for argon-protected and metal-cap-protected samplers of the following types: Björneborg, Lollipop with 6 mm thickness and Lollipop with 12 mm thickness. Homogeneity with respect to total oxygen content and primary inclusions in different samplers and sampling systems has been studied. From these results the following conclusions can be made: 1) The filling velocity of sampler for liquid steel is mostly dependent on the slag protection system. Argon-protected-sampling has a lower filling velocity (0.19±0.09 m/s) and higher reproducibility than metal-cap-protected sampling (1.28±2.23 m/s) 2) The difference in filling velocity between sampler geometries is not as large as between sampling systems. The filling velocity in the body of argon-protected Björneborg sampler is 0.15±0.07 m/s and in 12 mm thick Lollipop sampler 0.24±0.10 m/s. 3) The filling velocity seems to increase during filling of the sampler. The filling velocity of a Björneborg sampler increases from 0.28~0.29 m/s in the bottom part of the pin to 0.34~0.71 m/s in the top part of the pin. During filling of the sample body the measured velocity was in the range of 0.11~0.26 m/s, which correspond to a filling velocity in the pin part of 0.06~0.12 m/s. 4) The solidification rate for the different samplers was found to be as follows (with solidification time in parenthesis): 21~53 °C/s for Björneborg (2.9~4.5 s), 45~55 °C/s for 12 mm Lollipop (2.3~2.9 s) and 99~105 °C/s for 6 mm Lollipop (0.9~2.9 s). 5) Metal-cap-protected samplers are polluted by top slag which affects the total oxygen content to a large degree and becomes more severe as the sample volume decreases. 6) Regarding Lollipop samplers it is crucial to use argon-protection to obtain a representative sample while metal-cap-protected Björneborg samples can perhaps be used but with high caution. 7) The surface of the top part of both argon-protected 6 mm thick Lollipop and 12 mm thick Lollipop contained higher amounts of primary inclusions than the middle and bottom part.

29
6 Future Work In some cases, more filling velocity and solidification rate measurements should be done since the amount of successful measurements are low. The solidification structure in the samples may be analyzed and compared with the solidification rate to validate the results. With more solidification rate and filling velocity data it may be possible to calculate the lower and upper limit for filling velocity. The lower limit is calculated to avoid total solidification in the pin (and an unfilled sample) and an upper limit is good to avoid turbulence and risk of inclusion agglomeration. The total oxygen content in different parts of the steel samples may be analyzed with different samplers to investigate the effect of preheating and drying of samplers before sampling. Furthermore, the homogeneity of primary inclusions depending on the analyzed depth of the steel sample (surface to middle) will be determined.

31
7 References
1. L. Huet, P. Jönsson and F. Reinholdsson, "The effect of deoxidation practice on inclusion characteristics in bearing steel production", Steel Times Int., Nov. 1997, p. 47-50.
2. M. Göransson and P. Jönsson, “Ideas for Process Control of Inclusion Characteristics during Steelmaking”, ISIJ Int., Vol. 41, 2001, pp. S42-S46.
3. Z. Zhang, A. Tilliander, M. Iguchi and P.G. Jönsson, ”Physical Modeling of a Sampler”, Submitted for publication in ISIJ International, Apr 2009.
4. V. Tusset et.al., “Cleanness assessment of high quality steels produced by RH treatment”, Ironmaking & Steelmaking, Vol. 30, 2003, pp. 142-145.
5. F. Reinholdsson et.al., “A Metallurgical Tool for Rapid Determination of Micro Inclusion Characteristics in Bearing Steel Production”, ISIJ International, Vol. 37, 1997, pp. 637-639.
6. T. Muori, W. Nagasawa, H. Narai and M. Ohori, ”Rapid Evaluation of Inclusions in Bearing Steel”, ASTM International, Vol. 3, 2006
7. R. Meilland and L. Dosdat, “Rapid characterization of inclusionnary cleanliness in steels by PDA-OES mapping”, La Revue de Métallurgie-CIT, Apr 2002, pp. 373-382.
8. R. Dekkers, B. Blanpain and P. Wollants, “Steel sampling to study inclusions”, Proc. Iron and Steel Society, AIME, Indianapolis, USA, 2003, pp. 1007-1019.
9. I.R.C. Whiteside et.al., “Fast characterization of steel cleanness by advanced mathematical analysis of spark and laser source optical emission data”, European report, No. 7210-PR/298, EUR 22070, 2006
10. Internet: www.electro-nite.de/eng/Products/sensors/Iron_Positherm.html, 2009-05-07
11. R. Inoue, T. Ariyama and H. Suito, “Extraction and evaluation of inclusion particles in steel”, submitted for presentation at Asia Steel 2009 International Conference, May 24-27, Busan, Korea


DEN SVENSKA STÅLINDUSTRINS BRANSCHORGANISATION
Organisationen grundades 1747 och ägs sedan dess av de svenska stålföretagen. Jernkontoret företräder stålindustrin i frågor som berör handelspolitik, forskning och utbildning, standardisering, energi och miljö samt skatter och avgifter. Jernkontoret leder den gemensamma nordiska stålforskningen. Dessutom utarbetar Jernkontoret branschstatistik och bedriver bergshistorisk forskning.
Box 1721, 111 87 Stockholm � Kungstr�dg�rdsgatan 10Telefon 08 679 17 00 � Fax 08 611 20 89
E-post [email protected] � www.jernkontoret.se