Questions on Green Taxes. Pollution Permits/ Tradable Permits.

EN EN
EUROPEAN COMMISSION
Brussels, 22.2.2017
SWD(2017) 91 final
COMMISSION STAFF WORKING DOCUMENT
Country Report Finland 2017
Including an In-Depth Review on the prevention and correction of macroeconomic
imbalances
Accompanying the document
COMMUNICATION FROM THE COMMISSION TO THE EUROPEAN
PARLIAMENT, THE COUNCIL, THE EUROPEAN CENTRAL BANK AND THE
EUROGROUP
2017 European Semester: Assessment of progress on structural reforms, prevention and
correction of macroeconomic imbalances, and results of in-depth reviews
under Regulation (EU) No 1176/2011
{COM(2017) 90 final}
{SWD(2017) 67 final to SWD(2017) 93 final}

Executive summary 1
1. Economic situation and outlook 2
2. Progress with the country-specific recommendations 8
3. Summary of the main findings from the MIP in-depth review 11
4. Reform priorities 15
4.1. Public finances and taxation 15
4.2. Financial sector 19
4.3. Labour market, education and social policies 24
4.4. Investment 30
4.5. Sectoral policies 36
4.6. Public administration 40
A. Overview Table 41
B. MIP Scoreboard 46
C. Standard Tables 47
References 52
LIST OF TABLES
1.1. Key economic, financial and social indicators - Finland 7
2.1. Summary table on 2016 CSR assessment 9
3.1. MIP Assessment Matrix (*) Finland 2017 13
4.2.1. Key banking sector indicators 19
4.4.1. Changes in employment 2005-2015 by education and demand for more educated
employment 33
B.1. The MIP Scoreboard for Finland 46
C.1. Financial market indicators 47
C.2. Labour market and social indicators 48
C.3. Labour market and social indicators (continued) 49
C.4. Product market performance and policy indicators 50
C.5. Green growth 51
CONTENTS

LIST OF GRAPHS
1.1. Real GDP growth and growth contributions, 2005-2018, Finland 2
1.2. Contributions to potential growth 2
1.3. Change in employment rates by age cohorts and gender, 2005-2015 3
1.4. Employment ratio and economic dependency ratio 3
1.5. Nominal unit labour costs, 2005=100 4
1.6. Export market shares 4
1.7. Decomposition of growth of debt 5
1.8. Public deficit and debt, % of GDP 5
4.1.1. General government deficit 2002-2015, % of GDP 15
4.1.2. General government expenditure by function and revenue (% of GDP) 15
4.1.3. Share of environmental taxes in GDP, selected EU countries 18
4.2.1. Banks’ costs-to-income ratio, % 20
4.2.2. Growth of banks’ loans to non-financial corporations, %, y-o-y, 2004q1-2016q3 21
4.2.3. Relative house prices, Finland 21
4.2.4. Non-financial corporations liabilities, %, y-o-y 22
4.2.5. Drivers for non-financial corporations debt-to-GDP ratio 22
4.2.6. Drivers for households’ debt-to-GDP ratio 23
4.2.7. Loan restructuring, debtors in enforcement 23
4.3.1. Key labour market indicators 24
4.3.2. PISA: Share of top performers in science- Finland 29
4.4.1. Breakdown of growth in export market shares 30
4.4.2. Real effective exchange rates, selected countries, 2005=100 30
4.4.3. Drivers for REER developments, Finland 31
4.4.4. Nominal unit labour costs by industry, 2010=100 31
4.4.5. Breakdown of export market shares, Finland 31
4.4.6. Trade balance of goods according to broad economic classification of goods. 32
4.4.7. Speed of structural change, Finland 32
4.4.8. Short-run speed of structural change, selected countries 33
4.4.9. Reorientation of the economy towards lower productivity industries 33
4.5.1. Total intramural R&D expenditure (GERD) by sectors of performance in Finland between
2005 and 2014 36
LIST OF BOXES
1.1. Selected highlights: the Competitiveness Pact 6
2.1. Contribution of the EU budget to structural change in Finland 10
4.3.1. Towards the Finnish wage-setting model – what are the challenges? 25
4.4.1. Investment challenges and reforms in Finland 35

1
This report assesses Finland’s economy in the light
of the Commission’s Annual Growth Survey
published on 16 November 2016. In the survey the
Commission calls on EU Member States to
redouble their efforts on the three elements of the
virtuous triangle of economic policy – boosting
investment, pursuing structural reforms and
ensuring responsible fiscal policies. In so doing,
Member States should put the focus on enhancing
social fairness in order to deliver more inclusive
growth. At the same time, the Commission
published the Alert Mechanism Report (AMR) that
initiated the sixth round of the macroeconomic
imbalance procedure. The in-depth review, which
the 2017 AMR concluded should be undertaken
for the Finnish economy, is presented in this
report.
Following a three-year-long economic
downturn, a gradually strengthening recovery
started in 2015. The economy is expected to have
expanded by 1.5 % in 2016 and is expected to
continue to grow in 2017-2018 by 1.2 % and 1.5 %
respectively. Domestic demand, in particular
construction investment, is expected to be the main
driver for growth in the near term, alongside a
strengthening export performance. The labour
market situation has also started to improve, with a
decline in headline unemployment rates, although
long-term unemployment continues to increase.
The potential growth rate of the Finnish
economy remains close to zero. Potential growth
fell significantly from the start of the crisis and
remains at a subdued level. This is due to a
shrinking working-age population alongside
subdued total factor productivity growth following
in particular the decline of the electronics and
paper industry. Investment has fallen. The
increasing public debt could limit the scope for
growth-enhancing public investment in the future.
The signing of the Competitiveness Pact
between the social partners in 2016 put an end
to a period of uncertainty in wage
developments. The Pact freezes wages for 2017
and increases annual working time without
additional compensation. In addition, employees
will be permanently responsible for paying a larger
proportion of social contributions. These measures
are expected to improve cost competitiveness and
support exports and employment in the coming
years. For the public sector, the Pact brings cost
savings by temporarily reducing employees' annual
holiday bonuses. However, these savings are more
than outweighed by the reduction in taxes and
social contributions which the government
introduced as a compensation for the wage freeze
and the shift of social contributions towards
employees. Therefore the short-term effect of the
Pact on public finances is projected to be negative
but the-long-term effect positive thanks to the
expected improvement in employment. The
improved cost competitiveness is also expected to
encourage investments.
Implementation of the 2015 pension reform has
started in 2017. The lowest statutory retirement
age will start to increase gradually and it will be
connected to life expectancy in 2027. This is
expected to contribute towards higher participation
rates for older workers and therefore increased
total employment. Against the background of an
ageing population and an increase in the economic
dependency ratio, which is projected to rise
significantly by 2025, this reform should help to
improve the sustainability of the pension system.
Both public and private debt has increased
marginally. The ratio of gross public debt-to-GDP
has risen, but at around 64 % of GDP it is
relatively low compared to the euro area as a
whole. Households' debt increased in 2016, with
credit growth supported by favourable credit
conditions, including low interest rates. The
growth of non-financial corporations’ debt slowed
down in 2016, after a rapid increase of intra-group
loans in 2015. The financial sector remains well
capitalised.
Overall, Finland has made some progress in
addressing its 2016 country-specific
recommendations. The government has taken
political decisions on the reform of the social and
healthcare services, and public consultations have
been carried out on major parts of the draft
legislation. Therefore some progress has been
made in addressing the recommendation on fiscal
sustainability. In line with the labour market
recommendation, the Competitiveness Pact
reduces labour costs for employers and extends the
possibilities for local level bargaining. A new
wage-setting model is being negotiated where
wage increases in tradable industries would set an
anchor for the wages in non-tradable sectors. The
Pact is expected to improve the cost
EXECUTIVE SUMMARY

Executive summary
2
competitiveness of the economy. From 2017, the
incentives to accept job offers have been
strengthened: the period of entitlement to earnings-
related unemployment benefits was cut by a fifth
to 400 days and the fees for early childhood
education have been reduced, in particular for
low-income parents. A new initiative using the
social impact bond model has been put in place to
better integrate migrants to the labour market. This
constitutes some progress towards addressing the
labour market recommendation. The government
put forward a package which provides new
opportunities for the creation and growth of
enterprises. Significant reform measures have been
proposed in the transport sector and are underway
for the gas market, in line with the developments
of the Balticconnector pipeline project. These
policy initiatives have led to some progress in
addressing the competitiveness recommendation.
Regarding progress in reaching the national targets
under the Europe 2020 strategy, developments in
2016 were generally positive. Even though the
ambitious target will be difficult to meet, the
employment rate increased in 2016. The poverty
rate is low compared to the EU average but it
doubled as a consequence of the two severe
recessions. Recently it has not decreased
substantially, and the target for poverty reduction
seems unattainable. The early school leaving rate
declined slightly in 2015 but it could be
challenging to meet the target. Finland’s tertiary
educational attainment rate continued its
improving trend in 2015 and is already above the
target. Finland continues to be on track to reach its
renewable energy and greenhouse gas reduction
targets. However, the very ambitious R&D target
is likely to be missed, as R&D investment has
decreased in recent years.
The main findings of the in-depth review
contained in this report, and the related policy
challenges, are as follows:
Cost competitiveness is expected to improve on
the back of the Competitiveness Pact. The Pact’s
positive impact on exports and employment is
expected to materialise gradually. The discussions
on the new wage setting model for the upcoming
wage negotiation rounds are still under way and
reaching an agreement will be crucial to secure
these expected positive effects.
Non-cost competitiveness acts as a drag on
export performance. Progress has been made in
opening up services sectors such as retail trade to
competition, and a number of other domestic
service sectors, including taxis, have been
identified as candidates for future reform. While
international comparisons rank Finland among the
leading countries in the world in terms of its
business environment and investment appeal, the
existing stock of inward investments in Finland is
below the EU average when compared to the size
of the economy.
Structural change is unfolding, but the
reorientation of the economy seems to have
slowed down recently. After a decline in IT
manufacturing, information and communications
technology services have become a more important
exporting sector. The recent rapid increase in start-
ups is expected to contribute to the gradual
diversification of production structures. Policies to
support start-ups and the internationalisation of
small and medium sized enterprises are in place,
and the government has outlined plans to enable
and promote entrepreneurship further, including by
reducing the administrative and regulatory burden.
Private sector debt is expected to remain high
but the financial sector is robust. Non-financial
corporations’ debt may be reduced in the coming
years due to increased profitability resulting from
the Competitiveness Pact. The recent policy
measures, i.e. phasing out the deductibility of
mortgage interest payments in personal income
taxation and a loan-to-value cap as of July 2016,
are expected to moderate households’ borrowing
somewhat. That said, households’ debt is low
compared with Denmark and Sweden, and
households are not expected to reduce their debt
given the favourable borrowing conditions. Levels
of non-performing loans remain low and the
banking sector is generally solid.
The public debt-to-GDP ratio has started
decelerating and is projected to stand around
66.5 % in 2018. The government has committed
itself to consolidating public finances and the
deficit is projected to decline in the medium term.
According to the government’s fiscal strategy, debt
should be on a downward trend in 2019. The
pension reform implemented from 2017 and the
ongoing reform of the healthcare and social

Executive summary
3
services will help reduce the medium-term
sustainability risks.
Other key economic issues analysed in this report
which point to particular challenges facing
Finland’s economy are as follows:
The legislation needed to reform the
healthcare and social services system has
been agreed by the government. The main
aims of the reform include improved access to
healthcare and containing cost increases to
address the need for fiscal sustainability.
Before the legislation is passed, agreement is
also needed on the most controversial issues:
freedom of choice and the role of private
healthcare providers in the new system.
The labour market situation has started to
improve but some employment and social
challenges remain, such as the continued
increase in long-term unemployment. This
highlights the need to better target active labour
market policies and to continue to invest in
life-long learning and vocational training. To
achieve a higher employment rate including
for migrants is essential to counter the
challenges posed by an ageing population.
While the activity rate is improving overall, it
has declined for the 25-39 age group. The
complex benefit system, with its various types
of allowances, can result in significant
inactivity and low-wage traps.

2
GDP growth
Following three years of contraction, Finland’s
economy is growing again. In 2015, the economy
grew by 0.3 % and in 2016 the Commission
expects growth to have accelerated to about 1.5 %
on the back of increased private consumption and
investment. The economy is projected to continue
to expand by 1.2 % and 1.5 % in 2017 and 2018
respectively. Towards the end of the forecast
horizon, GDP growth is expected to become more
balanced, with both domestic and external demand
supporting growth.
Graph 1.1: Real GDP growth and growth contributions,
2005-2018, Finland
Source: European Commission, 2017 Winter Forecast
Potential GDP growth
Potential real GDP growth is not expected to
return to pre-crisis growth rates in the medium
term. Prior to the crisis, potential GDP grew
rapidly especially due to increases in total factor
productivity as the economy adjusted towards high
productivity industries. However, the economy
risks becoming trapped on a low-growth path
where:
(i) working age population declines;
(ii) total factor productivity stagnates;
(iii) investments remain at a low level (in
particular the decline in research investment and
moderate equipment investment restrain the
potential to increase labour productivity; low
productivity growth in turn requires continued
wage moderation to retain competitiveness); and
(iv) high private and public sector debt acts as
a drag on growth.
Measures to support an environment which is
conducive to investments, research and innovation,
and structural change towards higher-productivity
activities could help the economy to move out of
the low-growth equilibrium.
Graph 1.2: Contributions to potential growth
Source: European Commission, 2017 Winter Forecast
Labour market
The labour market situation started to improve
in 2016. The employment rate (15-64) increased to
70.5% by the third quarter of 2016, 0.6 pps higher
than in previous year. The unemployment rate
peaked at 9.4 % in 2015 and fell to 8.8% in 2016.
The latest unemployment rate data (7.9 % in
December 2016) show a year-on-year decline of
1.3 pps. Youth unemployment (age group 15-24)
also started to decline. It fell by 2.3 pps to 20.1 %
in 2016 approaching the EU average of 18.8 %.
Long-term unemployment is expected to have
peaked at 2.3 % in 2016.
Labour market policies are challenged by the
retirement of the ’baby boom’ cohorts and the
decline in employment in younger age groups.
The largest cohort was born in 1947 and reached
-10
-8
-6
-4
-2
0
2
4
6
8
05 07 09 11 13 15 17
%, pps
Inventories investment Investment (GFCF)
Consumption Net exports
Real GDP growth
-0.5
0.0
0.5
1.0
1.5
2.0
2.5
3.0
05 07 09 11 13 15 17 19
Rate
of
change y
-o-y
(%
)
Capital Accumulation ContributionTFP ContributionTotal Labour (Hours) ContributionPF Potential Growth
1. ECONOMIC SITUATION AND OUTLOOK

1. Economic situation and outlook
3
the lowest statutory retirement age, 63, in 2010.
Since then the working age population (15-64) has
been shrinking. To preserve the sustainability of
the pension system, the earnings-related pension
system was reformed in 2005 when the incentives
to work longer were strengthened. A new pension
reform took effect from 2017, when the lowest
statutory retirement age started to gradually
increase, from 63 to 65 by2027. Measures to
remove early exit pathways have led to higher
employment rates of older workers. However, at
the same time, employment has fallen among the
20-39 age group. Overall, in 2005-2015, the
employment rate of 15-74 year olds declined,
especially among men.
The economic dependency ratio (1), is at risk to
increase in the medium and long term.
Population projections and assumptions on
employment rates according to the Commission’s
2015 Ageing Report lead to a worsening economic
dependency ratio from about 120 in the early
2000s to about 135 by 2025. This highlights the
need to continue reforms that will increase
employment to ensure the sustainability of the
social security system.
Graph 1.3: Change in employment rates by age cohorts
and gender, 2005-2015
Source: European Commission
(1) A ratio of people aged 14 and below, people at 65 and
above and people not in employment aged 15-64 and
number of employed aged 15-64.
Graph 1.4: Employment ratio and economic dependency
ratio
Source: European Commission, Statistics Finland
Social developments
Income inequality in Finland is low in
comparison to other EU countries. The richest
20 % of the population had 3.6 times the income of
the poorest 20 % in 2015, compared with 5.2 times
in the whole EU. The Gini coefficient of
equivalised disposable income was at 25.2 in 2015,
reflecting a more equal income distribution than
the EU average (Gini coefficient of 31.0). Income
equality, as measured by both indicators, has
remained stable in Finland in recent years.
Households’ net wealth (2) however is not as
evenly distributed as income, but remains within
the range observed in other EU countries for which
data were collected in 2013-2014 (ECB 2016).
The risk of poverty has declined gradually since
its peak in 2011. In 2015, the at-risk-of-poverty
rate after social transfers/pensions, at 12.4 %, was
about 4 pps. lower than the EU average. However,
the recent economic downturn led to an increase in
the number of long-term unemployed, and in the
number of 15-24 year-olds who do not study, work
or participate in (vocational) training. This is likely
to limit the scope for significant further
improvements in income equality and in the fight
against poverty in the near future. It is also worth
recalling that the legacy of the 1990s recession, a
considerable increase in the risk of poverty,
(2) Difference between total assets and total liabilities.
-6
0
6
12
18
Female Male
64
66
68
70
72
100
110
120
130
140
150
2000 2005 2010 2015 2020 2025
Economic dependency ratio (LHS)
Employment ratio (RHS)
Forecast

1. Economic situation and outlook
4
remained uncorrected despite the economic
upturns that followed. The government’s EU2020
target, no more than 770 000 persons at risk of
poverty or social exclusion, seems unlikely to be
reached. In 2015, the corresponding number was at
904 000, with only a marginal (7 000) decrease
since 2008.
Competitiveness
Competitiveness losses are expected to start
reversing gradually over the medium run. Cost
competitiveness compared to peer countries has
been improving already over recent years and will
improve further in 2017 given the recent labour
market agreement, the Competitiveness Pact (see
box 1.1 and graph 1.5). Exports are projected to
turn to growth as of 2017, and in 2018 the
contribution of net exports to GDP growth is
expected to be positive again. Although the
outlook for exports has improved, uncertainty
related to the external environment remains
significant, in particular with regard to demand
from the EU and the speed of the economic
recovery in Russia in 2017-2018. Also the
challenges related to non-cost competitiveness,
such as the low productivity growth, the small
number of exporting SMEs and the concentration
of export products in intermediate and investment
goods, remain. The current account deficit has
been contracting since 2012, when the deficit was
1.9 % of GDP, reaching about 0.4 % of GDP in
2015.
Graph 1.5: Nominal unit labour costs, 2005=100
Source: European Commission, 2017 Winter Forecast
Graph 1.6: Export market shares
Source: European Commission
Financial sector
High private sector debt entails vulnerabilities
but the financial sector remains stable and
strong. The private sector debt-to-GDP ratio has
remained on an increasing trend, and in 2015
jumped to about 156 % of GDP mainly due to the
increase in the foreign borrowing of non-financial
corporations. Households’ debt-to-gross disposable
income increased to 112 % which is an all-time
high for Finland and above the euro area average
of about 94 %. At same time it remained below the
95
100
105
110
115
120
125
130
135
05 06 07 08 09 10 11 12 13 14 15 16 17 18
FI DE SE EA excl. FI and DE
-40
-30
-20
-10
0
10
20
30
00 01 02 03 04 05 06 07 08 09 10 11 12 13 14 15
Rate
of
change y
-o-y
(%
)
Contribution: World export growth (neg. Sign)Contribution: Finland export growthEMS growth rate

1. Economic situation and outlook
5
corresponding ratios for Sweden (166 %) and
Denmark (256 %). However, households and non-
financial corporations have benefited from low
interest rates and service their debt well, as
indicated by the low amount of non-performing
loans. The banking sector is highly concentrated,
the banks are interconnected in the Nordic
countries and are dependent on wholesale
financing. Most of the household debt consists of
mortgage loans which use the apartment or house
as a collateral. This link between the housing
market and the banking sector may be somewhat
stronger in Finland than in other countries, as the
share of owner-occupied housing is higher than in
the euro area overall.
Graph 1.7: Decomposition of growth of debt
Source: European Commission
Public finances
The balancing of government revenue and
expenditure continues gradually. The budget
deficit amounted to 2.8 % of GDP in 2015 and is
expected to have declined to 2.2 % of GDP in
2016, as a result of expenditure cuts and revenue
measures such as the increase in unemployment
insurance contributions. These measures were
decided in the general government fiscal plan for
2016-19. In 2017, in line with the Competitiveness
Pact, personal income tax and employers’ health
insurance contributions were lowered. These
measures lead to an estimated revenue loss of
0.6 % of GDP. The overall deficit is projected to
worsen to 2.3 % of GDP in 2017 despite the
implementation of expenditure cuts in line with the
fiscal plan and the reduction of public sector
employees’ holiday bonuses. In 2018, the deficit is
expected to fall again to 1.8 % of GDP thanks to
increasing economic activity and expenditure cuts
foreseen in the fiscal plan.
Graph 1.8: Public deficit and debt, % of GDP
Source: European Commission, 2017 Winter Forecast
-5
0
5
10
15
20
25
03 04 05 06 07 08 09 10 11 12 13 14 15
% o
f G
DP
Financial corporations
Household
Non financial corporations
Government
MIP Threshold
Private sector total
10
20
30
40
50
60
70
80
90
-6
-5
-4
-3
-2
-1
0
1
2
3
4
5
6
06 08 10 12 14 16 18
Deficit, % of GDP, LHS
Debt, % of GDP, RHS

1. Economic situation and outlook
6
Box 1.1: Selected highlights: the Competitiveness Pact
Several analysts (among others Borg and Vartiainen (2015), European Commission (2014), Kajanoja
(2012)) pointed to deteriorated cost competitiveness as one of the possible sources of weak economic
developments before the parliamentary elections in 2015. The Sipilä government took office in May 2015
and set itself the target to improve Finland's cost-competitiveness by 15% in terms of nominal unit labour
costs. Of this, 5pps would be reached through structural reforms leading to higher productivity, 5pps through
continuing wage moderation and 5pps through an agreement between the social partners.
The central labour market organisations reached an agreement on the Competitiveness Pact (the Pact) in
February 2016. During the spring and early summer, employer and employee organisations carried out
industry level collective agreement negotiations to introduce the Pact into about 300 industry- or company-
level agreements. To enable the conclusion of the industry-level agreements, the government announced in
early June that it will cut taxes on labour income in all income categories as of 2017 depending on the
coverage of the Pact. By the time of the government budget negotiations in late summer, over 90% of
employees were covered by the Pact. Consequently, a 515 million euros tax cut was included in the
government’s 2017 budget proposal.
The Pact includes the following measures to reduce labour costs:
annual working time will be increased by 24 hours without additional compensation from 2017
after the expiry of the latest wage agreements (mainly in late 2016 or early 2017), wages will be frozen
for 12 months (the exact timing depends on the industry)
a larger share of social security contributions will be shifted permanently towards the employees.
In line with the Pact, public sector employees' annual holiday bonuses, which roughly correspond to 50% of
a month's salary, will be temporarily (2017-2019) reduced by 30%, lowering public spending. The savings
that are expected to materialise as a result of the Pact will be used to reduce employers' labour costs. Over
the long-run, the Pact is expected to have positive impacts on exports, real GDP, employment and public
finances. Estimates of the impact of lower wage costs on employment range from 20 000 to 40 000
depending on the method and assumptions used (see for example estimates by Ministry of Finance (2016),
Lehto (2016), Economic Policy Council (2016)).
The social partners also agreed to extend local bargaining possibilities, and the Pact negotiations are being
followed up by negotiations for a new collective wage setting practices, which would emphasise the role of
tradable industries' cost-competitiveness (see Section 4.3). Wage increases that will be negotiated after the
wage freeze period will be the key in preserving the gains of the Competitiveness Pact.

1. Economic situation and outlook
7
Table 1.1: Key economic, financial and social indicators - Finland
(1) Sum of portfolio debt instruments, other investment and reserve assets.
(2,3) Domestic banking groups and stand-alone banks.
(4) Domestic banking groups and stand-alone banks, foreign (EU and non-EU) controlled subsidiaries and foreign (EU and
non-EU) controlled branches.
(*) Indicates BPM5 and/or ESA95.
Source: European Commission, European Central Bank
2004-2008 2009 2010 2011 2012 2013 2014 2015 2016 2017 2018
Real GDP (y-o-y) 3.3 -8.3 3.0 2.6 -1.4 -0.8 -0.6 0.3 1.5 1.2 1.5
Private consumption (y-o-y) 3.3 -2.7 3.1 2.9 0.3 -0.5 0.8 1.5 2.0 1.2 1.3
Public consumption (y-o-y) 1.5 1.6 -0.1 -0.1 0.5 1.1 -0.5 0.1 -0.1 -0.8 0.1
Gross fixed capital formation (y-o-y) 3.9 -12.5 1.1 4.1 -1.9 -4.9 -2.6 1.1 3.4 2.0 2.5
Exports of goods and services (y-o-y) 8.3 -20.1 6.2 2.0 1.2 1.1 -2.7 2.0 0.8 2.0 3.3
Imports of goods and services (y-o-y) 8.3 -16.9 6.5 6.0 1.6 0.5 -1.3 3.1 1.3 1.5 2.5
Output gap 1.9 -5.1 -2.4 -0.1 -1.6 -2.3 -2.9 -2.8 -1.7 -1.3 -0.6
Potential growth (y-o-y) 2.3 0.2 0.2 0.2 0.0 -0.1 0.0 0.2 0.4 0.8 0.8
Contribution to GDP growth:
Domestic demand (y-o-y) 2.8 -4.1 1.8 2.4 -0.1 -1.1 -0.3 1.1 1.8 0.9 1.3
Inventories (y-o-y) 0.1 -2.1 1.3 1.5 -1.1 0.0 0.2 0.3 -0.1 0.1 0.0
Net exports (y-o-y) 0.4 -2.1 0.0 -1.5 -0.2 0.3 -0.5 -0.4 -0.2 0.2 0.3
Contribution to potential GDP growth:
Total Labour (hours) (y-o-y) 0.4 -0.2 -0.1 -0.1 -0.1 -0.1 0.0 0.1 0.2 0.5 0.3
Capital accumulation (y-o-y) 0.7 0.4 0.4 0.4 0.4 0.2 0.2 0.2 0.2 0.3 0.3
Total factor productivity (y-o-y) 1.1 0.0 -0.1 -0.2 -0.2 -0.1 -0.2 -0.1 0.0 0.0 0.2
Current account balance (% of GDP), balance of payments 3.7 1.9 1.2 -1.8 -1.9 -1.6 -1.1 -0.4 . . .
Trade balance (% of GDP), balance of payments 4.7 2.3 1.4 -0.9 -1.1 -0.5 -0.5 0.1 . . .
Terms of trade of goods and services (y-o-y) -2.1 1.3 -2.1 -1.6 -1.0 0.7 1.3 2.8 0.6 -1.1 -0.8
Capital account balance (% of GDP) 0.1 0.0* 0.0* 0.0* 0.0* 0.0* . . . . .
Net international investment position (% of GDP) -14.0 3.2 16.5 15.1 11.7 3.9 -2.6 0.6 . . .
Net marketable external debt (% of GDP)1 -1.0 -11.7* -16.4* -20.9* -31.0* -37.1 -39.8 -29.5 . . .
Gross marketable external debt (% of GDP)1 98.1 138.5 161.1 190.1 204.5 188.5 196.4 181.7 . . .
Export performance vs. advanced countries (% change over 5 years) 4.4 -5.6 -12.9 -16.7 -23.1 -24.6 -19.5 -18.80 . . .
Export market share, goods and services (y-o-y) -0.8 -10.8 -12.0 -6.4 -5.8 0.1 -3.6 -6.6 . . .
Net FDI flows (% of GDP) -0.4 2.0 1.1 0.9 1.3 -0.8 -6.3 -7.5 . . .
Savings rate of households (net saving as percentage of net disposable income) 0.6 3.4 3.2 1.3 0.7 1.5 -0.1 -0.7 . . .
Private credit flow (consolidated, % of GDP) 11.6 0.8 7.3 3.6 7.4 2.8 1.2 9.5 . . .
Private sector debt, consolidated (% of GDP) 119.8 142.8 148.9 145.3 148.6 147.7 147.5 155.8 . . .
of which household debt, consolidated (% of GDP) 48.4 59.3 61.1 61.3 63.6 64.0 65.5 66.8 . . .
of which non-financial corporate debt, consolidated (% of GDP) 71.4 83.5 87.8 84.0 85.0 83.7 82.0 89.0 . . .
Corporations, net lending (+) or net borrowing (-) (% of GDP) 3.4 4.9 5.2 1.8 2.7 2.3 3.8 4.0 3.4 3.8 3.9
Corporations, gross operating surplus (% of GDP) 27.3 23.1 23.9 23.2 21.6 21.4 21.9 22.3 22.6 23.8 24.3
Households, net lending (+) or net borrowing (-) (% of GDP) -2.9 -0.2 -1.0 -2.1 -2.3 -1.5 -1.9 -2.0 -2.1 -2.3 -2.7
Deflated house price index (y-o-y) 4.4 -0.4 4.8 0.0 -0.4 -1.3 -1.8 -0.4 . . .
Residential investment (% of GDP) 6.3 5.2 6.1 6.3 6.3 6.0 5.5 5.6 . . .
GDP deflator (y-o-y) 1.7 1.9 0.4 2.6 3.0 2.6 1.7 1.7 0.9 1.0 0.9
Harmonised index of consumer prices (HICP, y-o-y) 1.5 1.6 1.7 3.3 3.2 2.2 1.2 -0.2 0.4 1.5 1.2
Nominal compensation per employee (y-o-y) 3.6 2.0 2.2 3.6 2.8 1.3 1.0 1.6 1.2 -0.8 1.2
Labour productivity (real, person employed, y-o-y) 1.6 -6.0 3.7 1.3 -2.3 0.0 -0.2 0.6 . . .
Unit labour costs (ULC, whole economy, y-o-y) 2.0 8.5 -1.4 2.3 5.2 1.4 1.1 1.0 0.1 -1.4 0.3
Real unit labour costs (y-o-y) 0.3 6.5 -1.8 -0.3 2.2 -1.1 -0.6 -0.7 -0.8 -2.3 -0.6
Real effective exchange rate (ULC, y-o-y) 0.8 6.3 -4.8 0.9 0.2 3.2 1.3 -2.9 -0.6 -2.7 -1.6
Real effective exchange rate (HICP, y-o-y) -0.8 3.2 -5.7 -0.1 -2.6 2.9 2.4 -2.9 1.2 -2.6 .
Tax wedge on labour for a single person earning the average wage (%) 30.8 29.1 29.1 29.8 29.5 30.1 30.7 30.9 . . .
Taxe wedge on labour for a single person earning 50% of the average wage (%) 20.0* 18.3 18.3 18.9 17.9 18.9 19.2 19.4 . . .
Total Financial Sector Liabilities, non-consolidated (y-o-y) 14.0 8.3 17.7 26.1 -2.7 -8.5 9.2 -1.5 . . .
Tier 1 ratio (%)2 . 13.4 13.5 14.7 14.8 15.3 16.2 20.4 . . .
Return on equity (%)3 . 6.2 6.3 6.1 6.5 8.0 9.5 8.5 . . .
Gross non-performing debt (% of total debt instruments and total loans and advances) (4) . 1.1 0.9 0.8 0.8 0.7 1.4 1.3 . . .
Unemployment rate 7.6 8.2 8.4 7.8 7.7 8.2 8.7 9.4 8.8 8.6 8.3
Long-term unemployment rate (% of active population) 1.8 1.4 2.0 1.7 1.6 1.7 1.9 2.3 . . .
Youth unemployment rate (% of active population in the same age group) 18.5 21.5 21.4 20.1 19.0 19.9 20.5 22.4 20.1 . .
Activity rate (15-64 year-olds) 75.5 75.0 74.5 74.9 75.2 75.2 75.4 75.8 . . .
People at-risk poverty or social exclusion (% total population) 17.3 16.9 16.9 17.9 17.2 16.0 17.3 16.8 . . .
Persons living in households with very low work intensity (% of total population aged below 60) 9.0 8.4 9.3 10.0 9.3 9.0 10.0 10.8 . . .
General government balance (% of GDP) 3.6 -2.5 -2.6 -1.0 -2.2 -2.6 -3.2 -2.7 -2.2 -2.3 -1.8
Tax-to-GDP ratio (%) 41.9 41.1 40.9 42.2 42.8 43.7 43.9 44.1 44.2 43.6 43.7
Structural budget balance (% of GDP) . . -1.1 -0.9 -1.2 -1.2 -1.6 -1.1 -1.2 -1.5 -1.4
General government gross debt (% of GDP) 37.5 41.7 47.1 48.5 53.9 56.5 60.2 63.5 63.7 65.6 66.5
forecast

8
Progress with the implementation of the
recommendations addressed to Finland in 2016
(3) has to be seen in a longer term perspective
since the introduction of the European Semester
in 2011. Over this six year period, the
recommendations have focused on public finances,
fiscal sustainability, labour market and business
environment. Numerous reforms have been
undertaken in these areas.
Finland has remained broadly compliant with
the fiscal recommendations. The medium-term
objective has not been met during most of the
period, but over 2011-2015 Finland has made
progress towards it in a manner which is broadly
compliant with the requirements of the Stability
and Growth Pact. However, Finland's debt-to-GDP
ratio has risen above 60% and continues to
increase.
To address the recommendations in the area of
fiscal sustainability, an important pension
reform was adopted in 2015, a reform of
healthcare and social services is in preparation.
The pension reform will gradually increase the
minimum retirement age and eventually link it to
the life expectancy. This is expected to increase
the supply of labour while ensuring that the
pensions can be kept at an adequate level. In
addition, the government is preparing reforms on
the administrative structure of the municipalities
and on the provision of healthcare and social
services.
There has also been progress in labour market
reforms. Active labour market policies aiming to
increase the participation rate have been
implemented. To improve competitiveness, social
partners have agreed on very moderate wage
increases and in 2016 a Competitiveness Pact was
concluded to improve cost competitiveness by
reducing labour costs to employers. The financial
incentives to accept low-income or part-time jobs
have been improved, as since the beginning of
2014 it has been possible to receive employment-
related earnings for up to 300 euros per month
without any impact on the unemployment benefit.
Similarly, since 2015, the housing allowance has
(3) For the assessment of other reforms implemented in the
past, see in particular section 4.
included a protected part of 300 euros, which has
not been deducted when the person receiving
assistance has received revenue from work.
The government has also addressed the
recommendations regarding the competition in
services, in particular in retail. Regulation of the
retail sector has been eased. As a major step, shop
opening hours were liberalised in 2016. The land
use and building act has been modified so that
promoting competition was added to the objectives
of land use planning so as to take into account the
need to increase competition. Alcohol monopoly
stores have been opening next to establishments
other than the dominant retail chains.
Regarding 2016, Finland has, overall, made
some (4) progress in addressing its 2016
country-specific recommendations (CSRs). The
government has presented large parts of the draft
legislation on the reform of the social and
healthcare services. The social partners have
signed a Competitiveness Pact which reduces
labour costs for employers and extends the
possibilities for local bargaining and a new wage
setting model is being negotiated. To increase the
incentives to accept job offers, the obligation for
the unemployed to accept a job offer as well as the
obligation to participate in activation schemes have
been tightened. In addition, the duration of
earnings-related unemployment benefits was
reduced. In order to promote entrepreneurship, the
government put forward a package which provides
additional opportunities for company creation and
growth. Initiatives to ease the establishment
conditions for retail outlets have been launched.
De-regulation measures have been proposed for
the transport sector and are underway for gas
markets.
(4) Information on the level of progress and actions taken to
address the policy advice in each respective subpart of a
CSR is presented in the Overview Table in the Annex. This
overall assessment does not include an assessment of
compliance with the Stability and Growth Pact.
2. PROGRESS WITH THE COUNTRY-SPECIFIC
RECOMMENDATIONS

2. Progress with the country-specific recommendations
9
Table 2.1: Summary table on 2016 CSR assessment
* This overall assessment of CSR1 does not include an assessment of compliance with the Stability and Growth Pact.
Source: European Commission
Finland Overall assessment of progress with
2016 CSRs: Some
CSR 1: Achieve an annual fiscal adjustment of at least 0,5 % of
GDP towards the medium-term budgetary objective in 2016 and
0,6 % in 2017. Use any windfall gains to accelerate the
reduction of the general government debt ratio. Ensure timely
adoption and implementation of the administrative reform with
a view to better cost-effectiveness of social and healthcare
services.
Some progress in ensuring timely
adoption and implementation of the
administrative reform*
CSR 2: While respecting the role of social partners, ensure
that the wage setting system enhances local wage bargaining
and removes rigidities, contributing to competitiveness and a
more export industry-led approach. Increase incentives to
accept work and ensure targeted and sufficient active labour
market measures, including for people with a migrant
background. Take measures to reduce regional and skills
mismatches. (MIP relevant)
Some progress
Substantial progress in ensuring that
the wage setting system enhances
local wage bargaining, removes
rigidities and contributes to
competitiveness
Some progress in increasing
incentives to work
Some progress in ensuring targeted
and sufficient active labour market
measures, including for people with a
migrant background
Some progress in addressing regional
and skills mismatches
CSR 3: Continue pursuing efforts to increase competition in
services, including in retail. Promote entrepreneurship and
investment, including by reducing administrative and regulatory
burden, to foster growth of high value added production. (MIP
relevant)
Some progress
Some progress in increasing
competition in services
Some progress in promoting
entrepreneurship and investment

2. Progress with the country-specific recommendations
10
Box 2.1: Contribution of the EU budget to structural change in Finland
The total allocation of the European Structural and Investment Funds (ESI Funds) in Finland amounts to EUR 3.8 billion under the current financial framework 2014-2020. This is equivalent to around 0.3 % of GDP annually (over 2014-2017) and 5 % of national public investment
1. By 31
December 2016, an estimated EUR 1.8 billion, which represents about 49 % of the total allocation for ESI Funds, have already been allocated to concrete projects. Financing under the European Fund for Strategic Investments, Horizon 2020, the Connecting Europe Facility (CEF) and other directly managed EU funds is additional to the ESI Funds. By end 2016, Finland has signed agreements for EUR 107.9 million for projects under the Connecting Europe Facility. The EIB Group approved financing under EFSI amounts to EUR 923 million, which is expected to trigger nearly EUR 2.8 billion in total investments (as of end 2016).. All necessary reforms and strategies as required by the ex-ante conditionalities
2 to ensure a
timely and efficient up-take of the funds have been met thus ensuring a timely and efficient up-take of the funds. All relevant CSRs were taken into account when designing the 2014-2020 programmes. The ESI Funds support the competitiveness, boost research and innovation, create employment as well as facilitate education and training. ESI Funds address, for example, labour market access for young people, older workers as well as long-term unemployed, migrants and other vulnerable groups through different operations. For example implementation of the youth guarantee is partly funded by the ESI Funds through one-stop guidance centres. By December 2016, more than 9 000 young unemployed or outside of working life had been supported by measures financed by the ESF. In the area of research and innovation, ESI Funds support Finland in implementing its smart specialisation strategies. In all 19 regions over 1 000 enterprises are involved and will cooperate with research institutes in their areas of excellence.
https://cohesiondata.ec.europa.eu/countries/FI 1 National public investment is defined as gross capital formation + investment grants + national expenditure on
agriculture and fisheries 2At the adoption of programmes, Member States are required to comply with a number of ex-ante conditionalities, which
aim at improving framework and investment conditions for the majority of areas of public investments. For Members
States that do not fulfil all the ex-ante conditionalities by the end 2016, the Commission has the possibility to propose the temporary suspension of all or part of interim payments

11
The 2017 Alert Mechanism Report called for
further in-depth analysis to monitor Finland's
progress in the evolution of the imbalances
identified in the 2016 MIP cycle. The selection
was motivated by the continued challenges related
to both price and non-price competitiveness in a
context of sectoral restructuring. Furthermore,
private and public sector indebtedness is high
which could constitute a risk to the stability in the
economy.
The report provides the in-depth review of how
the imbalances identified have developed. The
analysis is found in particular under
competitiveness and structural change (Section
4.4.1), private sector debt (Section 4.2) and public
debt (Section 4.1.1).
3.1. IMBALANCES AND THEIR GRAVITY
Export market shares fell in 2015 mainly due to
weak performance in the trade of goods. The
cumulative loss of export market shares in 2011-
2015 is estimated at about 20 %, which is one of
the largest in the EU. The decline has been driven
by cumulative losses of competitiveness and the
ongoing structural change in the economy and the
sensitivity of exports to the weak Russian
economy. Moreover, Finnish exports focus on
intermediate and investment goods, which make it
vulnerable to economic swings when investments
decline.
Structural change in industry has slowed down.
The rapid downsizing of forest and electronics
industries is over, but no other industry has
emerged as clearly taking the leading role in
economic recovery. Manufacturing has lost about
one fifth of its jobs and close to one third of its
gross value added since the crisis. Consequently,
aggregate labour productivity has fallen.
Private sector debt remains high, at about
155 % of GDP in 2015. The households'
debt-to-GDP ratio stood at 67 % while non-
financial corporations' debt was about 89 %. Non-
financial corporations' debt increased in 2015
partly due to loan arrangements between domestic
parent companies and their daughter companies
abroad.
Households' debt has increased to 112 % of
their gross disposable income. The European
Systemic Risk Board issued a formal warning to
Finland in 2016, highlighting the high level of
indebtedness and the associated vulnerabilities. At
the same time, as most mortgage loans are tied to
market reference interest rates, households'
average interest rate expenditure has fallen to a
record low 0.4 % of gross disposable income. The
share of non-performing loans in the total loan
stock, at 1.2 % in mid-2016, is the lowest in the
EU. The elevated private indebtedness, especially
households' debt, could reduce the economy's
resilience to macroeconomic shocks.
Public debt has increased since the beginning of
the crisis and is now above the 60 % of GDP
Treaty reference value but is set to stabilise at a
level below 70 %.
The financial sector is well capitalised and
shielded against risks even if vulnerabilities such
as high concentration, dependency on wholesale
market funding and cross-border connections to
the Nordic and Baltic banking sector, remain (see
also country reports for Sweden 2016 and 2017).
The solid position of the banking sector reduces
macro stability risks from private sector debt.
Furthermore, in a Nordic context, Finnish
households' debt-to-income ratio is not extremely
high and given fixed monthly mortgage payments
most households are protected from future
normalisation of reference market interest rates for
mortgages.
3.2. EVOLUTION, PROSPECTS, AND POLICY
RESPONSES
Finland is expected to continue losing export
market shares as the outlook in the
manufacturing sector remains relatively weak.
2016 is expected to have been a turning point in
exports and manufacturing sector production.
3. SUMMARY OF THE MAIN FINDINGS FROM THE MIP IN-
DEPTH REVIEW

3. Summary of the main findings from the MIP in-depth review
12
The cumulated loss of competitiveness has been
partly addressed. Cost competitiveness is
expected to improve in 2017 due to the
Competitiveness Pact, but the lack of agreement on
wage setting practices from 2018 create
uncertainty about future developments. If the new
wage setting practices or so called Finnish model
is successful, it will deliver nominal wage
increases that take into account competitiveness
and productivity developments so that workers
purchasing power is guaranteed while exporting
companies thrive. With enhanced local
possibilities to apply the sector level agreements,
as agreed in the Competitiveness Pact (for
organised employers) employers have more room
to adjust to economically difficult times. Non-cost
competitiveness challenges, including slow
productivity growth, continue to hamper economic
performance and export growth, but lively start-up
activities should imply that the fundamentals for
doing business are broadly in a good shape.
Non-cost competitiveness acts as a drag on
export performance. Many features of the
economy, such as the skilled labour force or the
favourable and stable business environment,
should make Finland well placed to reap the
benefits of world growth. However, this does not
yet seem to be the case. That said, the rapid
emergence of start-up companies might pave the
way to more diversified exports. And Russia's
expected economic recovery from 2017 could
bring about a positive risk to Finland's economic
outlook in the coming years.
Structural change is unfolding, but the
reorientation of the economy might have slowed
down recently. After a decline in electronics
production, ICT services have become more
important in service exports. The government
continues to support start-ups through its growth
programmes. Policies to support start-ups and the
internationalisation of SMEs are in place, but
might not be able to bring about a rapid change in
the structure of the economy or export market
shares in the short run.
Private sector debt is expected to remain high
but stable. Non-financial corporations may reduce
debt in the coming years for example due to
increased profitability thanks to the
Competitiveness Pact. The recent policy measures,
i.e. phasing out the deductibility of mortgage
interest payments in personal income taxation and
a loan-to-value cap as of July 2016, will have a
curbing effect on households' borrowing. Despite
this, households are not expected to deleverage
given the favourable borrowing conditions. The
households' debt-to-disposable income ratio could
continue to rise as income growth is projected to
remain limited given the wage freeze under the
Competitiveness Pact.
Public sector debt is expected to increase
further, driven up by the costs of an ageing
population. The Finnish government is committed
to consolidating public finances as outlined in the
government programme of 2015. According to the
government's fiscal strategy, debt would be put on
a downward trend in 2019. The 2017 pension
reform and the ongoing reform of healthcare and
social services will help reduce the medium-term
sustainability risk.
3.3. OVERALL ASSESSMENT
Sources of imbalances identified in Finland are
linked to competitiveness losses in a context of
sectoral restructuring and relatively high
private sector debt. Competitiveness losses are
the result of major sector restructuring affecting
the growth potential and are reflected in protracted
market share losses. Government debt has been
growing since after the crisis.
These developments had however limited
macro-stability implications because of the
strength of the financial sector. High levels of
private debt did not lead to a deterioration of
banks' balance sheets and the share of non-
performing loans remains very limited.
The post-crisis potential growth slowdown is
likely to be partly persistent but signs of
recovery are present. Potential growth has fallen
post-crisis and is not expected to return to pre-
crisis growth rates in the medium term as growth
of labour productivity is expected to remain
subdued. Losses in export market shares and costs
competitiveness have decelerated. Private debt as a
share of GDP is rising but a slower rate, both for
non-financial corporations and households.
Government debt is expected to grow at a
decelerated pace over the 2016-2018 period and to
be stabilised afterwards.

3. Summary of the main findings from the MIP in-depth review
13
The government has shown determination to
restore the competitiveness of the economy.
Following a strong push from the government,
social partners agreed on measures to improve cost
competitiveness especially on the front of labour
costs and to enhance the resilience of firms
through more flexible wage setting practices.
Measures have been taken also to contain the
incentives for taking up excessive mortgage debt.
Table 3.1: MIP Assessment Matrix (*) Finland 2017
(Continued on the next page)
Gravity of the challenge Evolution and prospects Policy responses
Competitiveness The loss of competitiveness has led
to a loss in Finland's export market
shares, which fell by 6.6% in 2015.
The cumulative loss of export
market shares in the five years to
2015 was 20.5% while market
shares had declined significantly
already before then. This
contributed to negative or modest
GDP growth and job losses.
In 2015 the market share loss
accelerated as real goods exports
fell by 2.2% but in 2016 exports
are expected to have grown again.
From 2017, improved cost
competitiveness is expected to
support export growth.
The Competitiveness Pact includes
measures that are expected to lower
wage costs by 4%. Social partners
signed the Pact in summer 2016
and it comes into effect as of 2017.
The change in nominal unit labour
costs over the past three years was
3.6% cumulatively. Since 2005
Finland's nominal unit labour costs
have increased cumulatively by
about 28% while in euro area, unit
labour costs increased on average
by about 16%.
In 2015 nominal unit labour costs
increased only by 1% and they are
expected to increase by 0.6% this
year. In 2017 unit labour costs are
expected to fall by 1.2% in
accordance with the
Competitiveness Pact.
In 2017, negotiated wages will be
frozen and annual working time
increases by 24 hours without
compensation.
High productivity sectors have
declined and the share of low-
productivity services in the
economy continues to increase,
leading to negative or low
aggregate productivity growth.
The government's entrepreneur
package include a subsidy for one-
person companies to hire a worker,
a reform in unemployment
insurance to make it more
conducive to becoming an
entrepreneur, a review of measures
that guide the recruitment of
foreign specialists and the creation
of public database of inventions
that everyone can access and
exploit.
The manufacturing industries have
lost about 87000 jobs or 21% since
2008; in 2015 real value added was
about 30% below 2008 level. Paper
and electronics account for bulk of
the losses of value added, but also
other technology industries have
reduced staff and production.
Over the recent years, the decline
in manufacturing has slowed down
and is expected to have bottomed
out in 2016. The outlook for 2017
looks positive but tepid.
The Innovation vouncher was
launched in 2016 to promote
innovation and product
development among SMEs.
Private and public sector debt Private sector debt amounted to
155.7% of GDP in 2015.
In early 2016 the NFC turned into
passive deleveraging mode while
increase in the debt-to-GDP ratio
has recently slowed down. Overall,
the private sector debt ratio is
expected to have stabilised in
2016.
In 2016 FIN-FSA introduced a
maximum loan-to-value ratio of
90% for housing loans (95% for
first time buyers).
Imbalances

3. Summary of the main findings from the MIP in-depth review
14
Table (continued)
(*) The first column summarises "gravity" issues which aim at providing an order of magnitude of the level of imbalances. The
second column reports findings concerning the "evolution and prospects" of imbalances. The third column reports recent and
planned relevant measures. Findings are reported for each source of imbalance and adjustment issue. The final three
paragraphs of the matrix summarise the overall challenges, in terms of their gravity, developments and prospects, policy
response.
Source: European Commission
Households' debt-to-gross
disposable income was 112.3% in
2015. Households' debt-to-GDP
ratio was 66.9% and households'
net-financial asset position was
72% of GDP in 2015.
Nominal house prices, the main
driver for households' debt, have
been rather flat over the recent
years. In real terms, house prices
have been gradually declining.
Increasing activity in construction
and the latest house price data
point to gradually increasing
nominal prices in the short-run.
However, house prices in the
capital city region are significantly
higher than in the rest of the
country and have also continued to
increase.
A 10% minimum level for the
average risk weight on housing
loans will be introduced on July
2017 at the latest for banks that
have adopted the Internal Ratings
Based Approach.
Given fixed monthly mortgage
payments, most households are
protected from future
normalisation of reference market
interest rates for mortgages.
The Finnish banking system has
remained well capitalised and
fairly profitable despite the overall
weakness, and the share of non-
performing loans is among the
lowest in the EU.
Non-financial corporations' (non-
consolidated) debt was about 116%
of GDP and their net financial
asset position stood at -128.9% in
2015.
Non-financial corporations
increased their foreign lending in
2015 but a notable part of the
increased debt consisted of intra-
group loans.
Public debt was 63.5% of GDP in
2015.
The debt has increased since 2008
and is expected to rise to 66.5% of
GDP by 2018.
The government programme
outlines consolidation measures for
2016-2019 and has a target of
putting the government debt-to-
GDP ratio on a downward path as
of 2019.
Conclusions from IDR analysis
● Finland has experienced competitiveness losses in a context of sectoral restructuring and increasing debt in the private sector. Government debt has
also increased, though remaining below euro-area average. Growth remains weak in a context of subdued export demand. Despite high private debt, the
financial sector is well capitalised and the level of NPLs among the lowest in the EU.
● Following a strong push from the government, social partners agreed on measures to improve cost competitiveness especially on the front of labour
costs and to enhance the resilience of firms through more flexible wage setting practices. Measures have been taken also to contain the incentives for
taking up excessive mortgage debt.
● Losses in export market shares and costs competitiveness have decelerated. Private debt as a share of GDP is rising but a slower rate, both for non-
financial corporations and households. Government debt is expected to continue to increase over the 2016-2018 period at a slowing pace on the back of
improving budgetary figures.

15
4.1.1. FISCAL POLICY* (5)
Finland's public debt has increased from about
30% in 2007 to above 60% in 2016. Policy
makers have faced the difficult task of striking a
balance between the need to respect the fiscal rules
and the need to support economic growth during
the years of recession or very low growth. In this
period, the medium-term budgetary objective was
mostly not met. Instead, the country cushioned the
rapid fall in revenues by borrowing (Graph 4.1.1).
The Commission forecasts the debt-to-GDP ratio
to increase also in 2016-2018.
Graph 4.1.1: General government deficit 2002-2015,
% of GDP
Source: National Accounts
Public debt has increased due to relatively high
primary deficits and because the pension funds
that have budgetary surplus do not invest into
government debt. Primary deficits have resulted
from a fall in government revenues after the crises
while expenditures kept growing, driven by social
protection and healthcare. The stock-flow
adjustment is driven by the fact that the statutory
earnings-related pension system within the general
government sector is partially pre-funded and in
surplus. The surplus of the statutory earnings-
(5) An asterisk indicates that the analysis in the section
contributes to the in-depth review under the MIP (see
Section 3 for an overall summary of main findings).
related pension system was 1.3 % of GDP in 2015.
. According to the OECD statistics (6), Finland’s
general government net financial assets are
expected to amount to 52.0 % of GDP in 2016,
second highest among the OECD countries (most
countries have large net liabilities).
Graph 4.1.2: General government expenditure by function
and revenue (% of GDP)
Source: Statistics Finland
Risks to the development of the gross debt ratio
stem mainly from the macroeconomic
developments, low real and nominal growth.
Risks related to various guarantees issued by the
government seem contained as these are related to
a large number of diverse companies and not
concentrated to particular companies or sectors.
4.1.2. LONG-TERM SUSTAINABILITY
Fiscal sustainability analysis points to a high
sustainability challenge over the medium term.
Based on the Debt Sustainability Monitor, Finland
does not appear to face risks of fiscal stress over
the short term (within one year). Over the long-
term, it can be classified as a medium risk country
(European Commission 2017). The medium-term
risk is however high, because under the baseline
scenario, structural primary balance should
improve by 2.1 pps over 5 (post-forecast) years to
reach a 60 % public debt-to-GDP ratio by 2031.
This rather high adjustment requirement takes into
account the current debt level and the required
financing for additional expenditure arising from
(6) Statistical annex of the OECD Economic Outlook (June
2016)
-8
-6
-4
-2
0
2
4
6
Central government Local government
Social security funds General government
0
10
20
30
40
50
60
70
Social protection
Education
Health
Other
Economic affairs
General publicservices
Revenue
4. REFORM PRIORITIES
4.1. PUBLIC FINANCES AND TAXATION

4.1. Public finances and taxation
16
an ageing population. The debt sustainability
analysis shows that the debt ratio would be still
increasing at the end of the 10-year projection
period under all sensitivity test scenarios. The
probability of debt ratio being higher in 2021 than
in 2016 is 80 %.
The existing sustainability challenges are well
recognised by policymakers and measures to
address them have been adopted or are being
discussed. From January 2017, a pension reform
will enter into force. The earliest pensionable age
will increase from the current 63 years by 3
months for each age cohort, until it reaches 65
years in 2027. Thereafter the link with life
expectancy will be introduced, so that the time
spent working in relation to the time spent in
retirement will be fixed at the 2025 level. The
national authorities project that the pension reform
will have a positive annual growth impact of 0.1 %
on GDP from 2020 onwards, as the supply of
labour increases. The direct fiscal effect on the
primary balance is projected to be -0.1 % in 2017
(due to the lowering of pension contributions).
However the total positive impact upon primary
balance is expected to reach 0.6 % by 2030. It is
estimated by the national authorities that the
reform will lower the S2 sustainability indicator by
1pp.
The reform of social and health services is
expected to increase the sustainability of the
health and social system. Pressure on costs arises
from the ageing population. The main objective of
the reform is to secure the delivery and adequate
access to health and social services while keeping
cost increases under control. Although the reform
will not provide immediate savings, it has the
potential to curb the speed of expenditure increases
(currently health care expenditure grows at 2.4 %
in real terms per year and the reform would reduce
the growth to 0.9 %). All responsibility for health
and social will shift from the municipalities to 18
counties from 1 January 2019. The first batch of
draft bills went through public consultation in
autumn 2016. The draft legislation to regulate the
freedom of choice for the patients, is now
undergoing public consultation. The new system
separates the organisation and provision of health
services and will allow patients to choose their
social and health care providers from public,
private and third sector service providers. There
could be considerable challenges in organising the
freedom of choice in a way which does not
increase costs or result in cherry-picking of easy-
to-treat patients. Different models of freedom of
choice will be piloted in five areas in 2017.
The reform is expected to also address some of
the existing challenges related to the social care
system. Access to services is currently uneven and
the proportion of people reporting unmet medical
care needs due to the waiting time is far above the
EU average (3.2 % in Finland vs 1.1 % in the EU).
The current organisation of the healthcare system
results in a strong contrast between occupational
healthcare with fast access and public healthcare
with long waiting lists. At the same time the need
for social and health services is growing as the
population ages. The occupational health care
system is envisaged to remain in place in the new
system. The Finnish long-term care (social care)
system faces serious challenges such as the high
demand for care, the need to ensure that resources
are directed at those that need care the most and
can least afford it, and fragmented governance.
The reform will also change the local
administration system. It will shift responsibility
and resources from the municipalities to the
counties that will be created on top of the
municipalities. A high number of employees will
be transferred from the municipalities to the new
counties. The counties have also other duties in
addition to social and health tasks such as
organising the public employment services in
addition to social and healthcare related tasks. The
funding will come in the form of government
transfers as the counties will not be able to levy
taxes. As employment shifts from municipalities to
the regions, the capability of municipalities is
likely to be at least temporarily weakened. A
temporary administration will start preparing the
launch of activities in July 2017, when laws come
into force following the completion of the
parliament process expected to last until spring
2017. Elections for the new county councils will
be held in the spring 2018 and the new counties
will start to operate from the beginning of 2019.
4.1.3. FISCAL FRAMEWORKS
The central government fiscal framework is tied
to multiannual expenditure ceilings. To date, the
framework has proved to be effective. At the

4.1. Public finances and taxation
17
beginning of the government’s term, the
expenditure ceilings are set for a four year period
according to the government’s fiscal policy.
Thereafter, each spring the government updates the
limits on central government spending for the
remaining years of its term, establishing the
multiannual financial framework. The ceilings are
set in real terms. The framework includes built-in
automatic stabilisers, as some spending, such as
unemployment expenditure or interest payments,
falls outside its scope.
Neither nominal-balanced-budget requirements
nor limits on annual deficits are included in the
legislation. Following the ratification of the fiscal
compact, a structural balance rule has been turned
into national legislation. In autumn 2016, the
government initiated legislative changes to remove
government discretion on whether to launch the
automatic correction and implement the ‘comply
or explain’ principle, so that the government will
in the future need to automatically respond to the
observations of the Fiscal Council.
The National Audit Office has been entrusted
with the responsibilities of the Fiscal Council
while the Ministry of Finance remains
responsible for forecasting. The National Audit
Office monitors the implementation of the fiscal
rules, in particular the compliance with the
medium-term budgetary objective. The
macroeconomic forecasts underlying the stability
programme and the draft annual budget are
prepared by the Department of Economics within
the Ministry of Finance. Finland is the only euro
area Member State that has designated a Ministry
of Finance department as the independent forecast
producer referred to in the two pack(7).
4.1.4. TAXATION
Finland remains a relatively high tax country.
In 2015, the tax burden was about 44.1 % of GDP,
slightly higher than in 2014 when it was at 44.0 %.
In 2016, the tax burden is expected to be broadly
unchanged. The 2017 budget includes tax
measures which are expected to contribute to a tax
(7) A pair of regulations that apply to euro area Member
States. They strengthen economic coordination by requiring Member States to submit draft budgetary plans
and introduce enhanced surveillance for those facing severe
financial difficulties.
shift from labour towards more growth-friendly tax
bases.
Personal income tax, employer and employee
social contributions are to be reduced as part of
the reform measures to increase cost-
competitiveness. Personal income tax cuts will be
implemented through cuts of all tax rates and
through increased deductibility of earnings from
taxable expenditure. However, assessments of a
package of various tax measures show that the
impact on the disposable income will be the
smallest among low income earners and is likely to
have no impact on inequality. (8) The measures
lead to a fall in general government revenues as of
2017 but the Competitiveness Pact also eases cost
pressures in the public sector.
Securing investment that meets the long-term
needs of the economy remains a challenge.
While investment levels remain slightly above the
EU average, they have been declining during the
recent years. The share of private investment is on
average lower than elsewhere in the EU. The
Ministry of Finance has appointed an expert group
to review the level and structure of corporate
taxation to assess how it could best contribute to
competitiveness, growth and productivity. The
mandate of the expert group covered various
aspects of corporate taxation, including its impact
on financing, investment and R&D. The group will
also review the economic effects of taxation of
dividends and other taxes on financial products.
The group’s work will be supported by a research
project coordinated by the VATT and ETLA
research centres. The researchers have produced a
report analysing the various options to improve the
system (Prime Minister’s Office 2016). The report
should be finalised by the end of 2017 and is
expected to include specific policy
recommendations.
Some features of the tax system may discourage
companies from growing. Under Finnish tax
legislation 85 % of dividends received from
publicly listed companies are taxable income for
the shareholder. The taxation of dividends received
from non-listed companies however depends on
the net assets that a company holds. As long as the
(8) Legislative proposal HE 135/2016 Hallituksen esitys
eduskunnalle vuoden 2017 tuloveroasteikkolaiksi sekä laiksi tuloverolain muuttamisesta

4.1. Public finances and taxation
18
dividend remains below 8 % of net assets and
below 150 000 euros, 75 % of this dividend is
considered to be non-taxable revenue. The tax-
exempt part falls to 25 % as regards dividends
exceeding 8 % of net assets. If the dividend
remains below 8 % of net assets but exceeds 150
000 euros, the tax-exempt part is 15 %. Such
artificial thresholds may provide incentives to
engineer the capital position of the company and
the amount of dividends paid so that the tax
advantage can be used to the maximum (ETLA
2014). It may also discourage companies from
growing and/or listing their shares on a stock
exchange.
Environmentally-harmful subsidies remain in
place in the traditional sectors of the economy.
Most of these subsidies are provided through the
tax system in the form of exemptions and reduced
rates on specific industrial activities and fuels.
Their annual impact has been estimated by the
Ministry of Environment, in co-operation with the
Ministry of Finance, at 1.5 % to 2 % of GDP. The
government reintroduced as of 2017, tax refunds
for the mining industry which were removed in
2015. In addition, the government has proposed to
introduce a new subsidy to compensate energy
intensive industries for indirect expenses incurred
from emissions trading. From 2017 to 2019, the
net annual revenue impact of this new subsidy is
expected to amount to 43 million euros per year
and reach 46 million euros in 2020. The revenues
from environmental taxation are above the EU
average, but are on a decreasing trend (see Graph
4.1.3).
Graph 4.1.3: Share of environmental taxes in GDP, selected
EU countries
Source: European Commission
1.80
2.30
2.80
3.30
3.80
4.30
4.80
2005 2006 2007 2008 2009 2010 2011 2012 2013 2014
EU
Denmark
Germany
Italy
Netherlands
Finland
Sweden

19
4.2.1. BANKING SECTOR
The Finnish banking system has remained
strong and stable despite the overall weakness
in the economy and the record low interest rate
environment. Short-term risks to financial
stability are low despite the high level of
households’ indebtedness. Finnish lenders remain
remarkably well capitalised and have high loss
absorption capacity. Their asset quality is among
the highest in the EU. The banking sector is large
and concentrated: the assets are equal to about
300 % of GDP and the three largest banks control
the market. Areas that remain potential sources of
risk are the strong regional interconnections with
other Nordic and Baltic countries and the
dependence on wholesale funding.
Lending to the private sector remains on a
stable growth trend. In general, the banking
system has rapidly passed on the record low
interest rates to the real economy. By June 2016
lending to firms grew by 4.2 % year-on-year, while
the mortgage loans segment increased by 2.6 %
year-on-year. These positive credit developments
also reflect improving levels of consumer
confidence, in particular an increasingly
favourable view of consumers regarding their
personal finances and expectations about future
purchases, which has supported retail sales and the
housing market in 2016.
Table 4.2.1: Key banking sector indicators
Source: ECB, CBD
The relatively high reliance of banks on
wholesale funding entails a contingent
refinancing risk. Finnish banks rely heavily on
wholesale funding and, alongside the public sector,
are the largest issuers of debt securities. The
banking system-wide loan-to-deposit ratio is
relatively high at close to 140 %. The share of
private sector deposits in the domestic banking
system represents 34 % of total liabilities and is
much lower than the euro area’ average of 54 %. It
is compensated by the system’s higher reliance on
debt issuance (market funding), external liabilities
(market funding outside the euro area) and
remaining liabilities (mainly the derivative
portfolio of the Nordea group). Banks maintain
large portfolios of liquid assets available for sale to
generate emergency cash. Wholesale funding,
especially with short term and foreign currency
instruments, may be a volatile funding source, in
particular during adverse market conditions.
However, banks can have strategies to mitigate this
risk such as liquidity buffers.
Financial soundness indicators show that the
financial system is in good condition. This is
despite low interest rates and the difficult
macroeconomic environment. Banks are well
capitalised: at the end of 2015 the average Tier 1
capital ratio was 22.4 %, one of the highest in the
EU. Tier 1 instruments account for the majority of
the capital (see Table 4.2.1) on the system’s
aggregate balance sheet. The high level of capital
was also reflected in the good results achieved by
the largest banks operating in Finland in the 2016
European Banking Authority stress test, where the
capital levels of the largest lenders remained good
in both the baseline and in the stress scenario. The
average quality of bank assets is very high in
comparison to other EU countries: the ratio of non-
performing loans to gross loans was just 1.3 % in
December 2015 whereas the EU average was close
to 6 %. The sector also performs well in terms of
profitability. In 2015, return on equity (8.3 %) and
return on assets (0.5 %) were much above the euro
area average (4.4 % and 0.3 %, respectively).
Nonetheless, the exceptionally low interest rate
level puts a strain on banks’ net interest income,
typically the core item in banks’ profits – the net
interest income dropped by about 5 % from the
2014 level in 2015. However, the Finnish banks
have controlled their costs more efficiently than
their euro area peers.
At the beginning of 2017, Nordea Bank, a
Swedish bank, converted its Nordic subsidiaries
into branches. The local Nordea Banks are
systemically important in each of the four Nordic
countries. From now on, the supervision of Nordea
Bank Finland is the responsibility of Sweden’s
financial supervisory authority. In Finland, Nordea
is one of the biggest banks, with a market share of
close to 30 % in lending and deposit taking. Unless
there is increased collaboration between the
Finnish and Swedish supervisors, the change may
seriously constrain the Finnish authorities’ insight
2010 2011 2012 2013 2014 2015
Non-performing loans 0.9 0.8 0.8 0.7 1.4 1.3
Coverage ratio - - - - 36.0 37.9
Loan-to-deposit ratio* 139.3 142.3 139.9 139.2 139.6 136.7
Tier 1 ratio 14.7 15.2 18.1 16.9 16.6 22.4
Return on equity 6.8 7.6 8.9 8.1 9.1 8.3
4.2. FINANCIAL SECTOR

4.2. Financial sector
20
into the business of one of the largest financial
institutions in the country, and its ability to carry
out macroprudential policy. To deal with the new
situation, the Nordic financial supervision
authorities and the ECB have agreed on
arrangements concerning information sharing,
supervisory responsibility and cooperation,
macroprudential policy, depositor protection and
recovery and resolution planning (9).
Graph 4.2.1: Banks’ costs-to-income ratio, %
Source: European Commission
4.2.2. ACCESS TO FINANCE
Equity is the main source of financing for
Finnish companies. Nasdaq Helsinki Oy stock
exchange, which is part of the Nordic OMX-
Nasdaq exchange, is very deep. In 2015, the total
stock of listed shares issued by firms increased to
74 % of GDP from 68 % in the previous year
Recently crowdfunding has gained popularity. The
Ministry of Finance estimates that crowdfunding
(9) Memorandum of Understanding between
Finansinspektionen (Sweden), Finanstilsynet (Norway), Finanstilsynet (Denmark), Finanssivalvonta (Finland) and
the ECB on prudential supervision of significant branches
in Sweden, Norway, Denmark and Finland of 2 December 2016; Memorandum of Understanding between the
Finnish, Norwegian and Swedish Ministries of Finance and
the Danish Ministry of Business on cooperation regarding significant branches of cross-border banking groups of 9
December 2016; Memorandum of Understanding on
Cooperation regarding Banks with Cross-Border
Establishments between the Central Banks of Denmark,
Estonia, Finland, Iceland, Latvia, Lithuania, Norway and
Sweden of 15 December 2016.
roughly doubled to about 150 million euros in
2016. The Crowdfunding Act, regulating the
market, came into force in September 2016. In
more traditional growth-company financing,
venture capital investment was 122 million euros
in 2015 (FVCA, 2016). As a share of GDP,
venture capital investment in Finland is one of the
highest in the EU and twice as high as the EU
average. While SMEs depend mainly on equity
and bank financing, big corporations have a wider
variety of financing at their disposal. Overall,
market debt funding of non-financial corporations
increased until 2013, when it reached 18 % of
GDP, but fell during the subsequent years to
31 billion euros or 15 % of GDP in 2015, just
below the EU average.
SMEs’ access to finance is good. Following a
decline of more than 40 % from 2008 to 2014 —
due to lower demand, tighter credit conditions,
solvency problems in some companies, and other
factors — lending to SMEs grew by 26 % from
2014 to 2015, reaching the highest proportion of
total bank lending since 2007. Recently, the stock
of long-term loans to non-financial corporations
has been increasing faster than shorter maturity
loans, indicating that SMEs borrow for investment
rather than for working capital (see Graph 4.2.2).
Despite the good overall picture, some obstacles
such as lack of collateral might prevent some
SMEs from using external financing. In a recent
survey, 10 % of SMEs signalled that they had not
applied for financing during the past year although
they would have needed it (10
) (Yrittäjät, 2016).
The public sector complements market funding.
The government growth financing and export
guarantee vehicle Finnvera complements the
supply of finance for SMEs, providing funding for
expansion and internationalisation. Recently the
government has directed more resources towards
start-ups and SMEs via Finnvera and increased the
fund’s capacity for export guarantees. Roughly one
SME in five turns to Finnvera rather than the
banking system for financing (Yrittäjät, 2016).
However, given the abundant or low cost
financing, not all economically or financially
unviable companies exit the market. These
companies continue to tie up capital and the labour
(10) In the same survey, only 4 % of respondents indicated that
they had received a negative financing decision on their loan application.
30
40
50
60
70
80
08 09 10 11 12 13 14 15
Finland Euro Area

4.2. Financial sector
21
force preventing a more efficient resource
allocation (OECD, 2016e).
The EU funds foster financing to Finnish SMEs.
In September 2016, an agreement was reached on
the implementation of the SME initiative. By
combining national budget funding with 40 million
euros of its European Structural and Investment
Funds and Horizon 2020 funding, to be leveraged
with commercial banks through a risk-sharing
mechanism, Finland expects the initiative to
release 400 million euros of new SME financing
(TEM, 2016). The European Fund for Strategic
Investment has also contributed towards the
investment projects. The Investment Plan for
Europe has already benefited around 300 Finnish
SMEs via a financing agreement amounting to 75
million euros (European Commission et al, 2016).
Graph 4.2.2: Growth of banks’ loans to non-financial
corporations, %, y-o-y, 2004q1-2016q3
Source: Bank of Finland, European Commission
4.2.3. HOUSING MARKET
The fall in house prices bottomed out in 2016.
House prices fell during 2014 and 2015 in both
nominal and real terms and are not currently
thought to be over or under valued. The house
prices-to-salary index or house prices-to-rents
ratios are close to their long run averages (see
Graph 4.2.3). Recently rents have been increasing
rapidly especially in attractive urban regions such
as the capital city region, where the demand for
small apartments has been increasing. In the course
of 2016, nominal house prices have started to
increase in the capital city region while they
remained flat in rest of the country. The European
Systemic Risk Board (ESRB) issued a warning to
Finland (as well as to seven other Member States)
in November 2016 on the medium-term
vulnerabilities of the residential real estate sector
as a source of systemic risk to financial stability.
The ESRB highlighted the fact that household debt
is not evenly distributed across households and
that a possible materialisation of risks could have
large spill-over effects to neighbouring countries
through the Baltic-Nordic banking sector.
Graph 4.2.3: Relative house prices, Finland
(1) Data until June 2016
Source: Bank of Finland, European Commission
4.2.4. PRIVATE INDEBTEDNESS*
Non-financial corporate debt increased rapidly
in 2015, but since then the rate of increase has
levelled off. Foreign counterparts account for
roughly one-third of Finnish non-financial
corporations’ liabilities (e.g. bonds, loans,
shareholder equity), the remaining liabilities are
accounted for by domestic counterparts. Non-
financial corporations’ foreign liabilities increased
altogether by about 14 % in 2015 while domestic
liabilities remained broadly unchanged. The main
drivers for foreign liabilities were intra-group
loans and the increase in foreign direct
investments. Since this recent increase in liabilities
-50
-40
-30
-20
-10
0
10
20
30
40
50
60
2004 2006 2008 2010 2012 2014 2016
Up to 1 year
Over 1 and up to 5 years
Over 5 years
70
90
110
130
150
170
190
210
81 84 87 90 93 96 99 02 05 08 11 14
House prices-to-CPI ratio
House prices-to-rents ratio
House prices-to-rents ratio, LR average
House prices-to-salary index ratio
House prices-to-salary index ratio, LR average
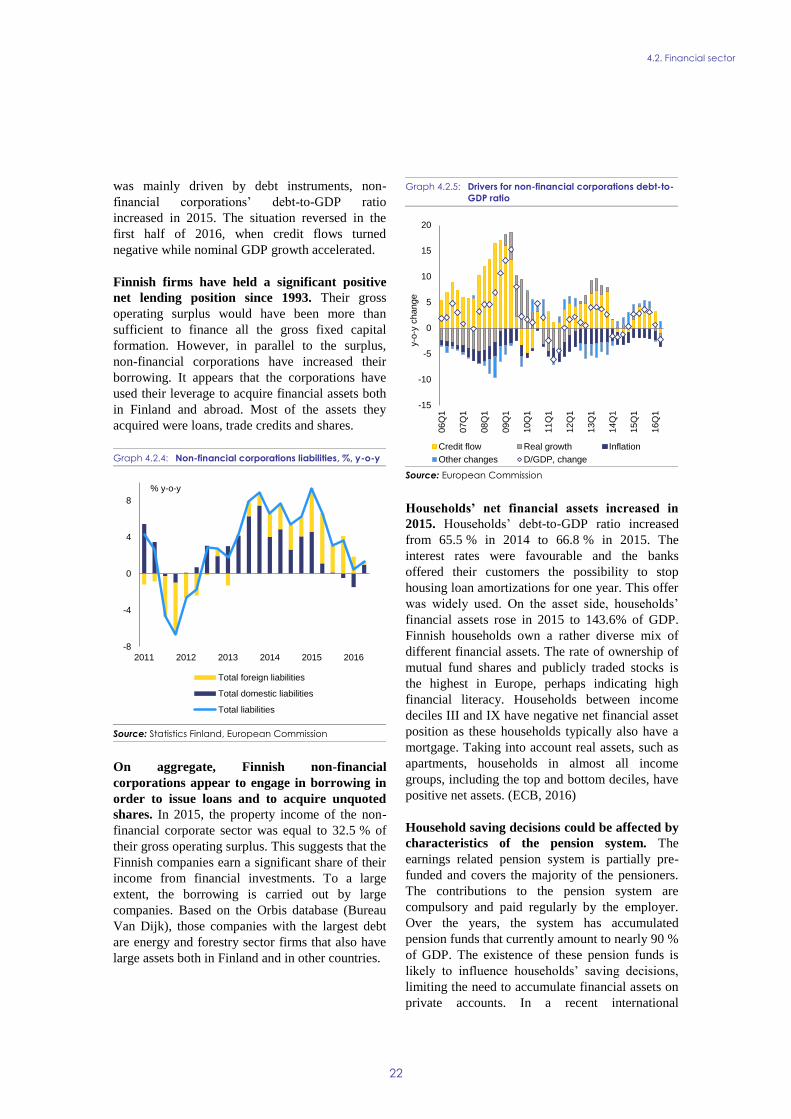
4.2. Financial sector
22
was mainly driven by debt instruments, non-
financial corporations’ debt-to-GDP ratio
increased in 2015. The situation reversed in the
first half of 2016, when credit flows turned
negative while nominal GDP growth accelerated.
Finnish firms have held a significant positive
net lending position since 1993. Their gross
operating surplus would have been more than
sufficient to finance all the gross fixed capital
formation. However, in parallel to the surplus,
non-financial corporations have increased their
borrowing. It appears that the corporations have
used their leverage to acquire financial assets both
in Finland and abroad. Most of the assets they
acquired were loans, trade credits and shares.
Graph 4.2.4: Non-financial corporations liabilities, %, y-o-y
Source: Statistics Finland, European Commission
On aggregate, Finnish non-financial
corporations appear to engage in borrowing in
order to issue loans and to acquire unquoted
shares. In 2015, the property income of the non-
financial corporate sector was equal to 32.5 % of
their gross operating surplus. This suggests that the
Finnish companies earn a significant share of their
income from financial investments. To a large
extent, the borrowing is carried out by large
companies. Based on the Orbis database (Bureau
Van Dijk), those companies with the largest debt
are energy and forestry sector firms that also have
large assets both in Finland and in other countries.
Graph 4.2.5: Drivers for non-financial corporations debt-to-
GDP ratio
Source: European Commission
Households’ net financial assets increased in
2015. Households’ debt-to-GDP ratio increased
from 65.5 % in 2014 to 66.8 % in 2015. The
interest rates were favourable and the banks
offered their customers the possibility to stop
housing loan amortizations for one year. This offer
was widely used. On the asset side, households’
financial assets rose in 2015 to 143.6% of GDP.
Finnish households own a rather diverse mix of
different financial assets. The rate of ownership of
mutual fund shares and publicly traded stocks is
the highest in Europe, perhaps indicating high
financial literacy. Households between income
deciles III and IX have negative net financial asset
position as these households typically also have a
mortgage. Taking into account real assets, such as
apartments, households in almost all income
groups, including the top and bottom deciles, have
positive net assets. (ECB, 2016)
Household saving decisions could be affected by
characteristics of the pension system. The
earnings related pension system is partially pre-
funded and covers the majority of the pensioners.
The contributions to the pension system are
compulsory and paid regularly by the employer.
Over the years, the system has accumulated
pension funds that currently amount to nearly 90 %
of GDP. The existence of these pension funds is
likely to influence households’ saving decisions,
limiting the need to accumulate financial assets on
private accounts. In a recent international
-8
-4
0
4
8
2011 2012 2013 2014 2015 2016
Total foreign liabilities
Total domestic liabilities
Total liabilities
% y-o-y
-15
-10
-5
0
5
10
15
20
06Q
1
07Q
1
08Q
1
09Q
1
10Q
1
11Q
1
12Q
1
13Q
1
14Q
1
15Q
1
16Q
1
y-o
-y c
hange
Credit flow Real growth Inflation
Other changes D/GDP, change

4.2. Financial sector
23
comparison, the Finnish pension system was
ranked on top especially in reliability and
transparency (Melbourne Mercer Global Pension
Index, 2016).
Graph 4.2.6: Drivers for households’ debt-to-GDP ratio
Source: European Commission
While the amount of non-performing loans in
the banking sector remains low, other
indicators show some signs that require
monitoring. The number of private loan
restructuring applications was on an increasing
path since 2008 until 2016 when the number of
applications decreased slightly. The number of
distraint cases peaked in 2013 and has been
declining since then. However, at the end of 2016,
the number of people who had been flagged in the
database of credit information company
Asiakastieto, as having problems to fulfil their
financial obligations, was about 1 % higher than
one year earlier, reaching 8.7 % of the adult
population. The population group with most
problems are males aged 25 to 44. Amongst this
group, about 15 % were black-listed in the
database.
Graph 4.2.7: Loan restructuring, debtors in enforcement
Source: Statistics Finland, European Commission
Measures to limit the risks related to household
debt have been introduced. In June 2016, a
maximum loan-to-value ratio for housing loans
was introduced, at 90 % (95 % for first time
buyers). A 10 % minimum average risk weight for
housing loans will be introduced in July 2017 for
banks that have adopted the Internal Ratings Based
Approach (IRBA). The minimum level of the risk
weight was increased because the risk weights
based on the IRBA are low in Finland by
international comparison and vary significantly
between credit institutions. The decision is
expected to strengthen banks’ capital adequacy and
to reduce the demand for housing loans through an
increase in interest spreads. The tax deductibility
of interest payments on housing loans has been
gradually reduced. In 2014, 75 % of interest
payments were deductible. In 2017, the deductible
share will decrease to 45 % and in 2018 stand at
35 %. These measures are expected to constrain
the growth of households’ debt.
-6
-4
-2
0
2
4
6
8
10
06Q
1
07Q
1
08Q
1
09Q
1
10Q
1
11Q
1
12Q
1
13Q
1
14Q
1
15Q
1
16Q
1
y-o
-y c
hange
Credit flow Real growth Inflation Other changes D/GDP, change
400
420
440
460
480
500
0
1000
2000
3000
4000
5000
05 06 07 08 09 10 11 12 13 14 15
Private loan restructurings
Business loan restructurings
Corporate bankruptcies
Debtors in enforcement - natural persons, 1000 (rhs)

24
4.3.1. LABOUR MARKET POLICIES
As the economy has turned to growth,
employment has started to increase and
unemployment has started to decrease. Long-
term unemployment, however, increased by 13 %
and very long-term unemployment by 18 % year-
on-year in 2016. (Ministry of Economic Affairs
and Employment, 2016a). The activity rate among
the 25-39 age group has declined since 2005, in
contrast to the EU average, where it has increased.
The rate is now below the EU average. Those who
would like to work but are not seeking
employment have increased, from 93 000 in 2008
to 152 000 in 2015 (63 % increase v 12 % at EU
level). Disincentives to accept work and sluggish
mobility between sectors and regions remain a
challenge and can be a source of mismatches
between labour supply and demand. Promoting job
creation and the integration of those furthest away
from the labour market (for example young not in
employment, education or training, non-EU
nationals) are major challenges for the Finnish
labour market.
Restructuring of the labour market is
underway. Manufacturing, which had one of the
highest shares in employment in the EU, showed
more than a 21 % decline in jobs between 2008
and 2015, due to a weak export performance.
Other sectors have showed stable or growing
headcounts: employment in services grew by
1.5 % over the same period, reflecting a
restructuring towards services in the economy and
in employment. The latest forecast from the
Ministry of Economic Affairs and Employment
(Ministry of Economic Affairs and Employment
2016c) shows that the labour demand would
increase by 30 000 employees in total over 2016
and 2017, with construction and services
contributing with respectively 15 000 and 20 000
additional employees.
There has been a decline in macroeconomic
skill mismatches.(11
) That was partly due to a
decrease in the share of low-skilled workers, even
though their employment situation is worsening.
Employment rates for different education levels
(11) The main indicators of macroeconomic skills mismatch in
this analysis are dispersion measures of employment rates across skill groups. This is to proxy the gap between the
skills that the working age population has and the skills
needed (or used) in the economy.
have declined over recent years but more markedly
so for low-skilled (12
). This decline could be due to
the retirement of less educated workers and cohort
effect in the context of relatively stronger demand
for high skills. At the same time, long distances
and shortages of affordable housing in areas of
high labour demand do not facilitate commuting
and mobility and can be a source of mismatch
between labour supply and demand. That is the
case even if the regional dispersion of
unemployment and employment rates does not
look high in a cross country perspective. (13
)
Graph 4.3.1: Key labour market indicators
Activity rate and Employment rate as % of total population
(20-64)
Unemployment rate and long-term unemployment rate as %
of labour force (15-74)
Youth unemployment rate as % of labour force (15-24)
NEET: Not in employment, education or training as % of
population (15-24)
Source: European Commission
Open vacancies stand at relatively high levels.
The ratio of open vacancies to employment stands
currently at a high level. The open vacancies-to-
employment ratio was in 2016 almost as high as in
2007 but the unemployment rate was two
percentage points higher. This may flag
mismatches between labour demand and supply or
low attractiveness of certain offer or little
incentives to take up certain jobs. Labour shortages
are more visible in certain sectors: real estate,
professional activities, administration and support
(12) Skills are proxied by the maximum educational level
attained. For more details, see Kiss and Vandeplas (2015) for more details on the methodology.
(13) Both NUTS 2 and 3.
77
78
79
80
81
0
5
10
15
20
25
01 03 05 07 09 11 13 15
Unemployment rate (lhs)
Long-term unemployment rate (lhs)
Youth unemployment rate (lhs)
NEET rate (lhs)
Activity rate (rhs)
4.3. LABOUR MARKET, EDUCATION AND SOCIAL POLICIES

4.3. Labour market, education and social policies
25
service activities. (14
) The employment share in
these sectors has increased over time and the share
in unemployment has declined substantially since
2008.
In the follow up to the Competitiveness Pact
(see Box 1.1), social partners agreed to prepare
a new "Finnish model" for wage-setting to
enable competitiveness. The new wage-setting
model is a move away from centralised wage-
setting. (15
) It will allow for productivity
differences to be reflected in wages across
different sectors. At the same time the wage norm
set by the tradable sector will impose a ceiling for
the other sectors. The first round of wage
negotiations under the new Finnish model will take
place in 2017 for 2018 wages, but the order of
sectorial negotiations and the degree of
coordination across sectors remain unclear. It is
envisaged that the Bank of Finland would provide
an outline of the economic situation in Finland as a
starting point for the negotiations. Overall, the
decentralization of wage-setting may have a
positive effect on employment if it shifts
adjustment to shocks from the quantity of labour to
the price of labour, and if a sufficient coordination
is ensured.
(14) These sectors are considered jointly in the analysis.
(15) The Finnish Confederation of Industries announced in 2016
that it will no longer participate in central wage-setting negotiations.
Social partners have agreed to increase the
possibilities for firm-level collective bargaining.
Possibilities for local bargaining (16
) are included
in 86 % of the current collective agreements of
organised employers (EK, 2016). About 70 % of
sectoral collective agreements contain a ‘crisis
clause’ (determining when it is possible to deviate
from their conditions on issues such as wages and
working time) and 30 % of them have a work time
bank (17
) (18
). It remains to be seen to what extent
the crisis clauses will be used in practice.
Successful local bargaining will require the
willingness and capacity to negotiate (Kröger,
Mähönen, Klemetti, Nieminen, Finnish Labour
Review 2016). The possibilities for local
bargaining included in the Competitiveness Pact
are available for organized employers as parties of
the collective agreements. The unorganized
employers have to follow those sectoral collective
agreements which have been declared as generally
binding.(19
)
Employment outcomes are hampered by
disincentives to work, as reflected by above-
average unemployment and inactivity traps
(16) These collective agreements allow for local agreement on
some issues, such as how the increase of working time in
the competitiveness pact will be implemented. (17) A flexible working time arrangement, where overtime can
be compensated by leave.
(18) All calculations are based on the membership organisations
of the Finnish Confederation of Industries (EK) and do not
include employers who are not members of EK.
(19) The employers’ organisation density is around 65 % (based on 2013 figures from Eurofound).
Box 4.3.1: Towards the Finnish wage-setting model – what are the challenges?
The challenge for the new more decentralized wage-setting system is to ensure the overall wage level is kept
in line with productivity developments, while allowing for differences in productivity across sectors. The
aim is to contribute towards improved competitiveness, economic growth and increased employment.
Theory suggests that uncoordinated sector-level bargaining can deliver undesired macroeconomic results
both in terms of employment and wage moderation (Calmfors and Driffil 1988, Calmfors 2001). This was
witnessed in Finland also in 2007-2008 when significant wage hikes were experienced as a result of sector-
level bargaining. However, more recent experiences show that global competition has a moderating impact
on wage costs also under this model (Obstbaum & Vanhala 2016, Calmfors 2001, Danthine and Hunt 1994).
Still, as a general rule, decentralisation of collective bargaining and wage-setting should also be
accompanied by reinforced coordination across the sectors in order to avoid wage hikes (Calmfors 2001,
Obstbaum & Vanhala 2016). Such coordination can also have a positive impact on employment (Obstbaum
& Vanhala 2016). The wage-setting model currently being planned in Finland is inspired by the Swedish
model, where wage agreements have been negotiated at sector level since the 1990s. Following wage hikes
in the 1990s, the wage coordination across sectors in Sweden is now conducted by the confederations of
employees organisations to ensure that all the sectors apply the wage norm set by the tradable sector
(Bergholm & Bieler 2013).

4.3. Labour market, education and social policies
26
resulting from the interplay of tax and benefits
systems. In 2015, the unemployment trap was
76.1 %, against an EU average of 69.3 % (20
). The
inactivity trap is also much higher than the EU
average (68 % v 56.1 %) (21
) suggesting that in
some cases moving into a paid job is not
sufficiently attractive. Traps are particularly high
for single parents (75.0 % v the EU average of
54.5 % for those with two children). Means-tested
social assistance and housing benefits may create
most of the disincentives to work (EC-OECD Tax
and Benefits database; Viitamäki, 2015). The
administrative complexity (bureaucratic traps)
related to the reinstating of benefits for those
moving in and out of the labour market, is also
causing barriers to work. The decision process and
the waiting period to get benefits reinstated can
take weeks. The situation is expected to improve
when the updated income register comes into force
in 2020. Meanwhile, some unemployment funds
(private or administered by the trade unions) are
making attempts to digitalise their systems to make
the application and decision process faster.
Strengthening incentives to work is the key to
increase labour market participation.
Narrowing the eligibility to some benefits,
strengthening conditionality or increased sanctions
in case of non-compliance with activation
requirements are some of the measures proposed
by the government. For instance, the participation
in active labour market policy measures will be a
condition for receiving unemployment benefits. As
of 2017, jobseekers will in some cases have to
accept work not matching their professional
background, work with lower earnings than
income through unemployment benefits, work
located within a three hours total daily commuting
time or short-term work assignments in order to
keep their benefits. The duration of the earnings-
related unemployment benefit was reduced from
500 to 400 days (from 400 to 300 days in the case
of a career shorter than 3 years) at the beginning of
2017. Positive incentives were introduced too:
(20) Measures what percentage of the gross earnings (after
moving into employment) is ‘taxed away’ by the combined effects of the withdrawal of benefits and higher tax and
social security contributions. The figure is for single
persons without children earning 67 % of the average wage when in work.
(21) Measures the financial incentives to move from inactivity
and social assistance to employment. It is defined as the rate at which the additional gross income of such a
transition is taxed.
allowing the use of basic (non-earnings related)
unemployment benefit as mobility and wage
subsidies to activate jobseekers. Unemployment
benefits can also be received while working as a
part-time entrepreneur or as start-up grants.
The introduction of in-work benefits is likely to
increase incentives to work. Some in-work
benefits were introduced in 2014 and 2015. (22
)
The initial results of these benefits show an
increase of unemployed (23
) people receiving
another income from 6.7 % in 2013 to 10.6 % in
2015 (Kela, 2015). However, there is also some
indication that the person moves to a different type
of trap, i.e. from unemployment to a low-wage
trap (24
) (Kotamäki & Kärkkäinen, 2014), in a
context where the low-wage trap is already higher
than the EU average (55.8 % against 47.3 %). In-
work benefits can result in subsidising employers
paying low wages work instead of providing
incentives to work.
Increased incentives to work bring the best
benefits when coupled with effective active
labour market policies. There are plans to use the
unemployment benefits to fund active measures
and to concentrate on the most effective measures.
Given the ongoing economic restructuring, it is
important to ensure that workers are retrained to
provide them with the skills demanded by
employers and to improve labour market matching
(Andersen & Svarer, 2011). (25
) The provision of
labour market training, designed in close
collaboration with local employers, and found to
be relatively successful, is expected to continue. In
addition, expanding the possibility to participate in
studies while receiving the unemployment benefit,
is under discussion (26
).The social partners could
play an increased role in the process of job-to-job
transitions with a stronger focus on job search
support in compensation packages (OECD, 2016).
(22) 300 EUR protected part of the unemployment benefit. For
further information, refer to the 2015 Country Report on Finland. A ministerial assessment of the impact of these
measures on employment will take place in 2017.
(23) These persons are still recorded as unemployed given the short duration of their assignments.
(24) For low wage earners seeking higher incomes a higher
proportion of their earnings would be ‘taxed away’. (25) Torben M. Andersen and Michael Svarer, Business cycle
contingent unemployment insurance, in Nordic Economic
Policy Review, 1/2011 (26) A tri-partite group is looking into this issue, the deadline
for their conclusions is in the spring 2017.

4.3. Labour market, education and social policies
27
From 2017 all unemployed will have regular
meetings with public employment services. This
new measure aims at a faster re-employment. The
government has reserved extra funding to
implement the measure. This will be done partly in
co-operation with private sector service providers.
There are plans to outsource part of employment
services when the responsibility for these services
is transferred from the municipality to the newly
created regional authorities. It remains to be seen
whether private partners will be provided with
appropriate incentives, in order to avoid
"creaming" effects (resulting in additional
disadvantage for the unemployed facing the
strongest barriers (European Job Mobility
Laboratory, 2011)), and also to ensure permanent
returns to the labour market. The long-term
unemployed in need of additional support have
been receiving increased support since 2016
through one-stop-shops providing a range of
services (social support, health services,
rehabilitation). While the coverage of long-term
unemployed is well ensured, reaching out also to
those who are inactive and not looking for work
could provide better labour market outcomes.
Some recent measures allow early retirement
for the long-term unemployed, which goes
against the objective of extending working lives.
The government is preparing a specific legislation
that allows the retirement of those long-term
unemployed who on 1 January 2016 were over 60
and who have been unemployed for more than five
years. There are some 35 000 long-term
unemployed who are over 60 and 5 300 of them
will fulfil the criteria under the new law. The
additional costs of this measure are calculated to
be approximately 16 million euros over the next
decade. As this is the second time that such
legislation is introduced (the last time was in
2005), expectations may build up that similar
possibilities will be available again in the future.
This may discourage those eligible (or expecting to
become eligible) to seek employment.
Youth unemployment and the number of young
people not in employment, education or
training declined in 2016. The unemployment
rate for those aged 15-24 declined by about 2 pps.
to 20.1 % in 2016. The share of people not in
employment, education or training increased
steadily since 2011, reaching 10.6 % of the
population aged 15-24 in 2015. In 2005-2015 (see
Graph 1.3), the employment rate for the younger
cohorts, especially men, declined more than the
average for the economy (27
). The lower
employment rates for the young highlight the
continued need for policies catered for the youth.
Budget cuts in the youth guarantee services may
affect in particular young people not in
employment, education or training.
Employment of non-EU nationals is lower than
native Finns, with the second generation also
affected. In 2015, this employment rate gap (25.4
pp) was one of the highest in the EU and was
significantly above the EU average (13.9 pp).
Women from non-EU-countries had the lowest
employment rate in the EU (35.7 %, 37.1 pps
below native Finnish women). Inactivity is the
main factor for the low employment of non-EU
women whereas unemployment is the main factor
regarding men. Overall, Finland's attractiveness for
high-skilled immigrants has been limited, which
has led to low levels of work-related immigration.
Given the magnitude of recent inflow of asylum
seekers (38.000, 0.7% of total population) and
considering the low employment rate of refugees
who had arrived before 2015, the labour market
integration of refugees is a major challenge. If
addressed well, the current inflow of refugees and
migrants provides opportunities to counter the
effects of an ageing population. Roughly one
asylum seeker in four is estimated to ultimately
receive a positive decision on their asylum
application in Finland. Language barriers as well
as lower levels of education and skills (see Section
on education) constitute obstacles to labour market
integration.
In response to an increase of asylum seekers,
the government introduced a new integration
pilot programme for migrants for the period
2016-2019. A new private sector initiative,
supported by the Ministry of Economic Affairs and
Employment and the Finnish Innovation Fund,
Sitra, aims at training and employing at least 2 000
migrants in 2017-2019. The project using the
social impact bond model offers migrants training
that will make them more attractive to employers.
Investors will fund the activities and carry the
financial risks whereas the public sector will make
the payments only if the employment objectives
are met. In addition, there have also been efforts to
(27) With the exception of young mothers

4.3. Labour market, education and social policies
28
direct European Structural Investment Funds
towards activities that enable the integration of
migrants.
4.3.2. SOCIAL POLICIES
A basic income scheme pilot has been running
since the beginning of 2017. The pilot scheme
aims at modifying the social security system to
better adjust to the changes in working life, as well
as tackling the complexity of the current benefits
system and creating incentives to accept work.
2 000 participants aged 25-58 who were receiving
the basic unemployment benefit at the end of 2016
are included in the pilot scheme. (28
) They receive
approximately 560 euros per month as basic
income (29
) without any means-testing and are able
to accept work without losing the benefit. The
experiment is expected to provide information
about individuals' responses to changes in benefit
systems. Such information could help design
possible future reforms of the social security
system.
The impact of motherhood on women’s careers
is high in Finland. The employment gap between
women with a child younger than six years and
women without children (20-49) was 15.7 pps in
2015 (30
). In 2015, approximately 84 % of mothers
(and 6.9 % of fathers) drew on the homecare
allowance. The homecare allowance is likely to
reduce labour market participation, with longer
leave periods for those with a weak labour market
attachment (Närvi, 2014, Bouget et al, 2015).
Labour market prospects are likely to have been
hampered by long periods of leave on the
homecare allowance (Thévenon and Solaz, 2013),
and the allowance is one of the potential causes of
the higher than EU average gender pay gap (31
).
These assessments of home care allowance are
limited only to the possible impact on labour
market participation of mothers, without taking
into account wider social policy objectives.
Overall, more incentives could be provided to
(28) This benefit is available for unemployed jobseekers who
have been in employment before but are not eligible for the earnings-linked unemployment benefit.
(29) This amount is equal to the basic unemployment benefit
minus tax.
(30) Almost two times the EU average (8.6 % in 2015)
(31) For further details, please refer to the European
Commission 2016 report
fathers to take leave to look after their children. In
Finland only 8.8 % of men use paid parental leave
during their lifetime, in comparison to 25.5 % in
Sweden (Employment and Social Developments in
Europe, 2015). (32
)
Improving female participation in the labour
market hinges on measures to support young
mothers' transition to work. Especially mothers
with low education and weak labour market
attachment, who are not provided with the right
incentives, would deserve attention (Närvi, 2014,
Bouget et al 2015). The parliament has amended
the law that regulates fees for childcare resulting in
lower costs especially for low income parents. The
new childcare fees will come into effect in March
2017.
There are poverty and social exclusion risks
associated with the lower labour market
attachment of some population groups, such as
the non-EU born. The employment rate of the
non-EU born is low. The non-EU born who work
register lower earnings (although the difference in
earnings is smaller than the employment rate gap)
and their in-work poverty rate is three times
higher. This results in a poverty gap (33
) of 23.3
pps, which is higher than the EU average of 17.4
pps. Also, recent reductions in the wage subsidy
scheme have had a considerable impact on the
employment prospects of those working for third
sector organisations, who tend to be among the
most vulnerable. The use of these subsidies has
fallen from 14 000 in 2007 to 4 000 persons
(SOSTE, 2016) and further cuts are planned.
4.3.3. EDUCATION AND SKILLS
Finland's education outcomes remain among
the best in the EU but continue to weaken,
particularly in science and mathematics.
According to the 2015 OECD programme for
international student assessment tests, the
proportion of low achievers in Finland is among
the smallest of the tests. However, compared to
2006, the proportion of poor performers in science
has nearly tripled while the proportion of top
(32) Parental leave in Finland refers to leave provided to look
after children from the age of 3 months to 9 months. Swedish parents are entitled to 480 days of parental leave,
of which 90 days are reserved for the father,
(33) Vis-à-vis the rest of the population.

4.3. Labour market, education and social policies
29
performers has dropped by about a third (see
Graph 4.3.2.). Performance differences between
regions have grown and the Helsinki area is doing
significantly better than rural areas. The
achievement gap between pupils with and without
a migrant background is the widest in the EU (83
points) and remains among the largest also when
adjusted for the socioeconomic status (65 points).
This translates into a learning gap of two years and
more.
Education expenditure has declined in recent
years albeit from a comparatively high level. In
2015 general government expenditure on
education was among the highest in the EU both as
a proportion of GDP (6.2 %) and as a proportion of
total general government expenditure (11.0 %).
However, education expenditure has been cut in
real terms since 2011 and the government's
programme envisages further savings. In 2019
expenditure to GDP ratio is projected at around
0.4 pps. of GDP lower than in 2015 (0.7 pps. lower
than in 2011). Reforms are being carried out to
make the education system more efficient and
effective. Skills erosion as a result of a weaker
education system will become visible only over a
longer period of time; similarly, any corrective
policy action will take time to have an impact.
Against the deterioration in the results of the
programme for international student assessment
results, and given the importance of a skilled
labour force and strong science base for future
economic growth, it is vital that cuts in education
expenditure do not lead to skills erosion.
The universities aim at increasing the transfer
of research output to the business sector.
Current government reforms seek to encourage
higher education institutions to develop a sharper
strategic focus and clearer profiles in their fields of
study. The government objectives are to shorten
the time it takes to enter higher education and to
move from graduation to work. Since the
institutions are autonomous only limited public
influence can be exerted via university financing
agreements, legislation and informal steering.
These actions fit the trend in other European
countries. For further discussion, see section 4.5.1.
The vocational education and training reform is
expected to be finalised in 2018. It aims at
making vocational education and training more
responsive to labour market needs by reducing the
number of vocational qualifications available in
Finland, broadening the qualification content and
allowing for more individual study paths. This is
expected to help reduce skills mismatches (see
Section on labour market). Initial analysis of the
impact of earlier cuts in government spending
shows that vocational education and training
providers have neither reduced study places nor
the number of teachers and trainers, but have saved
on other aspects such as equipment and
investments. Therefore quality, free access for all
and territorial coverage have so far not suffered.
These issues will warrant close monitoring during
the following stages of the reform.
Graph 4.3.2: PISA: Share of top performers in science-
Finland
Source: OECD, European Commission
Action has been taken to integrate the recently
arrived asylum seekers into the Finnish
education system. The reception of asylum
seekers is organised at the level of municipalities,
which receive additional public funding per
person, for a maximum of one year. This funding
can be used to set up preparatory classes or to
organise additional support in mainstream classes,
or to provide a specific curriculum. At the national
level, an action programme on the educational
tracks and integration of immigrants was launched
in 2016. The Ministry of Education has estimated
the needs and costs of immigrants in education to
amount to around 160 million euro annually.
0
5
10
15
20
25
2006 2009 2012 2015
Share of low performers
Share of top performers

30
4.4.1. EXTERNAL COMPETITIVENESS*
Exports of services have increased over the past
10 years, while exports of goods, which account
for 70 % of foreign trade, are still more than
10 % below their pre-crisis level. The share of
Finnish exports in the global markets has
continued to decline for the past 10 years (see
Graph 4.4.1).
Graph 4.4.1: Breakdown of growth in export market shares
Source: European Commission
The export market share losses since 2008
coincide with a rapid decline of nominal cost
competitiveness. The European Commission 2016
report for Finland discussed the developments in
wages and productivity over that period in detail.
On an aggregate level, the increase in aggregate
nominal unit labour costs has slowed down in
2014-2016 owing to moderate collective wage
agreements (see Graph 4.4.4). This indicates that
also non-cost competitiveness factors have
recently also had an impact on export performance.
In international comparison, part of Finland’s
cost competitiveness losses have been corrected
since 2013. However, Finland’s cost
competitiveness in terms of the real effective
exchange rate against 37 industrial countries, using
unit labour costs in manufacturing as deflator, was
still weaker in 2015 than 10 years earlier (see
Graph 4.4.2 ). Other euro area Member States
benefited more from the depreciation of the euro,
as they were less exposed to the depreciating
exchange rates of the Russian rouble and the
Swedish krona (both countries are among
Finland’s main export destinations). Moreover,
while Finland’s relative unit labour costs in
manufacturing have decreased, the decrease has
been smaller than in Sweden or in the euro area on
aggregate.
Graph 4.4.2: Real effective exchange rates, selected
countries, 2005=100
Deflator: manufacturing NULC, REER calculated against 37
industrialised countries.
Source: European Commission
The design and implementation of future wage
setting practices will play a key role in
safeguarding competitiveness. As of 2017, a new
collective wage agreement, the Competitiveness
Pact, contributes to lowering wage costs in a step-
wise manner (see Box 1.1). Overall, the measures
in the Pact would result in a reduction of labour
costs by approximately 4 % which will improve
Finland’s cost competitiveness. As shown in
Graph 4.4.4 and discussed in the European
Commission 2016 report, unit labour cost
developments differ across sectors due to different
productivity developments. In addition to the wage
cost measures, the social partners agreed to
develop a new wage setting model and increase
local collective bargaining as discussed in Section
4.3. Wage-setting practices across industries in
coming years will be the key to preserving cost-
competitiveness.
-14
-12
-10
-8
-6
-4
-2
0
2
4
6
01 02 03 04 05 06 07 08 09 10 11 12 13 14 15
Rate
of
change y
-o-y
(%
)
Contribution to EMS: goodsContribution to EMS: servicesExport market share growth yoy
90
95
100
105
110
115
120
125
05 06 07 08 09 10 11 12 13 14 15
EA19 EU28
Finland Sweden
2005=100
4.4. INVESTMENT

4.4. Investment
31
Graph 4.4.3: Drivers for REER developments, Finland
When REER appreciates, competitiveness decreases.
Source: European Commission
Graph 4.4.4: Nominal unit labour costs by industry,
2010=100
Source: European Commission
The continuous decline in goods exports and the
loss of market shares, despite the gradual
improvement in cost competitiveness, suggest
that challenges remain in non-cost
competitiveness and productivity. Labour
productivity has stagnated and is currently at the
same level as in 2011. In the same period, the
contribution of total factor productivity to growth
has remained negative. Low productivity growth
has increased the pressure to reduce labour costs to
retain competitiveness. As described in the
European Commission 2016 report, Finnish
companies have not reaped the full benefits of the
growth in their export markets. However, Finnish
exports of goods have grown less than the markets.
The goods exports value has declined since 2013.
In real terms the goods exports have slightly
grown, and declined in 2015.
In recent years, Finland’s main export
destinations have been growing slowly.
Economic growth in the EU has remained weak
and the Russian economy fell into recession in
2014. As seen in Graph 4.4.5, about half of the
estimated losses in Finland’s share of the global
export market in 2015 could be attributed to
sluggish growth in those markets to which Finnish
companies export. Over a longer time period, the
main factor behind Finland’s declining share of the
global export market has been Finland’s
deteriorating competitiveness in the markets
outside the EU.
Graph 4.4.5: Breakdown of export market shares, Finland
Initial specialisation (IS) represents gains or losses stemming
from the exposure to a certain market while market share
gains (MSG) measure the performance within a certain
market.
Source: European Commission
The current account surplus vanished after
2010 notably due to the elimination of the
surplus in the trade of capital goods. Moreover,
the surplus in trade of intermediate goods has
declined while the deficit in trade in consumption
goods has increased steadily as private
consumption has increased (see Graph 4.4.6).
-10
-5
0
5
10
15
05 06 07 08 09 10 11 12 13 14 15
NEER, %-ch. NULC, %-ch. REER, %-ch.
60
70
80
90
100
110
120
130
02 03 04 05 06 07 08 09 10 11 12 13 14 15
2010=
100
Industry (except construction)ConstructionMarket servicesPublic servicesTotal (all activities)
-16%
-14%
-12%
-10%
-8%
-6%
-4%
-2%
0%
2%
4%
2010 2011 2012 2013 2014 2015
MSG - extra EU
MSG - intra EU
IS - extra EUIS - intra EU

4.4. Investment
32
Graph 4.4.6: Trade balance of goods according to broad
economic classification of goods.
Source: European Commission
Intermediate products dominate goods exports.
They account for about two thirds of goods
exports, a much higher proportion than the EU
average (somewhat below 50 %). Finland’s role in
global value chains is predominantly to supply
intermediate goods to other economies such as
China, Germany and Sweden. Intermediate goods
also account for a large share, around 55 %, of
imports. The share of foreign gross value added
embedded in Finnish manufacturing value added
was 38 % in 2011, slightly above Sweden and
Denmark (Ali-Yrkkö, Rouvinen, Sinko, Tuhkuri
2016). However, the foreign content of exports has
increased more than in the neighbouring countries
or in the EU on average in 1995-2011. On the one
hand, this is a sign of deeper integration into global
value chains, but on the other hand means that
exports create less domestic value-added and
income than before. China and the United States
were the most important individual countries as
export markets in 2011, each representing around
3 % of Finnish GDP. Exports of goods and
services to the EU as a whole accounted for almost
10 % of GDP (Ali-Yrkkö et al. 2016).
Exports in services have nearly doubled since
the early 2000s. In 2015, the share of service
exports (34
) was at 11 % of GDP and accounted for
30 % of total exports. Exports of ICT services
account for about 40 % of total services exports
(34) In national accounts terms, including trade of services and
tourism.
and record a large surplus. However, in recent
years Finland has lost global market shares also in
trade of services.
The structural change of the economy has
stabilised. The speed of structural change can be
approximated by an indicator that looks at changes
in the shares of different industries in gross value-
added or in employment (Hansson and Lundberg
1991). The indicator gets small values when most
of the industries grow or decline at the same rate
and large values when changes happen in few
industries. At the peak of the crisis, export losses
were accompanied by a rapid decline in the
production and employment in the electronics and
paper industries, but after this negative shock the
production structure in the economy has remained
rather stable.
Graph 4.4.7: Speed of structural change, Finland
The short run indicator is a sum of (absolute) changes in
employment shares. The long run indicator shows an
average change of the employment structure over 1996-
2006 and 2006-2014.
Source: European Commission
The losses in productivity and employment
which materialised during the recession in
2012-2014 have not yet been reverted.
Innovation and expansion of high productivity
activities is needed, which would generate
favourable structural change, but the indicators
(see Graph 4.4.7) suggest that structural change
has slowed down. Also the long-run indicator,
which measures the changes in the production
structure in two successive periods over 1996-
2014, indicates a slowdown in the speed of change.
-5 0 5 10
Capital goods
Consumption goods
Fuel
Intermediate goods
TOTAL
% of GDP
2000 2005 2010 2015
-6
-4
-2
0
2
4
6
8
96 98 00 02 04 06 08 10 12 14
Short-run speed indicator
Long run share change
Total hours worked, % y-o-y

4.4. Investment
33
The speed indicator for Finland has been varying
within the same range as other peer countries’
indicators. The rise of the ICT sector in late 1990s
and the deep decline of manufacturing in 2009 are
periods when Finland stands out in this sample.
Aggregate labour productivity has deteriorated
significantly due to the decline of high
productivity industries. The orientation of the
economy towards higher-productivity industries
was apparent in the late 1990s and early 2000s.
The structure of the economy started to shift
towards lower productivity sectors already in the
early 2000s. The decline of the paper and
electronics industries is accelerated 2008 and the
productivity drop is more severe than in peer
economies such as Sweden (shorter) or Austria
(not as steep) (see Graph 4.4.9).
Graph 4.4.8: Short-run speed of structural change, selected
countries
Source: European Commission
Structural changes have reduced the demand
for labour in elementary occupations, while the
number of jobs that require a higher education
has increased. Reflecting the decline in
manufacturing, jobs in elementary occupations
(ISCO08 class 9) and in craft and related trades,
such as construction workers or metal and
machinery workers, (ISCO08 class 7) declined
between 2005 and 2015. Also jobs in managerial
occupations declined significantly, while expert
jobs increased. Table 4.4.1 also illustrates the rapid
decline in jobs which require at most lower
secondary education (education levels 0-2), while
jobs which demand tertiary education (education
levels 5-8) have increased. The manpower
requirement index (35
) shows that over recent years
jobs for workers with basic skills have declined
while the demand for educated workers has
increased. This has possibly worsened matching
problems in the labour market and could partly
explain why the estimated speed of structural
change has slowed down in the past years.
Graph 4.4.9: Reorientation of the economy towards lower
productivity industries
The graph illustrates how actual labour productivity
compares to a counterfactual labour productivity using
constant, average over 1995-2015, economic structure.
Source: European Commission
Table 4.4.1: Changes in employment 2005-2015 by
education and demand for more educated
employment
Education levels according to ISCED 2011:
0-2 Early childhood, primary and lower secondary
3-4 Upper secondary and post-secondary, non-tertiary
5-8 Short-cycle tertiary, bachelor, master doctoral (or
equivalent)
Source: European Commission
(35) Following Uusitalo (1999) and references therein.
0
1
2
3
4
5
6
7
96 98 00 02 04 06 08 10 12 14
FI SE DK NL AT
-20
-15
-10
-5
0
5
99 01 03 05 07 09 11 13 15
FI SE DK NL AT
Occupation 0-8 0-2 3-4 5-8
Managers -6.6 -4.5 -3.9 -11.2
Professionals 7.6 1.1 3.2 16.8
Technicians and associate professionals 1.9 1.1 1.3 3.2
Clerical support workers -0.7 -0.8 -0.6 -0.7
Service and sales workers 3.6 3.6 5.4 1.1
Skilled agricultural, forestry and fishery workers -0.7 -1.4 -0.8 -0.3
Craft and related trades workers -1.3 -1.6 -2.0 -0.2
Plant and machine operators and assemblers -0.7 -1.4 -1.0 -0.1
Elementary occupations -1.8 -3.6 -2.2 -0.2
Total 1.5 -38.1 0.1 24.0
Manpower requirement index -7.5 -0.5 8.4
Education levels

4.4. Investment
34
4.4.2. INVESTMENT OUTLOOK
Investment has been limited. On one hand the
increased labour costs and weakened terms of
trade have led to a deterioration of real unit labour
costs. Real unit labour costs give an indication of
companies’ profitability which has fallen and
might partly explain lower investment. On the
other hand, the Finnish export products might have
fallen behind competitors’ products in quality and
innovativeness. Both these dimensions were
discussed in more detail in the European
Commission 2016 report.
Foreign direct investment to Finland is
increasing while in net terms Finland has more
investment abroad. In 2014 a few large
acquisitions of Finnish companies increased
foreign direct investment (FDI) into Finland to a
record high 13.4 billion euros so FDI of about 1.3
billion euros in 2015 might seem disappointing.
However, in 2015 the number of companies
investing in Finland increased from the previous
year (36
). In 2015, the stock of inward FDI in
Finland was about 74 billion euros while Finnish
outward FDI was some 11 billion euros higher.
Outward FDI decreased as net investment was
negative, about -11.4 billion euros due to increased
loans by foreign affiliates to their parent
companies in home country (see Section on the
financial sector and non-financial corporates).
Overall, Finland has room to increase foreign
direct investment. Compared for example with
neighbouring Sweden, the Finnish FDI stock-to-
GDP is currently about 20 pps. lower. This is so
despite the fact that, as Finland usually performs
well in global competitiveness rankings. One
reason for not attracting FDI inflows could be the
small size of the domestic market. Finland, next to
economically larger Sweden with more or less
similar structural features of the economy, might
not be the most natural choice for foreign
investors. Also, a lack of national rules and
procedures for companies to directly transfer their
registered offices into and out of Finland makes it
more difficult and costly for companies to take
advantage of cross-border business opportunities.
(36) http://www.investinfinland.fi/-/number-of-foreign-owned-
companies-in-finland-grows-third-year-running
4.4.3. BUSINESS ENVIRONMENT
The business environment is an important
enabler of company growth. The growth
orientation of SMEs has increased: 11 % of small
and medium-sized enterprises now declare that
they are strongly growth-oriented, and 39 % plan
to grow as far as possible (Yrittäjät, 2016a). Their
main challenges are weak demand in the domestic
market and increased competition. To promote the
internationalisation of Finnish firms, a government
initiative known as Team Finland provides
services such as market research, networking,
training and business development support and
financing.
New legislation will support the introduction of
new technologies, digitisation and new business
concepts. As an example, the new Transport Code
is expected to promote the use of collaborative
business models by making regulation less
burdensome and enabling market access. Another
example is the guidance issued by the Ministry of
Economic Affairs and Employment for short-term
rented accommodation. It covers income and
value-added tax declaration obligations for
providers, minimum safety and insurance
requirements, and collection of users’ identity
information and thus increases legal certainty and
transparency.

4.4. Investment
35
Box 4.4.1: Investment challenges
Macroeconomic perspective
Real investment suffered significantly in the 2008-09 recession when investment fell so that it was the
largest individual demand component contributing to the fall in real GDP (see Graph 1.1). This reflects, in
part, the deterioration of the economic outlook but also the fact that the years 2007-08 before the crisis
witnessed an investment boom in Finland. After a brief rebound in 2010-11, investment fell in 2012-2014,
when investment in production facilities and commercial investment as well as research and development
expenditure (or intangible investment) of non-financial corporations declined. In addition, real housing
investment declined while public investment increased slightly. However, in 2015 real investment turned to
a tepid growth driven by machinery and equipment investment by the corporate sector. Also housing
construction started to grow. In 2016 machinery and equipment investment and construction were expected
to have continued to expand. However, the growth has started to increase from very low levels. In real
terms, investment was in 2015 still below the levels in 2009-2010. The investment-to-GDP ratio is currently
subdued and close to one fifth, a few percentage points lower than in 2006.
Assessment of barriers to investment and ongoing reforms
Table 1: Barriers to investment
Source: European Commission
Finland has preserved a good environment for doing business and cost-competitivenss is expected to
improve as of 2017. The new wage-setting practices in line with the Competitiveness Pact are under
discussion between the social partners (see Section 4.3). The government is working on improving the
business environment further.
1/ The main barriers to investment are the cumulated loss of cost competitiveness and continued challenges
in non-cost competitiveness. The Competitiveness Pact (see Box 1.1) is expected to lower wage costs for
employees creating possibilities to take on economically feasible investment projects. Non-cost
competitiveness issues such as declining economic activity in key export markets and shift of demand from
products made in Finland to competitors' more innovative products are limiting production. This in turn is
slowing down investment in production capacity. In this regard cuts to public and private R&D spending are
unfortunate and could result in lower capacity to create new innovative export products in the future.
2/ Overall, the business environment could be more favourable for foreign and domestic investment. The
government has pledged to reduce regulatory burden, also in services such as retail, to make the economy
more flexible and the business environment more attractive (see Section 4.4.3). The government programme
Team Finland on one hand supports growth of innovative start-ups and helps them to internationalise and on
the other hand promotes Finland as location for foreign investment.
Regulatory/ administrative burden CSR EPL & framework for labour contracts Business services / Regulated professions
Public administration CSR Wages & wage setting CSR Retail CSR
Public procurement /PPPs Education Construction
Judicial system Taxation Digital Economy / Telecom
Insolvency framework Access to finance Energy
Competition and regulatory frameworkCooperation btw academia, research and
businessTransport
Financing of R&D&I
No barrier to investment identified Not assessed yet Some progress
CSR Investment barriers that are also subject to a CSR No progress Substantial progressLimited progress Fully addressed
Pu
blic
ad
min
istr
atio
n/
Bu
sin
ess
envi
ron
men
t
Lab
ou
r m
arke
t/
Edu
cati
on
Sect
or
spec
ific
reg
ula
tio
n
Fin
anci
al
Sect
or
/
Taxa
tio
n
R&
D&
I

36
4.5.1. RESEARCH, DEVELOPMENT AND
INNOVATION
Since cost competitiveness is improving thanks
to the recent wage agreements, non-cost
competitiveness issues become even more
important. Retaking the path towards sustainable
growth and renewed competitiveness will require a
clear focus on research and innovation which
should increase business dynamism and help to
renew the structure of the economy. While
Finland’s total R&D budget (2.9 % GDP in 2015,
projected to marginally decline in 2016) is still
among the highest in the world, it has decreased by
15 % in 2009- 2014. The decline was mainly
caused by lower investments in the private sector
which can be linked to economic restructuring.
The share of manufacturing in total value-added
has decreased from 25.3 % in 2007 to 17.0 % in
2015. The share of high-tech manufacturing has
decreased from 7.3 % in 2007 to 3.0 % in 2015.
Graph 4.5.1: Total intramural R&D expenditure (GERD) by
sectors of performance in Finland between
2005 and 2014
Source: European Commission
Public R&D intensity remained almost stable
over the period 2007-2014 with a counter-
cyclical expansion in expenditure during the
crisis years. In 2015 public R&D intensity
dropped below 1%, bringing it back to the pre-
crisis levels due to the government’s fiscal
consolidation programme. Based on the 2016
budget, research and innovation expenditure
decreased 9.4 % in comparison to 2015. Among
the areas most concerned by the cuts are the R&D
subsidies to businesses-driven research, mainly
those distributed by the Tekes agency. No
evaluations that would demonstrate the impact and
appropriateness of cuts in the programmes and
other Tekes activities have been made.
In international comparison, subsidies towards
R&D have been moderate. Direct government
funding of business R&D as a percentage of GDP
amounted to only 0.06 % in 2014 (OECDd).
Subsidies are replaced by soft loans to businesses,
so that these could become commercially
successful on a global level. The government is
also experimenting with new programmes in
growth areas such as clean technology,
biotechnology and digitalisation, but these are on a
relatively small-scale.
In the 2016 European Innovation Scoreboard,
Finland remains an innovation leader. Its
innovation performance has, however, decreased
since 2010. Its performance has deteriorated based
on a number of indicators, notably innovative
SMEs collaborating with others, non-R&D
innovation expenditures and venture capital.
Nevertheless, Finland still has clear strengths in
international scientific co-publications, licence and
patent revenues from abroad, patent applications
and public-private co-publications.
Some of the resources put into public research
do not lead to high quality results. In terms of
highly cited publications (share of these in total
publications of the country), Finland only ranked
11th in the EU. Public-private cooperation also
shows a worrying declining trend, with the amount
of public R&D expenditure financed by business
declining from 0.08 % of GDP in 2007 to 0.05 %
GDP in 2014.
The choices made by the government in the
fiscal consolidation process have led to
relatively higher funding of fundamental
research. Encouraging the commercialisation of
research output also features prominently on the
policy agenda. The streamlining of profiles and the
division of labour between higher education and
research institutes is also a policy priority. In 2017
further changes are planned to the funding model
for universities. Part of the institutional funding of
universities has already been re-allocated to the
Academy of Finland to facilitate strategic choices.
0
0.5
1
1.5
2
2.5
3
3.5
4
2005
2006
2007
2008
2009
2010
2011
2012
2013
2014
2015
Business R&D Government R&D
Higher Education no-profit
4.5. SECTORAL POLICIES

4.5. Sectoral policies
37
Universities have been pursuing the
commercialisation of research output. This has
been achieved through the creation of spin-offs
and by significant investment into the innovation
capacity of the start-up ecosystem. However, the
share of high-growth enterprises categorised as
innovative is slightly lower than the EU average.
Also in terms of the average size of high-growth
businesses measured in employment, Finland falls
behind the EU average (Costa et al 2016).
The government’s programme for 2015-19
focuses research and innovation policy strongly
on university-business collaboration and the
creation of an efficient national research
system. While the budgetary restrictions have a
distortionary impact on the research and
innovation ecosystem which needs to be
thoroughly assessed, the risk taking by the
government on policy experimentation is
remarkably progressive and forward-looking. Yet,
the lack of justification for budgetary cuts and
limited cooperation with the main stakeholders can
be assessed as posing a threat to the success of
reforms.
4.5.2. COMPETITION IN PRODUCT AND SERVICE
MARKETS
The concentration of the grocery retail market
remains very high. (37
) Although the third largest
retailer has increased its market share, the
dominance of the two leading local retailers has
not significantly changed and is still very high —
also as a result of the acquisition of Suomen
Lähikauppa by Kesko, the second largest retailer in
the country.
Consumer prices have fallen but remain high.
Fierce price competition between the retail chains
has recently led to a continuous fall in prices of
daily consumer goods, as reported by the Ministry
of Finance in its Economic Survey for autumn
2016 (VM, 2016a). The Eurostat price level index
for food and non-alcoholic beverages has dropped,
moving Finland slightly closer to the EU average
but the prices for these product categories still
(37) Euromonitor (2016). The five largest grocery retailers hold
95 % of the Finnish market, with the two market leaders accounting for nearly 80 %.
remain the fourth highest in the EU (Eurostat,
2015).
Retail trade has been highly regulated but
recently steps towards lowering the regulation
have been taken. After liberalising the opening
hours from the start of 2016, the proposed
amendments to the Land Use and Building Act
increase the threshold of retail establishments to be
classified as ‘large’ from 2000 to 4000 m2. This
should provide more flexibility for retailers in
adapting their store formats to the needs of
consumers. However, it is necessary to ensure that
the changes are correctly implemented at the local
level, given the fact that planning powers were
recently entirely conferred on municipalities. In
addition, the government is planning to liberalise
alcohol policy. The proposal is expected to bring a
certain share of sales from state-owned Alko shops
to the other retailers and reduce the dependence of
other retailers on the location decisions of Alko
shops.
The taxi sector is to be reformed. As part of the
first stage of the unified Transport Code (cf. 4.5.4),
the government has presented proposals to
facilitate market entry in the taxi sector, enable
new business models, and remove national
regulation limiting competition. In particular, the
current quotas on taxis by geographical zone of
operation are proposed to be abolished in order to
facilitate access to markets, expansion of
operations and more efficient use of vehicles.
Similarly, taxi transport licences would no longer
require having followed a transport operator course
and at least six months experience of driving taxis.
Instead of being issued for specific vehicles as is
currently the case, they would be operator-specific
and available to operators holding passenger or
goods transport licences and fulfilling taxi
transport requirements. This change is intended to
make it easier to enter the taxi market and develop
new services and business models. Moreover, the
regulation of taxi fares would be replaced by a
system of flexibly set fares, communicated to
customers before the start of the journey;
provisions to determine maximum fares are
however expected to remain in place. Finally, the
formal requirements on taxi drivers are proposed
be eased and a wider definition of what vehicles
can be used to provide taxi services is envisaged.

4.5. Sectoral policies
38
Changes to the regulation and roles of both
hospital and private pharmacies are being
discussed, related to the reform of social and
healthcare services. The private pharmacy sector
is strictly regulated, including limitations on the
number of branches per pharmacy (up to three
branches per private pharmacy; the Helsinki
university pharmacy is however allowed to operate
up to 16 branches) and the ownership of the
pharmacies. There has been a public debate about
reform of the pharmacy sector, however a political
decision has not been made to change the
fundamentals of the system. The government has
conducted a public consultation on the rules
governing transfer of ownership of pharmacies as
well as the retail sale of non-pharmaceutical
products in pharmacies.
4.5.3. ENERGY, RESOURCES AND CLIMATE
CHANGE
Finland is broadly on track to reach its Europe
2020 energy targets, but to ensure fulfilment of
the climate target additional measures appear
to be required. The share of renewable energy in
gross final energy consumption reached 39.5 % in
2015, already exceeding its 2020 target. In
addition, primary and final energy consumption in
2015 were already below their 2020 energy
efficiency targets. The promotion of renewable
energy and energy efficiency is also a way of
reducing dependency on imported energy.
Regarding greenhouse gas emissions, according to
the national projections, the reduction in emissions
in the non-ETS sector by 2020 is exactly 16 %
(same as its commitment), implying that, unless it
adopts new policies, it is not certain that the target
will be met.
The government approved a new national
energy and climate strategy to 2030 on
24 November 2016. The strategy has been
submitted as a Government report to the
parliament. The strategy sets out concrete
measures and goals to reach the energy and climate
goals for 2030, with the aim of aligning the
strategy to the overall EU objectives. Such goals
include increasing the share of renewable energy
above 50 % in the 2020s, promoting the use of
advanced biofuels, and encouraging transport
electrification. The government’s proposal is
meant to promote cost-effective measures to
reduce greenhouse gas emissions. However, some
uncertainties remain regarding the adequacy
between the envisaged policy measures, notably
for wind power, and the government’s objectives.
Public finance implications have been assessed.
According to government estimates, public support
required by the strategy would increase central
government expenditure by approximately 160–
240 million euros in 2018-2020 and by 930 million
euros during 2021 to 2030. Energy related tax
revenue would decrease by ca 1.4 billion euros
over the strategy's horizon as energy use decreases.
The electricity market is working well.
Concentration on the power generation market is
low. There is also a widespread deployment of
smart meters, and high annual switching rates by
consumers from one electricity supplier to another.
Finland is an electricity importer and lacks
sufficient interconnector capacity to the Nordic
and Baltic neighbours, especially Sweden. The
wholesale price of electricity remains higher than
in the other Nordic countries. Ways to address this
problem include the improvement of
interconnection capacity, development of
additional generation capacity and promoting
energy efficiency. The latter is important as the
energy intensity of the economy is well above EU
average and progress has been limited over the last
10 years. High energy intensity can be partly
explained by climatic and structural factors
(energy intensive pulp and paper sector).
Regarding additional generation capacity, potential
delays have been announced in the completion of
the new nuclear power plant project Olkiluoto-3.
Competition in the gas market is currently
lacking. The market is tightly regulated as there
is no liberalised wholesale market and end-
users have no choice of supplier. The situation is
meant to improve thanks to the building of new
external gas connections. The Connecting Europe
Facility’s financing agreement on the
Balticconnector pipeline project has ensured
agreement for the construction of this gas pipeline
linking Finland and Estonia. Together with the
construction of small-scale liquefied natural gas
projects, this will enable the diversification of gas
providers. A first local LNG terminal, aimed
mainly for ships and local industry, was opened in
2016 in the port of Pori. On that basis,
amendments to the Natural Gas Market Act are
now under preparation. The new Act is expected to

4.5. Sectoral policies
39
open up wholesale and retail markets to
competition and improve the competitiveness of
natural gas by reducing rules applying to natural
gas companies.
4.5.4. OTHER NETWORK INDUSTRIES
Reform of the domestic postal services has been
initiated. Linked to the government’s
digitalisation and better regulation agenda, the
Ministry of Transport and Communications has
initiated a two-stage project to reform legislation
governing postal services. The goal is to make
postal services more flexible and better adapted to
the needs of the changing business environment
(LVM, 2016a).
Transport market regulations will be reformed
through the introduction of a unified regulatory
act (Transport Code). The reform will be
implemented in three stages. The first stage
includes provisions on road transport and better
interaction between all modes of transport. Later
stages include provisions on air, sea and rail
transport markets as well as on transportation
services. The first phase of the reform is intended
to enter into force on 1 July 2018 to enable the
transport sector to prepare for the new rules. The
Transport Code envisages that essential data on
transport services are made open, laying down
provisions for the interoperability of ticket and
payment systems. This is expected to facilitate
combinations of different transport services (LVM,
2016b).

40
4.6.1. REGULATORY FRAMEWORK
Finland’s regulatory environment is
transparent but at times costly for the
businesses. Costs affected by the regulation are in
particular significant for start-ups and SMEs.
Larger companies are generally coping with the
excessive regulation better and in some cases even
see it as a competitive advantage that keeps the
new entrants out of market.
The ’think small first’ principle, which aims at
making policy and legislative initiatives SME-
friendly, is not systematically applied to new
and existing legislation. At the same time SMEs
are a specific focus group in many new initiatives.
Moreover, entrepreneurs consider frequent
changes in legislation as a problem (Prime
Minister’s Office, 2016b). More focus should also
be put on facilitating small businesses’ compliance
with rules and regulations. In specific areas,
decreased public spending, together with structural
changes in the provision of public services
(towards larger units) make it difficult for SMEs to
participate in public procurement tenders.
The government has set up an independent
Council of Regulatory Impact Analysis in order
to improve the quality of impact assessments
accompanying government proposals. The
current members are appointed for three years until
2019. The Council has already started to produce
opinions, among others on the draft amendments to
the Land Use and Building Act (cf. 4.5.2) and the
Postal Act (cf. 4.5.4), as well as on a proposed new
tax deduction for entrepreneurs (VM, 2016b).
4.6.2. EFFICIENCY OF PUBLIC ADMINISTRATION
The public administration is efficient. Studies
point to Finland as an efficient and low corruption
country. Efficiency of public administration has
not been demonstrated as a factor hampering
investment or employment decisions.
Nevertheless, there is some room for improvement.
Among the key projects of the government is
the digitalisation of public services. The first step
is the development of the common principles for
all digital public services. Also, all internal
processes within the government are to be
digitalised. The funding in 2016-18 is expected to
amount to 100 million euros.
The government has stated its intention to
abolish detailed qualification requirements for
municipal staff. The aim is to focus recruitment
policies more towards skills and competencies than
formal qualification requirements. Municipal
positions involving the exercise of public authority
will be the exception as there will be specific
legislation on qualification requirements.
Abolishing detailed qualification requirements in
most cases to focus more on skills and
competencies is part of a plan to cut costs by 1
billion euros in municipalities (OKM, 2015).
Public procurement functions well in Finland.
All notifications are published electronically.
Electronic auctioning is used in less than 1 % of all
contract award notices. Public procurement
contracts are in most cases awarded on the basis of
quality and value for money, not based on the
lowest price (the latter is used in 46 % of contracts,
lower than the EEA average of 64 %). However,
Commission data indicate that transparency is an
issue as contract award notices are not always
published.
The public procurement system could do with
faster review procedures. Review procedures at
the Market Court are relatively time-consuming,
the average time for a review decision being eight
months. In most other EU Member States, review
bodies deliver their decisions within one to three
months.
4.6. PUBLIC ADMINISTRATION

41
2016 Country-specific recommendations (CSRs)
CSR 1: Achieve an annual fiscal adjustment of at
least 0,5 % of GDP towards the medium-term
budgetary objective in 2016 and 0,6 % in 2017.
Use any windfall gains to accelerate the reduction
of the general government debt ratio. Ensure
timely adoption and implementation of the
administrative reform with a view to better cost-
effectiveness of social and healthcare services.
Achieve an annual fiscal adjustment of at least 0,5
% of GDP towards the medium-term budgetary
objective in 2016 and 0,6 % in 2017. Use any
windfall gains to accelerate the reduction of the
general government debt ratio.
Ensure timely adoption and implementation of the
administrative reform with a view to better cost-
effectiveness of social and healthcare services.
Finland has made some progress is addressing
the CSR 1 (this overall evaluation excludes an
assessment of compliance with the Stability and
Growth Pact).
The compliance assessment with the Stability and
Growth Pact will be included in Spring when final
data for 2016 will be available.
Some progress has been made on the
adoption and implementation of the social and
healthcare reform. The reform has been
undertaken in order to ensure the continued
access to the good quality services while
ensuring the long-term sustainability of public
finances. The government has prepared the
first half of the draft legislation that is needed
for the reform to take effect from 2019. The
27 draft laws have undergone a public
consultation. Legislation regarding the
freedom of choice for the citizens was not part
(38) The following categories are used to assess progress in implementing the 2016 country-specific recommendations:
No progress: The Member State has not credibly announced nor adopted any measures to address the CSR. Below a number of
non-exhaustive typical situations that could be covered under this, to be interpreted on a case by case basis taking into account country-specific conditions:
• no legal, administrative, or budgetary measures have been announced in the National Reform Programme or in other official
communication to the national Parliament / relevant parliamentary committees, the European Commission, or announced in public (e.g. in a press statement, information on government's website);
• no non-legislative acts have been presented by the governing or legislator body;
• the Member State has taken initial steps in addressing the CSR, such as commissioning a study or setting up a study group to analyse possible measures that would need to be taken (unless the CSR explicitly asks for orientations or exploratory actions),
while clearly-specified measure(s) to address the CSR has not been proposed.
Limited progress: The Member State has: • announced certain measures but these only address the CSR to a limited extent;
and/or
• presented legislative acts in the governing or legislator body but these have not been adopted yet and substantial non-legislative further work is needed before the CSR will be implemented;
• presented non-legislative acts, yet with no further follow-up in terms of implementation which is needed to address the CSR.
Some progress: The Member State has adopted measures that partly address the CSR and/or
the Member State has adopted measures that address the CSR, but a fair amount of work is still needed to fully address the CSR as
only a few of the adopted measures have been implemented. For instance: adopted by national parliament; by ministerial
decision; but no implementing decisions are in place.
Substantial progress: The Member State has adopted measures that go a long way in addressing the CSR and most of which have
been implemented. Full implementation: The Member State has implemented all measures needed to address the CSR appropriately.
ANNEX A
Overview Table
Commitments Summary assessment(38
)

A. Overview Table
42
of the public consultation. The work needs to
continue, but thanks to the timely preparation
of the legislation creating the new
administrative structure, it can be concluded
that there is some progress in implementing
the recommendation.
CSR 2: While respecting the role of social
partners, ensure that the wage setting system
enhances local wage bargaining and removes
rigidities, contributing to competitiveness and a
more export industry-led approach. Increase
incentives to accept work and ensure targeted and
sufficient active labour market measures,
including for people with a migrant background.
Take measures to reduce regional and skills
mismatches.
While respecting the role of social partners,
ensure that the wage setting system enhances
local wage bargaining and removes rigidities,
contributing to competitiveness and a more export
industry-led approach.
Increase incentives to accept work and ensure
targeted and sufficient active labour market
measures, including for people with a migrant
background.
Finland has made some progress in addressing
the CSR 2:
Substantial progress has been made in ensuring
that the wage-setting system enhances local wage
bargaining and removes rigidities, contributing to
competitiveness and a more export industry-led
approach. The social partners agreed on the
Competitiveness Pact, which also extends the
possibilities for local bargaining. A new wage-
setting model is being negotiated for the next
round of wage negotiations, where wages in the
tradable sector serve as an anchor for the rest of
the economy. The extent to which there will be
results from the extended local bargaining
possibilities remains to be seen.
Some progress has been achieved on incentives
to accept work and ensure targeted and sufficient
active labour market measures, including for
people with a migrant background. To increase
incentives to accept work among parents of young
children, the government has proposed in the
2017 budget the reduction of fees for early
childhood education. From the benefits side,
Finland has tightened the obligation to accept a
job offer and the obligation to participate in
activation schemes. The duration of earnings-
related unemployment insurance was reduced by
one fifth to 400 days. From 2017, mandatory
interviews with all the unemployed will be carried
out at three-month intervals to monitor progress
with the individual employment plans. The
government has also introduced additional

A. Overview Table
43
Take measures to reduce regional and skills
mismatches.
funding for migrants' integration and a new
measure offering immigrants training that will
support their employability.
Some progress has been achieved in the area of
reducing regional and skills mismatches. The
reform of the vocational education system,
expected to be finalised in 2018 includes making
it more responsive to labour market needs. The
rules regarding acceptable commuting distance
for jobseekers will be stricter and the
unemployment benefit can be used as a mobility
allowance.
CSR 3: Continue pursuing efforts to increase
competition in services, including in retail.
Promote entrepreneurship and investment,
including by reducing administrative and
regulatory burden, to foster growth of high value
added production.
Continue pursuing efforts to increase competition
in services, including in retail.
Promote entrepreneurship and investment,
including by reducing administrative and
regulatory burden, to foster growth of high value
added production.
Finland has made some progress in addressing
the CSR 3:
Some progress has been made on competition in
services, including retail. Establishment
conditions for retail outlets will be eased. The
proposed legislation increases the minimum
surface of the more tightly regulated large retail
units from 2 000 to 4 000 square meters. The
possibilities to establish these units in areas other
than the city centres will be increased and access
to outlets will become a more important factor in
the planning than the outlet’s nature and size.
Transport and gas market reforms have been
announced and the draft legislation prepared.
Some progress has been made on the
promotion of entrepreneurship and investment
and fostering growth of high value added
production. In order to promote
entrepreneurship, the government put forward
a subsidy (grant or a wage subsidy) for one-
person companies to hire a worker, reviewed
the rules that guide the recruitment of foreign
specialists and the creation of a public
database of inventions that everyone can
access and exploit. An innovation voucher for
SMEs is in preparation, aimed at promoting
the use of outside expertise in innovating and
improving products or services. The

A. Overview Table
44
government also plans to combine the existing
public support instruments into a single
‘growth service’.
Europe 2020 (national targets and progress)
Employment rate (%):78 % The employment rate was 73.3 % in 2013 and
declined to 73.1 % in 2014 and further declined to
72.9 % in 2015. The ambitious target on the
employment rate will be difficult to meet,
especially considering the continuous negative
trend.
Research and development target: 4% of GDP 2.9 % (2015)
No progress towards the target. Public R&D
intensity has remained almost stable over the
period 2007-2014 with a counter-cyclical
expansion in expenditure during the crisis years.
In 2015 public R&D intensity dropped below 1%,
bringing it back to the pre-crisis levels. Private
expenditure on R&D as share of GDP decreased
from 2.42 % in 2007 to 1.94 % in 2015. Finland is
unlikely to reach its national target for 2020 as
expenditure is still decreasing.
Early school leaving target: 8 % The early school leaving rate increased from
9.3 % in 2013 to 9.5 % in 2014, but declined to
9.2 % in 2015. It was below the EU average value
of 11.0 % in 2015. There are significant gender
differences (rate is higher for boys).
Tertiary education target: 42 % Finland’s tertiary educational attainment rate was
45.5 % in 2015 compared with a figure of 45.3 %
in 2014 and 45.1 % in 2013, when measured
according to the EU definition of the indicator.
Target for reducing the population at risk of
poverty or social exclusion: 150 000 (compared to
910 000 in 2008)
The number of people at risk of poverty and
social exclusion in 2015 was 904 000, compared
with 927 000 in 2014. As the number of people at
risk of poverty has remained close to 900 000
over the last decade, it will be challenging to meet
the target by 2020.

A. Overview Table
45
2020 Renewable energy target: 38 % The share of renewable energy in gross final
energy consumption reached 39.5% in 2015(39
),
already exceeding the 2020 target. The
contribution of heating and cooling, with almost a
52% RES-share for that sector, is significant.
Energy efficiency target.
Finland has set and indicative national energy
efficiency target of 310 TWh, which implies
reaching a 2020 level of 35.9 Mtoe primary
consumption and 26.7 Mtoe final energy
consumption.
Finland reduced its primary energy consumption
by -4.6% from 33.57 Mtoe in 2014 to 32.03 Mtoe
in 2015. Final energy consumption decreased by -
1.3% from 24.5 Mtoe in 2014 to 24.18 Mtoe in
2015.
Even if Finland has already achieved levels of
primary and final energy consumption which are
below the indicative national 2020 targets (35.9
Mtoe in primary energy consumption and 26.7
Mtoe in final energy consumption) it would need
to make an effort to keep these levels until 2020.
Greenhouse gas emissions target 2020:
-16% in 2020 compared to 2005 (in non-ETS
sectors)
2020 target: -16 %
According to the latest national projections and
taking into account existing measures, the target
is expected to be achieved with no margin: -16 %
in 2020 compared to 2005.
Non-ETS 2015 target: -9 %.
Based on proxy data, the non-ETS greenhouse gas
emissions between 2005 and 2015 decreased by
11 %; which means 2 pps below the 2015 target
set by the Effort Sharing Decision.
(39) Renewable energy shares for 2015 are approximations and not official data, reflecting the available data (04.10.2016). See the
Öko-Institut Report: Study on Technical Assistance in Realisation of the 2016 Report on Renewable Energy,
http://ec.europa.eu/energy/en/studies

46
ANNEX B
MIP Scoreboard
Table B.1: The MIP Scoreboard for Finland
Flags: p: provisional.
Source: European Commission, Eurostat and Directorate General for Economic and Financial Affairs (for Real Effective
Exchange Rate), and International Monetary Fund
Thresholds 2010 2011 2012 2013 2014 2015
Current account balance,
(% of GDP) 3 year average -4%/6% 1.8 0.5 -0.8 -1.8 -1.6 -1.0
-35% 16.5 15.1 11.7 3.9 -2.6 0.6
Real effective exchange
rate - 42 trading partners,
HICP deflator
3 years % change ±5% & ±11% -1.2 -2.8 -8.2 0.1 2.6 2.3
Export market share - %
of world exports5 years % change -6% -19.3 -23.3 -30.8 -30.8 -25.1 -20.5
Nominal unit labour cost
index (2010=100)3 years % change 9% & 12% 13.2 9.4 6.0 9.1 7.9 3.6
6% 4.8 0.0 -0.4 -1.3 -1.8 -0.4
14% 7.3 3.6 7.4 2.8 0.8 9.5
133% 148.9 145.4 148.6 147.7 147.4 155.7
60% 47.1 48.5 53.9 56.5 60.2 63.6
Unemployment rate 3 year average 10% 7.7 8.1 8.0 7.9 8.2 8.8
16.5% 9.2 28.4 -0.6 -11.8 8.8 1.5
-0.2% -1.1 -1.1 0.2 0.7 0.5 0.6
0.5% 0.5 0.5 0.2 -0.3 0.2 0.7
2% 4.9 3.6 -2.5 -1.5 0.4 3.4
Activity rate - % of total population aged 15-64 (3 years
change in p.p)
Long-term unemployment rate - % of active population
aged 15-74 (3 years change in p.p)
Youth unemployment rate - % of active population aged
15-24 (3 years change in p.p)
External imbalances
and competitiveness
New employment
indicators
Net international investment position (% of GDP)
Deflated house prices (% y-o-y change)
Total financial sector liabilities (% y-o-y change)
Private sector credit flow as % of GDP, consolidated
Private sector debt as % of GDP, consolidated
General government sector debt as % of GDP
Internal imbalances

47
ANNEX C
Standard Tables
Table C.1: Financial market indicators
Notes:
1) Latest data Q2 2016.
2) Quarterly values are not annualised
* Measured in basis points.
Source: European Commission (long-term interest rates); World Bank (gross external debt); Eurostat (private debt); ECB (all
other indicators).
2011 2012 2013 2014 2015 2016
Total assets of the banking sector (% of GDP) 327.3 300.5 258.3 282.1 265.9 277.3
Share of assets of the five largest banks (% of total assets) 80.9 79.0 84.1 79.8 75.0 -
Foreign ownership of banking system (% of total assets) 70.3 66.6 64.4 66.8 61.9 -
Financial soundness indicators:1)
- non-performing loans (% of total loans) 0.8 0.8 0.7 1.4 1.3 1.3
- capital adequacy ratio (%) 14.4 17.2 16.3 17.5 23.8 23.6
- return on equity (%)2) 7.6 8.9 8.1 9.1 8.3 4.2
Bank loans to the private sector (year-on-year % change) 8.5 7.1 6.3 3.8 0.2 0.7
Lending for house purchase (year-on-year % change) 6.6 5.6 2.3 1.7 2.5 2.3
Loan to deposit ratio 142.3 139.9 139.2 139.6 136.7 139.8
Central Bank liquidity as % of liabilities 1.0 1.3 1.1 0.4 0.3 1.2
Private debt (% of GDP) 145.4 148.6 147.7 147.4 155.7 -
Gross external debt (% of GDP)1)
- public 41.8 47.8 45.9 53.9 52.1 51.6
- private 43.4 43.7 43.7 43.9 48.5 44.3
Long-term interest rate spread versus Bund (basis points)* 39.8 39.1 29.2 28.6 22.4 28.1
Credit default swap spreads for sovereign securities (5-year)* 49.2 56.4 25.1 24.0 20.6 24.4

C. Standard Tables
48
Table C.2: Labour market and social indicators
Notes:
1) The unemployed persons are all those who were not employed but had actively sought work and were ready to begin
working immediately or within 2 weeks.
2) Long-term unemployed are those who have been unemployed for at least 12 months.
3) Not in education employment or training.
4) Average of first three quarters of 2016. Data for total unemployment and youth unemployment rates are seasonally
adjusted.
Sources: Sources:
European Commission (EU Labour Force Survey).
2011 2012 2013 2014 2015 2016 4
Employment rate
(% of population aged 20-64)73.8 74.0 73.3 73.1 72.9 73.5
Employment growth
(% change from previous year)1.3 0.9 -0.7 -0.5 -0.4 0.5
Employment rate of women
(% of female population aged 20-64)71.9 72.5 71.9 72.1 71.8 71.8
Employment rate of men
(% of male population aged 20-64)75.6 75.5 74.7 74.0 73.9 75.1
Employment rate of older workers
(% of population aged 55-64)57.0 58.2 58.5 59.1 60.0 61.4
Part-time employment (% of total employment,
aged 15-64)14.1 14.1 14.0 14.1 14.1 15.0
Fixed-term employment (% of employees with a fixed term
contract, aged 15-64)15.5 15.5 15.3 15.4 15.1 15.9
Transitions from temporary to permanent employment 28.7 30.9 34.5 28.0 23.9 :
Unemployment rate1 (% active population,
age group 15-74)7.8 7.7 8.2 8.7 9.4 8.9
Long-term unemployment rate2 (% of labour force) 1.7 1.6 1.7 1.9 2.3 2.3
Youth unemployment rate
(% active population aged 15-24)20.1 19.0 19.9 20.5 22.4 20.5
Youth NEET3 rate (% of population aged 15-24) 8.4 8.6 9.3 10.2 10.6 :
Early leavers from education and training (% of pop. aged 18-24
with at most lower sec. educ. and not in further education or
training)
9.8 8.9 9.3 9.5 9.2 :
Tertiary educational attainment (% of population aged 30-34
having successfully completed tertiary education)46.0 45.8 45.1 45.3 45.5 :
Formal childcare (30 hours or over; % of population aged less
than 3 years)20.0 22.0 21.0 23.0 : :

C. Standard Tables
49
Table C.3: Labour market and social indicators (continued)
Notes:
1) People at risk of poverty or social exclusion : individuals who are at risk of poverty and/or suffering from severe material
deprivation and/or living in households with zero or very low work intensity.
2) At-risk-of-poverty rate : proportion of people with an equivalised disposable income below 60 % of the national equivalised
median income.
3) Proportion of people who experience at least four of the following forms of deprivation: not being able to afford to i) pay
their rent or utility bills, ii) keep their home adequately warm, iii) face unexpected expenses, iv) eat meat, fish or a protein
equivalent every second day, v) enjoy a week of holiday away from home once a year, vi) have a car, vii) have a washing
machine, viii) have a colour TV, or ix) have a telephone.
4) People living in households with very low work intensity: proportion of people aged 0-59 living in households where the
adults (excluding dependent children) worked less than 20 % of their total work-time potential in the previous 12 months.
5) For EE, CY, MT, SI and SK, thresholds in nominal values in euros; harmonised index of consumer prices = 100 in 2006 (2007
survey refers to 2006 incomes)
Sources: Sources:
For expenditure for social protection benefits ESSPROS; for social inclusion EU-SILC.
Expenditure on social protection benefits (% of GDP) 2010 2011 2012 2013 2014 2015
Sickness/healthcare 7.2 7.2 7.4 7.5 7.5 :
Disability 3.4 3.3 3.4 3.4 3.4 :
Old age and survivors 11.2 11.2 11.9 12.5 13.0 :
Family/children 3.2 3.1 3.2 3.3 3.2 :
Unemployment 2.3 2.0 2.0 2.3 2.6 :
Housing 0.5 0.5 0.5 0.6 0.6 :
Social exclusion n.e.c. 0.8 0.8 0.9 0.9 0.9 :
Total 28.5 28.1 29.3 30.3 31.1 :
of which: means-tested benefits 1.2 1.3 1.5 1.6 1.8 :
Social inclusion indicators 2010 2011 2012 2013 2014 2015
People at risk of poverty or social exclusion1
(% of total population)16.9 17.9 17.2 16.0 17.3 16.8
Children at risk of poverty or social exclusion
(% of people aged 0-17) 14.2 16.1 14.9 13.0 15.6 14.9
At-risk-of-poverty rate2 (% of total population) 13.1 13.7 13.2 11.8 12.8 12.4
Severe material deprivation rate3 (% of total population) 2.8 3.2 2.9 2.5 2.8 2.2
Proportion of people living in low work intensity households4 (% of
people aged 0-59)9.3 10.0 9.3 9.0 10.0 10.8
In-work at-risk-of-poverty rate (% of persons employed) 3.7 3.9 3.8 3.7 3.7 3.5
Impact of social transfers (excluding pensions) on reducing poverty 51.5 50.0 50.9 55.3 53.6 53.7
Poverty thresholds, expressed in national currency at constant prices5 11940 12005 12082 12009 11965 11852
Gross disposable income (households; growth %) 4.0 4.3 2.9 2.9 0.6 1.4
Inequality of income distribution (S80/S20 income quintile share ratio) 3.6 3.7 3.7 3.6 3.6 3.6
GINI coefficient before taxes and transfers 47.7 48.4 48.2 48.5 49.1 49.2
GINI coefficient after taxes and transfers 25.3 25.8 25.9 25.4 25.6 25.2

C. Standard Tables
50
Table C.4: Product market performance and policy indicators
Notes:
1) The methodologies, including the assumptions, for this indicator are shown in detail at :
http://www.doingbusiness.org/methodology.
2) Average of the answer to question Q7B_a. '[Bank loan]: If you applied and tried to negotiate for this type of financing over
the past six months, what was the outcome?'. Answers were scored as follows: zero if received everything, one if received
most of it, two if only received a limited part of it, three if refused or rejected and treated as missing values if the application is
still pending or if the outcome is not known.
3) Percentage population aged 15-64 having completed tertiary education.
4) Percentage population aged 20-24 having attained at least upper secondary education.
5) Index: 0 = not regulated; 6 = most regulated. The methodologies of the OECD product market regulation indicators are
shown in detail at : http://www.oecd.org/competition/reform/indicatorsofproductmarketregulationhomepage.htm
6) Aggregate OECD indicators of regulation in energy, transport and communications.
Sources: Sources:
European Commission; World Bank — Doing Business (for enforcing contracts and time to start a business); OECD (for the
product market regulation indicators); SAFE (for outcome of SMEs' applications for bank loans).
Performance indicators 2010 2011 2012 2013 2014 2015
Labour productivity (real, per person employed, year-on-year %
change)
Labour productivity in industry 9.61 -2.11 -8.02 4.69 2.68 -1.26
Labour productivity in construction 5.73 -1.22 -4.34 0.38 -2.21 0.54
Labour productivity in market services 3.18 3.99 1.20 -1.93 -0.38 0.84
Unit labour costs (ULC) (whole economy, year-on-year % change)
ULC in industry -9.53 4.65 11.11 -2.85 -0.68 3.59
ULC in construction -5.32 4.75 8.12 2.98 2.33 1.26
ULC in market services -1.02 1.31 2.12 4.58 0.91 0.34
Business environment 2010 2011 2012 2013 2014 2015
Time needed to enforce contracts1 (days) 375.0 375.0 375.0 375.0 375.0 375.0
Time needed to start a business1 (days) 14.0 14.0 14.0 14.0 14.0 14.0
Outcome of applications by SMEs for bank loans2 0.31 0.06 0.23 0.41 0.57 0.23
Research and innovation 2010 2011 2012 2013 2014 2015
R&D intensity 3.73 3.64 3.42 3.29 3.17 2.90
Total public expenditure on education as % of GDP, for all levels of
education combined6.85 6.76 7.12 7.16 na na
Number of science & technology people employed as % of total
employment49 49 50 51 52 52
Population having completed tertiary education3 32 33 33 34 35 36
Young people with upper secondary education4 84 85 86 86 86 87
Trade balance of high technology products as % of GDP -0.33 -0.74 -0.87 -1.02 -0.98 -1.22
Product and service markets and competition 2003 2008 2013
OECD product market regulation (PMR)5, overall na 1.34 1.29
OECD PMR5, retail 2.86 2.89 2.86
OECD PMR5, professional services 0.61 0.71 0.62
OECD PMR5, network industries
6 2.72 2.61 2.47

C. Standard Tables
51
Table C.5: Green growth
All macro intensity indicators are expressed as a ratio of a physical quantity to GDP (in 2005 prices)
Energy intensity: gross inland energy consumption (in kgoe) divided by GDP (in EUR)
Carbon intensity: greenhouse gas emissions (in kg CO2 equivalents) divided by GDP (in EUR)
Resource intensity: domestic material consumption (in kg) divided by GDP (in EUR)
Waste intensity: waste (in kg) divided by GDP (in EUR)
Energy balance of trade: the balance of energy exports and imports, expressed as % of GDP
Weighting of energy in HICP: the proportion of 'energy' items in the consumption basket used for the construction of the HICP
Difference between energy price change and inflation: energy component of HICP, and total HICP inflation (annual %
change)
Real unit energy cost: real energy costs as a percentage of total value added for the economy
Environmental taxes over labour taxes and GDP: from European Commission's database, ‘Taxation trends in the European
Union’
Industry energy intensity: final energy consumption of industry (in kgoe) divided by gross value added of industry (in 2005 EUR)
Real unit energy costs for manufacturing industry excluding refining : real costs as a percentage of value added for
manufacturing sectors
Share of energy-intensive industries in the economy: share of gross value added of the energy-intensive industries in GDP
Electricity and gas prices for medium-sized industrial users: consumption band 500–20 00MWh and 10 000–100 000 GJ; figures
excl. VAT.
Recycling rate of municipal waste: ratio of recycled and composted municipal waste to total municipal waste
Public R&D for energy or for the environment: government spending on R&D for these categories as % of GDP
Proportion of GHG emissions covered by EU Emissions Trading System (ETS) (excluding aviation): based on greenhouse gas
emissions
(excl land use, land use change and forestry) as reported by Member States to the European Environment Agency.
Transport energy intensity: final energy consumption of transport activity (kgoe) divided by transport industry gross value
added (in 2005 EUR)
Transport carbon intensity: GHG emissions in transport activity divided by gross value added of the transport sector
Energy import dependency: net energy imports divided by gross inland energy consumption incl. consumption of
international bunker fuels
Aggregated supplier concentration index: covers oil, gas and coal. Smaller values indicate larger diversification and hence
lower risk.
Diversification of the energy mix: Herfindahl index over natural gas, total petrol products, nuclear heat, renewable energies
and solid fuels
* European Commission and European Environment Agency
Source: Source:
European Commission (Eurostat) unless indicated otherwise
Green growth performance 2010 2011 2012 2013 2014 2015
Macroeconomic
Energy intensity kgoe / € 0.20 0.19 0.18 0.18 0.19 0.18
Carbon intensity kg / € 0.44 0.39 0.36 0.37 0.35 -
Resource intensity (reciprocal of resource productivity) kg / € 1.08 1.06 1.03 1.07 0.99 0.98
Waste intensity kg / € 0.61 - 0.53 - 0.56 -
Energy balance of trade % GDP -2.8 -3.8 -2.6 -2.5 -2.4 -
Weighting of energy in HICP % 7.57 7.52 8.37 8.12 7.84 7.63
Difference between energy price change and inflation % 8.6 17.2 -3.2 -1.6 -2.6 -2.3
Real unit of energy cost% of value
added14.0 16.9 17.2 16.7 15.8 -
Ratio of environmental taxes to labour taxes ratio 0.13 0.14 0.13 0.13 0.13 -
Environmental taxes % GDP 2.7 3.0 3.0 2.9 2.9 -
Sectoral
Industry energy intensity kgoe / € 0.29 0.29 0.30 0.30 0.30 0.31
Real unit energy cost for manufacturing industry excl.
refining
% of value
added18.3 19.8 22.7 21.8 21.8 -
Share of energy-intensive industries in the economy % GDP 11.40 11.63 11.52 11.66 11.50 11.01
Electricity prices for medium-sized industrial users € / kWh 0.07 0.08 0.07 0.07 0.07 0.07
Gas prices for medium-sized industrial users € / kWh 0.03 0.04 0.05 0.05 0.05 0.04
Public R&D for energy % GDP 0.11 0.10 0.08 0.08 0.08 0.08
Public R&D for environmental protection % GDP 0.02 0.02 0.02 0.01 0.01 0.01
Municipal waste recycling rate % 32.8 34.8 33.3 32.5 32.5 40.6
Share of GHG emissions covered by ETS* % 55.5 52.7 48.5 49.9 48.8 45.8
Transport energy intensity kgoe / € 0.64 0.61 0.59 0.59 0.60 0.62
Transport carbon intensity kg / € 1.67 1.55 1.48 1.48 1.40 -
Security of energy supply
Energy import dependency % 47.8 52.8 46.3 48.6 48.9 46.8
Aggregated supplier concentration index HHI 72.2 80.0 68.0 68.3 67.5 -
Diversification of energy mix HHI 0.21 0.21 0.21 0.21 0.22 -

52
Ali-Yrkkö J, Rouvinen P, Sinko P and Tuhkuri J (2016) Finland in Global Value Chains. Prime
Minister’s Office publications 12/2016
Andersen, Torben M. and Svarer, Michael, Business cycle contingent unemployment insurance, in Nordic
Economic Policy Review, 1/2011
Bergholm, Tapio & Bieler, Andreas (2013) Globalization and the erosion of the Nordic model: A
Swedish–Finnish comparison
Borg A, Vartiainen J (2015) Strategia Suomelle. Valtioneuvoston kanslian julkaisusarja 5/2015.
Bouget D, Frazer H, Marlier E, Sabato S and Vanhercke B (2015): Social Investment in Europe: A study
of national policies. Brussels: European Commission
Calmfors, Lars, Wages and wage-bargaining institutions in the EMU – a survey of the issues, 2001
Calmfors, Lars and Driffill, John (1988) Bargaining Structure, Corporatism and Macroeconomic
Performance in Economic Policy
City of Helsinki (2016). Preparatory education,
Costa P., Ribeiro A., Van der Zee F., Deschryvere M. (2016), Framework conditions for High Growth
Innovative Enterprises, European Commission, Luxembourg
Danthine, Jean-Pierre and Hunt, Jennifer, Wage Bargaining Structure, Employment and Economic
Integration, Economic Journal, 1994
Economic Policy Council (2016) Talouspolitiikan arviointineuvoston lausunto vuoden 2017
budjettiesityksestä.
ECB (2016), Survey on the Access to Finance of Enterprises, June 2016
Elinkeinoelämän Keskusliitto (EK), EK selvitti: Kiky vei paikallista sopimista eteenpäin (2016)
(http://ek.fi/ajankohtaista/tiedotteet/2016/06/07/ek-selvitti-kiky-vei-paikallista-sopimista-eteenpain/)
Employment and Social Developments in Europe 2015
http://ec.europa.eu/social/main.jsp?catId=738&langId=en&pubId=7859&furtherPubs=yes
EUA (2016), Public Funding Observatory 2016
European Commission (2014) Macroeconomic Imbalances Finland 2014. European Economy, Occasional
papers 177.
European Commission-EPC, 2016. Joint Report on Health Care and Long-Term Care Systems and Fiscal
Sustainability. Volume 2 – Country documents. Brussels;
European Commission (2016a), Education and Training Monitor 2016 — Volume 2, Finland,
Publications Office of the European Union, Luxembourg.
European Commission (2016b), Europe’s Digital Progress Report,
European Commission (2016c), Country Report Finland 2016,
REFERENCES

References
53
European Commission (2017), Debt Sustainability Monitor 2016, Institutional Paper 047, January 2017
European Commission, European Investment Bank, European Investment Fund (2016), The Investment
Plan for Europe: state of play September 2016
European Job Mobility Laboratory, 2011, Partnerships among Employment Services
Eurostat (2015), Comparative price levels for food, beverages and tobacco
FVCA (2016) Venture Capital and Private Equity Industry in Finland 2015. Finnish Venture Capital
Association
Hansson P, and Lundberg L (1991) Näringsstruktur, strukturomvandling och produktivitet. In
Internationalisering och produktivitet. Expertrapport nr 8 till Produktivitetsdelegationen.
Kajanoja L (2012) Suomen kilpailukyky ja sen mittaaminen. Euro ja talous 5/2012 Bank of Finland.
Kangas, Olli, Ideasta kokeiluun? - Esiselvitys perustulokokeilun toteuttamisvaihtoehdoista, 2016:
(http://tietokayttoon.fi/julkaisu?pubid=10601)
Kela, Tilastollinen vuosikirja, 2015
Kiss, A. & Vandeplas, A. (European Commission) Measuring Skills Mismatch - Analytical Webnote,
2015 http://ec.europa.eu/social/BlobServlet?docId=14974
Kotamäki, Mauri & Kärkkäinen, Olli, Työllisyys kasvaa, työnteko vähenee? Työnteon kannustimet ja
suojaosareformin vaikutus, Finnish Labour Review 4/2014
Kröger, Mähönen, Klemetti, Nieminen, Paikallinen sopiminen – uhasta mahdollisuudeksi, in Finnish
Labour Review 2/2016
Lehto E (2016) Laskelmia kilpailukykysopimuksen vaikutuksista. PT-blogi 6.4.2016.
http://www.labour.fi/ptblogi/2016/04/06/laskelmia-kilpailukykysopimuksen-vaikutuksista/
LVM (2016a), Ministry of Transport and Communications: press release 01.08.2016
LVM (2016b), Ministry of Transport and Communications: press release 22.09.2016
Melbourne Mercer Global Pension Index (2016). http://www.globalpensionindex.com/
Ministry of Finance (2016) Pika-arvio kilpailukykysopimuksen vaikutuksista. Memo.
http://valtioneuvosto.fi/documents/10623/1985149/Valtiovarainministeriön+arvio+työmarkkinajäjestöjen
+neuvottelutuloksen+vaikutuksista+29.2.2016/
Ministry of Economic Affairs and Employment 2016a, Employment Bulletin, September 2016:
http://julkaisut.valtioneuvosto.fi/bitstream/handle/10024/75581/TKAT_Syys_2016.pdf?sequence=1
Ministry of Economic Affairs and Employment 2016b, Työllisyyspaketti -työryhmän esitykset, Ministry
of Economic Affairs and Employment publications 33/2016
Ministry of Economic Affairs and Employment 2016c, Työ- ja elinkeinoministeriön lyhyen aikavälin
työmarkkinaennuste, syksy 2016

References
54
Ministry of Education and Culture (2015), Tomorrow’s comprehensive school
Ministry of Social Affairs and Health http://stm.fi/en/frontpage
Määttänen N and Ropponen O, Listaamattomien osakeyhtiöiden verotus, voitonjako ja investoinnit.
ETLA reports Nr 40 12/2014
Närvi, Johanna, Äidit kotona ja työssä – perhevapaavalinnat, työtilanteet ja hoivaihanteet, 2014:
http://www.julkari.fi/bitstream/handle/10024/116920/narvi.pdf?sequence=1
Obstbaum, Meri and Vanhala, Juuso, Paikallinen Sopiminen in Kansantaloudellinen aikakauskirja,
2/2016
OECD (2013), Programme for International Student Assessment (PISA) 2012
OECD (2016a) Economic Surveys – Finland, January 2016;
OECD (2016b), Back to Work: Finland: Improving the Re-employment Prospects of Displaced Workers,
OECD Publishing, Paris
OECD (2016c), Education at a Glance 2016. OECD Indicators
OECD (2016d), Financing SMEs and entrepreneurs 2017: an OECD scoreboard
OECD (2016e), The Walking Dead? Zombie Firms and Productivity Performance in OECD Countries
OECD (2016f), R&D Tax Incentive Indicators, July 2016.
OKM (2015), Ministry of Education and Culture: National action plan / Finland
Pitkänen, Sari – Mertala, Sirpa - Ala-Kauhaluoma, Mika, TE-palveluissa vahvistettava kokeiluista
kumppanuuksiin perustuvaa monikanavaisuutta ja yhteiskehittämistä, 1/2016, in Finnish Labour Review,
http://tem.fi/tyopoliittinen-aikakauskirja
Prime Minister's Office (2016), Hallituksen esitys Eduskunnan vuoden 2016 toiseksi lisätalousarvioksi,
2016, https://www.eduskunta.fi/FI/vaski/HallituksenEsitys/Documents/HE_88+2016.pdf.
Prime Minister’s Office (2016a), Action plan for the implementation of the key project and reforms
defined in the Strategic Government Programme
Prime Minister’s Office (2016b), Growth drivers and bottlenecks of start-up companies, Publications of
the Government’s analysis, assessment and research activities 30/2016
Prime Minister’s Office (2017) Business taxation, investments and productivity
Richardson, Linda, Costs of Childcare Across OECD Countries, 2012
(http://www.ifs.org.uk/docs/OECD%20countries_Richardson.pdf)
SOSTE, Lausunto Eduskunnan työelämä- ja tasa-arvovaliokunnassa, 11.11.2016
The Social Situation Monitor (SSM), Making Work Pay", 2016,
http://ec.europa.eu/social/BlobServlet?docId=16330&langId=en

References
55
TEM (2016), Ministry of Economic Affairs and Employment: press releases
Thévenon, O. and Solaz, A. (2013), “Labour Market Effects of Parental Leave Policies in OECD
Countries”, OECD Social, Employment and Migration Working Papers, No. 141, OECD Publishing
Uusitalo R (1999) Miten kävi hallitun rakennemuutoksen? VATT-Discussion Papers 206. Government
Institute for Economic Research.
Valtioneuvoston kanslia, Tuloverotuksen vaikutus työn tarjontaan, 2015,
http://vnk.fi/documents/10616/2009122/5_Tuloverotuksen+vaikutus+ty%C3%B6n+tarjontaan.pdf/1d853
9b5-f354-4f31-93cf-9a70a6b32c37?version=1.0
Viitamäki, Heikki, Työnteon kannustimet, mitä jää käteen?, VATT, 2015
VM (2016a), Ministry of Finance: Economic survey, Autumn 2016
VM (2016b), Ministry of Finance: Budget review 2017
Yrittäjät (2016a), Pk-yritysbarometri 2/2016 (Federation of Finnish Enterprises, Finnvera, Ministry of
Economic Affairs and Employment)
Yrittäjät (2016b), Syksyn 2016 Pk-yritysbarometri (Federation of Finnish Enterprises, Finnvera, Ministry
of Economic Affairs and Employment)