EMPORIA STATE R EJ EARCH STUDIES
28
EMPORIA STATE , R EJ EARCH STUDIES THE GRADUATE PUBLICATION OF THE EMPORIA KANSAS STATE COLLEGE Filt<i;-Feeding Dvnamics J Cladocerans Stephen W. Waite
Transcript of EMPORIA STATE R EJ EARCH STUDIES
E M P O R I A STATE
, R EJ E A R C H S T U D I E S
THE GRADUATE PUBLICATION OF THE EMPORIA KANSAS STATE COLLEGE
Filt<i;-Feeding Dvnamics J
Cladocerans
Stephen W. Waite
Filter-Feeding Dvnamics .'
of Two Kansas Cladocerans
I
7he C)npoia state Rebewch Studieb EMPORIA KANSAS STATE COLLEGE
EMPORIA, KANSAS 66801 i
by
Stephen W. Waite
L
Volunle XXV Fall, 1976 Number 2
THE EMPORIA STATE RESEARCH STUDIES is published quarterly
by The School of Graduate and I'rnfessional Studies of the En~poria Kansas
Sti~te Collegc, 1200 Commcrcial St., Emporin, Kansas, 66801. Entered
as second-class matter September 16, 1952, nt the post office at Emporia,
Kansas, under the act of August 24, 1912. Postage paid at Emporia, Kansas.
ERlYORZA KANSAS STATE COLLEGE:
EMPORIA, KANSAS
JOHN E. VISSER
President of the College
SCHOOL OF GRADUATE AND PROFESSIONAL STUDIES
HAROLD DURST, Dean
EDITORIAL BOARD
WILLIAM H. SEKLER, Profe~sor of History and Chairperson, Division of Social Sciences
CHARLES E. Professor of English and Chairperson of Department
GREEN D. WYRICK, Professor of English
Editor of this Issue: WILLIAM H. SEILER
Papers published in this periodical are written by faculty members of the Emporia Kansas State College and by either undergraduate or graduate students whose studies are conducted in residence under the supervision of a faculty member of the college.
"Stat.ernent required by the Act of October, 1962; Section 4369, Title 39, United States Code, showing Ownership, Management and Circula- tion." The Emporia State Research Studies is published quarterly. Edi- torial Office and Publication Office a t 1200 Commercial Street, Emporia, Kansas. (66801). The Research Stuldies is edited and published by t.he Emporia Kansas State College, Emporia, Kansas.
A complete list of all publications of The Emporia State Research Studies is published in the fourth number of each volume.
Filter-Feeding Dynamics
of Two Kansas Cladocerans
Stephen W. Waite *
INTRODUCTION
Recent efforts to construct refined models simulating energy flow and nutrient cycling in aquatic systems have emphasized the lack of information concerning the microstructure and function of such systems (Patten, 1971). Previously, the ecologist was interested only in gross behavior of the broad producer, consumer and decomposer categories of the system; thus, scarcity of such information remained largely un- noticed. But when greater resolution in energy models is sought, the information gap becomes obvious. For example, if an energy model of the limnoplankton of a lake is to be constructed and tested, knowledge of in situ feeding rates of micrograzers and the effects of various en- vironmental conditions on these rates is essential.
Two early attempts to measure zooplankton feeding rates were made by Fuller and Clarke (1936) and Fuller (1937). They used the cell-count method in which the number of food cells in a medium was determined prior to and following a period during which experimental animals were allowed to feed. However, other studies demonstrated that feeding rates determined in pure food cultures were in considerable error when extrapolated to the natural environment, since they are in- Fluenced by such physical factors as temperature (McMahon, 1962), chemical nature of the food (Reeve, 1963a), food particle size (Burns, 1969), and food concentration (Rigler, 1961 ) . Phytoplankters are assumed to be a major food source but colloidal particles, yeast, detritus and bacteria are also important (Jgrgenson, 1962; Federov and Sorokin, 1967). Arnold (1969) reported the presence of certain Cyanophyta in low concentrations inhibited grazing, and Ryther (1954) concluded that log-phase algal cultures chemically inhibited feeding rates. Yet, sus- pended organic and inorganic particles in lake water apparently increase feeding rates (Reeve, 1963b). -
Few studies have measured natural feeding rates without evident complications. Nauwerck (1959) measured filtering rates in natural
* Stephen W. Waite is on the staff of the Illinois Natural History Survey, University of Illinois, Urbana-Champaign. This study originated as a master's thesis in the Division of Biological Sciences at Emporia Kansas State College under the direction of Dr. Carl W. Prophet.
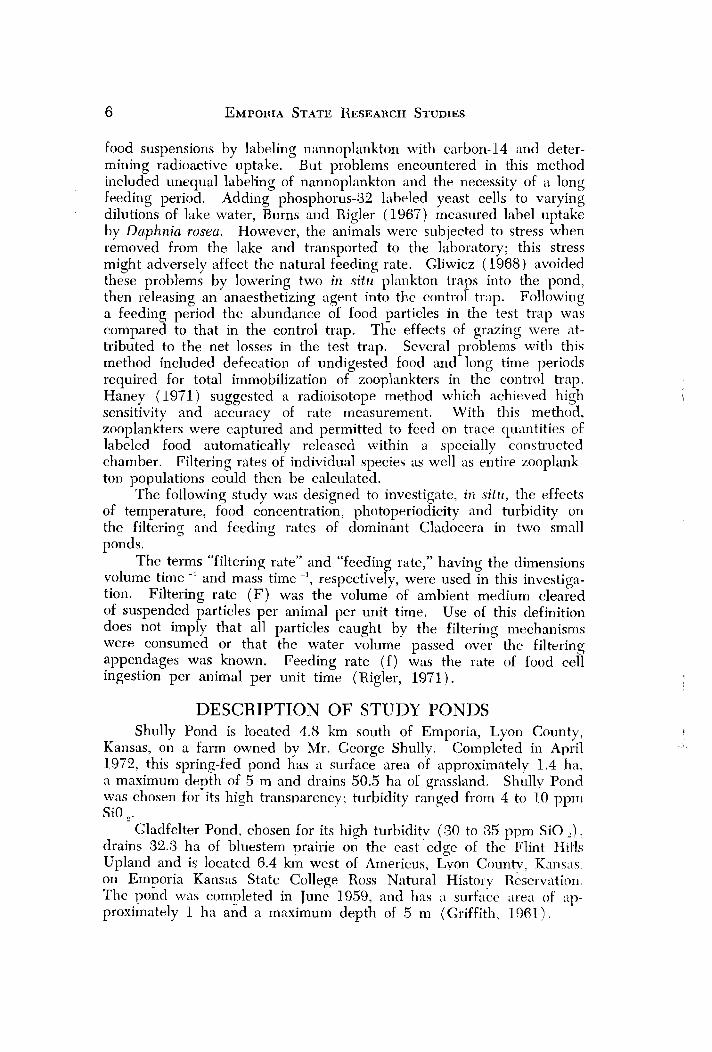
food suspensions by labeling nannoplankton with carbon-14 and deter- mining radioactive uptake. But problems encountered in this method included unequal labeling of nannoplankton and the necessity of a long feeding period. Adding phosphorus-32 labeled yeast cells to varying dilutions of lake water, Burns and Rigler (1967) measured label uptake by Daphnia Toseu. However, the animals were subjected to stress when removed from the lake and transported to the laboratory; this stress might adversely affect the natural feeding rate. Gliwicz (1968) avoided these problems by lowering two in sit11 plankton traps into the pond, then releasing an anaesthetizing agent into the controf trap. Following a feeding period the abundance of food particles in the test trap was compared to that in the control trap. ~ h k effects of grazing were nt- tributed to the net losses in the test trap. Several with this method included defecation of undigested food and long time periods required for total imniobilization of zooplankters in the control trap. Haney (1971) suggested 11 I-adioisotope method which achieved high sensitivity and accuracy of rate measurement. With this method, zooplankters were captured and permitted to feed on trace quantities of labeled food automatically released within a specially constructed chamber. Filtering rates of individual species as well as entire zooplank- ton populations could then be calculated.
The following study was designed to investigate, in sit lr, the effects of temperature, food concentration, photoperiodicity and turbidity on the filtering and feeding rates of dominant Cladocera in two small ponds.
The terms "filtering rate" and "feeding rate," having the dimensions volume time -' and mass time ' , respectively, were used in this investiga- tion. Filtering rate (F) was the volume of ambient medium cleared of suspended particles per animal per unit time. Use of this definition does not imply that all particles caught by the filtering mechanisms were consumed or that the water volume passed overL the filtering appendages was known. Feeding rate ( f ) was the rate of food cell ingestion per animal per unit time (Rigler, 1971 1.
DESCRIPTION OF STUDY PONDS Shully Pond is located 4.8 km south of Emporia, Lyon County,
Kansas, on a farm owned by Mr. George Shully. Completed in ~ ~ ; i l 1972, this spring-fed pond has a surface area of approximntelv 1.4 ha, a maximum denth of 5 m and drains 50.5 ha of grassland. Shullv Pond was chosen fo<its hieh transnarency; turbidity ranged from 4 to 10 ppm SiO .,.
Gladfelter Pond. chosen for its high turbiditv (30 to 35 ppm SiO ,), drains 32.3 ha of bluestem nrairie on the east edge of the Flint Hll'ls Upland and is located 6.4 k k west of ,4mericus, h o n Countv. Kansas on Emooria Kansas State College Ross Natural Historv Reservation The pokl was comnleted in Tune 1959, and has '1 surface .il-aa of .ip- proximately 1 ha and a maximum depth of 5 m (Griffith, 1961).
METHODS AND MATERIALS
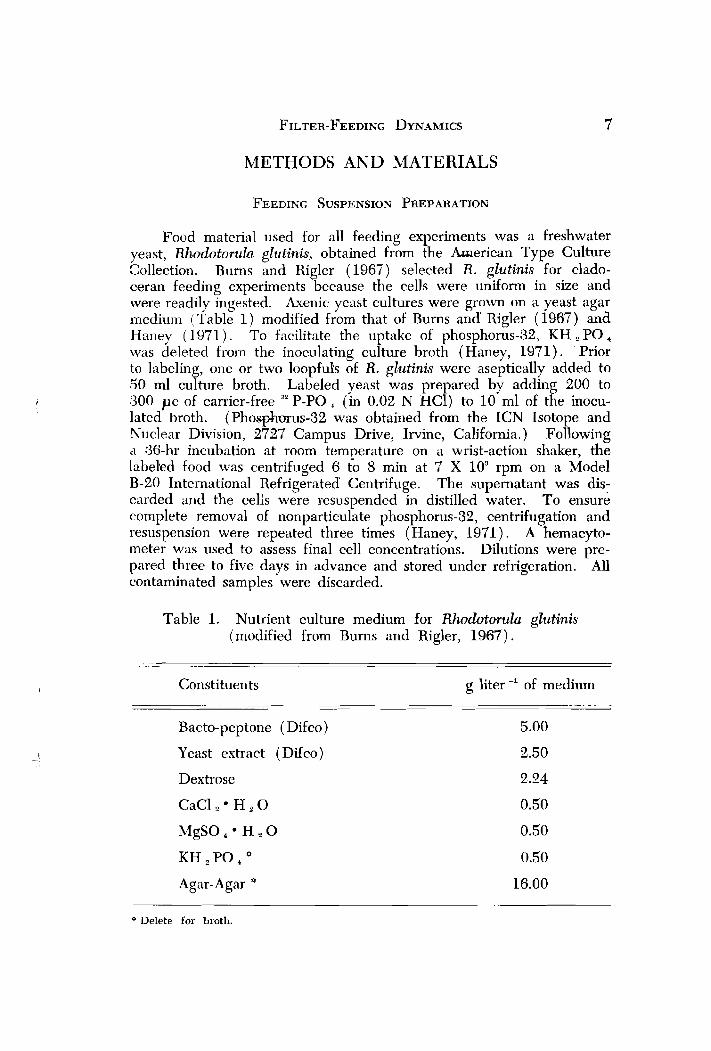
Food material used for all feeding experiments was a freshwater yeast, Rhodotorula glutinis, obtained from the American Type Culture Collection. Burns and Rigler (1967) selected R. glutinis for clado- ceran feeding experiments because the cells were uniform in size and were readily ingested. Axenic yeast cultures were grown on a yeast agar medium (Table 1 ) modified from that of Burns and Rigler (1967) and Harley ( 1971). To facilitate the uptake of phosphorus-32, KH , PO, was deleted from the inoculating culture broth (Haney, 1971). Prior to labeling, one or two loopfuls of R. glutinis were aseptically added to 50 ml culture broth. Labeled yeast was prepared by adding 200 to 300 p c of carrier-free :" P-PO , (in 0.02 N HC1) to 10 ml of the inocu- lated broth. (Phasphmus-32 was obtained from the ICN Isotope and Nuclear Division, 2727 Campus Drive, Irvine, California.) Following a 36-hr incubation at room temperature on a wrist-action shaker, the labeled food was centrifuged 6 to 8 min at 7 X lo3 rpm on a Model B-20 International Refrigerated Centrifuge. The supernatant was dis- carded and the cells were resuspended in distilled water. To ensure complete removal of nonparticulate phosphorus-32, centrifugation and resuspension were repeated three times (Haney, 1971). A hemacyto- meter was used to assess final cell concentrations. Dilutions were pre- pared three to five days in advance and stored under refrigeration. All contaminated samples were discarded.
Table 1. Nutrient culture medium for Rh&torula glutinis (modified from Burns and Rigler, 1967).
Constituents g liter of medium
Bacto-peptone (Difco) 5.00
Yeast extract (Difco) 2.50
Dextrose 2.24
Agar-Agar " 16.00 ~-
* Delete for broth.
Harley (1971) and Crowley (1973) suggested that 5 minutes was an acceptable feeding time. Their observations revealed postabdominal egestion of the label occurred 4 to 7 min after ingestion. I confirmed these experiments by feeding red dyed yeast suspensions to Daplania parvula Fordyce adults. Smaller daphnids began to defecate within 4 or 5 min while larger animals required 5.5 to 6 min. Since the loss of any labeled food by defecwtion would alter the results. the feeding period was set at less than the minimum time (5 min) required for food material to pass through the gut (Burns and Rigler, 1967).
Feeding was terminated by immersing test animals in a 50% al- cohol-4% formalin solution, followed by distilled water rinse to remove extraneous labeled cells adhering to animal bodies. Animals were separated by species and transferred to aluminum plnnchets for drying and then coated with two applications of Raye's clear plastic spray.
Radioactivity of zooplankters and labeled yeast suspeilsions was measured using a Nuclear Chicago gas-flow counter equipped with an automatic printer and sample changer. All results were corrected for background. No corrections for self-absorption were necessary, as phosphorus-32 is a high energy beta emitter.
To prepare the labeled food cells for radioactive assay, two 5.0 ml samples were drawn through 25 mm millipore filters ( H A ) . Each filter was placed on a planchet, dried and sprayed in the same manner used for the animals.
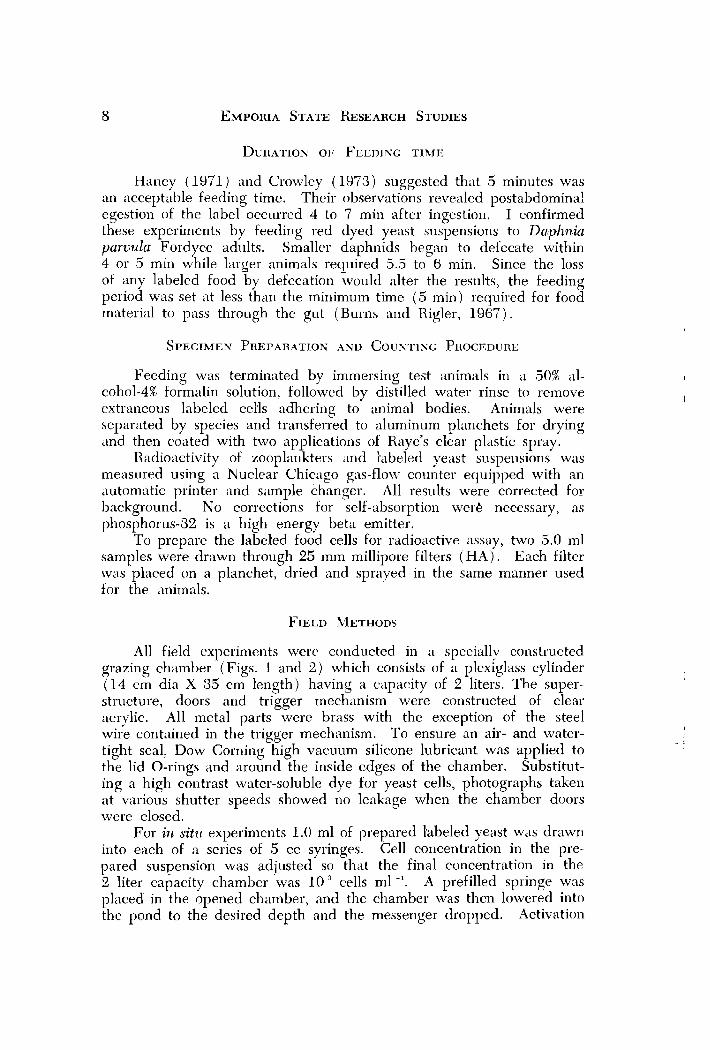
All field experiments were conducted in a speciillly constructed grazing chamber (Figs. 1 and 2 ) which consists of a plexiglass cylinder (14 cm dia X 35 cm length) having a capacity of 2 liters. The super- structure, doors and trigger mechanism were constructed of clear acrylic. All metal parts were brass with the exception of the steel wire contained in the trigger mechanism. To ensure an air- and water- tight seal, Dow Corning high vacuum silicone lubricant was applied to the lid O-rings and around the inside edges of the chamber. Substitut- ing a high contrast water-soluble dye for yeast cells, photographs taken at various shutter speeds showed no leakage when the chamber doors were closed.
For in situ experiments 1.0 ml of prepared labeled yeast was drawn into each of a series of 5 cc syringes. Cell concentration in the pre- pared suspension was adjusted so tha t the final concentration in the 2 liter capacity chamber -was 10 "ells ml -'. A prefilled springe was placed in the opened chamber, and the chamber was then lowered into the pond to the desired depth and the messenger dropped. Activation
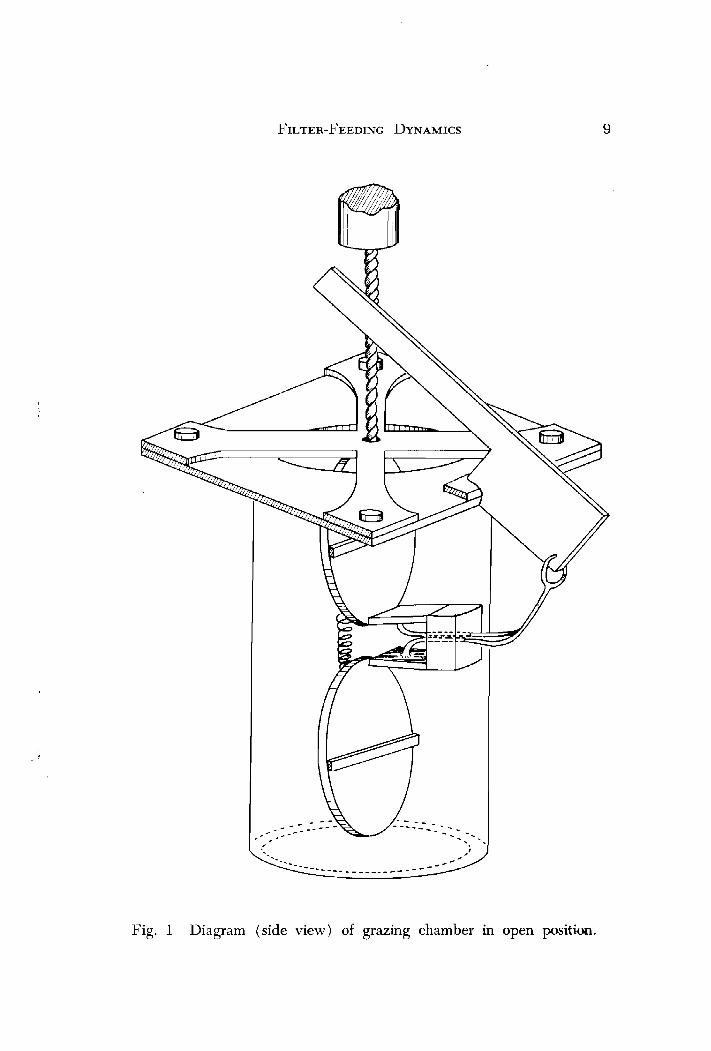
Fig. 1 Diagram (side view) of grazing chamber in open position.
Fig. 2 Diagram (side view) of grazing chamber in closed position.
of the trigger mechanism closed the chamber doors, forcing labeled food from the syringe. Following a 5 min feeding period, the chamber was quickly retrived and drained. Captured zooplankters were collected on netting attached to the bottom of a plastic funnel and killed by immer- sion in 50% alcohol-4% formalin solution. Netting containing the animals was placed in small vials and transported to the laboratory. Separation of species and counting techniques were similar to those described above. Waste water from the experiments was collected in a 21 liter plastic carboy and taken to the laboratory for decontamination.
The filtering rate was calculated by substituting the duration of feeding period, radioactivity of feeding suspension and radioactivity of zooplankters in equation ( 1 ) :
where F is the filtering rate in ml animal -l hr -', a is the counts min -' animal -', s is the counts min -' ml -' of grazing chamber suspension and T is the duration of feeding in min.
Feeding rate was then obtained by multiplying the filtering rate by the cell concentration in the food suspension, - equation ( 2 ) :
f = F x C ( 2 )
where f is the feeding rate in cells animal -' hr -l, F is filtering rate, and C is the cell concentration in cells ml -l. Filtering and feeding rates were calculated using the equations of Burns and Rigler (1967).
In this study, all statistical analyses were made using the Student t-test which compared the differences between two means at p = 0.05 level of significAce.
RESULTS AND DISCUSSON
Preliminary experiments were conducted on each of the two study ponds to determine whether or not there was a significant difference in filtering by cladoceran populations between ponds. Three field runs were made on each pond each day for a one-week period (24 Aug. 1974 to 1 Sept. 1974). While conducting the runs several hours before sunset was simply a matter of convenience, visits to the ponds were alternated
B A Y S
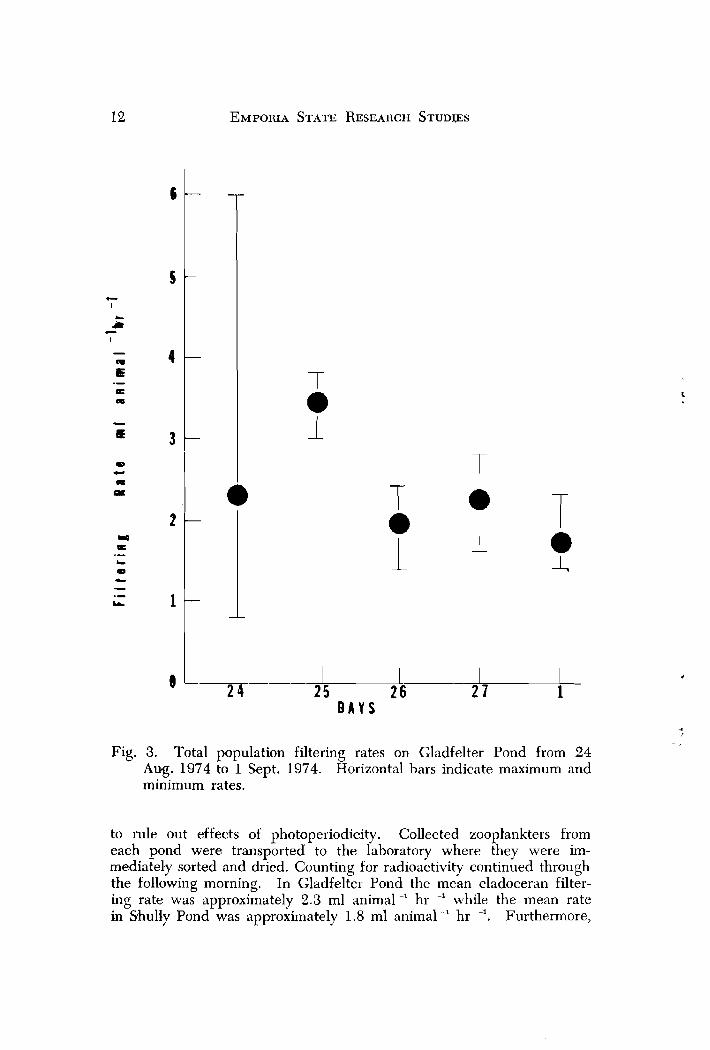
Fig. 3. Total population filtering rates on Gladfelter Pond from 24 Aug. 1974 to 1 Sept. 1974. Horizontal bars indicate maximum and minimum rates.
to rule out effects of photoperiodicity. Collected zoopl'ankters from each pond were transported to the laboratory where they were im- mediately sorted and dried. Counting for radioactivity continued through the following morning. In Gladfelter Pond the mean cladoceran filter- ing rate was approximately 2.3 ml animal -' hr ' while the mean rate in Shully Pond was approximately 1.8 ml animal -' hr -I. Furthermore,
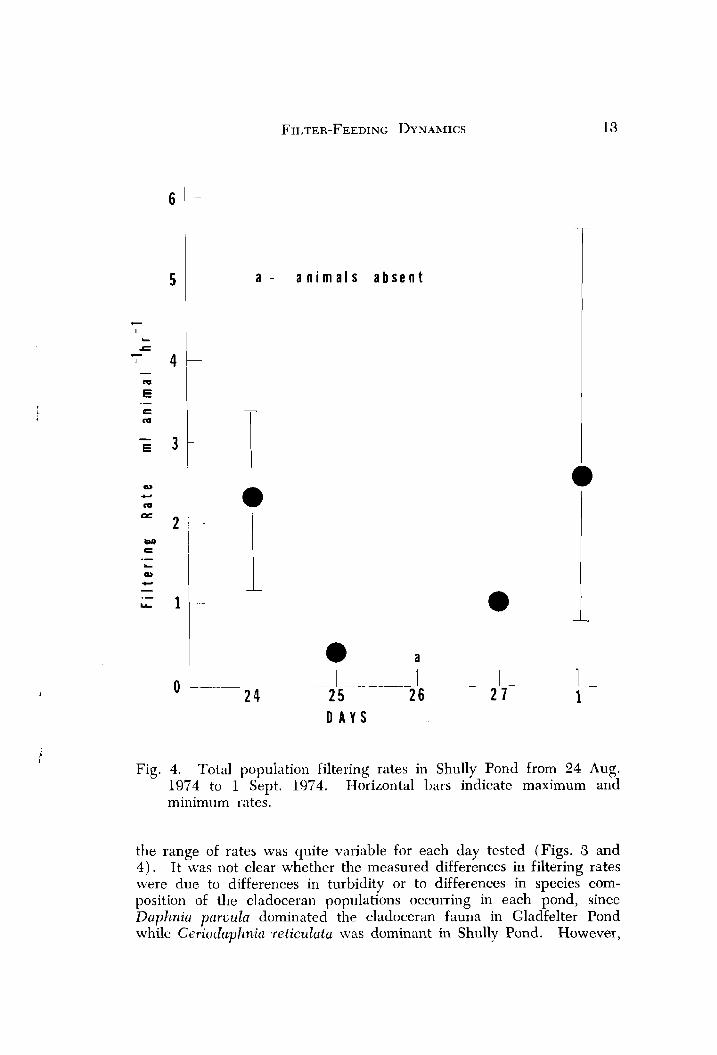
a - a n i m a l s a b s e n t
0 L L L 2 4 25 2 6 L l - 2 7 1 D A Y S
Fig. 4. Total population filtering rates in Shully Pond from 24 Aug. 1974 to 1 Sept. 1974. Horizontal bars indicate maximum and minimum rates.
the range of rates was quite variable for each day tested (Figs. 3 and 4 ) . It was not clear whether the measured differences in filtering rates were due to differences in turbidity or to differences in species com- position of the cladoceran populations occurring in each pond, since Daphnia parvula dominated the cladoceran fauna in Gladfelter Pond while Ceriodnphnin ~reticulata was dominarlt in Shully Pond. However,
several individuals of the dominant species in each pond were observed in the other pond.
Would the same trends occur if the Gladfelter cladocerans were allowed to feed in Shully Pond water? If so, the observed differences might be due to differences in species composition. To test this hypo- thesis the following set of laboratory experiments was conducted.
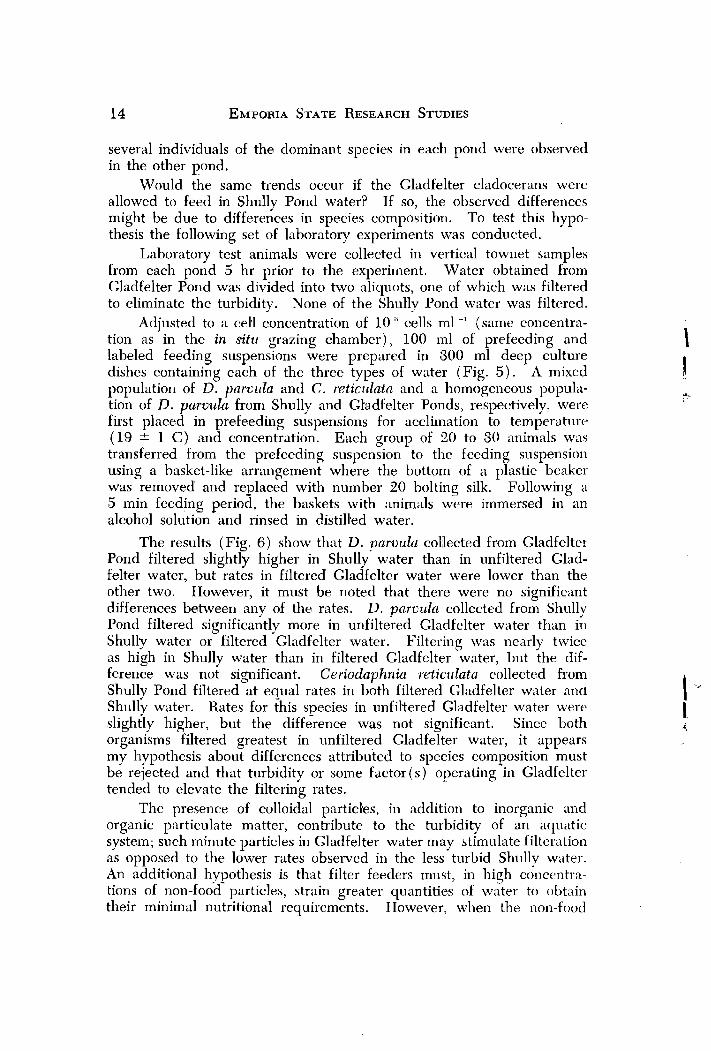
Laboratory test animals were collected in vertical townet samples from each pond 5 hr prior to the experiment. Water obtained from Gladfelter Pond was divided into two aliquots, one of which was filtered to eliminate the turbidity. None of the Shully Pond water was filtered.
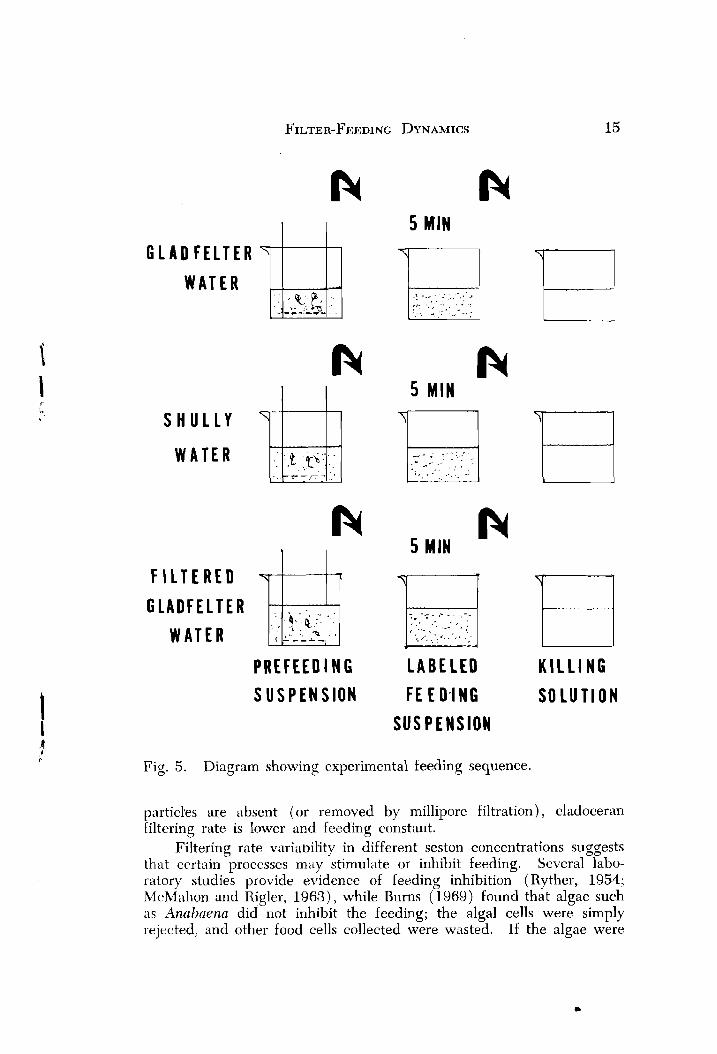
Adjusted to a cell concentration of 10 :' cells ml (same concentra- tion as in the in situ grazing chamber), 100 ml of prefeeding and labeled feeding suspensions were prepared in 300 ml deep culture dishes containing each of the three types of water (Fig. 5) . A mixed population of D. par~u la and C . reticzllatn and n homogeneous popula- tion of D. parvukz from Shully and Gladfelter Ponds, respectively, were first placed in prefeeding suspensions for acclimation to temperature (19 2 1 C) and concentration. Each group of 20 to 30 animals was transferred from the prefeeding suspension to the feeding suspension using a basket-like arrangement where the bottom of a plastic beaker was removed and replaced with number 20 bolting silk. Following a 5 min feeding period, the baskets with animals were immersed in an alcohol solution and rinsed in distilled water.
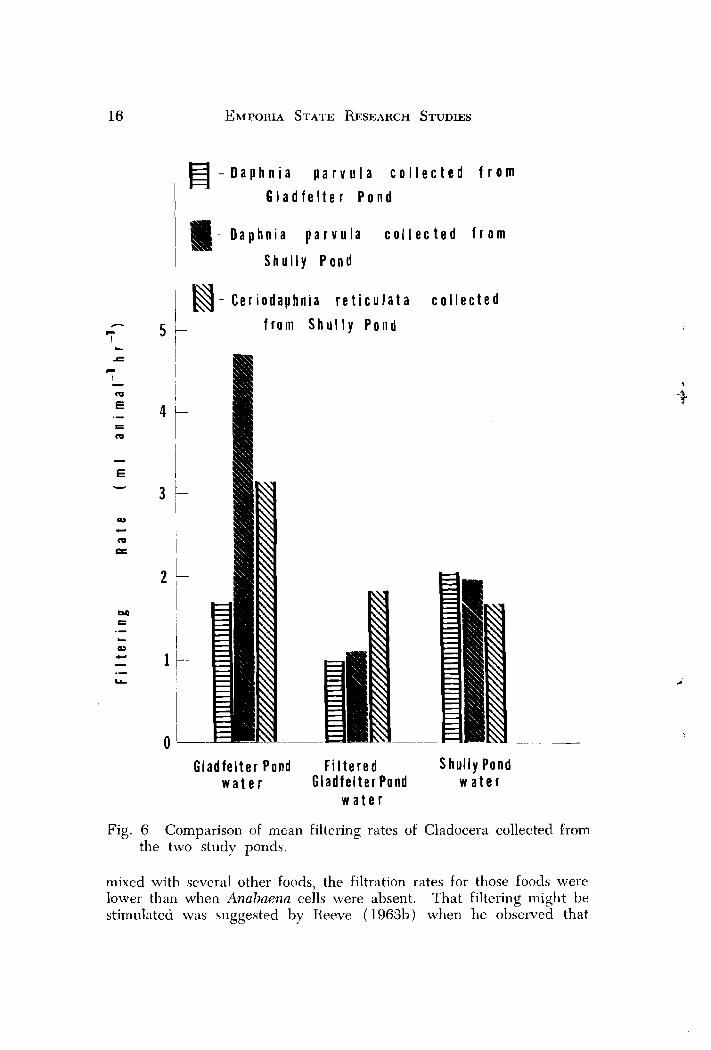
The results (Fig. 6) show that D. naruulu couected from Gladfelter Pond filtered slightly higher in shullye water than in unfiltered Glad- felter water, but rates in filtered Gladfelter water were lower than the other two. However, it must be noted that there were no significant differences between any of the rates. D. paruula collected from Shully Pond filtered significantly more in unfilteied Gladfelter water than in Shully water or filtered Gladfelter water. Filtering was nearly twice as high in Shully water than in filtered Gladfelter water, 11ut the dif- ference was not significant. Ceriodaphnia reticirlata collected from Shullv Pond fiItered at equal rates in both filtered Gladfelter water and shuliY water. Rates for ihis species in unfiltered Gladfelter water were slightly higher, but the difference was not significant. Since both organisms filtered greatest in unfiltered Gladfelter water, it appears my hypothesis about differences attributed to species composition must be rejected and that turbidity or some factor(s) operating in Gladfelter tended to elevate the filtering rates.
The presence of colloidal particles, in addition to inorganic and organic particulate matter, contribute to the turbidity of an aquatic system; such minute particles in Gladfelter water may stimulate filteration as opposed to the lower rates observed in the less turbid Shullv water. An additional hypothesis is that filter feeders must, in high cc;ncentla- tions of non-food- particles, strain greater quantities of water to obtain their minimal nutritional requirements. However, when the non-food
5 MIN G L A D F E L T E R
W A T E R ,- :.q. . . ..
---.---, . ' 1 : '. . ,y , : - ,., . , . ., -':
5 MIN
S H U L L Y
W A T E R . . , . .. . , .. . . . . .. .. -
1 n
I 5 MIN Fc
F I L T E R E D Y / i G L A D F E L T E R ., . . . ., . .
W A T E R a L--'- -
P R E F E E D I N G L A B E L E D S U S P E N S I O N F E E D.1 NG
S U S P E N S I O N
K I L L 1 NG
S O L U T I O N
Fig. 5. Diagram showing experimental feeding sequence.
particles are absent (or removed by millipore filtration), cladoceran Filtering rate is lower and feeding constant.
Filtering rate variability in different seston concentrations suggests that certain processes may stimulate or inhibit feeding. Several labo- ratory studies provide evidence of feeding inhibition (Ryther, 1954; McMahon and Rigler, 1963), while Burns (1969) found that algae such as Atlahuenu did not inhibit the feeding; the algal cells were simply rejected, and other food cells collected were wasted. If the algae were
I - D a p h n i a p a r v u l a c o l l e c t e d f r o m
G l a d f e l t e r P o n d
I a- D a p h n i a p a r v u l a c o l l e c t e d f r o m
1 S h u l l y P o n d
1 - C e r i o d a p h n i a r e t i c u l a t a c o l l e c t e d
C fro111 S h u l l y P o l i d I
G l a d f e l t e r Porld F i l t e r e d S h u l l y P o n d w a t e r G l a d f e l t e r Pond w a t e r
w a t e r
Fig. 6 Comparison of mean filtering rates of Cladocera collected from the two study ponds.
mixed with several other foods, the filtration rates for those foods were lower than when Anuhaena cells were absent. That filtering rnight be stimulated was suggested by Reeve (1963b) when he observed that
Artemia ingested algal cells three time faster when additions of fine sand were added to the suspension. Differing thresholds or reaction by tension receptors in the gut may also affect cladoceran filtering behavior (Hutchinson, 1967).
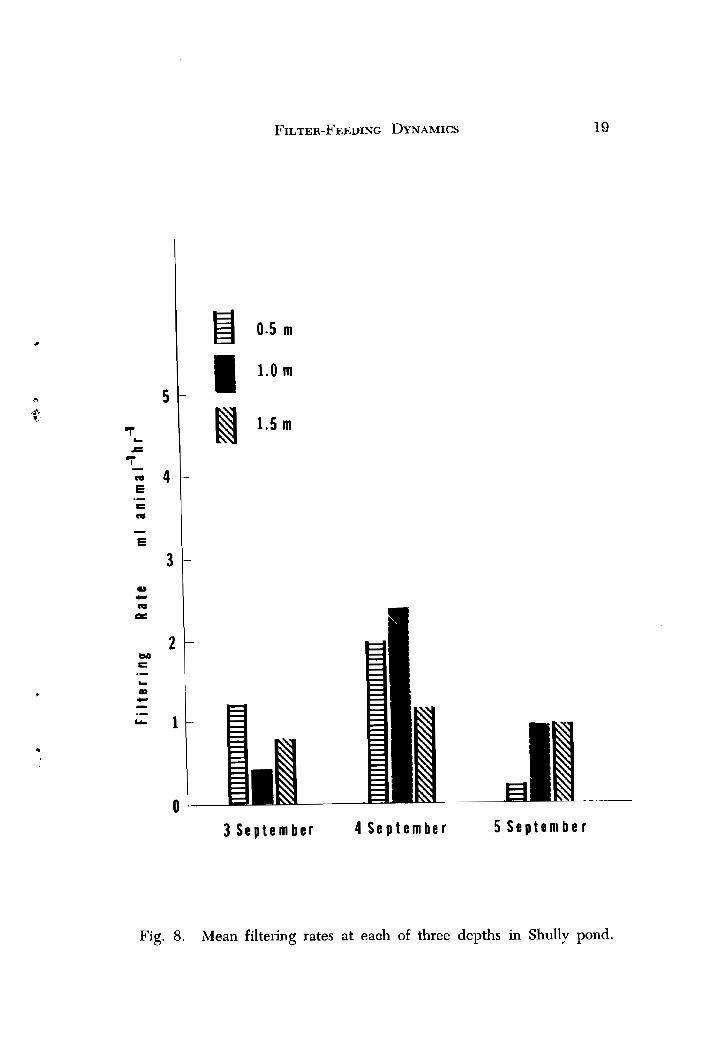
The animals collected during the preliminary in situ tests were captured at similar depths in each pond, but it was not known if the total population filtering rates at these depths were indicative of rates at all depths in each pond. Light intensity and color play a major role in the filter-feeding behavior of some aquatic organisms (Smith and Baylor, 1953; Harris and Wolfe, 1955). I t is possible that changes in light intensity and quality differ as light is Gansmitted through the turbid Gladfelter water compared to that in the less turbid Shully water. To test this hypothesis, tKe following experiment was conducted at three depths on the study ponds for three succeeding days (3 Sept. to 5 Sept, 1974). Although color and extinction coefficients were not cal- culated, turbidity was measured using a Hellige Turbidimeter. The experiments were conducted on both ponds 2 hr prior to sundown each day. At least three replicate samples were taken at 0.5, 1.0 and 1.5 m depths in each pond.
Yeast cell suspensions in the grazing chamber were adjusted to 10 "ell's ml -' and the feeding period was limited to 5 min. All animals were transported to the laboratory for sorting and drying. Radioactive counting continued through the following morning. Mean filtering rates in both ponds were calculated for the total cladoceran populations at each depth.
The results reveal highly variable rates at each of the three depths during the study (Figs. 7 and 8) . In Gladfelter Pond, filtering rates were lowest at 0.5 m for 3 Sept. to 4 Sept. (approximately 1 ml animal -' hr I ) , but increased significantly (0.05 level) to 8 ml animal -l hr -' on 5 Sept. Filtering at 1.5 m varied slightly during the experiment, sug- gesting that below the euphotic zone (0.5 to 1.0 m ) , animals were not affected by light. In general, the results were variable, but for the most part, differed little between depths. Since all samples in this experiment were taken at sundown, the hypothesis that filtering rates may be higher or lower at other times during the day was proposed.
Little is known of the effects of natural photoperiodicity. Smith and Baylor (1953) have shown movement responses when daphnids are sub- jected to vertical and horizontal light beams. Such movement responses may be related to filtering and feeding behavior; hence an additional experiment was designed to investigate the effects of photoperiodicity on feeding.
To determine die1 variation, cladoceran filtering rates were measured in both study ponds at each of three depths during the hours of sunrise
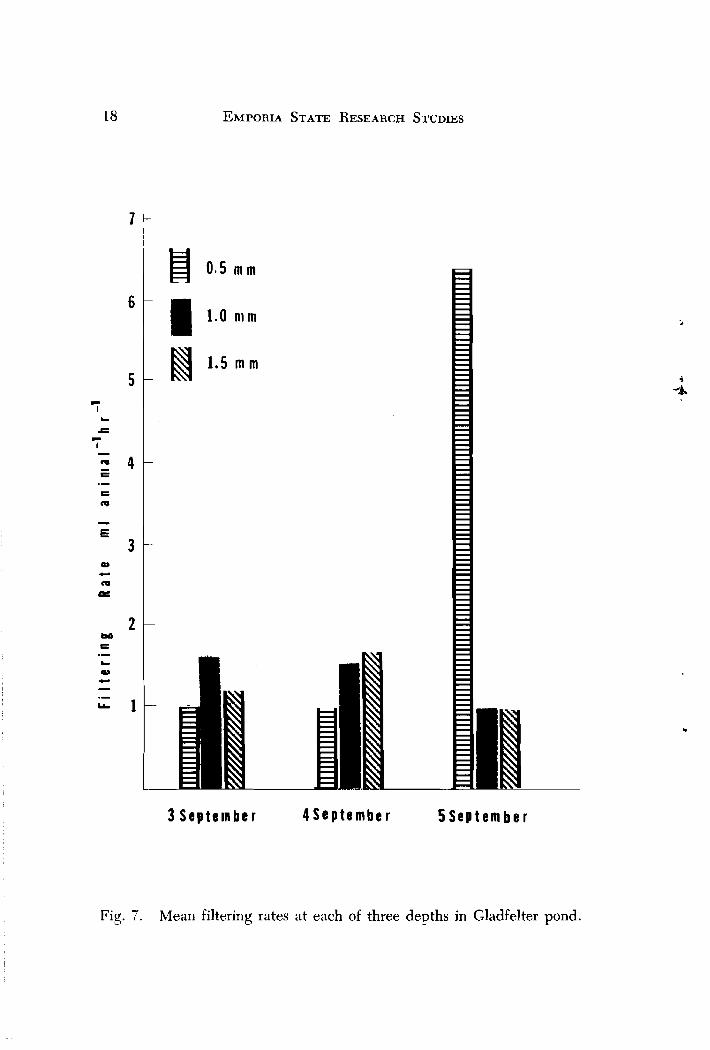
Fig. 7 . Mean filtering rates at each of three devths in Gladfelter pond.
3 S e p t e m b e r 4 S e p t e m b e r 5 S e p t e a b e r
Fig. 8. Mean filtering rates at eauh of three depths in Shully pond.
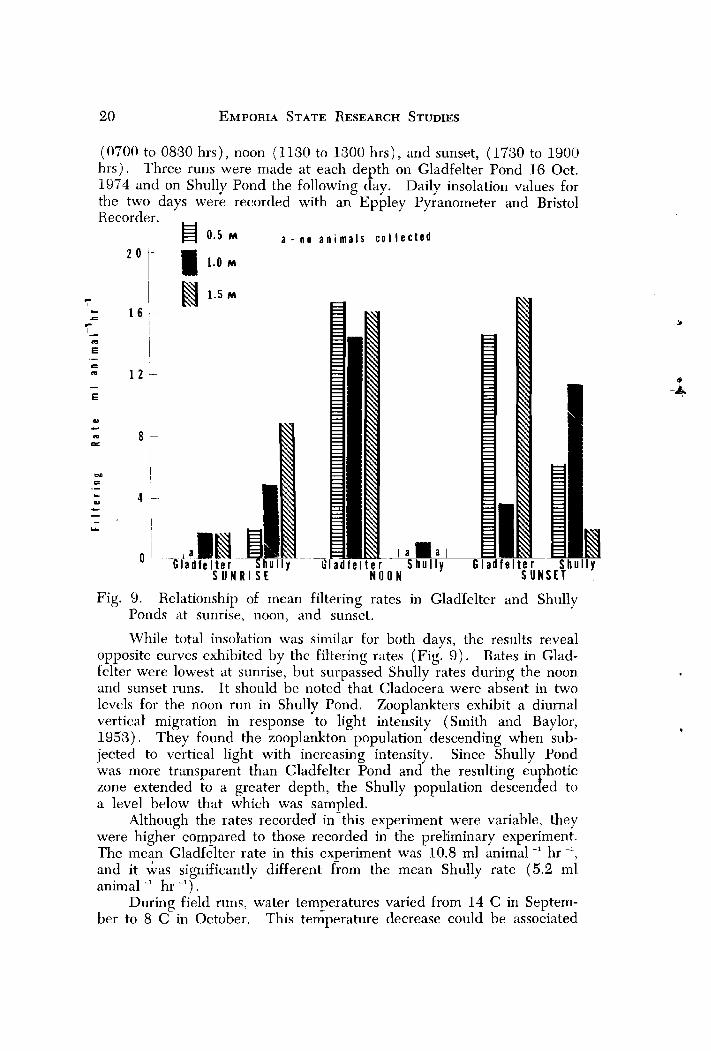
(0700 to 0830 hrs), noon (1130 to 1300 hrs), and sunset, (1730 to 1900 hrs). Three runs were made at each depth on Gladfelter Pond 16 Oct. 1974 and on Shully Pond the following day. Daily insolation values for the two days were recorded with an Eppley Pyranometer and Bristol Recorder. , 0.5 M a - n o a n i m a l s c o I l e c t e d
i a G l a d f e l t e r
S U N R I S E '
- G l a d f e l t e r
S U N S h u l l y
S E T
Fig. 9. Relationship of mean filtering rates in Glad'felter and Shully Ponds at sunrise, noon, and sunset.
While total insolation was similar for both days, the results reveal opposite curves exhibited by the filtering rates (Fig. 9 ) . Rates in Glad- Eelter were lowest at sunrise, but surpassed Shully rates during the noon and sunset runs. I t should be noted that Cladocera were absent in two levels for the noon run in Shully Pond. Zooplankters exhibit a diurnal vertical' migration in response to light intensity (Smith and Baylor, 1953). They found the zooplankton population descending when sub- jected to vertical light with increasing intensity. Since Shully Pond was more transparent than Gladfelter Pond and the resulting euphotic zone extended to a greater depth, the Shully population descended to a level below that which was sampled.
Although the rates recorded in-this experiment were variable, they were higher compared to those recorded in the preliminary experiment. The mean Gladfelter rate in this experiment was 10.8 ml animal -l hr -', and it &as significantly different &om the mean Shully rate (5.2 ml animal -' hr -I).
During field runs, water temneratures varied from 14 C in Septem- ber to 8 C in October. This temperature decrease could be associated
with the observed two-fold increase in mean filtering rates through this time period. Further studies were needed to augment this research since natural rates are affected by other interrelated factors, such as temperature and food concentration. Therefore, it was hypothesized that temperature and food concentration affected feeding behavior, and a laboratory experiment was designed to test this hypothesis.
Using Daphnia roseu cultured at 12 C for a prolonged period of time, Kibby (1971) observed that, following acclimation to cooler temperatures, the filtering rates were higher than expected. He sug- gested that possibly the energy budgets of the zooplankters prompted an increased filtering rate at cooler temperatures.
-
With respect to food concentration, experiments conducted by Marshall and Orr (1955), McMahon and Rigler (1963) and Crowley (1973) suggest several trends indicative of filter-feeding animals. Below a certain concentratioil (called "incipient limiting concentra- tion"), filtering rates are constant and maximum while feeding rates are directly proportional to food concentri~tion. Above the incipient con- centration, filtering declines to a point near zero, and feeding rates are constant and maximum.
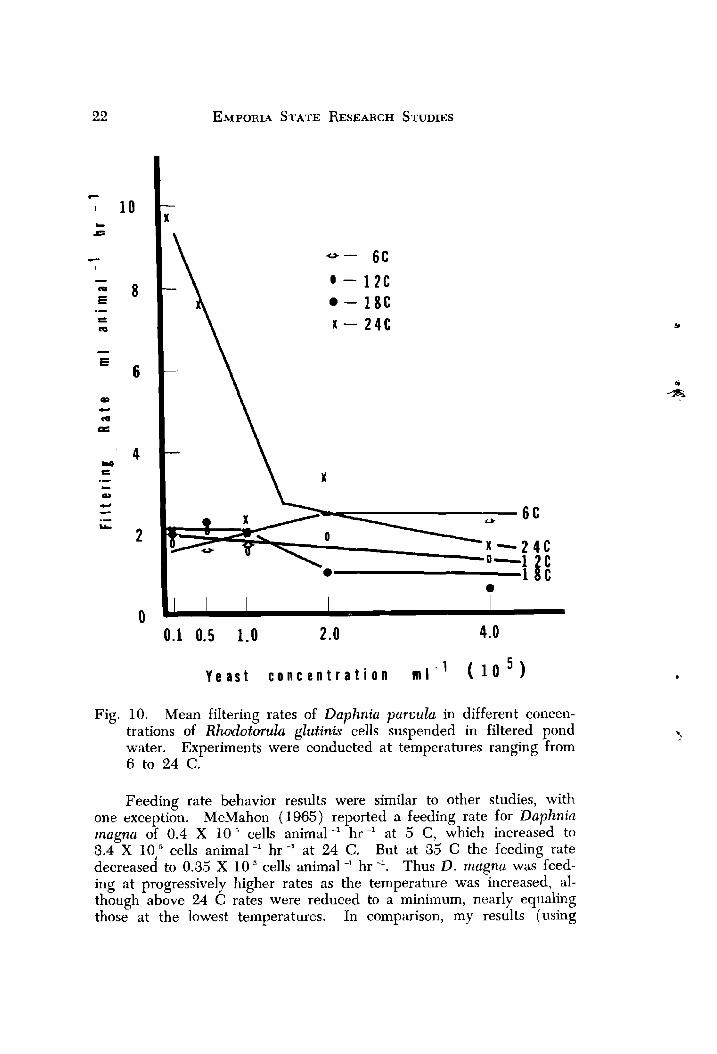
In this laboratory experiment, 20 to 30 D. pnrvula (average length 1.2 mm) were allowed to feed in each of five cell concentrations rang- ing from 0.1 X 10 " cells ml -' to 4.0 X 10 " cells ml -'. All tests were conducted at temperatures of 6, 12, 18 and 24 C. Animals were ac- climated to cell concentration and temperature by placement in a pre- feeding suspension 1 to 2 hr prior to the experiment (Burns and Rigler, 1967; Rigler, 1971 ) . The calculated mean filtering rates represent four to five repetitions at each temperature.
The results reveal that filtering rates in concentrations below the incipient concentration ( approximately 1.0 X 10 " cells ml -') were af- fected by temperature (Fig. 10) . An inci ient concentration did not exist at 6 C, but possibly the incipient levef at this temperature was a concentration higher than those used in this experiment. While filtering rates were similar at 6, 12 and 18 C, rates at 24 C were nearly five tinies higher at the lowest concentration. Filtering rates at 24 C and a concentration of 0.1 X 10 "ells ml-' were found to be significantly higher (0.05 level) than rates at other temperatures at the same con- centration. However, differences between filtering rates at all tempera- tures above the incipient concentration were not significant. One hypothesis may be-suggested 'to explain the high rate exhibited at 24 C. At a temperature above 18C, resuliing high metabolic demands must be met in low food concentrations by a higher intake of food; hence, a higher filtering rate.
Y e a s t c o n c e n t r a t i o n
Fig. 10. Mean filtering rates of Daphnia paruula in different concen- trations of Rhudotmulu glutinis cells suspended in filtered pond water. Experiments were conducted at temperatures ranging from 6 to 24 C.
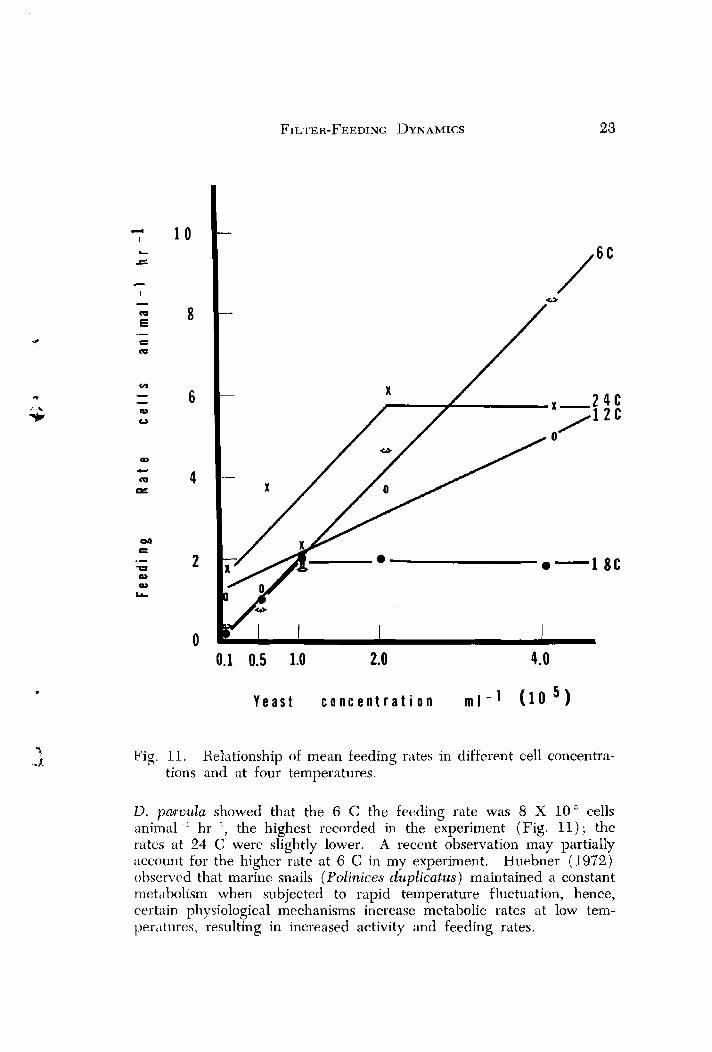
Feeding rate behavior results were similar to other studies, with. one exception. McMahon (1965) reported a feeding rate for Daphnia tnagna of 0.4 X 1 0 " cells animal hr at 5 C, which increased to 3.4 X 10,%ells animal -' hr -' at 24 C. But at 35 C the feeding rate decreased to 0.35 X 10 "ells animal hr -'. Thus 0. magnu was feed- ing at progressively highe'r rates as the temperature was increased, al- though above 24 C rates were reduced to a minimum, nearly equaling those at the lowest temperatures. In comparison, my results (using
Y e a s t c o n c e n t r a t i o n m l - 1 (10 5 ,
Fig. 11. Relationship of mean feeding rates in different cell concentra- tions and at four temperatures.
D. paruula showed that the 6 C the feeding rate was 8 X 1 0 ~ e l l s animal -' hr -', the highest recorded in the experiment (Fig. 11 ) ; the rates at 24 C were slightly lower. A recent observation may partially account for the higher rate at 6 C in my experiment. Huebner (1972,) observed that marine snails (Polinices dupli&tus) maintained a constant metabolism when subjected to rapid temperature fluctuation, hence, certain physiological mechanisms increase metabolic rates at low tem- peratures, resulting in increased activity and feeding rates.
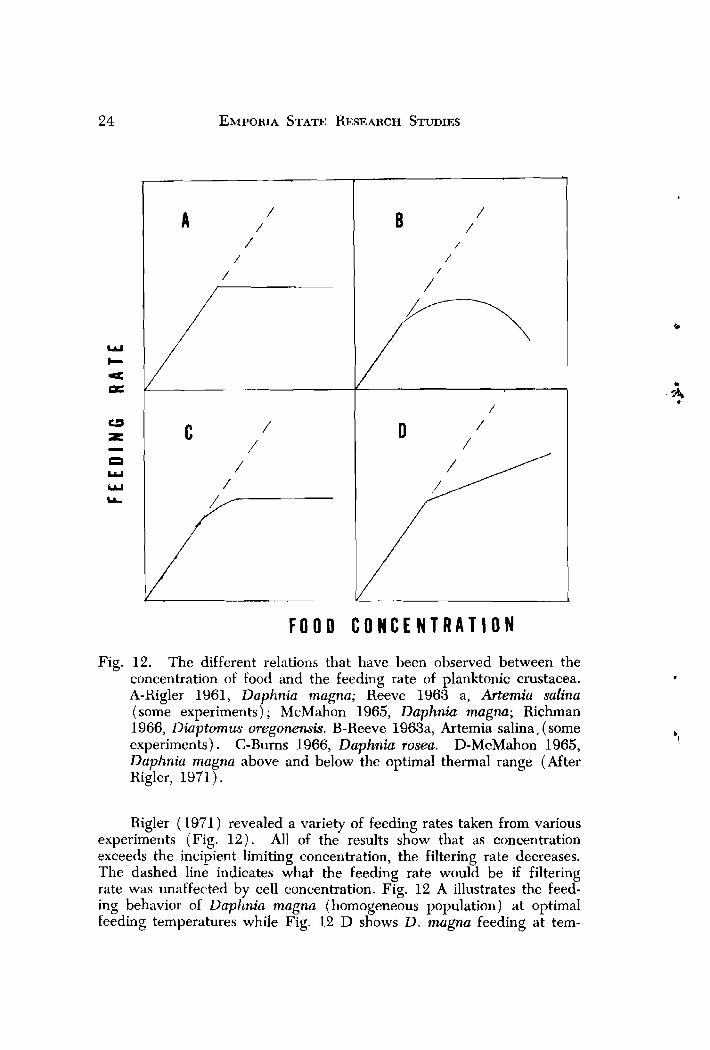
F O O D C O N C E N T R A T I O N
Fig. 12. The different relations that have been observed between the concentration of food and the feeding rate of planktonic crustacea. A-Rigler 1961, Daphnia magna; Reeve 1963 a, Artemia salina (some experiments); McMahon 1965, Daphnia magnu; Richman 1966, Diaptomus oregonewis. B-Reeve 1963a, Artemia salina, (some experiments). C-Burns 1966, Daphnia rosea. D-McMahon 1965, Dapltnia magna above and below the optimal thermal range (After Rigler, 1971).
Rigler (1971) revealed a variety of feeding rates taken from various experiments (Fig. 12) . All of the results show that as concentration exceeds the incipient limiting concentration, the filtering rate decreases. The dashed line indicates what the feeding rate would be if filtering rate was unaffected by cell concentration. Fig. 12 A illustrates the feed- ing behavior of Daphnia magna (homogeneous population) at optimal feeding temperatures while Fig. 12 D shows D. mugna feeding at tem-
peratures above and below the optimal range. Although the optimal range was not defined for these experiments, my results revealed similar relationships. Feeding at 6 C ( ~ i g 11) indicates that possibly the filter- ing rate was not affected by food concentration. The 12 C rates follow- ed the relationship in Fig. 12 D,' hence rates at this temperature and 6 C were below the optimal range. Feeding rates calculated at 18 to 24 C are similar to the rates in Fig. 12 A, thus these two temperatures are within the optimal temperature range for D. parvuh.
Further research is needed to determine seasonal optimal tempera- ture ranges and the effects of temperatures above and below such ranges at varying food concentrations.
ADDITIONAL STUDIES IN SECONDARY PRODUCTIVITY
Often the aquatic ecologist seeks to examine only a particular species or population in the light of its own properties without regard to the ecosystem in which it exists. Hall (1971) emphatically states that the ecologist must fully understand the formation of consumer organisms (i.e., consumption, transformation and utilization of food) when probing into the organization of natural communities in terms of the energy flow between trophic levels.
Presently, more research in the form of laboratory experimentation coupled with sound field techniques and manipulations are needed to examine satisfactorily secondary production as a whole. Through the course of my research, I have atempted to "accumulate" questions ap- propriate to' further field-oriented research. Some questions are of my own design while others were obtained from Hall (1971) and Rigler (1971).
1. What role do the physicochemical factors such as temperature, light, pH and oxygen tension play on annual secondary production? How does the physical make-up of the environment (sediment type, vegetation, morphometry) affect production? Does production below the compensation level vary from that within the euphotic zone?
2. How does the interspecific competition between fast-growing and slow-growing species affect production processes?
3. In terms of turnover rates and ~ i e l d , how does the impact of zooplankton, benthos and fish predation affect production dynamics? In what way does nutrient cycling affect herbivore pressure on plants? What are the relationships between the observed natural oscillations of the phytoplankton and zooplankton populations?
A follow-up s f this last-question resulted in an interesting applica- tion of some of my filtering data. The average density of all cladoceran species in the upher 2 m of Gladfelter Pond during late summer 1974 was roughly 30-animals liter -' and the overall mean filtering rate was
approximately 2 ml animal -l hr - I . The volume of Gladfelter Pond is approximately 1.7 1Y 10 ' m ' or 1.7 X 10 ' liters. Multiplying the aver- age animal density times the volume resulted in a cladoceran population of nearly 5.1 X 1 0 " animals. If the filtering rate was 2 ml animal -' hr -', then the total population filtered the equivalent total volume of the 1.0 ha Gladfelter Pond once everv 16.7 hrs. During the period of one week, the pond was filtered approximately 10 times.
In conclusion, more applications of this kind are needed before the production dynamics of aquatic herbivore populations can be fully under- stood.
SUMMARY
An investigation of the effects of turbidity, die1 periodicity, food concentration and temperature on cladoceran filter-feeding behavior us- ing radioactive yeast was conducted on two ponds during summer 1974.
A prelimiGary study revealed higher filtering rates in the more turbid pond, and further experimentation indicated the observed dif- ferences were not due to differences in species composition. Although the rate in the turbid pond was not significantly higher than that in the clear pond, the higher rate was attributed to turbidity and other en- vironmental factors.
Die1 periodicity affected grazing in both ponds but in an opposite fashion. A direct relationship existed between the filtering and feeding rates of Daphnia palrvzlla anJ food concentration. The optimal tempera- ture range'for this species was 18 to 24 C, and a decrease in water temperatures below this range resulted in increased feeding rates.
LITERATURE CITED
Arnold, D. E. 1969. Feeding studies on Daphnia pz~lex using seven blue-green algae. Ph.D. Dissertation. Cornell Univ. 89 p.
Burns, C. W. 1968. The relationshin between body size of Cladocera and the maximum size of - ingested. Limnol. and Oceanogr. 13: 675-678.
..................... 1969. Relations between filtering rate, temperature and body size in four species of Daphnia. Limnol. and Oceanogr. 14:693-700.
Burns, C. W. and F. H. Rigler. 1967. Comparison of filtering rates of Daphnia rosea in lake water and in suspensions of yeast. Limnol. and Oceanogr. 12: 492-502.
Crowley, P. H. 1973. Filtering rate inhibition of Daphnia pulex in V17intergreen Lake water. Limnol. and Oceanogr. 18:394-402.
Federov, V. K. and Y. I. Sorokin. 1967. Determination of the as- simibility of algae, yeasts and bacteria for some representatives of the Cladocera. Doklady Biol. Sci. 174:329.
Fuller, J. L. 1937. Feeding rate of Calun~~s finmarchicus in relation to environmental condition. Biol. Bull. 72 : 233-246.
Fuller, J . L. and G. L. Clarke. 1936. Further experiments on the feed- ing of Calanus finmarchicus. Biol. Bull. 70:308-320.
Gliwicz, Z. M. 1968. The use of anaesthetizing substances in studies on the food habits of zooplankton communities. Ekol. Polska 16 (A) :279-295.
Griffith, S. J. 1961. The physical' and chemical characteristics and oc- currence of fauna in a new impoundment. Unpublished Master's Thesis, Emporia Kansas State College.
Hall, D. J . 1971. The experimental field approach to secondary pro- duction, p. 210-221. In W. T. Edmondson and G. G. Winberg (eds.) A manual on methods for the assessment of secondary pro- ductivity in freshwaters. Int. Biol. Programme by Blackwell 'scien- tific Publ., Oxford. IBP Handbook No. 17.
Haney, J. F. 1971. An in sit11 method for the measurement of zoo- plankton grazing rates. Limnol. and Oceanogr. 16:970.
Harris, J. E. and V. K. Wolfe. 1955. A laboratory study of vertical migration. Proc. R. Soc. 144 (B ) : 329-354.
Huebner, J. D. 1973. The effect of body size and temperature on the respiration of Polinices duplicatus. Comp. Biochem. Physiol. 44: 1185-1197.
Hutchinson, G. E. 1967. A treatise on limnology. Vol. 11. Introduction to lake biology and the limnoplankton. John Wiley and Sons, New York. 1115 p.
Ttrgenson, C. B. 1962. Biology of suspension feeding. Internatl. Ser. Monog. in Pure and Applied Biol. Zool. Div. vol. 27. Pergamon Press.
Kibby, H. V. 1971. Effect of temperature on the feeding behavior of Daphnia rosea. Limnol. and 06eanogr. 16: 580-581.
Marshall, S. M. and A. P. Orr. 1955. On the biology of Calanus finmarchicus VIII. Food uptake, assimilation and excretion in adult and stage V Calanus. J. Marine Biol. Assoc. U. K. 34:495-529.
McMahon, J. W. 1962. The feeding behavior and feeding rate of Daphnia w g n a in different concentrations of foods. Ph.D. Dis- sertation. Univ. Toronto. 91 p.
..................... 1965. Some physical factors influencing the feeding behavior of Daplinia magna. Can. J . Zool. 43:603-611.
Mchlahon, 1. W. and F. H. Rigler. 1963. Mechanisms regulating the feeding rate of Daphnia magnu. Can. 1. Zool. 41:321-332.
Nauwerck, A. 1959. Zur bestimmung der filtrierrate limnischer plank- toniere. Arch. Hydrobiol. 1 : 83- 101.
Patten, B. C. 1971. Systems analysis and simulation in ecology. Academic Press, New York. vol 1. 607 p.
Reeve, M. R. 1963a. The filter-feeding of Artemia I. In pure cultures of plant cells. J. Exptl. Biol. 40: 195-205.
..................... 196313. The filter-feeding of Artemia II. In suspensions of various particles. J. Exptl. Biol. 40:207-214.
Rigler, F. H. 1961. The relation between concentration of food and feeding rate of Daphn.ia magna. Can. 1. Zool. 39:857-868.
..................... 1971. Feeding p. 228-256. In W. T. Edmondson and G. G. Winberg (eds.) A manual on methods for the assessment of secondary productivity in freshwaters. Int. Biol. Programme by Blackwell Scientific Publ., Oxford. IBP Handbook No. 17.
Ryther, J. H. 1954. Inhibiting effects of phytoplankton upon the feeding of Daphniu magna with reference to growth, reproduction and survival. Ecology 35:522-533.
Smith, F. E. and E. R. Baylor. 1953. Color responses in the Clad'ocera and their ecological 'significance. Am. Nat. 87: 49-55.