Graduate Unemployment situation in Ghana and Proposed Solutions
Employment - Unemployment Situation In
Million Plus Cities of India - A Critical Analysis
- By DR.B.K.Sharma & N.T.Krishna
DES,N.C.T.Delhi
mployment – Unemployment is a hotly debated subject among academicians,
government circles as this is viewed as one of the important outcomes of ultimate
success or otherwise of public policies. This aspect is of great concern for the
public at large because standard of living, disposable income, savings, education, health and
overall psyche of the society is determined by current levels of employment and un-
employment. Social behavioural analysts, of late, hold the view that unrest among the youth in
the present day highly lop sided society is mainly due to high levels of un-employment which
in turn leads to insecurity and related consequences thereof. Such a conclusion calls for the
study of this sensitive issue with care, as factual position will serve as an eye opener for policy
makers/administrators to initiate suitable measures to remedy the situation.
Generation of gainful employment both skilled and unskilled has been one of the
important target areas vigorously pursued under the planning process both by central/state
governments. However, the wide gap between the job seekers and avenues of employment has
become the thing of the bygone era as the economy is firmly looking up at present. According
to a recent press release by the Prime Miniser’s Economic Advisory Council (EAC)
(Economic Outlook 2004-05) that attainment of 8% GDP growth rate by 2010 will lead to a
situation where in work force is expected to equal labour force (Dr.Rangarajan) which may
mean that unemployment will be at very low levels irrespective of the quality of employment
and quantum of remuneration.
E
2
FOCUS OF THE PAPER The main focus of this paper is to analyse the changing trends in employment-unemployment
situation of million plus cities/towns of India (As per population census 2001list at annexure)
and also give meaningful inputs to policy makers/administrators and enhance the vision and
readiness to tackle the situation.
WORKER POPULATION RATIOS (WPR) In the first instance analysis of the trends in worker- population proportions in the
million plus cities of India was taken up for study. These cities have been further grouped
under metros and other million plus cities as former ones possess certain distinctive features
from that of the later.
SINKING WPRs IN METROPOLITAN CITIES
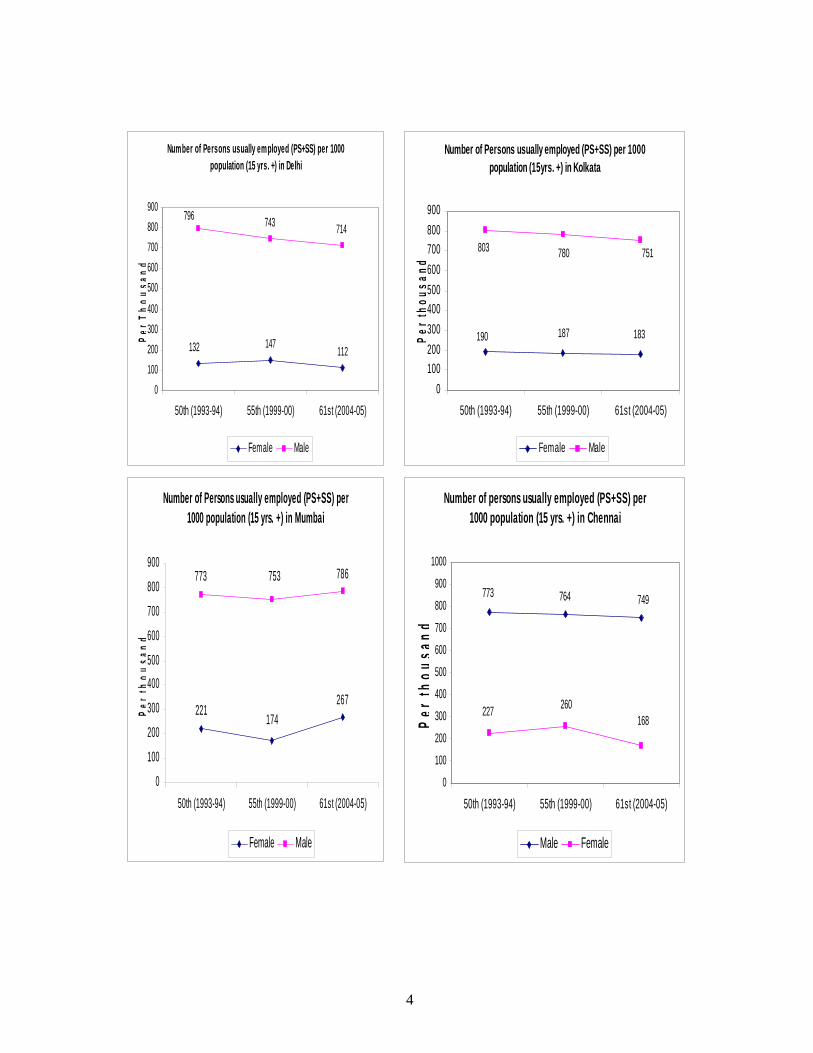
The proportion of usually employed persons (15+ aged) in the population of
metropolitan cities of the country has shown a definite slide with the sole exception of
Mumbai city which had exhibited booming trends amply justifying the commercial capital tag
attached to it.
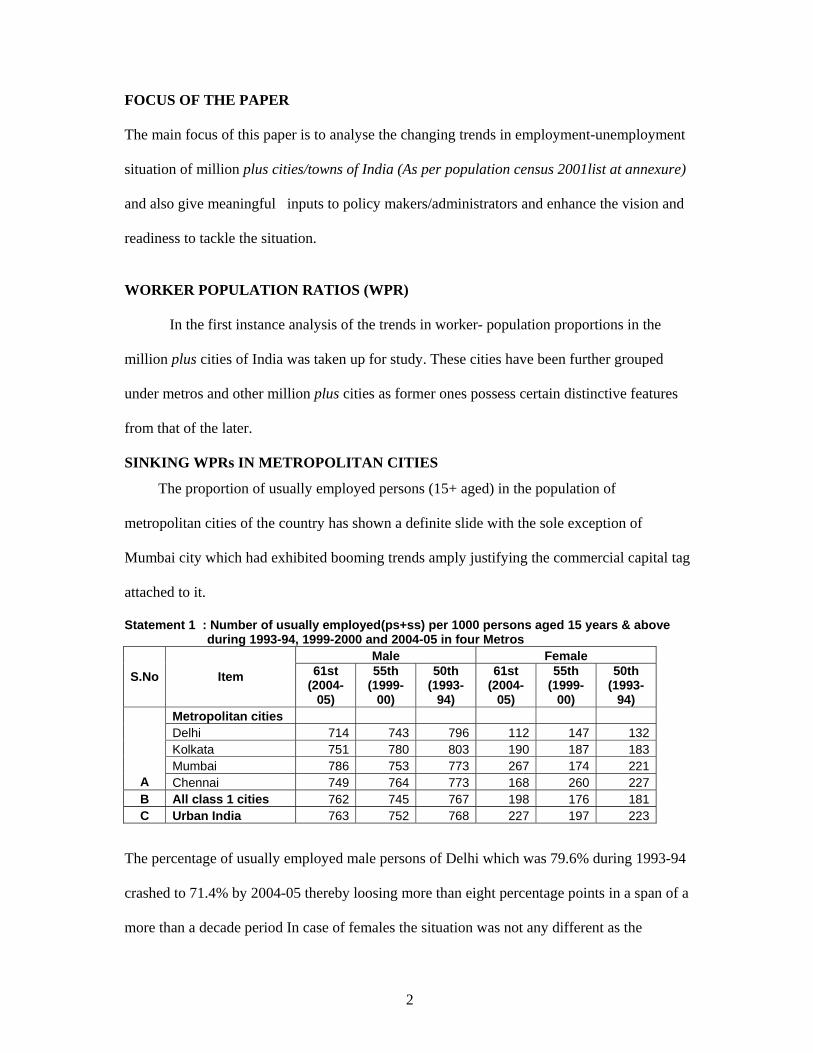
Statement 1 : Number of usually employed(ps+ss) per 1000 persons aged 15 years & above during 1993-94, 1999-2000 and 2004-05 in four Metros
Male Female S.No Item 61st
(2004-05)
55th (1999-
00)
50th (1993-
94)
61st (2004-
05)
55th (1999-
00)
50th (1993-
94) Metropolitan cities Delhi 714 743 796 112 147 132 Kolkata 751 780 803 190 187 183 Mumbai 786 753 773 267 174 221
A Chennai 749 764 773 168 260 227 B All class 1 cities 762 745 767 198 176 181 C Urban India 763 752 768 227 197 223
The percentage of usually employed male persons of Delhi which was 79.6% during 1993-94
crashed to 71.4% by 2004-05 thereby loosing more than eight percentage points in a span of a
more than a decade period In case of females the situation was not any different as the
3
percentage of usually employed female persons decreased from 13.2% to11.2% during the
same period ..In fact the proportion of employed both male and female was least in case of
Delhi among the 4 metros.
The negative trends may clearly mean low level of employment generation or
creation of fewer jobs which is a matter of concern to the job seekers who look to the national
capital as natural destination for better/bright prospects. In fact there are a number of readily
available reasons to support this trend exhibited by the successive sample surveys carried out
under quinquennial rounds on employment. The closure of polluting industries etc., during
the later part of 90s at the instance of the directives of highest judiciary had probably upset the
growth tempo of the manufacturing sector as a whole and also dampened the prospects of the
related economic activities and triggered the collapse .Moreover, the fast growing sectors of
the present century ,namely, IT and telecom sectors did not have strong roots to generate
sufficient levels of employment to sustain the loss of mass employment due to closure of
industries. Coming to the case of kolkatta (male only) and Chennai (both male &female) the
decreasing trends were not as sharp as it was in case of Delhi. Mumbai on the other hand
though recorded an increased proportion of persons employed during 1993-94 and 2004-05 in
both male and female ,the growth was marginal. Further, the wprs of Delhi, Kolkatta and
Chennai both for male and female during 2004-05 were observed to be low when compared
to the over all average wprs of all class 1cities of the country and for that mater the whole of
urban India .
These results have in fact raised a few basic questions namely, Is this the end of the
road for Metros as far as employment generation is concerned? Are metro cities still the
favorite destinations for the job hunting public? The foregoing analysis might help to answer
some of these aspects.
4
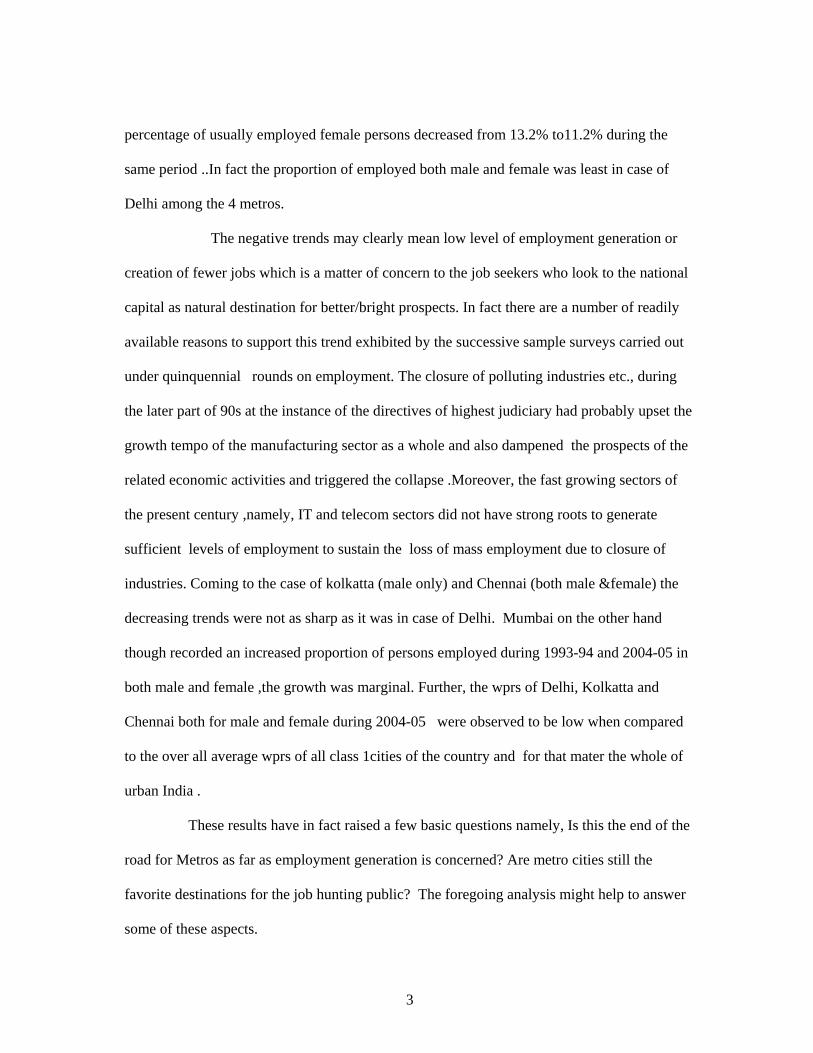
Number of Persons usually employed (PS+SS) per 1000 population (15 yrs. +) in Delhi
132 147 112
796 743 714
0100200300400
500600700800900
50th (1993-94) 55th (1999-00) 61st (2004-05)
PerT
hous
and
Female Male
Number of Persons usually employed (PS+SS) per 1000 population (15yrs. +) in Kolkata
190 187 183
803 780 751
0100200300400500600700800900
50th (1993-94) 55th (1999-00) 61st (2004-05)Pe
rtho
usan
d
Female Male
Number of Persons usually employed (PS+SS) per 1000 population (15 yrs. +) in Mumbai
221174
267
773 753 786
0
100
200
300
400
500
600
700
800
900
50th (1993-94) 55th (1999-00) 61st (2004-05)
Pert
hous
and
Female Male
Number of persons usually employed (PS+SS) per 1000 population (15 yrs. +) in Chennai
773 764 749
227 260168
0
100
200
300
400
500
600
700
800
900
1000
50th (1993-94) 55th (1999-00) 61st (2004-05)
Pert
hous
and
Male Female
5
CHANGING EMPLOYMENT SCENARIO OF OTHER MILLION PLUS CITIES
It is not an exaggerated statement that newly emerged metros and other million plus
Cities/Towns will occupy centre stage when it comes to generation of gainful employment in
the urban sphere due to entrepreneur friendly environment in the rest of the cities / towns
coupled with stagnation levels appeared to have reached in big metros owing to shortage of
land , high density of population, poor infrastructure /maintenance, increased costs etc.,
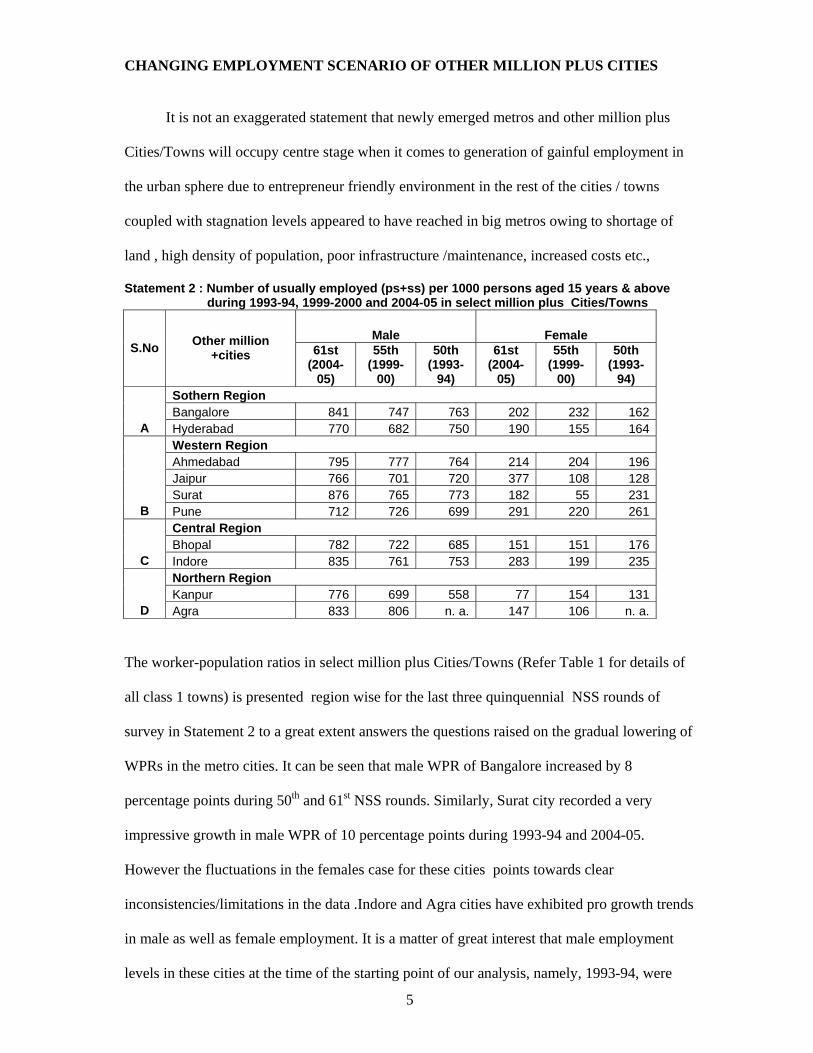
Statement 2 : Number of usually employed (ps+ss) per 1000 persons aged 15 years & above during 1993-94, 1999-2000 and 2004-05 in select million plus Cities/Towns
Male Female S.No Other million
+cities 61st (2004-
05)
55th (1999-
00)
50th (1993-
94)
61st (2004-
05)
55th (1999-
00)
50th (1993-
94) Sothern Region Bangalore 841 747 763 202 232 162
A Hyderabad 770 682 750 190 155 164 Western Region Ahmedabad 795 777 764 214 204 196 Jaipur 766 701 720 377 108 128 Surat 876 765 773 182 55 231
B Pune 712 726 699 291 220 261 Central Region Bhopal 782 722 685 151 151 176
C Indore 835 761 753 283 199 235 Northern Region Kanpur 776 699 558 77 154 131
D Agra 833 806 n. a. 147 106 n. a.
The worker-population ratios in select million plus Cities/Towns (Refer Table 1 for details of
all class 1 towns) is presented region wise for the last three quinquennial NSS rounds of
survey in Statement 2 to a great extent answers the questions raised on the gradual lowering of
WPRs in the metro cities. It can be seen that male WPR of Bangalore increased by 8
percentage points during 50th and 61st NSS rounds. Similarly, Surat city recorded a very
impressive growth in male WPR of 10 percentage points during 1993-94 and 2004-05.
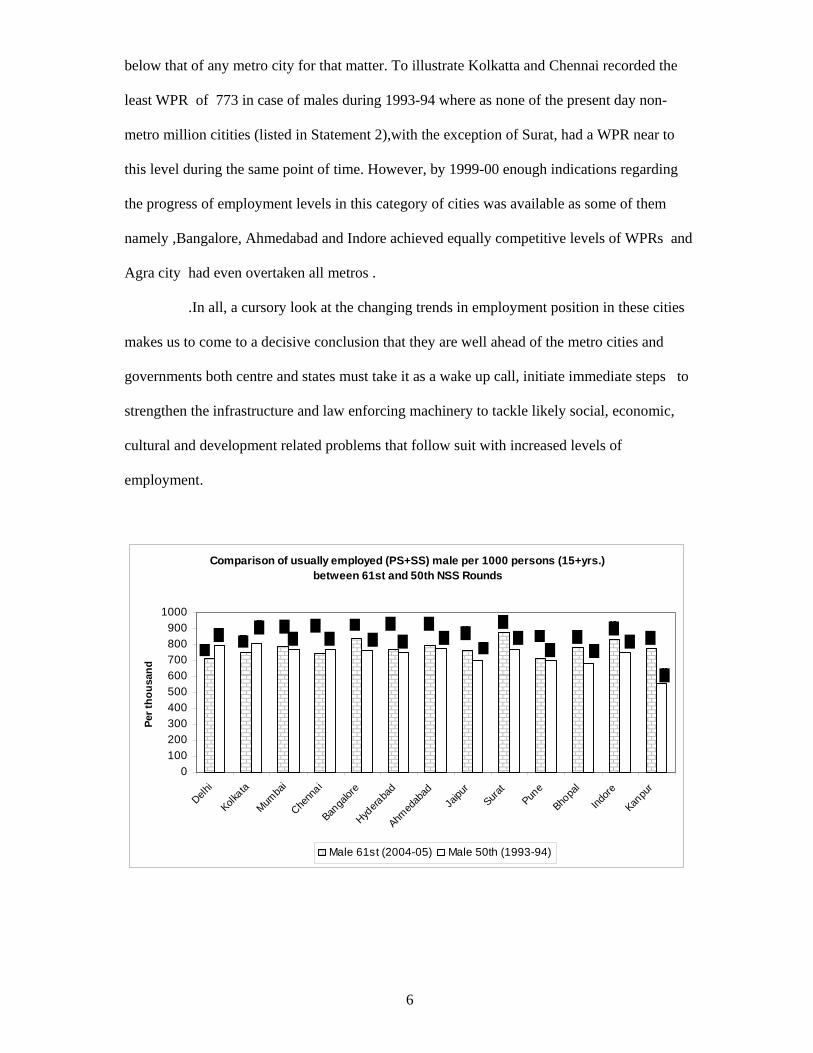
However the fluctuations in the females case for these cities points towards clear
inconsistencies/limitations in the data .Indore and Agra cities have exhibited pro growth trends
in male as well as female employment. It is a matter of great interest that male employment
levels in these cities at the time of the starting point of our analysis, namely, 1993-94, were
6
below that of any metro city for that matter. To illustrate Kolkatta and Chennai recorded the
least WPR of 773 in case of males during 1993-94 where as none of the present day non-
metro million citities (listed in Statement 2),with the exception of Surat, had a WPR near to
this level during the same point of time. However, by 1999-00 enough indications regarding
the progress of employment levels in this category of cities was available as some of them
namely ,Bangalore, Ahmedabad and Indore achieved equally competitive levels of WPRs and
Agra city had even overtaken all metros .
.In all, a cursory look at the changing trends in employment position in these cities
makes us to come to a decisive conclusion that they are well ahead of the metro cities and
governments both centre and states must take it as a wake up call, initiate immediate steps to
strengthen the infrastructure and law enforcing machinery to tackle likely social, economic,
cultural and development related problems that follow suit with increased levels of
employment.
Comparison of usually employed (PS+SS) male per 1000 persons (15+yrs.) between 61st and 50th NSS Rounds
0100200300400500600700800900
1000
Delhi
Kolkata
Mumba
i
Chenn
ai
Banga
lore
Hydera
bad
Ahmed
abad
Jaipu
rSura
tPun
e
Bhopa
l
Indore
Kanpu
r
Per t
hous
and
Male 61st (2004-05) Male 50th (1993-94)
7
Comparison of usually employed (PS+SS) female per 1000 (15+yrs.) between 61st and 50th NSS Rounds
050
100150200250300350400450
Delhi
Kolka
ta
Mumba
i
Chenn
ai
Bang
alore
Hydera
bad
Ahm
edab
ad
Jaipu
rSu
rat
Pune
Bhop
al
Indor
e
Kanp
ur
Per t
hous
and
Female 61st (2004-05) Female 50th (1993-94)
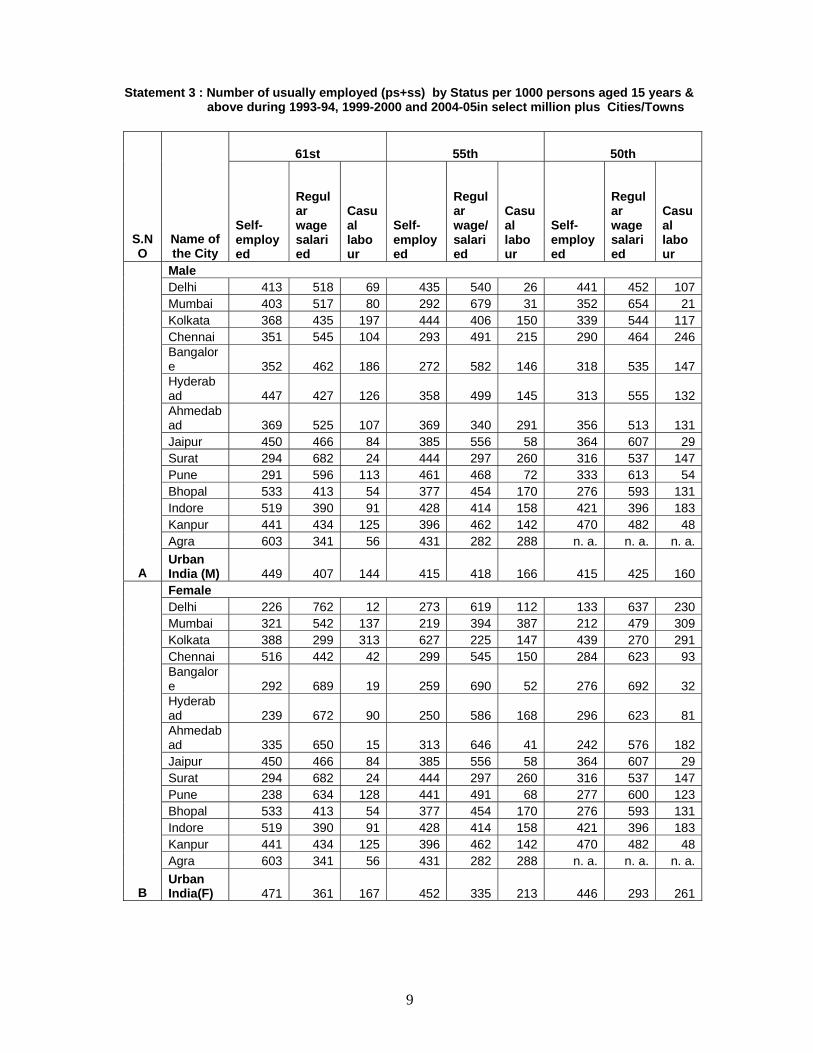
EMPLOMENT BY STATUS Employed persons can be categorized into three broad groups, namely, self-employed,
regular wage/salaried employees and casual labour. Statement 3 which shows per thousand
distribution of the usually employed (aged 15 years and above) over the three points of time
coinciding 50th 55th and 61st NSS rounds that there was a general tendency for the share of
self-employed workers to rise, that of wage and salaried workers to decline and with
fluctuating share of casual workers. This was broadly so for the entire urban sector as well as
for the class 1 cities/towns.
An overall review of the status of employment in urban areas of India(Statement
2) revealed that quantitatively, the share of self-employed in case of males was the highest at
45% among the three categories of employed viz. self-employed, regular salaried and casual
labourers during the year 2004-05. This was nearly 3 percentage points higher than that in the
years 1993-94 and 1999-2000 when the share of self-employed remained virtually unchanged
at 42%. The share of casual labourer in total employed fluctuating between 16 and 14 per
cent.. A comparison over three points of time indicated a broad tendency for the share of
regular wage/salaried and self-employed female workers to rise at the cost of the declining
share of casual workers in the urban sector and in the three classes of cities/towns. For the
8
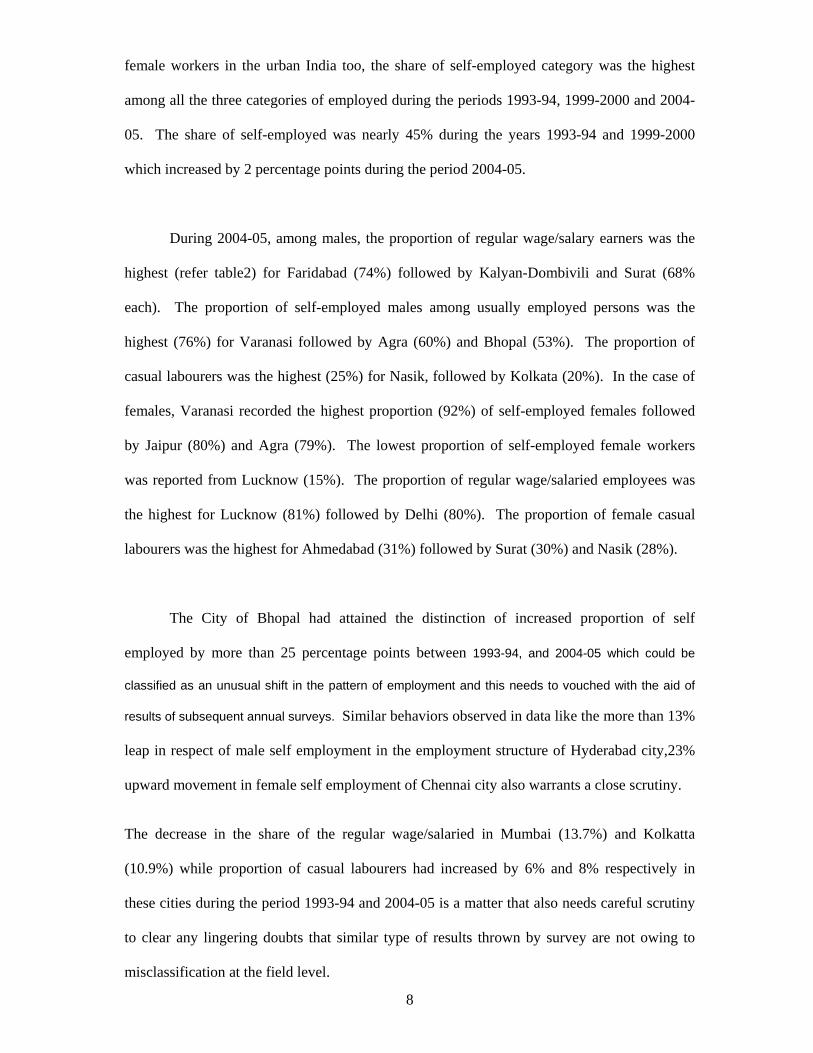
female workers in the urban India too, the share of self-employed category was the highest
among all the three categories of employed during the periods 1993-94, 1999-2000 and 2004-
05. The share of self-employed was nearly 45% during the years 1993-94 and 1999-2000
which increased by 2 percentage points during the period 2004-05.
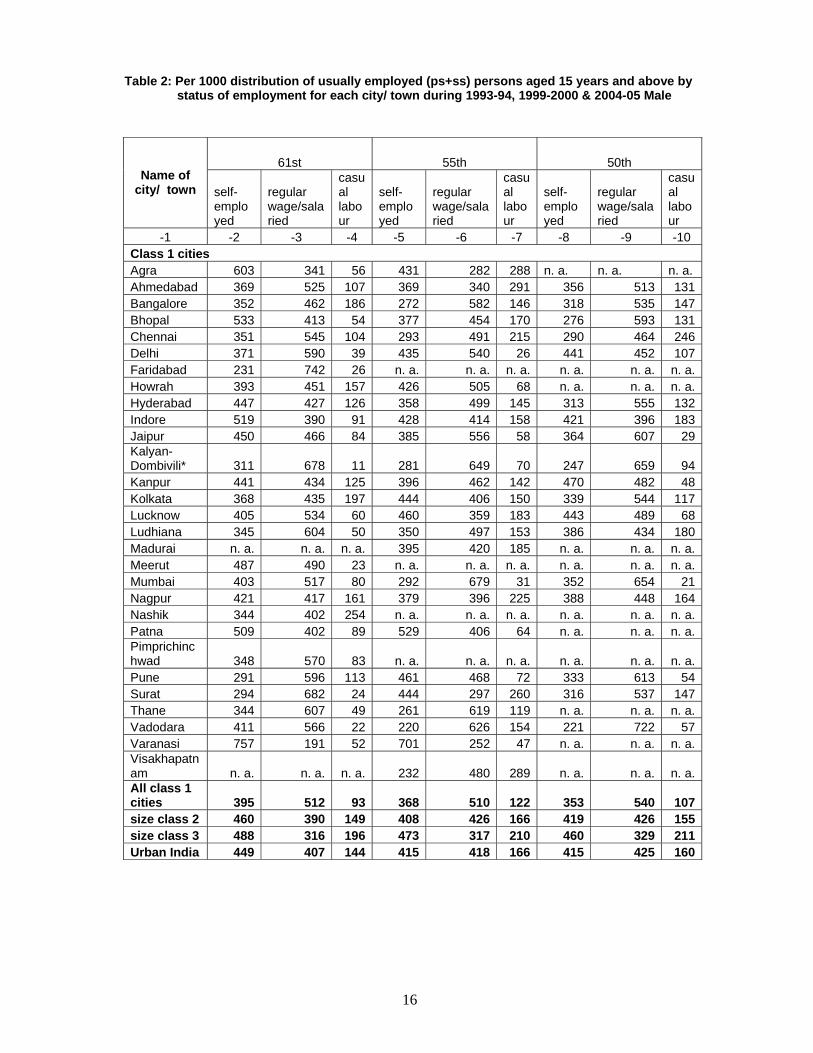
During 2004-05, among males, the proportion of regular wage/salary earners was the
highest (refer table2) for Faridabad (74%) followed by Kalyan-Dombivili and Surat (68%
each). The proportion of self-employed males among usually employed persons was the
highest (76%) for Varanasi followed by Agra (60%) and Bhopal (53%). The proportion of
casual labourers was the highest (25%) for Nasik, followed by Kolkata (20%). In the case of
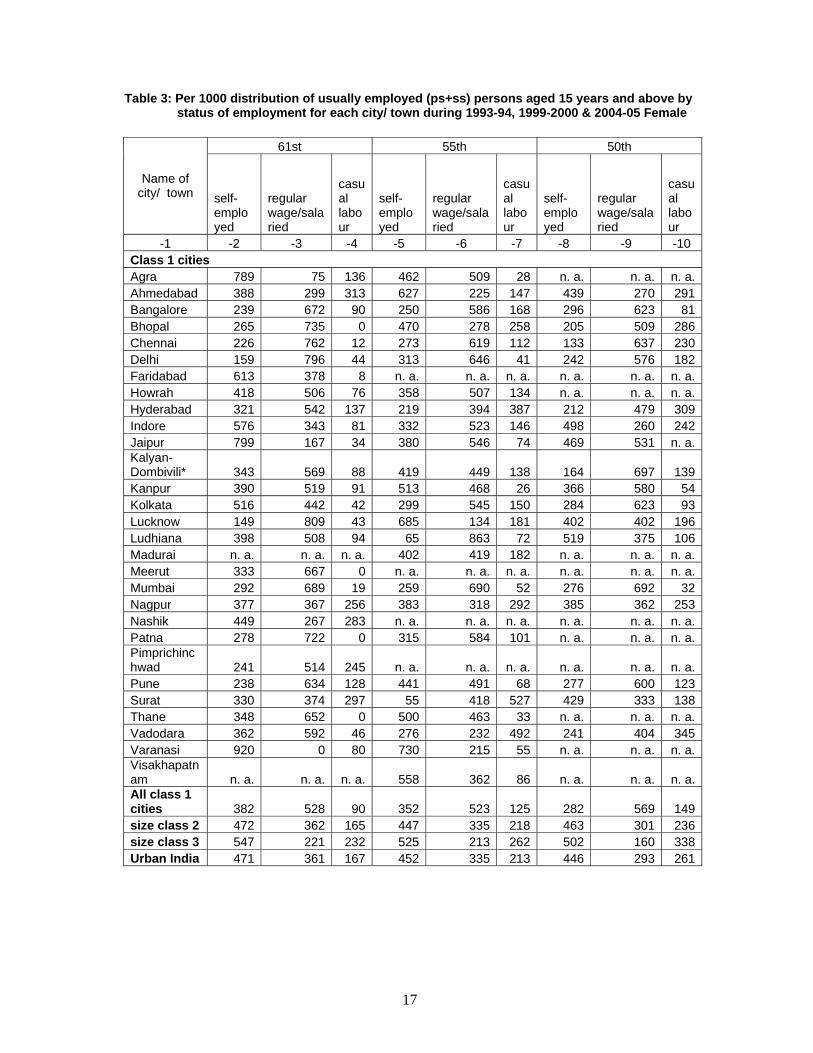
females, Varanasi recorded the highest proportion (92%) of self-employed females followed
by Jaipur (80%) and Agra (79%). The lowest proportion of self-employed female workers
was reported from Lucknow (15%). The proportion of regular wage/salaried employees was
the highest for Lucknow (81%) followed by Delhi (80%). The proportion of female casual
labourers was the highest for Ahmedabad (31%) followed by Surat (30%) and Nasik (28%).
The City of Bhopal had attained the distinction of increased proportion of self
employed by more than 25 percentage points between 1993-94, and 2004-05 which could be
classified as an unusual shift in the pattern of employment and this needs to vouched with the aid of
results of subsequent annual surveys. Similar behaviors observed in data like the more than 13%
leap in respect of male self employment in the employment structure of Hyderabad city,23%
upward movement in female self employment of Chennai city also warrants a close scrutiny.
The decrease in the share of the regular wage/salaried in Mumbai (13.7%) and Kolkatta
(10.9%) while proportion of casual labourers had increased by 6% and 8% respectively in
these cities during the period 1993-94 and 2004-05 is a matter that also needs careful scrutiny
to clear any lingering doubts that similar type of results thrown by survey are not owing to
misclassification at the field level.
9
Statement 3 : Number of usually employed (ps+ss) by Status per 1000 persons aged 15 years &
above during 1993-94, 1999-2000 and 2004-05in select million plus Cities/Towns
61st 55th 50th
S.NO
Name of the City
Self-employed
Regular wage salaried
Casual labour
Self-employed
Regular wage/ salaried
Casual labour
Self-employed
Regular wage salaried
Casual labour
Male Delhi 413 518 69 435 540 26 441 452 107Mumbai 403 517 80 292 679 31 352 654 21Kolkata 368 435 197 444 406 150 339 544 117Chennai 351 545 104 293 491 215 290 464 246Bangalore 352 462 186 272 582 146 318 535 147Hyderabad 447 427 126 358 499 145 313 555 132Ahmedabad 369 525 107 369 340 291 356 513 131Jaipur 450 466 84 385 556 58 364 607 29Surat 294 682 24 444 297 260 316 537 147Pune 291 596 113 461 468 72 333 613 54Bhopal 533 413 54 377 454 170 276 593 131Indore 519 390 91 428 414 158 421 396 183Kanpur 441 434 125 396 462 142 470 482 48Agra 603 341 56 431 282 288 n. a. n. a. n. a.
A Urban India (M) 449 407 144 415 418 166 415 425 160Female Delhi 226 762 12 273 619 112 133 637 230Mumbai 321 542 137 219 394 387 212 479 309Kolkata 388 299 313 627 225 147 439 270 291Chennai 516 442 42 299 545 150 284 623 93Bangalore 292 689 19 259 690 52 276 692 32Hyderabad 239 672 90 250 586 168 296 623 81Ahmedabad 335 650 15 313 646 41 242 576 182Jaipur 450 466 84 385 556 58 364 607 29Surat 294 682 24 444 297 260 316 537 147Pune 238 634 128 441 491 68 277 600 123Bhopal 533 413 54 377 454 170 276 593 131Indore 519 390 91 428 414 158 421 396 183Kanpur 441 434 125 396 462 142 470 482 48Agra 603 341 56 431 282 288 n. a. n. a. n. a.
B Urban India(F) 471 361 167 452 335 213 446 293 261
10
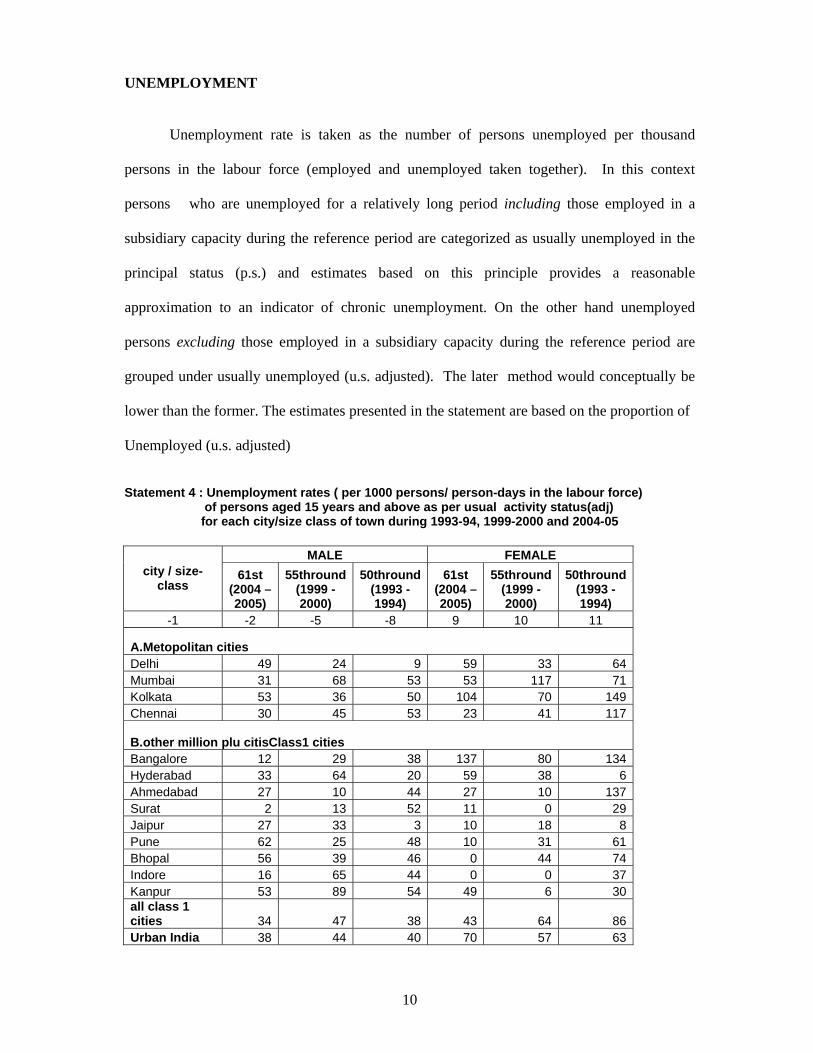
UNEMPLOYMENT Unemployment rate is taken as the number of persons unemployed per thousand
persons in the labour force (employed and unemployed taken together). In this context
persons who are unemployed for a relatively long period including those employed in a
subsidiary capacity during the reference period are categorized as usually unemployed in the
principal status (p.s.) and estimates based on this principle provides a reasonable
approximation to an indicator of chronic unemployment. On the other hand unemployed
persons excluding those employed in a subsidiary capacity during the reference period are
grouped under usually unemployed (u.s. adjusted). The later method would conceptually be
lower than the former. The estimates presented in the statement are based on the proportion of
Unemployed (u.s. adjusted)
Statement 4 : Unemployment rates ( per 1000 persons/ person-days in the labour force) of persons aged 15 years and above as per usual activity status(adj) for each city/size class of town during 1993-94, 1999-2000 and 2004-05
MALE FEMALE city / size-
class 61st
(2004 –2005)
55thround (1999 - 2000)
50thround (1993 - 1994)
61st (2004 –2005)
55thround (1999 - 2000)
50thround (1993 - 1994)
-1 -2 -5 -8 9 10 11
A.Metopolitan cities Delhi 49 24 9 59 33 64 Mumbai 31 68 53 53 117 71 Kolkata 53 36 50 104 70 149 Chennai 30 45 53 23 41 117
B.other million plu citisClass1 cities Bangalore 12 29 38 137 80 134 Hyderabad 33 64 20 59 38 6 Ahmedabad 27 10 44 27 10 137 Surat 2 13 52 11 0 29 Jaipur 27 33 3 10 18 8 Pune 62 25 48 10 31 61 Bhopal 56 39 46 0 44 74 Indore 16 65 44 0 0 37 Kanpur 53 89 54 49 6 30 all class 1 cities 34 47 38 43 64 86 Urban India 38 44 40 70 57 63
11
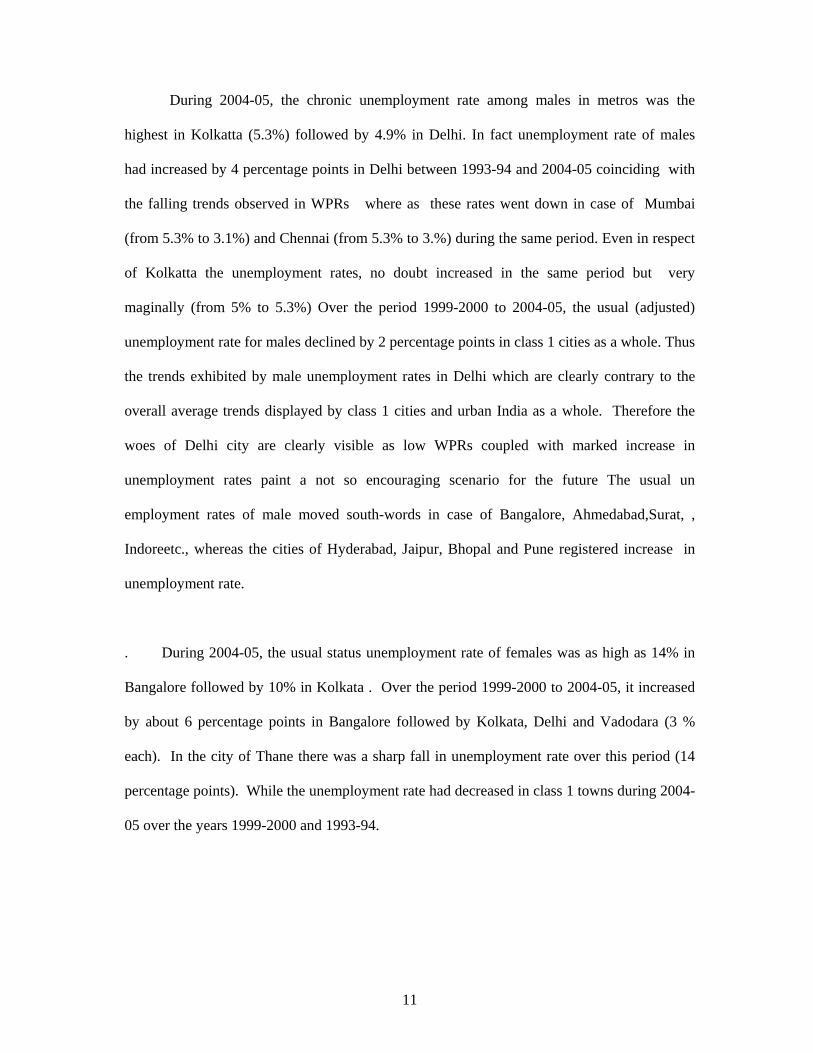
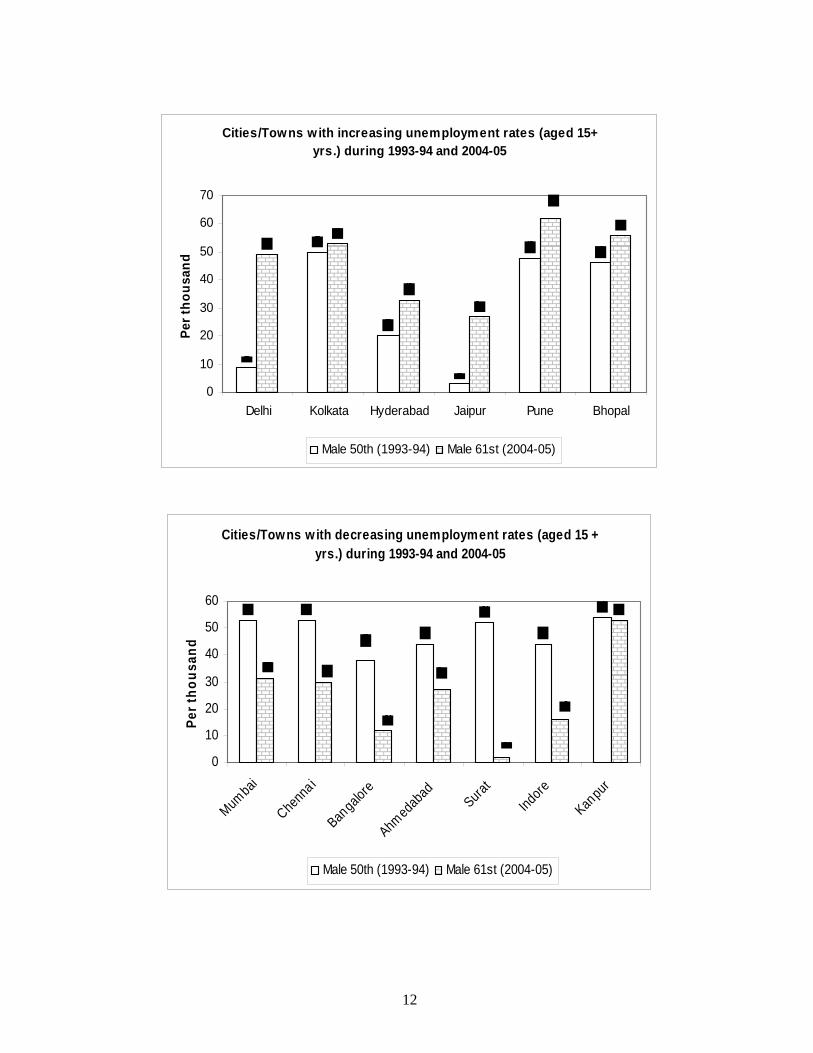
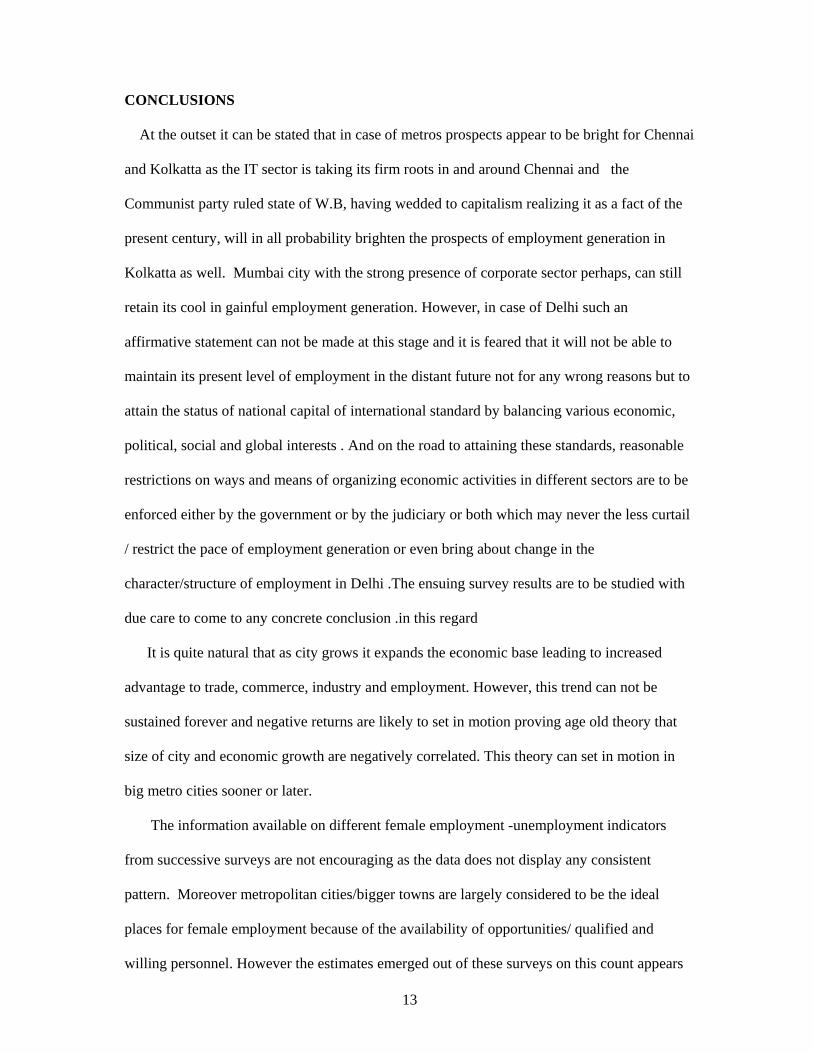
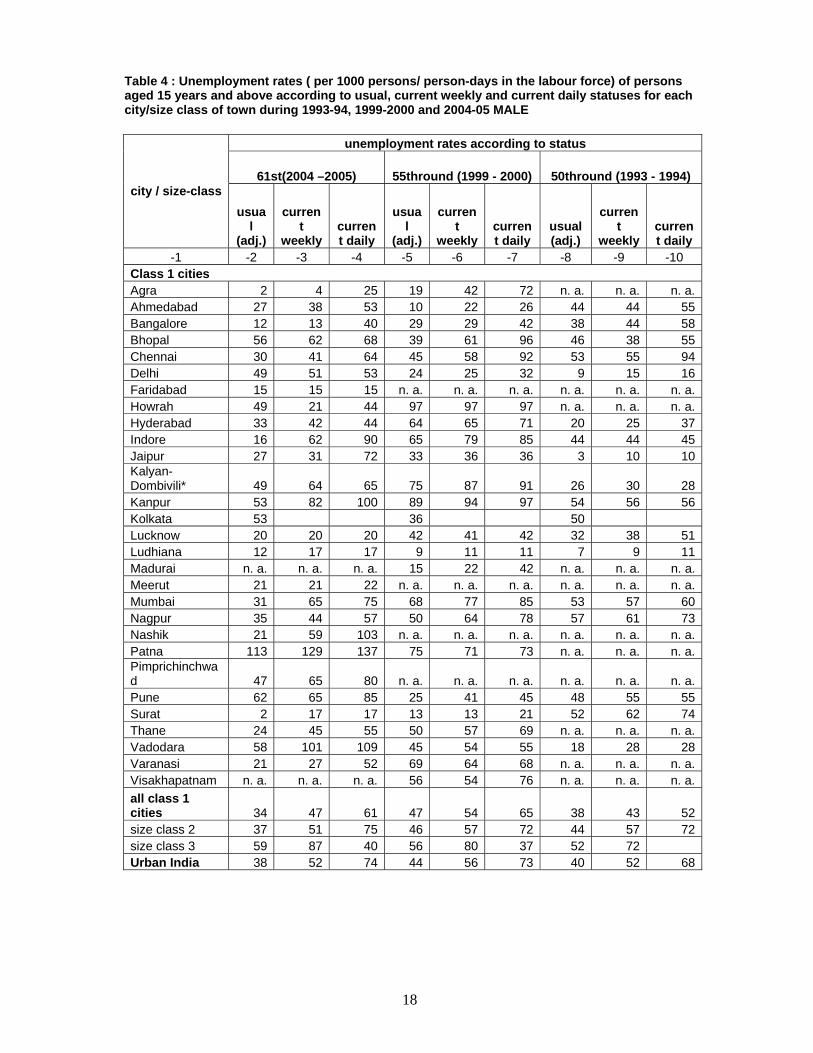
During 2004-05, the chronic unemployment rate among males in metros was the
highest in Kolkatta (5.3%) followed by 4.9% in Delhi. In fact unemployment rate of males
had increased by 4 percentage points in Delhi between 1993-94 and 2004-05 coinciding with
the falling trends observed in WPRs where as these rates went down in case of Mumbai
(from 5.3% to 3.1%) and Chennai (from 5.3% to 3.%) during the same period. Even in respect
of Kolkatta the unemployment rates, no doubt increased in the same period but very
maginally (from 5% to 5.3%) Over the period 1999-2000 to 2004-05, the usual (adjusted)
unemployment rate for males declined by 2 percentage points in class 1 cities as a whole. Thus
the trends exhibited by male unemployment rates in Delhi which are clearly contrary to the
overall average trends displayed by class 1 cities and urban India as a whole. Therefore the
woes of Delhi city are clearly visible as low WPRs coupled with marked increase in
unemployment rates paint a not so encouraging scenario for the future The usual un
employment rates of male moved south-words in case of Bangalore, Ahmedabad,Surat, ,
Indoreetc., whereas the cities of Hyderabad, Jaipur, Bhopal and Pune registered increase in
unemployment rate.
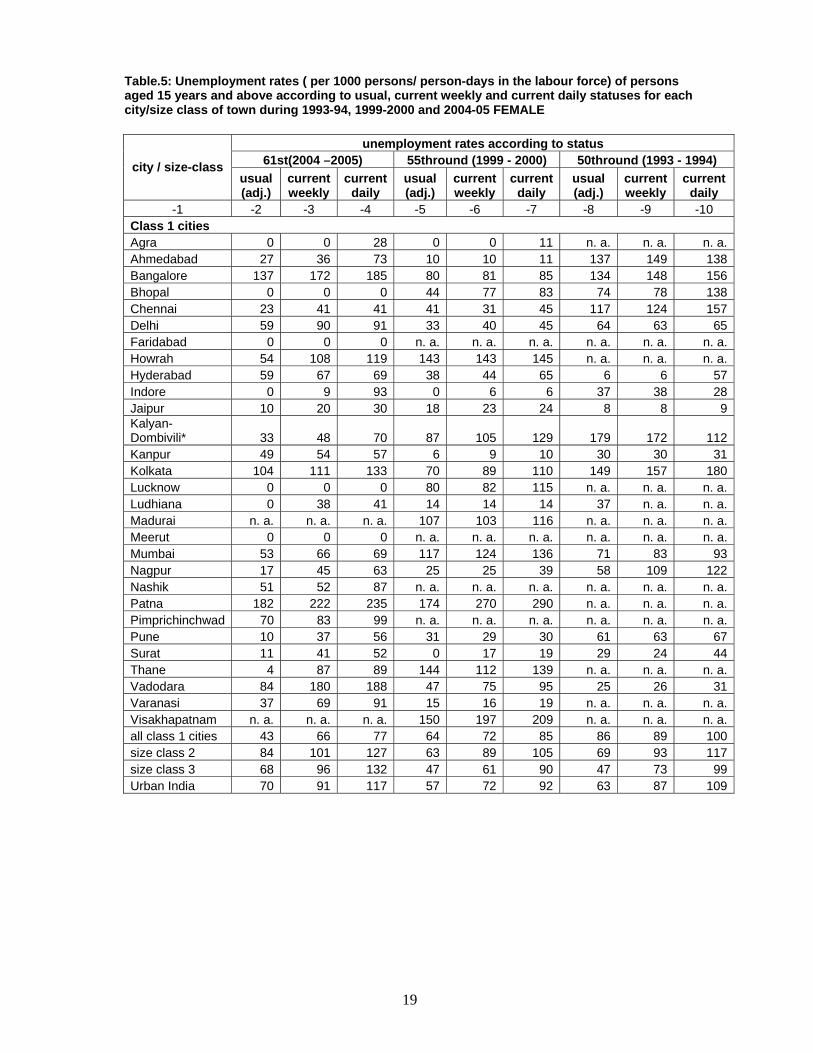
. During 2004-05, the usual status unemployment rate of females was as high as 14% in
Bangalore followed by 10% in Kolkata . Over the period 1999-2000 to 2004-05, it increased
by about 6 percentage points in Bangalore followed by Kolkata, Delhi and Vadodara (3 %
each). In the city of Thane there was a sharp fall in unemployment rate over this period (14
percentage points). While the unemployment rate had decreased in class 1 towns during 2004-
05 over the years 1999-2000 and 1993-94.
12
Cities/Towns with increasing unemployment rates (aged 15+ yrs.) during 1993-94 and 2004-05
0
10
20
30
40
50
60
70
Delhi Kolkata Hyderabad Jaipur Pune Bhopal
Per t
hous
and
Male 50th (1993-94) Male 61st (2004-05)
Cities/Towns with decreasing unemployment rates (aged 15 + yrs.) during 1993-94 and 2004-05
0
10
20
30
40
50
60
Mumba
i
Chenn
a i
Banga
lore
Ahmed
abad
Surat
Indore
Kanpu
r
Per t
hous
and
Male 50th (1993-94) Male 61st (2004-05)
13
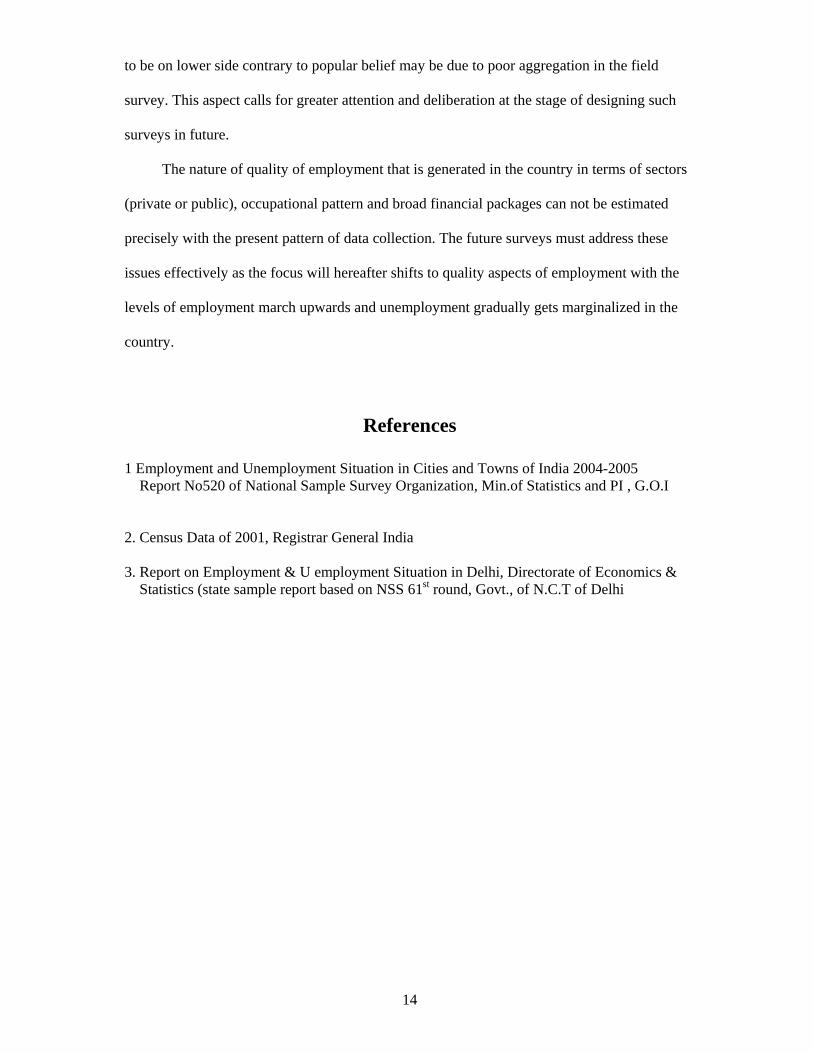
CONCLUSIONS At the outset it can be stated that in case of metros prospects appear to be bright for Chennai
and Kolkatta as the IT sector is taking its firm roots in and around Chennai and the
Communist party ruled state of W.B, having wedded to capitalism realizing it as a fact of the
present century, will in all probability brighten the prospects of employment generation in
Kolkatta as well. Mumbai city with the strong presence of corporate sector perhaps, can still
retain its cool in gainful employment generation. However, in case of Delhi such an
affirmative statement can not be made at this stage and it is feared that it will not be able to
maintain its present level of employment in the distant future not for any wrong reasons but to
attain the status of national capital of international standard by balancing various economic,
political, social and global interests . And on the road to attaining these standards, reasonable
restrictions on ways and means of organizing economic activities in different sectors are to be
enforced either by the government or by the judiciary or both which may never the less curtail
/ restrict the pace of employment generation or even bring about change in the
character/structure of employment in Delhi .The ensuing survey results are to be studied with
due care to come to any concrete conclusion .in this regard
It is quite natural that as city grows it expands the economic base leading to increased
advantage to trade, commerce, industry and employment. However, this trend can not be
sustained forever and negative returns are likely to set in motion proving age old theory that
size of city and economic growth are negatively correlated. This theory can set in motion in
big metro cities sooner or later.
The information available on different female employment -unemployment indicators
from successive surveys are not encouraging as the data does not display any consistent
pattern. Moreover metropolitan cities/bigger towns are largely considered to be the ideal
places for female employment because of the availability of opportunities/ qualified and
willing personnel. However the estimates emerged out of these surveys on this count appears
14
to be on lower side contrary to popular belief may be due to poor aggregation in the field
survey. This aspect calls for greater attention and deliberation at the stage of designing such
surveys in future.
The nature of quality of employment that is generated in the country in terms of sectors
(private or public), occupational pattern and broad financial packages can not be estimated
precisely with the present pattern of data collection. The future surveys must address these
issues effectively as the focus will hereafter shifts to quality aspects of employment with the
levels of employment march upwards and unemployment gradually gets marginalized in the
country.
References
1 Employment and Unemployment Situation in Cities and Towns of India 2004-2005 Report No520 of National Sample Survey Organization, Min.of Statistics and PI , G.O.I
2. Census Data of 2001, Registrar General India
3. Report on Employment & U employment Situation in Delhi, Directorate of Economics & Statistics (state sample report based on NSS 61st round, Govt., of N.C.T of Delhi
15
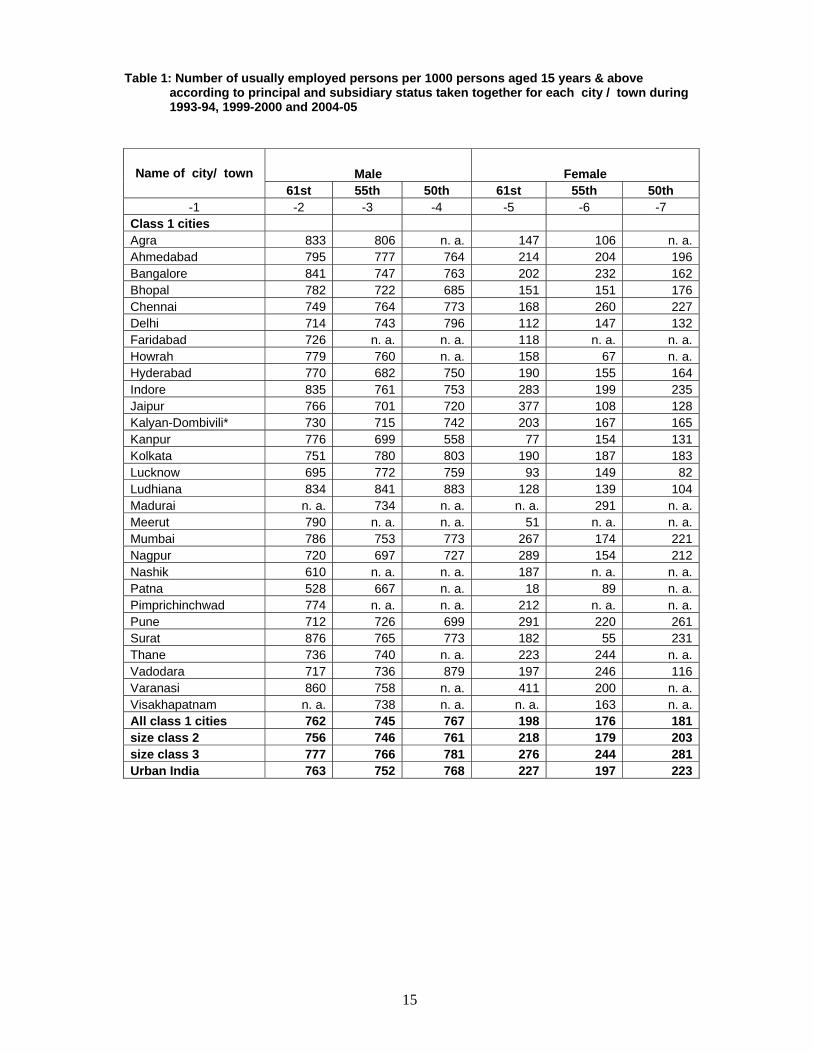
Table 1: Number of usually employed persons per 1000 persons aged 15 years & above
according to principal and subsidiary status taken together for each city / town during 1993-94, 1999-2000 and 2004-05
Male Female Name of city/ town 61st 55th 50th 61st 55th 50th
-1 -2 -3 -4 -5 -6 -7 Class 1 cities Agra 833 806 n. a. 147 106 n. a. Ahmedabad 795 777 764 214 204 196Bangalore 841 747 763 202 232 162Bhopal 782 722 685 151 151 176Chennai 749 764 773 168 260 227Delhi 714 743 796 112 147 132Faridabad 726 n. a. n. a. 118 n. a. n. a. Howrah 779 760 n. a. 158 67 n. a. Hyderabad 770 682 750 190 155 164Indore 835 761 753 283 199 235Jaipur 766 701 720 377 108 128Kalyan-Dombivili* 730 715 742 203 167 165Kanpur 776 699 558 77 154 131Kolkata 751 780 803 190 187 183Lucknow 695 772 759 93 149 82Ludhiana 834 841 883 128 139 104Madurai n. a. 734 n. a. n. a. 291 n. a. Meerut 790 n. a. n. a. 51 n. a. n. a. Mumbai 786 753 773 267 174 221Nagpur 720 697 727 289 154 212Nashik 610 n. a. n. a. 187 n. a. n. a. Patna 528 667 n. a. 18 89 n. a. Pimprichinchwad 774 n. a. n. a. 212 n. a. n. a. Pune 712 726 699 291 220 261Surat 876 765 773 182 55 231Thane 736 740 n. a. 223 244 n. a. Vadodara 717 736 879 197 246 116Varanasi 860 758 n. a. 411 200 n. a. Visakhapatnam n. a. 738 n. a. n. a. 163 n. a. All class 1 cities 762 745 767 198 176 181size class 2 756 746 761 218 179 203size class 3 777 766 781 276 244 281Urban India 763 752 768 227 197 223
16
Table 2: Per 1000 distribution of usually employed (ps+ss) persons aged 15 years and above by
status of employment for each city/ town during 1993-94, 1999-2000 & 2004-05 Male
61st 55th 50th Name of
city/ town self-employed
regular wage/salaried
casual labour
self-employed
regular wage/salaried
casual labour
self-employed
regular wage/salaried
casual labour
-1 -2 -3 -4 -5 -6 -7 -8 -9 -10 Class 1 cities Agra 603 341 56 431 282 288 n. a. n. a. n. a. Ahmedabad 369 525 107 369 340 291 356 513 131Bangalore 352 462 186 272 582 146 318 535 147Bhopal 533 413 54 377 454 170 276 593 131Chennai 351 545 104 293 491 215 290 464 246Delhi 371 590 39 435 540 26 441 452 107Faridabad 231 742 26 n. a. n. a. n. a. n. a. n. a. n. a.Howrah 393 451 157 426 505 68 n. a. n. a. n. a.Hyderabad 447 427 126 358 499 145 313 555 132Indore 519 390 91 428 414 158 421 396 183Jaipur 450 466 84 385 556 58 364 607 29Kalyan-Dombivili* 311 678 11 281 649 70 247 659 94Kanpur 441 434 125 396 462 142 470 482 48Kolkata 368 435 197 444 406 150 339 544 117Lucknow 405 534 60 460 359 183 443 489 68Ludhiana 345 604 50 350 497 153 386 434 180Madurai n. a. n. a. n. a. 395 420 185 n. a. n. a. n. a.Meerut 487 490 23 n. a. n. a. n. a. n. a. n. a. n. a.Mumbai 403 517 80 292 679 31 352 654 21Nagpur 421 417 161 379 396 225 388 448 164Nashik 344 402 254 n. a. n. a. n. a. n. a. n. a. n. a.Patna 509 402 89 529 406 64 n. a. n. a. n. a.Pimprichinchwad 348 570 83 n. a. n. a. n. a. n. a. n. a. n. a.Pune 291 596 113 461 468 72 333 613 54Surat 294 682 24 444 297 260 316 537 147Thane 344 607 49 261 619 119 n. a. n. a. n. a.Vadodara 411 566 22 220 626 154 221 722 57Varanasi 757 191 52 701 252 47 n. a. n. a. n. a.Visakhapatnam n. a. n. a. n. a. 232 480 289 n. a. n. a. n. a.All class 1 cities 395 512 93 368 510 122 353 540 107size class 2 460 390 149 408 426 166 419 426 155size class 3 488 316 196 473 317 210 460 329 211Urban India 449 407 144 415 418 166 415 425 160
17
Table 3: Per 1000 distribution of usually employed (ps+ss) persons aged 15 years and above by
status of employment for each city/ town during 1993-94, 1999-2000 & 2004-05 Female
61st 55th 50th
Name of city/ town self-
employed
regular wage/salaried
casual labour
self-employed
regular wage/salaried
casual labour
self-employed
regular wage/salaried
casual labour
-1 -2 -3 -4 -5 -6 -7 -8 -9 -10 Class 1 cities Agra 789 75 136 462 509 28 n. a. n. a. n. a.Ahmedabad 388 299 313 627 225 147 439 270 291Bangalore 239 672 90 250 586 168 296 623 81Bhopal 265 735 0 470 278 258 205 509 286Chennai 226 762 12 273 619 112 133 637 230Delhi 159 796 44 313 646 41 242 576 182Faridabad 613 378 8 n. a. n. a. n. a. n. a. n. a. n. a.Howrah 418 506 76 358 507 134 n. a. n. a. n. a.Hyderabad 321 542 137 219 394 387 212 479 309Indore 576 343 81 332 523 146 498 260 242Jaipur 799 167 34 380 546 74 469 531 n. a.Kalyan-Dombivili* 343 569 88 419 449 138 164 697 139Kanpur 390 519 91 513 468 26 366 580 54Kolkata 516 442 42 299 545 150 284 623 93Lucknow 149 809 43 685 134 181 402 402 196Ludhiana 398 508 94 65 863 72 519 375 106Madurai n. a. n. a. n. a. 402 419 182 n. a. n. a. n. a.Meerut 333 667 0 n. a. n. a. n. a. n. a. n. a. n. a.Mumbai 292 689 19 259 690 52 276 692 32Nagpur 377 367 256 383 318 292 385 362 253Nashik 449 267 283 n. a. n. a. n. a. n. a. n. a. n. a.Patna 278 722 0 315 584 101 n. a. n. a. n. a.Pimprichinchwad 241 514 245 n. a. n. a. n. a. n. a. n. a. n. a.Pune 238 634 128 441 491 68 277 600 123Surat 330 374 297 55 418 527 429 333 138Thane 348 652 0 500 463 33 n. a. n. a. n. a.Vadodara 362 592 46 276 232 492 241 404 345Varanasi 920 0 80 730 215 55 n. a. n. a. n. a.Visakhapatnam n. a. n. a. n. a. 558 362 86 n. a. n. a. n. a.All class 1 cities 382 528 90 352 523 125 282 569 149size class 2 472 362 165 447 335 218 463 301 236size class 3 547 221 232 525 213 262 502 160 338Urban India 471 361 167 452 335 213 446 293 261
18
Table 4 : Unemployment rates ( per 1000 persons/ person-days in the labour force) of persons aged 15 years and above according to usual, current weekly and current daily statuses for each city/size class of town during 1993-94, 1999-2000 and 2004-05 MALE
unemployment rates according to status
61st(2004 –2005) 55thround (1999 - 2000) 50thround (1993 - 1994) city / size-class
usual
(adj.)
current
weekly current daily
usual
(adj.)
current
weekly current daily
usual (adj.)
current
weekly current daily
-1 -2 -3 -4 -5 -6 -7 -8 -9 -10 Class 1 cities Agra 2 4 25 19 42 72 n. a. n. a. n. a. Ahmedabad 27 38 53 10 22 26 44 44 55Bangalore 12 13 40 29 29 42 38 44 58Bhopal 56 62 68 39 61 96 46 38 55Chennai 30 41 64 45 58 92 53 55 94Delhi 49 51 53 24 25 32 9 15 16Faridabad 15 15 15 n. a. n. a. n. a. n. a. n. a. n. a. Howrah 49 21 44 97 97 97 n. a. n. a. n. a. Hyderabad 33 42 44 64 65 71 20 25 37Indore 16 62 90 65 79 85 44 44 45Jaipur 27 31 72 33 36 36 3 10 10Kalyan-Dombivili* 49 64 65 75 87 91 26 30 28Kanpur 53 82 100 89 94 97 54 56 56Kolkata 53 36 50 Lucknow 20 20 20 42 41 42 32 38 51Ludhiana 12 17 17 9 11 11 7 9 11Madurai n. a. n. a. n. a. 15 22 42 n. a. n. a. n. a. Meerut 21 21 22 n. a. n. a. n. a. n. a. n. a. n. a. Mumbai 31 65 75 68 77 85 53 57 60Nagpur 35 44 57 50 64 78 57 61 73Nashik 21 59 103 n. a. n. a. n. a. n. a. n. a. n. a. Patna 113 129 137 75 71 73 n. a. n. a. n. a. Pimprichinchwad 47 65 80 n. a. n. a. n. a. n. a. n. a. n. a. Pune 62 65 85 25 41 45 48 55 55Surat 2 17 17 13 13 21 52 62 74Thane 24 45 55 50 57 69 n. a. n. a. n. a. Vadodara 58 101 109 45 54 55 18 28 28Varanasi 21 27 52 69 64 68 n. a. n. a. n. a. Visakhapatnam n. a. n. a. n. a. 56 54 76 n. a. n. a. n. a. all class 1 cities 34 47 61 47 54 65 38 43 52size class 2 37 51 75 46 57 72 44 57 72size class 3 59 87 40 56 80 37 52 72 Urban India 38 52 74 44 56 73 40 52 68
19
Table.5: Unemployment rates ( per 1000 persons/ person-days in the labour force) of persons aged 15 years and above according to usual, current weekly and current daily statuses for each city/size class of town during 1993-94, 1999-2000 and 2004-05 FEMALE
unemployment rates according to status 61st(2004 –2005) 55thround (1999 - 2000) 50thround (1993 - 1994) city / size-class
usual (adj.)
current weekly
current daily
usual (adj.)
current weekly
current daily
usual (adj.)
current weekly
current daily
-1 -2 -3 -4 -5 -6 -7 -8 -9 -10 Class 1 cities Agra 0 0 28 0 0 11 n. a. n. a. n. a. Ahmedabad 27 36 73 10 10 11 137 149 138Bangalore 137 172 185 80 81 85 134 148 156Bhopal 0 0 0 44 77 83 74 78 138Chennai 23 41 41 41 31 45 117 124 157Delhi 59 90 91 33 40 45 64 63 65Faridabad 0 0 0 n. a. n. a. n. a. n. a. n. a. n. a. Howrah 54 108 119 143 143 145 n. a. n. a. n. a. Hyderabad 59 67 69 38 44 65 6 6 57Indore 0 9 93 0 6 6 37 38 28Jaipur 10 20 30 18 23 24 8 8 9Kalyan-Dombivili* 33 48 70 87 105 129 179 172 112Kanpur 49 54 57 6 9 10 30 30 31Kolkata 104 111 133 70 89 110 149 157 180Lucknow 0 0 0 80 82 115 n. a. n. a. n. a. Ludhiana 0 38 41 14 14 14 37 n. a. n. a. Madurai n. a. n. a. n. a. 107 103 116 n. a. n. a. n. a. Meerut 0 0 0 n. a. n. a. n. a. n. a. n. a. n. a. Mumbai 53 66 69 117 124 136 71 83 93Nagpur 17 45 63 25 25 39 58 109 122Nashik 51 52 87 n. a. n. a. n. a. n. a. n. a. n. a. Patna 182 222 235 174 270 290 n. a. n. a. n. a. Pimprichinchwad 70 83 99 n. a. n. a. n. a. n. a. n. a. n. a. Pune 10 37 56 31 29 30 61 63 67Surat 11 41 52 0 17 19 29 24 44Thane 4 87 89 144 112 139 n. a. n. a. n. a. Vadodara 84 180 188 47 75 95 25 26 31Varanasi 37 69 91 15 16 19 n. a. n. a. n. a. Visakhapatnam n. a. n. a. n. a. 150 197 209 n. a. n. a. n. a. all class 1 cities 43 66 77 64 72 85 86 89 100size class 2 84 101 127 63 89 105 69 93 117size class 3 68 96 132 47 61 90 47 73 99Urban India 70 91 117 57 72 92 63 87 109
20
ANNEXURE
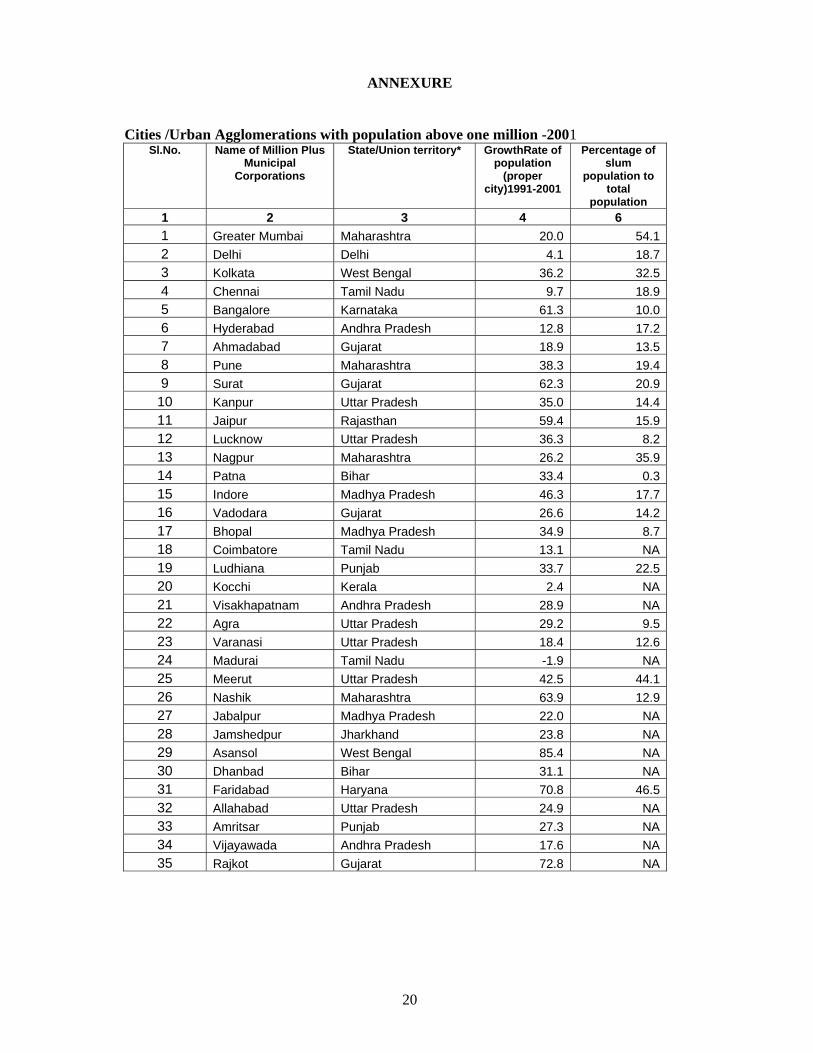
Cities /Urban Agglomerations with population above one million -2001
Sl.No. Name of Million Plus Municipal
Corporations
State/Union territory* GrowthRate of population
(proper city)1991-2001
Percentage of slum
population to total
population 1 2 3 4 6 1 Greater Mumbai Maharashtra 20.0 54.12 Delhi Delhi 4.1 18.73 Kolkata West Bengal 36.2 32.54 Chennai Tamil Nadu 9.7 18.95 Bangalore Karnataka 61.3 10.06 Hyderabad Andhra Pradesh 12.8 17.27 Ahmadabad Gujarat 18.9 13.58 Pune Maharashtra 38.3 19.49 Surat Gujarat 62.3 20.9
10 Kanpur Uttar Pradesh 35.0 14.411 Jaipur Rajasthan 59.4 15.912 Lucknow Uttar Pradesh 36.3 8.213 Nagpur Maharashtra 26.2 35.914 Patna Bihar 33.4 0.315 Indore Madhya Pradesh 46.3 17.716 Vadodara Gujarat 26.6 14.217 Bhopal Madhya Pradesh 34.9 8.718 Coimbatore Tamil Nadu 13.1 NA19 Ludhiana Punjab 33.7 22.520 Kocchi Kerala 2.4 NA21 Visakhapatnam Andhra Pradesh 28.9 NA22 Agra Uttar Pradesh 29.2 9.523 Varanasi Uttar Pradesh 18.4 12.624 Madurai Tamil Nadu -1.9 NA25 Meerut Uttar Pradesh 42.5 44.126 Nashik Maharashtra 63.9 12.927 Jabalpur Madhya Pradesh 22.0 NA28 Jamshedpur Jharkhand 23.8 NA29 Asansol West Bengal 85.4 NA30 Dhanbad Bihar 31.1 NA31 Faridabad Haryana 70.8 46.532 Allahabad Uttar Pradesh 24.9 NA33 Amritsar Punjab 27.3 NA34 Vijayawada Andhra Pradesh 17.6 NA35 Rajkot Gujarat 72.8 NA
21
PAPER TO BE PRESENTED IN THE NATIONAL SEMINAR ON N.S.S 61ST ROUND RESULTS TO BE HELD AT ON OCTOBER 2007
EMPLOYMENT– UNEMPLOYMENT SITUATION IN
MILLION PLS CITIES/TOWNS OF INDIA
-A Critical Analysis
BY DR.B.K.SHARMA & N.T.KRISHNA
DIRECTORATE OF ECONOMICS & STATISTICS GOVERNMENT OF NCT OF DELHI