Employment policy Department · Employment policy Department 2015 Christoph Ernst, Marianela...
36
Development and Investment Branch Employment Intensive Investment Programme EMPLOYMENT Working Paper No. 176 Employment Policy Department 2015 Christoph Ernst, Marianela Sarabia Urgent plan to activate the Egyptian economy An employment impact assessment EMPLOYMENT
Transcript of Employment policy Department · Employment policy Department 2015 Christoph Ernst, Marianela...

Development and Investment Branch
Employment Intensive Investment Programme
EmploymEnt Working Paper No. 176
Employment policy Department
2015
Christoph Ernst, Marianela Sarabia
Urgent plan to activate the Egyptian economyAn employment impact assessment
Empl
oym
Ent

Employment Policy Department EMPLOYMENT Working Paper 176 2015
Urgent plan to activate the Egyptian economy: An employment impact assessment1
Christoph Ernst, Marianela Sarabia
Development and Investment Branch
Employment Intensive Investment Programme
1 Authors are, in addition to fully responsible for all errors, omissions and opinions, very grateful to Kazutoshi Chatani for his valuable comments and for a group of experts (Planning Ministry, Finance Ministry, CAPMAS, Institute for National Planning, Egyptian National Competitiveness Council, academia, civil society, donors and IFIs) in Egypt to whom this paper was presented twice.
i
_________________________

Copyright © International Labour Organization 2015 First published 2015 Publications of the International Labour Office enjoy copyright under Protocol 2 of the Universal Copyright Convention. Nevertheless, short excerpts from them may be reproduced without authorization, on condition that the source is indicated. For rights of reproduction or translation, application should be made to ILO Publications (Rights and Licensing), International Labour Office, CH-1211 Geneva 22, Switzerland, or by email: [email protected]. The International Labour Office welcomes such applications. Libraries, institutions and other users registered with a reproduction rights organization may make copies in accordance with the licences issued to them for this purpose. Visit www.ifrro.org to find the reproduction rights organization in your country. Ernst, Christoph; Sarabia, Marianela Urgent plan to activate the Egyptian economy : an employment impact assessment / Christoph Ernst, Marianela Sarabia ; International Labour Office, Employment Policy Department, Development and Investment Branch. - Geneva: ILO, 2015 (Employment working paper ; No. 176) International Labour Office Employment Policy Dept. employment creation / economic development / plan of action / Egypt
ILO Cataloguing in Publication Data
The designations employed in ILO publications, which are in conformity with United Nations practice, and the presentation of material therein do not imply the expression of any opinion whatsoever on the part of the International Labour Office concerning the legal status of any country, area or territory or of its authorities, or concerning the delimitation of its frontiers. The responsibility for opinions expressed in signed articles, studies and other contributions rests solely with their authors, and publication does not constitute an endorsement by the International Labour Office of the opinions expressed in them. Reference to names of firms and commercial products and processes does not imply their endorsement by the International Labour Office, and any failure to mention a particular firm, commercial product or process is not a sign of disapproval. ILO publications and digital products can be obtained through major booksellers and digital distribution platforms, or ordered directly from [email protected] For more information, visit our website: www.ilo.org/publns or contact [email protected].
Printed in Switzerland
ii
Preface
The primary goal of the ILO is to work with member States towards achieving full and productive employment and decent work for all. This goal is elaborated in the ILO Declaration 2008 on Social Justice for a Fair Globalization,2 which has been widely adopted by the international community. Comprehensive and integrated perspectives to achieve this goal are embedded in the Employment Policy Convention of 1964 (No. 122), the Global Employment Agenda (2003) and – in response to the 2008 global economic crisis – the Global Jobs Pact (2009) and the conclusions of the Recurrent Discussion Reports on Employment (2010 and 2014).
The Employment Policy Department (EMPLOYMENT) is engaged in global advocacy and in supporting member States in placing more and better jobs at the center of economic and social policies and growth and development strategies. Policy research and knowledge generation and dissemination are essential components of the Employment Policy Department’s activities. The resulting publications include books, country policy reviews, policy and research briefs, and working papers.3
The Employment Policy Working Paper series is designed to disseminate the main findings of research on a broad range of topics undertaken by the branches of the Department. The working papers are intended to encourage the exchange of ideas and to stimulate debate. The views expressed within them are the responsibility of the authors and do not necessarily represent those of the ILO.
Azita Berar Awad Director Employment Policy Department
2 See http://www.ilo.org/public/english/bureau/dgo/download/dg_announce_en.pdf 3 See http://www.ilo.org/employment.
iii
_________________________


Foreword
The Employment Intensive Investment Branch (EMP/INVEST) of the Development and Investment Branch of the ILO has a long tradition in the development and use of employment impact assessment methodologies for up-stream policy advice in developing and emerging countries, most recently also in industrialized countries. They have been developed with the purpose to compare the cost-effectiveness and employment dimension of different technologies applied in the implementation of infrastructure investment. Another objective of these methodologies has been to evaluate the effectiveness of already implemented infrastructure investment with regard to employment and general economic variables. For many decades, ILO has been using Open Input-Output Tables around the world. A Closed Input-Output framework has been introduced more recently, which develops Open Input-Output Tables further by introducing feedback loops of higher income achieved through employment generation, stimulating additional the economy and government revenues through tax collection.
As a response to the global economic and financial crisis, in 2008–2009 the Egyptian government implemented a fiscal stimulus package designed to build public utilities infrastructure, particularly water and sewage projects, as well as roads, bridges, schools and basic health care centres. It hoped to limit the possible adverse repercussions of the global financial crisis on the Egyptian economy and maintain the sustainability of development programmes by increasing employment rates and reducing the threat of a decline in the rate of economic growth.
However, after the January 2011 revolution, several issues became more urgent. The lack of decent jobs, mainly for youth, led the Government to prioritise or scale up certain on-going intervention activities. The relevant ministries and partners sought to provide an integrated response to the domestic crisis, paying special attention to employment questions. In this framework, the social turmoil and economic slowdown in Egypt led to the implementation of a new stimulus package in order to overcome the current socio-economic situation. In this context, the Ministry of Planning approached the ILO to conduct an employment impact assessment of the Urgent Plan to Activate the Egyptian Economy, 2013–2014.
This working paper should help decision-makers in the Egyptian government, but also think tanks and academia to gain a better understanding of the potential impact of the Urgent Plan. It will design of future Government interventions, in particular in infrastructure, which are also aimed at optimizing (and related targeting) the employment outcome of public investments. This study is part of a series of studies which will serve as input to a reference guide which will a) provide policy advice on the employment dimension of different infrastructure sub-sectors in countries of different development level; and b) describe various technical tools used for employment impact assessment, comparing them and showing their strengths and limitations.
Terje Tessem Chief of Development and Investment Branch
v
Contents
Page
Preface ...................................................................................................................................................... iii
Foreword ................................................................................................................................................... v
1. Introduction ..................................................................................................................................... 1
1.1. Urgent Plan for the year 2013–2014 ........................................................................................ 1
1.2. Structural features of Egyptian economy and multiplier effects .............................................. 6
2. Employment impact assessment ............................................................................................................ 8
2.1 Methodological issues ............................................................................................................... 8
2.2 Multiplier analysis of Egyptian economy and labour market ................................................. 12
3. The Urgent Plan and its potential impact on employment: Simulation exercise ................................. 15
4. Conclusion ........................................................................................................................................... 20
References ............................................................................................................................................... 21
Appendix ................................................................................................................................................. 22
1. Multiplier analysis of Egyptian economy and labour market ................................................... 22
2. Main data sources ...................................................................................................................... 26
vi

List of Tables
Table 1. Details of the Urgent Plan to Activate the Egyptian economy, 2013–2014 ................................ 2
Table 2. Comparison of stimulus packages in the Egyptian economy by sector .................................... 15
Table 3. Classification in input-output tables and labour force surveys ................................................. 26
List of Graphs
Graph 1. Comparison of stimulus packages in the Egyptian economy ..................................................... 4
Graph 2. Comparison of stimulus packages in the Egyptian economy by sector ..................................... 5
Graph 3. Overview of the Egyptian labour force ...................................................................................... 6
Graph 4. Output multipliers, wage compensation, 2010–2011 ............................................................... 12
Graph 5. Employment multipliers, paid labour, 2010–2011 ................................................................... 13
Graph 6. Employment multipliers, paid labour, by age, 2010–2011 ....................................................... 14
Graph 7. Impact of the Urgent Plan on the labour force (2013 figures) .................................................. 16
Graph 8. Impact of the Urgent Plan on the labour force, youth (2013 figures)....................................... 17
Graph 9. Impact of the Urgent Plan on the labour force, gender (2013 figures) ..................................... 18
Graph 10. Sectoral cost-effectiveness to reduce youth vulnerability (2013 figures) .............................. 19
vii


1. Introduction
As a response to the global economic and financial crisis, in 2008–2009 the Egyptian government implemented a fiscal stimulus package designed to build public utilities infrastructure, particularly water and sewage projects, as well as roads, bridges, schools and basic health care centres. It hoped to limit the possible adverse repercussions of the global financial crisis on the Egyptian economy and maintain the sustainability of development programmes by increasing employment rates and reducing the threat of a decline in the rate of economic growth.4
However, after the January 2011 revolution, several issues became more urgent. The lack of decent jobs, mainly for youth, led to the prioritisation or scaling up of certain on-going intervention activities. In this context, the relevant ministries and partners sought to provide an integrated response to the domestic crisis, paying special attention to employment questions. In this framework, the social turmoil and economic slowdown in Egypt led to the implementation of a new stimulus package in order to overcome the current socio-economic situation. In this context, the Ministry of Planning (MoP) approached the ILO to conduct an employment impact assessment of the Urgent Plan to Activate the Egyptian Economy, 2013–2014 (hereafter referred to as the Urgent Plan).
Therefore, the remainder of this document is structured as follows: firstly, a short description of the current stimulus packages in comparison to their predecessors. Secondly, a brief presentation of the methodology, followed by data details and the structural features of the Egyptian economy (also located in the Appendix). And most importantly, we shall assess the potential impact of the Urgent Plan, presenting our conclusions and some future challenges for discussion.
1.1. Urgent Plan for the year 2013–2014
The Urgent Plan to activate the Egyptian economy for 2013–2014 was implemented by Presidential Decree No. 105, 2013, allowing for the provision of additional credits from the State’s budget for the financial year 2013–2014. In this regard, it is important to note that in the context of a limited fiscal space, the key to reducing budget deficits is restoring the trajectory of sustained and better diversified growth: an empirical study highlights that a positive shock in GDP by 1 per cent decreases the budget deficit in the subsequent two quarters.5
The two main pillars of the Urgent Plan were: i) revitalising the Egyptian economy and ii) increasing final demand in order to promote economic growth, as well as job creation and maintenance. In other words, this extra public expenditure was aimed at supporting and enhancing industries and services; developing infrastructure and public services and improving their efficiency and extension; and providing industrial training. In this regard, a recent study has shown that access to infrastructure allows workers to be more productive and thus allows companies to save money and invest in new machinery. Better roads and ports also provide access to new markets,6 improve trade and as a result, attract investments.
4 Abdelfattah Moursi, T. and Mossallamy, M. E. (2010). 5 Abdellatif, L., Shehata, A. and Albedwehy (2012). 6 International Finance Corporation (2013).
1
_________________________
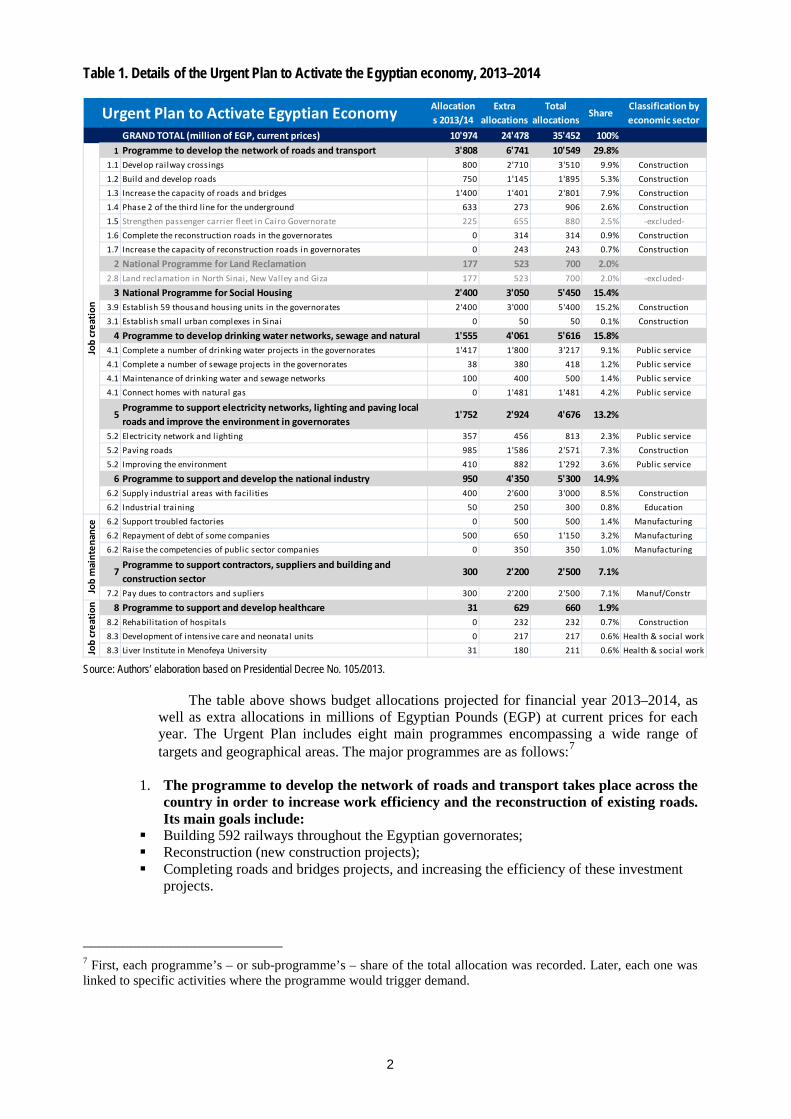
Table 1. Details of the Urgent Plan to Activate the Egyptian economy, 2013–2014
Source: Authors’ elaboration based on Presidential Decree No. 105/2013.
The table above shows budget allocations projected for financial year 2013–2014, as well as extra allocations in millions of Egyptian Pounds (EGP) at current prices for each year. The Urgent Plan includes eight main programmes encompassing a wide range of targets and geographical areas. The major programmes are as follows:7
1. The programme to develop the network of roads and transport takes place across the country in order to increase work efficiency and the reconstruction of existing roads. Its main goals include:
Building 592 railways throughout the Egyptian governorates; Reconstruction (new construction projects); Completing roads and bridges projects, and increasing the efficiency of these investment
projects.
7 First, each programme’s – or sub-programme’s – share of the total allocation was recorded. Later, each one was linked to specific activities where the programme would trigger demand.
Allocations 2013/14
Extra allocations
Total allocations
ShareClassification by economic sector
GRAND TOTAL (million of EGP, current prices) 10'974 24'478 35'452 100%1 Programme to develop the network of roads and transport 3'808 6'741 10'549 29.8%
1.1 Develop railway crossings 800 2'710 3'510 9.9% Construction1.2 Build and develop roads 750 1'145 1'895 5.3% Construction1.3 Increase the capacity of roads and bridges 1'400 1'401 2'801 7.9% Construction1.4 Phase 2 of the third l ine for the underground 633 273 906 2.6% Construction1.5 Strengthen passenger carrier fleet in Cairo Governorate 225 655 880 2.5% -excluded- 1.6 Complete the reconstruction roads in the governorates 0 314 314 0.9% Construction1.7 Increase the capacity of reconstruction roads in governorates 0 243 243 0.7% Construction
2 National Programme for Land Reclamation 177 523 700 2.0%2.8 Land reclamation in North Sinai, New Valley and Giza 177 523 700 2.0% -excluded-
3 National Programme for Social Housing 2'400 3'050 5'450 15.4%3.9 Establish 59 thousand housing units in the governorates 2'400 3'000 5'400 15.2% Construction3.1 Establish small urban complexes in Sinai 0 50 50 0.1% Construction
4 Programme to develop drinking water networks, sewage and natural 1'555 4'061 5'616 15.8%4.1 Complete a number of drinking water projects in the governorates 1'417 1'800 3'217 9.1% Public service4.1 Complete a number of sewage projects in the governorates 38 380 418 1.2% Public service4.1 Maintenance of drinking water and sewage networks 100 400 500 1.4% Public service4.1 Connect homes with natural gas 0 1'481 1'481 4.2% Public service
5Programme to support electricity networks, lighting and paving local roads and improve the environment in governorates
1'752 2'924 4'676 13.2%
5.2 Electricity network and l ighting 357 456 813 2.3% Public service5.2 Paving roads 985 1'586 2'571 7.3% Construction5.2 Improving the environment 410 882 1'292 3.6% Public service
6 Programme to support and develop the national industry 950 4'350 5'300 14.9%6.2 Supply industrial areas with facil ities 400 2'600 3'000 8.5% Construction6.2 Industrial training 50 250 300 0.8% Education6.2 Support troubled factories 0 500 500 1.4% Manufacturing6.2 Repayment of debt of some companies 500 650 1'150 3.2% Manufacturing6.2 Raise the competencies of public sector companies 0 350 350 1.0% Manufacturing
7Programme to support contractors, suppliers and building and construction sector
300 2'200 2'500 7.1%
7.2 Pay dues to contractors and supliers 300 2'200 2'500 7.1% Manuf/Constr
8 Programme to support and develop healthcare 31 629 660 1.9%8.2 Rehabilitation of hospitals 0 232 232 0.7% Construction8.3 Development of intensive care and neonatal units 0 217 217 0.6% Health & social work8.3 Liver Institute in Menofeya University 31 180 211 0.6% Health & social work
Urgent Plan to Activate Egyptian EconomyJo
b cr
eatio
nJo
b m
aint
enan
ceJo
b cr
eatio
n
2
_________________________

2. The National Programme for Social Housing: Social housing units in the governorates to include 1,372 buildings and 29,624 housing
units. Social housing units in the new cities to include a total number of 20,108 units and 927
buildings are expected to be completed in the context of the Urgent Plan before 30 June 2014.
3. Programme to develop drinking water networks, sewage and connections to natural gas:
Village sanitation projects; 55 drinking water and sanitation projects in 60 villages (for example, this kind of project is
expected to be implemented during the financial year 2013–2014 in North and South Sinai);
Housing units connected to natural gas programme.
4. Programme to support and develop health care in order to: Provide radiation equipment for 192 hospitals throughout the Egyptian governorates; Rehabilitate 59 hospitals; Develop 45 intensive care units; Add an additional 35 neonatal units.
As you can see, two items were excluded in the impact simulation (4.5 per cent of the whole stimulus package). Line 1.5 was excluded due to the fact that it refers to buses, which, according to the information we received, would in this case be imported.8 Land reclamation was likewise excluded because of it is difficult to evaluate, since it is more of a long-term plan with a large number of unknown parameters and involves multi-sectorial challenges regarding productivity increase. Therefore, the remaining 95.5 per cent are considered in the following sections for impact analysis.
8 However, in a future study, it would be possible to include forward linkages in sectors such as trade, transport, insurance, etc.
3
_________________________

Graph 1. Comparison of stimulus packages in the Egyptian economy
Source: Authors’ elaboration of data from CAPMAS and estimates.
In comparative terms, the 2008–2009 stimulus package represented 13.2 per cent of total public expenditure (the government’s final consumption expenditure), according to the input-output table (IOT) for that year (Graph 1). At 24.4 per cent, the current package, the Urgent Plan, represents almost twice as much of the total expenditure.9 The high share of extra allocations in the current package should also be highlighted. In 2008–2009, the package was mainly focused on water and sewage (45.3 per cent of the total), manufacturing (34 per cent) and construction (19.4 per cent) (see Graph 2). Therefore, the two packages have significant differences in terms of size and sectoral allocations.
9 Total government expenditure in the 2010–2011 IOT was extrapolated to 2013–2014 based on price changes; government expenditure was thus estimated for 2013–2014 assuming that all other variables remained constant. Then, total allocations for 2013–2014 were calculated as a share of this estimated government expenditure.
Allocations 2013/2014
7.6%
Extra allocations16.8%13.2%
24.4%
2008/2009 2013/2014
Growth of public expenditure due to Egypt's stimulus packages2013 current prices according to 2010/2011 structure of public expenditure
2.1% GDP
2012/2013
1.6% GDP
2008/2009
4
_________________________

Graph 2. Comparison of stimulus packages in the Egyptian economy by sector
Source: Authors’ elaboration of data from CAPMAS.
The 2013–2014 stimulus package would involve additional expenditures equivalent to 24.4 per cent of total public expenditure, following the 2010–2011 economic structure (Graph 1). In order to compare the previous stimulus package with the current one and go beyond information constraints, the amount of money implicated in the Urgent Plan was “deflated” according to the overall Producer Price Index established by CAPMAS. Considering 2010–2011 prices, it would have reached around EGP 31.3 billion, all other factors remaining constant.
Regarding the composition of the Urgent Plan (Graph 2), construction is the sector that would receive the biggest share of allocations (62.5 per cent), followed by public services (21.8 per cent). Public services include water supply and sewerage (15.3 percentage points) and electricity, gas, steam and air conditioning supply (6.5 percentage points.). Therefore, there is also a sectoral shift in the stimulus package away from manufacturing and towards the construction and energy sectors. The focus is placed on economic growth, but also on job creation and the preservation of already existing jobs.
Infrastructure investment10 has a key role to play in economic growth (including with regard to issues of better connectivity and the environment), but also with regard to job creation, which is necessary to fulfil the inspirations of a growing population with a high percentage of younger individuals. Job quality is therefore another issue that needs to be addressed in order to guarantee social inclusion and reduce poverty.
10 In addition to support for industries and services, including industrial training.
19.4%
45.3%
34.0%
1.3%
62.5%
21.8%
9.2%
2.5%
2.0%
1.2%
0.8%
Construction
Public serv
Manufacturing
Transportation & storage
Land reclamation
Health & social work
Education
Egypt's stimulus packages according to expenditure allocationmain economic sectors
2008/2009 2013/2014
5
_________________________

1.2. Structural features of Egyptian economy and multiplier effects
Taking into account methodological issues as well as data availability and constraints (see the following section and the Appendix), we calculated two estimations for the Egyptian economy in order to recognise structural features via output and employment multiplier effects. The difference between the two estimates stems from their respective treatment of occupational structures, which in 2013 were composed of 62 per cent of wage employees; 12.7 per cent of employers; 15.1 per cent of self-employed individuals; and 10.2 per cent of non-contributing family workers (Graph 3 below).
According to national accounts, the income of employers and the self-employed are recorded as “net operating surplus”, whereas income from wage employment is recorded as “wages”. However, several studies show similarities between self-employment and wage employment. By definition, family workers do not receive any income for their work and were therefore excluded.
Graph 3. Overview of the Egyptian labour force
Source: Authors’ elaboration of data from CAPMAS.
Wage employment in Egypt is at slightly over 60 per cent, and youth wage employment is at a very similar level (62.6 per cent). The unemployment rate is high, at 13.3 per cent. The young labour force includes about 5.46 million individuals, while youth
62.0% 62.6%
15.1%
8.5%10.2%
26.8%
12.7%
2.2%
13.3%
35.4%
total youth total youth total youth total youth total youth
14.64 2.21 3.57 0.30 2.41 0.94 3.00 0.08 3.62 1.93
Wage employed Self-employed Unpaid family worker Employer
Total occupied => total: 23.6 // youth: 3.5 Unemployment
Egyptian labour force2013 average
39.2% of total
52.9% of total
Youth toTotal
Empshare 16.8%
2010
201114.8%(12.1%)
2013 -2pp∆
Highervulnerability
2.875 M
6
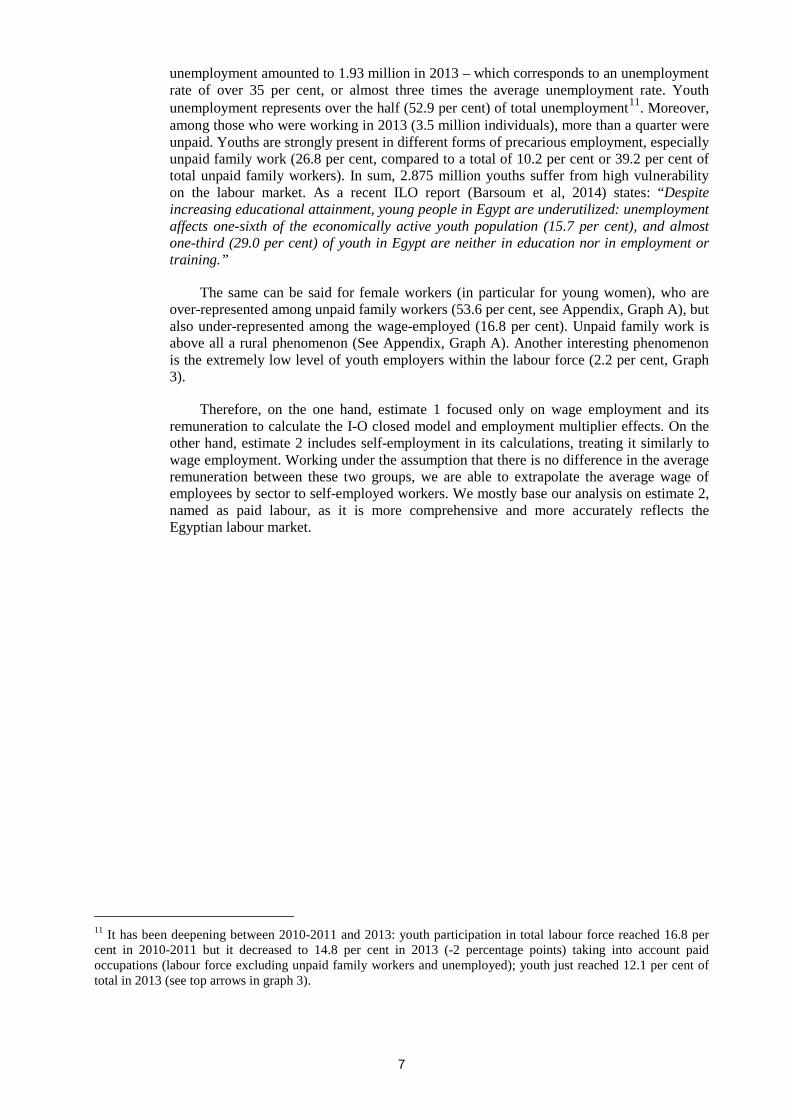
unemployment amounted to 1.93 million in 2013 – which corresponds to an unemployment rate of over 35 per cent, or almost three times the average unemployment rate. Youth unemployment represents over the half (52.9 per cent) of total unemployment11. Moreover, among those who were working in 2013 (3.5 million individuals), more than a quarter were unpaid. Youths are strongly present in different forms of precarious employment, especially unpaid family work (26.8 per cent, compared to a total of 10.2 per cent or 39.2 per cent of total unpaid family workers). In sum, 2.875 million youths suffer from high vulnerability on the labour market. As a recent ILO report (Barsoum et al, 2014) states: “Despite increasing educational attainment, young people in Egypt are underutilized: unemployment affects one-sixth of the economically active youth population (15.7 per cent), and almost one-third (29.0 per cent) of youth in Egypt are neither in education nor in employment or training.”
The same can be said for female workers (in particular for young women), who are over-represented among unpaid family workers (53.6 per cent, see Appendix, Graph A), but also under-represented among the wage-employed (16.8 per cent). Unpaid family work is above all a rural phenomenon (See Appendix, Graph A). Another interesting phenomenon is the extremely low level of youth employers within the labour force (2.2 per cent, Graph 3).
Therefore, on the one hand, estimate 1 focused only on wage employment and its remuneration to calculate the I-O closed model and employment multiplier effects. On the other hand, estimate 2 includes self-employment in its calculations, treating it similarly to wage employment. Working under the assumption that there is no difference in the average remuneration between these two groups, we are able to extrapolate the average wage of employees by sector to self-employed workers. We mostly base our analysis on estimate 2, named as paid labour, as it is more comprehensive and more accurately reflects the Egyptian labour market.
11 It has been deepening between 2010-2011 and 2013: youth participation in total labour force reached 16.8 per cent in 2010-2011 but it decreased to 14.8 per cent in 2013 (-2 percentage points) taking into account paid occupations (labour force excluding unpaid family workers and unemployed); youth just reached 12.1 per cent of total in 2013 (see top arrows in graph 3).
7
_________________________

2. Employment impact assessment
2.1 Methodological issues12
The analysis of the employment impact of the Urgent Plan requires an analytical tool, which combines the macro dimension (public policies and investment) with the meso (sectoral information and the value chain) and micro dimensions, showing the impact on different groups of workers. An Input-Output and Social Accounting Matrix framework appears to be the most appropriate tool for this type of analysis. As we did not account for price or competition effects, we did not have to complement this framework with a more comprehensive economic model.
Broadly speaking, any Input-Output (I-O) or Social Accounting Matrix (SAM) multiplier analysis starts by recognising the importance of productive interdependences within an economy. In other words, this analysis takes place in a circular flow framework where production, demand and distribution are interlinked.
By focusing on production linkages between commodities and activities as well as their potential impact on employment and income distribution, the I-O model is a helpful analytical tool for identifying bottlenecks, trade-offs and complementarities, setting up production priorities and calculating cost-benefit effects or price-cost margins. It can help to identify (i) sectors and commodities that create the highest production or value added and their import requirements; and (ii) the highest employment or income effect (including distributional effects), in response to changes in exogenous sectoral final demand, caused by public policies, private sector development or external shocks (e.g. financial crises or natural disasters).
What are the main methodological constraints involved? As the I-O model fixes proportional relationships between inputs and measures commodities at constant prices, the model necessarily remains static. Firstly, under the proportionality assumption, domestic inputs and foreign inputs (i.e. imports) are complementary. Secondly, relationships between inputs and outputs can be assumed to be fixed only in the short and medium terms. Thirdly, since the I-O model only allows for the evaluation of cost-push inflation, constant relative prices must be assumed and it is impossible to analyse the impact of relative price changes on the economy (Alarcón, 1980; Bulmer-Thomas, 1982). Fourthly, the constant market shares hypothesis implies that regardless of technological changes, the product mix – within a broad sector of production activities – will remain stable over a given period. Finally, although instantaneous adjustments are supposed to take place in the models, in practice, production reacts with some delay to changes in demand.
The IOT is the key element in this kind of model, due to the fact that it typifies and quantifies all intersectoral transactions. Column entries represent sectoral expenditures on intermediate or material input and factor input payments (sectoral value added), while row entries show intermediate and final commodity demand by sector of origin. In this regard, the first step to I-O-based multiplier models is obtaining the coefficient matrix A, identifying all intersectoral demands as endogenous variables. By focusing on the backward linkages, each industry record (cell) is divided by its respective gross output (column total), in order to obtain the direct requirements for each industry at the domestic level. All of them conform to matrix A or the technical coefficient matrix, which shows the share of production of each sector that depends on the rest of the domestic activities. In matrix terms, the open I-O model is as follows:
12 Based on Ernst, C. and Sarabia, M. (forthcoming).
8
_________________________

1. 𝑌 = 𝑋 + 𝐴𝑌
2. (𝐼 − 𝐴) ∗ 𝑌 = 𝑋
3. ∆𝑌 = (𝐼 − 𝐴)−1 ∗ ∆𝑋
4. ∆𝐸𝑀𝑃 = 𝐸𝑂∗ ∆𝑌
Where:
Y = total demand vector = gross output vector X = final demand vector A = technical coefficient matrix, nonnegative with 𝑎𝑖𝑗 ≥ 0 for all 𝑖 and 𝑗 𝑎𝑖𝑗 = 𝑥𝑖𝑗
𝑋𝑖 where 𝑥𝑖𝑗 is the 𝑗𝑡ℎ intersectorial requirement of the 𝑖𝑡ℎ commodity
and 𝑋𝑗 is the 𝑗𝑡ℎ sectorial output I = identity matrix (𝐼 − 𝐴)−1 = Leontief inverse matrix EMP = employment multiplier effects matrix 𝐸𝑂
= diagonal matrix of sectorial employment output ratios with 𝑒𝑗 = 𝑒𝑖𝑗 if 𝑖 = 𝑗
𝑒𝑖𝑗 = 𝑒𝑗 = 𝑒𝑚𝑝𝑙𝑜𝑦𝑚𝑒𝑛𝑡𝑗𝑜𝑢𝑡𝑝𝑢𝑡𝑗
= employment output ratios where 𝑗 = 1…n
The Leontief inverse matrix (I – A)-1 records the total requirement matrix at the inter-industry level. In this regard, the Leontief inverse matrix accounts for how the production of the 𝑖𝑡ℎ commodity changes when the demand of the 𝑗𝑡ℎ industry has changed. In other words, the sum of each column represents productive multiplier effects of one additional monetary unit spent in a certain sector on the total output at overall level – type I multipliers. To split different multiplier effects, indirect effects are obtained by subtracting the direct coefficient 𝑎𝑖𝑗 from the total productive requirements 𝑙𝑖𝑗. In order to capture the direct impact of that additional monetary unit on employment, the employment multipliers (matrix EMP) need to be established. This is the sum of products between each technical coefficient 𝑎𝑖𝑗 and the corresponding employment output ratio 𝑒𝑖𝑖. Each employment output ratio is the sectoral productivity inverse that reflects labour intensity by sector. The analogous procedure also applies for indirect, induced and total multiplier effects obtained from the Leontief inverse matrix.
So far, in the open I-O model, all the categories of final demand are exogenous, meaning that there is no feedback from factor income into demand for goods and services, providing us with simple direct and indirect multiplier effects. This constraint is partially accounted for by the closed I-O model that introduces induced multiplier effects as a result of income feedbacks (O'Connor and Henry, 1975 and Alarcón, 2006). The direct, indirect and induced effects together are known as the total or complete multiplier effects (see chart below) and the closed I-O model therefore allows for the evaluation of economy-wide effects within a more articulated productive structure: for example, the effects triggered by changes in the remaining final demand categories (government consumption, exports and capital formation) on sectoral production structure. Following the circular economic flow, further effects can be measured, for example, on factorial and household incomes, and on the feedback effects of household demand on production. Hence, in the closed I-O model, increased wages and distributed profits lead to higher household expenditure demand. The former leads to an increase in the demand for goods and services and this in turn leads to increases in sectoral production (e.g. supply).
9

Chart 1. Optimize employment outcomes of public investment/spending
Following Miller and Blair (2009), if sector j increases its output, this means there will be increased demands from sector j (as a purchaser) on the sectors whose goods are used as inputs for production of j. This is the direction of causation in the usual demand-side model, and the term “backwards linkages” is used to indicate this interconnection of a particular sector with those (upstream) sectors from which it purchases inputs. In other words, it captures not only direct and indirect effects, but also the induced effects of household income generation through their labour compensation.
In practical terms, the coefficient matrix in the closed I-O model13 gains one dimension by making household consumption endogenous as a new column in the coefficient matrix and by including the analogous income, which allows for this expenditure to form an additional row. Household income is represented as a proxy by total labour income, defined here as payments for labour services of wage employees and the self-employed. That resulting matrix is known as the augmented matrix A* and previous specifications are valid when A is replaced by A*. As previously mentioned, this is the result of including household income and expenditures in the original matrix A and recalculating the multiplier effects. These procedures are also analogous for the augmented Leontief inverse matrix which transforms the open I-O model into a closed one. In this case, the augmented Leontief inverse matrix provides the total output multiplier effects by adding together 𝑙𝑖𝑗∗ and 𝑙𝑖𝑗.
13 However, “closing” the IOT yields a model that is somewhat more comprehensive and encompassing, by making a large part of the economic cycle (demand, household production factor, income-demand-production) endogenous, it still does not capture the effects of institutions of income distribution and transfers, nor does it show the sources of users of capital formation and savings or the financial flows among and within domestic institutions and the rest of the world, aspects that are all explicitly introduced as part of a SAM, where savings remain stable.
10
_________________________
The main basis for this assessment was the official Egyptian IOT for 2010–2011
provided by CAPMAS, as well as the previous 2008–2009 version.14
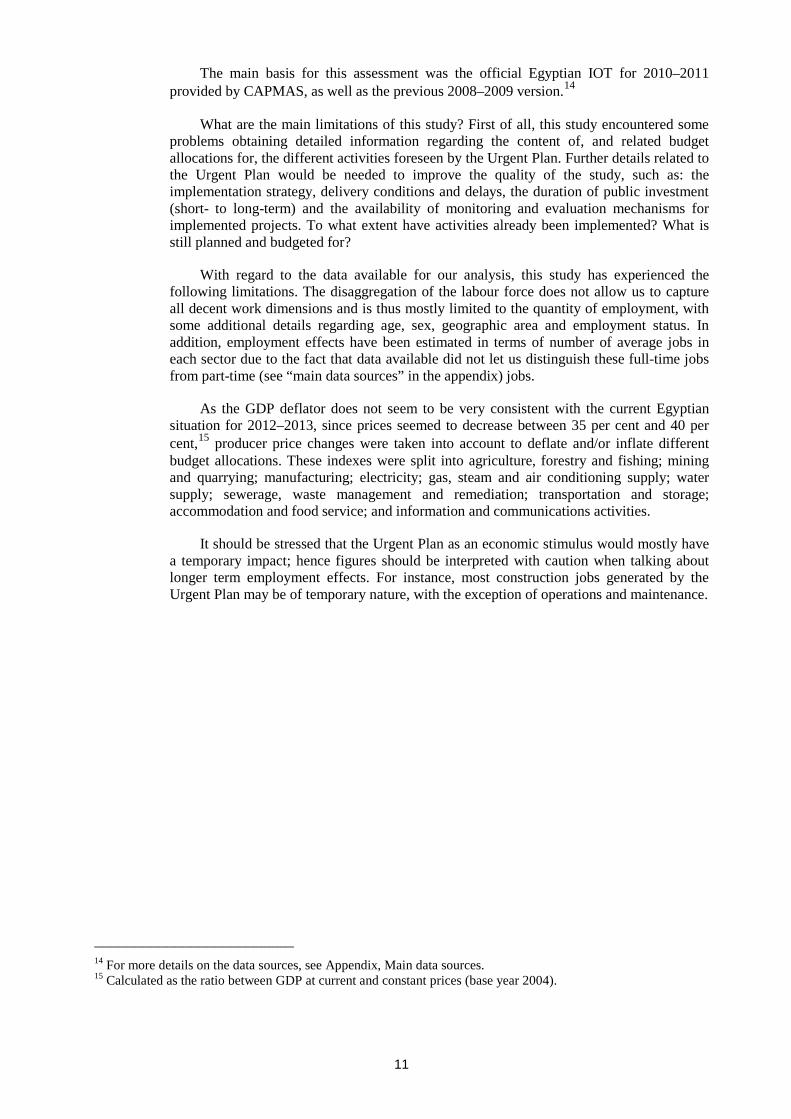
What are the main limitations of this study? First of all, this study encountered some problems obtaining detailed information regarding the content of, and related budget allocations for, the different activities foreseen by the Urgent Plan. Further details related to the Urgent Plan would be needed to improve the quality of the study, such as: the implementation strategy, delivery conditions and delays, the duration of public investment (short- to long-term) and the availability of monitoring and evaluation mechanisms for implemented projects. To what extent have activities already been implemented? What is still planned and budgeted for?
With regard to the data available for our analysis, this study has experienced the following limitations. The disaggregation of the labour force does not allow us to capture all decent work dimensions and is thus mostly limited to the quantity of employment, with some additional details regarding age, sex, geographic area and employment status. In addition, employment effects have been estimated in terms of number of average jobs in each sector due to the fact that data available did not let us distinguish these full-time jobs from part-time (see “main data sources” in the appendix) jobs.
As the GDP deflator does not seem to be very consistent with the current Egyptian situation for 2012–2013, since prices seemed to decrease between 35 per cent and 40 per cent,15 producer price changes were taken into account to deflate and/or inflate different budget allocations. These indexes were split into agriculture, forestry and fishing; mining and quarrying; manufacturing; electricity; gas, steam and air conditioning supply; water supply; sewerage, waste management and remediation; transportation and storage; accommodation and food service; and information and communications activities.
It should be stressed that the Urgent Plan as an economic stimulus would mostly have a temporary impact; hence figures should be interpreted with caution when talking about longer term employment effects. For instance, most construction jobs generated by the Urgent Plan may be of temporary nature, with the exception of operations and maintenance.
14 For more details on the data sources, see Appendix, Main data sources. 15 Calculated as the ratio between GDP at current and constant prices (base year 2004).
11
_________________________

2.2 Multiplier analysis of Egyptian economy and labour market
Graph 4. Output multipliers, wage compensation, 2010–2011
Source: Authors’ calculations based on Egyptian IOT 2010–11. Note: Aggregate output increase per each additional million of EGP in terms of final demand at current prices, 2010–2011.
This breakdown comes from the 2010–2011 IOT; households as employers were excluded. Looking at the output multiplier effects for labour compensation, all sectors implicated in the Urgent Plan have higher multiplier effects than the weighted, and even the simple, average for the Egyptian economy. In particular, manufacturing, construction16 and public services17 have a high indirect effect, demonstrating their strong integration with the other productive sectors of the Egyptian economy, whereas health and social services have a high direct effect, and education a strong induced positive effect on the economy through higher income generation. Wage compensation figures are very similar (See Appendix, Graph B). Therefore, when considering the impact of the Urgent Plan impacts as globally
16 Consulting a more detailed IOT from 2008–09, water supply has an even higher output multiplier (see Appendix, Graph B). 17 See Appendix. It is necessary to note that “public services” includes electricity, gas, steam and air conditioning supply, as well as water supply, sewerage, waste management and remediation activities. These two sectors were disaggregated in the 2008–09 IOT, demonstrating that water supply is the sector with the highest total output and employment multiplier effects despite its small global participation in the economy (0.1 per cent of output). Despite the 2010–2011 IOT having 47 categories, electricity, gas, steam and air conditioning supply were not identified, whereas water collection, treatment and supply were computed jointly with the manufacturing of other transport equipment. In addition, machinery and equipment as a sector was replicated in different accounts. Therefore, this study is based on the 2010–2011 IOT with 18 sectors, since employment data was disaggregated for only 20 sectors (the two sectors that conflated public services were split).
0.29
0.30
0.34
0.42
0.31
0.50
0.31
0.69
0.38
0.81
0.51
0.43
0.15
0.17
0.31
1.05
1.04 1.05 1.12 1.
24 1.30
1.20 1.
31
1.21
1.45
1.24
1.48
1.29
1.58
1.08
1.42
1.36
1.12
1.13 1.
25
0.81 0.
87 0.91 0.
94 1.11 0.98
1.20 0.83 1.29 0.74
1.27 0.
74
1.98 1.25
1.71
2.64 2.70
2.89
1.261.60
1.952.14
2.43 2.55 2.65 2.71 2.72 2.78 2.85 2.91 2.943.13 3.15 3.19
3.50
3.91 4.00
4.45
Min
ing
Real
Esta
te
Fina
nc&
Insu
r
Adm
&Su
ppor
t
Agric
For&
Fish
Tran
sp&
Stor
Info
&Co
mm
un
WEI
GHTE
D …
Trad
e&Re
pair
Acco
mm
&Fo
od
SIM
PLE A
VG
Man
ufac
turin
g
Oth
Serv
&Hh
…
Publ
icSer
v
Prof
Sc&
Tech
Cons
truc
tion
Heal
th&
SocW
Educ
atio
n
Arts
&Re
crea
t
Publ
icAdm
Output multiplier effects in Egypt, 2010-2011
Induced Indirect Direct
Estimation 2Labour
compensation
12
_________________________

as possible, the aforementioned sectors become key policy targets. The downward arrows on graphs of output and employment multiplier effects indicate the sectors which are part of the Urgent Plan.
Graph 5. Employment multipliers, paid labour, 2010–2011
Source: Authors’ calculations based on 2010–2011 Egyptian IOT. Note: Total job creation per each additional million of final demand (EGP) at current prices, 2010–2011.
Analysing the employment multipliers shows a different picture for some of the sectors targeted by the Urgent Plan. Public services and manufacturing have below average impact on job creation, due to their low employment multipliers and the fact that they are by nature more capital-intensive. Nevertheless, these sectors also employ a relatively high share of skilled workers. On the contrary, other services sectors such as health and social services, education and construction are highly significant for job creation.
1.8 3.2 3.2 2.1 1.7 0.5 1.7 1.7 2.1 1.4 2.9 4.2 2.8 1.02.94.0 5.9 5.5 7.1 10.3 9.3 12.4
9.711.7 11.5 12.6
6.9
14.4
20.7 22.5 27.3
32.9
3.1
4.2 2.8 2.83.2 3.3 3.7
3.67.5
4.6 4.9 3.5 10.3
6.5
4.8 4.8
11.0
10.0
1.4 2.4
6.5
10.3 10.6 11.513.5 14.3 15.1
17.7 17.7 17.9 18.1 18.1 18.5
23.8
29.7 30.1
38.2
43.9
Min
ing
Real
Esta
te
Fina
nc&
Insu
r
Info
&Co
mm
un
Publ
icSer
v
Man
ufac
turin
g
Acco
mm
&Fo
od
Adm
&Su
ppor
t
WEI
GHTE
D …
Tran
sp&
Stor
Prof
Sc&
Tech
Trad
e&Re
pair
SIM
PLE A
VG
Agric
For&
Fish
Arts
&Re
crea
t
Heal
th&
SocW
Cons
truc
tion
Oth
Serv
&Hh
…
Publ
icAdm
Educ
atio
n
Employment multiplier effects in Egypt, 2010-2011
Induced Indirect Direct
Estimation 2Paid
labour
13

Graph 6. Employment multipliers, paid labour, by age, 2010–2011
Source: Authors’ calculations based on 2010–2011 Egyptian IOT. Note: Total job creation per each additional million of final demand (EGP) at current prices, 2010–2011.
Taking a closer look at the age distribution for paid labour, we can observe the high importance of construction for youth among the selected sectors. To a certain degree, the service sectors (health and social services, other services, education) are also significant for youth employment. Looking at the potential for job creation within the 2010–2011 employment structure, youth participation in some of the selected sectors was in general slightly above Egyptian economy’s average (2.5). This is a promising sign amidst the otherwise unfavourable situation of youth in the Egyptian labour market.
An analysis by gender reaffirms the strong potential for generating new female jobs in social sectors such as health and education, which also play an important role in the Urgent Plan. Traditionally, however, female workers (0.9 per cent according to the first estimation, just based on wage employment) display a kind of gender segregation when we focus on the “trigger” effects of total employment multipliers in the construction sector, where they are under-represented. A comparison of rural and urban area shows that rural activities, in particular agriculture, are not key sectors in the Urgent Plan. Land reclamation, which was outside the scope of this study, would be expected to play a key role in supporting rural areas. Manufacturing is traditionally predominantly an urban activity, whereas rural areas have high employment multipliers in some sectors of the Urgent Plan – mainly construction (including water supply), and also to some extent, in the service sector (See Appendix, Graphs C–H, for more details, in particular regarding age, gender and geographic area).
0.3 0.4 0.8 1.5 1.2 2.2 2.8 2.1 2.5 2.6 2.5 3.3 2.6 3.6 2.9 3.5 7.7 3.9 3.0 3.31.4 2.4
6.5
10.3 10.6 11.513.5 14.3 15.1
17.7 17.7 17.9 18.1 18.1 18.5
23.8
29.7 30.1
38.2
43.9
Min
ing
Real
Esta
te
Fina
nc&
Insu
r
Info
&Co
mm
un
Publ
icSer
v
Man
ufac
turin
g
Acco
mm
&Fo
od
Adm
&Su
ppor
t
WEI
GHTE
D AV
G
Tran
sp&
Stor
Prof
Sc&
Tech
Trad
e&Re
pair
SIM
PLE A
VG
Agric
For&
Fish
Arts
&Re
crea
t
Heal
th&
SocW
Cons
truc
tion
Oth
Serv
&Hh
empl
Publ
icAdm
Educ
atio
n
Employment multiplier effects by ageJobs for rest of labour forceJobs for youthTotal jobs (only number)
Estimation 2Paid
labour
14
3. The Urgent Plan and its potential impact on employment: Simulation exercise
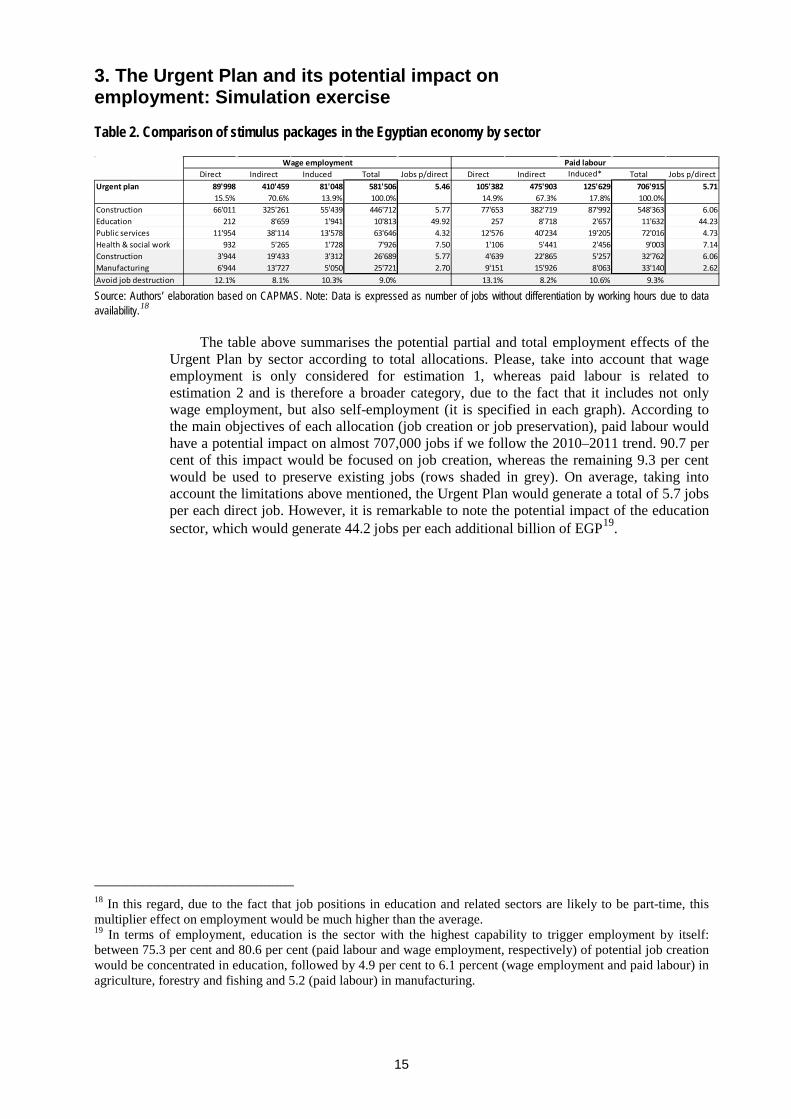
Table 2. Comparison of stimulus packages in the Egyptian economy by sector
Source: Authors’ elaboration based on CAPMAS. Note: Data is expressed as number of jobs without differentiation by working hours due to data availability.18
The table above summarises the potential partial and total employment effects of the Urgent Plan by sector according to total allocations. Please, take into account that wage employment is only considered for estimation 1, whereas paid labour is related to estimation 2 and is therefore a broader category, due to the fact that it includes not only wage employment, but also self-employment (it is specified in each graph). According to the main objectives of each allocation (job creation or job preservation), paid labour would have a potential impact on almost 707,000 jobs if we follow the 2010–2011 trend. 90.7 per cent of this impact would be focused on job creation, whereas the remaining 9.3 per cent would be used to preserve existing jobs (rows shaded in grey). On average, taking into account the limitations above mentioned, the Urgent Plan would generate a total of 5.7 jobs per each direct job. However, it is remarkable to note the potential impact of the education sector, which would generate 44.2 jobs per each additional billion of EGP19.
18 In this regard, due to the fact that job positions in education and related sectors are likely to be part-time, this multiplier effect on employment would be much higher than the average. 19 In terms of employment, education is the sector with the highest capability to trigger employment by itself: between 75.3 per cent and 80.6 per cent (paid labour and wage employment, respectively) of potential job creation would be concentrated in education, followed by 4.9 per cent to 6.1 percent (wage employment and paid labour) in agriculture, forestry and fishing and 5.2 (paid labour) in manufacturing.
Direct Indirect Induced Total Jobs p/direct Direct Indirect Induced* Total Jobs p/directUrgent plan 89'998 410'459 81'048 581'506 5.46 105'382 475'903 125'629 706'915 5.71
15.5% 70.6% 13.9% 100.0% 14.9% 67.3% 17.8% 100.0%Construction 66'011 325'261 55'439 446'712 5.77 77'653 382'719 87'992 548'363 6.06Education 212 8'659 1'941 10'813 49.92 257 8'718 2'657 11'632 44.23Public services 11'954 38'114 13'578 63'646 4.32 12'576 40'234 19'205 72'016 4.73Health & social work 932 5'265 1'728 7'926 7.50 1'106 5'441 2'456 9'003 7.14Construction 3'944 19'433 3'312 26'689 5.77 4'639 22'865 5'257 32'762 6.06Manufacturing 6'944 13'727 5'050 25'721 2.70 9'151 15'926 8'063 33'140 2.62Avoid job destruction 12.1% 8.1% 10.3% 9.0% 13.1% 8.2% 10.6% 9.3%
Wage employment Paid labour
15
_________________________

Graph 7. Impact of the Urgent Plan on the labour force (2013 figures)
Source: Authors’ calculation based on 2010–2011 Egyptian IOT.
Taking 2013 and wage employment (estimation 1) as a starting point, with 23.6 million people in the labour force and 3.62 million unemployed, 0.19 per cent (52,000) of the labour force is expected to remain occupied and to generate jobs for another 1.94 per cent of workers (529,000) according to the Urgent Plan. For example, if the share of contributing family workers remains the same, the unemployment rate will likely decrease by 2 percentage points (to 11.36 per cent).
Then, Graph 7 demonstrates that the unemployment rate would decrease significantly as a result of the implementation of the stimulus package in both scenarios, with a decline of 2 percentage points for wage employment and of 2.4 percentage points for paid labour. This is mainly due to the creation of new jobs (between 1.9 and 2.4 per cent) rather than to the preservation of existing jobs (around 0.2 per cent). The unemployment rate will fall by almost 2 per cent in the wage employment scenario and by over 2.4 per cent for total employment.
0.19%
1.94%
11.36%
0.24%
2.35%
10.95%
Job preservation Job creation New unemployment
rate
Job preservation Job creation New unemployment
rate
Wage employment Paid labour
Potential impacts of the Urgent Plan on total labour forceaccording to 2013 indicators
13.3%unemployment
rate (2013)
16

Graph 8. Impact of the Urgent Plan on the labour force, youth (2013 figures)
Source: Authors’ calculations based on 2010–2011 Egyptian IOT.
Based on the previous graph, but now focusing on the youth population, we can assume a uniform shock on the young labour force, according to their participation in employment. The decline in youth unemployment, however, is less pronounced than the average, mainly, because the involvement of youth is modest in the sectors targeted by the Urgent Plan. With regard to wage employment, it may decline by only 2.5 percentage points, and with regard to paid labour by only 2.8 percentage points. This result is somewhat surprising, as selected public interventions generally have relatively good results with regard to employment. However, plugging in real budget figures in these simulations, the different weight given to the various activities shows dominance in all the sectors where the employment effect for youth is lower than the national average. Even though the differences are not immense, they still demonstrate that the Urgent Plan has not been designed with the young labour force sufficiently in mind.
The paper reveals modest youth employment impact of the Urgent Plan on page 18, noting a smaller decline in youth unemployment rate than the reduction in overall unemployment rate. It explains this by pointing out that the Plan invests in sectors in which the involvement of youth is modest.
0.24%2.47%
32.91%
0.27%2.75%
32.62%
Job preservation Job creation New unemployment
rate
Job preservation Job creation New unemployment
rate
Wage employment Paid labour
Potential impacts of the Urgent Plan on young labour forceaccording to 2013 indicators
35.4%youth unempl.
rate (2013)
17
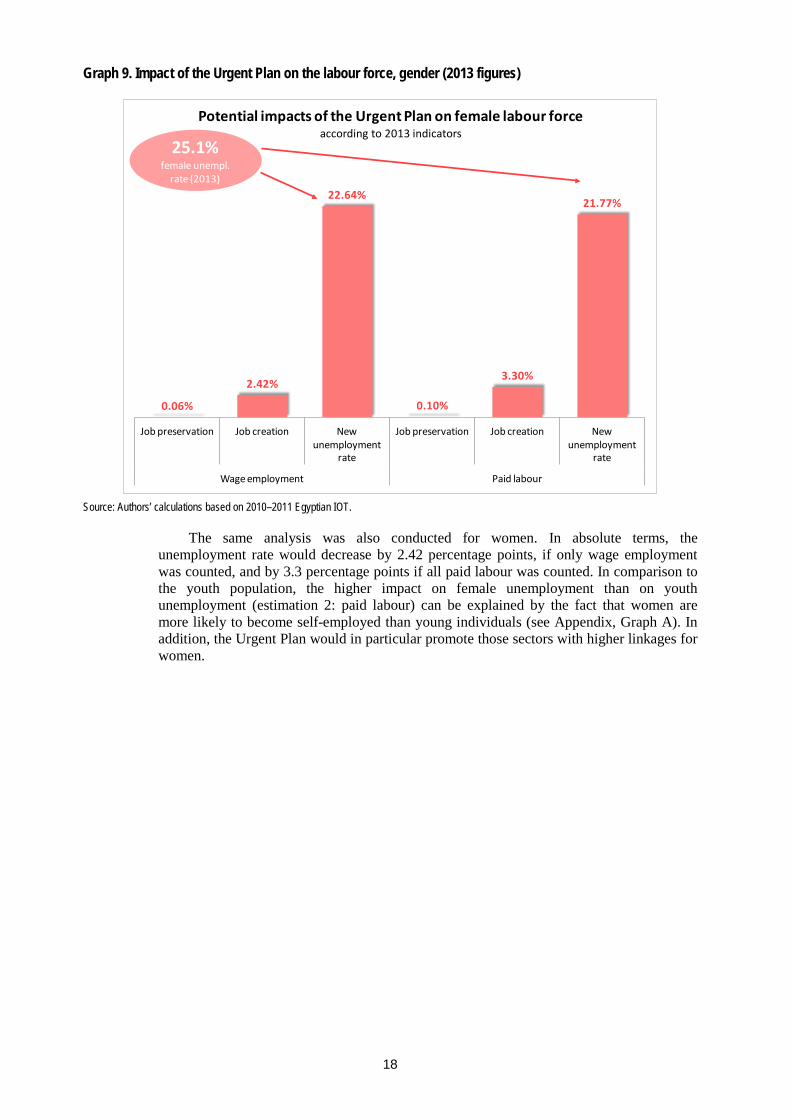
Graph 9. Impact of the Urgent Plan on the labour force, gender (2013 figures)
Source: Authors’ calculations based on 2010–2011 Egyptian IOT.
The same analysis was also conducted for women. In absolute terms, the unemployment rate would decrease by 2.42 percentage points, if only wage employment was counted, and by 3.3 percentage points if all paid labour was counted. In comparison to the youth population, the higher impact on female unemployment than on youth unemployment (estimation 2: paid labour) can be explained by the fact that women are more likely to become self-employed than young individuals (see Appendix, Graph A). In addition, the Urgent Plan would in particular promote those sectors with higher linkages for women.
0.06%
2.42%
22.64%
0.10%
3.30%
21.77%
Job preservation Job creation New unemployment
rate
Job preservation Job creation New unemployment
rate
Wage employment Paid labour
Potential impacts of the Urgent Plan on female labour forceaccording to 2013 indicators
25.1%female unempl.
rate (2013)
18

Graph 10. Sectoral cost-effectiveness to reduce youth vulnerability (2013 figures)
Source: Authors’ calculations based on 2010–2011 Egyptian IOT.
Resuming our analysis of the youth population, there are 2.875 million youths experiencing vulnerable labour conditions (i.e. a deficit of decent work, especially for the unemployed or unpaid family workers) in 2013. In order to reduce this group’s Decent Work deficit by 25 per cent, ceteris paribus, we would need to create 719,000 jobs. What would therefore be the most cost-effective way of achieving this goal?
We shall focus on one sector in order to compare the needed expenditures (cost-effectiveness) and their outcomes in terms of job creation for youth. The results are described in Graph 9. There are huge gaps in potential job creation by sector. Promoting youth employment through education would demand 19.9 billion EGP to generate 719,000 jobs for the wage-employed and 18.5 billion EGP for paid labour, being the most effective sector in terms of money spent. Manufacturing, however, would reach this goal with 90.98 and 77.1 billion EGP respectively, becoming one of the most expensive sectors in terms of job creation, together with public services. This can be explained by the fact that this sector is already highly capital-intensive and does not employ many workers. Construction in general follows education as the least cost-effective sector, requiring 33.7 billion EGP for wage employment and 27.4 billion EGP for paid labour.
Taking the 2007–8 data with disaggregated sectoral information, the most cost-effective sector is water supply and recycling for wage employment (10.5 per cent) and even more so for total employment (9.8 per cent), while electricity and gas are at the other end of the spectrum (109.8 per cent for wage employment and 96.6 per cent for total employment).
19.9
33.738.8
87.290.8
18.5
27.434.2
70.577.1
Educ
atio
n
Cons
truc
tion
Heal
th &
soci
al w
ork
Publ
ic se
rvic
es
Man
ufac
turin
g
Educ
atio
n
Cons
truc
tion
Heal
th &
soci
al w
ork
Man
ufac
turin
g
Publ
ic se
rvic
es
Wage employment Paid labour
Government expenditure needed to reduce youth vulnerabilitybillions of EGP in 2013
19

4. Conclusion
Egypt launched a new economic stimulus package just a few years after its last stimulus package (2008–2009). The total amount and the sectoral distribution have changed, which explains why the Urgent Plan has had a significant impact on employment, according to total allocations. As a result, unemployment should decrease by 3 to 4 percentage points and the Plan should help to prevent the unemployment rate from increasing (i.e. job preservation) by 0.2 to 0.025 percentage points, at least temporally.
Analysing the sectoral contribution to this final sector in more detail, the study found out that the highest employment effects could be seen with regard to water supply, education, construction and health and social work. Most sectors have an above average employment multiplier (with the exception of electricity, but an improved electricity supply would have positive knock-on effects for the population), which explains a number of the positive results, in addition to the significant amount spent on the Urgent Plan.
Even though the youth population suffers from a lack of access to the labour market and is increasingly susceptible to vulnerable employment situations, the Urgent Plan is not truly targeted towards this group of workers; consequently, the youth population benefits less from the Urgent Plan than other workers when we analyse paid employment. Selected public interventions cover many sectors with high employment multiplier effects, but could focus more on sectors with high youth employment potential, such as construction or high-skilled service sectors20. Moreover, the financial contributions to these sectors would need to be increased in order to further benefit young workers. Additionally, these interventions could be complemented by other targeted programmes directly supporting young workers, such as public employment programmes, measures to improve school-to-work transitions (including the quality and relevance of education and career counselling), youth entrepreneurship and apprenticeship programmes, wage subsidies and special employment services (cf. Barsoum et al., 2014). A brief analysis of the Plan’s impact on women and the rural labour force also shows that a gender-sensitive approach to employment creation, complemented by the special targeting of these groups, would also be needed to improve the country’s overall labour market situation.
The Urgent Plan also shows the importance of the public sector, particularly in times of crisis, for stimulating internal demand and “crowding in” private sector initiatives and investment. Public interventions therefore still play an important role, not just for employment creation, but also for social cohesion and economic development. As there are limits to the scope of our study (engendered by constraints affecting a detailed understanding of the Plan and data availability), but also to the extent to which the Urgent Plan will be implemented, results of this study should be cautiously interpreted. More frequent analysis of public interventions and investment on employment, the quality of employment, income distribution and poverty would help to increase the socio-economic effectiveness of government actions.
20 Further analysis should be done in order to be sure about these sectors’ possibilities (i.e. labour absorption capacity, fixed capital, etc.) as well as availability of sufficiently skilled young workers.
20
_________________________

References
Abdelfattah Moursi, T. and Mossallamy, M. E. 2010. Measuring the impact of the Egyptian fiscal stimulus package 2008/2009. Cairo: ILO.
Abdellatif, L., Shehata, A. and Albedwehy, O. 2012. The Most Effective Fiscal Stimulus Measures for Egypt: An Empirical Investigation. Cairo: Cairo University, Faculty of Economics and Political Science.
Alarcón, J.V. 1979. Handbook of economic model building for economic planning. The Hague: Institute of Social Studies.
Alarcón, J.V. 2006. Social accounting matrix-based modelling, extension to well-being and environment and computable general equilibrium models applications using the SAMs of Ecuador 1975 and Bolivia 1989, 2nd ed. The Hague: Institute of Social Studies.
Barsoum, G., Ramadan, M., Mostafa, M. 2014. Labour market transitions of young women and men in Egypt. Geneva/Cairo: Work4Youth Publication Series, No. 16.
Bulmer-Thomas, V. 1982. Input-output Analysis in Developing Countries: Sources, Methods and Applications. Chichester: John Wiley and Sons.
Egyptian Presidential Decree, No. 105/2013.
Ernst, C. and Sarabia, M. Forthcoming. The employment dimension of construction: a closed input-output analysis. Geneva: ILO WP Series on Employment.
International Finance Corporation. 2013. IFC Jobs Study: Assessing Private Sector Contributions to Job Creation and Poverty Reduction. Washington: IFC.
Miller, R.; Blair, P. 2009 (2nd ed.). Input-Output Analysis: Foundations and Extensions. New York: Cambridge University Press.
O'Connor, R.; Henry E.W. 1975. Input-output analysis and its applications. London: Griffin.
21
Appendix
1. Multiplier analysis of Egyptian economy and labour market
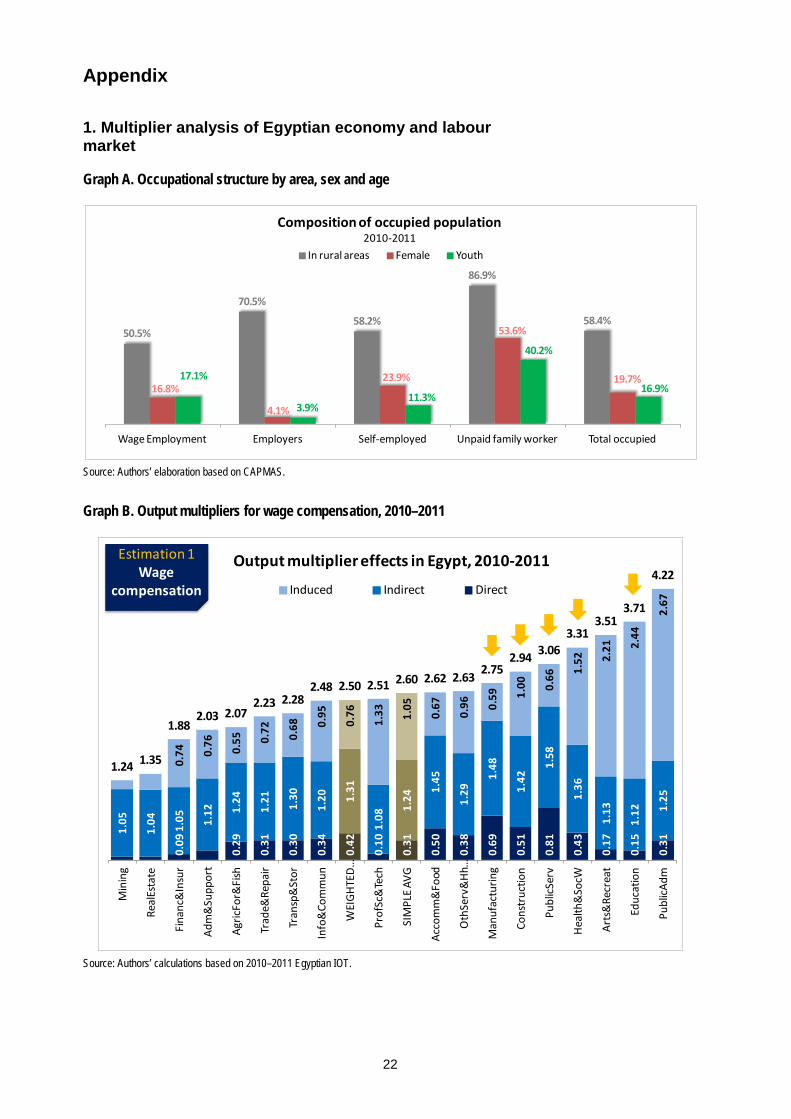
Graph A. Occupational structure by area, sex and age
Source: Authors’ elaboration based on CAPMAS.
Graph B. Output multipliers for wage compensation, 2010–2011
Source: Authors’ calculations based on 2010–2011 Egyptian IOT.
50.5%
70.5%
58.2%
86.9%
58.4%
16.8%
4.1%
23.9%
53.6%
19.7%17.1%
3.9%11.3%
40.2%
16.9%
Wage Employment Employers Self-employed Unpaid family worker Total occupied
Composition of occupied population2010-2011
In rural areas Female Youth
0.09
0.29
0.31
0.30
0.34
0.42
0.10
0.31
0.50
0.38
0.69
0.51
0.81
0.43
0.17
0.15
0.31
1.05
1.04 1.05 1.
12 1.24
1.21 1.30
1.20 1.
31
1.08
1.24
1.45
1.29
1.48
1.42
1.58
1.36
1.13
1.12 1.
25
0.74 0.
76 0.55 0.
72 0.68 0.
95
0.76
1.33 1.
05
0.67
0.96 0.
59 1.00 0.
66 1.52 2.
21 2.44
2.67
1.24 1.35
1.882.03 2.07
2.23 2.282.48 2.50 2.51 2.60 2.62 2.63 2.75
2.94 3.063.31
3.513.71
4.22
Min
ing
Real
Esta
te
Fina
nc&
Insu
r
Adm
&Su
ppor
t
Agric
For&
Fish
Trad
e&Re
pair
Tran
sp&
Stor
Info
&Co
mm
un
WEI
GHTE
D …
Prof
Sc&
Tech
SIM
PLE A
VG
Acco
mm
&Fo
od
Oth
Serv
&Hh
…
Man
ufac
turin
g
Cons
truc
tion
Publ
icSer
v
Heal
th&
SocW
Arts
&Re
crea
t
Educ
atio
n
Publ
icAdm
Output multiplier effects in Egypt, 2010-2011
Induced Indirect Direct
Estimation 1Wage
compensation
22

Graph C. Employment multipliers for wage employment, 2010–2011
Source: Authors’ calculations based on 2010–2011 Egyptian IOT.
Graph D. Employment multipliers for wage employment, by age, 2010–2011
Source: Authors’ calculations based on 2010–2011 Egyptian IOT.
2.4 1.8 1.4 2.5 1.4 1.7 0.6 1.5 1.2 1.4 2.5 2.3 3.6 0.82.83.6 4.8 5.6 7.0 6.5 7.9
7.07.7 9.6 9.2
6.010.0
13.918.0 17.6 26.7
32.7
2.22.8
1.8 2.0 2.2 2.0 1.6 4.0 2.3 2.3 2.0 6.6 3.1
4.62.9 3.0
8.0
7.3
1.1 1.1
5.48.3 9.0 9.3 10.6 10.9 10.9 11.4 11.6 12.5 12.7 13.8 14.5
20.923.2 24.2
34.7
40.8
Real
Esta
te
Min
ing
Fina
nc&
Insu
r
Info
&Co
mm
un
Man
ufac
turin
g
Publ
icSe
rv
Trad
e&Re
pair
Acco
mm
&Fo
od
Agric
For&
Fish
Prof
Sc&
Tech
WEI
GH
TED
…
Adm
&Su
ppor
t
Tran
sp&
Stor
Arts
&Re
crea
t
SIM
PLE
AVG
Hea
lth&
SocW
Oth
Serv
&H
h…
Cons
truc
tion
Publ
icAd
m
Educ
atio
n
Employment multiplier effects in Egypt, 2010-2011
Induced Indirect Direct
Estimation 1Wage
employment
0.2 0.20.7 1.2 1.9 1.1 2.4 2.5 2.7 1.8 2.1 1.9 2.0 2.1 2.2 3.1 3.0 6.9 2.6 3.0
1.1 1.1
5.48.3 9.0 9.3
10.6 10.9 10.9 11.4 11.6 12.5 12.7 13.8 14.5
20.923.2 24.2
34.7
40.8
Real
Esta
te
Min
ing
Fina
nc&
Insu
r
Info
&Co
mm
un
Man
ufac
turin
g
Publ
icSer
v
Trad
e&Re
pair
Acco
mm
&Fo
od
Agric
For&
Fish
Prof
Sc&
Tech
WEI
GHTE
D AV
G
Adm
&Su
ppor
t
Tran
sp&
Stor
Arts
&Re
crea
t
SIM
PLE A
VG
Heal
th&
SocW
Oth
Serv
&Hh
empl
Cons
truc
tion
Publ
icAdm
Educ
atio
n
Employment multiplier effects by ageJobs for rest of labour forceJobs for youthTotal jobs (only number)
Estimation 1Wage
employment
23

Graph E. Employment multipliers for wage employment, by gender, 2010–2011
Source: Authors’ calculations based on 2010–11 Egyptian IOT .
Graph F. Employment multipliers for paid labour, by gender, 2010–2011
Source: Authors’ calculations based on 2010–11 Egyptian IOT.
0.1 0.11.1 1.5 0.9 0.9 1.2 0.8 0.8 2.2 1.7 1.4 0.9 2.2 2.8 8.6 2.2 0.9 7.3 16.5
1.1 1.1
5.48.3 9.0 9.3
10.6 10.9 10.9 11.4 11.6 12.5 12.7 13.8 14.5
20.923.2 24.2
34.7
40.8
Real
Esta
te
Min
ing
Fina
nc&
Insu
r
Info
&Co
mm
un
Man
ufac
turin
g
Publ
icSer
v
Trad
e&Re
pair
Acco
mm
&Fo
od
Agric
For&
Fish
Prof
Sc&
Tech
WEI
GHTE
D AV
G
Adm
&Su
ppor
t
Tran
sp&
Stor
Arts
&Re
crea
t
SIM
PLE A
VG
Heal
th&
SocW
Oth
Serv
&Hh
empl
Cons
truc
tion
Publ
icAdm
Educ
atio
n
Employment multiplier effects by gender
Male
Female
Total jobs (only number)
Estimation 1Wage
employment
0.2 0.4 1.3 1.9 1.2 1.7 1.5 1.7 2.6 1.4 3.2 2.4 3.6 4.2 3.2 9.3 1.5 3.1 8.2 17.41.4 2.4
6.5
10.3 10.6 11.513.5 14.3 15.1
17.7 17.7 17.9 18.1 18.1 18.5
23.8
29.7 30.1
38.2
43.9
Min
ing
Real
Esta
te
Fina
nc&
Insu
r
Info
&Co
mm
un
Publ
icSer
v
Man
ufac
turin
g
Acco
mm
&Fo
od
Adm
&Su
ppor
t
WEI
GHTE
D AV
G
Tran
sp&
Stor
Prof
Sc&
Tech
Trad
e&Re
pair
SIM
PLE A
VG
Agric
For&
Fish
Arts
&Re
crea
t
Heal
th&
SocW
Cons
truc
tion
Oth
Serv
&Hh
empl
Publ
icAdm
Educ
atio
n
Employment multiplier effects by gender
MaleFemaleTotal jobs (only number)
Estimation 2Paid
labour
24

Graph G. Employment multipliers for wage employment, by area, 2010–2011
Source: Authors’ calculations based on 2010–11 Egyptian IOT.
Graph H. Employment multipliers for paid labour, by area, 2010–2011
Source: Authors’ calculations based on 2010–11 Egyptian IOT.
0.5 0.6 2.1 3.2 4.5 4.6 4.2 5.1 8.3 4.1 5.9 4.6 5.8 6.4 7.0 9.3 11.6 14.4 16.6 19.61.1 1.1
5.48.3 9.0 9.3
10.6 10.9 10.9 11.4 11.6 12.5 12.7 13.8 14.5
20.923.2 24.2
34.7
40.8Re
alEs
tate
Min
ing
Fina
nc&
Insu
r
Info
&Co
mm
un
Man
ufac
turin
g
Publ
icSer
v
Trad
e&Re
pair
Acco
mm
&Fo
od
Agric
For&
Fish
Prof
Sc&
Tech
WEI
GHTE
D AV
G
Adm
&Su
ppor
t
Tran
sp&
Stor
Arts
&Re
crea
t
SIM
PLE A
VG
Heal
th&
SocW
Oth
Serv
&Hh
empl
Cons
truc
tion
Publ
icAdm
Educ
atio
n
Employment multiplier effects by areaIn urban areasIn rural areasTotal jobs (only number)
Estimation 1Wage
employment
0.8 1.3 2.7 4.3 5.3 6.1 6.7 5.5 8.0 8.6 6.9 7.9 9.0 14.0 9.0 11.0 16.9 14.9 18.7 21.51.4 2.4
6.5
10.3 10.6 11.513.5 14.3 15.1
17.7 17.7 17.9 18.1 18.1 18.5
23.8
29.7 30.1
38.2
43.9
Min
ing
Real
Esta
te
Fina
nc&
Insu
r
Info
&Co
mm
un
Publ
icSer
v
Man
ufac
turin
g
Acco
mm
&Fo
od
Adm
&Su
ppor
t
WEI
GHTE
D AV
G
Tran
sp&
Stor
Prof
Sc&
Tech
Trad
e&Re
pair
SIM
PLE A
VG
Agric
For&
Fish
Arts
&Re
crea
t
Heal
th&
SocW
Cons
truc
tion
Oth
Serv
&Hh
empl
Publ
icAdm
Educ
atio
n
Employment multiplier effects by areaIn urban areas
In rural areas
Total jobs (only number)
Estimation 2Paid
labour
25

2. Main data sources
The main basis for this assessment was the official IOT elaborated for 2010–2011 provided by CAPMAS, as well as the 2008–2009 version. Whereas the newest version had 18 sectoral breakdowns, the previous version had 20. The data was updated and deflated with sectoral disaggregation for all industries (see Table 3).
Table 3. Classification in input-output tables and labour force surveys
Source: Authors’ elaboration based on CAPMAS.
Regarding sectorial employment, CAPMAS estimates based on its labour force survey (LFS) for 2010 and 2011 were considered, taking the average of these years in order to make the period consistent with the IOT. Additionally, average estimates become more stable after several breakdowns. “Non-classified activities” have been distributed across all sectors according to their own distribution by occupational category. Moreover, since the “activities of extraterritorial organizations and bodies” did not possess an analogous sector in the IOT, we excluded those (679 workers). The average quarter data for 2013 was used at an aggregated level, by age; youth’s age range is 15 to 24.
Additionally, in order to be able to measure the current impact of the stimulus package, the following data was used:
Prices: o Producer price index from CAPMAS at both the overall and sectoral levels. o GDP deflator for Egypt from the World Bank.
Macroeconomic data: o National accounts and GDP data from CAPMAS.
LFS 2010/2011 Disaggregation of IOT 2010/2011A Agriculture, forestry and fishing Agriculture, forestry and fishing Agriculture, forestry and fishingB Mining and quarrying Mining and quarrying Mining and quarryingC Manufacturing Manufacturing ManufacturingD Electricity, gas, steam and air conditioning supply Electricity, gaz,steam and air conditioning supply Electricity, gas, steam and air conditioning supply
E Water supply; sewerage, waste management and remediation activities
Water supply,sewerage,waste management and remediation activities
F Construction Construction Construction
G Wholesale and retail trade; repair of motor vehicles and motorcycles
Wholesale and retail trade, repair of motor vehicles and motorcycles
Wholesale and retail trade; repair of motor vehicles and motorcycles
H Transportation and storage Transportation and storage Transportation and storageI Accommodation and food service activities Accommodation and food servics activities Accommodation and food service activitiesJ Information and communication Information and communication Information and communicationK Financial and insurance activities Financial and insurance activites Financial and insurance activitiesL Real estate activities Real estate activities Real estate activities
M Professional, scientific and technical activities Professional scientific and technical activities Professional, scientific and technical activities
N Administrative and support service activities Adminstratve and support service activities Administrative and support service activities
O Public administration and defence; compulsory social security Public adminstration and defence / compulsory social security
Public administration and defence; compulsory social security
P Education Education Education
Q Human health and social work activities Human health and social work activities Human health and social work activitiesR Arts, entertainment and recreation Arts, entertainment and recreation Arts, entertainment and recreation
S Other service activities Other Activities
TActivities of households as employers; undifferentiated goods and services-producing activities of households for own use Activities of home services
Disaggregation of IOT in 2008/2009
Other service activities and Activities of households as employers; undifferentiated goods- and services-producing activities of households for own use
26

Employment Working Papers The Working Papers from 2008 are available at: www.ilo.org/employment/Whatwedo/Publications/working-papers
Employment Policy Department
For more information visit our website: http://www.ilo.org/employment
International Labour Office Employment Policy Department 4, route des Morillons CH-1211 Geneva 22 Email: [email protected]
Please scan the code
27