EMPLOYMENT IN LEBANON - International Labour … · EMPLOYMENT IN LEBANON ... OECD Organisation for...
147
PALESTINIAN EMPLOYMENT IN LEBANON FACTS AND CHALLENGES LABOUR FORCE SURVEY AMONG PALESTINIAN REFUGEES LIVING IN CAMPS AND GATHERINGS IN LEBANON of Palestinian workers earn 500,000 LBP or less a month 50 % Project Funded by the European Union International Labour Organization
Transcript of EMPLOYMENT IN LEBANON - International Labour … · EMPLOYMENT IN LEBANON ... OECD Organisation for...
PALESTINIAN EMPLOYMENT IN LEBANONFACTS AND CHALLENGES Labour force survey among PALESTINIAN rEFuGEES Living in camps and gatherings in Lebanon
of Palestinian workers earn 500,000 LBP or less a month
50 %Project Funded
by the European Union
InternationalLabourOrganization
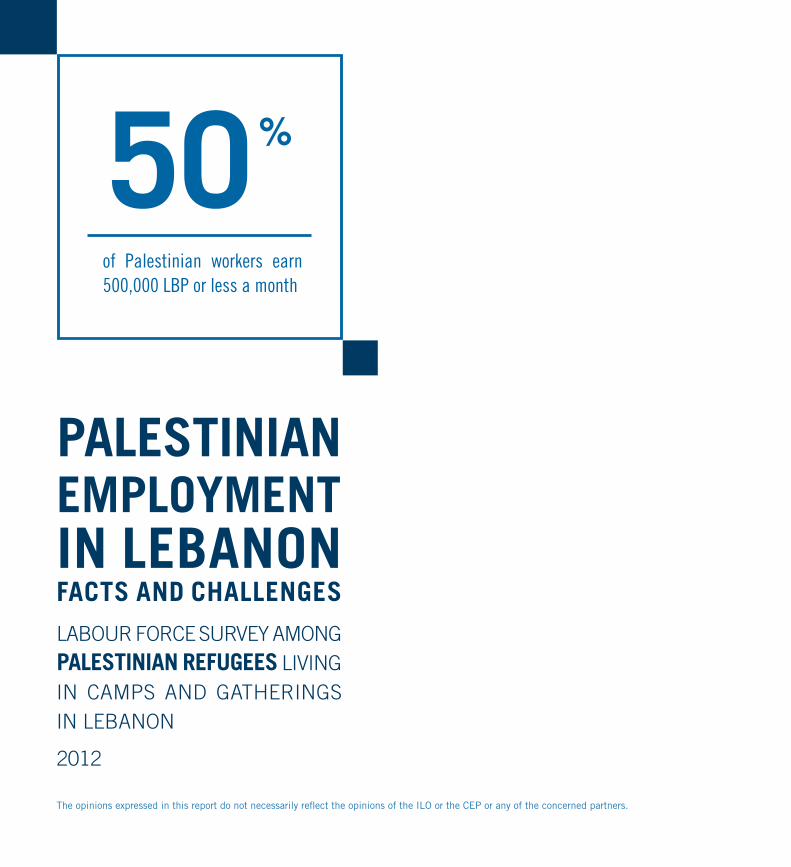
PALESTINIAN EMPLOYMENT IN LEBANONFACTS AND CHALLENGES
Labour force survey among PALESTINIAN rEFuGEES Living in camps and gatherings in Lebanon
2012
of Palestinian workers earn 500,000 LBP or less a month
The opinions expressed in this report do not necessarily reflect the opinions of the ILO or the CEP or any of the concerned partners.
50 %
2 3FOREWORD 1
FOrEwOrDFor too long, the debate surrounding the right of Palestinians to work in Lebanon has been shrouded in domestic politics and the misleading popular tendency to conflate employment rights with a right to naturalization, or tawteen. This is partially due to the dearth of reliable data on the Palestinian workforce in Lebanon – a result of the systematic exclusion of these refugees from national surveys.
In an effort to address this data deficit, the International Labour Organization and the Committee for the Employment of Palestinian Refugees in Lebanon commissioned a labour force survey among Palestinian refugees in camps and gatherings in Lebanon.
The labour force survey sheds light on the characteristics and conditions of the Palestinian labour force from a developmental and rights-based perspective and equips policy-makers and national stakeholders with the information to engage in evidence-based deliberations on this issue. It aims to inform the on-going discussion on Palestinians’ working and living conditions, as well as their access to social protection.
Based on the survey findings, this report provides our partners and other stakeholders with an extensive in-depth analysis of the labour survey results and profiling of the Palestinian workforce in Lebanon.
The survey and associated reports are part of a broader set of interventions to promote the right to work for Palestinians in Lebanon, including a Palestinian women’s economic empowerment initiative; establishment of employment service centres in different locations; setting up a resource centre on employment issues; and persistent advocacy and campaigning efforts.
We would like to express our gratitude to all those who participated in this effort, particularly the Palestinian Central Bureau of Statistics in both Ramallah and Damascus, the Fafo Institute for Applied International Studies (Norway) and the Central Administration of Statistics in Lebanon, for their much appreciated cooperation, efficiency and flexibility.
NADA AL-NASHIFInternational Labour Organization
SAMIr EL-KHOurYCommittee for the Employment of Palestinian Refugees (CEP)
32 ACKNOWLEDGEMENTS4
ACKNOwLEDGEMENTSThe implementation of the survey and its associated reports would not have been possible without the efforts and contributions of a number of individuals and organizations.
The survey was conducted by the Palestinian Central Bureau of Statistics under the leadership of its President, Ola Awad, including the sampling, pilot testing, data collection, training of surveyors, editing and coding. We would like to thank Youssef Madi, Suha Kanaan, Mohamad el-Omari and Nayef Abed for their diligent day-to-day supervision of the different phases of the survey implementation.
Åge Tiltnes of the Fafo Institute for Applied International Studies provided technical back-up and guidance on the survey design, sampling, data checking and analysis, and Akram Atallah directly supervised the data collection and fieldwork.
The labour force survey questionnaire and manual benefited from the employment module of the household living conditions questionnaire prepared by the Central Administration of Statistics, headed by Maral Tutelian, whose support was critical for the smooth implementation of survey activities.
Norwegian People’s Aid graciously provided office space and logistical support.
We would like to thank all the experts and consultants who provided their inputs at various expert meetings: Sawsan Abdul Rahim, Nisrin Salti and Ramzi Maboust for drafting the background chapters of the analytical report; Marwan Khawaja for providing his technical support and expertise; Ghada Nabulsi for developing some of the boxes; and the research assistants Laila Shaar and Khalil Asmar for preparing the statistical tables.
Special thanks to Farhad Mehran for his valuable support during the whole process, including technical advice on the survey design, questionnaire and data analysis.
From the ILO, Mary Kawar offered technical guidance and Sawsan Masri coordinated the implementation of the survey and contributed to the report write up; Rania Nader from the Consultation and Research Institute drafted most sections of the report; and Sahar Omran provided administrative support.
Last but not least, we would like to express our gratitude to the European Union Delegation and the Peacebuilding Fund for their financial support; and to the Committee for the Employment of Palestinian Refugees in Lebanon, the non-governmental organizations, the popular committees and all the Palestinian households in the different camps for their valuable cooperation, time and openness, without which the survey implementation and production of the report would not have been possible.
4 5ABBREVIATIONS AND ACRONYMS 3
ABBrEvIATIONS AND ACrONYMSCEP Committee fot the Employment of Palestinian Refugrees
GDP gross domestic product
ILO International Labour Office/Organization
NGO non-governmental organization
NSSF National Social Security Fund
OECD Organisation for Economic Co-operation and Development
PLO Palestine Liberation Organization
UNHCR United Nations High Commissioner for Refugees
UNRWA United Nations Relief and Works Agency for Palestine Refugees in the Near East
54 TABLE OF CONTENTS6
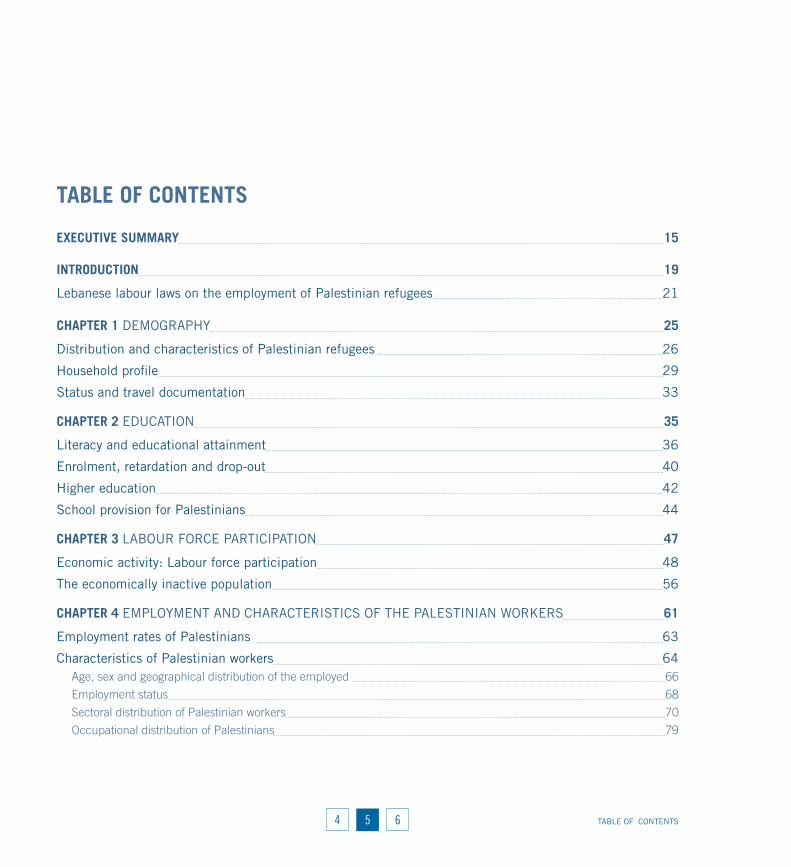
TABLE OF CONTENTS
ExECuTIvE SuMMArY 15
INTrODuCTION 19
Lebanese labour laws on the employment of Palestinian refugees 21
CHAPTEr 1 DEMOGRAPHY 25
Distribution and characteristics of Palestinian refugees 26
Household profile 29
Status and travel documentation 33
CHAPTEr 2 EDUCATION 35
Literacy and educational attainment 36
Enrolment, retardation and drop-out 40
Higher education 42
School provision for Palestinians 44
CHAPTEr 3 LABOUR FORCE PARTICIPATION 47
Economic activity: Labour force participation 48
The economically inactive population 56
CHAPTEr 4 EMPLOYMENT AND CHARACTERISTICS OF THE PALESTINIAN WORKERS 61
Employment rates of Palestinians 63
Characteristics of Palestinian workers 64age, sex and geographical distribution of the employed 66
employment status 68
sectoral distribution of palestinian workers 70
occupational distribution of palestinians 79

6 7TABLE OF CONTENTS 5
Working conditions 81health coverage 81
Working benefits 83
Work contracts 85
Working hours 86
Work location 88
nationality of the employer 90
type and size of enterprises 91
Income 93
Legal status 100
CHAPTEr 5 UNEMPLOYMENT AND CHARACTERISTICS OF THE UNEMPLOYED 103
Unemployment rates of Palestinians 104
Profile of the unemployed 107
Job search 110
Determinants of seeking an additional job 108
CONCLuSION 113
APPENDIx I ABOUT THE SURVEY 117
APPENDIx II ADDITIONAL TABLES 121
rEFErENCES 143
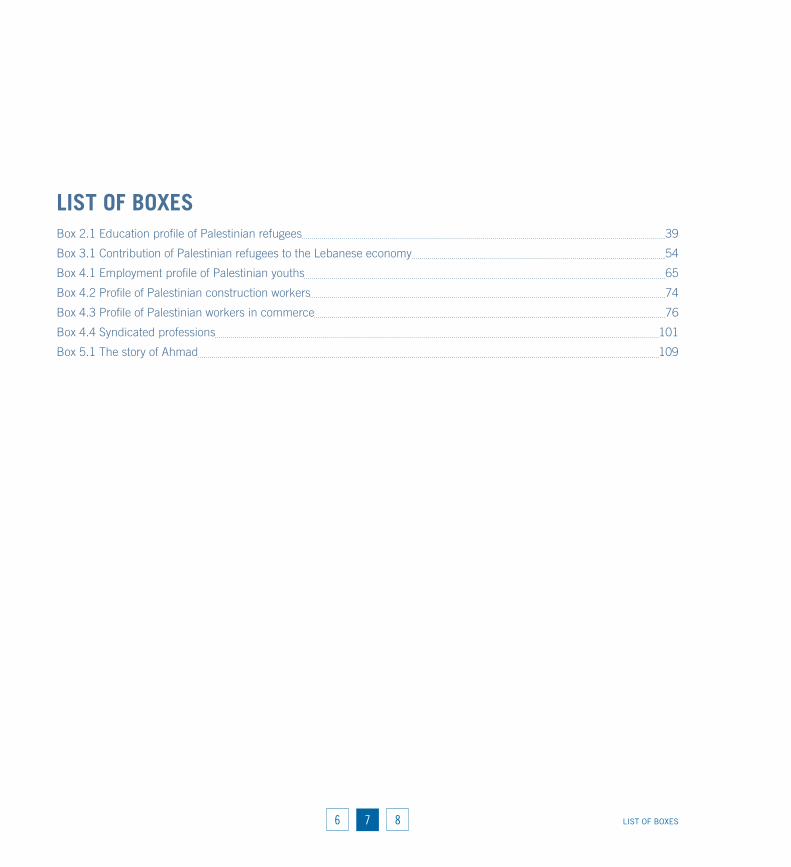
76 LIST OF BOXES8
LIST OF BOxESbox 2.1 education profile of palestinian refugees 39
box 3.1 contribution of palestinian refugees to the Lebanese economy 54
box 4.1 employment profile of palestinian youths 65
box 4.2 profile of palestinian construction workers 74
box 4.3 profile of palestinian workers in commerce 76
box 4.4 syndicated professions 101
box 5.1 the story of ahmad 109
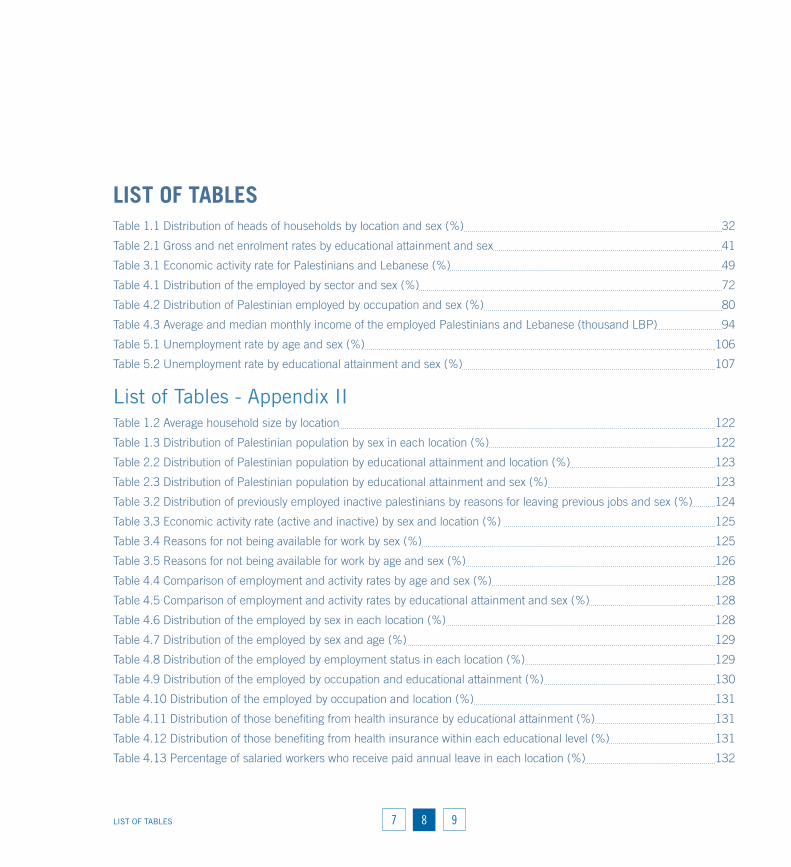
8 9LIST OF TABLES 7
LIST OF TABLEStable 1.1 distribution of heads of households by location and sex (%) 32
table 2.1 gross and net enrolment rates by educational attainment and sex 41
table 3.1 economic activity rate for palestinians and Lebanese (%) 49
table 4.1 distribution of the employed by sector and sex (%) 72
table 4.2 distribution of palestinian employed by occupation and sex (%) 80
table 4.3 average and median monthly income of the employed palestinians and Lebanese (thousand Lbp) 94
table 5.1 unemployment rate by age and sex (%) 106
table 5.2 unemployment rate by educational attainment and sex (%) 107
List of Tables - Appendix IItable 1.2 average household size by location 122
table 1.3 distribution of palestinian population by sex in each location (%) 122
table 2.2 distribution of palestinian population by educational attainment and location (%) 123
table 2.3 distribution of palestinian population by educational attainment and sex (%) 123
table 3.2 distribution of previously employed inactive palestinians by reasons for leaving previous jobs and sex (%) 124
table 3.3 economic activity rate (active and inactive) by sex and location (%) 125
table 3.4 reasons for not being available for work by sex (%) 125
table 3.5 reasons for not being available for work by age and sex (%) 126
table 4.4 comparison of employment and activity rates by age and sex (%) 128
table 4.5 comparison of employment and activity rates by educational attainment and sex (%) 128
table 4.6 distribution of the employed by sex in each location (%) 128
table 4.7 distribution of the employed by sex and age (%) 129
table 4.8 distribution of the employed by employment status in each location (%) 129
table 4.9 distribution of the employed by occupation and educational attainment (%) 130
table 4.10 distribution of the employed by occupation and location (%) 131
table 4.11 distribution of those benefiting from health insurance by educational attainment (%) 131
table 4.12 distribution of those benefiting from health insurance within each educational level (%) 131
table 4.13 percentage of salaried workers who receive paid annual leave in each location (%) 132

98 LIST OF TABLES - APPENDIX II10
table 4.14 percentage of salaried workers who receive paid sick leave in each location (%) 132
table 4.15 percentage of salaried workers who benefit from social security (pension, end-of-service indemnity) in each location (%) 132
table 4.16 distribution of salaried workers by duration of contract in each location (%) 132
table 4.17 distribution of salaried workers by type of contract in each industry (%) 133
table 4.18 distribution of salaried workers by contract type and employer nationality (%) 133
table 4.19 actual working hours per week by educational attainment 134
table 4.20 actual working hours per week by age 134
table 4.21 actual working hours per week by location 134
table 4.22 distribution of the employed by work location in each location (%) 135
table 4.23 distribution of the employed by place of work and sex (%) 135
table 4.24 average monthly income of employed by occupation and sex (thousand Lbp) 136
table 4.25 distribution of palestinian workers by eligibility to join trade unions (%) 138
table 4.26 distribution of palestinian workers by registeration in trade unions (%) 138
table 5.3 unemployment rate by location and sex (%) 139
table 5.4 distribution of the unemployed by location (%) 139
table 5.5 distribution of the employed and unemployed males and females by educational attainment (%) 140
table 5.6 average waiting time to find a job by age (months) 140
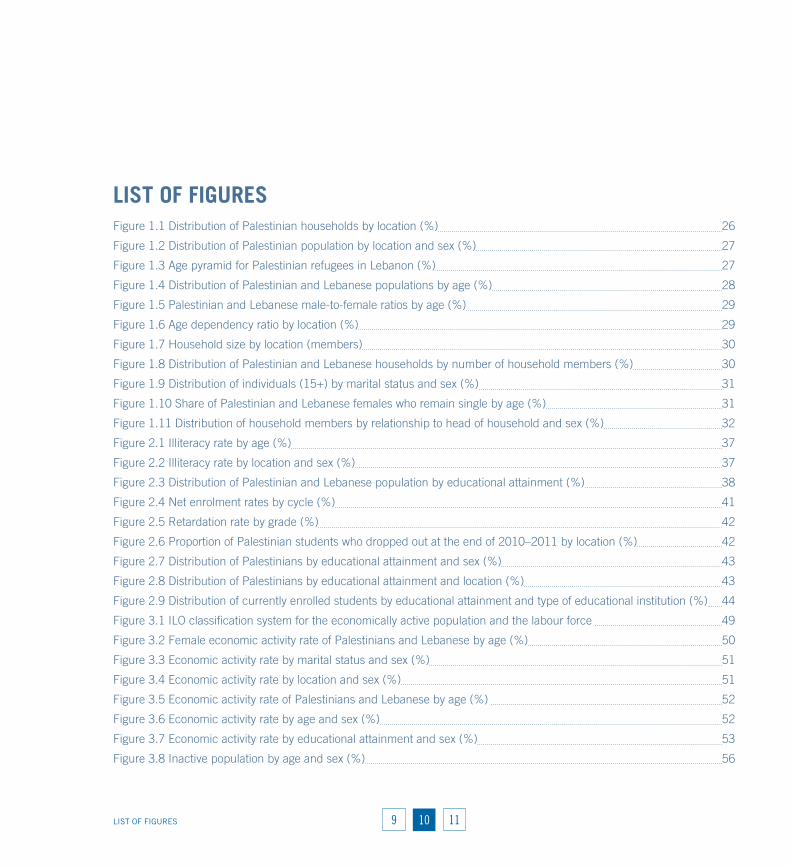
10 11LIST OF FIGURES 9
LIST OF FIGurESfigure 1.1 distribution of palestinian households by location (%) 26
figure 1.2 distribution of palestinian population by location and sex (%) 27
figure 1.3 age pyramid for palestinian refugees in Lebanon (%) 27
figure 1.4 distribution of palestinian and Lebanese populations by age (%) 28
figure 1.5 palestinian and Lebanese male-to-female ratios by age (%) 29
figure 1.6 age dependency ratio by location (%) 29
figure 1.7 household size by location (members) 30
figure 1.8 distribution of palestinian and Lebanese households by number of household members (%) 30
figure 1.9 distribution of individuals (15+) by marital status and sex (%) 31
figure 1.10 share of palestinian and Lebanese females who remain single by age (%) 31
figure 1.11 distribution of household members by relationship to head of household and sex (%) 32
figure 2.1 illiteracy rate by age (%) 37
figure 2.2 illiteracy rate by location and sex (%) 37
figure 2.3 distribution of palestinian and Lebanese population by educational attainment (%) 38
figure 2.4 net enrolment rates by cycle (%) 41
figure 2.5 retardation rate by grade (%) 42
figure 2.6 proportion of palestinian students who dropped out at the end of 2010–2011 by location (%) 42
figure 2.7 distribution of palestinians by educational attainment and sex (%) 43
figure 2.8 distribution of palestinians by educational attainment and location (%) 43
figure 2.9 distribution of currently enrolled students by educational attainment and type of educational institution (%) 44
figure 3.1 iLo classification system for the economically active population and the labour force 49
figure 3.2 female economic activity rate of palestinians and Lebanese by age (%) 50
figure 3.3 economic activity rate by marital status and sex (%) 51
figure 3.4 economic activity rate by location and sex (%) 51
figure 3.5 economic activity rate of palestinians and Lebanese by age (%) 52
figure 3.6 economic activity rate by age and sex (%) 52
figure 3.7 economic activity rate by educational attainment and sex (%) 53
figure 3.8 inactive population by age and sex (%) 56

1110 LIST OF FIGURES12
figure 3.9 reasons for not being available for work among palestinian youths (15–24 years) by sex (%) 57
figure 4.1 employment and activity rates of palestinians by age (%) 63
figure 4.2 employment and activity rates of palestinians by education (%) 64
figure 4.3 distribution of employed palestinians by location (%) 66
figure 4.4 share of employed females by location (%) 67
figure 4.5 distribution of employed palestinians and Lebanese by age (%) 67
figure 4.6 distribution of employed palestinians by educational attainment and sex (%) 68
figure 4.7 distribution of employed palestinians and Lebanese by employment status (%) 69
figure 4.8 distribution of the employed by employment status and sex (%) 69
figure 4.9 distribution of the employed by employment status and educational attainment (%) 70
figure 4.10 distribution of the employed by sector (%) 71
figure 4.11 distribution of the employed by educational attainment and selected sectors (%) 73
figure 4.12 distribution of construction workers by educational attainment (%) 74
figure 4.13 distribution of construction workers by employment status (%) 75
figure 4.14 distribution of commerce workers by educational attainment (%) 76
figure 4.15 distribution of commerce workers by subsector (%) 77
figure 4.16 distribution of commerce workers by subsector and size of enterprise (%) 77
figure 4.17 distribution of commerce workers by subsector and employment status (%) 78
figure 4.18 distribution of palestinian employed by occupation (%) 79
figure 4.19 share of palestinian selected occupations by educational attainment (%) 81
figure 4.20 distribution of the employed by the availability and source of health coverage (%) 82
figure 4.21 distribution of the employed by health coverage and size of enterprise (%) 83
figure 4.22 distribution of salaried workers by received work benefits and sex (%) 84
figure 4.23 distribution of salaried workers by selected work benefits and size of enterprise (%) 84
figure 4.24 distribution of salaried workers by sex and type of contract (%) 85
figure 4.25 share of salaried workers with a written contract by sector (%) 85
figure 4.26 distribution of salaried workers by duration of contract and sex (%) 85
figure 4.27 share of salaried workers with a daily agreement by location (%) 86
figure 4.28 distribution of employed males and females by actual working hours per week (%) 87
figure 4.29 actual working hours per week of palestinian workers by sector 87
12 13LIST OF FIGURES 11
figure 4.30 actual working hours per week of palestinian workers by location 88
figure 4.31 distribution of the employed by work location and sex (%) 89
figure 4.32 distribution of the employed by work location (%) 89
figure 4.33 distribution of salaried workers by nationality of employer and location (%) 90
figure 4.34 distribution of the employed by employment status and place of work (%) 91
figure 4.35 distribution of the employed by enterprise size (%) 92
figure 4.36 distribution of the employed by enterprise size and sex (%) 93
figure 4.37 distribution of the employed by income bracket (%) (thousand Lbp) 94
figure 4.38 average monthly income of the employed by age and sex (thousand Lbp) 95
figure 4.39 average monthly income of the employed by educational attainment and sex (thousand Lbp) 96
figure 4.40 average monthly income of the employed by employment status and sex (thousand Lbp) 96
figure 4.41 average monthly income of the employed by occupation (thousand Lbp) 97
figure 4.42 average monthly income of the employed by location and sex (thousand Lbp) 98
figure 4.43 distribution of the employed by monthly income brackets (thousand Lbp) and nationality of employer (%) 99
figure 4.44 distribution of the employed by awareness of the 2010 legal amendments (%) 100
figure 5.1 historical trend of the unemployment rate of palestinians by sex (%) 104
figure 5.2 unemployment rate based on different definitions (%) 105
figure 5.3 distribution of the unemployed by age and sex (%) 108
figure 5.4 distribution of the unemployed and the employed by educational attainment (%) 108
figure 5.5 average waiting time to find a job by educational attainment (months) 110
figure 5.6 average waiting time to find a job by location (months) 110
figure 5.7 share of the employed seeking an additional job by income (thousand Lbp) (%) 111

1312 14


ExECuTIvE SuMMArY
16 17ExECuTIvE SuMMArY 15
ExECuTIvE SuMMArYBetween 260,000 and 280,000 Palestinian refugees reside in 12 camps and 42 gatherings all around Lebanon (Chaaban et al., 2010). The great majority live under harsh living conditions with high poverty rates, inadequate infrastructure and housing conditions, and limited access to quality services and social protection, in addition to being subject to discriminatory laws and regulations.
The development conditions of Palestinian refugees are very much linked to their employment status. The lack of access to fair job opportunities and decent work is exacerbating the vicious cycle of impoverishment and precarious conditions that Palestinians endure. The employment conditions of Palestinian refugees reflect the discrimination and abuse they are subject to at the workplace. Most are unprotected, with limited labour rights due to legal restrictions, malpractice or bias.
This report profiles the employment conditions of Palestinian refugees in Lebanon. It is divided into five sections: demography, education and labour force participation, employment and unemployment. The employment and unemployment sections constitute the bulk of the report. They capture the different aspects of the labour force, including employment, unemployment, characteristics of the employed and the unemployed, income, working conditions, and protection and benefits, in addition to other features that are pertinent to the Palestinian refugees in Lebanon.
The following are the main highlights and findings of the report:
• The Palestinian labour force, in general, shares similar characteristics with the Lebanese in terms of activity rate, sector, employment status, occupation and industry. The general profile of the labour force has not changed significantly over time. Comparison with previous studies reveals little change in the employment status and working conditions of Palestinian refugees.
• The Palestinian workforce is poorly educated, young and lacking in skills. Most are engaged in low-status jobs concentrated in commerce and construction. A large proportion work on a daily, weekly, or productivity basis and are engaged in private employment.
• Participation of women in the labour force is very limited. The few women who are working are better educated than men and enjoy more decent working conditions and benefits, but are paid less than their male counterparts. The majority of working women are found in the education and health sectors. Many are engaged with civil society or international organizations and work as professionals, technicians or service and sales workers.
• Unemployment among Palestinian refugees is relatively low – similar to the Lebanese – but much lower than for other neighbouring countries. As expected, unemployment is high among youths, women and those with higher education.
1716 ExECuTIvE SuMMArY 18
• Higher education is correlated with better working status and more decent jobs. Those with better education are better paid, less overworked, enjoy more benefits and have enhanced protection.
• Indicators of working conditions reflect the vulnerable and insecure working status of Palestinian refugees. Very few work with a written contract, and a negligible share receive health coverage or paid holiday and sick leave. Few are entitled to a pension or end-of-service indemnity.
• Palestinian refugees are overworked and poorly paid. The average monthly income of Palestinian workers is below the minimum wage and represents 80% of the average monthly income of the Lebanese (based on the figures of 2007). A gender difference in income is also apparent, as women earn 82% of men’s income. Half of the workers receive less than 500,000 Lebanese pounds (LBP) a month.
• Low payment is coupled with long working hours. A Palestinian works 47 hours a week on average. Those who work in commerce, construction, and hotels and restaurants work the most.
• The profile of Palestinian refugees in the different locations is more or less similar; however, the population in Bekaa – although very small – enjoys relatively better conditions. On average, Bekaa refugees have greater educational attainment and the workforce is involved in more secure occupations and decent employment. The Palestinian workers in Tripoli and Tyre, on the other hand, are more disadvantaged.
• Work permits are not perceived as necessary and are not required by most of occupations performed by Palestinian refugees; only 2% of refugees have acquired a work permit. Half of the Palestinian refugees are employed by another Palestinian and one quarter work inside the camps only. Despite the high hopes built around the August 2010 legal amendments towards improving the conditions of Palestinian refugees, no impact has so far been perceived from those amendments on their working status.
The profile outlined above of the Palestinian workforce in Lebanon is a reflection of the inherently discriminatory laws and practices that have hindered Palestinians from legally joining the Lebanese labour market. Such conditions have not only led to the vulnerability and exposure to exploitation of Palestinian workers, but have also left the potential positive contributions of Palestinians unutilized. Making salient progress towards improved working conditions and fair treatment for the Palestinian workers in Lebanon calls for removing legal and administrative obstacles that stand in the way of Palestinians receiving fair and legal working opportunities, implementing consistent and innovative advocacy campaigns calling for the right to work and to social protection of Palestinian refugees, and conducting constructive dialogue with all concerned stakeholders on the right to work and to social protection.


INTrODuCTION
20 21INTrODuCTION 19
INTrODuCTIONIn 1948, more than 750,000 Palestinians were displaced from their original towns and villages in preparation for the establishment of the State of Israel. United Nations General Assembly Resolution 194 (III) of December 1948 states that Palestinian refugees and their descendants should be allowed to return to their original homes or else receive compensation for the property they lost. Article 11 of the resolution resolved that “refugees wishing to return to their homes and live at peace with their neighbours should be permitted to do so at the earliest practicable date, and that compensation should be paid for the property of those choosing not to return and for loss of or damage to property which, under principles of international law or in equity, should be made good by the Governments or authorities responsible” (United Nations General Assembly, 1948). Israel, however, has consistently denied the historical events that led up to the mass exodus of Palestinians and unequivocally refused to acknowledge, let alone negotiate, the refugees’ right of return.
Lebanon hosted approximately 100,000 Palestinian refugees in 1948 and smaller numbers in 1956 and 1967. Both Jordan and Syrian Arab Republic hosted larger numbers of Palestinians. Most of the refugees were naturalized in Jordan; in Syrian Arab Republic, they were granted social and economic rights without citizenship. In Lebanon, Palestinian refugees were categorized as a special group of foreigners and their permanent settlement was rejected by consecutive governments. Today, less than 450,0001 Palestinians
1 Information from UNRWA web page: http://www.unrwa.org/etemplate.php?id=65.
are registered with the United Nations Relief and Works Agency for Palestine Refugees in the Near East (UNRWA) in Lebanon. The number of Palestinians who actually reside in Lebanon, however, is estimated to be much lower and not to exceed 280,000 (Chaaban et al., 2010). Due to restrictive policies it is expected that Palestinians have been slowly migrating out of Lebanon.
For over 64 years, Palestinians in Lebanon have lived as stateless refugees. Though they and their descendants have adamantly rejected permanent settlement, regarding it as tantamount to renouncing their inalienable right to return to Palestine, they have at various phases during their residence in Lebanon mobilized social and economic rights campaigns. These requests, however, have been rejected by consecutive Lebanese Governments on the grounds that policies to ease the social and economic exclusion of Palestinians would constitute a prelude to their permanent settlement. Settlement is rejected across the political spectrum in Lebanon, on the grounds that it threatens the delicate sectarian balance upon which the political system in Lebanon is based. Efforts to disentangle civil rights from settlement have not been focused or effective.
Palestinians in Lebanon constitute a “protracted refugee population” (Roberts, 2010), who do not enjoy effective protection or representation. They fall under the mandate of UNRWA and do not receive the legal protection that other refugees receive from the United Nations High Commissioner for Refugees (UNHCR). UNRWA’s power is limited, given its reliance on aid money and the fact that its mandate focuses on providing educational, health and social services.

2120 INTrODuCTION22
The Oslo Accords, which were initiated between Israel and the Palestinian Authority in the early 1990s, deliberately relegated the refugees’ right of return to be decided on at a later stage. Since then, the refugees in Lebanon have increasingly felt abandoned by their own political representatives and the international community. With the Gaza Strip and the West Bank receiving most attention as possible locations for a future Palestinian State, Palestinians in refugee camps in Lebanon began to refer to themselves as the “forgotten people” (Roberts, 2010).
As stateless refugees, the majority of Palestinians who reside in camps in Lebanon have been denied basic civil rights and subjected to more stringent restrictions than other foreign nationals. Until very recently, they were denied the right to work legally in a large number of professions, forcing them to either emigrate or accept jobs in the informal economy that offer low wages and little if any protection. Palestinians are also denied the right to own property in Lebanon, a condition that affects their ability to enhance their socio-economic status through investing in a residential unit or a business. As a result of protracted economic and social exclusion, Palestinians in Lebanon have over the years become more dependent on services and assistance provided by UNRWA and other local non-governmental organization (NGOs), a situation that has influenced the social fabric in camps and heightened mistrust (Abdulrahim et al., 2010).
Socio-economic conditions of Palestinians in Lebanon are difficult and are particularly harsh for those who live inside camps. Compared to Jordan and Syrian Arab Republic, a larger proportion of refugees in Lebanon reside inside camps (60%). In 2010, 13,481 Palestinian families in Lebanon were registered in
UNRWA’s special hardship assistance programme (UNRWA, 2011). This is higher than the number of families registered in the same programme in Syrian Arab Republic and the West Bank. Employment restrictions force Palestinians to obtain informal, short-term and poorly paid jobs. They also force them to rely on remittances from family members abroad. Limited opportunities in Gulf countries and the global economic crisis have also had an impact on remittances.
LEBANESE LABOur LAwS ON THE EMPLOYMENT OF PALESTINIAN rEFuGEESThe history of Palestinian refugees’ interactions with restrictive employment policies in Lebanon dates back to the period preceding the Lebanese Civil War. In 1964, the Ministry of Labour and Social Affairs proposed Ministerial Decree No. 17561 to organize the participation of foreigners in the Lebanese labour market. As a consequence of the changes implemented, Palestinians became classified as foreigners and were required to obtain a work permit prior to employment (El-Natour and Yassine, 2007). Lebanese labour law pertaining to foreign workers then centred around two main principles – the principle of reciprocity of treatment in Lebanon, and the requirement to obtain a work permit prior to employment. The reciprocity of treatment policy stipulated that foreign workers in Lebanon could not obtain work permits or social security benefits unless their countries of origin granted those same benefits to Lebanese workers. The statelessness of Palestinians was not taken into consideration. In addition to the work permit requirement, Palestinians were prevented altogether

22 23INTrODuCTION 21
from practising such professions as medicine or law, given that only the Lebanese could join professional syndicates. Furthermore, the small proportion of Palestinians who worked with formal contracts were not allowed to benefit from the social security system, though they were required to contribute to it.
In 1982, shortly after the departure of the Palestine Liberation Organization (PLO) from Lebanon, Ministerial Decree No. 1/289 further restricted the list of professions open to Palestinians, depriving them from working in over 70 commercial and administrative professions (El-Natour and Yassine, 2007). In addition to the restriction on employment in syndicated professions, the new restrictions practically left only the construction and farming sectors open to Palestinians. In 1995, the restrictions were slightly lifted with the introduction of a new clause to the ministerial decree, which exempted foreigners who were born in Lebanon, born to Lebanese mothers or married to Lebanese women from these restrictions. This was seen to benefit Palestinian refugees who were the main group of “foreigners” born in Lebanon.
In June 2005, the Minister of Labour issued Ministerial Memorandum No. 1/67, which contained the following stipulation (quote abstracted from ILO and CEP, 2010):
Palestine refugees who are born in Lebanon and who are registered with the Lebanese Ministry of Labour are no longer excluded from 70 commercial and administrative professions which have until that date been restricted to Lebanese citizens only.
The memorandum was welcomed by some Palestinians as a groundbreaking step in that it lifted the restrictions that had been instituted in 1982. It was also seen as a major change from an attitude of neglect on the part
of Lebanese policy-makers to one of engagement (ILO and CEP, 2010). On the other hand, the memorandum was criticized for falling short of making real steps towards the right to work. The criticisms were based on the following: (a) Palestinians had been working in many of the restricted professions informally, but would now have to pay for a work permit and subscribe to the National Social Security Fund (NSSF) (without benefiting from it); (b) the memorandum still did not lift the ban on syndicated professions such as medicine and law; and (c) a ministerial memorandum is the weakest legal document, weaker than a presidential decree or a law voted on by Parliament, and can be revoked by a memorandum issued by the succeeding minister.
In August 2010, a stronger legal step took place whereby the Lebanese Parliament approved amendments to Article 59 of the Labour Law and Article 9 of the Social Security Law that specifically addressed the employment of Palestinian refugees. The amendments waived the fees to obtain a work permit by Palestinian refugees born in Lebanon and revoked the reciprocity of treatment policy as it concerned some social security benefits, namely end-of-service compensation and work-related injuries. The amendments did not include maternity benefits or family allowances. The amended text of Article 9 states that:
Palestine refugee workers/labourers are exempt from the condition of reciprocity stated in the Labour Law and Social Security Law, so as to benefit from the contributions of end-of-service indemnity conditions which the Lebanese worker/labourer benefits from. Hereby, the Administration of the Social Security Fund should ascertain a separate independent account for the contributions belonging
2322 INTrODuCTION24
to Palestinian refugee workers/labourers that does not bear the Treasury or the National Social Security Fund any financial obligation. Beneficiaries covered by the provisions of this law do not benefit from the contributions of sickness, maternity, and family allowance funds.
These amendments were welcomed by some and viewed sceptically by others. On the one hand, they were seen as an important step in the right direction, signalling a significant political shift as regards the employment rights of Palestinians in Lebanon. As social security and social protection are included in the Universal Declaration of Human Rights, the Lebanese Government’s engagement with social protections was seen as critical step towards acknowledging its responsibility towards Palestinian workers.
On the other hand, the amendments were criticized for not covering all social security benefits, such as health coverage and maternity benefits. Though Palestinian workers are required under the amended law to make full contributions to the National Social Security Fund (NSSF), they will only receive partial benefits. This is clearly a violation of their rights. Given the small number of Palestinian workers in the formal economy in Lebanon, the option of creating an NSSF sub-scheme for them, whereby they receive full social security benefits, would not be financially sustainable. As such, the only solution would be for the Lebanese Government to consider ways of incorporating Palestinian workers into the existing NSSF scheme.
In addition, the amendments introduced in 2010 did not lift the ban on the syndicated professions. As with other laws in Lebanon, where inadequacy takes place at the level of implementation not the level of legislation, the amended law does not hold much promise for
Palestinians until the Ministry of Labour specifies clear procedures for implementation and follow-up.
Granting Palestinian refugees economic rights stands to reduce their dependency and improve their socio-economic conditions. The right to work is the key strategy to enhance the economic independence of Palestinians. Integrating Palestinian refugees in the Lebanese labour market also makes economic sense as it stands to improve both the social and economic well-being of Palestinians themselves and stability in Lebanon as a whole.


CHAPTEr 1DEMOGRAPHY
26 27CHAPTEr 1DEMOGRAPHY 25
CHAPTEr 1 DEMOGRAPHYThere has never been an official census of Palestinian refugees in Lebanon, a fact that is not surprising in a country that has not itself had a population census since 1932. As a result, the size of the Palestinian refugee population has been the subject of much controversy. UNRWA’s registries, which include around 450,000 individuals, may be thought of as a starting point.2 However, it is undisputable that the actual number of Palestinian residents is much lower, due to the massive emigration of Palestinians driven out by the legal restrictions on employment and the difficult living conditions they face. The survey conducted by the American University of Beirut-UNRWA estimates between 260,000 and 280,000 residents, representing between 6.8% and 7.4% of the total population of Lebanon. Around 60% of Lebanon’s Palestinians live in 12 camps distributed across the Lebanese territory,
2 UNRWA web page: http://www.unrwa.org/etemplate.php?id=65.
while the remaining 40% reside in gatherings or elsewhere in urban areas (Chaaban et al., 2010).
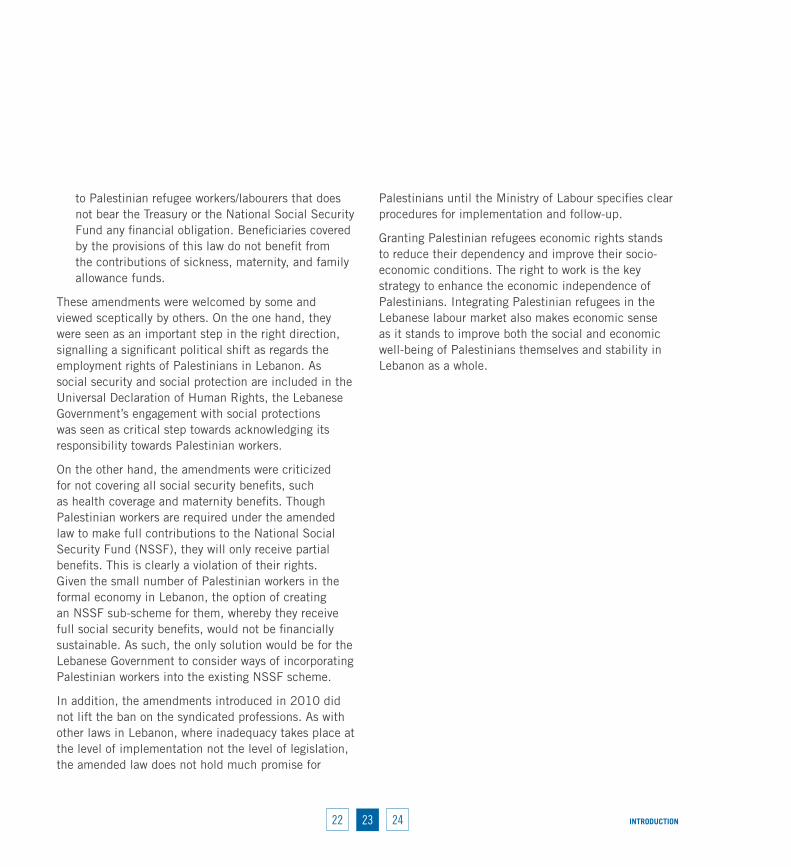
DISTrIBuTION AND CHArACTErISTICS OF PALESTINIAN rEFuGEES According to the labour force survey, the majority of Palestinian households reside in Saida and Tripoli, which together house around 56% of households (figure 1.1). The Bekaa area registers the lowest presence of Palestinian households (9%), a finding that becomes all the more significant in view of the fact that the entire mohafaza (district) of Bekaa is essentially being contrasted to a set of cities.
FIGurE 1.1 DISTrIBuTION OF PALESTINIAN HOuSEHOLDS BY LOCATION (%)
23.8
17.3
8.5
31.9
18.5TRIPOLI
BEIRUT
BEKAA
SAIDA
TYRE

2726CHAPTEr 1
DEMOGRAPHY28
The distribution by sex appears relatively stable across all locations, with a slight overrepresentation of females in Tyre (figure 1.2).
As is typical in the region, Lebanon’s Palestinians are a young population, with those aged 15 years or younger representing around one third of the population (figure 1.3). Also in keeping with regional demographic trends,
this share has declined in the past 10 years, dropping 4 points from 37% in 1999 (Faf0, 2003).
The Palestinian population is relatively younger than the Lebanese; 53% are aged below 24 years, compared to 44% for the Lebanese (figure 1.4). The difference is sharpest in the under-10 category, which may indicate a growing gap in fertility between the two populations.
FIGurE 1.2 DISTrIBuTION OF PALESTINIAN POPuLATION BY LOCATION AND SEx (%)
49.5 51.4 49.1 50.4 47.5 49.7
50.5 48.6 50.9 49.6 52.5 50.3
TRIPOLI BEIRUT BEKAA SAIDA TYRE ALL PALESTINIANS
MALE FEMALE
FIGurE 1.3 AGE PYrAMID FOr PALESTINIAN rEFuGEES IN LEBANON (%)
34.1
21.3
13.4
12.8
9.5
4.5
2.9
1.5
30.9
19.5
14.5
13.4
10.6
5.2
3.8
2.3
0-14
15-24
25-34
35-44
45-54
55-64
65-74
75-84
MALE FEMALE

28 29CHAPTEr 1DEMOGRAPHY 27
Moreover, the percentage of those aged over 65 is almost double for the Lebanese, which is probably related to their greater life expectancy. On the other hand, the similarities between the two populations in the 15–54 age groups reflect a similar tendency to migrate for both Lebanese and Palestinians. According to the Fafo survey, 80% of Palestinian households reported having relatives abroad and half of them had relatives in Europe (Tiltnes, 2005).
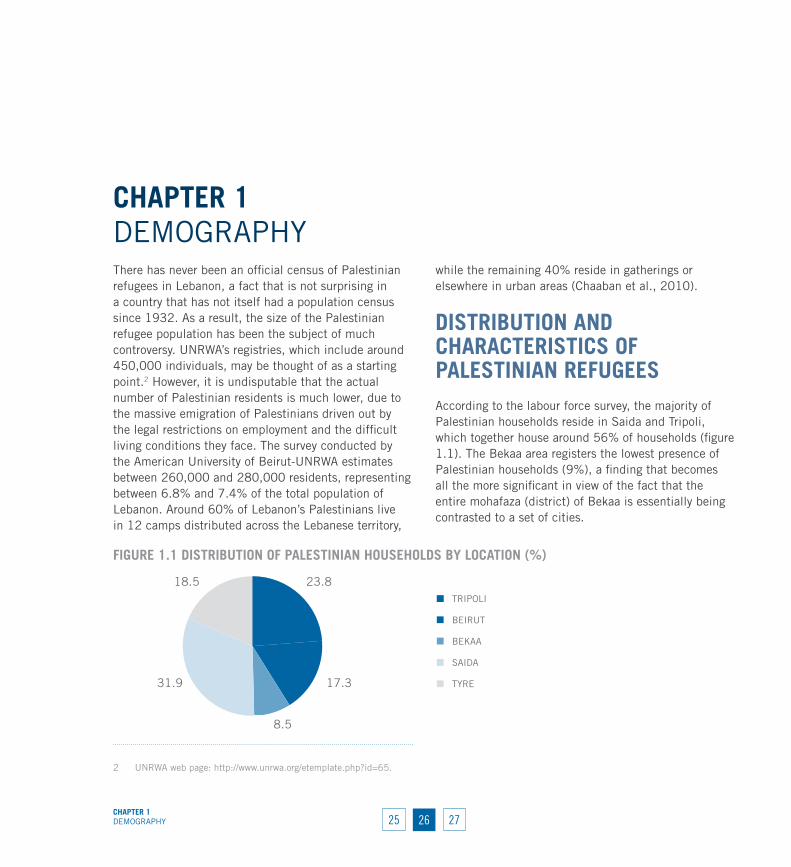
A closer look at the age distribution by sex reveals interesting sociological differences between the two populations (figure 1.5). The Palestinian male-to-female ratio in the 10–14 age category is particularly high at 119%, compared to 108% for the Lebanese. Moreover, the Lebanese male-to-female ratio drops to a low of 80% in the 35–44 age category, possibly indicating a high propensity to emigrate among male Lebanese wage-earners. Finally, a clear difference occurs in
the over-65 age category, where male-female parity is found among the Lebanese, while Palestinian females significantly outnumber males, as indicated by a male-to-female ratio of 71%. This indicates that the life expectancy of Palestinian females by far exceeds that of males, a phenomenon that deserves further investigation.
The age dependency ratio3 is 61% for Palestinians compared to 52% for the Lebanese (CAS, 2007).4 However, the ratio is significantly higher among the Palestinians living in the West Bank (81%) and Gaza
3 The age dependency ratio is calculated as follows: the dependent population (typically those aged below 15 years and above 65 years) divided by the productive population (typically those aged 15–-64 years) x 100.
4 The comparison with the Lebanese population had to rely on the 2007 data pending the completion and dissemination of results of the National Survey of Household Living Conditions for 2011.
FIGurE 1.4 DISTrIBuTION OF PALESTINIAN AND LEBANESE POPuLATIONS BY AGE (%)
PALESTINIANS
21.1
11.4
20.4
13.9
13.1
10.1
4.8 5.2
15
9.4
19.5
15.5
12.8
10.4
7.5
9.6
0-9 10-14 15-24 25-34 35-44 45-54 55-64 65+
LEBANESE
2928CHAPTEr 1
DEMOGRAPHY30
Strip (104%) (PCBS, 2007). The ratio also varies between locations in Lebanon, with the highest recorded in Tripoli (68%) and the lowest in Tyre (54%) (figure 1.6).
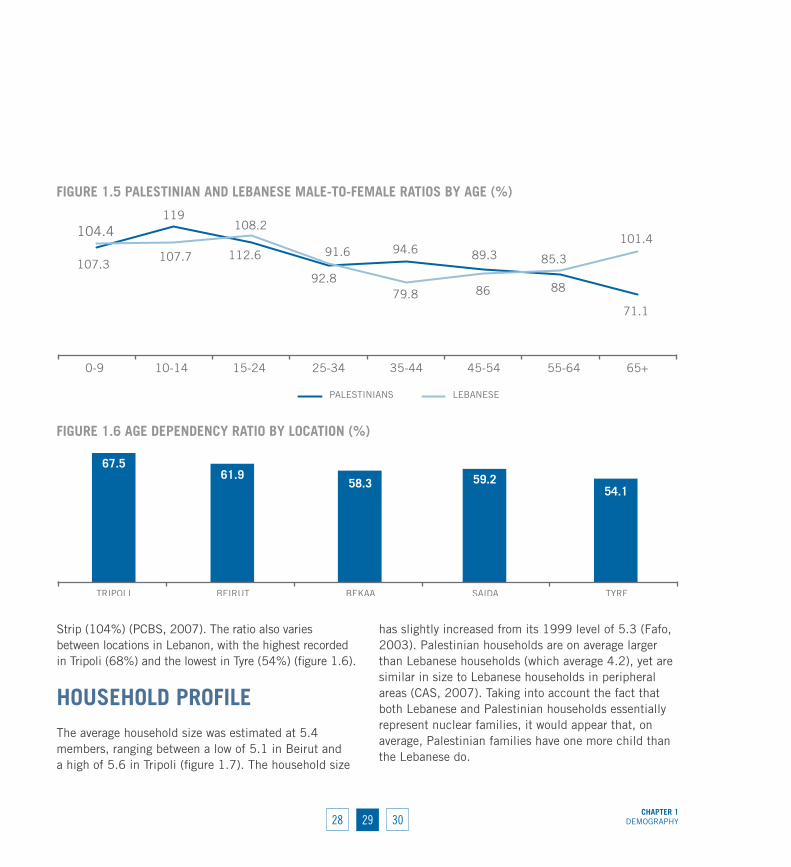
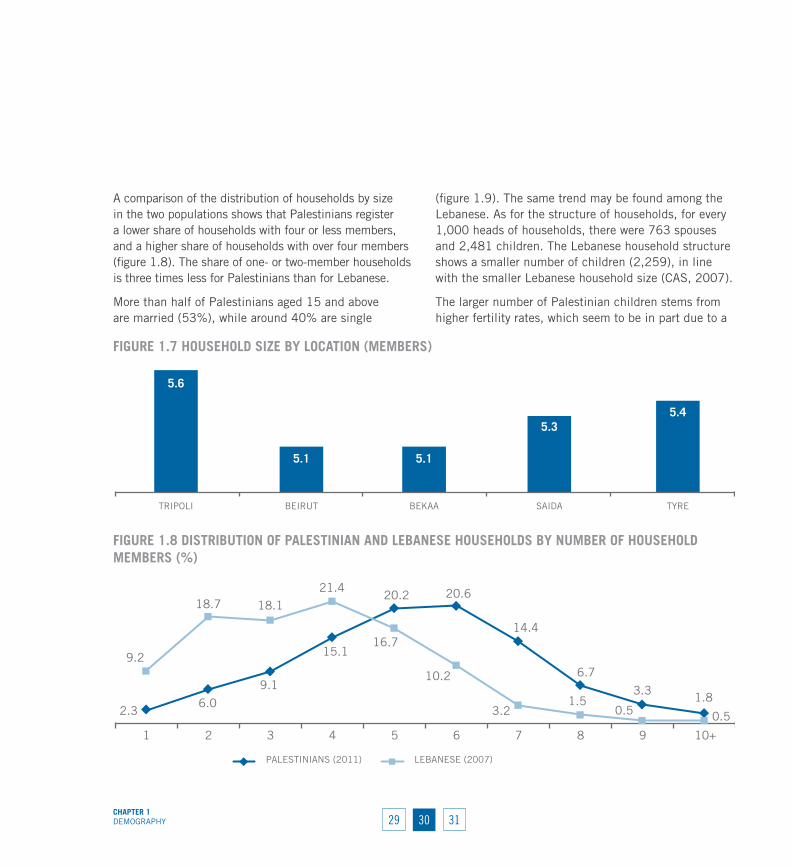
HOuSEHOLD PrOFILEThe average household size was estimated at 5.4 members, ranging between a low of 5.1 in Beirut and a high of 5.6 in Tripoli (figure 1.7). The household size
has slightly increased from its 1999 level of 5.3 (Fafo, 2003). Palestinian households are on average larger than Lebanese households (which average 4.2), yet are similar in size to Lebanese households in peripheral areas (CAS, 2007). Taking into account the fact that both Lebanese and Palestinian households essentially represent nuclear families, it would appear that, on average, Palestinian families have one more child than the Lebanese do.
FIGurE 1.5 PALESTINIAN AND LEBANESE MALE-TO-FEMALE rATIOS BY AGE (%)
104.4119
108.2
91.6 94.6 89.3 85.3
71.1
107.3107.7 112.6
92.879.8 86 88
101.4
0-9 10-14 15-24 25-34 45-5435-44 55-64 65+
PALESTINIANS LEBANESE
FIGurE 1.6 AGE DEPENDENCY rATIO BY LOCATION (%)
67.561.9
58.3 59.254.1
TRIPOLI BEIRUT BEKAA SAIDA TYRE
30 31CHAPTEr 1DEMOGRAPHY 29
A comparison of the distribution of households by size in the two populations shows that Palestinians register a lower share of households with four or less members, and a higher share of households with over four members (figure 1.8). The share of one- or two-member households is three times less for Palestinians than for Lebanese.
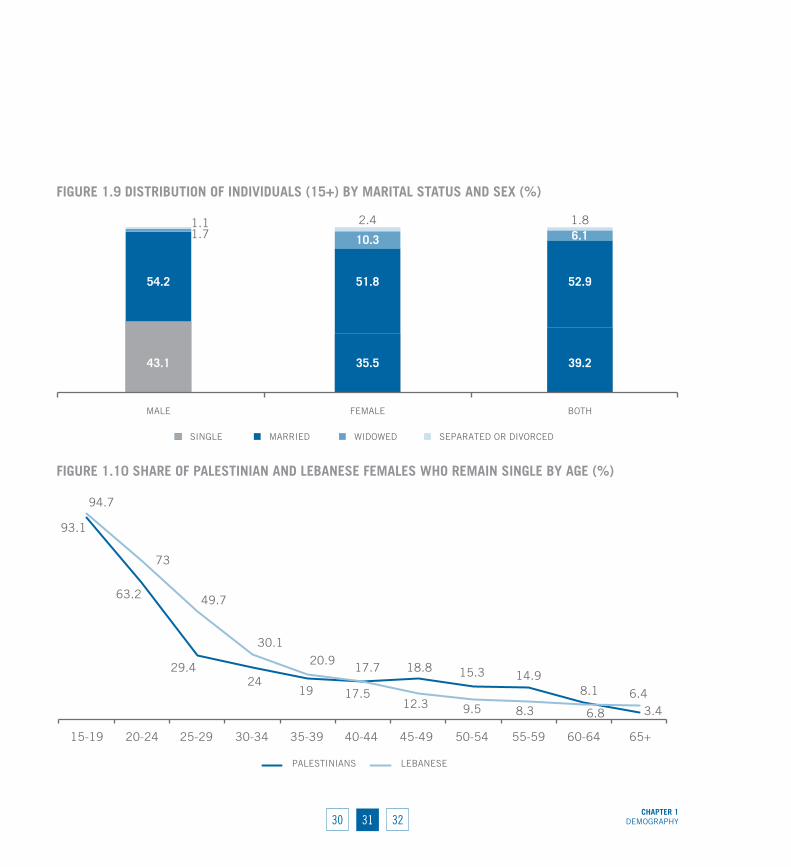
More than half of Palestinians aged 15 and above are married (53%), while around 40% are single
(figure 1.9). The same trend may be found among the Lebanese. As for the structure of households, for every 1,000 heads of households, there were 763 spouses and 2,481 children. The Lebanese household structure shows a smaller number of children (2,259), in line with the smaller Lebanese household size (CAS, 2007).
The larger number of Palestinian children stems from higher fertility rates, which seem to be in part due to a
FIGurE 1.8 DISTrIBuTION OF PALESTINIAN AND LEBANESE HOuSEHOLDS BY NuMBEr OF HOuSEHOLD MEMBErS (%)
2.36.0
9.1
15.1
20.2 20.6
14.4
6.7
3.3 1.8
9.2
18.7 18.1
21.4
16.7
10.2
3.21.5
0.5 0.5
1 2 3 4 5 6 7 8 9 10+
LEBANESE (2007)PALESTINIANS (2011)
FIGurE 1.7 HOuSEHOLD SIzE BY LOCATION (MEMBErS)
5.6
5.1 5.1
5.35.4
TRIPOLI BEIRUT BEKAA SAIDA TYRE
3130CHAPTEr 1
DEMOGRAPHY32
FIGurE 1.9 DISTrIBuTION OF INDIvIDuALS (15+) BY MArITAL STATuS AND SEx (%)
43.1 35.5 39.2
54.2 51.8 52.9
1.7 10.3 6.11.1 2.4 1.8
MALE FEMALE BOTH
SINGLE MARRIED WIDOWED SEPARATED OR DIVORCED
FIGurE 1.10 SHArE OF PALESTINIAN AND LEBANESE FEMALES wHO rEMAIN SINGLE BY AGE (%)
93.1
63.2
29.424
19
17.7 18.8 15.3 14.98.1
3.4
94.7
73
49.7
30.120.9
17.512.3 9.5 8.3 6.8
6.4
15-19 20-24 25-29 30-34 35-39 40-44 45-49 50-54 55-59 60-64 65+
LEBANESEPALESTINIANS

32 33CHAPTEr 1DEMOGRAPHY
lower age of marriage for Palestinian women. Despite the fact that the survey did not ask about the specific age of marriage, indications may be provided by the share of women who remain single in every age bracket. In the 25–29 age bracket only 29% of Palestinian women remain single, compared to 50% of Lebanese women (figure 1.10).
Finally, 73% of those who hold the status of siblings to the head of household are in fact female and 95% of those who hold the status of parent of the head of
household are also females. This finding denotes the higher dependency of females, who are more likely to continue to reside in the same household as adult sisters and mothers of the head of household (figure 1.11).
Around 82% of households are headed by males and 18% are headed by females, a share that increases to 24% in Bekaa and drops to 14% in Tripoli (table 1.1). The same share of female-headed households was reported by the 2003 Fafo survey, indicating that no increase has occurred over the past nine years.
31
TABLE 1.1 DISTrIBuTION OF HEADS OF HOuSEHOLDS BY LOCATION AND SEx (%)
Tripoli Beirut Bekaa Saida Tyre All Palestine
Male 85.5 82.4 75.8 82.1 77.9 81.6
Female 14.2 17.6 24.2 17.9 22.1 18.4
FIGurE 1.11 DISTrIBuTION OF HOuSEHOLD MEMBErS BY rELATIONSHIP TO HEAD OF HOuSEHOLD AND SEx (%)
81.6
0.2
52.8 48.2
5.1
26.8
18.4
99.8 47.2 51.8 94.9 73.2
Head of household Wife / Husband Son / Daughter Grandchild Father / Mother Brother / Sister
MALE FEMALE
3332CHAPTEr 1
DEMOGRAPHY34
In comparison, the Lebanese population has a lower share of female-headed households, estimated at 14% (CAS, 2007).
STATuS AND TrAvEL DOCuMENTATIONMore than 90% of Palestinian refugees were born in Lebanon. The remaining 10% consist essentially of the older generation who were born in Palestine and sought refuge in Lebanon after the nakba (“catastrophe”, as the 1948 Palestinian exodus is known). Questions about documentation of status and types of travel documents revealed that 95% of Lebanon’s Palestinians possess a Lebanese-Palestinian passport, otherwise known as a wathika. Similarly, 96% are in possession of an UNRWA card and documents attesting registration with the Ministry of Interior’s General Directorate of Political and Refugee Affairs. Only 0.5% are not registered and have no documents confirming their refugee status. This share increases to 2% in Bekaa. One of the reasons for this may be that during the 1960s and 1970s, a number of Palestinians moved mainly from Jordan and settled with the local communities, especially Bedouins, remaining without official documents attesting to their refugee status.


CHAPTEr 2EDUCATION
36 37CHAPTEr 2EDUCATION 35
CHAPTEr 2 EDUCATIONUntil the early 1980s, Lebanon’s Palestinian refugee community was considered as the most educated Palestinian community in the region (UNRWA, 2009). Palestinians prided themselves on their educational standards and UNRWA schools provided high-quality education, which was then completed in Lebanese or other Arab reputable universities (Sirhan, 1996). Following the Lebanese Civil War, which led to the expulsion of the PLO in 1982 in addition to political changes that swept the region, the Palestinians lost many job opportunities both in Lebanon and in the region as a whole. Moreover, the war inflicted severe damage on the infrastructure of camps and the livelihoods of their residents, turning them effectively into pockets of poverty. By the end of the decade, the financial problems faced by UNRWA, paired with the lack of opportunities to capitalize on educational achievement and a context characterized by poverty and insecurity, had a severe toll on the educational prospects of the Palestinians of Lebanon (UNICEF, 2010).
The following sections outline the principal features of the educational status of the Palestinian refugee population in Lebanon and attempt to extract some of the contextual factors that relate to these features.
LITErACY AND EDuCATIONAL ATTAINMENTThe illiteracy rate of the Palestinian refugee population stands at around 8%, compared to 9% for the Lebanese. This rate hides significant gender discrepancies, as the
female rate is almost double that of males (11% versus 5%), a trend that is mirrored in the Lebanese population (12% versus 6%) (CAS, 2007).
A more in-depth comparison of the male and female illiteracy rates shows almost identical rates for those who are 44 years of age or younger. Discrepancies begin to appear after 45, increasing in severity until they reach their peak among those aged 65 years or older (80% for females versus 26% for males). This means that, if the current trends continue, the gender gap will naturally disappear in time and illiteracy rates will drop from their current levels (figure 2.1).
Geographical comparison shows that illiteracy rates are highest in Tyre, reaching 10% and 16% for males and females respectively. The lowest rates are found in Tripoli, with rates of around 3% and 7% for males and females respectively. Finally, the largest gender gap may be found in Bekaa (figure 2.2).
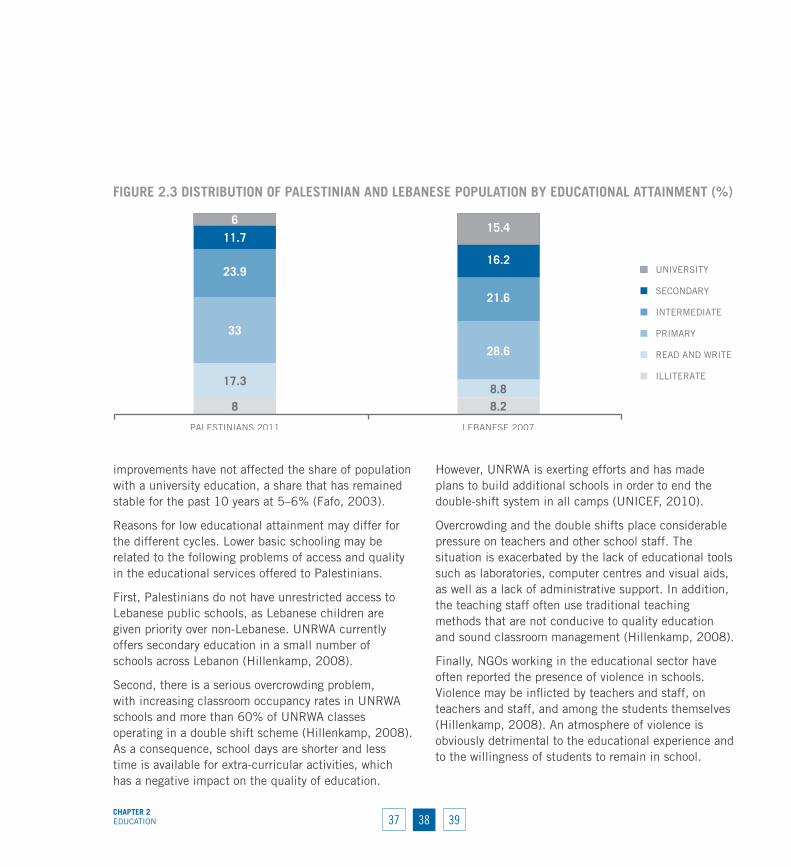
Although the two populations have similar illiteracy rates, the educational attainment of the Lebanese surpasses that of the Palestinians on all the rungs of the educational ladder (figure 2.3).5 Almost half of Palestinian refugees have primary education or less, compared to around 37% for the Lebanese. There have been improvements, as the share that has completed secondary education has climbed from 6% in 1999 to around 12% in the present survey. However, these
5 As the results revealed a small share of those enrolled in vocational education, vocational cycles were merged with their corresponding general education cycles.

3736CHAPTEr 2
EDUCATION38
FIGurE 2.1 ILLITErACY rATE BY AGE (%)
1.8 3.1 5.2 5.1 5.7 5.1
26.0
0.91.7 3.0 3.9
9.5
26.6
80.0
10-14 15-24 25-34 35-44 45-54 55-64 65+
FEMALEMALE
FIGurE 2.2 ILLITErACY rATE BY LOCATION AND SEx (%)
2.7
6.3
2.8 4.
5
10.0
6.7
10.3
12.5
10.6
15.8
4.7
8.3 7.8 7.5
13.0
TRIPOLI BEIRUT BEKAA SAIDA TYRE
BOTHMALE FEMALE
38 39CHAPTEr 2EDUCATION 37
improvements have not affected the share of population with a university education, a share that has remained stable for the past 10 years at 5–6% (Fafo, 2003).
Reasons for low educational attainment may differ for the different cycles. Lower basic schooling may be related to the following problems of access and quality in the educational services offered to Palestinians.
First, Palestinians do not have unrestricted access to Lebanese public schools, as Lebanese children are given priority over non-Lebanese. UNRWA currently offers secondary education in a small number of schools across Lebanon (Hillenkamp, 2008).
Second, there is a serious overcrowding problem, with increasing classroom occupancy rates in UNRWA schools and more than 60% of UNRWA classes operating in a double shift scheme (Hillenkamp, 2008). As a consequence, school days are shorter and less time is available for extra-curricular activities, which has a negative impact on the quality of education.
However, UNRWA is exerting efforts and has made plans to build additional schools in order to end the double-shift system in all camps (UNICEF, 2010).
Overcrowding and the double shifts place considerable pressure on teachers and other school staff. The situation is exacerbated by the lack of educational tools such as laboratories, computer centres and visual aids, as well as a lack of administrative support. In addition, the teaching staff often use traditional teaching methods that are not conducive to quality education and sound classroom management (Hillenkamp, 2008).
Finally, NGOs working in the educational sector have often reported the presence of violence in schools. Violence may be inflicted by teachers and staff, on teachers and staff, and among the students themselves (Hillenkamp, 2008). An atmosphere of violence is obviously detrimental to the educational experience and to the willingness of students to remain in school.
FIGurE 2.3 DISTrIBuTION OF PALESTINIAN AND LEBANESE POPuLATION BY EDuCATIONAL ATTAINMENT (%)
8 8.2
17.38.8
33
28.6
23.9
21.6
11.7
16.2
615.4
PALESTINIANS 2011 LEBANESE 2007
UNIVERSITY
SECONDARY
INTERMEDIATE
PRIMARY
READ AND WRITE
ILLITERATE
3939CHAPTEr 2
EDUCATION40
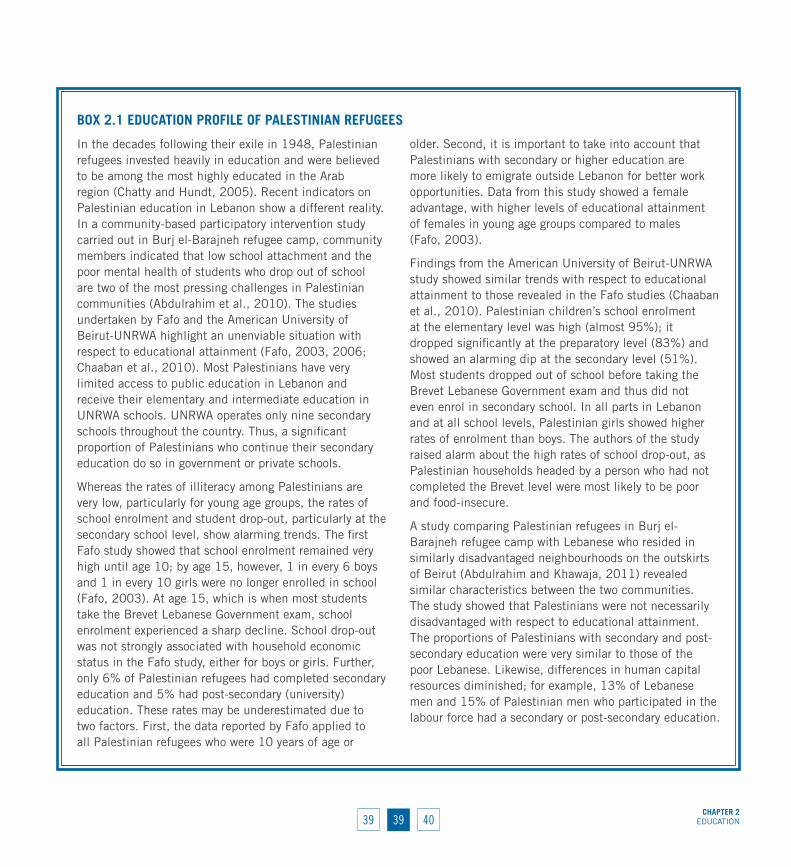
BOx 2.1 EDuCATION PrOFILE OF PALESTINIAN rEFuGEES
In the decades following their exile in 1948, Palestinian refugees invested heavily in education and were believed to be among the most highly educated in the Arab region (Chatty and Hundt, 2005). Recent indicators on Palestinian education in Lebanon show a different reality. In a community-based participatory intervention study carried out in Burj el-Barajneh refugee camp, community members indicated that low school attachment and the poor mental health of students who drop out of school are two of the most pressing challenges in Palestinian communities (Abdulrahim et al., 2010). The studies undertaken by Fafo and the American University of Beirut-UNRWA highlight an unenviable situation with respect to educational attainment (Fafo, 2003, 2006; Chaaban et al., 2010). Most Palestinians have very limited access to public education in Lebanon and receive their elementary and intermediate education in UNRWA schools. UNRWA operates only nine secondary schools throughout the country. Thus, a significant proportion of Palestinians who continue their secondary education do so in government or private schools.
Whereas the rates of illiteracy among Palestinians are very low, particularly for young age groups, the rates of school enrolment and student drop-out, particularly at the secondary school level, show alarming trends. The first Fafo study showed that school enrolment remained very high until age 10; by age 15, however, 1 in every 6 boys and 1 in every 10 girls were no longer enrolled in school (Fafo, 2003). At age 15, which is when most students take the Brevet Lebanese Government exam, school enrolment experienced a sharp decline. School drop-out was not strongly associated with household economic status in the Fafo study, either for boys or girls. Further, only 6% of Palestinian refugees had completed secondary education and 5% had post-secondary (university) education. These rates may be underestimated due to two factors. First, the data reported by Fafo applied to all Palestinian refugees who were 10 years of age or
older. Second, it is important to take into account that Palestinians with secondary or higher education are more likely to emigrate outside Lebanon for better work opportunities. Data from this study showed a female advantage, with higher levels of educational attainment of females in young age groups compared to males (Fafo, 2003).
Findings from the American University of Beirut-UNRWA study showed similar trends with respect to educational attainment to those revealed in the Fafo studies (Chaaban et al., 2010). Palestinian children’s school enrolment at the elementary level was high (almost 95%); it dropped significantly at the preparatory level (83%) and showed an alarming dip at the secondary level (51%). Most students dropped out of school before taking the Brevet Lebanese Government exam and thus did not even enrol in secondary school. In all parts in Lebanon and at all school levels, Palestinian girls showed higher rates of enrolment than boys. The authors of the study raised alarm about the high rates of school drop-out, as Palestinian households headed by a person who had not completed the Brevet level were most likely to be poor and food-insecure.
A study comparing Palestinian refugees in Burj el-Barajneh refugee camp with Lebanese who resided in similarly disadvantaged neighbourhoods on the outskirts of Beirut (Abdulrahim and Khawaja, 2011) revealed similar characteristics between the two communities. The study showed that Palestinians were not necessarily disadvantaged with respect to educational attainment. The proportions of Palestinians with secondary and post-secondary education were very similar to those of the poor Lebanese. Likewise, differences in human capital resources diminished; for example, 13% of Lebanese men and 15% of Palestinian men who participated in the labour force had a secondary or post-secondary education.
40 41CHAPTEr 2EDUCATION
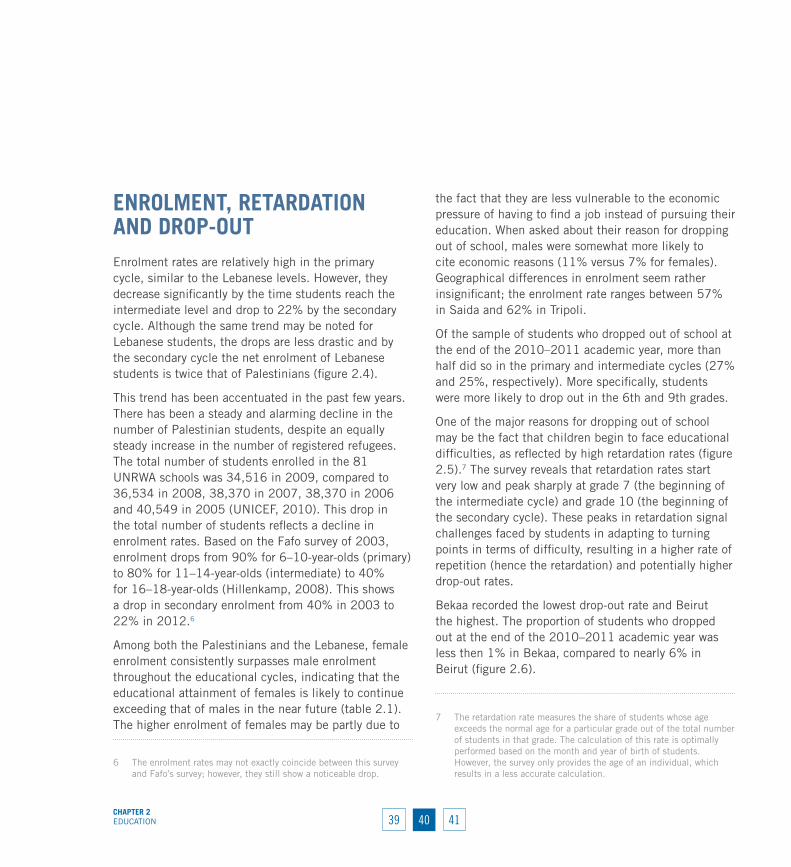
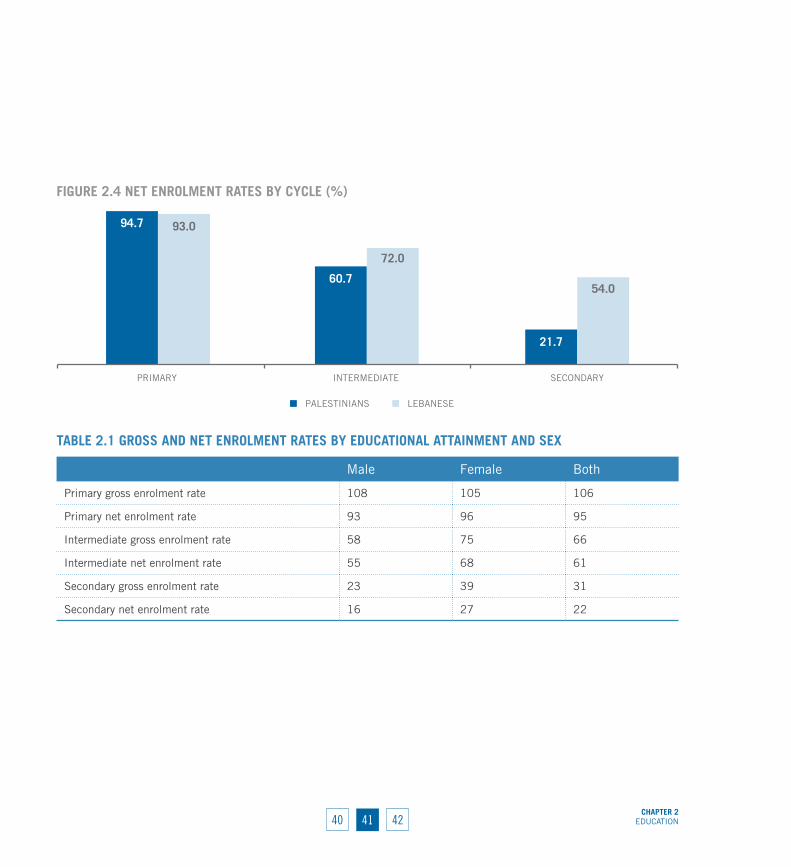
ENrOLMENT, rETArDATION AND DrOP-OuTEnrolment rates are relatively high in the primary cycle, similar to the Lebanese levels. However, they decrease significantly by the time students reach the intermediate level and drop to 22% by the secondary cycle. Although the same trend may be noted for Lebanese students, the drops are less drastic and by the secondary cycle the net enrolment of Lebanese students is twice that of Palestinians (figure 2.4).
This trend has been accentuated in the past few years. There has been a steady and alarming decline in the number of Palestinian students, despite an equally steady increase in the number of registered refugees. The total number of students enrolled in the 81 UNRWA schools was 34,516 in 2009, compared to 36,534 in 2008, 38,370 in 2007, 38,370 in 2006 and 40,549 in 2005 (UNICEF, 2010). This drop in the total number of students reflects a decline in enrolment rates. Based on the Fafo survey of 2003, enrolment drops from 90% for 6–10-year-olds (primary) to 80% for 11–14-year-olds (intermediate) to 40% for 16–18-year-olds (Hillenkamp, 2008). This shows a drop in secondary enrolment from 40% in 2003 to 22% in 2012.6
Among both the Palestinians and the Lebanese, female enrolment consistently surpasses male enrolment throughout the educational cycles, indicating that the educational attainment of females is likely to continue exceeding that of males in the near future (table 2.1). The higher enrolment of females may be partly due to
6 The enrolment rates may not exactly coincide between this survey and Fafo’s survey; however, they still show a noticeable drop.
the fact that they are less vulnerable to the economic pressure of having to find a job instead of pursuing their education. When asked about their reason for dropping out of school, males were somewhat more likely to cite economic reasons (11% versus 7% for females). Geographical differences in enrolment seem rather insignificant; the enrolment rate ranges between 57% in Saida and 62% in Tripoli.
Of the sample of students who dropped out of school at the end of the 2010–2011 academic year, more than half did so in the primary and intermediate cycles (27% and 25%, respectively). More specifically, students were more likely to drop out in the 6th and 9th grades.
One of the major reasons for dropping out of school may be the fact that children begin to face educational difficulties, as reflected by high retardation rates (figure 2.5).7 The survey reveals that retardation rates start very low and peak sharply at grade 7 (the beginning of the intermediate cycle) and grade 10 (the beginning of the secondary cycle). These peaks in retardation signal challenges faced by students in adapting to turning points in terms of difficulty, resulting in a higher rate of repetition (hence the retardation) and potentially higher drop-out rates.
Bekaa recorded the lowest drop-out rate and Beirut the highest. The proportion of students who dropped out at the end of the 2010–2011 academic year was less then 1% in Bekaa, compared to nearly 6% in Beirut (figure 2.6).
7 The retardation rate measures the share of students whose age exceeds the normal age for a particular grade out of the total number of students in that grade. The calculation of this rate is optimally performed based on the month and year of birth of students. However, the survey only provides the age of an individual, which results in a less accurate calculation.
39
4140CHAPTEr 2
EDUCATION42
TABLE 2.1 GrOSS AND NET ENrOLMENT rATES BY EDuCATIONAL ATTAINMENT AND SEx
Male Female Both
Primary gross enrolment rate 108 105 106
Primary net enrolment rate 93 96 95
Intermediate gross enrolment rate 58 75 66
Intermediate net enrolment rate 55 68 61
Secondary gross enrolment rate 23 39 31
Secondary net enrolment rate 16 27 22
FIGurE 2.4 NET ENrOLMENT rATES BY CYCLE (%)
94.7
60.7
21.7
93.0
72.0
54.0
PRIMARY INTERMEDIATE SECONDARY
PALESTINIANS LEBANESE

42 43CHAPTEr 2EDUCATION 41
The type of school does not appear be related to the likelihood of dropping out. Indeed, 3% of UNRWA students dropped out at the end of the 2010–2011 academic year, compared to 4% of private school children and 2% of public school children.
The proportion of students who dropped out of school for economic reasons was 9% on average, with notable
geographical differences, from a low of 4% in Tripoli to 13% and 14% in Beirut and Tyre respectively.
HIGHEr EDuCATIONIn addition to problems of access and quality, Palestinian children and youths seem to lack the
FIGurE 2.5 rETArDATION rATE BY GrADE (%)
1.32.7
8.911.4 12.0 10.8
24.9
13.5
16.1
21.3
17.6
14.1
G1 G2 G3 G4 G5 G6 G7 G8 G9 G10 G11 G12
FIGurE 2.6 PrOPOrTION OF PALESTINIAN STuDENTS wHO DrOPPED OuT AT THE END OF 2010–2011 BY LOCATION (%)
3.9
5.7
0.7
3.9
1.5
TRIPOLI BEIRUT BEKAA SAIDA TYRE
4342CHAPTEr 2
EDUCATION44
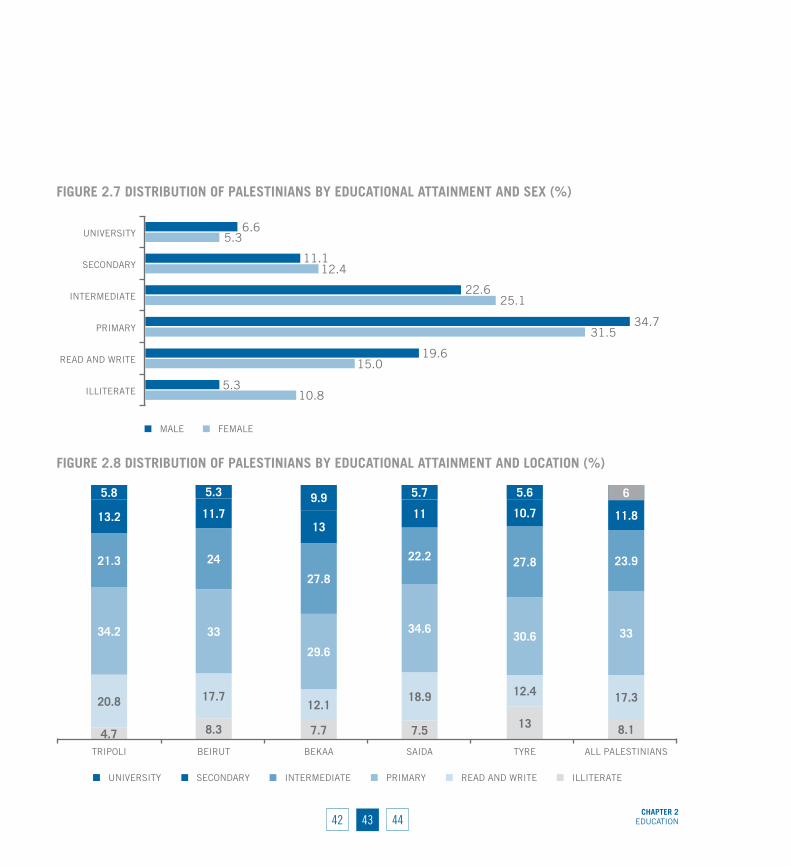
FIGurE 2.7 DISTrIBuTION OF PALESTINIANS BY EDuCATIONAL ATTAINMENT AND SEx (%)
10.8
15.0
31.5
25.1
12.4
5.3
5.3
19.6
34.7
22.6
11.1
6.6
ILLITERATE
READ AND WRITE
PRIMARY
INTERMEDIATE
SECONDARY
UNIVERSITY
MALE FEMALE
FIGurE 2.8 DISTrIBuTION OF PALESTINIANS BY EDuCATIONAL ATTAINMENT AND LOCATION (%)
ILLITERATEREAD AND WRITEINTERMEDIATESECONDARY
4.7 8.3 7.7 7.5 13 8.1
20.8 17.712.1
18.9 12.4 17.3
34.2 33
29.6
34.630.6 33
21.3 24
27.8
22.2 27.8 23.9
13.2 11.713
11 10.7 11.8
5.8 5.3 9.9 5.7 5.6 6
TRIPOLI BEIRUT BEKAA SAIDA TYRE ALL PALESTINIANS
UNIVERSITY PRIMARY
44 45CHAPTEr 2EDUCATION 43
motivation to pursue an education due to the feeling that there would be no good jobs waiting for them at the end of the line. Many think that the years spent on education are wasted, as the investment is still insufficient to open the door to well-paid jobs in Lebanon (Amnesty International, 2007).
Similarly to the Lebanese population, females have a higher educational attainment up to the secondary level. However, unlike the Lebanese situation where the share of females with university degrees exceeds that of males, university degree holders are more prevalent among male than female Palestinians (figure 2.7).
Geographically, educational attainment is similar across different locations, with Bekaa maintaining an edge, with the highest share of university graduates and the lowest share of the “can read and write” group (figure 2.8).
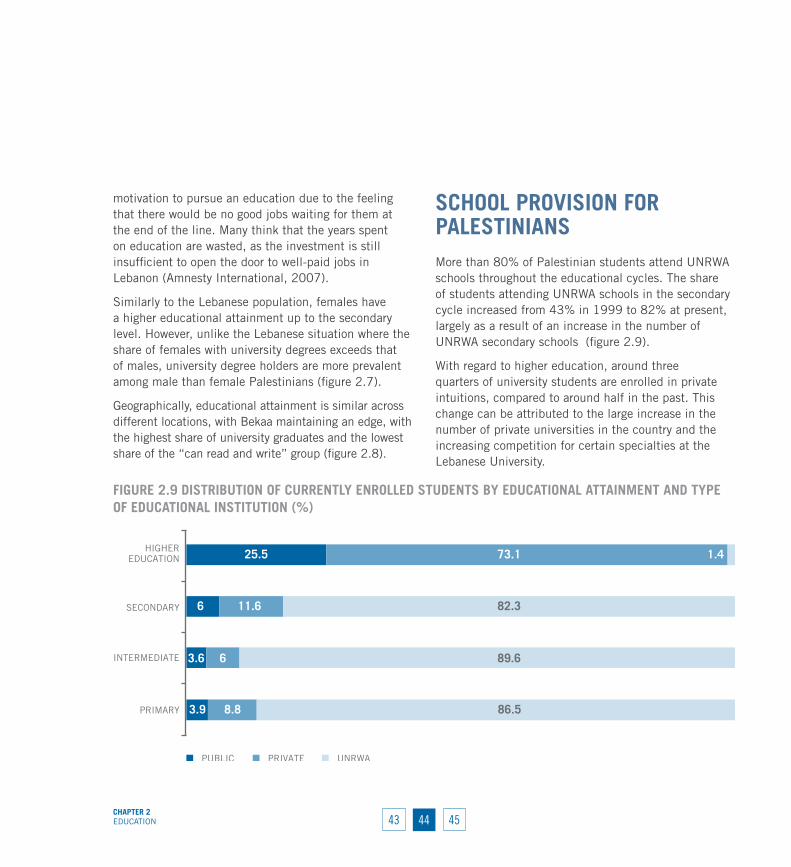
SCHOOL PrOvISION FOr PALESTINIANSMore than 80% of Palestinian students attend UNRWA schools throughout the educational cycles. The share of students attending UNRWA schools in the secondary cycle increased from 43% in 1999 to 82% at present, largely as a result of an increase in the number of UNRWA secondary schools (figure 2.9).
With regard to higher education, around three quarters of university students are enrolled in private intuitions, compared to around half in the past. This change can be attributed to the large increase in the number of private universities in the country and the increasing competition for certain specialties at the Lebanese University.
FIGurE 2.9 DISTrIBuTION OF CurrENTLY ENrOLLED STuDENTS BY EDuCATIONAL ATTAINMENT AND TYPE OF EDuCATIONAL INSTITuTION (%)
3.9
3.6
6
25.5
8.8
6
11.6
73.1
86.5
89.6
82.3
1.4
PRIMARY
INTERMEDIATE
SECONDARY
HIGHEREDUCATION
PRIVATEPUBLIC UNRWA

4544CHAPTEr 2
EDUCATION46
Finally, only 4% of Palestinians attend vocational training schools and UNRWA caters for the needs of a third of those who do. Moreover, a recent study has found that only 27% of young people who had received vocational training ended up working in their field of training (Abdunnur, Abdunnur and Madi, 2008). This may be due to the fact that NGOs provide training courses of only six months, hardly enough time for proper learning, and the certificates are not equivalent to those offered by the Lebanese Government (Hillenkamp, 2008).


CHAPTEr 3LABOUR FORCE PARTICIPATION

48 49CHAPTEr 3LABOUR FORCE PARTICIPATION 47
CHAPTEr 3 LABOUR FORCE PARTICIPATIONPalestinians are a young and socially conservative population, features that are typical of Arab populations in general. Children under the age of 15 constitute around 33% of the Palestinian refugee population, a share that is similar to that found in most of the region’s countries but much greater than that found in countries of the Organisation for Economic Co-operation and Development (OECD), such as France (18%), Italy (14%), the United Kingdom (17%) and the United States of America (20%).8 The higher share of children entails a smaller share of working age population in the region’s countries and therefore limits the crude labour force participation rate, that is, the share of the economically active out of the entire population. Unlike, the classical economic activity rate, the crude economic activity rate shows the higher economic burden that each active member has to bear due to the high age dependency ratios in the Arab region.
Moreover, the different expectations faced by men and women regarding work outside the home results in widespread low participation of women in the labour force. The Arab region is characterized by the lowest share of economically active women, a share that does not exceed the 20% range (21% in Lebanon) and may fall below 20%, as is the case for Jordan (15%), Iraq (14%) and Syrian Arab Republic
8 World Bank data, available at http://data.worldbank.org/indicator/SP.POP.0014.TO.ZS/countries.
(13%).9 In comparison, European and South American countries have female labour participation rates that range between 50% and 60%. Palestinian refugees in Lebanon are no exception to this rule and tend to exhibit the same pattern of low female labour participation (15%).
As a result of these demographic and cultural levers, labour participation in Arab countries is relatively low and tends to hover around 45% compared to 60% in OECD countries and South America. In Lebanon, the share of economically active Lebanese and Palestinians falls within the normal range for the region (43% and 42% respectively). Finally, the economic activity rate of Palestinians does not seem to vary according to their country of residence. The economic activity rate stands at 45% in the West Bank, 40% in the Gaza Strip and 41% in Jordan (PCBS, 2012).10
The remainder of this chapter will present a detailed description of the demographic and social features that characterize the Palestinian labour force on the one hand and the inactive Palestinian population on the other.
9 World Bank data, ibid.
10 World Bank data, ibid.

4948CHAPTEr 3
LABOUR FORCE PARTICIPATION50
ECONOMIC ACTIvITY: LABOur FOrCE PArTICIPATIONAs mentioned above, the economic activity rate11
is 42% for Palestinians, compared to 43% for the Lebanese (figure 3.1 and table 3.1). In other words, there is little difference in economic participation
11 The economic activity rate (labour force participation rate) refers to the share of active population (employed + unemployed) aged 15 years and above out of the total working age population (15 years and above). The ILO defines the economically active as those who performed any work, whether paid or unpaid, in the week preceding the interview, in addition to those who were temporarily absent from their job and those who are unemployed.
between the two populations. However, because the age dependency ratio is higher for Palestinians (61% versus 52% for the Lebanese), the same rate of participation would translate into a higher economic burden in the case of Palestinians.
Similar activity rates were reported by the American University of Beirut-UNRWA study in 2010 (which uses the 15–65 age category) and the 2006 Fafo labour survey, both of which place the activity rate for the Palestinian population residing in Lebanon at 37% (Chaaban, 2010; Fafo, 2006).
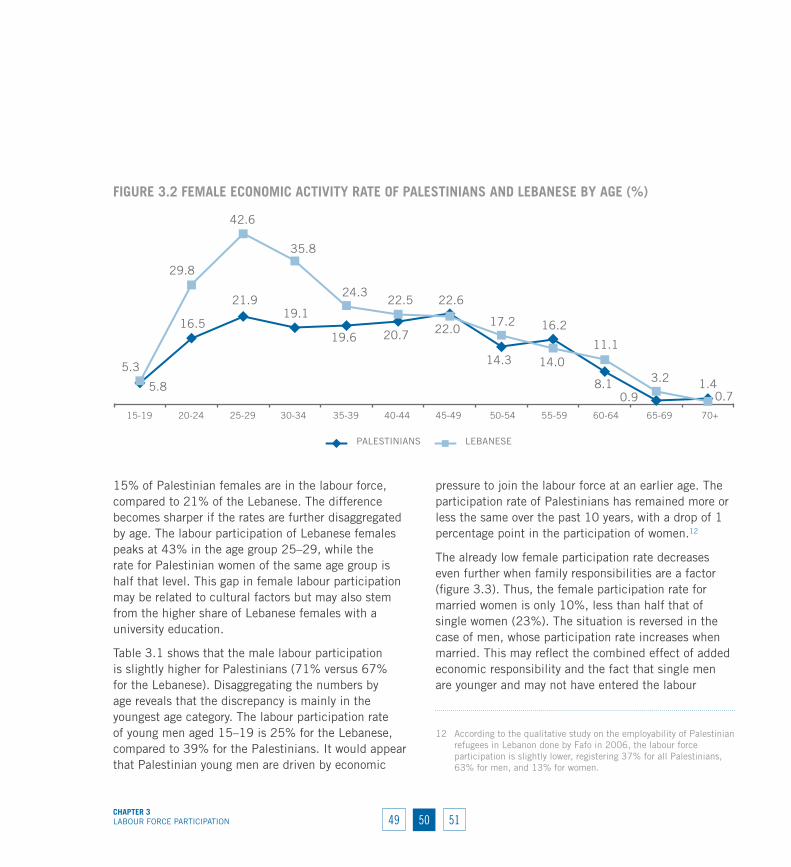
The female participation rate is even lower than that witnessed in the Lebanese population (figure 3.2). Only
FIGurE 3.1 ILO CLASSIFICATION SYSTEM FOr THE ECONOMICALLY ACTIvE POPuLATION AND THE LABOur FOrCE
Full time (35 hours a week or more)
Working age population (15 Years and above)
Economically active population (in the labour force)
Employed Unemployed
Part time (34 hoursa week or less)
Inactive population(out-side the labour force)
Populationbelow workingage (15 yearsand below)
33%
58%
8%
78%
92%
67%
42%
22%
TABLE 3.1 ECONOMIC ACTIvITY rATE FOr PALESTINIANS AND LEBANESE (%)
Palestinians (2011) Palestinians (1999) Lebanese (2007)
Both 42 42 43
Male 71 69 67
Female 15 16 21
50 51CHAPTEr 3LABOUR FORCE PARTICIPATION 49
15% of Palestinian females are in the labour force, compared to 21% of the Lebanese. The difference becomes sharper if the rates are further disaggregated by age. The labour participation of Lebanese females peaks at 43% in the age group 25–29, while the rate for Palestinian women of the same age group is half that level. This gap in female labour participation may be related to cultural factors but may also stem from the higher share of Lebanese females with a university education.
Table 3.1 shows that the male labour participation is slightly higher for Palestinians (71% versus 67% for the Lebanese). Disaggregating the numbers by age reveals that the discrepancy is mainly in the youngest age category. The labour participation rate of young men aged 15–19 is 25% for the Lebanese, compared to 39% for the Palestinians. It would appear that Palestinian young men are driven by economic
pressure to join the labour force at an earlier age. The participation rate of Palestinians has remained more or less the same over the past 10 years, with a drop of 1 percentage point in the participation of women.12
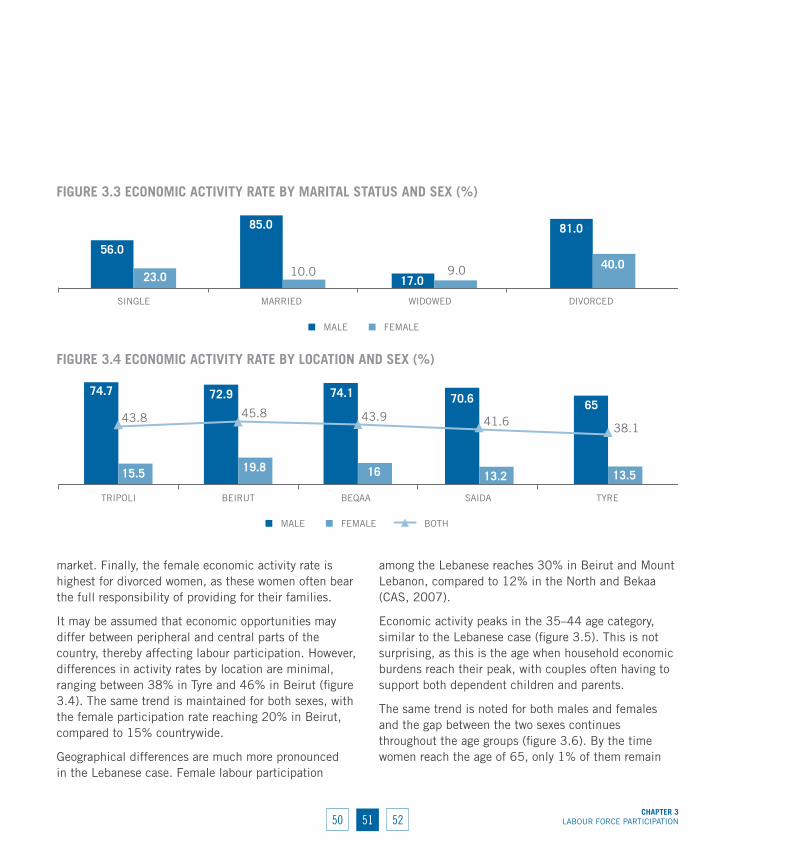
The already low female participation rate decreases even further when family responsibilities are a factor (figure 3.3). Thus, the female participation rate for married women is only 10%, less than half that of single women (23%). The situation is reversed in the case of men, whose participation rate increases when married. This may reflect the combined effect of added economic responsibility and the fact that single men are younger and may not have entered the labour
12 According to the qualitative study on the employability of Palestinian refugees in Lebanon done by Fafo in 2006, the labour force participation is slightly lower, registering 37% for all Palestinians, 63% for men, and 13% for women.
FIGurE 3.2 FEMALE ECONOMIC ACTIvITY rATE OF PALESTINIANS AND LEBANESE BY AGE (%)
5.3
16.5
21.919.1
19.6 20.7
22.6
14.3
16.2
8.10.9
1.4 5.8
29.8
42.6
35.8
24.322.5
22.0 17.2
14.011.1
3.2
0.7 15-19 20-24 25-29 30-34 35-39 40-44 45-49 50-54 55-59 60-64 65-69 70+
LEBANESEPALESTINIANS
5150CHAPTEr 3
LABOUR FORCE PARTICIPATION52
market. Finally, the female economic activity rate is highest for divorced women, as these women often bear the full responsibility of providing for their families.
It may be assumed that economic opportunities may differ between peripheral and central parts of the country, thereby affecting labour participation. However, differences in activity rates by location are minimal, ranging between 38% in Tyre and 46% in Beirut (figure 3.4). The same trend is maintained for both sexes, with the female participation rate reaching 20% in Beirut, compared to 15% countrywide.
Geographical differences are much more pronounced in the Lebanese case. Female labour participation
among the Lebanese reaches 30% in Beirut and Mount Lebanon, compared to 12% in the North and Bekaa (CAS, 2007).
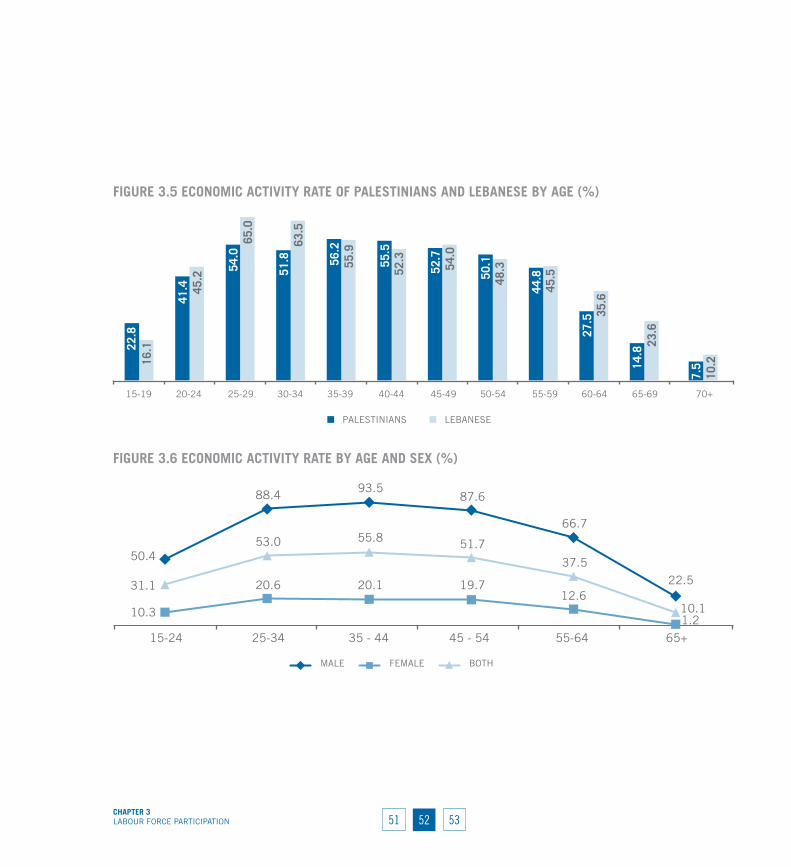
Economic activity peaks in the 35–44 age category, similar to the Lebanese case (figure 3.5). This is not surprising, as this is the age when household economic burdens reach their peak, with couples often having to support both dependent children and parents.
The same trend is noted for both males and females and the gap between the two sexes continues throughout the age groups (figure 3.6). By the time women reach the age of 65, only 1% of them remain
FIGurE 3.3 ECONOMIC ACTIvITY rATE BY MArITAL STATuS AND SEx (%)
56.0
85.0
17.0
81.0
23.0 10.0 9.0 40.0
SINGLE MARRIED WIDOWED DIVORCED
MALE FEMALE
FIGurE 3.4 ECONOMIC ACTIvITY rATE BY LOCATION AND SEx (%)
74.7 72.9 74.1 70.6 65
15.5 19.8 16 13.2 13.5
43.8 45.8 43.9 41.6 38.1
TRIPOLI BEIRUT BEQAA SAIDA TYRE
BOTHMALE FEMALE
52 53CHAPTEr 3LABOUR FORCE PARTICIPATION 51
FIGurE 3.5 ECONOMIC ACTIvITY rATE OF PALESTINIANS AND LEBANESE BY AGE (%)
65.0
22.8
41.4
54.0
51.8
56.2
55.5
52.7
50.1
44.8
27.5
14.8
7.516
.1
45.2
63.5
55.9
52.3
54.0
48.3
45.5
35.6
23.6
10.2
15-19 20-24 25-29 30-34 35-39 40-44 45-49 50-54 55-59 60-64 65-69 70+
PALESTINIANS LEBANESE
FIGurE 3.6 ECONOMIC ACTIvITY rATE BY AGE AND SEx (%)
50.4
88.4 93.587.6
66.7
22.5
10.3
20.6 20.1 19.712.6
1.2
31.1
53.0 55.8 51.7
37.5
10.1
15-24 25-34 35 - 44 45 - 54 55-64 65+
FEMALEMALE BOTH
5352 53CHAPTEr 3
LABOUR FORCE PARTICIPATION
active, compared to 10% of men. Around three quarters(74%) of the Palestinian active population is under the age of 44, while those 55 and above constitute only 8% of the active population.
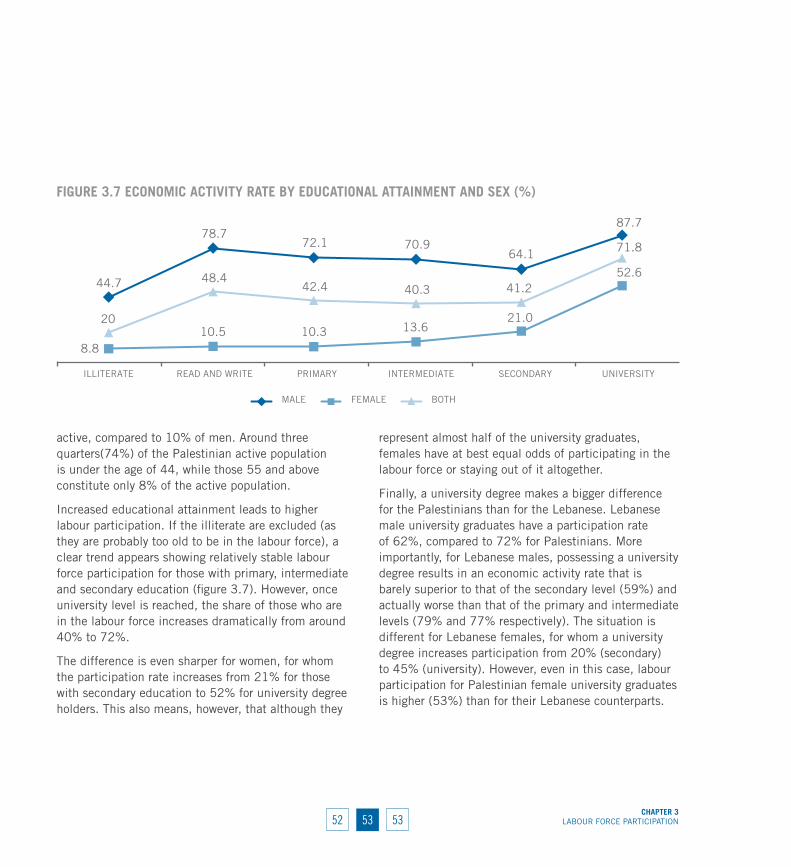
Increased educational attainment leads to higher labour participation. If the illiterate are excluded (as they are probably too old to be in the labour force), a clear trend appears showing relatively stable labour force participation for those with primary, intermediate and secondary education (figure 3.7). However, once university level is reached, the share of those who are in the labour force increases dramatically from around 40% to 72%.
The difference is even sharper for women, for whom the participation rate increases from 21% for those with secondary education to 52% for university degree holders. This also means, however, that although they
represent almost half of the university graduates, females have at best equal odds of participating in the labour force or staying out of it altogether.
Finally, a university degree makes a bigger difference for the Palestinians than for the Lebanese. Lebanese male university graduates have a participation rate of 62%, compared to 72% for Palestinians. More importantly, for Lebanese males, possessing a university degree results in an economic activity rate that is barely superior to that of the secondary level (59%) and actually worse than that of the primary and intermediate levels (79% and 77% respectively). The situation is different for Lebanese females, for whom a university degree increases participation from 20% (secondary) to 45% (university). However, even in this case, labour participation for Palestinian female university graduates is higher (53%) than for their Lebanese counterparts.
FIGurE 3.7 ECONOMIC ACTIvITY rATE BY EDuCATIONAL ATTAINMENT AND SEx (%)
44.7
78.7 72.1 70.9
64.1
87.7
8.8
10.5 10.3 13.621.0
52.6
20
48.4 42.4 40.3 41.2
71.8
FEMALEMALE BOTH
ILLITERATE READ AND WRITE PRIMARY INTERMEDIATE SECONDARY UNIVERSITY

54 55CHAPTEr 3LABOUR FORCE PARTICIPATION 53
BOx 3.1 CONTrIBuTION OF PALESTINIAN rEFuGEES TO THE LEBANESE ECONOMY
Opinions have been expressed that Palestinian refugees in Lebanon constitute a liability on the Lebanese economy, and granting them their rights to work limits the already scarce job opportunities available for the Lebanese. The significant contributions of the Palestinian refugees to the Lebanese economy have, consequently, not been taken into consideration; instead, they have been viewed as a burden on the Lebanese State (economically, socially and politically) in the light of the past and current political and economic climate in the country.
Historically, Palestinian human capital has enriched the Lebanese economy, both in the agricultural sector and the construction sector, and successful Palestinian businesses have prospered and become an invaluable part of the economic fabric of Lebanon, contributing to increasing employment (of both Lebanese and Palestinian people) and total investment and growth rates in the country. There are also small businesses that are run and managed by Palestinians inside and on the fringes of camps and gatherings. These directly contribute to Lebanon’s GDP through supporting the growth of the informal economy. Such small establishments, regardless of their levels of efficiency, are considered the mainstay for economic growth in Lebanon (as well as other developing countries). Such contributions go beyond individuals or private business owners. Qualitative analysis shows that contributions at the community level are made through invigorating surrounding areas by
establishing low-cost markets, such as the Sabra and Ein el-Hilweh markets, which are recognized as major informal economic centres for both Lebanese and Palestinian poor and low-income earners.
Palestinian labourers have historically had the capacity to sustain themselves despite their immobility, and the role they have played in the Lebanese economy, whether directly or indirectly, has been highly significant over the years. Their contribution to the economy dates back to the onset of the nakba in 1948, since when generations of Palestinians have been born and raised in Lebanon. Palestinian labourers have been particularly active in the agricultural and construction sectors, in which Lebanese workers have generally been unwilling to engage, so there have been no legal hurdles preventing Palestinians from working in those sectors.
Though Palestinians have resided in Lebanon for decades, their work remains restricted, and with the growing numbers of youths entering the labour force, the majority of Palestinians are forced to work in the informal economy. But unlike other non-Lebanese workers, Palestinian refugees consume and save inside Lebanon, thus positively contributing to the country’s balance of payments and its gross domestic product (GDP). In other words, Palestinian households are part of a long-term labour pool who live in Lebanon; this means that their consumption patterns are comprehensive, especially those of food and medical services, which are the two main areas of expenditure. Palestinian contribution to
5554CHAPTEr 3
LABOUR FORCE PARTICIPATION56
national private consumption is highly significant: the ratio of Palestinians’ private consumption (not excluding UNRWA’s appropriations) to total private consumption in Lebanon has been estimated to be approximately 10%. Surveys estimate that Palestinian refugees in Lebanon contribute more than US$300 million a year to the Lebanese economy, with a particular effect in rural areas, where most Palestinians reside.
Also worthy of mention are the significant patterns of refugee migration and the flow of remittances back to Lebanon, which is very similar to the migration trends of Lebanese workers. Studies show that more than half of the households in the eight largest camps have reported that they receive financial assistance from emigrants, who are either in Europe or the Arab Gulf, and almost a quarter of households have reported the presence of a direct family member abroad. The estimated average value of remittances flowing into Lebanon from Palestinian migrant workers exceeds US$60 million a year. However, not enough studies have been made to reach a more reliable estimate of the size of Palestinian remittances to Lebanon, or the extent of the economic and social impact of remittances within Palestinian communities and refugee camps in Lebanon.
The issue of Palestinian refugees has, since the nakba in 1948, attracted the attention and hence
the money of the international community. The flows of funds from international organizations are aimed to provide health, education and social services directly through UNRWA, or through funding development projects that are implemented by local NGOs. Such projects employ different Lebanese experts, specialists, social workers and programme officers, thereby mobilizing different sectors in the Lebanese economy. This was recently apparent in the efforts to rebuild Nahr el-Bared camp. Foreign funds may also be channelled directly to households, thus contributing to the rates of private consumption within Palestinian communities and within the Lebanese economy.
All in all, studies show that despite all the hurdles facing their right to join the formal employment sector, and despite their poverty, the majority of the households in refugee camps are economically active. Though they are employed informally with no work permits, they establish small businesses in and around camps and they form a labour pool with various skills, and when circumstances permit they manage to emigrate and send remittances back to Lebanon. Their comprehensive consumption patterns contributed to the growth of total private consumption in the Lebanese economy, thus positively contributing to the country’s GDP. And finally, Palestinian communities in Lebanon are a focal point for international welfare funding.
Sources: Ali, 2004; Khalidi and Tabbarah, 2009; Abou Namel, 2008; Palestinian Human Rights Organization, 2007; Chaaban et al., 2010.
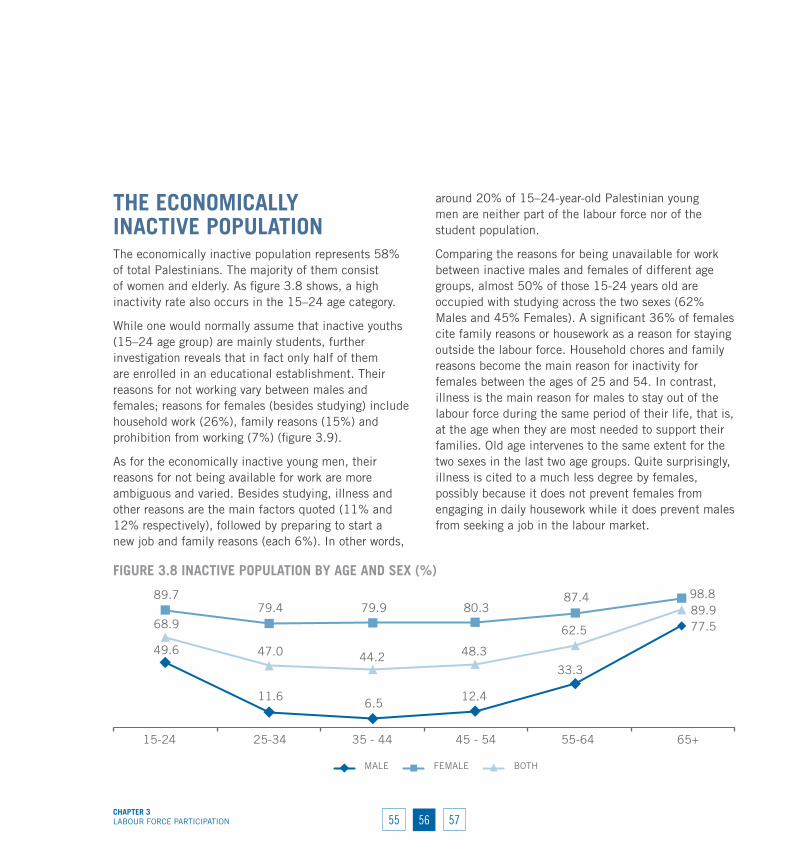
56 57CHAPTEr 3LABOUR FORCE PARTICIPATION 55
THE ECONOMICALLY INACTIvE POPuLATIONThe economically inactive population represents 58% of total Palestinians. The majority of them consist of women and elderly. As figure 3.8 shows, a high inactivity rate also occurs in the 15–24 age category.
While one would normally assume that inactive youths (15–24 age group) are mainly students, further investigation reveals that in fact only half of them are enrolled in an educational establishment. Their reasons for not working vary between males and females; reasons for females (besides studying) include household work (26%), family reasons (15%) and prohibition from working (7%) (figure 3.9).
As for the economically inactive young men, their reasons for not being available for work are more ambiguous and varied. Besides studying, illness and other reasons are the main factors quoted (11% and 12% respectively), followed by preparing to start a new job and family reasons (each 6%). In other words,
around 20% of 15–24-year-old Palestinian young men are neither part of the labour force nor of the student population.
Comparing the reasons for being unavailable for work between inactive males and females of different age groups, almost 50% of those 15-24 years old are occupied with studying across the two sexes (62% Males and 45% Females). A significant 36% of females cite family reasons or housework as a reason for staying outside the labour force. Household chores and family reasons become the main reason for inactivity for females between the ages of 25 and 54. In contrast, illness is the main reason for males to stay out of the labour force during the same period of their life, that is, at the age when they are most needed to support their families. Old age intervenes to the same extent for the two sexes in the last two age groups. Quite surprisingly, illness is cited to a much less degree by females, possibly because it does not prevent females from engaging in daily housework while it does prevent males from seeking a job in the labour market.
FIGurE 3.8 INACTIvE POPuLATION BY AGE AND SEx (%)
49.6
11.6 6.512.4
33.3
77.5
89.779.4 79.9 80.3
87.4 98.8
68.9
47.0 44.2 48.3
62.5
89.9
15-24 25-34 35 - 44 45 - 54 55-64 65+
FEMALEMALE BOTH
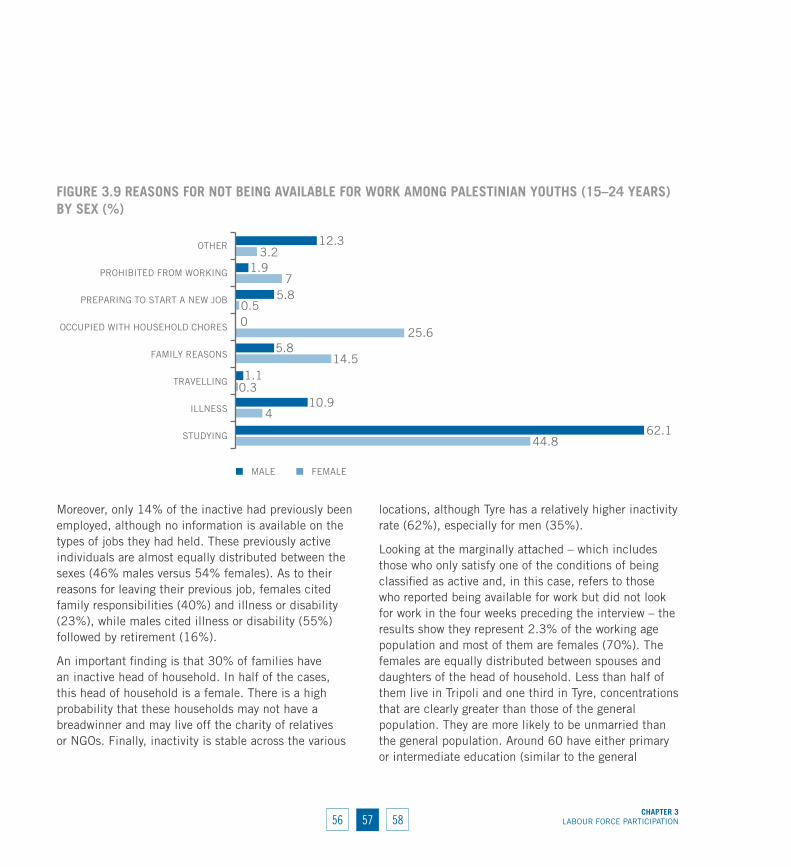
5756CHAPTEr 3
LABOUR FORCE PARTICIPATION58
Moreover, only 14% of the inactive had previously been employed, although no information is available on the types of jobs they had held. These previously active individuals are almost equally distributed between the sexes (46% males versus 54% females). As to their reasons for leaving their previous job, females cited family responsibilities (40%) and illness or disability (23%), while males cited illness or disability (55%) followed by retirement (16%).
An important finding is that 30% of families have an inactive head of household. In half of the cases, this head of household is a female. There is a high probability that these households may not have a breadwinner and may live off the charity of relatives or NGOs. Finally, inactivity is stable across the various
locations, although Tyre has a relatively higher inactivity rate (62%), especially for men (35%).
Looking at the marginally attached – which includes those who only satisfy one of the conditions of being classified as active and, in this case, refers to those who reported being available for work but did not look for work in the four weeks preceding the interview – the results show they represent 2.3% of the working age population and most of them are females (70%). The females are equally distributed between spouses and daughters of the head of household. Less than half of them live in Tripoli and one third in Tyre, concentrations that are clearly greater than those of the general population. They are more likely to be unmarried than the general population. Around 60 have either primary or intermediate education (similar to the general
FIGurE 3.9 rEASONS FOr NOT BEING AvAILABLE FOr wOrK AMONG PALESTINIAN YOuTHS (15–24 YEArS) BY SEx (%)
4
0.3
14.5
25.6
0.5
7
3.2
44.862.1
10.9
1.1
5.8
0
5.8
1.9
12.3
STUDYING
ILLNESS
TRAVELLING
FAMILY REASONS
OCCUPIED WITH HOUSEHOLD CHORES
PREPARING TO START A NEW JOB
PROHIBITED FROM WORKING
OTHER
MALE FEMALE

58 59CHAPTEr 3LABOUR FORCE PARTICIPATION 57
population). Most of them are under 44 (compared to 70% for the general working age population). When asked, 66% of them reported not wanting to work in the previous week. Three quarters of them had not looked for work in the previous six months. As for their reasons for not looking for a job, around 40% believe that no work is available. Finally, 64% of them had never worked before.

5958CHAPTEr 3
LABOUR FORCE PARTICIPATION60

CHAPTEr 4EMPLOYMENT AND CHARACTERISTICS OF PALESTINIAN WORKERS
62 63CHAPTEr 4EMPLOYMENT AND CHARACTERISTICS OF PALESTINIAN WORKERS 61
CHAPTEr 4 EMPLOYMENT AND CHARACTERISTICS OF PALESTINIAN WORKERSLebanon’s economy is characterized by a dominance of micro and small enterprises. According to the latest available census of establishments published by the Central Administration of Statistics in 2004, 95% of enterprises in Lebanon employ less than 10 workers, and 91% less than 5. Medium-sized enterprises consisting of 20 to 49 workers represent no more than 1% of the total. Such a structure has several economic repercussions in terms of both growth potential and conditions of employment. The small size of establishments tends to generate low added value and low productivity, thus limiting the potential for growth and expansion of businesses. In fact, these enterprises generally have minimal horizontal and vertical integration and as such tend to dedicate themselves to simplistic and repetitive services to the end customer. Further than this still is the high prevalence of informality among these micro and small enterprises. These enterprises are subject to lower legal restrictions and little oversight due to the inability to enforce existing laws. This situation not only limits labour market opportunities, both in terms of demand and job opportunities in Lebanon, and also in terms of the quality of jobs available, which often lack any form of security and benefits.
Adding to this, Palestinians face even more hurdles and obstacles to decent employment. Unlike the situation in
Syrian Arab Republic and Jordan, where the law grants Palestinians the same social and economic rights as the two countries’ nationals, Lebanese law restricts the access of Palestinians to the labour market and debars them from engaging in several occupations, including liberal professions such as medicine, engineering and the law, on several grounds, one of which being the competition they represent to the Lebanese for jobs in this tight economy.
Based on the results of this survey, however, and the generally shared assumption that there are between 260,000 and 280,000 Palestinian refugees currently residing in Lebanon, the size of the Palestinian labour force in Lebanon would be around 110,000. This represents around 5% of the total labour force in Lebanon and less than 15% of the foreign labour force in Lebanon. These numbers reveal the deliberately exaggerated threat of Palestinian competition for Lebanese jobs and seriously undermines the justification for the discriminatory laws imposed on their participation in the only labour market they have access to under the present circumstances.
Within the context of a tight labour market made even tighter by the aforementioned legal restrictions, the Palestinian refugee population of Lebanon is characterized by low activity rates (as shown in the
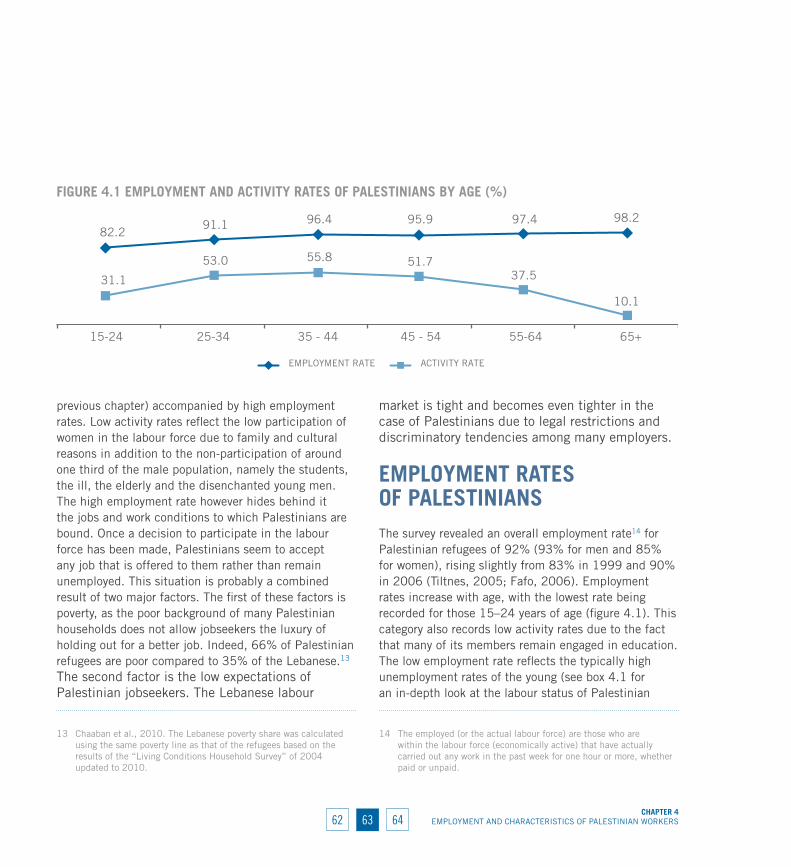
6362CHAPTEr 4
EMPLOYMENT AND CHARACTERISTICS OF PALESTINIAN WORKERS64
previous chapter) accompanied by high employment rates. Low activity rates reflect the low participation of women in the labour force due to family and cultural reasons in addition to the non-participation of around one third of the male population, namely the students, the ill, the elderly and the disenchanted young men. The high employment rate however hides behind it the jobs and work conditions to which Palestinians are bound. Once a decision to participate in the labour force has been made, Palestinians seem to accept any job that is offered to them rather than remain unemployed. This situation is probably a combined result of two major factors. The first of these factors is poverty, as the poor background of many Palestinian households does not allow jobseekers the luxury of holding out for a better job. Indeed, 66% of Palestinian refugees are poor compared to 35% of the Lebanese.13 The second factor is the low expectations of Palestinian jobseekers. The Lebanese labour
13 Chaaban et al., 2010. The Lebanese poverty share was calculated using the same poverty line as that of the refugees based on the results of the “Living Conditions Household Survey” of 2004 updated to 2010.
market is tight and becomes even tighter in the case of Palestinians due to legal restrictions and discriminatory tendencies among many employers.
EMPLOYMENT rATES OF PALESTINIANS The survey revealed an overall employment rate14 for Palestinian refugees of 92% (93% for men and 85% for women), rising slightly from 83% in 1999 and 90% in 2006 (Tiltnes, 2005; Fafo, 2006). Employment rates increase with age, with the lowest rate being recorded for those 15–24 years of age (figure 4.1). This category also records low activity rates due to the fact that many of its members remain engaged in education. The low employment rate reflects the typically high unemployment rates of the young (see box 4.1 for an in-depth look at the labour status of Palestinian
14 The employed (or the actual labour force) are those who are within the labour force (economically active) that have actually carried out any work in the past week for one hour or more, whether paid or unpaid.
FIGurE 4.1 EMPLOYMENT AND ACTIvITY rATES OF PALESTINIANS BY AGE (%)
82.291.1 96.4 95.9 97.4 98.2
31.1
53.0 55.8 51.737.5
10.1
15-24 25-34 35 - 44 45 - 54 55-64 65+
ACTIVITY RATEEMPLOYMENT RATE

64 65CHAPTEr 4EMPLOYMENT AND CHARACTERISTICS OF PALESTINIAN WORKERS 63
youths). The highest employment rates are witnessed in the oldest category, which may be explained by the fact that any elderly individuals who are not employed typically drop out of the labour force rather than look for work. The activity rate drops to 10% in the 65 and above age category.
A noteworthy finding is that, unlike activity rates, which increase with higher education, employment rates are inversely related to education, with the sharpest drop being registered once an individual acquires a university degree. In other words, university degree holders find it more difficult to secure adequate employment. Employment rates are highest for the illiterate (95%) and lowest for university degree holders (85%). This may also reflect the fact that those who are poorly educated are more likely to belong to very poor households and are therefore more likely to settle for any job available.
The picture becomes richer when activity rates are brought into the comparison. Unlike employment rates, activity rates increase with education, and the
activity rate for university graduates is almost fourfold the rate for the illiterate (figure 4.2). This contrast probably reflects the following two factors: (a) the illiterate as a group includes a large share of elderly and sick individuals; and (b) individuals who invest in a university degree are more likely to seek work in order to capitalize on their investment.
In conclusion, uneducated individuals are less likely to join the labour force but when they do they seem to settle for any job available. In contrast, highly educated Palestinians are more likely to be economically active but face difficulties in finding adequate employment.
CHArACTErISTICS OF PALESTINIAN wOrKErSThis section presents a relatively detailed overview of who the Palestinian workers of Lebanon are, including their demographic and social characteristics, the sectors and occupations they work in, and their work
FIGurE 4.2 EMPLOYMENT AND ACTIvITY rATES OF PALESTINIANS BY EDuCATION (%)
94.7 94.0 92.0 93.0 91.085.0
20.0
48.4 42.4 40.3 41.2 71.8
ACTIVITY RATEEMPLOYMENT RATE
ILLITERATE READ AND WRITE PRIMARY INTERMEDIATE SECONDARY UNIVERSITY
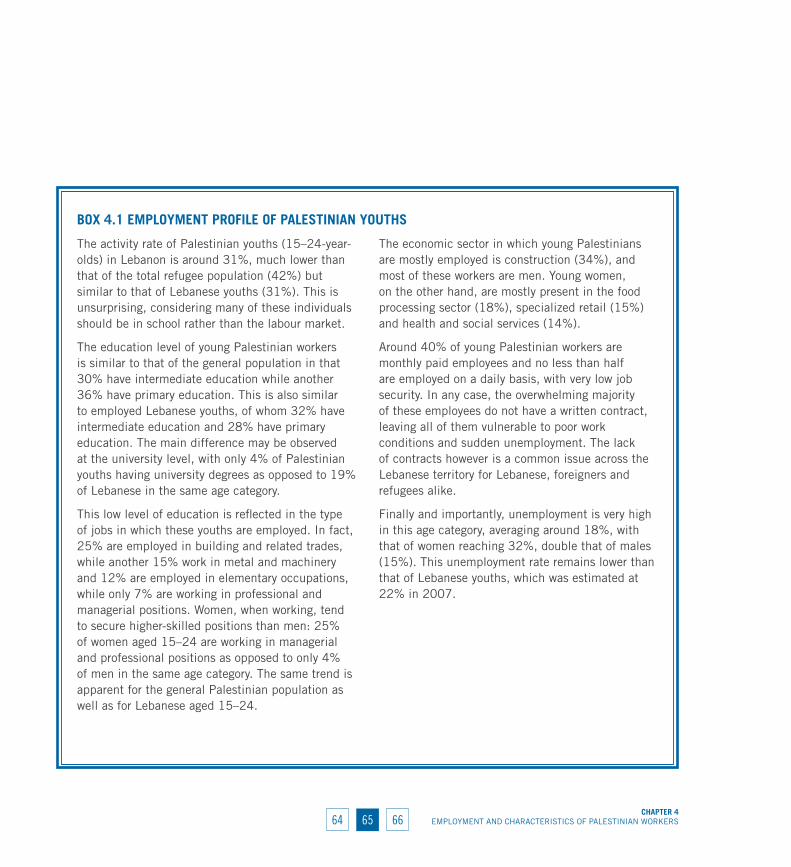
6564CHAPTEr 4
EMPLOYMENT AND CHARACTERISTICS OF PALESTINIAN WORKERS66
BOx 4.1 EMPLOYMENT PrOFILE OF PALESTINIAN YOuTHS
The activity rate of Palestinian youths (15–24-year-olds) in Lebanon is around 31%, much lower than that of the total refugee population (42%) but similar to that of Lebanese youths (31%). This is unsurprising, considering many of these individuals should be in school rather than the labour market.
The education level of young Palestinian workers is similar to that of the general population in that 30% have intermediate education while another 36% have primary education. This is also similar to employed Lebanese youths, of whom 32% have intermediate education and 28% have primary education. The main difference may be observed at the university level, with only 4% of Palestinian youths having university degrees as opposed to 19% of Lebanese in the same age category.
This low level of education is reflected in the type of jobs in which these youths are employed. In fact, 25% are employed in building and related trades, while another 15% work in metal and machinery and 12% are employed in elementary occupations, while only 7% are working in professional and managerial positions. Women, when working, tend to secure higher-skilled positions than men: 25% of women aged 15–24 are working in managerial and professional positions as opposed to only 4% of men in the same age category. The same trend is apparent for the general Palestinian population as well as for Lebanese aged 15–24.
The economic sector in which young Palestinians are mostly employed is construction (34%), and most of these workers are men. Young women, on the other hand, are mostly present in the food processing sector (18%), specialized retail (15%) and health and social services (14%).
Around 40% of young Palestinian workers are monthly paid employees and no less than half are employed on a daily basis, with very low job security. In any case, the overwhelming majority of these employees do not have a written contract, leaving all of them vulnerable to poor work conditions and sudden unemployment. The lack of contracts however is a common issue across the Lebanese territory for Lebanese, foreigners and refugees alike.
Finally and importantly, unemployment is very high in this age category, averaging around 18%, with that of women reaching 32%, double that of males (15%). This unemployment rate remains lower than that of Lebanese youths, which was estimated at 22% in 2007.
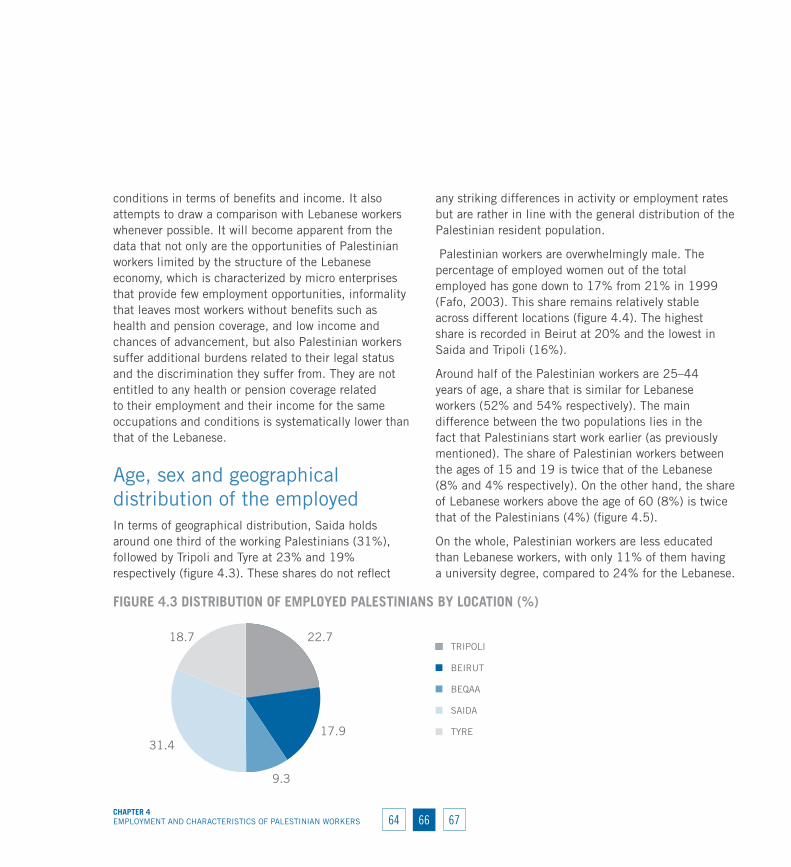
66 67CHAPTEr 4EMPLOYMENT AND CHARACTERISTICS OF PALESTINIAN WORKERS 64
conditions in terms of benefits and income. It also attempts to draw a comparison with Lebanese workers whenever possible. It will become apparent from the data that not only are the opportunities of Palestinian workers limited by the structure of the Lebanese economy, which is characterized by micro enterprises that provide few employment opportunities, informality that leaves most workers without benefits such as health and pension coverage, and low income and chances of advancement, but also Palestinian workers suffer additional burdens related to their legal status and the discrimination they suffer from. They are not entitled to any health or pension coverage related to their employment and their income for the same occupations and conditions is systematically lower than that of the Lebanese.
Age, sex and geographical distribution of the employed In terms of geographical distribution, Saida holds around one third of the working Palestinians (31%), followed by Tripoli and Tyre at 23% and 19% respectively (figure 4.3). These shares do not reflect
any striking differences in activity or employment rates but are rather in line with the general distribution of the Palestinian resident population.
Palestinian workers are overwhelmingly male. The percentage of employed women out of the total employed has gone down to 17% from 21% in 1999 (Fafo, 2003). This share remains relatively stable across different locations (figure 4.4). The highest share is recorded in Beirut at 20% and the lowest in Saida and Tripoli (16%).
Around half of the Palestinian workers are 25–44 years of age, a share that is similar for Lebanese workers (52% and 54% respectively). The main difference between the two populations lies in the fact that Palestinians start work earlier (as previously mentioned). The share of Palestinian workers between the ages of 15 and 19 is twice that of the Lebanese (8% and 4% respectively). On the other hand, the share of Lebanese workers above the age of 60 (8%) is twice that of the Palestinians (4%) (figure 4.5).
On the whole, Palestinian workers are less educated than Lebanese workers, with only 11% of them having a university degree, compared to 24% for the Lebanese.
FIGurE 4.3 DISTrIBuTION OF EMPLOYED PALESTINIANS BY LOCATION (%)
22.7
17.9
9.3
31.4
18.7TRIPOLI
BEIRUT
BEQAA
SAIDA
TYRE

6766CHAPTEr 4
EMPLOYMENT AND CHARACTERISTICS OF PALESTINIAN WORKERS68
Moreover, more than 60% have primary education or less. This of course reflects the trend present in the general population (see Chapters 1 and 2).
Across all locations, the share of university degree holders among female workers is almost double the share among male workers. This probably reflects the
higher participation of university-educated females in the labour force (figure 4.6).
Bekaa houses the best-educated workforce. This area records the lowest share of workers who are illiterate or can read and write (16%) and the highest share of university graduate workers (11%). Surprisingly,
FIGurE 4.4 SHArE OF EMPLOYED FEMALES BY LOCATION (%)
15.5
20.218.3
1617.7
TRIPOLI BEIRUT BEKAA SAIDA TYRE
FIGurE 4.5 DISTrIBuTION OF EMPLOYED PALESTINIANS AND LEBANESE BY AGE (%)
8
11.9
13.9
11.8 13
.4
13.4
12.1
6.9
4.6
2.1
1
1
3.9
11.8
15.6
14.7
12
10.5
9.8
7.3
5.5
4.4
2.4
2.1
15-19 20-24 25-29 30-34 35-39 40-44 45-49 50-54 55-59 60-64 65-69 70+
PALESTINIANS LEBANESE
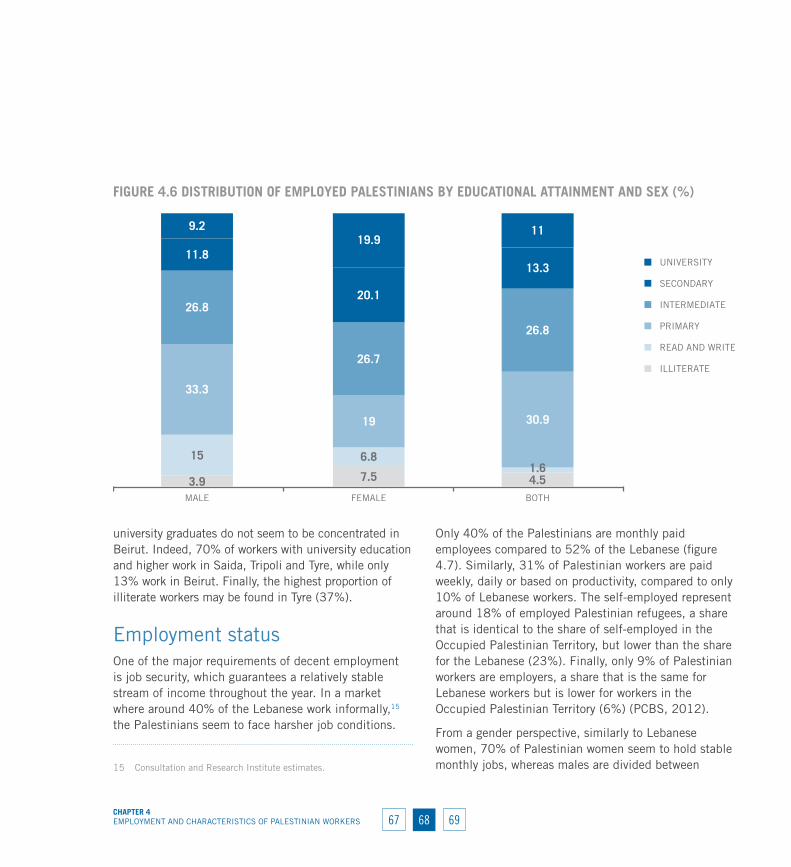
68 69CHAPTEr 4EMPLOYMENT AND CHARACTERISTICS OF PALESTINIAN WORKERS 67
university graduates do not seem to be concentrated in Beirut. Indeed, 70% of workers with university education and higher work in Saida, Tripoli and Tyre, while only 13% work in Beirut. Finally, the highest proportion of illiterate workers may be found in Tyre (37%).
Employment statusOne of the major requirements of decent employment is job security, which guarantees a relatively stable stream of income throughout the year. In a market where around 40% of the Lebanese work informally,15 the Palestinians seem to face harsher job conditions.
15 Consultation and Research Institute estimates.
Only 40% of the Palestinians are monthly paid employees compared to 52% of the Lebanese (figure 4.7). Similarly, 31% of Palestinian workers are paid weekly, daily or based on productivity, compared to only 10% of Lebanese workers. The self-employed represent around 18% of employed Palestinian refugees, a share that is identical to the share of self-employed in the Occupied Palestinian Territory, but lower than the share for the Lebanese (23%). Finally, only 9% of Palestinian workers are employers, a share that is the same for Lebanese workers but is lower for workers in the Occupied Palestinian Territory (6%) (PCBS, 2012).
From a gender perspective, similarly to Lebanese women, 70% of Palestinian women seem to hold stable monthly jobs, whereas males are divided between
FIGurE 4.6 DISTrIBuTION OF EMPLOYED PALESTINIANS BY EDuCATIONAL ATTAINMENT AND SEx (%)
20.1
3.9 7.5 4.5
15 6.81.6
33.3
19 30.9
26.8
26.7
26.8
11.813.3
9.219.9
11
MALE FEMALE BOTH
UNIVERSITY
SECONDARY
INTERMEDIATE
PRIMARY
READ AND WRITE
ILLITERATE
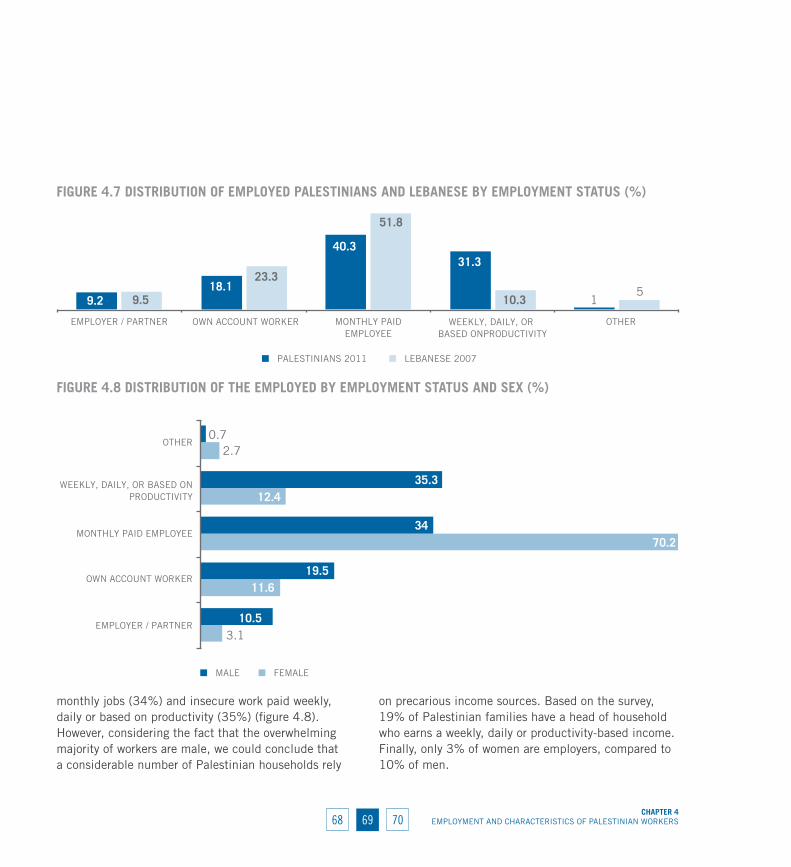
6968CHAPTEr 4
EMPLOYMENT AND CHARACTERISTICS OF PALESTINIAN WORKERS70
monthly jobs (34%) and insecure work paid weekly, daily or based on productivity (35%) (figure 4.8). However, considering the fact that the overwhelming majority of workers are male, we could conclude that a considerable number of Palestinian households rely
on precarious income sources. Based on the survey, 19% of Palestinian families have a head of household who earns a weekly, daily or productivity-based income.Finally, only 3% of women are employers, compared to 10% of men.
FIGurE 4.7 DISTrIBuTION OF EMPLOYED PALESTINIANS AND LEBANESE BY EMPLOYMENT STATuS (%)
9.218.1
40.331.3
19.5
23.3
51.8
10.35
EMPLOYER / PARTNER OWN ACCOUNT WORKER MONTHLY PAIDEMPLOYEE
WEEKLY, DAILY, OR BASED ONPRODUCTIVITY
OTHER
PALESTINIANS 2011 LEBANESE 2007
FIGurE 4.8 DISTrIBuTION OF THE EMPLOYED BY EMPLOYMENT STATuS AND SEx (%)
3.1
11.6
70.2
12.4
2.7
10.5
19.5
34
35.3
0.7
EMPLOYER / PARTNER
OWN ACCOUNT WORKER
MONTHLY PAID EMPLOYEE
WEEKLY, DAILY, OR BASED ONPRODUCTIVITY
OTHER
MALE FEMALE
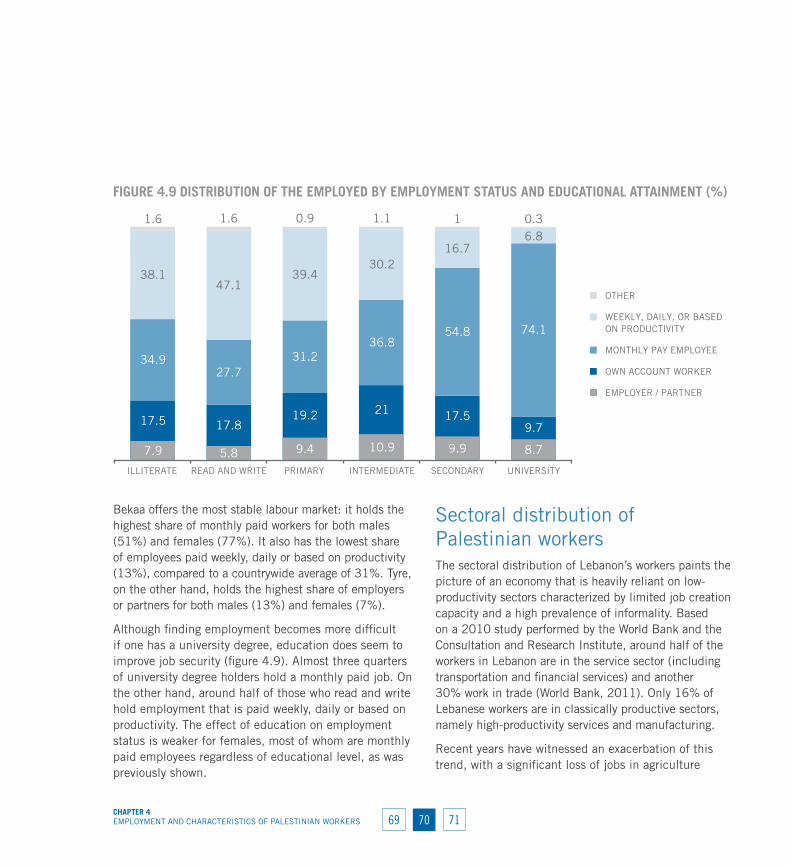
70 71CHAPTEr 4EMPLOYMENT AND CHARACTERISTICS OF PALESTINIAN WORKERS 69
Bekaa offers the most stable labour market: it holds the highest share of monthly paid workers for both males (51%) and females (77%). It also has the lowest share of employees paid weekly, daily or based on productivity (13%), compared to a countrywide average of 31%. Tyre, on the other hand, holds the highest share of employers or partners for both males (13%) and females (7%).
Although finding employment becomes more difficult if one has a university degree, education does seem to improve job security (figure 4.9). Almost three quarters of university degree holders hold a monthly paid job. On the other hand, around half of those who read and write hold employment that is paid weekly, daily or based on productivity. The effect of education on employment status is weaker for females, most of whom are monthly paid employees regardless of educational level, as was previously shown.
Sectoral distribution of Palestinian workersThe sectoral distribution of Lebanon’s workers paints the picture of an economy that is heavily reliant on low-productivity sectors characterized by limited job creation capacity and a high prevalence of informality. Based on a 2010 study performed by the World Bank and the Consultation and Research Institute, around half of the workers in Lebanon are in the service sector (including transportation and financial services) and another 30% work in trade (World Bank, 2011). Only 16% of Lebanese workers are in classically productive sectors, namely high-productivity services and manufacturing.
Recent years have witnessed an exacerbation of this trend, with a significant loss of jobs in agriculture
FIGurE 4.9 DISTrIBuTION OF THE EMPLOYED BY EMPLOYMENT STATuS AND EDuCATIONAL ATTAINMENT (%)
7.9 5.8 9.4 10.9 9.9 8.7
17.5 17.819.2 21 17.5
9.7
34.927.7
31.236.8
54.8 74.1
38.147.1
39.430.2
16.76.8
1.6 1.6 0.9 1.1 1 0.3
ILLITERATE READ AND WRITE PRIMARY INTERMEDIATE SECONDARY UNIVERSITY
OTHER
WEEKLY, DAILY, OR BASED ON PRODUCTIVITY
MONTHLY PAY EMPLOYEE
OWN ACCOUNT WORKER
EMPLOYER / PARTNER

7170CHAPTEr 4
EMPLOYMENT AND CHARACTERISTICS OF PALESTINIAN WORKERS72
and industry and a simultaneous increase of the employment share of trade and services. Over the past 40 years, the shares of the trade and service sectors grew by 10% and 8% respectively, at the expense of agriculture and industry, which decreased by 13% and 7% respectively. In terms of gender, a large majority of Lebanese women work in services (64%), whereas male employment is less concentrated and tends to be distributed across a number of sectors, including services (34%), trade (25%) and industry (15%).
As a result of the legal restrictions that prevent them from engaging in public sector occupations, Palestinians work overwhelmingly in the private sector, a fact that has changed little over time. The share of private sector workers has increased from 80% in 1999 (Fafo, 2003) to 86% in the present survey (figure 4.10). This increase is due to reduced employment in civil society organizations and private households. UNRWA and civil society organizations attract a larger share of females (20% compared to 6% of males). This may be the case because of the female-friendly environment offered by these organizations and the fact
that they place a higher focus on education and health, both sectors that attract women, especially those who hold university degrees.
Due to the nature of the Lebanese economy, 56% of Palestinian workers belong to two sectors only, namely construction (29%) and commerce (27%). A similar share of Lebanese workers is employed in commerce (23%); however, only 6% of Lebanese workers are in construction. Finally, only 2% of Palestinian workers are in the hotel and restaurant sector despite the fact that it is a booming sector in Lebanon (table 4.1).
Moreover, the sectoral distribution hides significant gender discrepancies. Thus, women are much more present in education, health, and other16 services, while construction and commerce are male dominated.
16 The category “other” includes the following services: finance and Insurance, electricity, gas and water services, as well as hairdressing, laundry, civil society, international organizations, trade unions, professional associations and political parties.
FIGurE 4.10 DISTrIBuTION OF THE EMPLOYED BY SECTOr (%)
1.1
85.5
3.5
3.8 4.61.5
PUBLIC SECTOR
PRIVATE SECTOR
CIVIL SOCIETY ORGANIZATIONS
POLITICAL PARTIES
UNRWA
OTHER

72 73CHAPTEr 4EMPLOYMENT AND CHARACTERISTICS OF PALESTINIAN WORKERS 71
The sectoral distribution remains relatively stable across the various locations with the single exception of agriculture, which takes up a share of 17% of workers in Tyre compared to an average of only 2% in other locations. The share of Palestinians working in agriculture has decreased from 11% in 1999 to 4% in the present survey.
University degree holders are mainly employed in “other services” in addition to the health and education sectors. In contrast, workers with low education or none at all tend to be employed in the commerce and construction sectors (figure 4.11).
TABLE 4.1 DISTrIBuTION OF THE EMPLOYED BY SECTOr AND SEx (%)
Male Female Both
Agriculture 4.5 2.3 4.1
Manufacturing 11.6 13.3 11.9
Construction 28.6 1.5 24.0
Commerce 27.3 19.3 25.9
Hotels and restaurants 2.4 0.6 2.1
Transport and storage 5.6 1.2 4.9
Education 1.6 16.4 4.2
Health 2.9 17.0 5.3
Other 15.5 28.3 17.7
Total 100.0 100.0 100.0
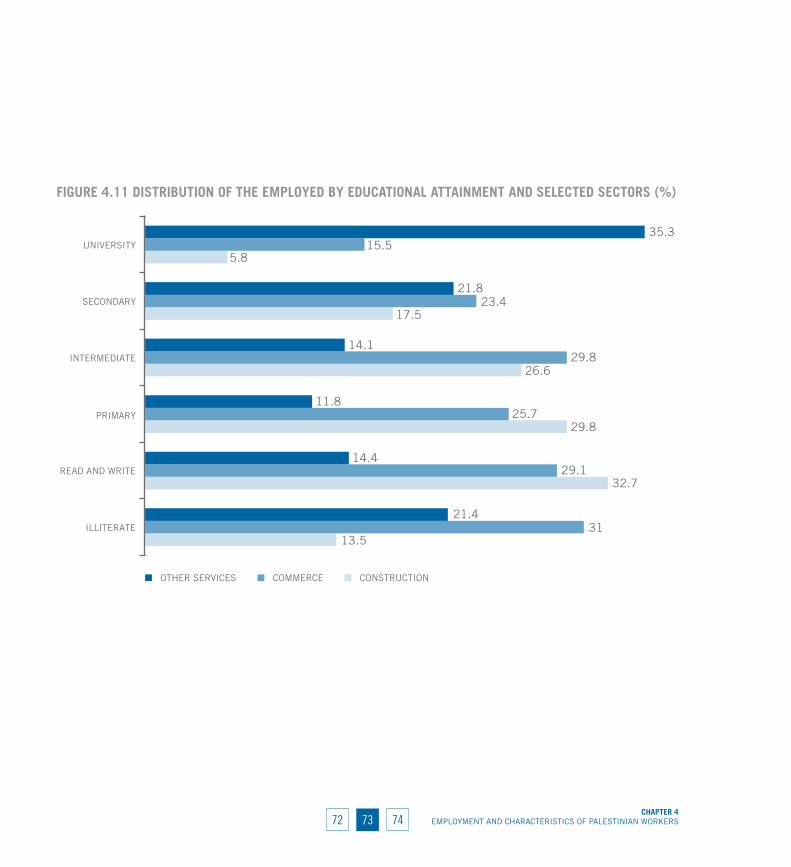
7372CHAPTEr 4
EMPLOYMENT AND CHARACTERISTICS OF PALESTINIAN WORKERS74
FIGurE 4.11 DISTrIBuTION OF THE EMPLOYED BY EDuCATIONAL ATTAINMENT AND SELECTED SECTOrS (%)
13.5
32.7
29.8
26.6
17.5
5.8
31
29.1
25.7
29.8
23.4
15.5
21.4
14.4
11.8
14.1
21.8
35.3
ILLITERATE
READ AND WRITE
PRIMARY
INTERMEDIATE
SECONDARY
UNIVERSITY
OTHER SERVICES COMMERCE CONSTRUCTION
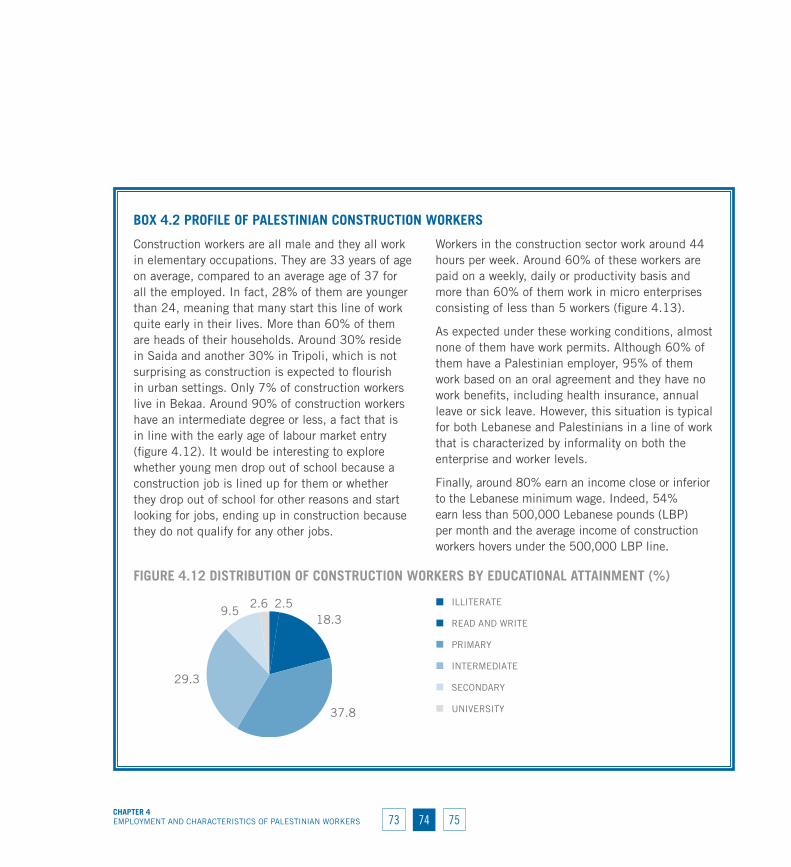
74 75CHAPTEr 4EMPLOYMENT AND CHARACTERISTICS OF PALESTINIAN WORKERS 73
BOx 4.2 PrOFILE OF PALESTINIAN CONSTruCTION wOrKErS
Construction workers are all male and they all work in elementary occupations. They are 33 years of age on average, compared to an average age of 37 for all the employed. In fact, 28% of them are younger than 24, meaning that many start this line of work quite early in their lives. More than 60% of them are heads of their households. Around 30% reside in Saida and another 30% in Tripoli, which is not surprising as construction is expected to flourish in urban settings. Only 7% of construction workers live in Bekaa. Around 90% of construction workers have an intermediate degree or less, a fact that is in line with the early age of labour market entry (figure 4.12). It would be interesting to explore whether young men drop out of school because a construction job is lined up for them or whether they drop out of school for other reasons and start looking for jobs, ending up in construction because they do not qualify for any other jobs.
Workers in the construction sector work around 44 hours per week. Around 60% of these workers are paid on a weekly, daily or productivity basis and more than 60% of them work in micro enterprises consisting of less than 5 workers (figure 4.13).
As expected under these working conditions, almost none of them have work permits. Although 60% of them have a Palestinian employer, 95% of them work based on an oral agreement and they have no work benefits, including health insurance, annual leave or sick leave. However, this situation is typical for both Lebanese and Palestinians in a line of work that is characterized by informality on both the enterprise and worker levels.
Finally, around 80% earn an income close or inferior to the Lebanese minimum wage. Indeed, 54% earn less than 500,000 Lebanese pounds (LBP) per month and the average income of construction workers hovers under the 500,000 LBP line.
FIGurE 4.12 DISTrIBuTION OF CONSTruCTION wOrKErS BY EDuCATIONAL ATTAINMENT (%)
2.518.3
37.8
29.3
9.52.6 ILLITERATE
READ AND WRITE
PRIMARY
INTERMEDIATE
SECONDARY
UNIVERSITY

7574CHAPTEr 4
EMPLOYMENT AND CHARACTERISTICS OF PALESTINIAN WORKERS76
FIGurE 4.13 DISTrIBuTION OF CONSTruCTION wOrKErS BY EMPLOYMENT STATuS (%)
11
13.6
18.3
56.6
0.6
EMPLOYER / PARTNER
OWN ACCOUNT WORKER
MONTHLY PAID EMPLOYEE
WEEKLY, DAILY, OR BASEDON PRODUCTIVITY
OTHER

76 77CHAPTEr 4EMPLOYMENT AND CHARACTERISTICS OF PALESTINIAN WORKERS 75
BOx 4.3 PrOFILE OF PALESTINIAN wOrKErS IN COMMErCE
Commerce workers are overwhelmingly male, with the male to female ratio closely resembling the ratio in the general employed population. Their average age is 38, and their age distribution is again close to that of the employed population. Around 65% of them are heads of households, compared to 60% for all the employed. One quarter live in Tripoli and another 30% in Saida, a distribution that is similar to the geographical distribution of the employed in general, with the exception of Tyre, which houses only 13% of commerce workers compared to 19% of all workers. Half have not exceeded the primary level in their education and 82% have not exceeded the intermediate level (figure 4.14).
Commerce may be subdivided into six subsectors, which may hide discrepancies in terms of demographics and work conditions. These subsectors are repair of motor vehicles, repair of household goods, wholesale, unspecialized retail, specialized retail, and non-store retail. The distribution of commerce workers across these subsectors is shown in figure 4.15. Specialized retail (retail that focuses on one category of goods, such as clothing) takes up the highest share, followed by unspecialized retail (for example diverse groceries) and repair of motor vehicles.
The demographic profile varies across the various
subsectors. Thus, the average age ranges from 34 for motor vehicle repairers to 41 for wholesale, unspecialized retail, and non-store retail workers. The share of females is highest in specialized and unspecialized retail (21% and 17% respectively). There are no significant differences in the educational achievement of the various subpopulations. One fifth of unspecialized retail workers have a structure attached to their home.
As for enterprise size, while 82% of commerce establishments have less than 5 employees, 40% of wholesale establishments exceed 5 workers per establishment and 20% exceed 15 workers per establishment. Repair of household goods and repair of motor vehicles come next, with 23% and 21% (respectively) of establishments exceeding 5 workers (figure 4.16).
Larger establishments imply a larger share of employees as opposed to employers or self-employed individuals. This is indeed the case in the wholesale and vehicle repair subsectors, in which more than 65% of workers are salaried employees (figure 4.17). In contrast, more than half the workers in non-store retail are own account workers. Indeed, non-store retail workers seem to be in the most precarious economic situation: 80% of them
FIGurE 4.14 DISTrIBuTION OF COMMErCE wOrKErS BY EDuCATIONAL ATTAINMENT (%)
5.3
15.2
30.5
30.6
11.9
6.6
ILLITERATE
READ AND WRITE
PRIMARY
INTERMEDIATE
SECONDARY
UNIVERSITY
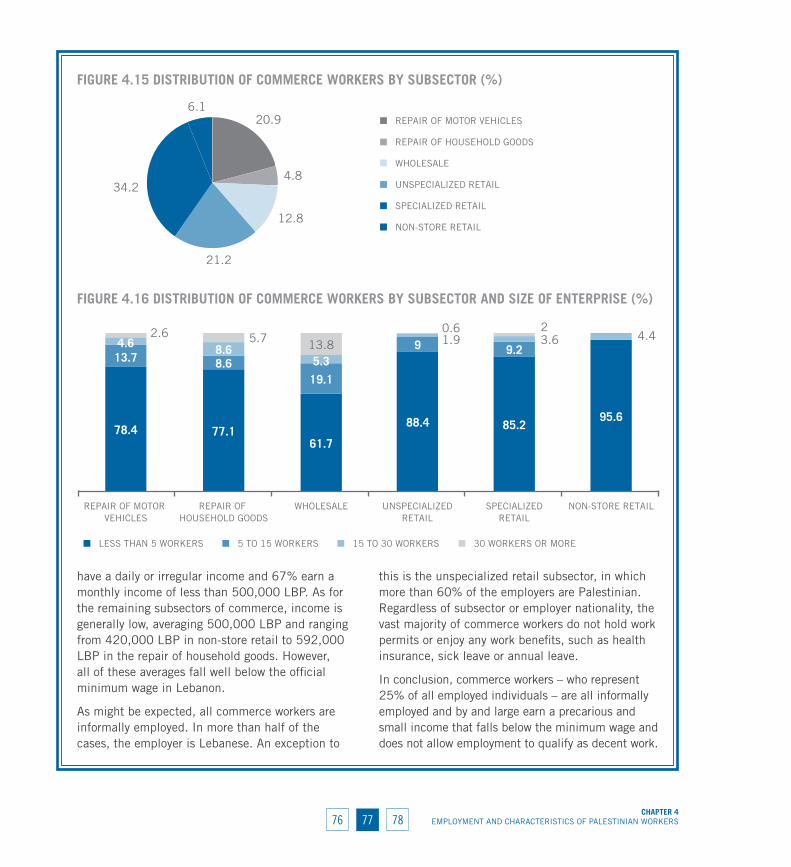
7776CHAPTEr 4
EMPLOYMENT AND CHARACTERISTICS OF PALESTINIAN WORKERS78
have a daily or irregular income and 67% earn a monthly income of less than 500,000 LBP. As for the remaining subsectors of commerce, income is generally low, averaging 500,000 LBP and ranging from 420,000 LBP in non-store retail to 592,000 LBP in the repair of household goods. However, all of these averages fall well below the official minimum wage in Lebanon.
As might be expected, all commerce workers are informally employed. In more than half of the cases, the employer is Lebanese. An exception to
this is the unspecialized retail subsector, in which more than 60% of the employers are Palestinian. Regardless of subsector or employer nationality, the vast majority of commerce workers do not hold work permits or enjoy any work benefits, such as health insurance, sick leave or annual leave.
In conclusion, commerce workers – who represent 25% of all employed individuals – are all informally employed and by and large earn a precarious and small income that falls below the minimum wage and does not allow employment to qualify as decent work.
FIGurE 4.15 DISTrIBuTION OF COMMErCE wOrKErS BY SuBSECTOr (%)
20.9
4.8
12.8
21.2
34.2
6.1REPAIR OF MOTOR VEHICLES
REPAIR OF HOUSEHOLD GOODS
WHOLESALE
UNSPECIALIZED RETAIL
SPECIALIZED RETAIL
NON-STORE RETAIL
FIGurE 4.16 DISTrIBuTION OF COMMErCE wOrKErS BY SuBSECTOr AND SIzE OF ENTErPrISE (%)
78.4 77.161.7
88.4 85.2 95.6
13.7 8.619.1
9 9.2 4.6 8.65.3
1.9 3.6 4.42.6 5.7 13.8 0.6 2
REPAIR OF MOTOR VEHICLES
REPAIR OF HOUSEHOLD GOODS
WHOLESALE UNSPECIALIZEDRETAIL
SPECIALIZEDRETAIL
NON-STORE RETAIL
LESS THAN 5 WORKERS 5 TO 15 WORKERS 30 WORKERS OR MORE15 TO 30 WORKERS
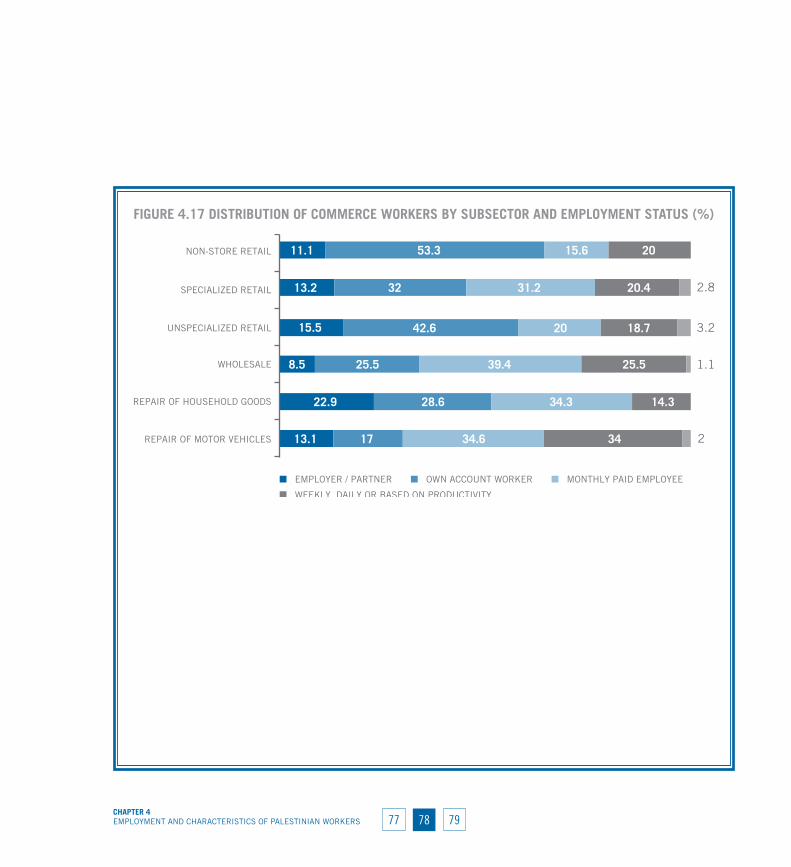
78 79CHAPTEr 4EMPLOYMENT AND CHARACTERISTICS OF PALESTINIAN WORKERS 77
FIGurE 4.17 DISTrIBuTION OF COMMErCE wOrKErS BY SuBSECTOr AND EMPLOYMENT STATuS (%)
13.1
22.9
8.5
15.5
13.2
11.1
17
28.6
25.5
42.6
32
53.3
34.6
34.3
39.4
20
31.2
15.6
34
14.3
25.5
18.7
20.4
20
2
1.1
3.2
2.8
REPAIR OF MOTOR VEHICLES
REPAIR OF HOUSEHOLD GOODS
WHOLESALE
UNSPECIALIZED RETAIL
SPECIALIZED RETAIL
NON-STORE RETAIL
EMPLOYER / PARTNER OWN ACCOUNT WORKER
WEEKLY, DAILY OR BASED ON PRODUCTIVITY
MONTHLY PAID EMPLOYEE
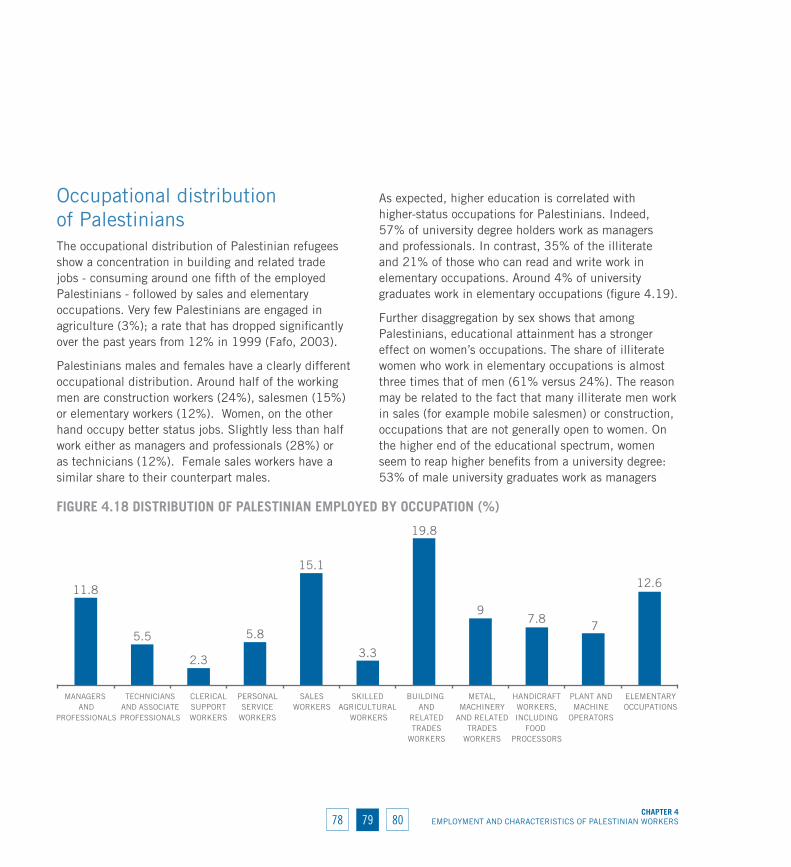
7978CHAPTEr 4
EMPLOYMENT AND CHARACTERISTICS OF PALESTINIAN WORKERS80
Occupational distribution of PalestiniansThe occupational distribution of Palestinian refugees show a concentration in building and related trade jobs - consuming around one fifth of the employed Palestinians - followed by sales and elementary occupations. Very few Palestinians are engaged in agriculture (3%); a rate that has dropped significantly over the past years from 12% in 1999 (Fafo, 2003).
Palestinians males and females have a clearly different occupational distribution. Around half of the working men are construction workers (24%), salesmen (15%) or elementary workers (12%). Women, on the other hand occupy better status jobs. Slightly less than half work either as managers and professionals (28%) or as technicians (12%). Female sales workers have a similar share to their counterpart males.
As expected, higher education is correlated with higher-status occupations for Palestinians. Indeed, 57% of university degree holders work as managers and professionals. In contrast, 35% of the illiterate and 21% of those who can read and write work in elementary occupations. Around 4% of university graduates work in elementary occupations (figure 4.19).
Further disaggregation by sex shows that among Palestinians, educational attainment has a stronger effect on women’s occupations. The share of illiterate women who work in elementary occupations is almost three times that of men (61% versus 24%). The reason may be related to the fact that many illiterate men work in sales (for example mobile salesmen) or construction, occupations that are not generally open to women. On the higher end of the educational spectrum, women seem to reap higher benefits from a university degree: 53% of male university graduates work as managers
FIGurE 4.18 DISTrIBuTION OF PALESTINIAN EMPLOYED BY OCCuPATION (%)
11.8
5.5
2.3
5.8
15.1
3.3
19.8
97.8
7
12.6
MANAGERS AND
PROFESSIONALS
TECHNICIANSAND ASSOCIATEPROFESSIONALS
CLERICALSUPPORTWORKERS
PERSONALSERVICE
WORKERS
SALESWORKERS
BUILDING AND
RELATEDTRADES
WORKERS
SKILLED AGRICULTURAL
WORKERS
METAL,MACHINERY
AND RELATEDTRADES
WORKERS
HANDICRAFTWORKERS,INCLUDING
FOOD PROCESSORS
PLANT ANDMACHINE
OPERATORS
ELEMENTARYOCCUPATIONS

80 81CHAPTEr 4EMPLOYMENT AND CHARACTERISTICS OF PALESTINIAN WORKERS 79
and professionals, compared to 67% of female university graduates.
Some variations are found in the geographical distribution of occupations. Thus, managers and professionals tend to be more concentrated in Bekaa (22% versus a national average of 12%) and skilled agricultural workers have a higher presence in Tyre (15% versus a national average of 3%).
When gender is brought into the mix, the advantage of Bekaa in terms of the share of managers and professionals crosses gender lines. Indeed, 18% of men and 40% of women in Bekaa work as managers and professionals, compared to countrywide shares of 8% and 28% respectively. Similarly, the higher prevalence of agricultural work in Tyre does not seem to be restricted to one sex: 16% of men and 9% of women work in skilled agricultural occupations versus national shares of 4% and 2% respectively.
TABLE 4.2 DISTrIBuTION OF PALESTINIAN EMPLOYED BY OCCuPATION AND SEx (%)
Male Female
Managers and professionals 8.4 28.3
Technicians and associate professionals 4.1 12.2
Clerical support workers 1.1 8.1
Personal service workers 6.1 4.1
Sales workers 14.7 17.1
Skilled agricultural workers 3.6 2.1
Building and related trades workers 23.8 0.6
Metal, machinery and related trades workers 10.7 0.8
Handicraft workers, including food processors 7.5 8.9
Plant and machine operators 8.3 1.2
Elementary occupations 11.8 16.5
Total 100.0 100.0
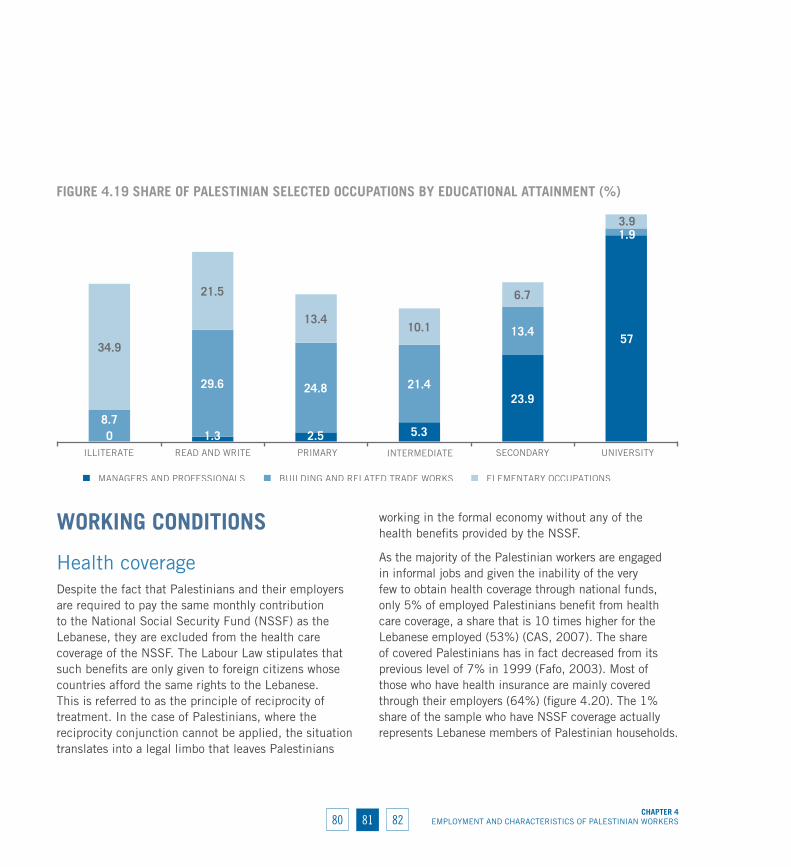
8180CHAPTEr 4
EMPLOYMENT AND CHARACTERISTICS OF PALESTINIAN WORKERS82
wOrKING CONDITIONS
Health coverageDespite the fact that Palestinians and their employers are required to pay the same monthly contribution to the National Social Security Fund (NSSF) as the Lebanese, they are excluded from the health care coverage of the NSSF. The Labour Law stipulates that such benefits are only given to foreign citizens whose countries afford the same rights to the Lebanese. This is referred to as the principle of reciprocity of treatment. In the case of Palestinians, where the reciprocity conjunction cannot be applied, the situation translates into a legal limbo that leaves Palestinians
working in the formal economy without any of the health benefits provided by the NSSF.
As the majority of the Palestinian workers are engaged in informal jobs and given the inability of the very few to obtain health coverage through national funds, only 5% of employed Palestinians benefit from health care coverage, a share that is 10 times higher for the Lebanese employed (53%) (CAS, 2007). The share of covered Palestinians has in fact decreased from its previous level of 7% in 1999 (Fafo, 2003). Most of those who have health insurance are mainly covered through their employers (64%) (figure 4.20). The 1% share of the sample who have NSSF coverage actually represents Lebanese members of Palestinian households.
FIGurE 4.19 SHArE OF PALESTINIAN SELECTED OCCuPATIONS BY EDuCATIONAL ATTAINMENT (%)
0 1.3 2.5 5.3
23.9
57
8.7
29.6 24.8 21.4
13.4
1.9
34.9
21.5
13.410.1
6.7
3.9
ILLITERATE READ AND WRITE PRIMARY INTERMEDIATE SECONDARY UNIVERSITY
MANAGERS AND PROFESSIONALS BUILDING AND RELATED TRADE WORKS ELEMENTARY OCCUPATIONS
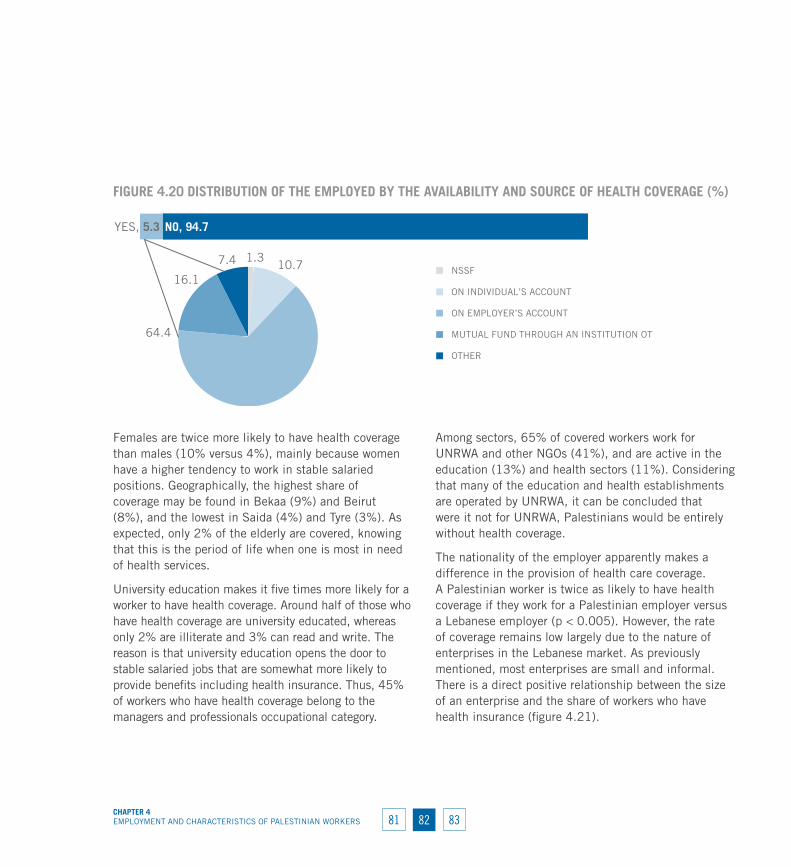
82 83CHAPTEr 4EMPLOYMENT AND CHARACTERISTICS OF PALESTINIAN WORKERS 81
Females are twice more likely to have health coverage than males (10% versus 4%), mainly because women have a higher tendency to work in stable salaried positions. Geographically, the highest share of coverage may be found in Bekaa (9%) and Beirut (8%), and the lowest in Saida (4%) and Tyre (3%). As expected, only 2% of the elderly are covered, knowing that this is the period of life when one is most in need of health services.
University education makes it five times more likely for a worker to have health coverage. Around half of those who have health coverage are university educated, whereas only 2% are illiterate and 3% can read and write. The reason is that university education opens the door to stable salaried jobs that are somewhat more likely to provide benefits including health insurance. Thus, 45% of workers who have health coverage belong to the managers and professionals occupational category.
Among sectors, 65% of covered workers work for UNRWA and other NGOs (41%), and are active in the education (13%) and health sectors (11%). Considering that many of the education and health establishments are operated by UNRWA, it can be concluded that were it not for UNRWA, Palestinians would be entirely without health coverage.
The nationality of the employer apparently makes a difference in the provision of health care coverage. A Palestinian worker is twice as likely to have health coverage if they work for a Palestinian employer versus a Lebanese employer (p < 0.005). However, the rate of coverage remains low largely due to the nature of enterprises in the Lebanese market. As previously mentioned, most enterprises are small and informal. There is a direct positive relationship between the size of an enterprise and the share of workers who have health insurance (figure 4.21).
FIGurE 4.20 DISTrIBuTION OF THE EMPLOYED BY THE AvAILABILITY AND SOurCE OF HEALTH COvErAGE (%)
YES, 5.3 NO, 94.7
1.310.7
64.4
16.1
7.4NSSF
ON INDIVIDUAL’S ACCOUNT
ON EMPLOYER’S ACCOUNT
MUTUAL FUND THROUGH AN INSTITUTION OT UNION
OTHER
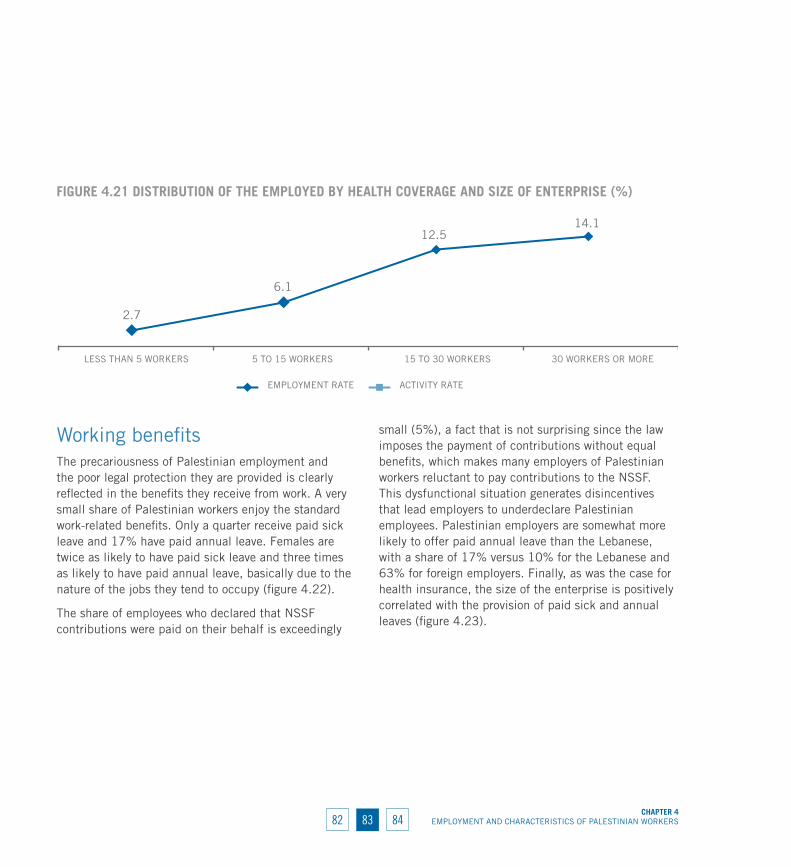
8382CHAPTEr 4
EMPLOYMENT AND CHARACTERISTICS OF PALESTINIAN WORKERS84
Working benefitsThe precariousness of Palestinian employment and the poor legal protection they are provided is clearly reflected in the benefits they receive from work. A very small share of Palestinian workers enjoy the standard work-related benefits. Only a quarter receive paid sick leave and 17% have paid annual leave. Females are twice as likely to have paid sick leave and three times as likely to have paid annual leave, basically due to the nature of the jobs they tend to occupy (figure 4.22).
The share of employees who declared that NSSF contributions were paid on their behalf is exceedingly
small (5%), a fact that is not surprising since the law imposes the payment of contributions without equal benefits, which makes many employers of Palestinian workers reluctant to pay contributions to the NSSF. This dysfunctional situation generates disincentives that lead employers to underdeclare Palestinian employees. Palestinian employers are somewhat more likely to offer paid annual leave than the Lebanese, with a share of 17% versus 10% for the Lebanese and 63% for foreign employers. Finally, as was the case for health insurance, the size of the enterprise is positively correlated with the provision of paid sick and annual leaves (figure 4.23).
FIGurE 4.21 DISTrIBuTION OF THE EMPLOYED BY HEALTH COvErAGE AND SIzE OF ENTErPrISE (%)
2.7
6.1
12.514.1
LESS THAN 5 WORKERS 5 TO 15 WORKERS 15 TO 30 WORKERS 30 WORKERS OR MORE
ACTIVITY RATEEMPLOYMENT RATE
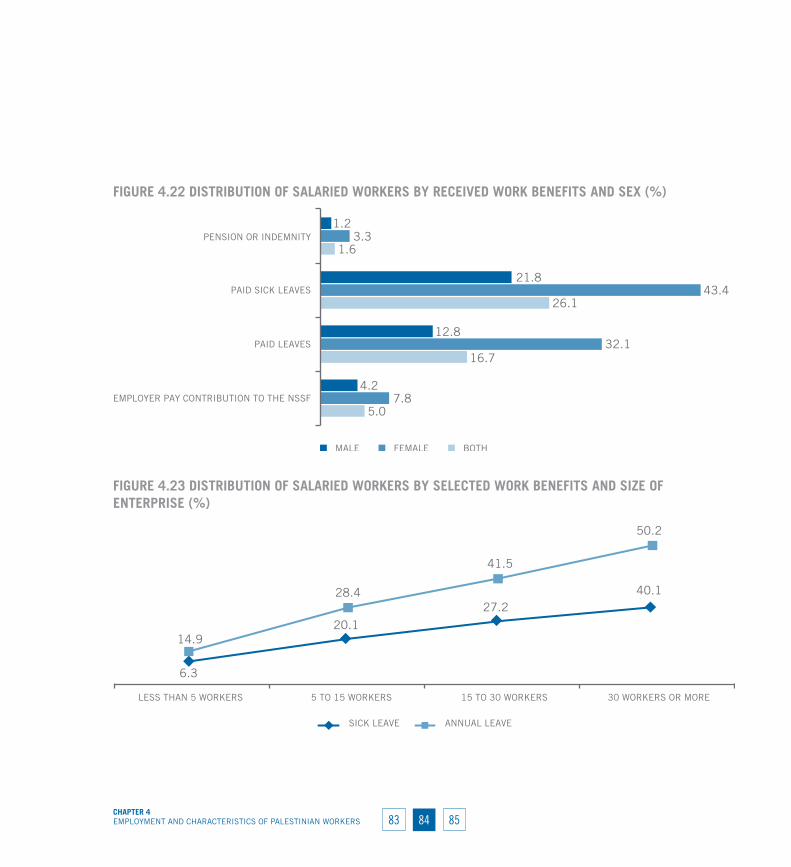
84 85CHAPTEr 4EMPLOYMENT AND CHARACTERISTICS OF PALESTINIAN WORKERS 83
FIGurE 4.22 DISTrIBuTION OF SALArIED wOrKErS BY rECEIvED wOrK BENEFITS AND SEx (%)
5.0
16.7
26.1
1.6
7.8
32.1
43.4
3.3
4.2
12.8
21.8
1.2
EMPLOYER PAY CONTRIBUTION TO THE NSSF
PAID LEAVES
PAID SICK LEAVES
PENSION OR INDEMNITY
MALE FEMALE BOTH
FIGurE 4.23 DISTrIBuTION OF SALArIED wOrKErS BY SELECTED wOrK BENEFITS AND SIzE OF ENTErPrISE (%)
14.9
28.4
41.5
50.2
6.3
20.1
27.240.1
LESS THAN 5 WORKERS 5 TO 15 WORKERS 15 TO 30 WORKERS 30 WORKERS OR MORE
ANNUAL LEAVESICK LEAVE
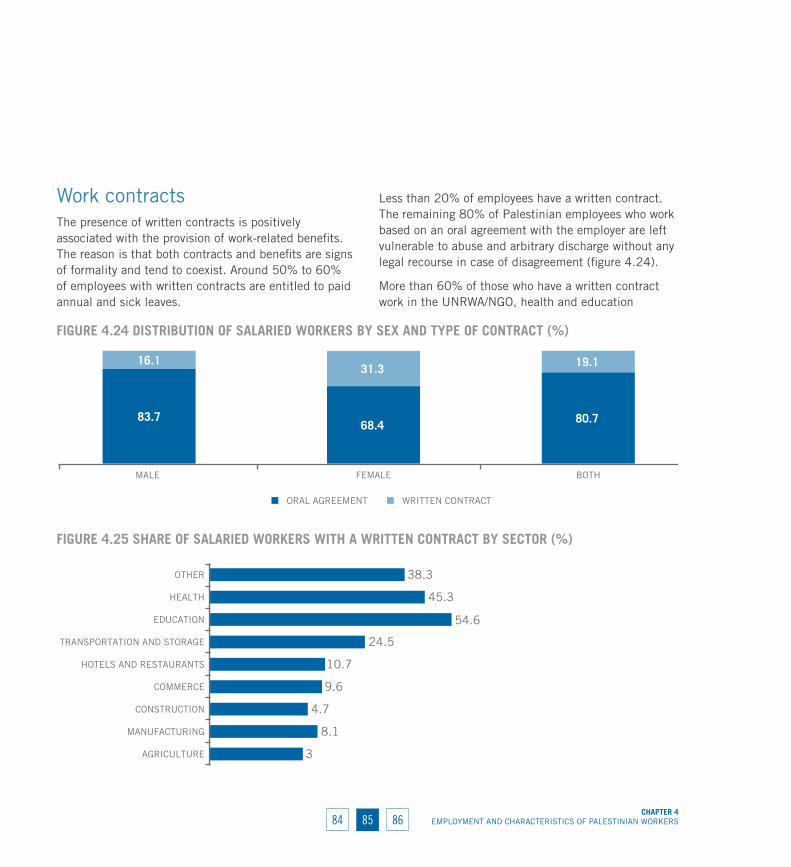
8584CHAPTEr 4
EMPLOYMENT AND CHARACTERISTICS OF PALESTINIAN WORKERS86
Work contractsThe presence of written contracts is positively associated with the provision of work-related benefits. The reason is that both contracts and benefits are signs of formality and tend to coexist. Around 50% to 60% of employees with written contracts are entitled to paid annual and sick leaves.
Less than 20% of employees have a written contract. The remaining 80% of Palestinian employees who work based on an oral agreement with the employer are left vulnerable to abuse and arbitrary discharge without any legal recourse in case of disagreement (figure 4.24).
More than 60% of those who have a written contract work in the UNRWA/NGO, health and education
FIGurE 4.24 DISTrIBuTION OF SALArIED wOrKErS BY SEx AND TYPE OF CONTrACT (%)
83.768.4 80.7
16.131.3 19.1
MALE FEMALE BOTH
ORAL AGREEMENT WRITTEN CONTRACT
FIGurE 4.25 SHArE OF SALArIED wOrKErS wITH A wrITTEN CONTrACT BY SECTOr (%)
3
8.1
4.7
9.6
10.7
24.5
54.6
45.3
38.3
AGRICULTURE
MANUFACTURING
CONSTRUCTION
COMMERCE
HOTELS AND RESTAURANTS
TRANSPORTATION AND STORAGE
EDUCATION
HEALTH
OTHER

86 87CHAPTEr 4EMPLOYMENT AND CHARACTERISTICS OF PALESTINIAN WORKERS 85
sectors. These are the sectors with the highest degree of formality. Female workers are twice as likely to have written contracts because of their concentrated presence in these three sectors (figure 4.25).
The likelihood of having a written contract is equally low for both workers of Palestinian and Lebanese employers and significantly higher in the case of foreign employers. The share of workers with a written contract is 11% for Palestinian workers working for a Lebanese
employer, 16% for those working for a Palestinian employer, and 65% for foreign employers.
Job security is another facet of decent work conditions without which employees and their families cannot make long-term plans, having to worry constantly about finding the next job. A significant share of Palestinian employees work on a daily basis (38%) and another 6% work based on short-term agreements spanning a period of one to six months (figure 4.26).
FIGurE 4.27 SHArE OF SALArIED wOrKErS wITH A DAILY AGrEEMENT BY LOCATION (%)
73.9
20.2
7.8
35.5 31.1
TRIPOLI BEIRUT BEKAA SAIDA TYRE
FIGurE 4.26 DISTrIBuTION OF SALArIED wOrKErS BY DurATION OF CONTrACT AND SEx (%)
41.422.2
37.6
6.9
6.9
7.0
51.370.7
55.2
DAILY LESS THAN 1 MONTH - LESS THAN 12 MONTHS CONSTRUCTION
MALE FEMALE BOTH
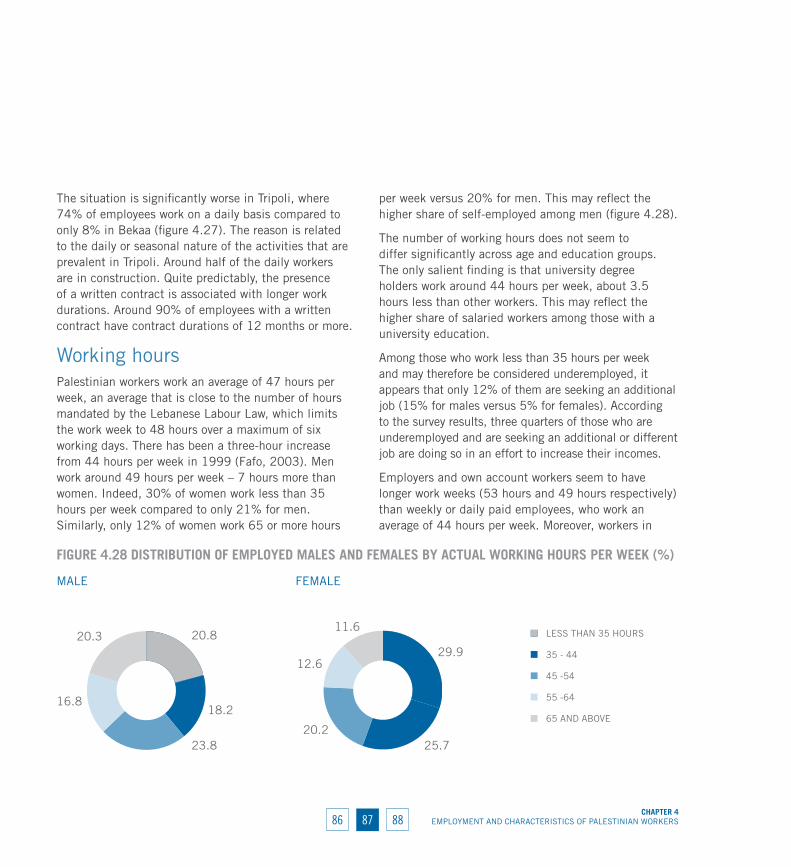
8786CHAPTEr 4
EMPLOYMENT AND CHARACTERISTICS OF PALESTINIAN WORKERS88
The situation is significantly worse in Tripoli, where 74% of employees work on a daily basis compared to only 8% in Bekaa (figure 4.27). The reason is related to the daily or seasonal nature of the activities that are prevalent in Tripoli. Around half of the daily workers are in construction. Quite predictably, the presence of a written contract is associated with longer work durations. Around 90% of employees with a written contract have contract durations of 12 months or more.
Working hoursPalestinian workers work an average of 47 hours per week, an average that is close to the number of hours mandated by the Lebanese Labour Law, which limits the work week to 48 hours over a maximum of six working days. There has been a three-hour increase from 44 hours per week in 1999 (Fafo, 2003). Men work around 49 hours per week – 7 hours more than women. Indeed, 30% of women work less than 35 hours per week compared to only 21% for men. Similarly, only 12% of women work 65 or more hours
per week versus 20% for men. This may reflect the higher share of self-employed among men (figure 4.28).
The number of working hours does not seem to differ significantly across age and education groups. The only salient finding is that university degree holders work around 44 hours per week, about 3.5 hours less than other workers. This may reflect the higher share of salaried workers among those with a university education.
Among those who work less than 35 hours per week and may therefore be considered underemployed, it appears that only 12% of them are seeking an additional job (15% for males versus 5% for females). According to the survey results, three quarters of those who are underemployed and are seeking an additional or different job are doing so in an effort to increase their incomes.
Employers and own account workers seem to have longer work weeks (53 hours and 49 hours respectively) than weekly or daily paid employees, who work an average of 44 hours per week. Moreover, workers in
FIGurE 4.28 DISTrIBuTION OF EMPLOYED MALES AND FEMALES BY ACTuAL wOrKING HOurS PEr wEEK (%)
20.8
18.2
23.8
16.8
20.329.9
25.720.2
12.6
11.6LESS THAN 35 HOURS
35 - 44
45 -54
55 -64
65 AND ABOVE
MALE FEMALE
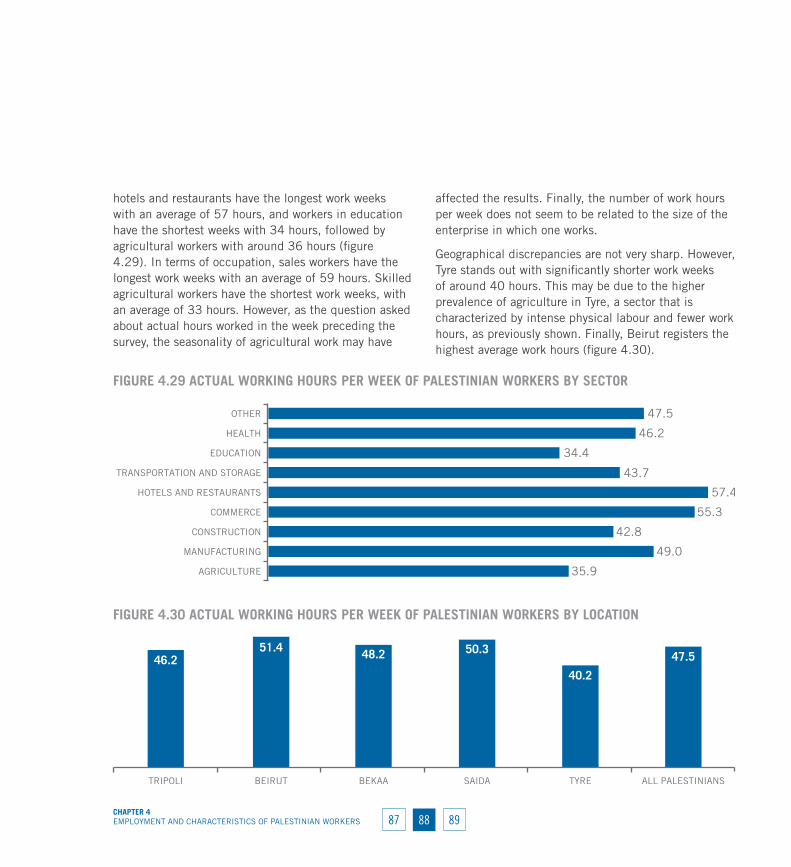
88 89CHAPTEr 4EMPLOYMENT AND CHARACTERISTICS OF PALESTINIAN WORKERS 87
hotels and restaurants have the longest work weeks with an average of 57 hours, and workers in education have the shortest weeks with 34 hours, followed by agricultural workers with around 36 hours (figure 4.29). In terms of occupation, sales workers have the longest work weeks with an average of 59 hours. Skilled agricultural workers have the shortest work weeks, with an average of 33 hours. However, as the question asked about actual hours worked in the week preceding the survey, the seasonality of agricultural work may have
affected the results. Finally, the number of work hours per week does not seem to be related to the size of the enterprise in which one works.
Geographical discrepancies are not very sharp. However, Tyre stands out with significantly shorter work weeks of around 40 hours. This may be due to the higher prevalence of agriculture in Tyre, a sector that is characterized by intense physical labour and fewer work hours, as previously shown. Finally, Beirut registers the highest average work hours (figure 4.30).
FIGurE 4.30 ACTuAL wOrKING HOurS PEr wEEK OF PALESTINIAN wOrKErS BY LOCATION
46.251.4 48.2 50.3
40.2
47.5
TRIPOLI BEIRUT BEKAA SAIDA TYRE ALL PALESTINIANS
FIGurE 4.29 ACTuAL wOrKING HOurS PEr wEEK OF PALESTINIAN wOrKErS BY SECTOr
35.9
49.0
42.8
55.3
57.4
43.7
34.4
46.2
47.5
AGRICULTURE
MANUFACTURING
CONSTRUCTION
COMMERCE
HOTELS AND RESTAURANTS
TRANSPORTATION AND STORAGE
EDUCATION
HEALTH
OTHER
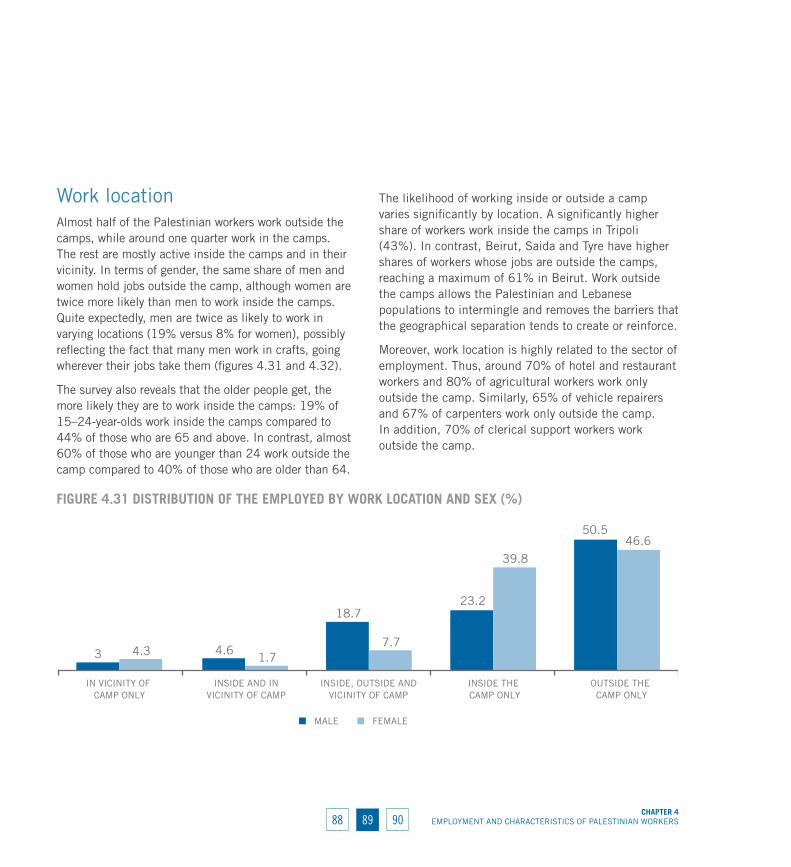
8988CHAPTEr 4
EMPLOYMENT AND CHARACTERISTICS OF PALESTINIAN WORKERS90
Work locationAlmost half of the Palestinian workers work outside the camps, while around one quarter work in the camps. The rest are mostly active inside the camps and in their vicinity. In terms of gender, the same share of men and women hold jobs outside the camp, although women are twice more likely than men to work inside the camps. Quite expectedly, men are twice as likely to work in varying locations (19% versus 8% for women), possibly reflecting the fact that many men work in crafts, going wherever their jobs take them (figures 4.31 and 4.32).
The survey also reveals that the older people get, the more likely they are to work inside the camps: 19% of 15–24-year-olds work inside the camps compared to 44% of those who are 65 and above. In contrast, almost 60% of those who are younger than 24 work outside the camp compared to 40% of those who are older than 64.
The likelihood of working inside or outside a camp varies significantly by location. A significantly higher share of workers work inside the camps in Tripoli (43%). In contrast, Beirut, Saida and Tyre have higher shares of workers whose jobs are outside the camps, reaching a maximum of 61% in Beirut. Work outside the camps allows the Palestinian and Lebanese populations to intermingle and removes the barriers that the geographical separation tends to create or reinforce.
Moreover, work location is highly related to the sector of employment. Thus, around 70% of hotel and restaurant workers and 80% of agricultural workers work only outside the camp. Similarly, 65% of vehicle repairers and 67% of carpenters work only outside the camp. In addition, 70% of clerical support workers work outside the camp.
FIGurE 4.31 DISTrIBuTION OF THE EMPLOYED BY wOrK LOCATION AND SEx (%)
3 4.6
18.723.2
50.5
4.3 1.77.7
39.8
46.6
IN VICINITY OF CAMP ONLY
INSIDE AND INVICINITY OF CAMP
INSIDE, OUTSIDE ANDVICINITY OF CAMP
INSIDE THE CAMP ONLY
OUTSIDE THE CAMP ONLY
MALE FEMALE

90 91CHAPTEr 4EMPLOYMENT AND CHARACTERISTICS OF PALESTINIAN WORKERS 89
Nationality of the employerSlightly less than half (45%) of the Palestinian workers are employed by Palestinian employers. Another 48% work for Lebanese employers and around 6% work for employers of other nationalities. Employer nationality also affects the likelihood of working inside the camp. Indeed, 38% of those who work for Palestinian employers work inside the camp versus only 4%
of those who have Lebanese employers. Moreover, although 38% of those working for Palestinian employers work outside the camp, the share increases to 83% in the case of Lebanese employers.
There are no age or sex differences in the likelihood of having a Palestinian or non-Palestinian employer. Not surprisingly, Tripoli hosts the highest share of those who are employed by Palestinian employers (62%) (figure
FIGurE 4.33 DISTrIBuTION OF SALArIED wOrKErS BY NATIONALITY OF EMPLOYEr AND LOCATION (%)
62.1
37.3 34.8
46.736.9
45.4
30.2
55.3 55.647.2
57.147.7
TRIPOLI BEIRUT BEKAA SAIDA TYRE ALL PALESTINIANS
PALESTINIANS EMPLOYER LEBANESE EMPLOYER
FIGurE 4.32 DISTrIBuTION OF THE EMPLOYED BY wOrK LOCATION (%)
3.2
4.1
16.8
26.1
49.8
IN VICINITY OF CAMP ONLY
INSIDE AND IN VICINITY OF CAMP
INSIDE, OUTSIDE AND IN VICINITY
INSIDE THE CAMP ONLY
OUTSIDE THE CAMP ONLY
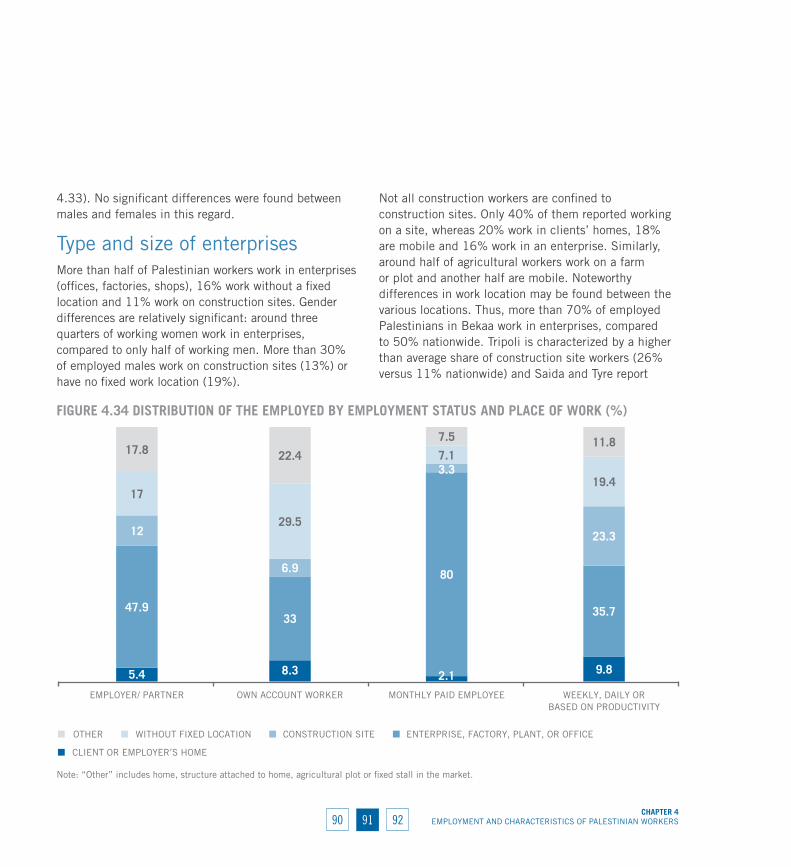
9190CHAPTEr 4
EMPLOYMENT AND CHARACTERISTICS OF PALESTINIAN WORKERS92
4.33). No significant differences were found between males and females in this regard.
Type and size of enterprisesMore than half of Palestinian workers work in enterprises (offices, factories, shops), 16% work without a fixed location and 11% work on construction sites. Gender differences are relatively significant: around three quarters of working women work in enterprises, compared to only half of working men. More than 30% of employed males work on construction sites (13%) or have no fixed work location (19%).
Not all construction workers are confined to construction sites. Only 40% of them reported working on a site, whereas 20% work in clients’ homes, 18% are mobile and 16% work in an enterprise. Similarly, around half of agricultural workers work on a farm or plot and another half are mobile. Noteworthy differences in work location may be found between the various locations. Thus, more than 70% of employed Palestinians in Bekaa work in enterprises, compared to 50% nationwide. Tripoli is characterized by a higher than average share of construction site workers (26% versus 11% nationwide) and Saida and Tyre report
FIGurE 4.34 DISTrIBuTION OF THE EMPLOYED BY EMPLOYMENT STATuS AND PLACE OF wOrK (%)
Note: “Other” includes home, structure attached to home, agricultural plot or fixed stall in the market.
5.4 8.3 2.1 9.8
47.933
80
35.7
12
6.9
3.3
23.3
17
29.5
7.1
19.4
17.8 22.4
7.5 11.8
EMPLOYER/ PARTNER OWN ACCOUNT WORKER MONTHLY PAID EMPLOYEE WEEKLY, DAILY ORBASED ON PRODUCTIVITY
OTHER WITHOUT FIXED LOCATION CONSTRUCTION SITE ENTERPRISE, FACTORY, PLANT, OR OFFICE
CLIENT OR EMPLOYER’S HOME
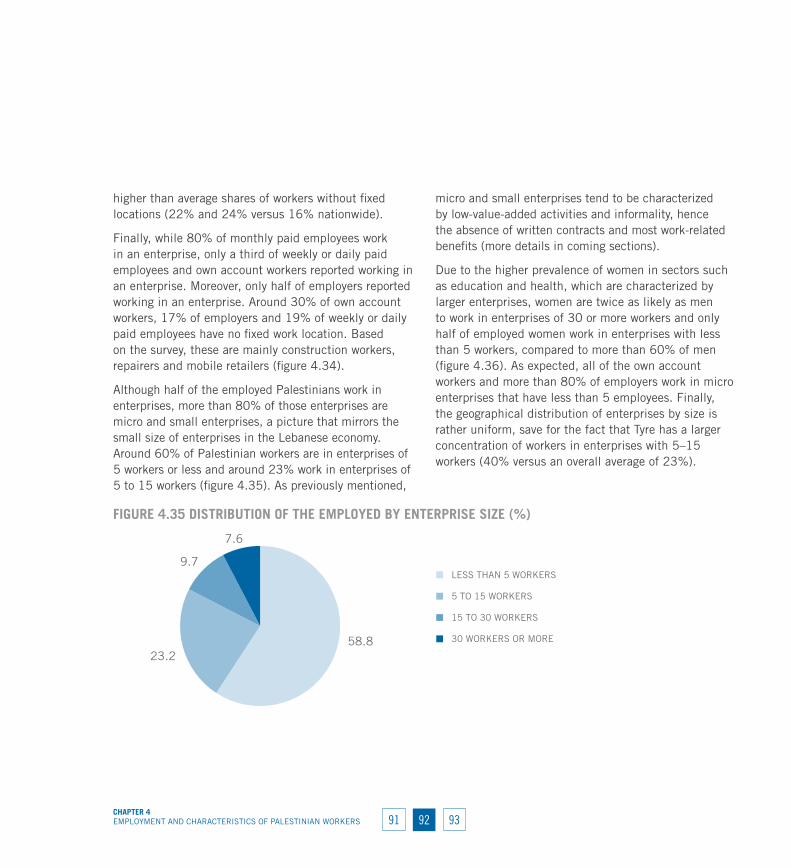
92 93CHAPTEr 4EMPLOYMENT AND CHARACTERISTICS OF PALESTINIAN WORKERS 91
higher than average shares of workers without fixed locations (22% and 24% versus 16% nationwide).
Finally, while 80% of monthly paid employees work in an enterprise, only a third of weekly or daily paid employees and own account workers reported working in an enterprise. Moreover, only half of employers reported working in an enterprise. Around 30% of own account workers, 17% of employers and 19% of weekly or daily paid employees have no fixed work location. Based on the survey, these are mainly construction workers, repairers and mobile retailers (figure 4.34).
Although half of the employed Palestinians work in enterprises, more than 80% of those enterprises are micro and small enterprises, a picture that mirrors the small size of enterprises in the Lebanese economy. Around 60% of Palestinian workers are in enterprises of 5 workers or less and around 23% work in enterprises of 5 to 15 workers (figure 4.35). As previously mentioned,
micro and small enterprises tend to be characterized by low-value-added activities and informality, hence the absence of written contracts and most work-related benefits (more details in coming sections).
Due to the higher prevalence of women in sectors such as education and health, which are characterized by larger enterprises, women are twice as likely as men to work in enterprises of 30 or more workers and only half of employed women work in enterprises with less than 5 workers, compared to more than 60% of men (figure 4.36). As expected, all of the own account workers and more than 80% of employers work in micro enterprises that have less than 5 employees. Finally, the geographical distribution of enterprises by size is rather uniform, save for the fact that Tyre has a larger concentration of workers in enterprises with 5–15 workers (40% versus an overall average of 23%).
FIGurE 4.35 DISTrIBuTION OF THE EMPLOYED BY ENTErPrISE SIzE (%)
58.823.2
9.7
7.6
LESS THAN 5 WORKERS
5 TO 15 WORKERS
15 TO 30 WORKERS
30 WORKERS OR MORE
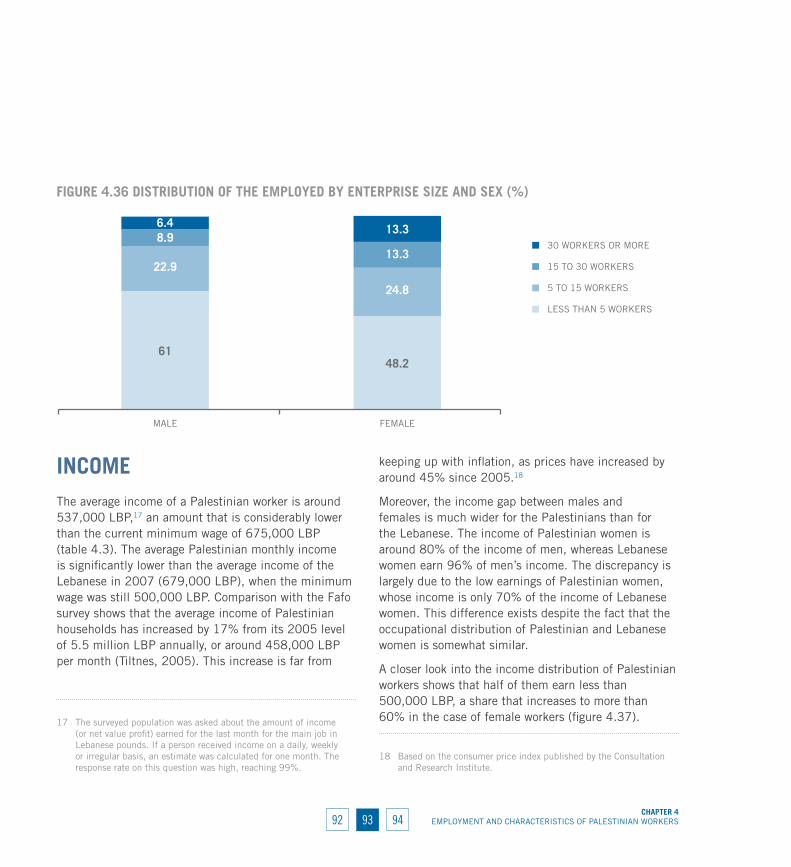
9392CHAPTEr 4
EMPLOYMENT AND CHARACTERISTICS OF PALESTINIAN WORKERS94
INCOMEThe average income of a Palestinian worker is around 537,000 LBP,17 an amount that is considerably lower than the current minimum wage of 675,000 LBP (table 4.3). The average Palestinian monthly income is significantly lower than the average income of the Lebanese in 2007 (679,000 LBP), when the minimum wage was still 500,000 LBP. Comparison with the Fafo survey shows that the average income of Palestinian households has increased by 17% from its 2005 level of 5.5 million LBP annually, or around 458,000 LBP per month (Tiltnes, 2005). This increase is far from
17 The surveyed population was asked about the amount of income (or net value profit) earned for the last month for the main job in Lebanese pounds. If a person received income on a daily, weekly or irregular basis, an estimate was calculated for one month. The response rate on this question was high, reaching 99%.
keeping up with inflation, as prices have increased by around 45% since 2005.18
Moreover, the income gap between males and females is much wider for the Palestinians than for the Lebanese. The income of Palestinian women is around 80% of the income of men, whereas Lebanese women earn 96% of men’s income. The discrepancy is largely due to the low earnings of Palestinian women, whose income is only 70% of the income of Lebanese women. This difference exists despite the fact that the occupational distribution of Palestinian and Lebanese women is somewhat similar.
A closer look into the income distribution of Palestinian workers shows that half of them earn less than 500,000 LBP, a share that increases to more than 60% in the case of female workers (figure 4.37).
18 Based on the consumer price index published by the Consultation and Research Institute.
FIGurE 4.36 DISTrIBuTION OF THE EMPLOYED BY ENTErPrISE SIzE AND SEx (%)
6148.2
22.9
24.8
8.913.3
6.4 13.3
MALE FEMALE
30 WORKERS OR MORE
15 TO 30 WORKERS
5 TO 15 WORKERS
LESS THAN 5 WORKERS

94 95CHAPTEr 4EMPLOYMENT AND CHARACTERISTICS OF PALESTINIAN WORKERS 93
Moreover, around 75% earn less than 700,000 LBP, essentially under the Lebanese minimum wage. A very small fraction (3%) earns 1.5 million LBP or more. The picture for the Lebanese is not as bleak, with around 50% earning less than 600,000 LBP according to 2007 data (CAS, 2007).
When these numbers are combined with a low labour participation rate and therefore a low number of workers per household, poverty becomes an inevitable consequence. Based on the survey, every household relies on an average of 1.14 workers. At an average monthly income of 537,000 LBP per worker, the
TABLE 4.3 AvErAGE AND MEDIAN MONTHLY INCOME OF THE EMPLOYED PALESTINIANS AND LEBANESE (THOuSAND LBP)
Palestinians (2011) Lebanese (2007)
Average Median Average Median
Male 554 500 687 600
Female 457 400 661 550
Both 537 500 679 560
FIGurE 4.37 DISTrIBuTION OF THE EMPLOYED BY INCOME BrACKET (%) (THOuSAND LBP)
46.961.9
49.5
26.3
20.9
25.4
12.46.8
11.5
10.9 7.4 10.33.4 3.0 3.3
MALE FEMALE BOTH
1,500 OR MORE
900 -1499
700 - 899
500 - 699
LESS THAN 500
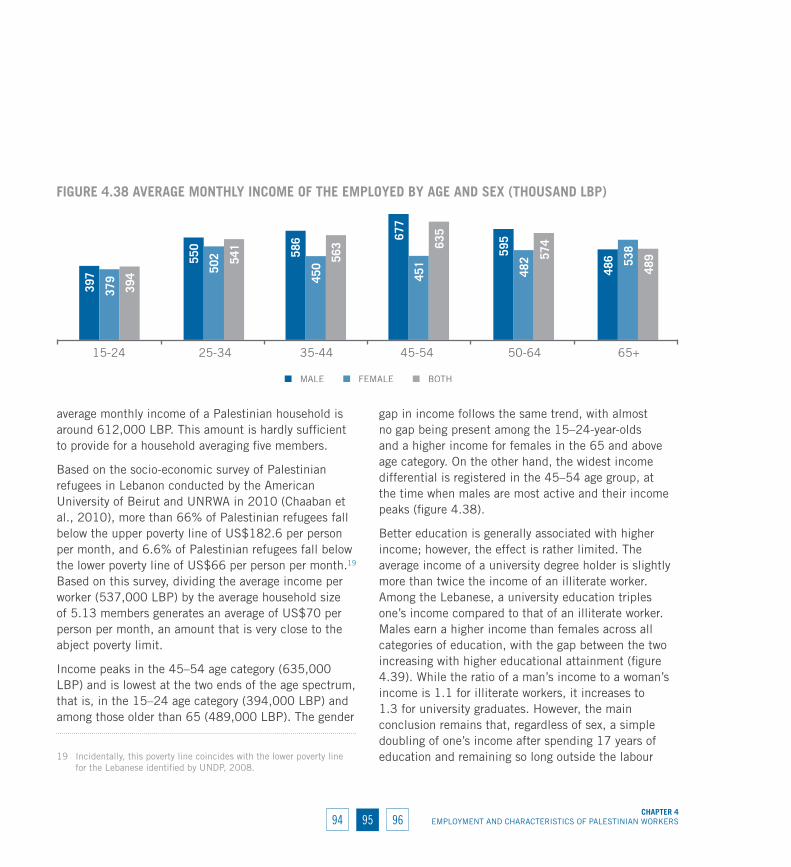
9594CHAPTEr 4
EMPLOYMENT AND CHARACTERISTICS OF PALESTINIAN WORKERS96
average monthly income of a Palestinian household is around 612,000 LBP. This amount is hardly sufficient to provide for a household averaging five members.
Based on the socio-economic survey of Palestinian refugees in Lebanon conducted by the American University of Beirut and UNRWA in 2010 (Chaaban et al., 2010), more than 66% of Palestinian refugees fall below the upper poverty line of US$182.6 per person per month, and 6.6% of Palestinian refugees fall below the lower poverty line of US$66 per person per month.19 Based on this survey, dividing the average income per worker (537,000 LBP) by the average household size of 5.13 members generates an average of US$70 per person per month, an amount that is very close to the abject poverty limit.
Income peaks in the 45–54 age category (635,000 LBP) and is lowest at the two ends of the age spectrum, that is, in the 15–24 age category (394,000 LBP) and among those older than 65 (489,000 LBP). The gender
19 Incidentally, this poverty line coincides with the lower poverty line for the Lebanese identified by UNDP, 2008.
gap in income follows the same trend, with almost no gap being present among the 15–24-year-olds and a higher income for females in the 65 and above age category. On the other hand, the widest income differential is registered in the 45–54 age group, at the time when males are most active and their income peaks (figure 4.38).
Better education is generally associated with higher income; however, the effect is rather limited. The average income of a university degree holder is slightly more than twice the income of an illiterate worker. Among the Lebanese, a university education triples one’s income compared to that of an illiterate worker. Males earn a higher income than females across all categories of education, with the gap between the two increasing with higher educational attainment (figure 4.39). While the ratio of a man’s income to a woman’s income is 1.1 for illiterate workers, it increases to 1.3 for university graduates. However, the main conclusion remains that, regardless of sex, a simple doubling of one’s income after spending 17 years of education and remaining so long outside the labour
FIGurE 4.38 AvErAGE MONTHLY INCOME OF THE EMPLOYED BY AGE AND SEx (THOuSAND LBP)
397
550 586 67
7
595
486
379
502
450
451
482 53
8
394
541
563 63
5
574
489
15-24 25-34 35-44 45-54 50-64 65+
MALE FEMALE BOTH

96 97CHAPTEr 4EMPLOYMENT AND CHARACTERISTICS OF PALESTINIAN WORKERS 95
FIGurE 4.40 AvErAGE MONTHLY INCOME OF THE EMPLOYED BY EMPLOYMENT STATuS AND SEx (THOuSAND LBP)
677
495
689
420
312 351
497
370
657
479
631
416
EMPLOYER / PARTNER OWN ACCOUNT WORKER MONTHLY PAID WORKER WEEKLY, DAILY, OR BASEDON PRODUCTIVITY
MALE FEMALE BOTH
FIGurE 4.39 AvErAGE MONTHLY INCOME OF THE EMPLOYED BY EDuCATIONAL ATTAINMENT AND SEx (THOuSAND LBP)
362 341 350375 481
719409 438 478
538
703
930
ILLITERATE READ AND WRITE PRIMARY INTERMEDIATE SECONDARY UNIVERSITY
FEMALEMALE
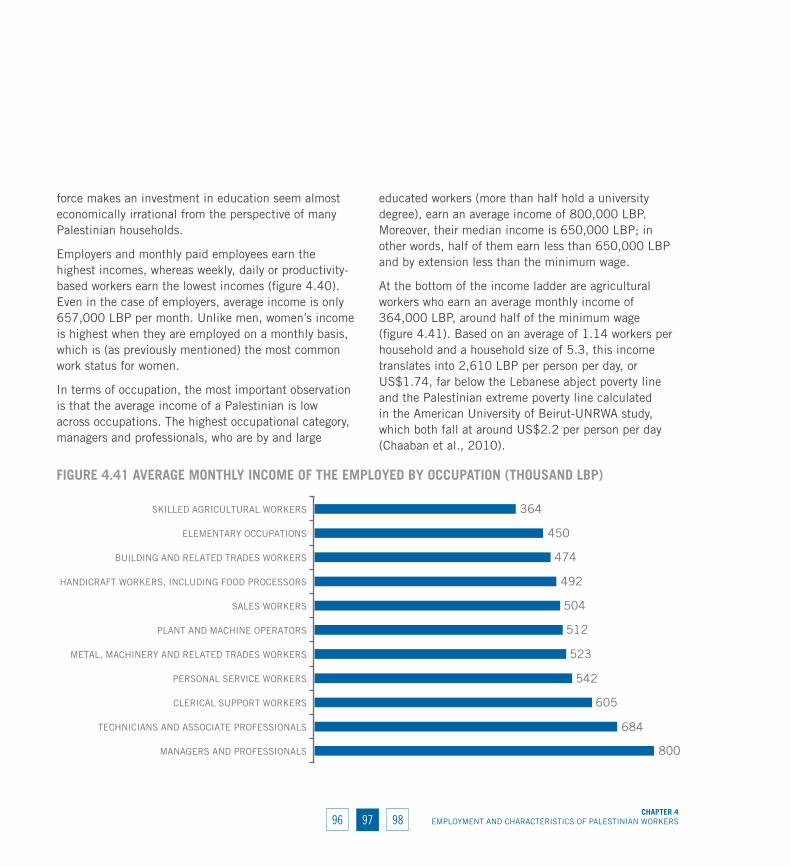
9796CHAPTEr 4
EMPLOYMENT AND CHARACTERISTICS OF PALESTINIAN WORKERS98
force makes an investment in education seem almost economically irrational from the perspective of many Palestinian households.
Employers and monthly paid employees earn the highest incomes, whereas weekly, daily or productivity-based workers earn the lowest incomes (figure 4.40). Even in the case of employers, average income is only 657,000 LBP per month. Unlike men, women’s income is highest when they are employed on a monthly basis, which is (as previously mentioned) the most common work status for women.
In terms of occupation, the most important observation is that the average income of a Palestinian is low across occupations. The highest occupational category, managers and professionals, who are by and large
educated workers (more than half hold a university degree), earn an average income of 800,000 LBP. Moreover, their median income is 650,000 LBP; in other words, half of them earn less than 650,000 LBP and by extension less than the minimum wage.
At the bottom of the income ladder are agricultural workers who earn an average monthly income of 364,000 LBP, around half of the minimum wage (figure 4.41). Based on an average of 1.14 workers per household and a household size of 5.3, this income translates into 2,610 LBP per person per day, or US$1.74, far below the Lebanese abject poverty line and the Palestinian extreme poverty line calculated in the American University of Beirut-UNRWA study, which both fall at around US$2.2 per person per day (Chaaban et al., 2010).
FIGurE 4.41 AvErAGE MONTHLY INCOME OF THE EMPLOYED BY OCCuPATION (THOuSAND LBP)
800
684
605
542
523
512
504
492
474
450
364
MANAGERS AND PROFESSIONALS
TECHNICIANS AND ASSOCIATE PROFESSIONALS
CLERICAL SUPPORT WORKERS
PERSONAL SERVICE WORKERS
METAL, MACHINERY AND RELATED TRADES WORKERS
PLANT AND MACHINE OPERATORS
SALES WORKERS
HANDICRAFT WORKERS, INCLUDING FOOD PROCESSORS
BUILDING AND RELATED TRADES WORKERS
ELEMENTARY OCCUPATIONS
SKILLED AGRICULTURAL WORKERS
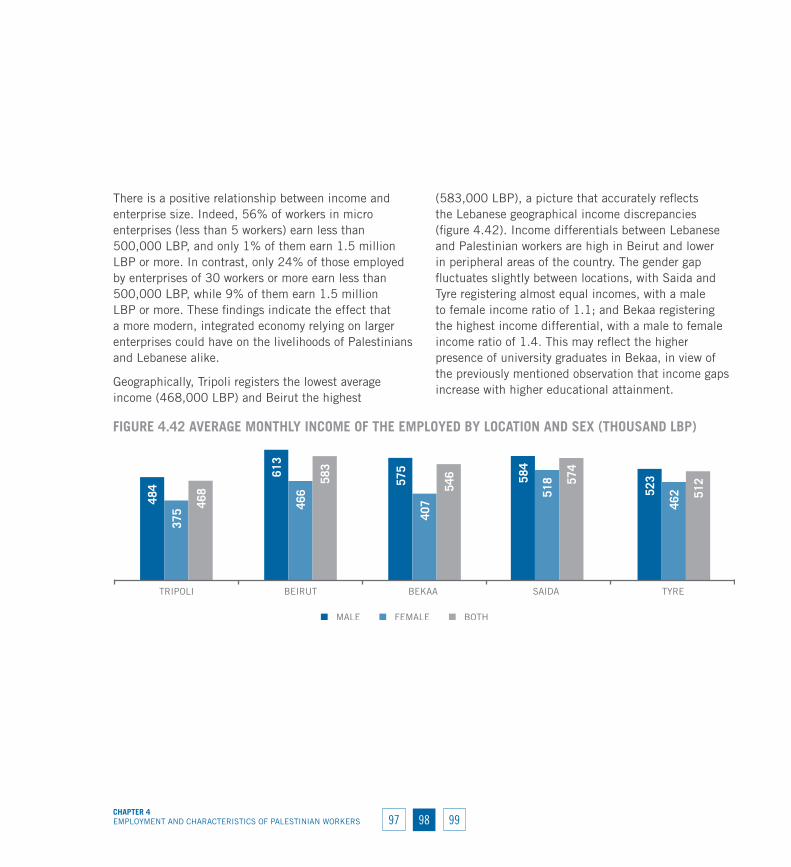
98 99CHAPTEr 4EMPLOYMENT AND CHARACTERISTICS OF PALESTINIAN WORKERS 97
There is a positive relationship between income and enterprise size. Indeed, 56% of workers in micro enterprises (less than 5 workers) earn less than 500,000 LBP, and only 1% of them earn 1.5 million LBP or more. In contrast, only 24% of those employed by enterprises of 30 workers or more earn less than 500,000 LBP, while 9% of them earn 1.5 million LBP or more. These findings indicate the effect that a more modern, integrated economy relying on larger enterprises could have on the livelihoods of Palestinians and Lebanese alike.
Geographically, Tripoli registers the lowest average income (468,000 LBP) and Beirut the highest
(583,000 LBP), a picture that accurately reflects the Lebanese geographical income discrepancies (figure 4.42). Income differentials between Lebanese and Palestinian workers are high in Beirut and lower in peripheral areas of the country. The gender gap fluctuates slightly between locations, with Saida and Tyre registering almost equal incomes, with a male to female income ratio of 1.1; and Bekaa registering the highest income differential, with a male to female income ratio of 1.4. This may reflect the higher presence of university graduates in Bekaa, in view of the previously mentioned observation that income gaps increase with higher educational attainment.
FIGurE 4.42 AvErAGE MONTHLY INCOME OF THE EMPLOYED BY LOCATION AND SEx (THOuSAND LBP)
484
613
575
584
523
375 46
6
407
518
462
468
583
546 57
4
512
TRIPOLI BEIRUT BEKAA SAIDA TYRE
MALE FEMALE BOTH
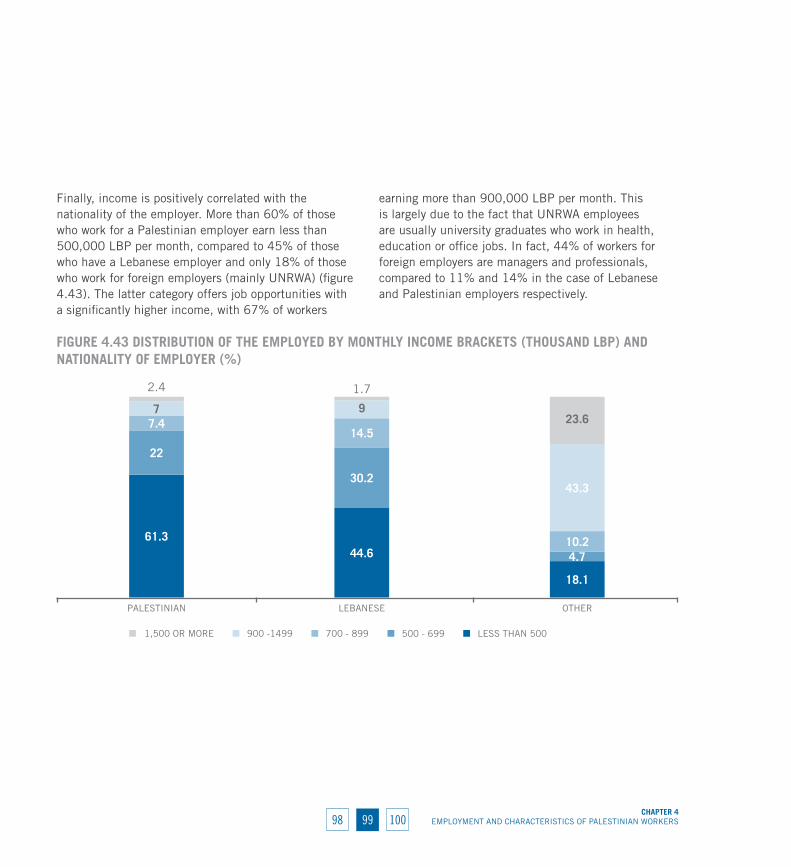
9998CHAPTEr 4
EMPLOYMENT AND CHARACTERISTICS OF PALESTINIAN WORKERS100
Finally, income is positively correlated with the nationality of the employer. More than 60% of those who work for a Palestinian employer earn less than 500,000 LBP per month, compared to 45% of those who have a Lebanese employer and only 18% of those who work for foreign employers (mainly UNRWA) (figure 4.43). The latter category offers job opportunities with a significantly higher income, with 67% of workers
earning more than 900,000 LBP per month. This is largely due to the fact that UNRWA employees are usually university graduates who work in health, education or office jobs. In fact, 44% of workers for foreign employers are managers and professionals, compared to 11% and 14% in the case of Lebanese and Palestinian employers respectively.
FIGurE 4.43 DISTrIBuTION OF THE EMPLOYED BY MONTHLY INCOME BrACKETS (THOuSAND LBP) AND NATIONALITY OF EMPLOYEr (%)
61.3
22
7.47
2.4
PALESTINIAN
44.6
30.2
14.5
9
1.7
LEBANESE
18.1
4.710.2
43.3
23.6
OTHER
1,500 OR MORE 900 -1499 700 - 899 500 - 699 LESS THAN 500

100 101CHAPTEr 4EMPLOYMENT AND CHARACTERISTICS OF PALESTINIAN WORKERS 99
LEGAL STATuSOn 17 August 2010, the Lebanese Parliament approved legal amendments granting certain rights to Palestinian refugees registered and residing in Lebanon, including working in sectors open to foreigners, the issuance of free-of-charge work permits, and the provision of end-of-service benefits through the Lebanese NSSF. However, those amendments continued to bar Palestinian refugees from practising over 30 syndicated professions.
Despite these legal reforms, the share of Palestinians who obtain a work permit remains extremely low. The reason is that it is practically impossible for many of them to apply for the permit. As a matter of fact, obtaining a permit requires the worker to submit a written contract with the employer that is officiated by a notary public. However, in many of the professions that are common among Palestinians and given the employment status of the Palestinians in the country – as many are self-employed or work on daily basis – it becomes quite difficult to fulfil the requirements for a work permit, including the presence of a signed and
notified written contract. Also, the issuance of a work permit automatically entails commitment to register with the NSSF, which most employers of Palestinian workers avoid, given that their contributions to the NSSF are not commensurate with the benefits the workers would receive. Moreover, work permits should be renewed on a yearly basis, a factor that also creates disincentives for obtaining one, particularly given that no actual gains are received in return.
As a result of this situation, less than 2% of Palestinian workers have a work permit. More than 40% of those who do not have a permit cited the fact that they were not required to have one in their type of work. Another 40% were not able to comply with the regulations.
Finally, the survey reveals that around 60% of workers have only partial knowledge of the legal amendments issued in August 2010. Only 9% have no awareness whatsoever of the changes. However, when workers were asked if those amendments had any impact on their employment status, the survey results revealed zero changes, possibly because the related implementation decrees have not yet been issued (figure 4.44).
FIGurE 4.44 DISTrIBuTION OF THE EMPLOYED BY AwArENESS OF THE 2010 LEGAL AMENDMENTS (%)
32.6
58.6
8.6
GOOD KNOWLEDGE
PARTIALLY AWARE
NOT AWARE
101100CHAPTEr 4
EMPLOYMENT AND CHARACTERISTICS OF PALESTINIAN WORKERS102
BOx 4.4 SYNDICATED PrOFESSIONS
There are at least 19 groups of professions that Palestinian refugees are debarred from practising due a number of legal restrictions. These may be subdivided into four major groups based on the types of legal restrictions:
• Professions restricted to Lebanese nationals: archaeological and tourist guides, real estate agents, money exchange professionals, legal professionals, people responsible for following up formalities at the vehicle registration department and driving instructors.
• Professions that Palestinian refugees cannot practise due to the principle of reciprocity of treatment or the requirement to have the right to practise the profession in their own country: certified chartered accountants, engineers, topographers, physiotherapists, dental laboratory workers, veterinarians, nurses and nutritionists.
• Professions that Palestinians cannot practise due to the principle of reciprocity and the requirement to acknowledge this principle in a bilateral agreement: medical laboratories and laboratory professions, and professions related to the preparation and fitting of artificial limbs and orthopaedic apparatuses (in the latter, exceptions are made for practising the profession in a non-profit or academic institution).
• Professions that Palestinian refugees cannot practise due to the principle of reciprocity of treatment, the requirement to acknowledge this principle in a bilateral agreement, and the right to practise the profession in their own country: medicine (Decree No. 1658 of 17 January 1979), dentistry (Law No. 485 of 12 December 2002) and health inspection (Legislative Decree No. 107 of 16 September 1983).


CHAPTEr 5UNEMPLOYMENT AND CHARACTERISTICS OF THE UNEMPLOYED
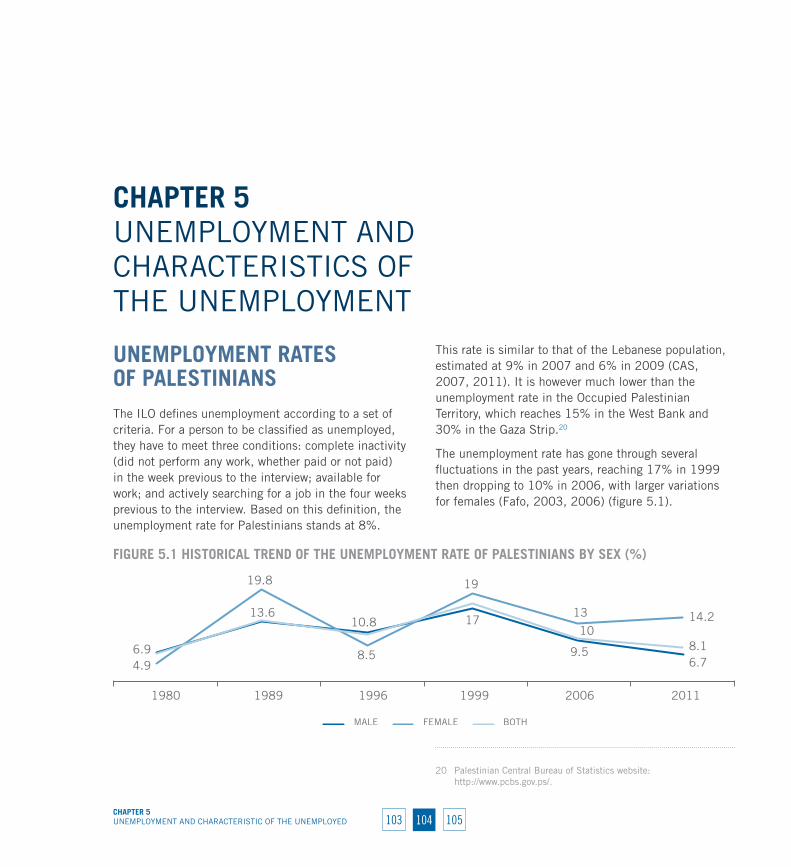
104 105CHAPTEr 5UNEMPLOYMENT AND CHARACTERISTIC OF THE UNEMPLOYED 103
CHAPTEr 5 UNEMPLOYMENT AND CHARACTERISTICS OF THE UNEMPLOYMENT
uNEMPLOYMENT rATES OF PALESTINIANSThe ILO defines unemployment according to a set of criteria. For a person to be classified as unemployed, they have to meet three conditions: complete inactivity (did not perform any work, whether paid or not paid) in the week previous to the interview; available for work; and actively searching for a job in the four weeks previous to the interview. Based on this definition, the unemployment rate for Palestinians stands at 8%.
This rate is similar to that of the Lebanese population, estimated at 9% in 2007 and 6% in 2009 (CAS, 2007, 2011). It is however much lower than the unemployment rate in the Occupied Palestinian Territory, which reaches 15% in the West Bank and 30% in the Gaza Strip.20
The unemployment rate has gone through several fluctuations in the past years, reaching 17% in 1999 then dropping to 10% in 2006, with larger variations for females (Fafo, 2003, 2006) (figure 5.1).
20 Palestinian Central Bureau of Statistics website: http://www.pcbs.gov.ps/.
FIGurE 5.1 HISTOrICAL TrEND OF THE uNEMPLOYMENT rATE OF PALESTINIANS BY SEx (%)
9.56.74.9
19.8
8.5
19
13 14.2
6.9
13.610.8
17
108.1
1980 1989 1996 1999 2006 2011
FEMALEMALE BOTH
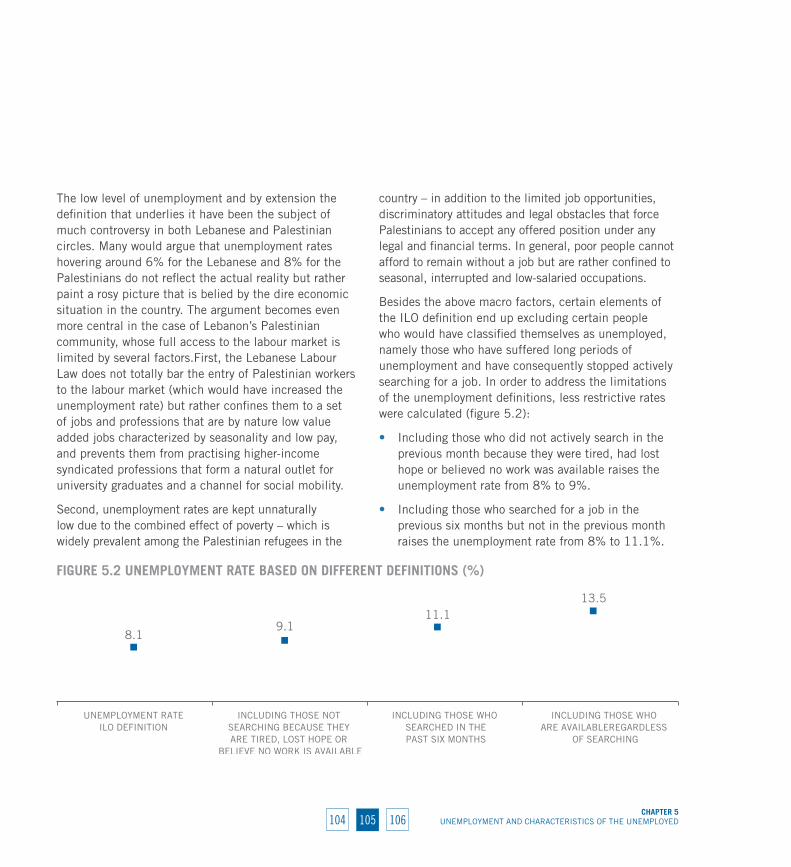
105104CHAPTEr 5
UNEMPLOYMENT AND CHARACTERISTICS OF THE UNEMPLOYED106
The low level of unemployment and by extension the definition that underlies it have been the subject of much controversy in both Lebanese and Palestinian circles. Many would argue that unemployment rates hovering around 6% for the Lebanese and 8% for the Palestinians do not reflect the actual reality but rather paint a rosy picture that is belied by the dire economic situation in the country. The argument becomes even more central in the case of Lebanon’s Palestinian community, whose full access to the labour market is limited by several factors.First, the Lebanese Labour Law does not totally bar the entry of Palestinian workers to the labour market (which would have increased the unemployment rate) but rather confines them to a set of jobs and professions that are by nature low value added jobs characterized by seasonality and low pay, and prevents them from practising higher-income syndicated professions that form a natural outlet for university graduates and a channel for social mobility.
Second, unemployment rates are kept unnaturally low due to the combined effect of poverty – which is widely prevalent among the Palestinian refugees in the
country – in addition to the limited job opportunities, discriminatory attitudes and legal obstacles that force Palestinians to accept any offered position under any legal and financial terms. In general, poor people cannot afford to remain without a job but are rather confined to seasonal, interrupted and low-salaried occupations.
Besides the above macro factors, certain elements of the ILO definition end up excluding certain people who would have classified themselves as unemployed, namely those who have suffered long periods of unemployment and have consequently stopped actively searching for a job. In order to address the limitations of the unemployment definitions, less restrictive rates were calculated (figure 5.2):
• Including those who did not actively search in the previous month because they were tired, had lost hope or believed no work was available raises the unemployment rate from 8% to 9%.
• Including those who searched for a job in the previous six months but not in the previous month raises the unemployment rate from 8% to 11.1%.
FIGurE 5.2 uNEMPLOYMENT rATE BASED ON DIFFErENT DEFINITIONS (%)
8.19.1
11.113.5
UNEMPLOYMENT RATEILO DEFINITION
INCLUDING THOSE NOT SEARCHING BECAUSE THEY ARE TIRED, LOST HOPE OR
BELIEVE NO WORK IS AVAILABLE
INCLUDING THOSE WHO SEARCHED IN THEPAST SIX MONTHS
INCLUDING THOSE WHO ARE AVAILABLEREGARDLESS
OF SEARCHING
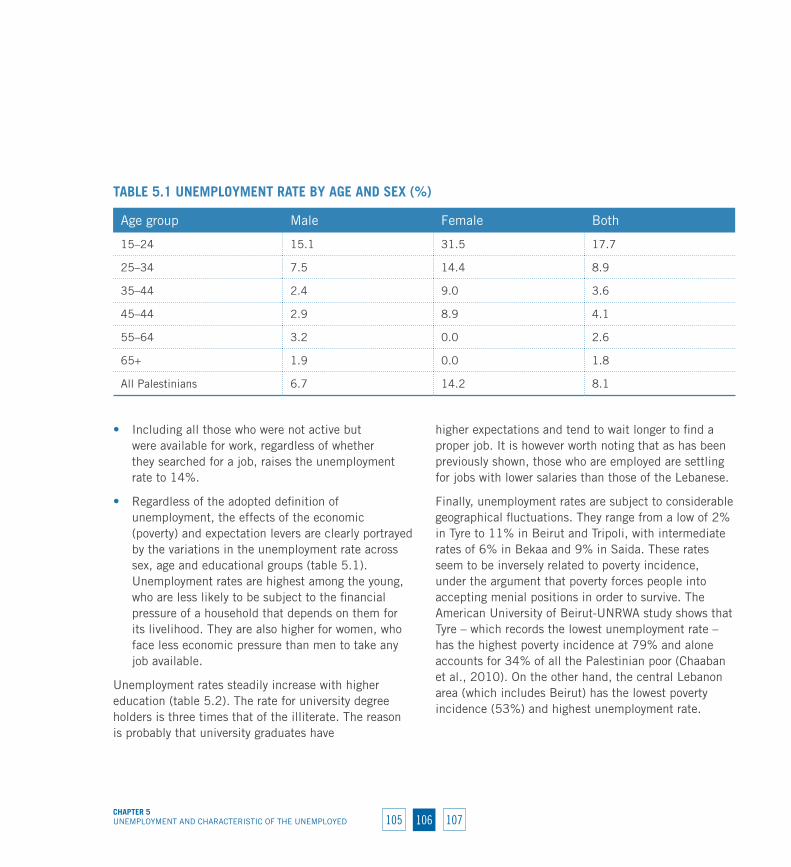
106 107105
• Including all those who were not active but were available for work, regardless of whether they searched for a job, raises the unemployment rate to 14%.
• Regardless of the adopted definition of unemployment, the effects of the economic (poverty) and expectation levers are clearly portrayed by the variations in the unemployment rate across sex, age and educational groups (table 5.1). Unemployment rates are highest among the young, who are less likely to be subject to the financial pressure of a household that depends on them for its livelihood. They are also higher for women, who face less economic pressure than men to take any job available.
Unemployment rates steadily increase with higher education (table 5.2). The rate for university degree holders is three times that of the illiterate. The reason is probably that university graduates have
higher expectations and tend to wait longer to find a proper job. It is however worth noting that as has been previously shown, those who are employed are settling for jobs with lower salaries than those of the Lebanese.
Finally, unemployment rates are subject to considerable geographical fluctuations. They range from a low of 2% in Tyre to 11% in Beirut and Tripoli, with intermediate rates of 6% in Bekaa and 9% in Saida. These rates seem to be inversely related to poverty incidence, under the argument that poverty forces people into accepting menial positions in order to survive. The American University of Beirut-UNRWA study shows that Tyre – which records the lowest unemployment rate – has the highest poverty incidence at 79% and alone accounts for 34% of all the Palestinian poor (Chaaban et al., 2010). On the other hand, the central Lebanon area (which includes Beirut) has the lowest poverty incidence (53%) and highest unemployment rate.
TABLE 5.1 uNEMPLOYMENT rATE BY AGE AND SEx (%)
Age group Male Female Both
15–24 15.1 31.5 17.7
25–34 7.5 14.4 8.9
35–44 2.4 9.0 3.6
45–44 2.9 8.9 4.1
55–64 3.2 0.0 2.6
65+ 1.9 0.0 1.8
All Palestinians 6.7 14.2 8.1
CHAPTEr 5UNEMPLOYMENT AND CHARACTERISTIC OF THE UNEMPLOYED

107106 108
PrOFILE OF THE uNEMPLOYEDSimilarly to the Lebanese, the unemployed Palestinian refugees are young, with 77% of them under 34 years of age and around half under 24 (figure 5.3). Two thirds of them are males, reflecting the difference in economic activity between males and females.
Around 90% of the unemployed reside in Beirut (25%), Saida (34%) and Tripoli (30%), compared to 72% of the employed who live in these cities. The difference is probably due to the uniquely low unemployment rate in Tyre.
The distribution of the unemployed by educational achievement shows a similar trend to that found among the employed until university level, when a sharp divergence takes place (figure 5.4). The share of university degree holders among the unemployed is
double the share among the employed, clearly reflecting the difficulty faced by university-educated Palestinians in finding jobs. The situation is exacerbated in the case of females, for whom the share of unemployed university degree holders reaches 30%.
The unemployed may be further subdivided into two major groups: those who had worked before (66%) and those who had not, that is, first-time jobseekers (33%). The latter are overwhelmingly young: 67% of them are under 24. They are mostly the sons and daughters of heads of households (86%), and the vast majority are single (86%). More importantly, 34% of first-time jobseekers are university degree holders, compared to 21% for the unemployed. This reflects the combined effect of the increased share of university graduates among the young who are seeking their first job and the increased difficulty of finding jobs faced by the university educated.
TABLE 5.2 uNEMPLOYMENT rATE BY EDuCATIONAL ATTAINMENT AND SEx (%)
Education Male Female Both
Illiterate 3.2 10.0 5.3
Read and write 4.6 15.4 5.7
Primary 6.6 14.7 7.6
Intermediate 6.2 11.0 7.0
Secondary 7.4 12.6 8.8
University 12.0 20.0 14.6
CHAPTEr 5UNEMPLOYMENT AND CHARACTERISTICS OF THE UNEMPLOYED
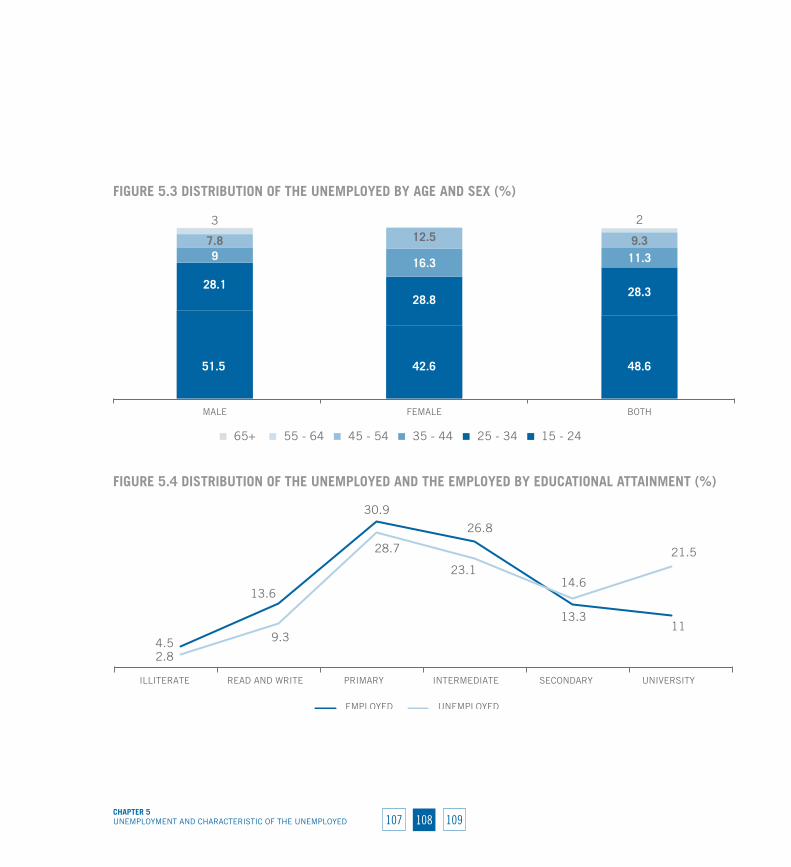
108 109107
FIGurE 5.4 DISTrIBuTION OF THE uNEMPLOYED AND THE EMPLOYED BY EDuCATIONAL ATTAINMENT (%)
4.5
13.6
30.9
26.8
13.311
2.8
9.3
28.7
23.114.6
21.5
ILLITERATE READ AND WRITE PRIMARY INTERMEDIATE SECONDARY UNIVERSITY
UNEMPLOYEDEMPLOYED
FIGurE 5.3 DISTrIBuTION OF THE uNEMPLOYED BY AGE AND SEx (%)
51.5 42.6 48.6
28.128.8
28.3
9 16.3 11.37.8 12.5 9.3
3 2
MALE FEMALE BOTH
65+ 55 - 64 45 - 54 35 - 44 25 - 34 15 - 24
CHAPTEr 5UNEMPLOYMENT AND CHARACTERISTIC OF THE UNEMPLOYED

109108 110
BOx 5.1 THE STOrY OF AHMAD
“I dream of, what any other young man dreams of, a chance to find a decent job and secure my future” – Ahmad Ayoub
Like many other young Palestinian refugees in Lebanon, Ahmad Ayoub has spent the majority of his youth years dreaming of a better future. Ahmad is a 25-year-old young man who lives in Baddawi camp in North Lebanon with his parents and two younger siblings. He completed secondary education, earning a diploma with a focus on social and economic studies. He then attended and graduated from Siblin Training Centre for Palestinian refugees in Lebanon, where he specialized in computer information systems. He did not however complete his university education, because at the time he was more concerned with finding a job and earning money to support himself and help support his family: “My father is getting older and is no longer able to work as much as he used to, so now I pitch in and help him financially support the family.” Ahmad’s father works as a house painter, and has been forced into unprotected and vulnerable employment, with no decent work conditions, no well-defined working hours and no stable income.
Ahmad graduated in 2007, and has, since then, been searching for a job. He approached a number of Lebanese companies, with optimism and hope, but somehow he always seemed to hear one of the many excuses for why they do not wish to employ him, but nonetheless Ahmad kept applying for jobs,
only now knowing that he will not get employed any time soon. One would think that insufficient educational background, with no university degree, has limited his prospects, but Ahmad realizes that his friends who were “lucky enough” to complete their university education are also facing the same difficulties in finding a job. So, with or without high educational qualifications, most Palestinians find themselves marginalized, with no choice but to make a living through the informal economy. Ahmad believes that their status as Palestinian refugees is the main reason preventing their formal and secure employment in Lebanon.
Unfortunately, like his father, Ahmad finds himself faced with no choice but to run a small shop in the camp to generate some sort of income. He expresses his utmost frustration and extreme discomfort, knowing that he is more than qualified to get a respectful and decent job: “This shop is a very poor compensation,” he says. When comparing the security and dignity that come with a full-time job to the humiliation and low income generated from running this shop, who can blame him for his discontent?
“I often dream, I dream about securing a job … I dream about a secure future, I dream that one day I will have a home to call my own and family to care for, I dream that one day I will live comfortably. Or maybe not, I don’t want to get carried away with my dreams” – Ahmad Ayoub
CHAPTEr 5UNEMPLOYMENT AND CHARACTERISTICS OF THE UNEMPLOYED
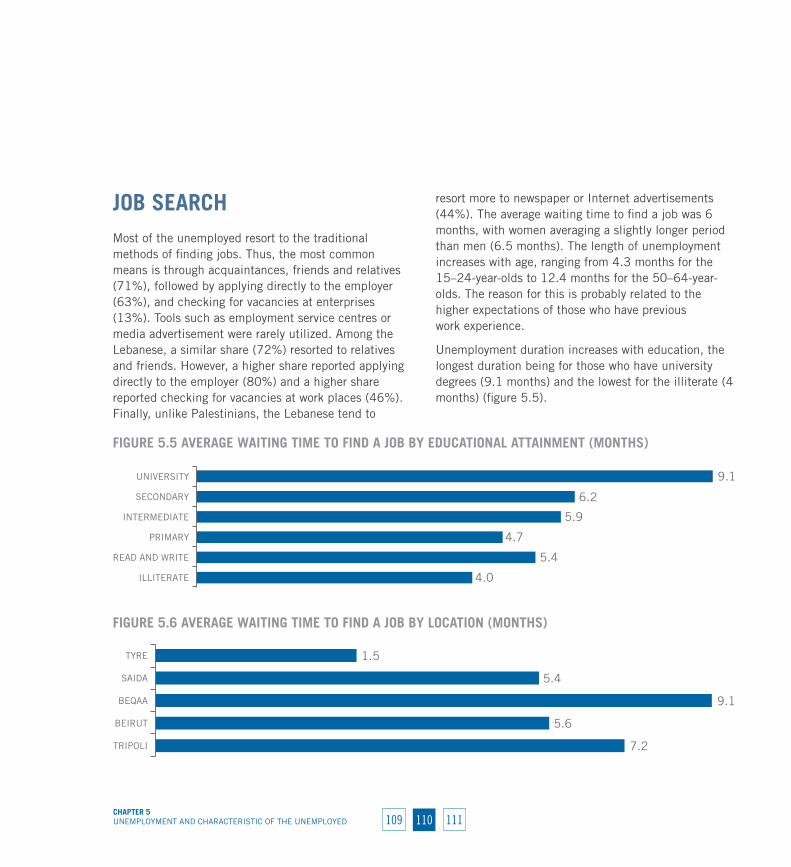
110 111109
JOB SEArCHMost of the unemployed resort to the traditional methods of finding jobs. Thus, the most common means is through acquaintances, friends and relatives (71%), followed by applying directly to the employer (63%), and checking for vacancies at enterprises (13%). Tools such as employment service centres or media advertisement were rarely utilized. Among the Lebanese, a similar share (72%) resorted to relatives and friends. However, a higher share reported applying directly to the employer (80%) and a higher share reported checking for vacancies at work places (46%). Finally, unlike Palestinians, the Lebanese tend to
resort more to newspaper or Internet advertisements (44%). The average waiting time to find a job was 6 months, with women averaging a slightly longer period than men (6.5 months). The length of unemployment increases with age, ranging from 4.3 months for the 15–24-year-olds to 12.4 months for the 50–64-year-olds. The reason for this is probably related to the higher expectations of those who have previous work experience.
Unemployment duration increases with education, the longest duration being for those who have university degrees (9.1 months) and the lowest for the illiterate (4 months) (figure 5.5).
FIGurE 5.5 AvErAGE wAITING TIME TO FIND A JOB BY EDuCATIONAL ATTAINMENT (MONTHS)
4.0
5.4
4.7
5.9
6.2
9.1
ILLITERATE
READ AND WRITE
PRIMARY
INTERMEDIATE
SECONDARY
UNIVERSITY
FIGurE 5.6 AvErAGE wAITING TIME TO FIND A JOB BY LOCATION (MONTHS)
7.2
5.6
9.1
5.4
1.5
TRIPOLI
BEIRUT
BEQAA
SAIDA
TYRE
CHAPTEr 5UNEMPLOYMENT AND CHARACTERISTIC OF THE UNEMPLOYED
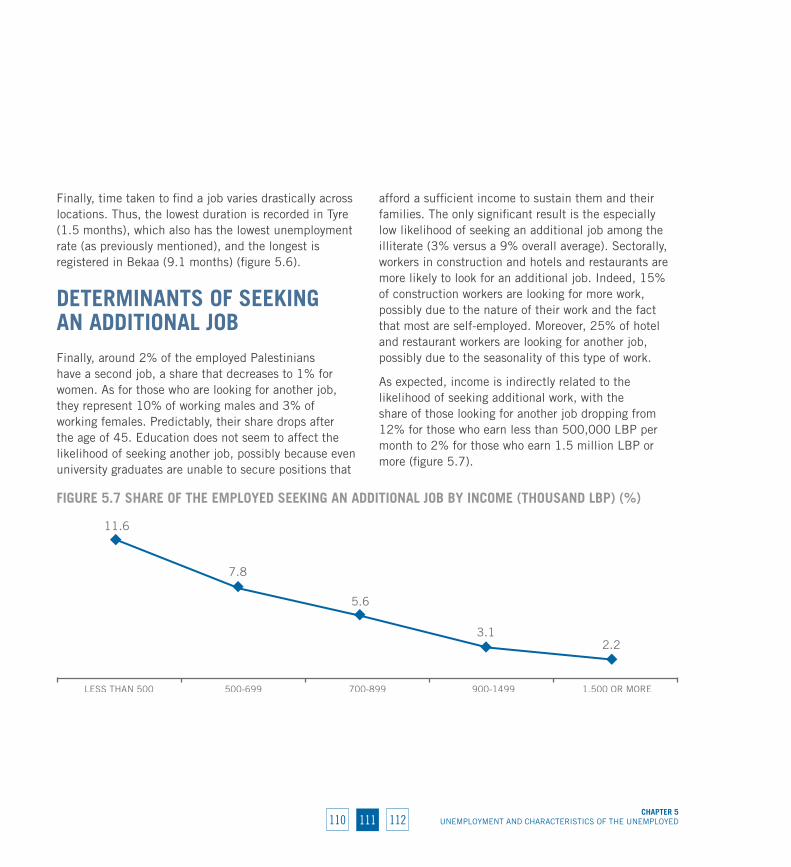
111110 112
Finally, time taken to find a job varies drastically across locations. Thus, the lowest duration is recorded in Tyre (1.5 months), which also has the lowest unemployment rate (as previously mentioned), and the longest is registered in Bekaa (9.1 months) (figure 5.6).
DETErMINANTS OF SEEKING AN ADDITIONAL JOBFinally, around 2% of the employed Palestinians have a second job, a share that decreases to 1% for women. As for those who are looking for another job, they represent 10% of working males and 3% of working females. Predictably, their share drops after the age of 45. Education does not seem to affect the likelihood of seeking another job, possibly because even university graduates are unable to secure positions that
afford a sufficient income to sustain them and their families. The only significant result is the especially low likelihood of seeking an additional job among the illiterate (3% versus a 9% overall average). Sectorally, workers in construction and hotels and restaurants are more likely to look for an additional job. Indeed, 15% of construction workers are looking for more work, possibly due to the nature of their work and the fact that most are self-employed. Moreover, 25% of hotel and restaurant workers are looking for another job, possibly due to the seasonality of this type of work.
As expected, income is indirectly related to the likelihood of seeking additional work, with the share of those looking for another job dropping from 12% for those who earn less than 500,000 LBP per month to 2% for those who earn 1.5 million LBP or more (figure 5.7).
FIGurE 5.7 SHArE OF THE EMPLOYED SEEKING AN ADDITIONAL JOB BY INCOME (THOuSAND LBP) (%)
11.6
7.8
5.6
3.12.2
LESS THAN 500 500-699 700-899 900-1499 1,500 OR MORE
CHAPTEr 5UNEMPLOYMENT AND CHARACTERISTICS OF THE UNEMPLOYED


CONCLuSION

114 115CONCLuSION 113
CONCLuSIONThe working conditions of Palestinian refugees and their employment profile that the survey results revealed is a reflection of the inherently discriminatory laws and practices that have hindered Palestinians from legally joining the Lebanese labour market. Such conditions have not only led to the vulnerability, deteriorating living conditions and exposure to exploitation of Palestinian workers, but have also left the potential positive contributions of Palestinians unutilized.
The issue of Palestinians’ right to work is still controversial at the economic, political and social fronts. The connection between civil rights – including the right to work – and naturalization (tawteen) prevails. The several legal amendments and ministerial decisions that have been issued so far contributed little to making drastic changes in the Palestinians’ working rights and conditions. Palestinians are still treated as foreigners and are prohibited from practising a number of professions, which has reflected negatively on their living conditions. Poverty hits around two thirds of the Palestinian population in Lebanon.
Looking at the wider picture, the Palestinian labour force in Lebanon makes up around 5% of the total Lebanese and non-Lebanese (including Syrians, Egyptians and other nationalities) labour force in Lebanon.21 However, unlike foreign workers, Palestinian refugees contribute positively to the economy. They consume and save in the country and enjoy a consumption pattern similar to the Lebanese. Many Palestinians are business owners and employers who
21 Estimates made by the Common Space Initiative, 2012.
participated to increase employment and economic growth. Remittances from Palestinians abroad sent to Lebanon are estimated at more than US$60 million a year, in addition to aid money from the international community that continues to be disbursed in Lebanon, employing and benefiting both Palestinians and Lebanese.
Improving working conditions and providing fair treatment for the Palestinian workers in Lebanon calls for advancing a number of decisions and actions, including the following:
• Remove the legal and administrative obstacles that stand in the way of Palestinians receiving fair and legal working opportunities, including removal of the reciprocity of treatment injunction and introduction of a free work permit that is not confined to the employer;
• Explore viable measures that could benefit Palestinians working in the formal economy from the health care coverage under the NSSF and facilitate entrance of Palestinians to the occupations regulated by law;
• Undertake a number of measures that involve regulating and organizing the employment of Palestinian refugees, giving priority to Palestinian refugees over foreign workers in the country and the possibility of adopting a quota system for Palestinian workers;
• Conduct constructive dialogue with all concerned stakeholders, including the Lebanese Government, political groups, labour and professional

115114 CONCLuSION116
syndicates, Lebanese and Palestinian civil society organizations and international agencies, on feasible arrangements to grant the Palestinian refugees full right to work and to social protection;
• Implement consistent and innovative advocacy campaigns calling for the right to work and to social protection of Palestinian refugees, and create awareness on the benefits for the Lebanese economy of Palestinian employment, dispelling any fears associating Palestinian employment with tawteen.


APPENDIx IABOUT THE SURVEY

118 119APPENDIx IABOUT THE SURVEY 117
119118APPENDIx I
ABOUT THE SURVEY120
APPENDIx I. ABOUT THE SURVEYThe labour force survey was implemented in all Palestinian camps and gatherings in Lebanon during the period September 2011 to March 2012. The main objective of the survey was to fill the information gap and update available data about the labour and employment conditions of Palestinian refugees in Lebanon. More specifically, it aimed to:
• enhance the quality of discussion relevant to the Palestinian’s right to work and to social protection based on objective and scientific facts and figures;
• provide decision-makers and concerned stakeholders with reliable information on Palestinian employment and support evidence-based policy-making towards improved working conditions for Palestinian refugees in Lebanon;
• empower advocacy efforts with needed information and figures for more convincing messages and improved dialogue on the Palestinian refugees’ right to work and social security.
The survey was implemented under an ILO project titled “Improving access to employment and social protection of Palestinian refugees in Lebanon” in partnership with the Committee for the Employment of Palestinian Refugees in Lebanon and funded by the European Union Delegation. The Palestinian Central Bureau of Statistics took charge of the field survey, including piloting, sampling, training of surveyors, data collection and data processing (coding, entry, editing). The Fafo Institute for Applied International Studies provided technical support and quality control on the different
phases of the survey. Data collection was completed by the end of 2011 and preliminary survey results were produced and discussed with a group of experts and researchers in April 2012.
The target population of the survey consisted of all Palestinian refugees who are living in refugee camps and some localities that have a majority of Palestinians in Lebanon. The sampling frame relied on the total enumeration (census) that was implemented by the Palestinian Central Bureau of Statistics in 2010 of all the Palestinians living in the refugee camps and gatherings in Lebanon. The survey was based on a sampling frame that consisted of 1,430 clusters (a “cluster” being defined as a geographical area containing around 20 buildings and housing units on average). The clusters were the primary sampling units in the sampling design. The total sample size was approximately 2,600 households comprising 7,212 individuals (of 15 years or more). Each household therefore contained on average 2.8 individuals of 15 years or more. Of the total sample, the response rate reached 94%.
The implementation of the survey was synchronized with the implementation of the National Survey of Household Living Conditions for Lebanon currently executed by the Central Administration of Statistics covering all Lebanon. The labour force survey adopted the employment module utilized by the Central Administration of Statistics for their household survey to ensure – for the first time – accurate comparability of employment conditions between the Palestinians and Lebanese.


APPENDIx IIADDITIONAL TABLES
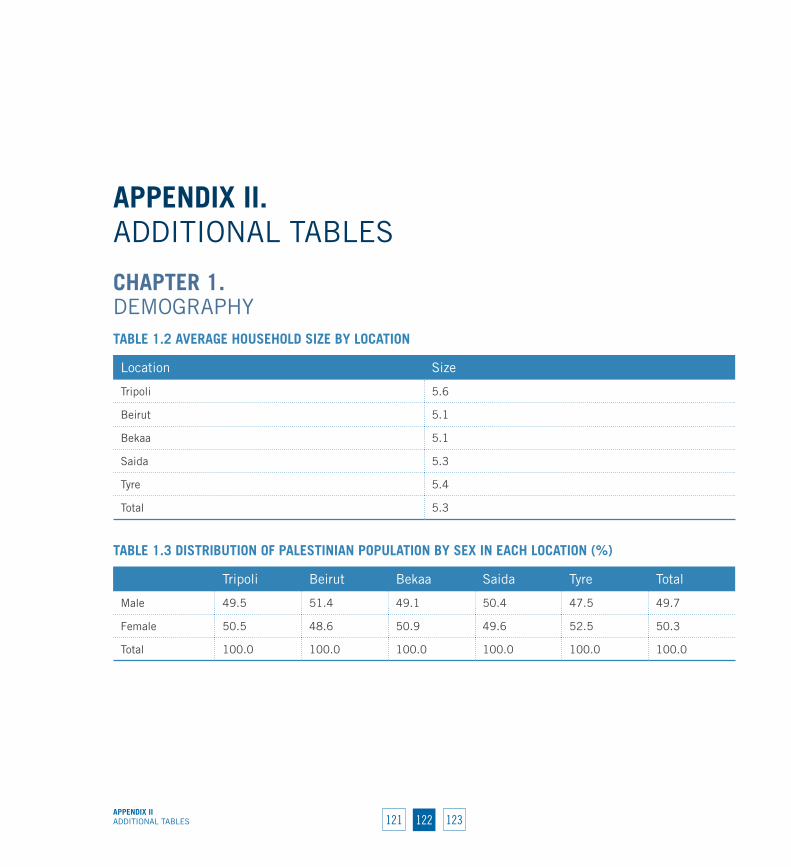
122 123APPENDIx IIADDITIONAL TABLES 121
APPENDIx II. ADDITIONAL TABLES
CHAPTEr 1. DEMOGRAPHYTABLE 1.2 AvErAGE HOuSEHOLD SIzE BY LOCATION
Location Size
Tripoli 5.6
Beirut 5.1
Bekaa 5.1
Saida 5.3
Tyre 5.4
Total 5.3
TABLE 1.3 DISTrIBuTION OF PALESTINIAN POPuLATION BY SEx IN EACH LOCATION (%)
Tripoli Beirut Bekaa Saida Tyre Total
Male 49.5 51.4 49.1 50.4 47.5 49.7
Female 50.5 48.6 50.9 49.6 52.5 50.3
Total 100.0 100.0 100.0 100.0 100.0 100.0

123122APPENDIx II
ADDITIONAL TABLES124
CHAPTEr 2. EDUCATIONTABLE 2.2 DISTrIBuTION OF PALESTINIAN POPuLATION BY EDuCATIONAL ATTAINMENT AND LOCATION (%)
Illiterate Read and write Primary Intermediate Secondary University
Tripoli 10.3 30.9 22.1 19.7 27.7 20.7
Beirut 23.0 15.4 18.5 19.0 19.4 13.3
Bekaa 3.2 5.0 8.0 10.5 10.5 16.8
Saida 26.2 39.8 33.7 27.1 29.0 29.8
Tyre 37.3 8.9 17.8 23.7 13.4 19.4
Total 100.0 100.0 100.0 100.0 100.0 100.0
TABLE 2.3 DISTrIBuTION OF PALESTINIAN POPuLATION BY EDuCATIONAL ATTAINMENT AND SEx (%)
Male Female Total
Illiterate 5.3 10.8 8.1
Read and write 19.6 15.0 17.3
Primary 34.7 31.5 33.0
Intermediate 22.6 25.1 23.9
Secondary 11.1 12.4 11.8
University 6.6 5.3 6.0
Total 100.0 100.0 100.0
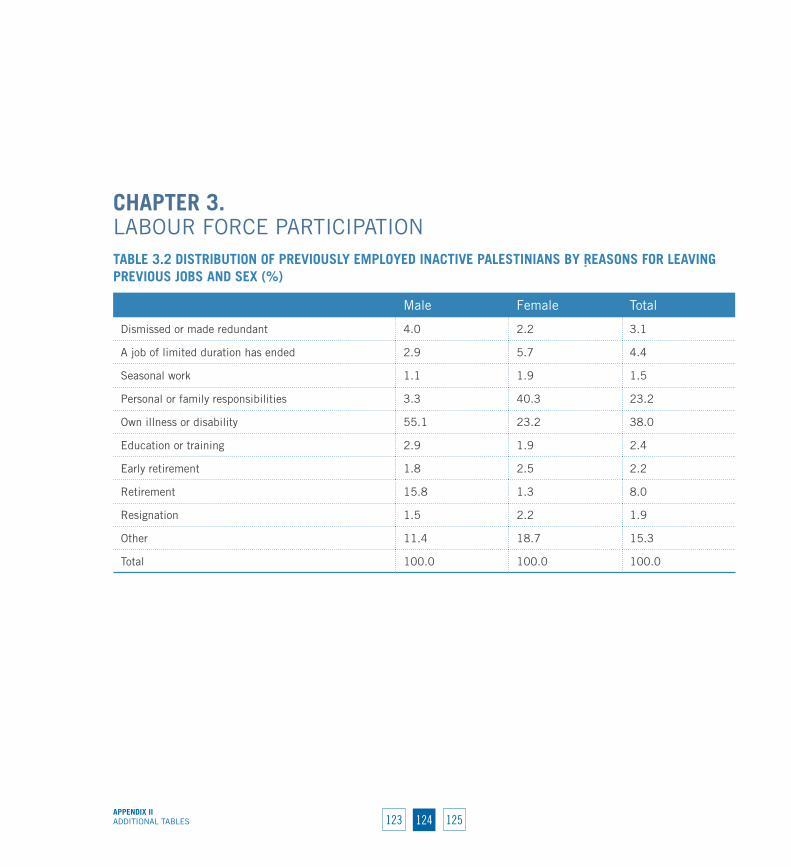
124 125APPENDIx IIADDITIONAL TABLES 123
CHAPTEr 3. LABOUR FORCE PARTICIPATIONTABLE 3.2 DISTrIBuTION OF PrEvIOuSLY EMPLOYED INACTIvE PALESTINIANS BY ٍrEASONS FOr LEAvING PrEvIOuS JOBS AND SEx (%)
Male Female Total
Dismissed or made redundant 4.0 2.2 3.1
A job of limited duration has ended 2.9 5.7 4.4
Seasonal work 1.1 1.9 1.5
Personal or family responsibilities 3.3 40.3 23.2
Own illness or disability 55.1 23.2 38.0
Education or training 2.9 1.9 2.4
Early retirement 1.8 2.5 2.2
Retirement 15.8 1.3 8.0
Resignation 1.5 2.2 1.9
Other 11.4 18.7 15.3
Total 100.0 100.0 100.0
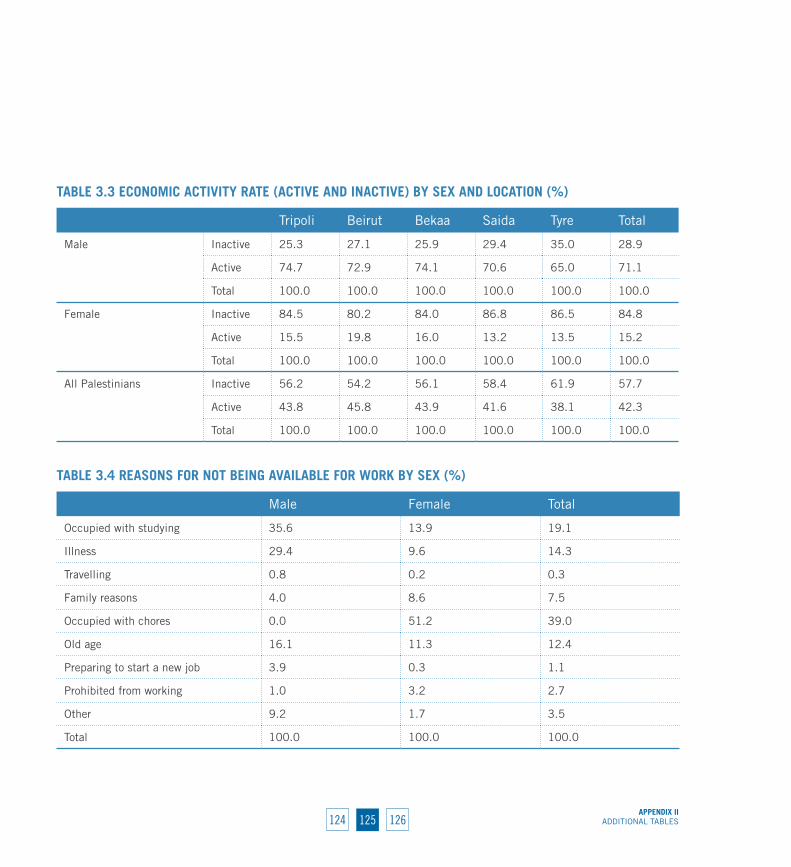
125124APPENDIx II
ADDITIONAL TABLES126
TABLE 3.3 ECONOMIC ACTIvITY rATE (ACTIvE AND INACTIvE) BY SEx AND LOCATION (%)
Tripoli Beirut Bekaa Saida Tyre Total
Male Inactive 25.3 27.1 25.9 29.4 35.0 28.9
Active 74.7 72.9 74.1 70.6 65.0 71.1
Total 100.0 100.0 100.0 100.0 100.0 100.0
Female Inactive 84.5 80.2 84.0 86.8 86.5 84.8
Active 15.5 19.8 16.0 13.2 13.5 15.2
Total 100.0 100.0 100.0 100.0 100.0 100.0
All Palestinians Inactive 56.2 54.2 56.1 58.4 61.9 57.7
Active 43.8 45.8 43.9 41.6 38.1 42.3
Total 100.0 100.0 100.0 100.0 100.0 100.0
TABLE 3.4 rEASONS FOr NOT BEING AvAILABLE FOr wOrK BY SEx (%)
Male Female Total
Occupied with studying 35.6 13.9 19.1
Illness 29.4 9.6 14.3
Travelling 0.8 0.2 0.3
Family reasons 4.0 8.6 7.5
Occupied with chores 0.0 51.2 39.0
Old age 16.1 11.3 12.4
Preparing to start a new job 3.9 0.3 1.1
Prohibited from working 1.0 3.2 2.7
Other 9.2 1.7 3.5
Total 100.0 100.0 100.0
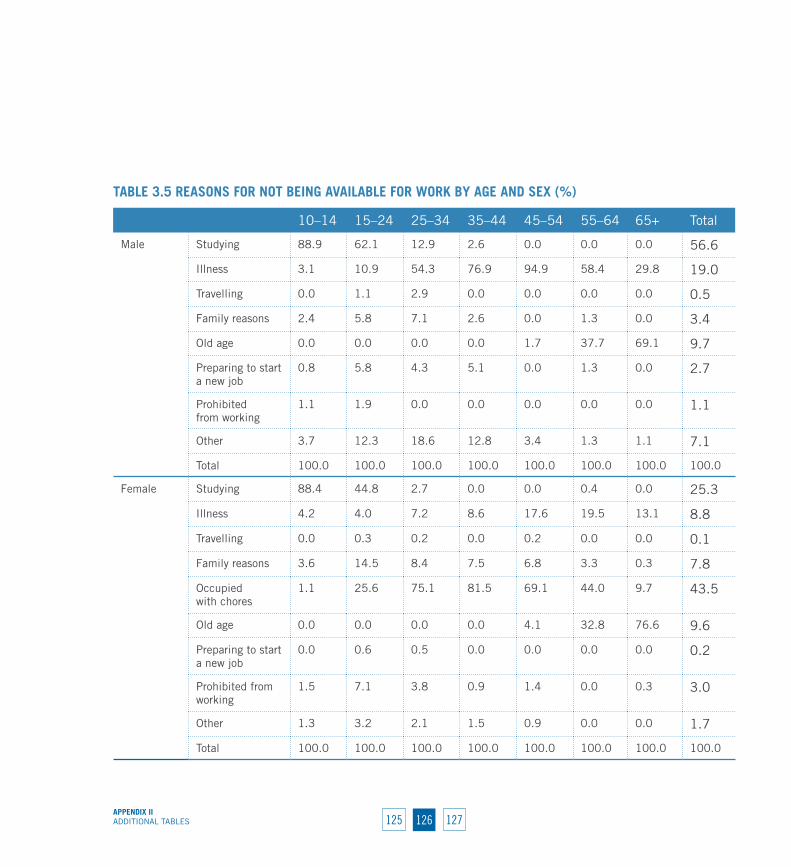
126 127APPENDIx IIADDITIONAL TABLES 125
TABLE 3.5 rEASONS FOr NOT BEING AvAILABLE FOr wOrK BY AGE AND SEx (%)
10–14 15–24 25–34 35–44 45–54 55–64 65+ Total
Male Studying 88.9 62.1 12.9 2.6 0.0 0.0 0.0 56.6
Illness 3.1 10.9 54.3 76.9 94.9 58.4 29.8 19.0
Travelling 0.0 1.1 2.9 0.0 0.0 0.0 0.0 0.5
Family reasons 2.4 5.8 7.1 2.6 0.0 1.3 0.0 3.4
Old age 0.0 0.0 0.0 0.0 1.7 37.7 69.1 9.7
Preparing to start a new job
0.8 5.8 4.3 5.1 0.0 1.3 0.0 2.7
Prohibited from working
1.1 1.9 0.0 0.0 0.0 0.0 0.0 1.1
Other 3.7 12.3 18.6 12.8 3.4 1.3 1.1 7.1
Total 100.0 100.0 100.0 100.0 100.0 100.0 100.0 100.0
Female Studying 88.4 44.8 2.7 0.0 0.0 0.4 0.0 25.3
Illness 4.2 4.0 7.2 8.6 17.6 19.5 13.1 8.8
Travelling 0.0 0.3 0.2 0.0 0.2 0.0 0.0 0.1
Family reasons 3.6 14.5 8.4 7.5 6.8 3.3 0.3 7.8
Occupied with chores
1.1 25.6 75.1 81.5 69.1 44.0 9.7 43.5
Old age 0.0 0.0 0.0 0.0 4.1 32.8 76.6 9.6
Preparing to start a new job
0.0 0.6 0.5 0.0 0.0 0.0 0.0 0.2
Prohibited from working
1.5 7.1 3.8 0.9 1.4 0.0 0.3 3.0
Other 1.3 3.2 2.1 1.5 0.9 0.0 0.0 1.7
Total 100.0 100.0 100.0 100.0 100.0 100.0 100.0 100.0
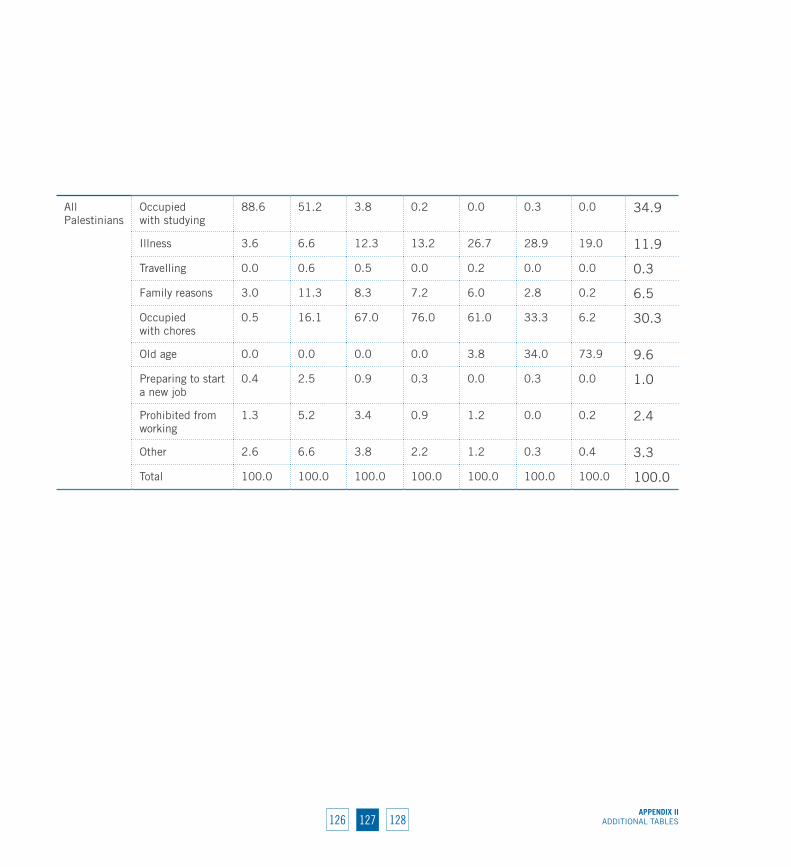
127126APPENDIx II
ADDITIONAL TABLES128
All Palestinians
Occupied with studying
88.6 51.2 3.8 0.2 0.0 0.3 0.0 34.9
Illness 3.6 6.6 12.3 13.2 26.7 28.9 19.0 11.9
Travelling 0.0 0.6 0.5 0.0 0.2 0.0 0.0 0.3
Family reasons 3.0 11.3 8.3 7.2 6.0 2.8 0.2 6.5
Occupied with chores
0.5 16.1 67.0 76.0 61.0 33.3 6.2 30.3
Old age 0.0 0.0 0.0 0.0 3.8 34.0 73.9 9.6
Preparing to start a new job
0.4 2.5 0.9 0.3 0.0 0.3 0.0 1.0
Prohibited from working
1.3 5.2 3.4 0.9 1.2 0.0 0.2 2.4
Other 2.6 6.6 3.8 2.2 1.2 0.3 0.4 3.3
Total 100.0 100.0 100.0 100.0 100.0 100.0 100.0 100.0
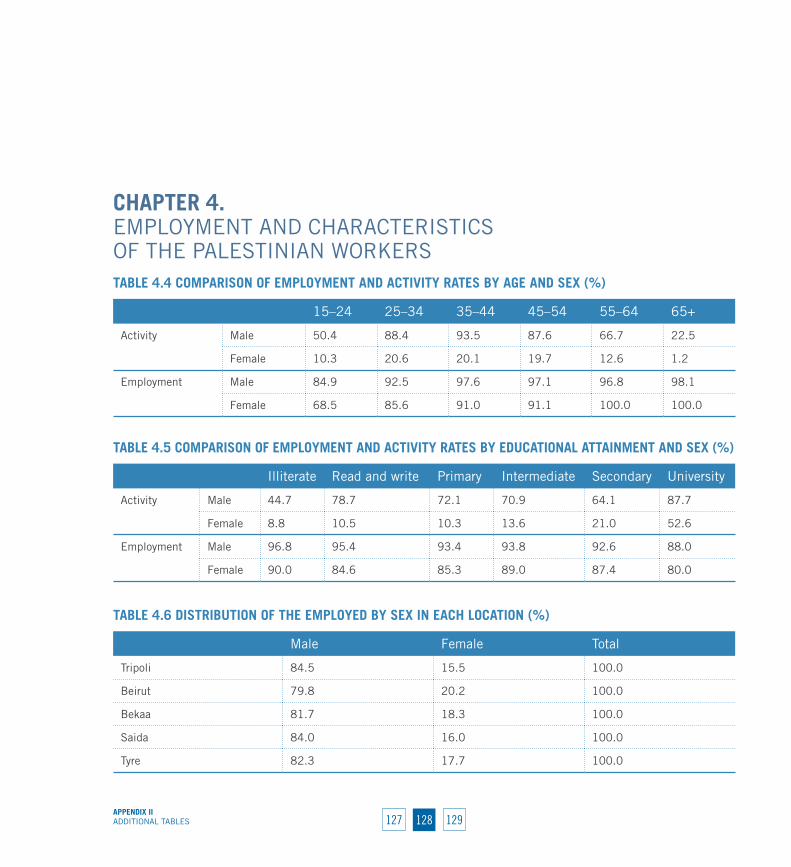
128 129APPENDIx IIADDITIONAL TABLES 127
CHAPTEr 4. EMPLOYMENT AND CHARACTERISTICS OF THE PALESTINIAN WORKERSTABLE 4.4 COMPArISON OF EMPLOYMENT AND ACTIvITY rATES BY AGE AND SEx (%)
15–24 25–34 35–44 45–54 55–64 65+
Activity Male 50.4 88.4 93.5 87.6 66.7 22.5
Female 10.3 20.6 20.1 19.7 12.6 1.2
Employment Male 84.9 92.5 97.6 97.1 96.8 98.1
Female 68.5 85.6 91.0 91.1 100.0 100.0
TABLE 4.5 COMPArISON OF EMPLOYMENT AND ACTIvITY rATES BY EDuCATIONAL ATTAINMENT AND SEx (%)
Illiterate Read and write Primary Intermediate Secondary University
Activity Male 44.7 78.7 72.1 70.9 64.1 87.7
Female 8.8 10.5 10.3 13.6 21.0 52.6
Employment Male 96.8 95.4 93.4 93.8 92.6 88.0
Female 90.0 84.6 85.3 89.0 87.4 80.0
TABLE 4.6 DISTrIBuTION OF THE EMPLOYED BY SEx IN EACH LOCATION (%)
Male Female Total
Tripoli 84.5 15.5 100.0
Beirut 79.8 20.2 100.0
Bekaa 81.7 18.3 100.0
Saida 84.0 16.0 100.0
Tyre 82.3 17.7 100.0
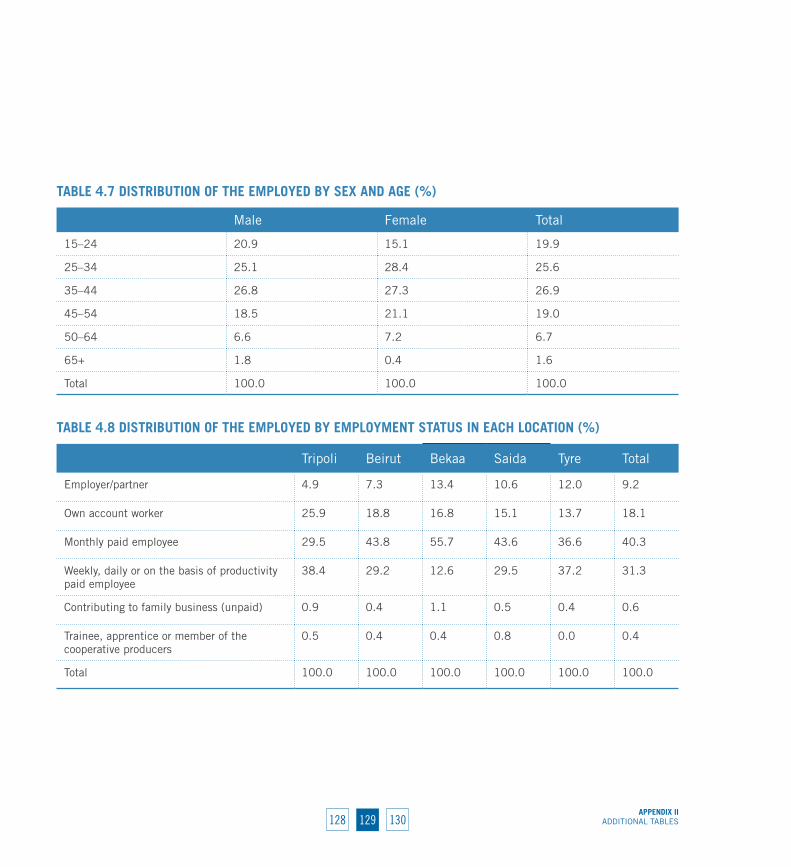
129128APPENDIx II
ADDITIONAL TABLES130
TABLE 4.7 DISTrIBuTION OF THE EMPLOYED BY SEx AND AGE (%)
Male Female Total
15–24 20.9 15.1 19.9
25–34 25.1 28.4 25.6
35–44 26.8 27.3 26.9
45–54 18.5 21.1 19.0
50–64 6.6 7.2 6.7
65+ 1.8 0.4 1.6
Total 100.0 100.0 100.0
TABLE 4.8 DISTrIBuTION OF THE EMPLOYED BY EMPLOYMENT STATuS IN EACH LOCATION (%)
Tripoli Beirut Bekaa Saida Tyre Total
Employer/partner 4.9 7.3 13.4 10.6 12.0 9.2
Own account worker 25.9 18.8 16.8 15.1 13.7 18.1
Monthly paid employee 29.5 43.8 55.7 43.6 36.6 40.3
Weekly, daily or on the basis of productivity paid employee
38.4 29.2 12.6 29.5 37.2 31.3
Contributing to family business (unpaid) 0.9 0.4 1.1 0.5 0.4 0.6
Trainee, apprentice or member of the cooperative producers
0.5 0.4 0.4 0.8 0.0 0.4
Total 100.0 100.0 100.0 100.0 100.0 100.0
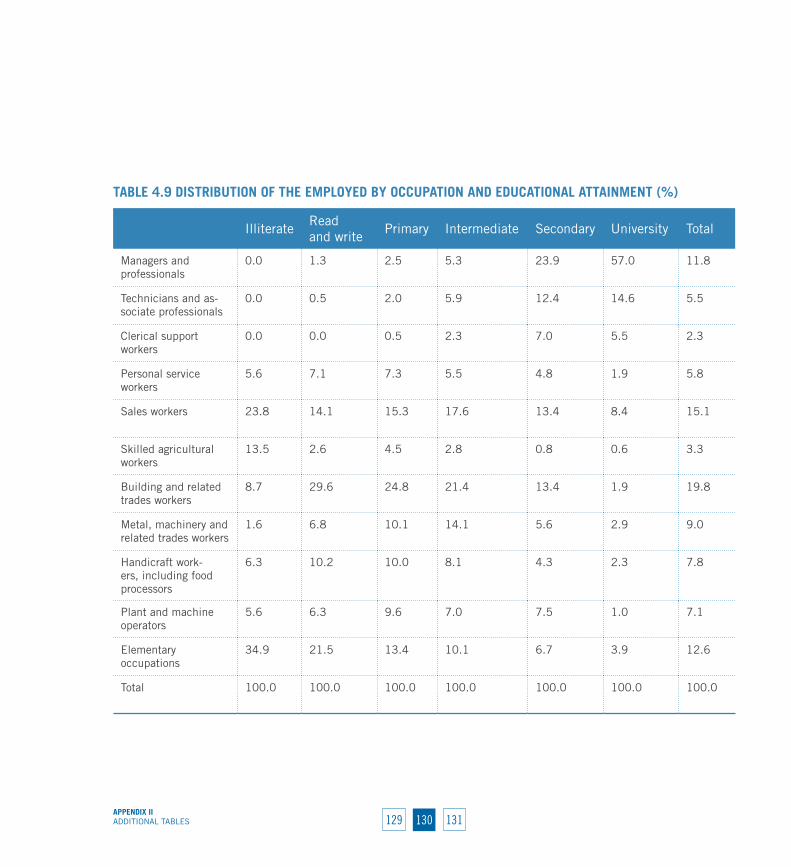
130 131APPENDIx IIADDITIONAL TABLES 129
TABLE 4.9 DISTrIBuTION OF THE EMPLOYED BY OCCuPATION AND EDuCATIONAL ATTAINMENT (%)
IlliterateRead and write
Primary Intermediate Secondary University Total
Managers and professionals
0.0 1.3 2.5 5.3 23.9 57.0 11.8
Technicians and as-sociate professionals
0.0 0.5 2.0 5.9 12.4 14.6 5.5
Clerical support workers
0.0 0.0 0.5 2.3 7.0 5.5 2.3
Personal service workers
5.6 7.1 7.3 5.5 4.8 1.9 5.8
Sales workers 23.8 14.1 15.3 17.6 13.4 8.4 15.1
Skilled agricultural workers
13.5 2.6 4.5 2.8 0.8 0.6 3.3
Building and related trades workers
8.7 29.6 24.8 21.4 13.4 1.9 19.8
Metal, machinery and related trades workers
1.6 6.8 10.1 14.1 5.6 2.9 9.0
Handicraft work-ers, including food processors
6.3 10.2 10.0 8.1 4.3 2.3 7.8
Plant and machine operators
5.6 6.3 9.6 7.0 7.5 1.0 7.1
Elementary occupations
34.9 21.5 13.4 10.1 6.7 3.9 12.6
Total 100.0 100.0 100.0 100.0 100.0 100.0 100.0
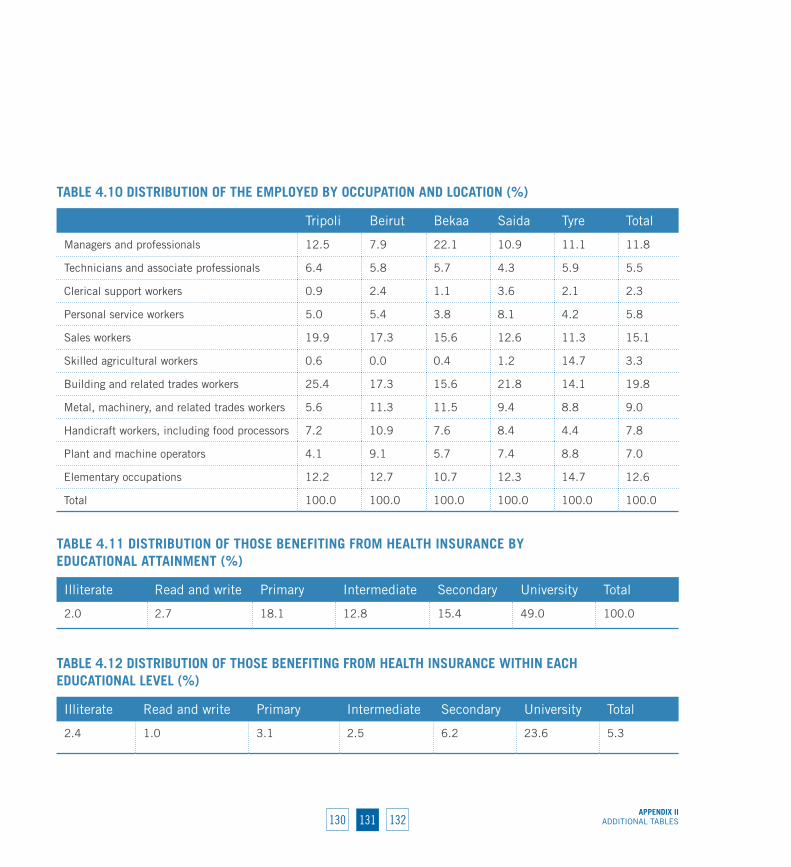
131130APPENDIx II
ADDITIONAL TABLES132
TABLE 4.10 DISTrIBuTION OF THE EMPLOYED BY OCCuPATION AND LOCATION (%)
Tripoli Beirut Bekaa Saida Tyre Total
Managers and professionals 12.5 7.9 22.1 10.9 11.1 11.8
Technicians and associate professionals 6.4 5.8 5.7 4.3 5.9 5.5
Clerical support workers 0.9 2.4 1.1 3.6 2.1 2.3
Personal service workers 5.0 5.4 3.8 8.1 4.2 5.8
Sales workers 19.9 17.3 15.6 12.6 11.3 15.1
Skilled agricultural workers 0.6 0.0 0.4 1.2 14.7 3.3
Building and related trades workers 25.4 17.3 15.6 21.8 14.1 19.8
Metal, machinery, and related trades workers 5.6 11.3 11.5 9.4 8.8 9.0
Handicraft workers, including food processors 7.2 10.9 7.6 8.4 4.4 7.8
Plant and machine operators 4.1 9.1 5.7 7.4 8.8 7.0
Elementary occupations 12.2 12.7 10.7 12.3 14.7 12.6
Total 100.0 100.0 100.0 100.0 100.0 100.0
TABLE 4.11 DISTrIBuTION OF THOSE BENEFITING FrOM HEALTH INSurANCE BY EDuCATIONAL ATTAINMENT (%)
Illiterate Read and write Primary Intermediate Secondary University Total
2.0 2.7 18.1 12.8 15.4 49.0 100.0
TABLE 4.12 DISTrIBuTION OF THOSE BENEFITING FrOM HEALTH INSurANCE wITHIN EACH EDuCATIONAL LEvEL (%)
Illiterate Read and write Primary Intermediate Secondary University Total
2.4 1.0 3.1 2.5 6.2 23.6 5.3
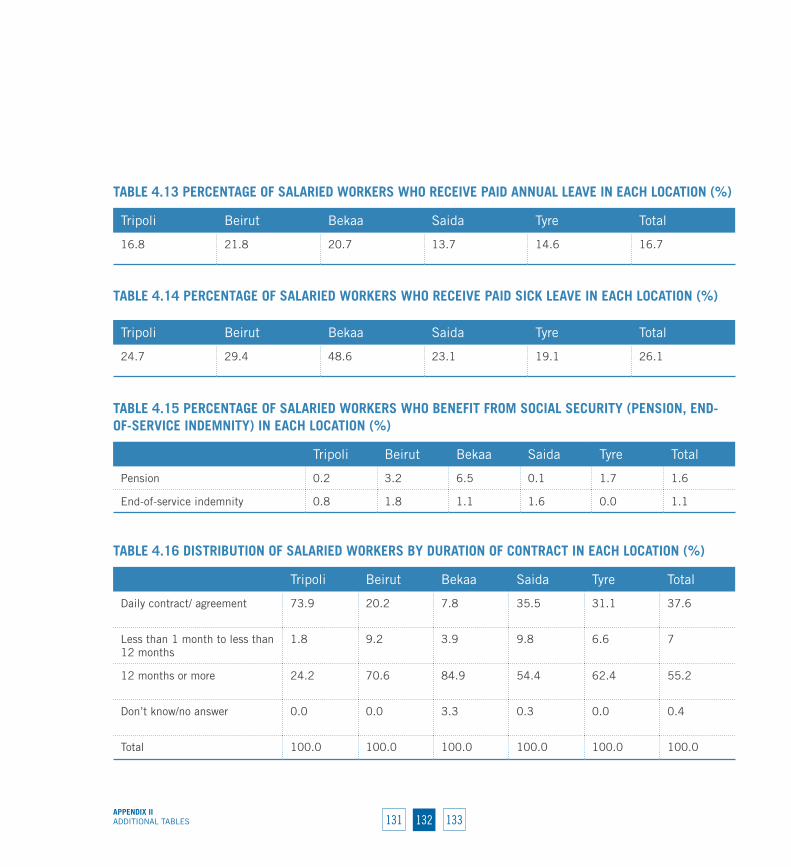
132 133APPENDIx IIADDITIONAL TABLES 131
TABLE 4.13 PErCENTAGE OF SALArIED wOrKErS wHO rECEIvE PAID ANNuAL LEAvE IN EACH LOCATION (%)
Tripoli Beirut Bekaa Saida Tyre Total
16.8 21.8 20.7 13.7 14.6 16.7
TABLE 4.16 DISTrIBuTION OF SALArIED wOrKErS BY DurATION OF CONTrACT IN EACH LOCATION (%)
Tripoli Beirut Bekaa Saida Tyre Total
Daily contract/ agreement 73.9 20.2 7.8 35.5 31.1 37.6
Less than 1 month to less than 12 months
1.8 9.2 3.9 9.8 6.6 7
12 months or more 24.2 70.6 84.9 54.4 62.4 55.2
Don’t know/no answer 0.0 0.0 3.3 0.3 0.0 0.4
Total 100.0 100.0 100.0 100.0 100.0 100.0
TABLE 4.14 PErCENTAGE OF SALArIED wOrKErS wHO rECEIvE PAID SICK LEAvE IN EACH LOCATION (%)
Tripoli Beirut Bekaa Saida Tyre Total
24.7 29.4 48.6 23.1 19.1 26.1
TABLE 4.15 PErCENTAGE OF SALArIED wOrKErS wHO BENEFIT FrOM SOCIAL SECurITY (PENSION, END-OF-SErvICE INDEMNITY) IN EACH LOCATION (%)
Tripoli Beirut Bekaa Saida Tyre Total
Pension 0.2 3.2 6.5 0.1 1.7 1.6
End-of-service indemnity 0.8 1.8 1.1 1.6 0.0 1.1
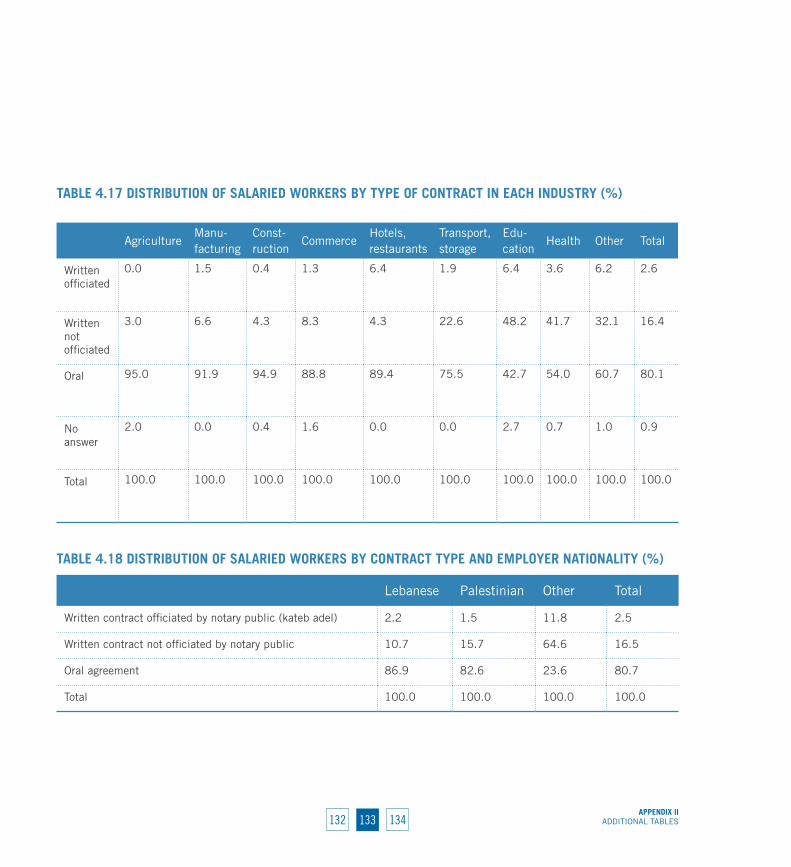
133132APPENDIx II
ADDITIONAL TABLES134
TABLE 4.17 DISTrIBuTION OF SALArIED wOrKErS BY TYPE OF CONTrACT IN EACH INDuSTrY (%)
AgricultureManu-facturing
Const-ruction
CommerceHotels, restaurants
Transport, storage
Edu-cation
Health Other Total
Written officiated
0.0 1.5 0.4 1.3 6.4 1.9 6.4 3.6 6.2 2.6
Written not officiated
3.0 6.6 4.3 8.3 4.3 22.6 48.2 41.7 32.1 16.4
Oral 95.0 91.9 94.9 88.8 89.4 75.5 42.7 54.0 60.7 80.1
No answer
2.0 0.0 0.4 1.6 0.0 0.0 2.7 0.7 1.0 0.9
Total 100.0 100.0 100.0 100.0 100.0 100.0 100.0 100.0 100.0 100.0
TABLE 4.18 DISTrIBuTION OF SALArIED wOrKErS BY CONTrACT TYPE AND EMPLOYEr NATIONALITY (%)
Lebanese Palestinian Other Total
Written contract officiated by notary public (kateb adel) 2.2 1.5 11.8 2.5
Written contract not officiated by notary public 10.7 15.7 64.6 16.5
Oral agreement 86.9 82.6 23.6 80.7
Total 100.0 100.0 100.0 100.0
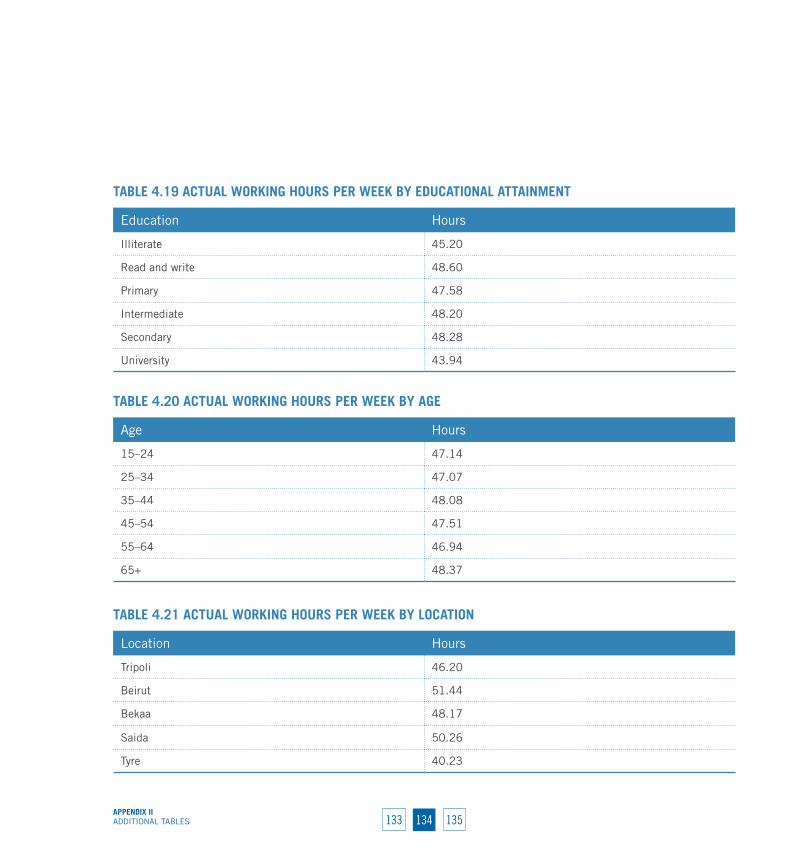
134 135APPENDIx IIADDITIONAL TABLES 133
TABLE 4.19 ACTuAL wOrKING HOurS PEr wEEK BY EDuCATIONAL ATTAINMENT
Education Hours
Illiterate 45.20
Read and write 48.60
Primary 47.58
Intermediate 48.20
Secondary 48.28
University 43.94
TABLE 4.20 ACTuAL wOrKING HOurS PEr wEEK BY AGE
Age Hours
15–24 47.14
25–34 47.07
35–44 48.08
45–54 47.51
55–64 46.94
65+ 48.37
TABLE 4.21 ACTuAL wOrKING HOurS PEr wEEK BY LOCATION
Location Hours
Tripoli 46.20
Beirut 51.44
Bekaa 48.17
Saida 50.26
Tyre 40.23
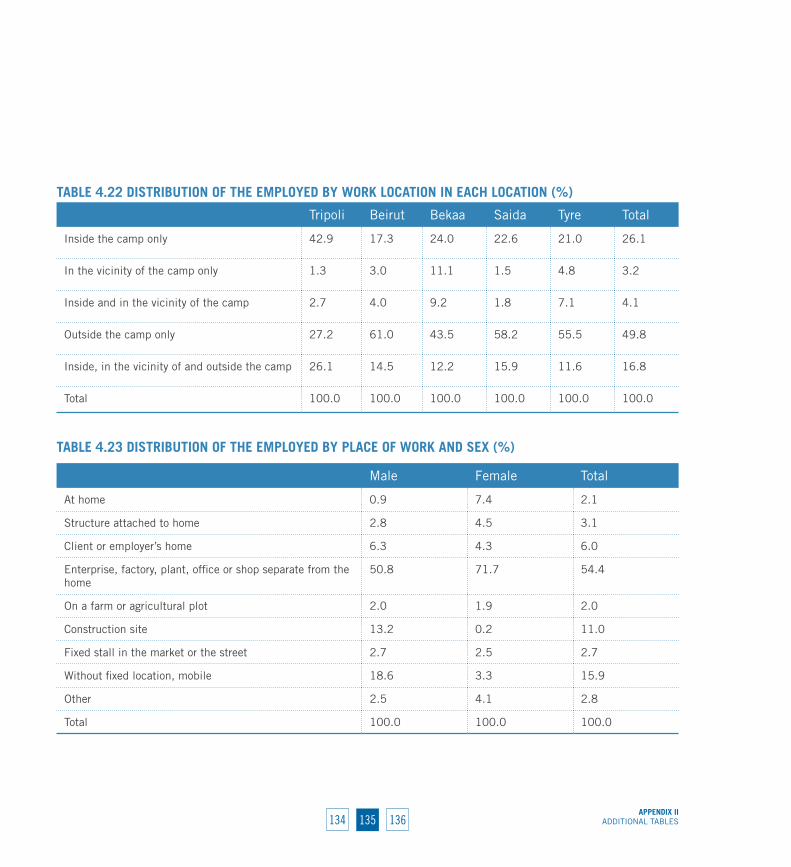
135134APPENDIx II
ADDITIONAL TABLES136
TABLE 4.22 DISTrIBuTION OF THE EMPLOYED BY wOrK LOCATION IN EACH LOCATION (%)
Tripoli Beirut Bekaa Saida Tyre Total
Inside the camp only 42.9 17.3 24.0 22.6 21.0 26.1
In the vicinity of the camp only 1.3 3.0 11.1 1.5 4.8 3.2
Inside and in the vicinity of the camp 2.7 4.0 9.2 1.8 7.1 4.1
Outside the camp only 27.2 61.0 43.5 58.2 55.5 49.8
Inside, in the vicinity of and outside the camp 26.1 14.5 12.2 15.9 11.6 16.8
Total 100.0 100.0 100.0 100.0 100.0 100.0
TABLE 4.23 DISTrIBuTION OF THE EMPLOYED BY PLACE OF wOrK AND SEx (%)
Male Female Total
At home 0.9 7.4 2.1
Structure attached to home 2.8 4.5 3.1
Client or employer’s home 6.3 4.3 6.0
Enterprise, factory, plant, office or shop separate from the home
50.8 71.7 54.4
On a farm or agricultural plot 2.0 1.9 2.0
Construction site 13.2 0.2 11.0
Fixed stall in the market or the street 2.7 2.5 2.7
Without fixed location, mobile 18.6 3.3 15.9
Other 2.5 4.1 2.8
Total 100.0 100.0 100.0
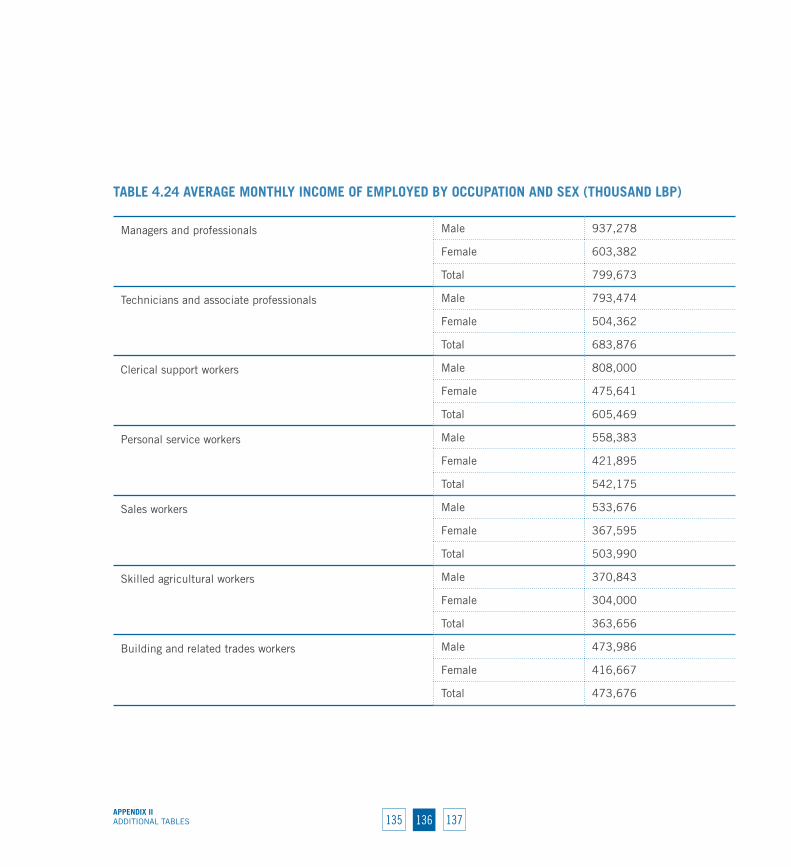
136 137APPENDIx IIADDITIONAL TABLES 135
TABLE 4.24 AvErAGE MONTHLY INCOME OF EMPLOYED BY OCCuPATION AND SEx (THOuSAND LBP)
Managers and professionals Male 937,278
Female 603,382
Total 799,673
Technicians and associate professionals Male 793,474
Female 504,362
Total 683,876
Clerical support workers Male 808,000
Female 475,641
Total 605,469
Personal service workers Male 558,383
Female 421,895
Total 542,175
Sales workers Male 533,676
Female 367,595
Total 503,990
Skilled agricultural workers Male 370,843
Female 304,000
Total 363,656
Building and related trades workers Male 473,986
Female 416,667
Total 473,676

137136APPENDIx II
ADDITIONAL TABLES138
Metal, machinery and related trades workers Male 523,766
Female 500,000
Total 523,383
Handicraft workers, incl. food processors Male 535,959
Female 311,905
Total 491,986
Plant and machine operators Male 515,293
Female 391,667
Total 511,528
Elementary occupations Male 478,431
Female 353,500
Total 450,198
All Palestinians Male 553,660
Female 456,690
Total 537,243

138 139APPENDIx IIADDITIONAL TABLES 137
TABLE 4.25 DISTrIBuTION OF PALESTINIAN wOrKErS BY ELIGIBILITY TO JOIN TrADE uNIONS (%)
Union of Palestinian only 77.8
Union of Lebanese only 1.0
Union of Palestinian and Lebanese 0.4
Not eligible for 19.5
Don’t know / no answer 1.3
Total 100.0
TABLE 4.26 DISTrIBuTION OF PALESTINIAN wOrKErS BY rEGISTErATION IN TrADE uNIONS (%)
Palestinian unions only 18.2
Lebanese unions only 1.5
Palestinian and Lebanese unions 0.2
Not registered in any union 77.6
Don’t know / no answer 2.5
Total 100.0
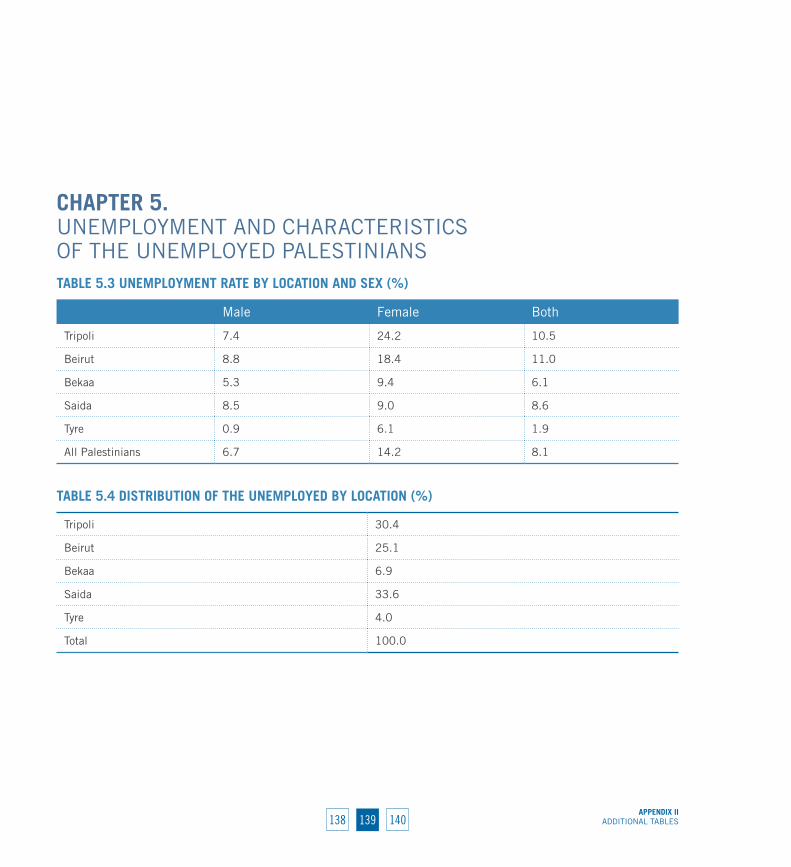
139138APPENDIx II
ADDITIONAL TABLES140
CHAPTEr 5. UNEMPLOYMENT AND CHARACTERISTICS OF THE UNEMPLOYED PALESTINIANS TABLE 5.3 uNEMPLOYMENT rATE BY LOCATION AND SEx (%)
Male Female Both
Tripoli 7.4 24.2 10.5
Beirut 8.8 18.4 11.0
Bekaa 5.3 9.4 6.1
Saida 8.5 9.0 8.6
Tyre 0.9 6.1 1.9
All Palestinians 6.7 14.2 8.1
TABLE 5.4 DISTrIBuTION OF THE uNEMPLOYED BY LOCATION (%)
Tripoli 30.4
Beirut 25.1
Bekaa 6.9
Saida 33.6
Tyre 4.0
Total 100.0
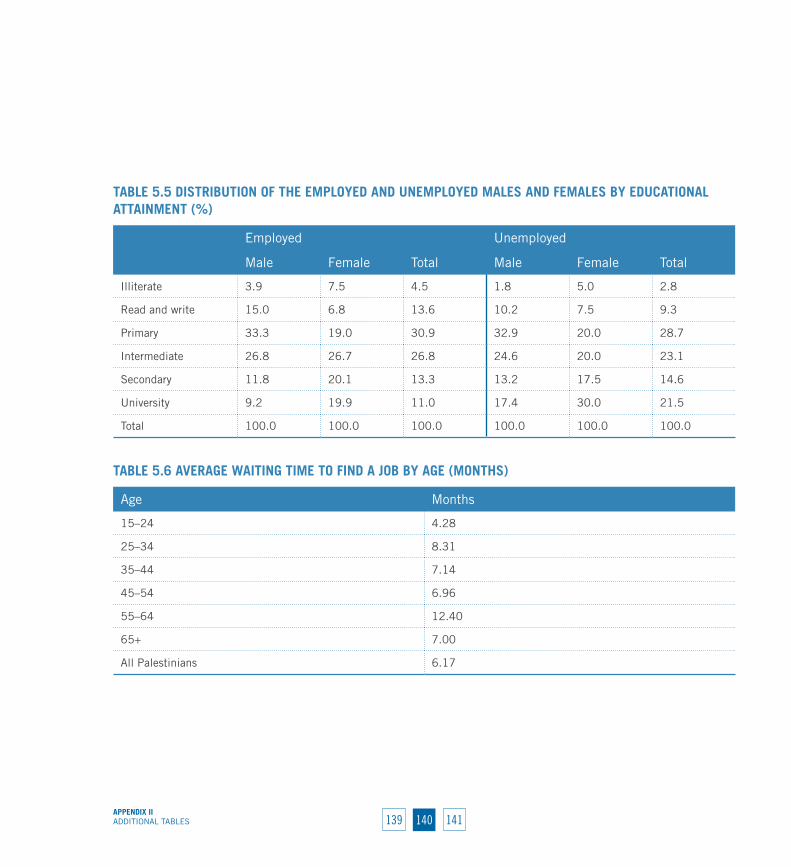
140 141APPENDIx IIADDITIONAL TABLES 139
TABLE 5.5 DISTrIBuTION OF THE EMPLOYED AND uNEMPLOYED MALES AND FEMALES BY EDuCATIONAL ATTAINMENT (%)
Employed Unemployed
Male Female Total Male Female Total
Illiterate 3.9 7.5 4.5 1.8 5.0 2.8
Read and write 15.0 6.8 13.6 10.2 7.5 9.3
Primary 33.3 19.0 30.9 32.9 20.0 28.7
Intermediate 26.8 26.7 26.8 24.6 20.0 23.1
Secondary 11.8 20.1 13.3 13.2 17.5 14.6
University 9.2 19.9 11.0 17.4 30.0 21.5
Total 100.0 100.0 100.0 100.0 100.0 100.0
TABLE 5.6 AvErAGE wAITING TIME TO FIND A JOB BY AGE (MONTHS)
Age Months
15–24 4.28
25–34 8.31
35–44 7.14
45–54 6.96
55–64 12.40
65+ 7.00
All Palestinians 6.17

141140APPENDIx II
ADDITIONAL TABLES142


rEFErENCES

144 145rEFErENCES 143
rEFErENCESAbdulrahim, S.; El-Shareef, M.; Alameddine, M.; Afifi, R.A.;
Hammad, S. 2010. “The potential and challenges of an academic-community partnership in a low trust urban context”, in Journal of Urban Health, Vol. 87, No. 6, pp. 1017–1020.
Abdulrahim, S.; Khawaja, M. 2011. “The cost of being Palestinian in Lebanon”, in Journal of Ethnic and Migration Studies, Vol. 37, No. 1, pp. 151–166.
Abdunnur, L.; Abdunnur, S.; Madi, Y. 2008. A comprehensive survey and needs assessment of dropouts and reform strategies (UNRWA Lebanon Education Programme).
Abou Namel, H. 2008. In A. Sayigh (ed): Awraq Filistiniya wa Arabia [Palestinian and Arab Papers] (Arab Scientific Publishers), p. 144 (in Arabic).
Ali, A.M. 2004. Palestinian labor and trends of the Palestinian labor syndicate movement in Lebanon 1948–2004 (Beirut, Baheth Liddirasat).
Amnesty International. 2007. Exiled and suffering: Palestinian refugees in Lebanon. Available online at http://www.amnesty.org/en/library/asset/MDE18/010/2007/en/34373bc5-d367-11dd-a329-2f46302a8cc6/mde180102007en.pdf.
Central Administration of Statistics (CAS). 2004. National Survey of Household Living Conditions 2004 (Beirut).
Central Administration of Statistics (CAS). 2007. National Survey of Household Living Conditions 2007 (Beirut).
Central Administration of Statistics (CAS). 2011. “Labour market in Lebanon”, Statistics in Focus, issue 1, October 2011.
Chaaban, J.; Ghattas, H.; Habib, R.; Hanafi, S.; Sahyoun, N.; Salti, N.; Seyfert, K.; Naamani, N. 2010. Socio-economic survey of Palestine refugees in Lebanon (American University of Beirut and United Nations Relief and Works Agency for Palestine Refugees in the Near East).
Chatty, D.; Hundt, G.L. 2005. Children of Palestine: Experiencing forced migration in the Middle East (New York, Berghahn Books).
El-Natour, S.; Yassine, D. 2007. The legal status of the Palestine refugees in Lebanon and the demands of adjustment, study prepared by Human Development Center with support and funding of Canadian International Development Research Center.
Fafo. 2003. Difficult past, uncertain future: Living conditions among Palestinian refugees in camps and gatherings in Lebanon (Oslo).
Fafo. 2006. Study on the employability of Palestinian refugees in Lebanon (Oslo).
Hillenkamp, B. 2008. The challenges of Palestinian education (Lebanese Palestinian Dialogue Committee).
International Labour Organization (ILO) and Committee for the Employment of Palestinian Refugees in Lebanon (CEP). 2010. Review of studies on the employability of Palestinian refugees in the Lebanese labour market (Beirut, ILO Regional Office for the Arab States and CEP).
Khalidi, A.; Tabbarah, R. 2009. Working unprotected: Contributions of Palestinian refugees residing in camps and some gatherings to the Lebanese economy, report on 2008 household survey and qualitative research.
Palestinian Central Bureau of Statistics (PCBS). 2007. CensusInfo: Population, housing and establishment census 2007. Available online at http://82.213.38.42/CensusInfo/.
Palestinian Central Bureau of Statistics (PCBS). 2012. Labour force survey (April–June, 2021) round (Q1/2012): Press report on the labour force survey results (Ramallah, Palestine).
Palestinian Human Rights Organization. 2007. Lebanese labour laws, Palestinian refugees, recent situations (Lebanon).

145144 rEFErENCES146
Roberts, R. 2010. Palestinians in Lebanon: Refugees living with long-term displacement (London, I.B. Tauris).
Sirhan, B.T. 1996. Problems facing the education of Palestinians in Lebanon (Oxford University, Centre for Lebanese Studies).
Tiltnes, A. 2005. Falling behind: A brief on the living conditions of Palestinian refugees in Lebanon, Fafo Report No. 46.
United Nations Children’s Fund (UNICEF). 2010. The situation of Palestinian children in the Occupied Palestinian Territory, Jordan, Syria and Lebanon.
United Nations Development Programme (UNDP). 2008. Poverty, growth, and income distribution in Lebanon (Ministry of Social Affairs and UNDP).
United Nations General Assembly. 1948. Resolution 194 (III). Palestine: Progress report of the United Nations mediator. Available online at http://unispal.un.org/UNISPAL.NSF/0/C758572B78D1CD0085256BCF0077E51A.
United Nations Relief and Works Agency for Palestine Refugees in the Near East (UNRWA). 2009. Annual report of the Department of Health 2008 (Amman, UNRWA Health Department).
United Nations Relief and Works Agency for Palestine Refugees in the Near East (UNRWA). 2011. UNRWA statistics 2010: Selected indicators. Available online at http://www.unrwa.org/userfiles/2011120434013.pdf.
World Bank. 2011. Lebanon – Good jobs needed: The role of macro, investment, labor, education, and social protection policies (Washington, DC, World Bank).