Employment in Export-Oriented Agricultural Value Chain in ... · Employment in Export-Oriented...
30
Joint EU-ILO Government of Rwanda project: Strengthening the impact on employment of sectoral and trade policies Employment in Export-Oriented Agricultural Value Chain in Rwanda April 2019 Synthesis report This document was produced by the International Labour Office with the financial assistance of the European Union
Transcript of Employment in Export-Oriented Agricultural Value Chain in ... · Employment in Export-Oriented...

Joint EU-ILO Government of Rwanda project: Strengthening the
impact on employment of sectoral and trade policies
Employment in Export-Oriented
Agricultural Value Chain in Rwanda
April 2019
Synthesis report
This document was produced by the International Labour Office
with the financial assistance of the European Union

2

3
Copyright © International Labour Organization 2019
First published 2019
Copyright © International Labour Organization 2019
Publications of the International Labour Office enjoy copyright under Protocol 2 of the Universal Copyright Convention. Nevertheless, short
excerpts from them may be reproduced without authorization, on condition that the source is indicated. For rights of reproduction or translation,
application should be made to the Publications Bureau (Rights and Permissions), International Labour Office, CH-1211 Geneva 22,
Switzerland. The International Labour Office welcomes such applications.
Libraries, institutions and other users registered in the United Kingdom with the Copyright Licensing Agency, 90 Tottenham Court Road,
London W1T 4LP [Fax: (+44) (0)20 7631 5500; email: [email protected]], in the United States with the Copyright Clearance Center, 222 Rosewood Drive, Danvers, MA 01923 [Fax: (+1) (978) 750 4470; email: [email protected]] or in other countries with associated
Reproduction Rights Organizations, may make photocopies in accordance with the licences issued to them for this purpose.
ISSN 1999-2939; ISSN 1999-2947 (web pdf)
International Labour Office; Employment Sector.
ILO Cataloguing in Publication Data
The designations employed in ILO publications, which are in conformity with United Nations practice, and the presentation of material therein
do not imply the expression of any opinion whatsoever on the part of the International Labour Office concerning the legal status of any country,
area or territory or of its authorities, or concerning the delimitation of its frontiers.
The responsibility for opinions expressed in signed articles, studies and other contributions rests solely with their authors, and publication does
not constitute an endorsement by the International Labour Office of the opinions expressed in them.
Reference to names of firms and commercial products and processes does not imply their endorsement by the International Labour Office, and
any failure to mention a particular firm, commercial product or process is not a sign of disapproval.
ILO publications and electronic products can be obtained through major booksellers or ILO local offices in many countries, or direct from ILO
Publications, International Labour Office, CH-1211 Geneva 22, Switzerland. Catalogues or lists of new publications are available free of charge
from the above address, or by email: [email protected]
Visit our website: http://www.ilo.org/publns
Printed by the International Labour Office, Geneva, Switzerland

Contents
1. Introduction ................................................................................................................................................. 4
2. Methodology ................................................................................................................................................ 5
3. Traditional export value chains ................................................................................................................ 8
3.1. Pyrethrum value chain................................................................................................................... 8 Production and revenue .................................................................................................................................. 8
Employment and wages .................................................................................................................................. 9
3.2. Tea value chain ............................................................................................................................ 10 Production and revenue ................................................................................................................................ 11
Employment and wages ................................................................................................................................ 12
3.3. Coffee value chain ....................................................................................................................... 13 Production and revenue ................................................................................................................................ 13
Employment and wages ................................................................................................................................ 14
4. Non-traditional export value chains ...................................................................................................... 15
4.1. Essential oils value chain ........................................................................................................... 15
4.2. Green beans ................................................................................................................................. 17
4.3 Cut flowers ..................................................................................................................................... 18
5. Employment implications and projections .......................................................................................... 20
6. Policy implications ................................................................................................................................... 24
7. Recommendations.............................................................................................................................. 25
References ..................................................................................................................................................... 27

2
List of tables and figures
Table 1: Summary of pyrethrum survey ................................................................................... 9
Table 2: Green leaf supply and revenue estimates ................................................................ 12
Table 3: Production, supply and revenue in the coffee value chain ........................................ 14
Table 4: Essential oils, production, price and revenue ........................................................... 16
Table 5: Green beans, price and revenue .............................................................................. 18
Table 6: Cut flowers production, supply, and price for sample of producers ........................... 19
Table 7: Estimating the employment effects of the untapped export
potential………………………………………………………………………………………………...22
Figure 1: Pyrethrum export value (USD) .................................................................................. 9
Figure 2: Pyrethrum – split of export value along the value chain (2016) ............................... 10
Figure 3: Tea value chain ....................................................................................................... 11
Figure 4: Tea – split of export value along the value chain (2016) .......................................... 13
Figure 5: Simplified coffee value chain ................................................................................... 13
Figure 6: Coffee – split of export value along the value chain (2016) ..................................... 15
Figure 7: Essential oils value chain and contractual relationships between producers and
processors ............................................................................................................................. 16
Figure 8: Green bean value chain .......................................................................................... 17
Figure 9: Cut flowers value chain ........................................................................................... 18
Figure 10: Cut flowers - incomes and expenses along the value chain .................................. 19
Figure 11: Employment per USD 1 million of exports in the for traditional export crops .......... 20
Figure 12: Employment generated per ha of traditional export crop grown (2016) ................. 22
Figure 13: Export value generated per ha of traditional export crop grown (USD 2016) ......... 23

3
Abbreviations
CWS Coffee Washing Station
EU European Union
ILO International Labour Office
ITC International Trade Centre
MINECOFIN Ministry of Finance and Economic Planning
NAEB National Agricultural Export Development Board
NISR National Institute of Statistics of Rwanda
RWF Rwandan Franc
Acknowledgements
This summary document was produced in the context of the Strengthen project. The following
people contributed to the document: Maikel Lieuw-Kie-Song, Haile Abebe, Faustin Mwambari,
Jean Marc Mkundabantu, Jean Paul Gahamanyi and Julien Varlin.

4
1. Introduction
Agriculture has been at the forefront of Rwanda’s development strategy in the past decade, with
the share of the national budget allocated growing from 5.1 percent in 2006 to 5.3 percent in
2016/17 (MINECOFIN, 2006 and 2017). Over the same period, growth in agriculture averaged
over 5.1 per cent a year.1 The country is trying to overcome the limitations of land availability
and its landlocked situation by increasing yields, developing new export value chains and
leveraging regional trade. The agricultural sector contributes considerably to the national
economy and poverty reduction. It provides employment for 72 per cent of the population and
accounts for 29.5 per cent of the gross national product (GDP) (NISR, 2018). Food crop
cultivation for self-consumption and cash is dominant, with farmers’ holdings averaging around
0.5ha (Dijkxhoorn et al., 2016).
This synthesis report is based on work done through the Joint EU-ILO Government of Rwanda
project: Strengthening the impact on employment of sectoral and trade policies. It synthesizes
findings from the 2017 study Understanding the effects of increased agricultural exports on
employment in agricultural value chain in Rwanda, referred to as the “study”. This study
estimates the wages and gross profit along the value chains to gauge the potential effects of
increased agricultural exports on employment and gross profits in both traditional export value
chains (pyrethrum, tea and coffee) and selected value chains developed recently (green beans,
cut flowers and essential oils). It also incorporates findings from a baseline study on employment
in agricultural value chains, referred to as the “baseline report” (DAI, 2016)2, and those from an
assessment by the International Trade Centre (ITC, 2017) on the potential of export crops in
Rwanda. The objective of the baseline study was to assess how many people are employed in
the three traditional agricultural export value chains as well as non-traditional products including
green beans, cut flowers and essential oils.
This synthesis first describes the methodology used and then gives a description of each value
chain and the split of the export added-value among its various players. Finally, it provides an
overview of the employment effects along the different value chains and how these could be
impacted by increased production for exports, given that as part of the project it was assessed
that for coffee, tea and pyrethrum, there is considerable potential for increasing exports (See
Box 2).
1 National Institute of Statistics of Rwanda 2 Technical assistance in the establishment of a baseline of employment in Rwanda’s export-oriented agricultural value chains,
Final Report, Request for Services No. 2016/373-608, November 2016

5
2. Methodology
The study used mixed methods. It combined existing data from the National Agricultural Export
Development Board (NAEB) and the 2016 Baseline of employment in Rwanda’s export-oriented
agricultural value chains report (DAI 2016) with quantitative and qualitative primary data
collected as part of this study. Data was collected from farmers, cooperative members, and
processors. For consistency, whenever possible, the same cooperatives and processors were
surveyed as in the Baseline report. Only for the pyrethrum value chain was a more extensive
sample of 367 farmers surveyed and the sampling was done at district level.
The data from the study was complemented by a desk review, qualitative data from Key
Informant Interviews and Focus Group Discussions. This entailed visiting managers to get
complementary information on production data, market process of the products, and the cost of
labour for each activity. Other information was related to the views of managers on quality
improvement strategies they might have planned. These included appropriate techniques
towards quality upgrading. The managers were also asked to provide views on possibilities of
value chain upgrading to improve the quality of employment.
These interviews made it possible to gather data on production and exports, and also on prices,
production costs, the split between casual and permanent employment, and wages at the
different segments of the value chains. This in turn made it possible to estimate revenue, gross
profit3, wages and revenue sharing at each segment of the value chain. Given the policy interest
in creating off-farm employment, the creation of job in processing is of particular interest.
Total employment is expressed as full-time equivalents (FTEs), which is based on 240 days of
work a year4. Total casual employment per value chain was given by the available total casual
labourers’ days worked divided by 240.
The following assumptions were made during the analysis:
1. At the farm level, casual wage labour was included as an input and its cost was estimated
based on person days of casual labour reported in the surveys and prevailing daily actual
wage rates. The labour inputs by farmers was not estimated, but where required the
estimates from the baseline study were used.
2. Where data was available other inputs, such as fertilizer, were also included as an input.
3. At each value chain segment, the production was sold integrally (no self-consumption and
no product loss) and that there was no inventory.
3 As defined by revenue minus labour costs and raw material costs. 4 240 days is based on 12 months and 20 working days a month, which would amount to 1 920 hours for an eight-hour working day.
It should be noted that the baseline study used a definition of 1 800 hours worked a year. To properly compare figures, these units
need to be adjusted. This is done by a multiplier of the baseline report figures with 1 800/1 920= 0.9375.

6
4. For the cooperatives and processors, non-labour inputs were typically lumped together but
labour inputs for both permanent and casual staff were collected separately.
5. Zero national consumption of the final products was assumed so that total exports were
assumed to be equal to total production.
6. Generally a linear relationship between production and the use of inputs, (including raw
materials and labour), was assumed at each step of the value chains.
Finally, it should be noted that increasing the volume of exports requires either that a) more land
will be dedicated to this crop, but that may have negative employment effects related to other
crops. Or b) that the yield (production per ha) of the current land increases, but this would
typically also require an increase in other inputs such as fertilizer or better seeds or varietals.
The likelihood of either, or a combination of these options will vary from value chain to value
chain, and it was not possible to factor this into the analysis.
Box 1: Terminology
Wage employment: all paid employment where workers receive monetary wages.
Total employment in a value chain: includes wage employment as well as labour from self-employed
farmers and their households.
Gross farmer profit: total income of farmer minus payments for casual workers and costs of other inputs
(if available).
Gross farmer revenue: Total income from sales calculated from farm gate price times total quantity sold.
Full-time equivalent (FTE): 240 days of employment generated.

7
Box 2: Export potential for pyrethrum, tea and coffee
As part of the project, the International Trade Centre (ITC), a United Nations agency that aims to support trade,
assessed the export potential of Rwanda's main agricultural exports. The ITC has developed a global model for
estimating export potential to support countries with identifying what exports to prioritize. The model includes
various variables including past exports and global demand for different products and access to different markets.
The model also assesses potential; however, this does not specifically assess the capacity of different countries
how to meet this potential. As it is based on historical data, it is also limited in how well it can assess potential for
new products that have not been exported yet or for only a short time. Nonetheless it is useful for providing
estimates for how much Rwanda’s traditional exports can grow based on global demand and indicates in which
markets such demand exists.
Key results of potential export markets for Rwandan coffee, tea and pyrethrum are presented in the figure below.
These show the untapped export potential of the three traditional crops in millions of USD to different export
markets. The value of untapped potential provides an estimate of how much exports can grow. It is clear from these
results that for all three of the traditional exports, there is significant room to grow and thus also grow employment
in the value chains of these crops. The 2016 exports for coffee were USD 58.5 million and so there is around 80
percent room for growth. Tea exports in 2016 were USD 74.5 million with an increase export potential of 59%.
Pyrethrum exports were USD 3.2 million and the potential for growth is 78 percent.
Untapped export potential of traditional exports to developed and developing countries
-
41.12
2.31 3.64
01020304050
DevelopedCountries
DevelopingCountries
DevelopedCountries
Coffee (excludingroasted and
decaffeinated)
Coffee (excludingroasted and
decaffeinated)
Decaffeinatedcoffee (excluding
roasted)
Coffee: untapped export potential in millions of USD
17.3514.06 12.85
0
5
10
15
20
DevelopingCountries
DevelopedCountries
Eastern Africa
Black fermented tea and partly fermented tea,whether or not flavoured, in immediate packings of >
3 kg
Tea: Untapped export potential in millions of USD
2
0.51
0
0.5
1
1.5
2
2.5
Developed Countries Developing Countries
Vegetable saps and extracts (excluding liquorice, hops andopium)
Pyrethrum: untapped export potential in millions USD

8
3. Traditional export value chains
3.1. Pyrethrum value chain
The study identified three major value chain segments: about 10 000 independent smallholder
farmers who grow pyrethrum in the four districts of Musanze, Burera, Nyabihu and Rubavu, nine
cooperatives, and a single processing plant owned by private company Horizon Sopyrwa5.The
pyrethrum farms mostly use household labour but hire casual labourers at work peaks such as
harvest. Farm production is delivered to cooperatives and then sold on to Sopyrwa, which
processes it to make pale extract, and exports the production. The main use of the pale extract
is as a natural or organic insecticide.
Figure 1: Pyrethrum value chain
Production and revenue
The study gathered information at the farm level, cooperatives and processors on quantities of
pyrethrum harvested, supplied, processed and exported to different actors in the value chain.
The prices, revenues received, labour used as well as their wages were also identified.
The study showed a fluctuation in the numbers of farmers growing pyrethrum among the
367 farmers in the sample. In 2014, 180 farmers cultivated pyrethrum; in 2015, 200; and in
2016,174. This would indicate that in a given year only about half of the 10 000 farmers grow
pyrethrum. Nevertheless, the reported cultivated area increased by 10 percent from 1 922 acre
in 2014 to 2 114 acre in 2016. This increase combined with a yield increase, from 6.9 kg/acre
to 9.5 kg/acre, led to a 52 percent production increase among respondents over the same period
from 13 266 kgs (2012) to 20 167 kgs (2016).
As the reported farm gate price of pyrethrum stayed constant at 1 080 RWF/kg between 2014
and 2016, the aggregated revenue increase for the respondents was proportional to the
production change. By extrapolating the results of the survey, estimates of the national
5 The baseline study also included the nurseries that produce seedlings and splits in the value chain and their employment estimates
are used when discussing total employment in the value chain.
10 000 households
Self-employed and
casual employment
Casual farm labor
Nine cooperatives
Permanent and casual
employment
Processing Sopyrwa
Permanent and casual
employees

9
production and farm revenue were made and are presented in Table 1. The total export value
of pyrethrum over the three years is presented in Figure 3.
Table 1: Summary of pyrethrum survey
2014 2015 2016
Change
Sample respondents (sample) 180 200 174 -3%
Maximum cultivated area per person (acre) 145 154 178 23%
Average Cultivated Area (acre) 74 91 116 57%
Total cultivated area (acre) 1,922 2,055 2,114 10%
Quantity of dry flower produced (kg) 13,266 18,131 20,167 52%
Yield (kg/acre) 6.9 8.8 9.5 38%
Farm gate price of dried (RWF) 1,080 1,080 1,080 0%
Farm gate revenue (RWF) 14,327,280 19,581,480 21,780,360 52%
Estimated National Farm revenue (RWF) 795,960,000 979,074,000 1,251,744,828 57%
Estimated National Cooperative Revenue (RWF) 826,914,000 1,017,149,100 1,300,423,793 57%
Source ILO, 2017 Study
Figure 2: Pyrethrum export value (USD)
Source ILO, 2017 Study
Employment and wages
The total wage employment of hired farm labour in the pyrethrum value chain increased from
1 358 in 2014 to 2 169 FTEs in 2016. Most of the increase was at farm level with a 68.3 percent
increase compared to only 7.1 percent at the processing level. As the total labour inputs in the
pyrethrum value chain (excluding nurseries) was estimated to be 8 400 FTE a year, this implies
the difference of 6 231 FTE was labour input provided by farmers’ households. The labour input
in cooperatives did not change. Both permanent and casual workers at the processing level
have increased. In 2014, of the 234 FTEs, 78 were permanent and 157 were casual. By 2016
this had increased slightly to 80 permanent workers and 171 casual workers. These findings
suggest that increases in export quantity will translate mainly into employment creation at the
farm level, not in processing.
1,809,9202,455,635
3,268,351
0
1,000,000
2,000,000
3,000,000
4,000,000
2014 2015 2016Exp
ort
val
ue
in U
SD
Year
Total export value of pyrethrum

10
At farm level, casual wages were found to be RWF 1000 a day. In contrast at Sopyrwa, the
average daily wage of all staff was RWF 4 870 per day, almost five times as high.
Figure 1: Pyrethrum – split of export value along the value chain (2016)
Source ILO, 2017 Study
Figure 2 presents a summary of the financial flows along the value chain and shows what share
of total export revenue is paid to the different actors in the value chain. The figure on the left
shows that for every USD in export generated, 53 per cent is accrued to processors, 2 per cent
to cooperatives and 45 per cent to farmers. The figure on the right, splits these further by
showing the share that is paid out to wages in each step. It shows that the 10 000 pyrethrum
farmers pay out 17 percent of total export value in wages and retain 29 percent of the total
export revenue. Based on this it could be estimated that the average gross profit per farmer was
RWF 79 215. However, if as indicated by the survey, only about half of the farmers grow
pyrethrum in a given year, then the average gross profit per farmer would roughly double to
around RWF 158,000 per farmer per year. Furthermore, about 1 per cent of total export revenue
was paid to workers at the cooperatives and 11 per cent of the export value accrued to labour
employed at the processors. An important question is whether, through a different pricing
mechanism, a larger share of export revenue could accrue to farmers, thus making growing
pyrethrum a more attractive option for farmers.
3.2. Tea value chain
Tea, together with coffee, are Rwanda’s most important agricultural export crops. The Rwandan
tea processing industry comprises 14 operational factories processing a total of 108 480 metric
tonnes of green leaves a year, with two additional factories under construction. Smallholder
farmers sell their tea to cooperatives, which in turns sell it to one of the 14 factories. Factory
owners typically also own nearby plantations which supply green leaf to tea factories. Processed
tea is directly exported by the tea factories.

11
Thus the tea value chain includes smallholder farmers, plantations, estates, cooperatives and
tea factory companies. Smallholder farmers mostly use household labour on their own farms or
casual labourers. Plantations and estates use employ a combination of permanent and casual
employees. The survey purposefully selected and visited 13 cooperatives and six of the same
tea factories surveyed in the baseline report. Interviews with 58 tea growers, from all the 19 tea
supplying areas, were also conducted, and key informant interviews with managers were done
at the six tea factories and associated plantations.
Figure 2: Tea value chain
Source ILO, 2017 Study
Production and revenue
According to NAEB, between 2012 and 2016 the total tea planted area increased by 27 per cent
and the area in production increased by 12 per cent from 15 383 ha to 17 221 ha. Due to a
combination of increasing global market prices and the devaluation of the Rwandan Franc, the
farm gate price increased by almost 100 per cent in the same period; cooperative gate prices
increased by 74 per cent. As a result, farm and cooperatives’ revenues increased 129 per cent
and 99 per cent respectively in the same period.
The split of green leaf production between small farms and tea estates varies by year, but no
detailed annual figures were available. For 2015/ 2016, 25.5 per cent of green leaf was produced
on estates, and the rest on small farms. The estates supply their green leaf directly to the
factories, while the small farmers their output is supplied to cooperatives, who aggregate the
crops and then supply to the factories.
As presented in Table 2, the national farm revenue in 2016 was RWF 23 214 636 000 of which
17,294,904,000 was income for small farmers. This implies that for the 60,000 small farmers
involved in rowing tea, the average income per farmer from tea was RWF 288,000.

12
Table 2: Green leaf supply and revenue estimates
Source ILO, 2017 Study
Employment and wages
Total employment in the tea sector was estimated at 65 400 FTE in the baseline study. Total
wage employment in the sector was estimated to be 41 400 FTEs and this implies the difference
is labour inputs from self-employed famers and their households, which would amount to 24 000
FTE.
For paid labour, the average daily wages were estimated at RWF 1 000 at the farm, 1 154 at
the cooperatives and 2 002 at tea processors in 2016. Figure 6 shows that of the total value of
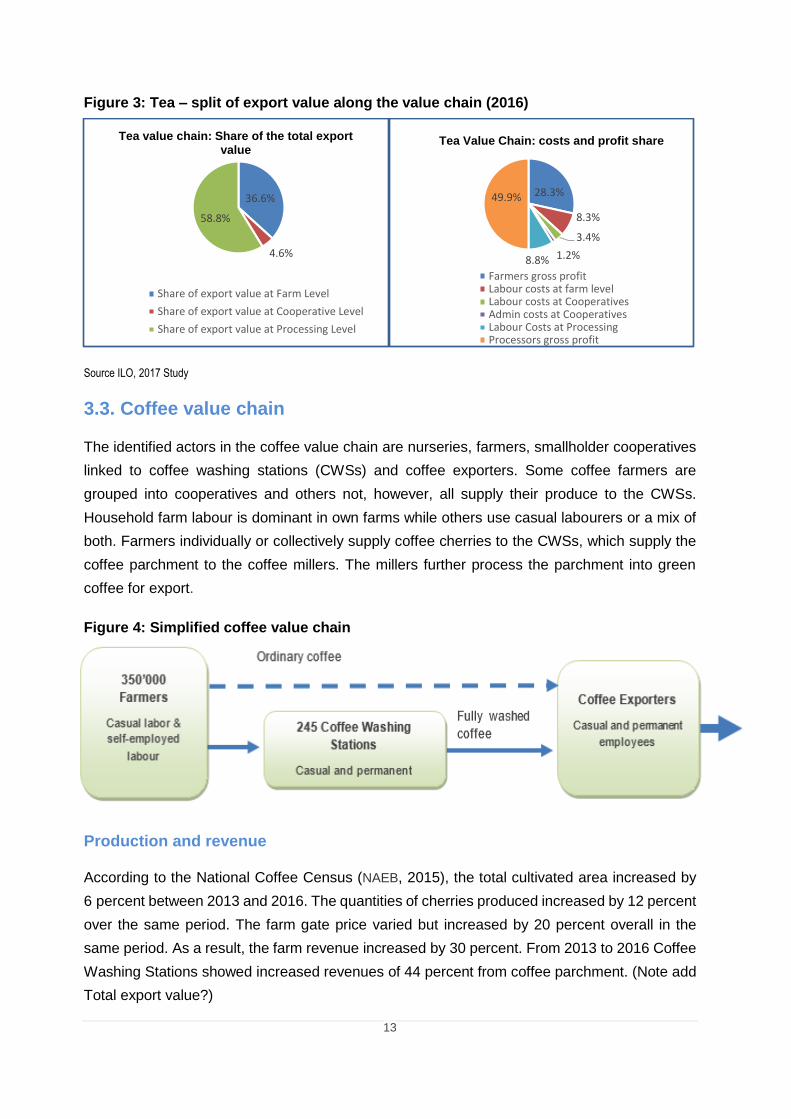
tea exports 2016 (RWF 63 447 223 400) 57 per cent went to processors, 37 per cent was paid
at the farm level, and six per cent went to the cooperatives. Figure 6 also presents the
distribution of cost and profit among different actors in the value chain.
The figure on the right shows how much was paid to labour in each of these steps and shows
that at farm level, wage labour earned the equivalent of 8 per cent of the total export income, at
cooperatives they earned 3 per cent and in processing 9 per cent. Of the total export value, 20
per cent was thus paid out in wages and 28 per cent accrued to farmers.
Production and supply 2012 2013 2014 2015 2016
Total Planted Area (ha) 20,665 22,585 24,043 25,344 26,274
Total cultivated area (ha) 15,383 16,013 17,221 17,221 17,221
Production (Green leaf, kg)
Small farms 78,990,190 80,817,308
Tea estates 27,036,911 27,662,300
Total National Production
green leaf (kg) 94,482,844 93,046,766 104,819,646 106,027,101 108,479,608
Average Farm gate prices
(RWF) 107 142 141 155 214
National Farm Revenue
(RWF) 10,109,664,308 13,212,640,815 14,779,570,061 16,434,200,593 23,214,636,000
13
Figure 3: Tea – split of export value along the value chain (2016)
Source ILO, 2017 Study
3.3. Coffee value chain
The identified actors in the coffee value chain are nurseries, farmers, smallholder cooperatives
linked to coffee washing stations (CWSs) and coffee exporters. Some coffee farmers are
grouped into cooperatives and others not, however, all supply their produce to the CWSs.
Household farm labour is dominant in own farms while others use casual labourers or a mix of
both. Farmers individually or collectively supply coffee cherries to the CWSs, which supply the
coffee parchment to the coffee millers. The millers further process the parchment into green
coffee for export.
Figure 4: Simplified coffee value chain
Production and revenue
According to the National Coffee Census (NAEB, 2015), the total cultivated area increased by
6 percent between 2013 and 2016. The quantities of cherries produced increased by 12 percent
over the same period. The farm gate price varied but increased by 20 percent overall in the
same period. As a result, the farm revenue increased by 30 percent. From 2013 to 2016 Coffee
Washing Stations showed increased revenues of 44 percent from coffee parchment. (Note add
Total export value?)
36.6%
4.6%
58.8%
Tea value chain: Share of the total export value
Share of export value at Farm Level
Share of export value at Cooperative Level
Share of export value at Processing Level
28.3%
8.3%
3.4%
1.2%8.8%
49.9%
Tea Value Chain: costs and profit share
Farmers gross profitLabour costs at farm levelLabour costs at CooperativesAdmin costs at CooperativesLabour Costs at ProcessingProcessors gross profit

14
Table 3: Production, supply and revenue in the coffee value chain
Source ILO, 2017 Study
Employment and wages
Total wage employment in the coffee value chain was estimated at 18 000 FTE while total
employment (paid and unpaid) was estimated at 57 500 FTE in the baseline study. This implies
that the coffee farmers and their households provided 39 500 FTE of labour into the value chain.
Overall, casual wage employment on coffee farms decreased from 8 463 in 2013 to 6 951 FTEs
in 2016. This is a result of labour inputs not being consistent for perennial crops and less labour
required in the years after the planting of the new coffee plants. It probably also reflects a shift
from processing coffee on farms to processing at CWSs over the period. This is supported by
an increase in employment at CWSs which has increased from 6 783 to 9 822 full-time
equivalents as more and more cherries are processed at the CWSs (note add Employment at
Exporters).
This is a positive trend as productivity and average wages at the CWSs are generally higher
than average wages on farms. In 2016 the average daily wages paid in the value chain were
RWF 1 000 at the farm, 2 362 at the CWS, and 9 774 at coffee exporters. It is therefore more
beneficial for labourers to be employed at a CWS. Furthermore, given that the CWSs are located
in farming areas, they are able to offer wage employment to rural workers.
The pie chart on the left in Figure 8 shows that of the total value of coffee exports 2016, 44 per
cent went to processors, 41 per cent was paid at the farm level, and 15 per cent went to the
washing stations. The pie chart on the right in Figure 8 presents the distribution of wages and
gross profit among different actors in the value chain and shows that at farm level, wage labour
earned the equivalent of 4 per cent of the total export income, at CWS they earned 7 per cent
and in processing 6 per cent. Of the total export value, 17 per cent was thus paid out in wages
and 37 per cent accrued to farmers. Based on these figures the average gross profit per small
farmer is [20,237,045,938 – (6951x1000x240)]/350 000= RWF 53,000.
Production, supply, and revenues 2013 2014
2015 2016 Change
Total cultivated area (ha) 33,826 34,045 35,000 35,891 6%
Farm gate prices (RWF) 145 175 160 175 20%
Total coffee cherries produced (kg) 102,935,455 103,310,563 122,253,975 115,640,263 8%
Total farm revenue (RWF) 14,925,640,975 18,079,348,438 19,560,636,000 20,237,045,938 30%
Qty of parchment coffee produced (kg) 20,587,091 20,662,113 24,450,795 23,128,053 12%
Unit price of parchment coffee (RWF) 900 1,200 1,055 1,150 28%
Total revenue of parchment coffee
produced (RWF) 18,528,381,900 24,794,535,600
25,795,588,725 26,597,260,950 44%
Total CWS revenue (RWF) 18,528,381,900 24,794,535,600 25,795,588,725 26,597,260,950 44%

15
Figure 5: Coffee – split of export value along the value chain (2016)
Source ILO, 2017 Study
4. Non-traditional export value chains
The non-traditional value chains that were considered in the study were essential oils, green
beans and cut flowers. This selection was based on both the potential of these value chains, as
well as the availability of data and information. However, given the small number of growers and
that these firms are in early phases of production, it can be expected that the results from
findings would change, as the companies mature, and their productivity increases to match
those of other countries in the region like Kenya and Ethiopia. It is important to emphasize, that
these crops are non-traditional not only because they are products that have not been
traditionally exported, but also that they farming models used are also non-traditional. Most of
the farms producing these products are commercial farms, using mostly wage labour and
modern farm practices. Because of the much smaller number of actors involved, the approach
used for the assessments also differed.
4.1. Essential oils value chain
Essential oils are high value-added oil obtained from processing various essential oil crops.
These essential oils are further processed to produce fragrances, pharmaceutical and
phytosanitary products. The actors of the Rwandan value chain have focused on high value-
added essential oils mainly used in perfumes, such as geranium, patchouli, rose oils or
eucalyptus. The essential oils value chain is divided into three segments: growers, labour
associations and exporters/marketers with the capacity to do low-volume retail packaging for
the domestic market and wholesale packaging for export markets. Essential oils differ from other
41%
15%
44%
Coffee value chain: share of total export values
The share of export value at Farm Level
The share of export value at Washing Stations
The share of export value at Processing Level
37%
4%7%8%
6%
38%
Coffee value chain: costs and profit share in the value chain
Farmers gross profitLabour costs at farm levelLabour costs at Washing stationsCoffee Washing Gross profitLabour Costs at ProcessingProcessors gross profit

16
crops as processors need strong control over the quality and organic nature of the crop. This
leads to a wide variety of contractual relationships, as illustrated in Figure 9.
The cultivated area increased by 20 per cent between 2013 and 2016, while the production and
revenues of essential oils green leaves increased by 98 per cent in the same period. The labour
inputs on farms increased by around 50 per cent but employment in processing decreased
slightly even though outputs increased. The average daily wage was estimated at RWF 1 000
at the farm and RWF 1 473 at the processor in 2016.
Figure 6: Essential oils value chain and contractual relationships between producers and processors
Source ILO, 2017 Study
Table 4: Essential oils, production, price and revenue
Estimated farm revenues 2013 2014 2015 2016
Total cultivated area 25 25 30 30
Quantity of green leaves produced (kg) 1,752 2,141 2,650 3,470
Farm gate prices (RWF) 500 500 500 500
Farm gate revenues (RWF) 876,000 1,070,500 1,325,000 1,735,000
Aggregate farm revenues (RWF) 17,520,000 22,536,842 26,500,000 34,700,000
Estimated gross profit in Essential oils
Total gross profit of around 400 Farmers 13,560,000 18,031,579 21,200,000 28,520,000
Total gross profit at farm level (RWF) 3,960,000 4,505,263 5,300,000 6,180,000
Provision of fertilizers and seedlings
Cooperatives
Permanent and casual
Employment
Out-growers
Permanent and casual
employment
In-growers
The land is leased to farmers
with a contract to produce
certain essential oil crops
Three processors
Permanent and casual
employees
Labor associations
Workers are paid a wage partly
based on output
Direct Ownership of the land

17
Total gross profit at Essential oil processing company
(RWF) 43,259,424 43,259,424 49,307,424 51,827,424
Total gross profit/wage at essential oils value chain 60,779,424 65,796,266 75,807,424 86,527,424
Person-days and average wages
Total number of person-days at farm 3,960 4,505 5,300 6,180
Average wage for casual labour at farm (RWF/day) 1000 1000 1000 1000
Total number of person-days at processing 1,225 1,468 1,468 1,461
Average wage at processors (RWF/day) 1595 1625 1509 1473
Total person days at essential oils value chain 5555 6130 6809 7641
Source 2017 Study
For essential oils, total employment 31.8 FTE which results in only 1.06 FTE per ha, which
seems low compared to other crops. Employment in processing per ha was 0.2 FTE, which
does seem reasonable as is it comparable with pyrethrum which undergoes a similar type of
processing. It should be noted that even though production increased over the four-year period
reviewed, employment in processing declined slightly, indicating there is probably spare
capacity at the processors and they can process increased quantities without additional labour
inputs. Income per farmer was estimated at RWF 86 750 for 2016, which is also comparable
with that of pyrethrum farmers. At a total export value of USD136 200 in 2016, total wage
employment was 234 FTE per USD1 million and employment in processing was 45 FTE per
USD1 million.
4.2. Green beans
The production of green beans (or French beans as known in Rwanda) is steadily rising due to
a year-round demand in destination markets (Europe, Middle East). The crop is exported fresh.
Figure 7: Green bean value chain
A sample of 40 farmers cultivating a total of 27 ha of green beans was surveyed. According to
the survey, production increased by 20 per cent between 2014 and 2016. Labour inputs at farm
level were higher compared to other non-traditional value chains under study with 82 FTEs, or
3.0 FTE/ha in 2016. Based on the sample surveyed, the export value per ha was USD 50,500
per ha and the employment per USD million of exports was 60.1 FTE.
Farmers
Permanent and casual
employment
Cooperatives
Permanent and casual
employment
Exporters
Permanent and casual
employees

18
Table 5: Green beans, price and revenue
Production, supply and price 2014 2015 2016
Total respondents, 40 farmers 40 40 40
Total cultivated area (ha) 27 27 27
Quantity of beans produced (kg) 100,000 110,000 120,000
Farm gate prices (RWF) 360 360 360
Farm gate revenues in (RWF) 36,000,000 39,600,000 43,200,000
Aggregate Farm revenues (RWF) 585,000,000 643,500,000 702,000,000
Cooperative gate price (RWF) 560 560 560
Cooperative revenue (RWF) 56,000,000 61,600,000 67,200,000
Aggregate cooperative revenues (RWF) 910,000,000 1,001,000,000 1,092,000,000
Source ILO, 2017 Study
4.3 Cut flowers
The cut flowers sector is among the non-traditional export crops with high export potential for
Rwanda. Current flower production is limited to a small number of producers that operate on a
small scale and sell on the domestic market (Dijkxhoorn et al., 2016), but increasingly additional
export-oriented producers have entered, and exports have increased rapidly in recent months6.
Figure 8: Cut flowers value chain
The survey concentrated on producers that focus on exports. The total planted area of cut
flowers of the producers surveyed was estimated at 12 ha. They produced about 18 750 kg of
cut flowers and generated around RWF 11 250 000 of farm revenues selling to
processors/exporting companies, of which two were surveyed. If all these flowers were exported
at the price of USD2.3 per kg, then USD 43,125 of export revenue would have been generated.
6 Latest export figures have indicated that total exports from July 2017 to March 2017 amounted to USD2.8 million.
Farmers
Permanent and casual
employment
Two processors/exporters
Permanent and casual
employment
Domestic buyers (hotels,
restaurants)

19
Table 6: Cut flowers production, supply, and price for sample of producers
Production, supply, and price 2016
Total cultivated area (ha) 12
Quantity of cut flowers produced (kg) 18,750
Farm gate prices (RWF) 600
Farm gate revenues in RWF 11,250,000
Source ILO, 2017 Study
As the processors and exporters of the cut flowers under study had only recently started
operating only the export values for 2016 were available and the estimates provided are based
on a total export value of USD 562 500. Given the early stages of exports and the rapid changes
in the sector, care should be taken in interpreting these figures. Based on the total production
on the farms surveyed, and the total export of 150 000 kg of flowers in 2016, the total farm wage
employment was estimated at 256 FTEs. Employment at the two processors was found to be
510 FTEs, making the total employment in the value chain 766 FTEs. From the survey, the
distribution of income along the value chain is presented in Figure 9.
Figure 9: Cut flowers - incomes and expenses along the value chain
Source ILO, 2017 Study
What is worth highlighting about the cut flower sector is the high labour intensity and share of
export revenue paid in wages. About 34 per cent of export values are paid in wages during
processing and an additional 12 per cent for labour working on farms. The estimated amount of
employment created per one million of USD exports was 1 323 FTE, and total employment per
ha was 7.7 FTE/ha. Although from a limited sample, the export value generated per ha was
7%
12%
34%
46%
Cut flower: income and expenses along the value chain
Farmers gross revenue
Payments to farm labour
Wages processors
Processors Non-wage costs and profit
80%
20%
Cut flower value chain: share of total export value
Processors-Total income (export value)
Farmers-Total income

20
USD 3,593. It should also be noted that all employment in the value chain was wage
employment, and the average wage on farms was RWF 1 000 a day, while in processing it was
RWF 1 274 a day.
5. Employment implications and projections
For the three traditional export crops, the findings presented on the share of export value that
goes to wages showed that Pyrethrum has the highest share, with 29 per cent paid out in wages,
followed by tea with 20.5 per cent and coffee at 17 per cent. Concerning the share that goes to
farmers (after paying wage costs), for coffee, 37 per cent of export value goes to farmers, while
for tea and pyrethrum this value is similar at around 29 per cent. Increasing this share would be
an important step for increasing the income of these farmers, thus improving their employment
situation if we consider them as self-employed. The average annual income per small farmer
were found to be: RWF 158,000 for Pyrethrum, RWF 288,000 for tea and RWF 53,000 for
coffee.
To be able to compare the employment effects of the traditional export crops, it is useful to
compare common indicators estimated, namely employment per USD 1 million of exports, and
employment per ha. From a perspective of land use, it is useful to discuss the value of exports
generated per ha.
About employment created per million USD of export value, of particular interest is how much
employment is created in processing, as it is clear that the jobs created in processing tend to be
more productive and of higher quality in wages, working conditions and formality. The results
also allow for such estimations as presented in Figure 11.
Figure 10: Employment per USD 1 million of exports for traditional export crops
Source: Calculated from the study and baseline data results.
190 309
948
160556
925
85
1048
4306
0
500
1000
1500
2000
2500
3000
3500
4000
4500
5000
Employment in processing per USD 1million of exports (full time job
equivalents)
Wage employment per USD 1 millionof exports (full time job equivalents)
Total employment (including self-employed farmers) per USD 1 million
of exports (2015)
Coffee Tea Pyrethrum

21
The results show important differences in the employment in these value chains. Coffee
currently offers the most employment in processing, creating 190 FTEs for every USD1 million
of exports. This is followed by tea with 160’ and then pyrethrum with 85 FTEs. Tea creates
higher demand for wage labour than coffee. This reflects the way the sector is structured, in
particular with tea cooperatives involved in growing and harvesting, and estates and factories
all offering wage employment. Tea is followed by coffee and then pyrethrum. The high amount
of total employment per USD million dollars in pyrethrum is an indication of the high labour
intensity of this sector, but at the same time also indication of the low labour productivity in this
crop. It should thus be seen as a confirmation that productivity and income in this sector is low
and efforts should focus on promoting this. The employment generated in the coffee and tea
value chains tends to be similar when calculated in terms of export value.
These values can also be used to do simple linear projections of the quantity of labour inputs
required if exports were to increase. The implicit assumption when doing this is that the
production methods along the value chain would stay the same, and so any additional quantity
of export volume would on average be produced in the same way as is done at present. This
assumption can of course be questioned as different farmers may respond to increased demand
in different ways. Furthermore, for a crop like pyrethrum that is grown annually it is easier to
respond to increased demand, as compared to coffee and tea where new plants take several
years to mature before they bear fruit or enough leaves for harvesting.
With processing, many processors are able to increase production without increasing
employment at the same rate, as there is spare capacity and/or economies of scale among
processors. Pyrethrum processing clearly showed this trend and so using a linear projection for
pyrethrum processing results in an overestimation of labour demand. However, in the long term
the goal would be to improve production methods to increase both yields and labour productivity,
and then linear extrapolations would no longer be reasonable as this would fundamentally
change the productivity of the land and of labour.
Table 7: Estimating the employment effects of the untapped export potential
Untapped Export Potential
(millions of USD)
Estimated employment effects of the untapped
export potential at processors level (FTEs)
Estimated employment effects of the untapped
export potential on wage employment (FTEs)
Total employment effect of the
untapped potential (FTEs)
Coffee 47 8 930 14 523 44556
Tea 44 7 040 24 464 40700
Pyrethrum 2.5 10 to 212 2 620 10765
Total (rounded) 93.5 16 000 41 000 96 000
Source: Calculated from the study and baseline data results.

22
Taking cognisance of these limitations, linear estimates of the additional labour demand of
fulfilling export potential as assess by the ITC results are presented in Table 7. It shows that
increasing exports to meet the untapped coffee demand would demand up to 8 930 FTEs jobs
at the processing level and 14 523 FTEs at farm level. For tea, if the untapped export potential
were to be fully utilised, it is estimated labour demand would increase by 7 040 FTEs at the
processors level and 24 464 FTEs at the casual farm labour level. Furthermore, the untapped
pyrethrum potential could also generate up to 2 620 FTEs of the wage employment at farm level.
Looking at the general picture, the untapped USD 93.5 million in the three traditional export
crops could create up to 96 000 FTEs jobs in the value chain of the three crops.
Another useful indicator is to use the processing employment generated on farm in processing
created per ha of each crop. This is particularly important if arable land is seen as a scarce
resource and the aim is to optimise employment generated per ha. The results for the traditional
crops are presented in Figure 11.
Figure 11: Employment generated per ha of traditional export crop grown (2016)
Source: Calculated from the study and baseline data results.
While the total employment per ha for these two crops does not vary that much, there are
important differences in where the employment is created. It was found that tea exports
generated the most processing employment per ha, followed by coffee and then pyrethrum.
Generating employment in processing is more desirable as wages in processing were at least
twice as high on average as wages paid on farms. Generally, the further up the value chain, the
higher the average wages paid.
0.06 0.44
0.07 0.16
0.30
0.01
1.47 0.84
0.51
1.2
0.9
2.28
2.90
2.49
2.87
-
0.50
1.00
1.50
2.00
2.50
3.00
3.50
Coffee Tea PyrethrumEmployment in processing (FTE/ha) Employment at cooperative level* (FTE/ha)
Hired Labour at farm level (FTE/ha) Self-employed Labour (FTE/ha)

23
Figure 13 shows the export value generated per ha of traditional export crops in 2016. It was
found that tea generated the most export value with USD 2837 per ha, followed by coffee which
generated USD 1 631.
Figure 12: Export value generated per ha of traditional export crop grown (USD 2016)
Source: Calculated from the study and baseline data results.
For the non-traditional value chains analysed, it is clear that because of the different farm
practices in cut flowers and green beans, that are also much more modern and capital intensive,
the productivity per ha is much higher and as a result so is the export value per ha. This
generates a very different range for some of the indicators. French beans and cut flowers were
found to have the highest employment potential and the value of employment created per ha
was much higher than for traditional crops. Although the findings are based on a small sample
and should thus be taken with caution, cut flowers were found to generate as much as 7.7 FTE
per ha of employment, of which more than two thirds was generated in processing. Green beans
were found to create up to 3.9 FTE per ha. However, even though it would appear that the export
value per ha is much higher for cut flowers and green beans, the wage for farm labour are similar
to other crops. This provides an indication that labour is not benefitting from the more modern
farming practices used in these crops, as their presumably higher productivity is not translating
into higher on farm wages. Furthermore, while the wages in flower processing were higher than
for farm labour, they are much lower than wages in other processing in the traditional value
chains.
1,631
2,837
890
-
500
1,000
1,500
2,000
2,500
3,000
Coffee Tea Pyrethrum

24
6. Policy implications
Based on the findings and analysis, the following policy implications can be deducted:
Processing in the tea and coffee export value chains is important as it creates productive
and better paid employment. However the total amount of employment created is still
relatively small when compared to on-farm employment. With current production techniques,
both the total employment creation potential and the employment potential for better and
higher paying jobs in processing varies for different crops.
For the traditional export crops, coffee and tea have the highest impact on employment
created in processing per USD 1 million of exports, while the coffee value chain has the
highest average salaries in the final parts of the value chain.
However, when looking at the amount of employment created in processing per ha of
land under production, then tea exports generate by far the most employment in
processing, more than twice as much as coffee.
Based on global demand as assessed by the ITC, there appears to be good potential to
grow exports of both tea and coffee, and this would also increase employment creation
both on farm and in processing in the value chain.
The introduction of CWSs have improved employment in the coffee value chain,
generating additional and on-average better paid jobs in rural areas. Similar initiatives to
shift processing from farms to regional centres could be encouraged in other export and
domestic value chains. Given the scale of the domestic value chains, the employment
potential is also likely to be large.
For the traditional crops, in order to increase processing related employment it is
important that there is further development in the value chains, to include further
processing of both tea and coffee.
A large share of labour input provided into the value chain is through casual labour,
employed for a short-term on a day basis at a relatively low wage (typically RWF 1000 a
day). It was not possible from this study to know to what extent this pool of labour is able
to find sufficient paid employment on this basis, how many also have access to their own
land for farming, and to what extent they are also dependent on other sources of income.
However, this is an important question to investigate for a better understanding of the
rural labour market.
The non-traditional export crops appear to generate much higher levels of employment
per ha of crop planted. Therefore, while these crops tend to use modern farming methods
and require higher upfront investments, they are beneficial as they also create a higher
demand for labour. However, despite this, they do not tend to pay higher wages than
farms on traditional crops.

25
7. Recommendations
The recommendations emerging from these findings can be split up in recommendations
about traditional and non-traditional export value chains, as the findings for these value
chains are quite different.
For traditional value chains it is recommended that
Avenues to increase the exports of traditional crops are explored further as there is good
potential for this based on global demand. This can support both on-farm and off-farm
employment creation.
With regards to on-farm employment, it is recommended that there is a strong focus on
increasing both yield (productivity of land) and labour so that exports can be increased
without having to increase the area used for these crops in the same proportion. Such
increased productivity would also increase income and wages in the sector which remain
among the lowest of all sectors in Rwanda.
Concerning off-farm employment, the Government of Rwanda should work with
stakeholders to improve competitiveness and continue to support the emergence of new
activities to increase value added through processing even further. Rwandan industries
are exporting the main export crops, coffee and tea, in semi-processed form. Innovation
is required to shift, for example, to export roasted coffee and packaged tea, as this will
help the country to generate more export revenue and domestic employment.
The Ministry of Agriculture and Animal Resources, through NAEB, should continue to
strengthen the tea sub-sector given its high employment creation potential in processing
per ha. This can include continuing the introduction of improved farming techniques,
expanding the land under tea green leaf growing and mobilising more private sector
investment for the creation of new tea estates.
In general, self-employed farmers in the traditional value chains receive around a third
of the total export revenue (28 per cent to 29 per cent for pyrethrum, coffee and tea),
even though they contribute the most labour to the production of these crops. This is
partly due to their low productivity thus requiring many farmers in the production process,
and partly due to the structure of the value chain whereby the farm gate price is
significantly lower than the export price. For these crops, measures to increase the farm
gate price should be explored as this would enable farmers to benefit more and provide
more incentive for increasing their production.
Concerning the non-traditional crops it is recommended that:
For non-traditional export crops such as green beans and cut flowers the total
employment per ha cultivated is much higher, than for traditional crops, and it thus has
higher employment potential and should be further strengthened.

26
As many of the growers or these crops are enterprises, employment in these crops is
wage employment that is more easily formalised. It would also appear that labour on
these farms is more productive and there would this be a possibility to pay higher wages
than on other farms, and this is an area to be explored further.
These crops also offer higher levels of processing related employment, which in turn
tend to be jobs that offer higher average wages.
While these non-traditional crops are currently mostly grown by farms that are
enterprises, an interesting policy question that should be explored is the extent to which
current small family farms could switch to these crops and in the process to much higher
productivity and incomes. In particular because of the small size of family farms,
switching to these crops that generate much more output per ha would appear an
attractive policy option. This would require considerable measures in terms of access to
credit, markets and training, but would present an important opportunity for small farmers
to enter into a much more productive sub sector, while maximizing the income they can
generate from their two primary assets, their land, and their labour.

27
References
DAI Europe. 2016. Technical assistance in the establishment of a baseline of employment in
Rwanda’s export-oriented agricultural value chains. Final Report. November, 2016.
Gahamanyi, J.P. 2018. Understanding the effects of increased agricultural exports on
employment and income in agricultural value chains in Rwanda. ILO Project Study.
MINECOFIN. 2006 and 2017. Budget Execution Report for 2006 and 2016/17. Ministry of
Finance and Economic Planning. Kigali, Rwanda.
NAEB. 2015. National Coffee Census. National Agricultural Export Development Board.
NISR. 2018. GDP National Accounts, 2017. Annual publication. National Institute of Statistics
of Rwanda
Dijkxhoorn, Y., Gonzalez Y. and Judge, L.O. 2016. Horticulture and floriculture in Rwanda;
Identification of focus areas for sector development. Wageningen, LEI Wageningen UR
(University & Research centre), LEI Memorandum 2015-161. 51 pp.; 9 fig.; 3 tab.; 14 ref.
International Trade Centre 2017, Spotting export potential, strengthening the impact on
employment of sector & trade policies in Rwanda. Presentation by Yvan Decreux, Kigali,
November 2, 2017.