Employment and Poverty in Jharkhand and India Dr. Balwant ...Employment and Poverty in Jharkhand and...
13
Volume-II, Issue-V March 2016 311 International Journal of Humanities & Social Science Studies (IJHSSS) A Peer-Reviewed Bi-monthly Bi-lingual Research Journal ISSN: 2349-6959 (Online), ISSN: 2349-6711 (Print) Volume-II, Issue-V, March 2016, Page No. 311-323 Published by Scholar Publications, Karimganj, Assam, India, 788711 Website: http://www.ijhsss.com Employment and Poverty in Jharkhand and India Dr. Balwant Singh Mehta Dr. Bharat Singh Faculty, Institute for Human Development, New Delhi and Associate Professor, Department of Economics, Satyawati College (Eve.), University of Delhi Abstract Jharkhand is situated in eastern part of India. Being rich in natural resources and minerals, the state is one of the most deprived and underdeveloped in the country. It stands second third lowest in per capita terms and second highest in poverty. Over one-fourth population of the state population is tribal and agriculture still has the main source of employment. Hence, the main concern of the policy makers and other stakeholders is generation of more employment opportunities in non-farm sector and reduction of poverty in the state. However, there are very few studies available to assess the present status of these two important issues. Therefore this paper attempts to explore the present employment and poverty status of Jharkhand. Key Words: Employment, Poverty, Jharkhand, Workers, Engel Ratio Introduction: Jharkhand is situated in the eastern part of India bordering the state of Bihar, West Bengal, Bihar, Odisha and Chhatisgarh. It was formed as a separate state on 15 th November 2000 and consists of 24 districts. Despite heterogeneity in terms of resources as well as of socio- economic characteristics, its population shared some uniformity in terms of nature and extent of deprivation and development (World Bank, 2007). The region is well endowed with natural resources and significantly urbanised (24%) and industrialised. Thus it generates ample economic opportunities, which are harnessed by many people but these opportunities failed to percolate down to the poor and marginalised people (HDR, 2011). Though mining and industrial sectors made notable strides, rural economy in general and agriculture sector in particular remained stagnant over a period of time. Despite the fact that per capita NSDP of the state is high in comparison to many other poor states of the country. The eastern states fares well in many other development indicators, still a large section of its population live a miserable life (Singh et al. 2012). The percentage of population below poverty line is around 37 per cent per cent, which is second highest in the country and next only to Chhattisgarh (GoI, 2012). A sizeable proportion of its population is tribal. According to the 2011 population census over 26.2 percent of its population is tribal, which constitute more than 40 percent of the population in seven districts namely Ranchi, Kunti, Lohardaga, Gumla, West Singhbhum, Dumka and Pakur respectively. The state is marked by low agricultural production and productivity, but is rich in mineral and forest resources. Though per capita income of the state (Rs 46,131) is less than half the all India average (Rs 98,983/-) but it is higher than Bihar (Rs 36,143) and Uttar Pradesh (Rs 36,250) states (Jharkhand Economic Survey,
Transcript of Employment and Poverty in Jharkhand and India Dr. Balwant ...Employment and Poverty in Jharkhand and...
Volume-II, Issue-V March 2016 311
International Journal of Humanities & Social Science Studies (IJHSSS) A Peer-Reviewed Bi-monthly Bi-lingual Research Journal ISSN: 2349-6959 (Online), ISSN: 2349-6711 (Print) Volume-II, Issue-V, March 2016, Page No. 311-323 Published by Scholar Publications, Karimganj, Assam, India, 788711 Website: http://www.ijhsss.com
Employment and Poverty in Jharkhand and India Dr. Balwant Singh Mehta
Dr. Bharat Singh Faculty, Institute for Human Development, New Delhi and Associate Professor, Department of
Economics, Satyawati College (Eve.), University of Delhi
Abstract
Jharkhand is situated in eastern part of India. Being rich in natural resources and minerals,
the state is one of the most deprived and underdeveloped in the country. It stands second
third lowest in per capita terms and second highest in poverty. Over one-fourth population
of the state population is tribal and agriculture still has the main source of employment.
Hence, the main concern of the policy makers and other stakeholders is generation of more
employment opportunities in non-farm sector and reduction of poverty in the state.
However, there are very few studies available to assess the present status of these two
important issues. Therefore this paper attempts to explore the present employment and
poverty status of Jharkhand.
Key Words: Employment, Poverty, Jharkhand, Workers, Engel Ratio
Introduction: Jharkhand is situated in the eastern part of India bordering the state of Bihar, West
Bengal, Bihar, Odisha and Chhatisgarh. It was formed as a separate state on 15th
November 2000
and consists of 24 districts. Despite heterogeneity in terms of resources as well as of socio-
economic characteristics, its population shared some uniformity in terms of nature and extent of
deprivation and development (World Bank, 2007). The region is well endowed with natural
resources and significantly urbanised (24%) and industrialised. Thus it generates ample economic
opportunities, which are harnessed by many people but these opportunities failed to percolate down
to the poor and marginalised people (HDR, 2011). Though mining and industrial sectors made
notable strides, rural economy in general and agriculture sector in particular remained stagnant over
a period of time. Despite the fact that per capita NSDP of the state is high in comparison to many
other poor states of the country. The eastern states fares well in many other development indicators,
still a large section of its population live a miserable life (Singh et al. 2012). The percentage of
population below poverty line is around 37 per cent per cent, which is second highest in the country
and next only to Chhattisgarh (GoI, 2012). A sizeable proportion of its population is tribal.
According to the 2011 population census over 26.2 percent of its population is tribal, which
constitute more than 40 percent of the population in seven districts namely Ranchi, Kunti,
Lohardaga, Gumla, West Singhbhum, Dumka and Pakur respectively. The state is marked by low
agricultural production and productivity, but is rich in mineral and forest resources. Though per
capita income of the state (Rs 46,131) is less than half the all India average (Rs 98,983/-) but it is
higher than Bihar (Rs 36,143) and Uttar Pradesh (Rs 36,250) states (Jharkhand Economic Survey,

Employment and Poverty in Jharkhand and India Balwant Singh Mehta & Bharat Singh
Volume-II, Issue-V March 2016 312
2014). Agriculture is the main source of employment in the state, as it constitutes three fourths of
the total workforce but constitutes only one-eighth of the total state domestic product.
Therefore two main concerns of the state are employment creation and reduction of poverty. The
policy makers and research community is continuously trying to understand the reasons of
backwardness of the state. So, the appropriate steps and policy correction can be made for the
development of the state. But there is dearth of studies on this topic, and only the state economic
survey publish regularly highlight some relevant issues at broad level. Hence, the central question of
this paper is to understand the employment and poverty level in the state.
Methodology and Data Sources: The status of employment in a state provides an important
window to the life of its people. It is widely felt that the recent growth story in India has been one of
jobless growth and not enough decent jobs are being created. While Jharkhand is a relatively poor
and backward state and thus very much in need of creation of employment opportunities, it also is a
mineral-rich state and thus has the potential to create a number of jobs. It is therefore disturbing that
participation in work force and participation in labor force in the state have declined over the last
seven years and the reasons thereof need closer investigation, as will be discussed in the following
sections. For this purpose, the data provided by NSSO of 2004-5 to 2011-12 for state and all India
level information on employment characteristics and the data for district level from the census of
India have been used. It highlights some of the major employment issues such as work participation
rate, unemployment, employment status, industry and occupational pattern of Jharkhand compared
with All India. In addition, census of India, 2011 data also used to analyze employment pattern and
occupations at district level. Engel ratio, poverty ratio and simple percentage analysis have been
done across sector (rural and urban) and social groups (SC, ST, OBC and Others).For employment,
usual principal and subsidiary status (UPSS) for NSSO and total workers (main and marginal) for
census have been used for the analysis.
The paper is divided in to four main sections. After a brief introduction in section I, section II
describe the methodology and data sources, section III focus on findings on employment and
poverty level in the state and last section IV concludes the paper with main findings and
suggestions.
Findings
Employment: The work participation rate (WPR) indicates the percentage of economically active
people in the population, and the related data are presented in Table 1. In Jharkhand and India, 35.1
per cent and 38.6 per cent people respectively were economically active in the population in 2011-
12. There was significant difference in rural-urban WPR with higher proportion of people in rural
areas involved in economic activities compared to urban areas. The WPR has declined both in
Jharkhand and all-India. The decline was greater in rural areas compared to urban areas between
2004-05 and 2011-12. Table-1
Work Participation Rate (WPR) in India and Jharkhand, 2004-05 and 2011-12
Rural Urban Total
2004/05 2011/12 2004/05 2011/12 2004/05 2011/12
India 43.9 39.9 36.5 35.5 42.0 38.6
Jharkhand 42.7 37.0 31.1 28.4 40.7 35.1
Source: National Sample Survey, 2004-05 and 2011-12

Employment and Poverty in Jharkhand and India Balwant Singh Mehta & Bharat Singh
Volume-II, Issue-V March 2016 313
WPR across social groups indicate higher WPR among STs, SCs, OBCs than Other social group
in Jharkhand in 2011-12 (Table 2). This pattern is also true in case of rural areas, where the STs and
SCs constitute more in the total population than urban areas. Paradoxically, the higher employment
of STs, SCs and OBCs in rural areas and overall only reflects more vulnerability than wellbeing
among these groups.
Table-2
Work Participation Rate (WPR) by Social Group in Jharkhand in 2011-12
ST SC OBC Others Total
Rural 41.0 35.4 36.4 31.5 37.0
Urban 29.9 31.8 26.1 29.5 28.4
Total 40.1 34.6 34.3 30.7 35.1
Source: National Sample Survey, 2011-12
In absolute terms, the employment in all India and Jharkhand was 473 million and 11.8 million
respectively in 2011-12 as shown in Table 3. Overall employment has increased marginally on
account of high growth rate in urban areas during 2004-05 and 2011-12. The employment has
declined in rural areas during the same period. One of the main reasons cited for the decline is
significant number of people have opted not to work and continue education. In addition, overall
household income in rural poor has also increased due to several government welfare schemes. The
government scheme like MGNREGS provide employment to the rural households but they are not
counted as employed according to NSS definition due to mostly less than 30 numbers of average
days worked under the scheme.
The unemployment rate, according to UPSS criteria in all India and Jharkhand was 2.2 per cent
and 2.6 per cent respectively in 2011-12 as given in Table 3. In contrast to the all-India pattern
where unemployment rate has declined, it has increased for Jharkhand between 2004-5 and 2011-12.
In particular, unemployment rate in Jharkhand has increased in rural areas from 1.4 per cent to 2.1
per cent during the same period. However in case of urban Jharkhand unemployment rate has
declined from 6.5 per cent in 2004-05 to 5.1 per cent in 2011-12. Overall this indicates that in rural
areas of the state a relatively larger proportion of persons who were willing to work, were actually
not able to get employment. The employment rate has rather decreased in both Jharkhand and all
India as discussed earlier.
Table-3
Unemployment Rate (WPR) in India and Jharkhand, 2004-05 to 2011-12
Rural Urban Total
2004/05 2011/12 2004/05 2011/12 2004/05 2011/12
India 1.7 1.7 4.5 3.4 2.3 2.2
Jharkhand 1.4 2.1 6.5 5.1 2.1 2.6
Source: National Sample Survey, 2004-05 and 2011-12
The status of employment reflects the quality of employment among workers as regular or
salaried employment is considered to be the best and casual labour is considered to be the worst
form of work status. Around 64 per cent of workers in the state were self-employed and 25.6 per
cent were in the casual labour category. Only 10.2 per cent were in salaried employment (Table 4).

Employment and Poverty in Jharkhand and India Balwant Singh Mehta & Bharat Singh
Volume-II, Issue-V March 2016 314
In rural areas, self-employed and casual labour proportion in total workers were relatively higher
than urban areas, while salaried or regular workers proportion in total workers were nine times
higher in urban areas than rural in the state in 2011-12. This shows a wide disparity in the
employment status level of the workforce across rural and urban areas.
Table-4
Status of Employment in Jharkhand, 2011-12
Rural Urban Total
Self-Employed 68.6 43.8 64.2
Regular/Salaried 4.2 38.0 10.2
Casual Labour 27.2 18.2 25.6
Total 100.0 100.0 100.0
Source: National Sample Survey, 2011-12
In Jharkhand, around half of the total workers were involved in agriculture and allied activities in
2011-12 as shown in Table 5. The second highest industry of employment was construction
followed by trade, hotel & restaurant and manufacturing, other social services and mining &
quarrying.
Table-5
Industrial Distribution of Employment in Jharkhand, 2011-12
Rural Urban Total
Agriculture and Allied activities 60.6 3.7 50.4
Mining & Quarrying 1.2 7.4 2.3
Manufacturing 7.0 10.7 7.7
Electricity, Gas & Water supply 0.5 0.5 0.5
Construction 18.2 14.3 17.5
Trade, Hotel & restaurants 7.2 29.9 11.3
Transport, Storage & Communication 2.2 10.1 3.6
Finance, Business, Real Estate, etc 0.4 8.2 1.8
Public Admin, Health, education, etc. 2.6 15.3 4.9
Total 100.0 100.0 100.0
Source: National Sample Survey, 2011-12
A similar pattern of employment across industries was also observed in case of rural areas.
However, in urban areas, trade, hotel & restaurants employed the maximum workers followed by
public admin, health & education, construction, transport, storage and communication and
manufacturing.
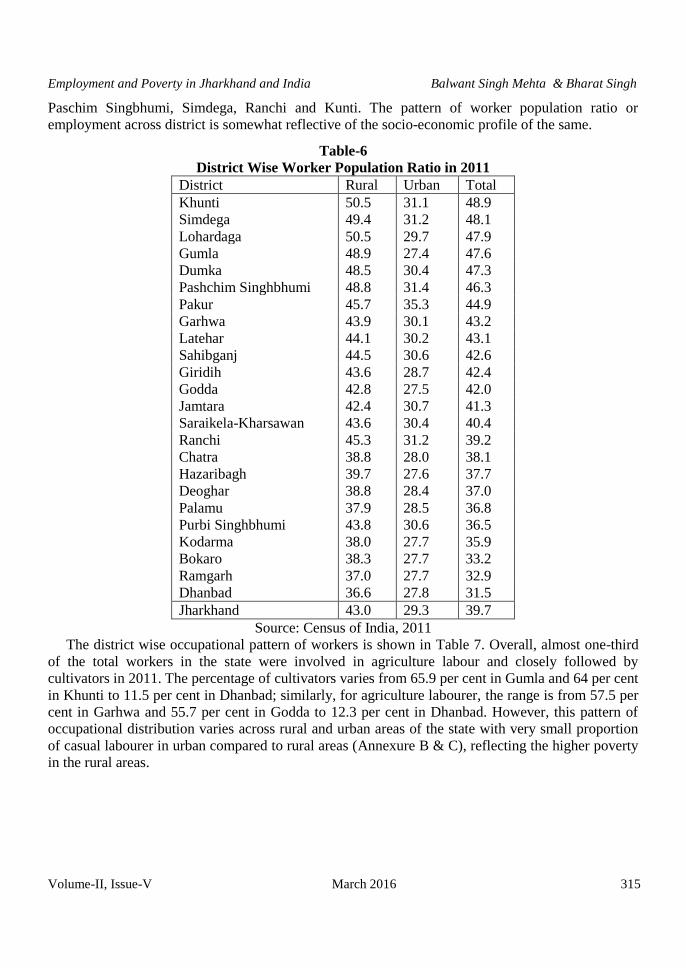
District Level Analysis: The district wise employment or worker population ratio of Jharkand state
is presented in Table 6. The result shows that the top five districts on the basis of worker population
ratio were Kunti, Simdega, Lohardaga, Gumla and Dumka in 2011. On the other hand, some
districts, namely, Dhanbad, Ramgarh, Bokaro, Kodarma and Purbi Singhbumi showed the lowest
worker population ratio in the same year. In the rural areas, worker population ratio was very much
similar to the average across the districts in the state. However, if we look at the urban area, the
pattern is different. In urban areas, Pakur showed the highest worker population ratio followed by
Employment and Poverty in Jharkhand and India Balwant Singh Mehta & Bharat Singh
Volume-II, Issue-V March 2016 315
Paschim Singbhumi, Simdega, Ranchi and Kunti. The pattern of worker population ratio or
employment across district is somewhat reflective of the socio-economic profile of the same.
Table-6
District Wise Worker Population Ratio in 2011
District Rural Urban Total
Khunti 50.5 31.1 48.9
Simdega 49.4 31.2 48.1
Lohardaga 50.5 29.7 47.9
Gumla 48.9 27.4 47.6
Dumka 48.5 30.4 47.3
Pashchim Singhbhumi 48.8 31.4 46.3
Pakur 45.7 35.3 44.9
Garhwa 43.9 30.1 43.2
Latehar 44.1 30.2 43.1
Sahibganj 44.5 30.6 42.6
Giridih 43.6 28.7 42.4
Godda 42.8 27.5 42.0
Jamtara 42.4 30.7 41.3
Saraikela-Kharsawan 43.6 30.4 40.4
Ranchi 45.3 31.2 39.2
Chatra 38.8 28.0 38.1
Hazaribagh 39.7 27.6 37.7
Deoghar 38.8 28.4 37.0
Palamu 37.9 28.5 36.8
Purbi Singhbhumi 43.8 30.6 36.5
Kodarma 38.0 27.7 35.9
Bokaro 38.3 27.7 33.2
Ramgarh 37.0 27.7 32.9
Dhanbad 36.6 27.8 31.5
Jharkhand 43.0 29.3 39.7
Source: Census of India, 2011
The district wise occupational pattern of workers is shown in Table 7. Overall, almost one-third
of the total workers in the state were involved in agriculture labour and closely followed by
cultivators in 2011. The percentage of cultivators varies from 65.9 per cent in Gumla and 64 per cent
in Khunti to 11.5 per cent in Dhanbad; similarly, for agriculture labourer, the range is from 57.5 per
cent in Garhwa and 55.7 per cent in Godda to 12.3 per cent in Dhanbad. However, this pattern of
occupational distribution varies across rural and urban areas of the state with very small proportion
of casual labourer in urban compared to rural areas (Annexure B & C), reflecting the higher poverty
in the rural areas.

Employment and Poverty in Jharkhand and India Balwant Singh Mehta & Bharat Singh
Volume-II, Issue-V March 2016 316
Table-7
District Wise Occupation Distribution (Total) of Workers, 2011
Name CL AL HHW OTH Total
Garhwa 19.9 57.5 2.5 20.1 100.0
Chatra 30.0 47.4 3.6 19.0 100.0
Kodarma 32.3 25.0 3.1 39.7 100.0
Giridih 35.7 35.0 3.1 26.2 100.0
Deoghar 23.3 38.0 7.1 31.5 100.0
Godda 26.2 55.7 3.4 14.7 100.0
Sahibganj 22.4 42.2 8.8 26.5 100.0
Pakur 26.0 37.1 4.8 32.1 100.0
Dhanbad 11.5 12.3 3.1 73.2 100.0
Bokaro 20.1 18.4 3.2 58.3 100.0
Lohardaga 45.1 36.5 2.0 16.4 100.0
Purbi Singhbhumi 13.4 25.1 2.6 59.0 100.0
Palamu 18.7 53.4 2.8 25.1 100.0
Latehar 33.1 45.5 2.9 18.4 100.0
Hazaribagh 37.0 26.3 2.5 34.2 100.0
Ramgarh 29.1 15.0 2.7 53.2 100.0
Dumka 31.0 48.5 3.7 16.8 100.0
Jamtara 32.5 41.5 3.5 22.5 100.0
Ranchi 27.8 23.4 3.4 45.5 100.0
Khunti 64.0 19.0 3.6 13.5 100.0
Gumla 65.9 20.1 2.6 11.4 100.0
Simdega 54.7 31.3 2.8 11.2 100.0
Pashchim Singhbhumi 35.1 38.5 3.6 22.8 100.0
Saraikela-Kharsawan 27.1 33.2 2.4 37.2 100.0
Jharkhand 29.1 33.9 3.5 33.5 100.0
Source: Census of India, 2011
Note: CL: Cultivator; AL: Agriculture Labour; HHW: Household Worker; OTH: Other Workers
Poverty: The 2011-12 poverty estimates by the Planning Commission shows that population below
the poverty line in Jharkhand (37 per cent) was second highest in the country after Chhattisgarh
(39.93 per cent) and significantly more than the national average (21.9 per cent). The poverty line,
estimated by the Planning Commission on the basis of monthly per capita consumption expenditure
data collected by National Sample Survey Office (NSSO), has been revised continuously by expert
groups and the latest was headed by Prof. Tendulkar, which computed the poverty lines at all India
and states level for rural and urban areas separately for 2004-5 which was further updated by the
Planning Commission for the year, 2009-10 and 2011-12 (GoI, 2012).1
1 On the basis of poverty line a head-count ratio (HCR) or population below the poverty line is calculated for
2004-5 and 2011-12 is given in annexure 2. Head count Ratio is the proportion of the poor in the aggregate
population.

Employment and Poverty in Jharkhand and India Balwant Singh Mehta & Bharat Singh
Volume-II, Issue-V March 2016 317
In absolute numbers, 269.3 million people were below the poverty line in all India and 12.4
million in Jharkhand in 2011-12 (Table 8). The percentage of people living below the poverty line in
the country has declined more (from 37.2 per cent in 2004-5 to 21.9 per cent in 2011-12) than that of
Jharkhand (45.3 per cent in 2004-05 to 37 per cent in 2011-12) between the years 2004-5 and 2011-
12. In absolute terms, the number of poor people has fallen by 137.8 million in India and 0.8 million
in Jharkhand. The number of poor has declined on an average little higher than four times in all
India (4.8 per cent per year) compared to Jharkhand (0.9 per cent per year). Jharkhand’s
neighbouring states, Odisha, Bihar and Chhatisgarh also fall in the top five poorer states in the
country and they are far behind from the economically better performing states such as Punjab,
Maharashtra and Tamil Nadu (GoI, 2012).
There has been significant difference in rural-urban poverty head-count ratio (HCR), which was
twice in urban areas of all India and 1.6 times in Jharkhand than their rural areas in 2011-12.
However, the decline in population below the poverty line in rural and urban areas showed a
contradictory picture in case of Jharkhand and all India. The poverty has declined both in rural and
urban areas at the national level but in Jharkhand, it increased marginally in urban areas. This may
be due to huge migration from rural to urban areas and subsequent increase in urban population over
the years. In absolute terms, the number of poor people decreased by 1.2 million in rural areas but
increased by 0.4 million in urban areas of the state.
Table-8
Number and Percentage of Population below poverty line in India and Jharkhand (% and
No.), 2004-05 and 2011-12
Poverty Ratio
(%)
Number of Poor (million)
Rural Urban Total Rural Urban Total
All India
2004-05 41.8 25.7 37.2 326.3 80.8 407.1
2011-12 25.7 13.7 21.9 216.5 52.8 269.3
Change (%) 16.1 12.0 15.3 109.8 28.0 137.8
Jharkhand
2004-05 51.6 23.8 45.3 11.6 1.6 13.2
2011-12 40.8 24.8 37.0 10.4 2.0 12.4
Change 10.8 -1.0 8.3 1.2 -0.4 0.8
Source: Planning Commission, Government of India, 2012
The population below poverty line by social groups in Jharkhand and India is given in Table 9 for
the year 2011-12. Overall, Schedule Tribes (ST) exhibits the highest population below the poverty
line followed by Schedule Caste (SC), Other Backward Caste (OBC) and Others (Upper Caste).
This pattern of poverty ratio was very much similar for both Jharkhand and all India. Furthermore,
the poverty gap across social groups showed that more people fall under the poverty line in rural
areas compared to urban areas except SC in Jharkhand. However, the poverty gap across social
groups was relatively higher in all India than Jharkhand.

Employment and Poverty in Jharkhand and India Balwant Singh Mehta & Bharat Singh
Volume-II, Issue-V March 2016 318
Table-9
Poverty in India and Jharkhand by Social Groups in 2011-12
Social Group Rural Urban Total Rural Urban Total
India Jharkhand
Scheduled Tribe 42.7 23.3 40.6 51.6 28.7 49.7
Scheduled Caste 32.3 21.6 29.9 40.4 40.6 40.4
Other Backward Caste 24.0 16.2 21.9 36.2 28.2 34.6
Others 15.0 7.4 11.9 31.3 12.5 23.1
Total 25.7 13.7 21.9 40.8 24.8 37.0
Source: National Sample Survey, 2011-12
NSS provides disaggregated information of the surveyed households according to their economic
groups using the terminology ‘Household type’. Household types are distinguished according to
major source of livelihood of a household during the last year preceding the date of survey. For rural
areas, households are classified into five categories namely self-employed in agriculture, self-
employed in non-agriculture, rural agricultural labour, other (than agricultural) rural labour and
(residual) others. For the urban areas households are categories into four types, namely, self-
employed households, wage and salaried income households, casual labour households and
(residual) others.
For occupational categories in rural areas, agricultural labour households exhibit the highest
poverty ratio both in Jharkhand (54.8 per cent) and all India (38.3 per cent) for 2011-12 as given in
Table 10. These categories were closely followed by non-agricultural labour (46.2 per cent in
Jharkhand and 33.5 per cent in India), self-employed in agriculture (45.3 per cent in Jharkhand and
22.9 per cent in India) and self-employment in non-agriculture households (32.9 per cent in
Jharkhand and 20.3 per cent in all India). As expected, those households, who were in regular
wage/salaried jobs had the lowest proportion of poor (10.1 per cent in Jharkhand and 20.3 per cent
in all India) both in all India and Jharkhand.
Table-10
Poverty in Rural India and Jharkhand by Household type in 2011-12
Occupational Categories India Jharkhand
Self Employed in Agriculture 22.9 45.3
Self Employed in Non-Agriculture 20.3 32.9
Regular/Salary Earning 10.1 20.3
Casual Labour in Agriculture 38.3 54.8
Casual Labour in Non-agriculture 33.5 46.2
Others 21.0 21.6
Source: National Sample Survey, 2011-12
A similar picture emerges for urban counterparts of Jharkhand and all India, where casual labour
households showed the highest poverty ratio (53.3 per cent in Jharkhand and 32.2 per cent in all
India) followed by self-employed (23.4 per cent in Jharkhand and 15.4 per cent in all India) for
2011-12 as presented in Table 11. Households involved in regular or salaried jobs had the lowest
poverty ratio both in Jharkhand and all India.

Employment and Poverty in Jharkhand and India Balwant Singh Mehta & Bharat Singh
Volume-II, Issue-V March 2016 319
Table-11
Poverty in Urban India and Jharkhand by Household Type in 2011-12
Occupational Categories India Jharkhand
Self Employed 15.3 23.4
Regular/Salary Earning 6.5 17.1
Casual Labour 32.2 53.3
Others 8.8 9.2
Source: National Sample Survey, 2011-12
The standard of living of people can be gauged from the levels and patterns of consumer
expenditures. As households get richer, their expenditures increase, and, furthermore, the share of
food expenditure in total expenditure declines, and within the food category, the share of
expenditure on cereals or staple foods like rice and wheat falls and that of processed foods, meat and
other items increases. There are two concepts based on the consumption expenditure that are often
used to show the standard of living. The first concept is that of monthly per capita consumer
expenditure (MPCE) and the second involves Engel’s ratio2. This ratio is widely used to indicate the
standard of living and the extent of poverty. The average MPCE at household level indicating the
standard of living of each household is presented for 2004-05 and 2011-12 in Table 12.
Table-12
Average Monthly per Capita Consumer Expenditure (MPCE), 2004-05 and 2011-12 (in Rs)
Current
Prices
Constant Prices
(2004-5)
Rural Urban Rural Urban Urban-Rural
difference %
India
2004-5 579 1105 579 1105 90
2011-12 1287 2477 855 1668 100
% Change 47.5 51.0
Jharkhand
2004-5 439 1017 439 1017 130
2011-12 920 1894 604 1211 100
% Change 37.5 19.0
Source: National Sample Survey, 2004-05 and 2011-12
The average MPCE of Jharkhand at current price was less than that of all India in both rural and
urban areas. The difference of average MPCE for all India and Jharkhand was more evident in case
of urban areas, which was Rs 88 in 2004-05 and Rs 583 in 2011-12. It increased in real terms in
rural areas of Jharkhand and all India by 47 per cent and 37.5 per cent respectively, while it grew by
51.0 per cent and 19 per cent in urban areas of the same. However, Jharkhand has shown a shrinking
rural-urban gap over the years, indicating that the disparities are being bridged, while rural-urban
disparities have increased for all India.
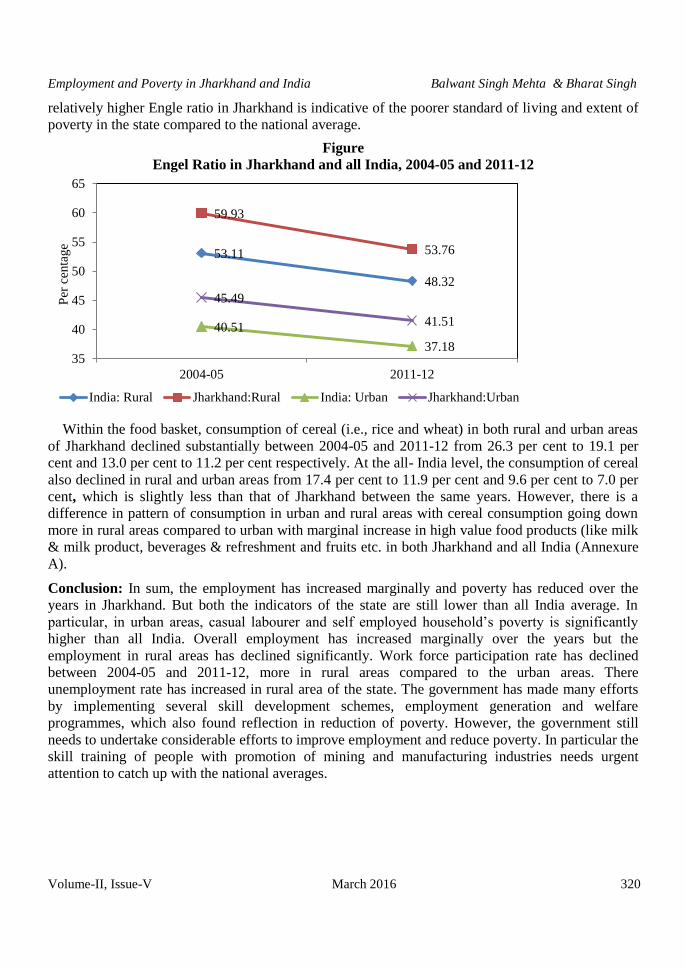
Figure 1 show that the Engel’s ratio is more than 50 percent for the rural areas in both 2004-05
and 2011-12 for Jharkhand but at the national level, it fell below that level in 2011-12 (i.e. 48.32 per
cent). The ratio is less than 50 per cent in urban areas for both Jharkhand and all India. The
2The share of food expenditure in total expenditure
Employment and Poverty in Jharkhand and India Balwant Singh Mehta & Bharat Singh
Volume-II, Issue-V March 2016 320
relatively higher Engle ratio in Jharkhand is indicative of the poorer standard of living and extent of
poverty in the state compared to the national average.
Figure
Engel Ratio in Jharkhand and all India, 2004-05 and 2011-12
Within the food basket, consumption of cereal (i.e., rice and wheat) in both rural and urban areas
of Jharkhand declined substantially between 2004-05 and 2011-12 from 26.3 per cent to 19.1 per
cent and 13.0 per cent to 11.2 per cent respectively. At the all- India level, the consumption of cereal
also declined in rural and urban areas from 17.4 per cent to 11.9 per cent and 9.6 per cent to 7.0 per
cent, which is slightly less than that of Jharkhand between the same years. However, there is a
difference in pattern of consumption in urban and rural areas with cereal consumption going down
more in rural areas compared to urban with marginal increase in high value food products (like milk
& milk product, beverages & refreshment and fruits etc. in both Jharkhand and all India (Annexure
A).
Conclusion: In sum, the employment has increased marginally and poverty has reduced over the
years in Jharkhand. But both the indicators of the state are still lower than all India average. In
particular, in urban areas, casual labourer and self employed household’s poverty is significantly
higher than all India. Overall employment has increased marginally over the years but the
employment in rural areas has declined significantly. Work force participation rate has declined
between 2004-05 and 2011-12, more in rural areas compared to the urban areas. There
unemployment rate has increased in rural area of the state. The government has made many efforts
by implementing several skill development schemes, employment generation and welfare
programmes, which also found reflection in reduction of poverty. However, the government still
needs to undertake considerable efforts to improve employment and reduce poverty. In particular the
skill training of people with promotion of mining and manufacturing industries needs urgent
attention to catch up with the national averages.
53.11
48.32
59.93
53.76
40.51
37.18
45.49
41.51
35
40
45
50
55
60
65
2004-05 2011-12
Per
cen
tage
India: Rural Jharkhand:Rural India: Urban Jharkhand:Urban

Employment and Poverty in Jharkhand and India Balwant Singh Mehta & Bharat Singh
Volume-II, Issue-V March 2016 321
References
1. Census of India 2011, PCA Tables, Registrar General of India, 2011
2. Government of India (GOI, 2012), Planning Commission, ‘ Press Note on Poverty
Estimates, 2011-12, accessed from http://planningcommission.nic.in/news/pre_pov2307.pdf
on date 20 March, 2016
3. India Human Development Report (IHDR), 2011, IAMR and Planning Commission, 2011
4. Jharkhand Economic Survey, 2013-14 accessed from http://finance-
jharkhand.gov.in/updates/eco-serv2013-14/EconomicSurvey2013-14.pdf on date 22 March,
2016
5. Singh,,K.M.; M.S.Meena, A.Kumar and R.K.P.Singh. 2012. Socio-Economic Determinants
of Rural Poverty: An Empirical Exploration of Jharkhand State, India. Development
Economics: Regional & Country Studies eJournal, Vol 1, Issue 15, Marh 09, 2016.
http://dx.doi.org/10.2139/ssrn.2017593
6. World Bank (2007), ‘Jharkhand :Addressing the Challenges of Inclusive Development’,
(20070, Report No. 36437-IN), Poverty Reduction and Economic Management India
Country Management Unit South Asia, 2007
Annexure A
Consumption Pattern of People in Jharkhand and India, 2004-05 and 2011-12
Item
India Jharkhand
Rural Urban Rural Urban Rural Urban Rural Urban
2004-05 2011-12 2004-05 2011-12
(1) (2) (3) (4) (5)
Cereal 17.4 9.6 11.9 7.0 26.3 13.0 19.1 11.2
Pulses & pulse products 3.0 2.0 3.1 2.1 2.9 2.1 3.0 2.1
Milk & milk products 8.2 7.5 9.0 7.5 4.4 6.6 5.5 6.6
Egg, fish & meat 3.2 2.6 3.5 2.7 3.5 3.0 3.7 2.8
Vegetables & Fruits 5.9 4.2 6.7 5.5 8.6 6.4 7.4 6.4
Beverage, Refreshments
etc
4.4 5.9 5.8 6.9 3.8 5.7 6.2 6.2
Others 11.1 8.6 8.2 5.5 10.4 8.8 8.8 6.2
Food 53.1 40.5 48.3 37.2 59.9 45.5 53.8 41.5
Fuel and light 9.8 9.5 9.2 7.4 11.1 8.1 10.5 7.2
Clothing, Bedding &
Footwear
7.8 6.6 7.9 6.9 7.8 7.6 9.1 8.5
Education 3.1 6.7 3.9 7.8 2.1 7.4 2.8 7.5
Medical 6.3 5.2 7.4 6.1 3.9 4.2 4.0 5.7
Entertainment 0.6 1.8 1.1 1.8 0.3 1.6 1.0 1.8
Conveyance 3.6 6.2 4.7 7.3 2.1 6.0 3.3 5.2
Rent 0.5 5.4 0.5 6.7 0.2 6.3 0.5 6.8
Others 15.2 18.1 17.0 18.8 12.6 13.2 15.2 15.9
Non-Food 46.9 59.5 51.7 62.8 40.1 54.5 46.2 58.5
Total 100.0 100.0 100.0 100.0 100.0 100.0 100.0 100.0
Source: Various Reports of Consumption Expenditure Surveys, National Sample Survey
Organistions, 2004-05 and 2011-012

Employment and Poverty in Jharkhand and India Balwant Singh Mehta & Bharat Singh
Volume-II, Issue-V March 2016 322
Annexure-B
District Wise Occupation Distribution (Rural) of Workers, 2011
District CL AL HHW OTH Total
Garhwa 20.4 58.7 2.5 18.4 100.0
Chatra 31.2 49.4 3.5 15.9 100.0
Kodarma 37.3 28.4 2.9 31.5 100.0
Giridih 37.6 36.8 3.1 22.6 100.0
Deoghar 26.5 43.2 7.5 22.9 100.0
Godda 26.8 57.2 3.4 12.6 100.0
Sahibganj 24.4 45.6 9.0 21.1 100.0
Pakur 27.6 39.1 4.5 28.8 100.0
Dhanbad 21.9 22.8 3.3 52.0 100.0
Bokaro 31.0 28.5 3.3 37.2 100.0
Lohardaga 48.4 39.1 1.9 10.6 100.0
Purbi Singhbhumi 24.6 45.5 3.0 26.9 100.0
Palamu 20.3 57.3 2.7 19.8 100.0
Latehar 34.6 47.2 2.9 15.3 100.0
Hazaribagh 41.5 29.4 2.5 26.7 100.0
Ramgarh 43.4 21.6 2.8 32.1 100.0
Dumka 32.2 50.3 3.6 13.8 100.0
Jamtara 34.7 44.3 3.6 17.5 100.0
Ranchi 41.1 33.5 3.2 22.2 100.0
Khunti 66.8 19.8 3.5 9.9 100.0
Gumla 68.1 20.6 2.4 8.8 100.0
Simdega 56.7 32.0 2.8 8.5 100.0
Pashchim Singhbhumi 38.8 42.1 3.6 15.5 100.0
Saraikela-Kharsawan 33.0 40.2 2.4 24.4 100.0
Jharkhand 34.8 40.3 3.5 21.4 100.0
Source: Census of India, 2011

Employment and Poverty in Jharkhand and India Balwant Singh Mehta & Bharat Singh
Volume-II, Issue-V March 2016 323
Annexure-C
District Wise Occupation Distribution (urban) of Workers, 2011
District CL AL HHW OTH Total
Garhwa 5.5 26.4 3.1 65.0 100.0
Chatra 3.9 4.7 5.6 85.9 100.0
Kodarma 4.4 6.0 4.3 85.4 100.0
Giridih 4.8 5.6 4.3 85.3 100.0
Deoghar 2.9 4.5 5.0 87.5 100.0
Godda 8.6 10.6 4.0 76.8 100.0
Sahibganj 5.1 11.9 7.4 75.6 100.0
Pakur 1.7 4.5 9.5 84.3 100.0
Dhanbad 1.7 2.2 2.8 93.3 100.0
Bokaro 3.6 3.2 3.0 90.3 100.0
Lohardaga 5.2 6.1 3.4 85.2 100.0
Purbi Singhbhumi 0.5 1.6 2.1 95.7 100.0
Palamu 3.2 14.8 4.1 77.9 100.0
Latehar 4.9 13.3 3.9 77.9 100.0
Hazaribagh 3.4 3.2 2.6 90.8 100.0
Ramgarh 4.9 3.8 2.4 89.0 100.0
Dumka 4.5 8.5 4.9 82.2 100.0
Jamtara 3.3 5.8 2.9 87.9 100.0
Ranchi 2.3 4.0 3.7 90.1 100.0
Khunti 14.5 5.4 4.8 75.3 100.0
Gumla 6.9 6.0 7.1 80.0 100.0
Simdega 13.9 15.6 2.6 67.9 100.0
Pashchim Singhbhumi 1.9 5.1 3.3 89.7 100.0
Saraikela-Kharsawan 1.2 2.2 2.1 94.5 100.0
Jharkhand 2.7 4.2 3.3 89.9 100.0
Source: Census of India, 2011