Employing Productivity Tools in Regulatory Reform Malaysia ...
23
Employing Productivity Tools in Regulatory Reform – Malaysia Experience National Career and Productivity Fair 2019 Phnom Penh 03Nov2019
Transcript of Employing Productivity Tools in Regulatory Reform Malaysia ...

Employing Productivity Tools
in Regulatory Reform –
Malaysia Experience
National Career and Productivity Fair 2019
Phnom Penh
03Nov2019

1960
Management Training &
Advisory Services
1990
Research & Systems
Developments
1995
Productivity & Efficiency
Enhancement
2000
Benchmarking & Best Practices
2005-2010
Competitiveness & Innovation
2010-2015
High impact productivity &
innovation drivers
2016-2020
Unlocking the Potential of Productivity
2
Towards a Quantum Leap Impact on
Productivity and Innovation
2
3.7% Productivity
Growth
5-6% GDP Growth
9.4% Private
Investment Growth
3.1
2.6 2.3
3.7
0.0
2.0
4.0
6.0
2001-2005 2006-2010 2011-2015 2016-2020
Gro
wth
(%
)
current
Target
Source : Computed from Department of Statistic Malaysia
Average Annual Productivity Growth in Malaysia


The Malaysia Productivity Blueprint represents a bold step in raising labour productivity to achieve the targets set in the
Eleventh Malaysia Plan, 2016-2020, laying the groundwork for an era of unprecedented productivity growth in the country.
MALAYSIA PRODUCTIVITY BLUEPRINT

CHALLENGES

KEY STRATEGIC THRUSTS

10th Malaysia Plan & 11th Malaysia Plan
“The National Policy on the Development and Implementation of Regulations (NPDIR) to modernise the current regulatory regime will be fully implemented to include states and local governments. The capacity of regulatory coordinators in ministries and agencies will be strengthened to ensure adherence to the NPDIR. The regulatory reform will also be aligned to Malaysia’s commitments in existing free trade agreements and unilateral liberalisation initiatives. “ – 11th MP
A POLITICAL MANDATE

An internationally recognised processes,
systems, tools and methods for improving
the quality of regulations.
Good governance: Ensuring regulations
are effective in addressing the desired
public policy objectives in an accountable,
equitable and transparent manner.
Malaysia launched National Policy on the
Development and Implementation of
Regulations (NPDIR) in July 2013.
WHAT IS GRP?
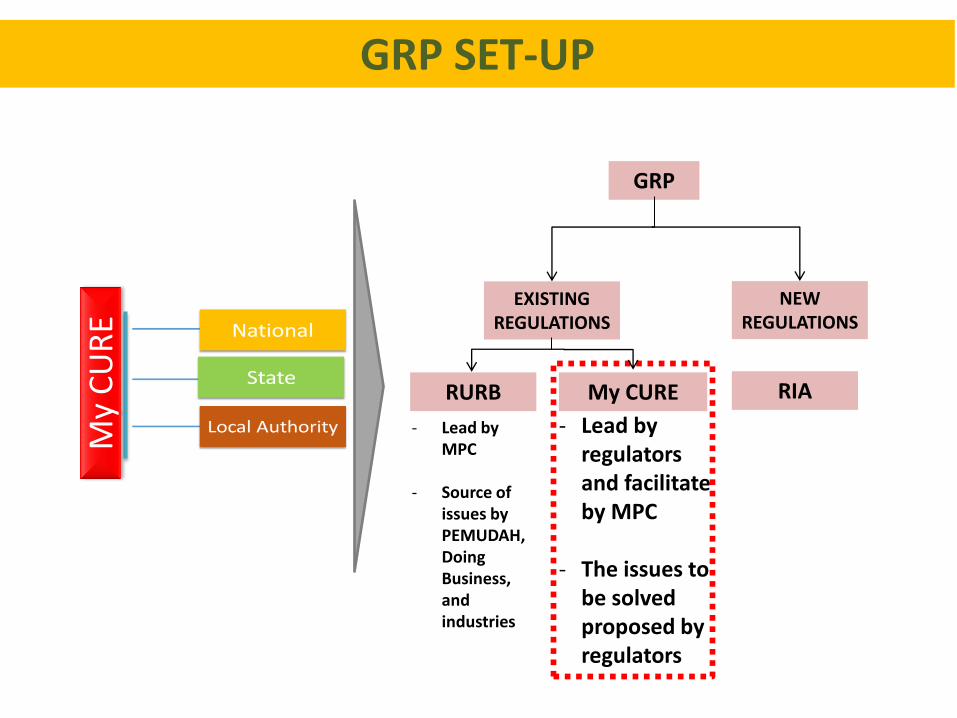
GRP
My CURE RURB
NEW REGULATIONS
EXISTING REGULATIONS
- Lead by regulators and facilitate by MPC
- The issues to
be solved proposed by regulators
My
CU
RE
- Lead by MPC
- Source of
issues by PEMUDAH, Doing Business, and industries
RIA
GRP SET-UP

Communication and consultation with
stakeholders involved
Regulatory inefficiency and delays
Coordination of all parties to achieve regulatory
coherence
Periodic reviews to assess the need &
ongoing effectiveness
Impacts of regulations,
requirements and procedures
Focus
Red tape refers to unimportant procedures such as forms, licenses or regulations that are faced including something that is outdated, overlapping, waste or confusion that may reduce the competitiveness of the public sector.
CUTTING RED TAPE - MYCURE

To establish the guiding principles and requirements for carrying out an adequate public consultation exercise
Public consultation enables the regulator to : • Develop better and more practical
regulations • Identify the full range of effected parties • Minimize the risk of unexpected
consequences • To discover better implementation
methods
PUBLIC CONSULTATION

Conduct Preliminary Planning
Step 1 Step 2 Step 3 Step 4 Step 5
Conduct Preliminary Planning
Step 2 Measuring the Current
Performance
Step 1 Defining the Issues / Problems
• The Project Team identify problematic issues related to regulation policy matters
Engagement Sessions with Stakeholders and
Customers
Approach : Discussion Duration : 1 Man Days Project Execution : 1 week
• Understanding RIA, RIS and DMAIC Methodology
• Set-up target outcome and goals • Develop action plan with milestone • Develop Public Consultation Plan • Identify the problem(s) that need to
be addressed. • State the Project objectives • Identify impacted customers and
stakeholders • Demonstrate that existing regulation
is not adequately addressing the problem
Engagement Sessions with Stakeholders and Customers
Approach : Discussion Duration : 3 Man Days Project Execution : 3-4 week
• Establish Data Collection Plan and Compliance Cost
• Conduct Baseline Study and Mapping Out Process
• Collect Process Data
Engagement Sessions with Stakeholders and Customers
Approach : Workshop Duration : 3 Man days Project Execution : 3-4 weeks
IMPLEMENTATION MILESTONE
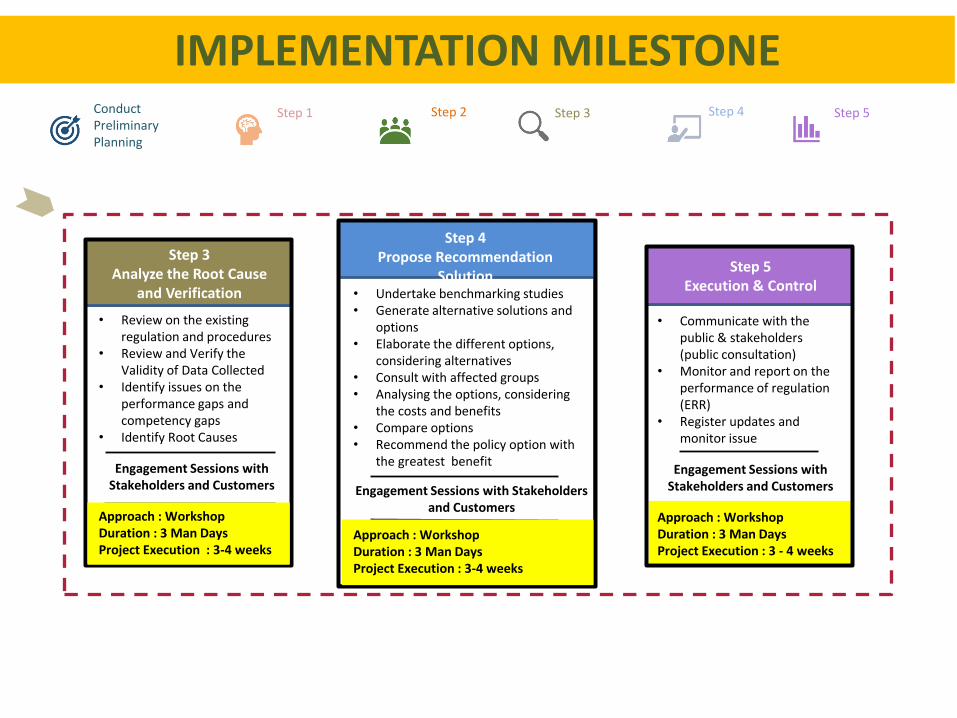
Conduct Preliminary Planning
Step 1 Step 2 Step 3 Step 4 Step 5
Step 5 Execution & Control
Step 4 Propose Recommendation
Solution
Step 3 Analyze the Root Cause
and Verification
• Review on the existing regulation and procedures
• Review and Verify the Validity of Data Collected
• Identify issues on the performance gaps and competency gaps
• Identify Root Causes
Engagement Sessions with Stakeholders and Customers
Approach : Workshop Duration : 3 Man Days Project Execution : 3-4 weeks
• Undertake benchmarking studies • Generate alternative solutions and
options • Elaborate the different options,
considering alternatives • Consult with affected groups • Analysing the options, considering
the costs and benefits • Compare options • Recommend the policy option with
the greatest benefit
Engagement Sessions with Stakeholders and Customers
Approach : Workshop Duration : 3 Man Days Project Execution : 3-4 weeks
• Communicate with the public & stakeholders (public consultation)
• Monitor and report on the performance of regulation (ERR)
• Register updates and monitor issue
Engagement Sessions with Stakeholders and Customers
Approach : Workshop Duration : 3 Man Days Project Execution : 3 - 4 weeks
IMPLEMENTATION MILESTONE

14
Formation of a group of workers to investigate,
analyse, and find the way to solve the problems
Part of excellence workplace culture.
The PDCA (Plan, Do, Check, Action) cycle is
utilized
The problem identification explained by 5W 1H
(What, When, Why, Who and Where, How)
approach.
Employing ICC tools and technique – 7 QC Tools
(New and Old)
ICC – Small Group Activities (QCC, SGA, SDWT) approach to improve pieces of the processes.
INNOVATIVE AND CREATIVE CIRCLE

SIX-SIGMA LEAN MANAGEMENT
MYC
UR
E
LEAN & SIX SIGMA METHODOLOGY

16
06
05
04 03
02
01
07
Present evidence on the magnitude of the problem
Demonstrate that existing regulation is not adequately addressing the problem
Document relevant existing regulation at all level of government
Present a clear case for considering that additional government action may be warrant
Identify the relevant, risk of a problem and explain why government should act to minimize them
Identify affected parties & stakeholders
Clearly define the problem need to be address
A Process Of Clear Description Of The Problem And Ways To Improve It
PROBLEM DEFINITION

ORDER
CREATED
Start Alarm Rings
Ready to Get Up ?
Climb Out of
Bed End
Hit Snooze Button
Delay
DEPT1 DEPT 2 DEPT 3 DEPT 4
SWIM LANE
30,000 FEET VIEW
DETAILED PROCESS FLOW
SHIP
ORDER ORDER
COMPLETED
PROCESS
ORDER
PROCESS MAPPING

18
18
3. Identify Key Input, Process and Output Metrics
Identify what metric information must be gathered to determine what are the ‘root causes’ of current process performance from process flow to excel.
5. Develop Operational Definitions Clearly, define each metric for which information will be gathered, to provide clarity
1. Accessing the baseline data & the performance gap
An analysis that involves the comparison of actual performance with potential or desired performance
2. Understanding type of data
a particular kind of data item, as defined by the values it can take, the programming language used, or the operations that can be performed on it.
6. Data Sampling A statistical analysis technique used to select, manipulate and analyze a representative subset of data points in order to identify patterns and trends in the larger data set being examined.
8. Basic Analysis Tools A set of Tools and techniques identified as being most helpful in troubleshooting issues related to quality & performance
7. Introduction to Data Mining the practice of examining large pre-existing databases in order to generate new information.
4. Develop Data Collection Plan
Develop a formal Data Collection Plan, including ‘stratification’ factors to assist in the Analyze Phase
MEASUREMENT

01 02
03 04
05 06
07
Organise Data
Compare Data
Clean Data
Summarise Data (Transform Raw Data Into Information)
Generate Tables And Graphs
Facilitate Presentation Of Information And Preparation Of Analytical Reports
Input Data Into The Computer
MEASUREMENT

Too Many Approval Levels
Shift Roles & Responsibilities
Rule out Non- Value Added Task
Eliminate Unnecessary Steps
4
Simplify the Process
1
Eliminate Solve Problems
Using Concurrent Processing 2
Combine Task
Automate
Relocate Works
3
Rearrange
SOLUTIONING

21
Savings on Compliance & Administration Costs
Elimination Of Attitude In Bureaucracy and Non-Relevant Requirements
Increasing Service Productivity & Efficiency In Department And Agencies (Shortening Time & Process)
Helps Enhance State Revenue (Royalties & Taxes)
01 04 02 03
BENEFITS TO ORGANIZATION

22
Exposure to Project Management
Implementation Methodology
Improving Problem Solving and Decision
Making Skills
Enhance knowledge on Data Driven
Decision Marking o Making decisions that are backed up by
hard data rather than making decisions that
are intuitive or based on observation alone.
Exposed to various Improvement Tools and
Techniques (Six-Sigma, Lean, ICC, etc.)
Mentored and facilitated by consultants
with Productivity Improvement expertise
Becomes Facilitator for new teams
BENEFITS TO TEAM PARTICIPANTS

23
PROJECT EXAMPLE