Employability at Coventry University - A Guide for Employers
EMPLOYERS’ PERCEPTIONS OF THE EMPLOYABILITY AND SKILLS OF RECENT GRADUATES IN CATALONIAMain findings of the AQU Catalunya Employers Survey 2014

EMPLOYERS’ PERCEPTIONS OF THE EMPLOYABILITY AND SKILLS OF RECENT GRADUATES IN CATALONIA
Main findings of the AQU Catalunya Employers Survey 2014
© Agència per a la Qualitat del Sistema
Universitari de Catalunya
C. dels Vergós, 36-42
08017 Barcelona
First edition: July 2015
Legal deposit: B 13436-2015
The contents of this guide are covered by a
Creative Commons Attribution-Non-
commercial-No Derivative Works 3.0 license.
Their reproduction, distribution and public
communication are permitted provided that
the name of the author is stated and that they
are not used for commercial purposes.
For the full license, see:
http://creativecommons.org/licenses/by-nc-
nd/3.0/legalcode
An e-version is also available at:
<www.aqu.cat>
Employers’ perceptions of the employability and skills of recent graduates in Catalonia
Table of contents 3
TABLE OF CONTENTS
TABLE OF CONTENTS ................................................................................................................ 3
Index of tables............................................................................................................................ 5
Index of figures .......................................................................................................................... 5
Index of graphs .......................................................................................................................... 5
0. Executive summary ............................................................................................................. 9
1. Introduction ........................................................................................................................ 15
1.1. The Employers project .................................................................................................. 15
1.2. Objectives of the Employers survey (stage 1) .............................................................. 16
1.3. The importance of the views and perceptions of employers ........................................ 17
1.4. Other studies and surveys taken as reference ............................................................. 18
2. Population and sample ...................................................................................................... 21
3. Characteristics of employers in the sample.................................................................... 25
3.1. Characteristics of the organisations in the sample ....................................................... 25
3.2. Sample informants ........................................................................................................ 29
3.3. Comparison between employers as a whole in Catalonia and those in the sample .... 30
4. Recent graduate recruitment ............................................................................................ 35
4.1. Recent graduate recruitment ........................................................................................ 35
4.2. Characteristics of the recruiting organisations in the sample ....................................... 37
4.3. Relevant factors in recent graduate recruitment ........................................................... 41
4.4. Difficulties with the recruitment of recent graduates ..................................................... 44
5. Skills of recent graduates ................................................................................................. 49
5.1. Employers’ views concerning the importance of the skills of recent graduates and their
actual satisfaction with their graduate recruits’ skills ............................................................... 49
5.2. Comparison between employers’ views concerning the importance of the skills of recent
graduates and their actual satisfaction with their employees’ skills ........................................ 53
Employers’ perceptions of the employability and skills of recent graduates in Catalonia
4 Table of contents
5.3. Scope for improvement in the skills of recent graduates .............................................. 59
6. Workplace training for recent graduates ......................................................................... 67
6.1. Workplace training ........................................................................................................ 67
6.2. Reasons for workplace training .................................................................................... 70
7. enterprise-university cooperation .................................................................................... 72
7.1. Frequency of enterprise-university cooperation............................................................ 72
7.2. Actions to improve the employability of recent graduates ............................................ 73
8. International Comparison .................................................................................................. 77
9. Conclusions ........................................................................................................................ 81
10. Bibliography .................................................................................................................... 85
Annex 1. Technical specifications ........................................................................................... 89
Annex 2. Employers survey questionnaire ............................................................................. 90
Annex 3. Editorial team ........................................................................................................... 100
Annex 4. Producing the listing of enterprises ...................................................................... 101
Annex 5. AQU Catalunya classification of branches of economic activity ....................... 102
Employers’ perceptions of the employability and skills of recent graduates in Catalonia
Table of contents 5
Index of tables
Table 1. Population and sample characteristics .......................................................................... 22
Table 2. Distribution of enterprises according to size ................................................................. 23
Table 3. Distribution of enterprises according to branch of activity ............................................. 23
Table 4. Position in the company of the survey informant according to the size of enterprise ... 30
Table 5. Comparison between enterprises in Catalonia and those in the sample according to size
and branch of activity .................................................................................................................. 33
Table 6. The mean number of graduates recruited according to the size of enterprise (last five
years) ........................................................................................................................................... 38
Table 7. The mean number of graduates recruited according to the percentage of graduate
employees in the enterprise (last five years) ............................................................................... 39
Table 8. The mean number of graduates recruited according to the innovation index (last five
years).......................................................................................................................................... 40
Table 9. The mean number of graduates recruited according to the human resource management
index (last five years) .................................................................................................................. 41
Table 10. Distribution of the difficulties with graduate recruitment according to the size of
enterprise ..................................................................................................................................... 48
Table 11. Examples of good practices in enterprise-university cooperation ............................... 75
Table 12. Benefits of enterprise-university cooperation .............................................................. 76
Table 13. Comparison between the main findings of the Employers survey and other international
surveys ........................................................................................................................................ 77
Table 14. Source of the company registers in the population and sample ............................... 101
Table 15. Branches of activity (AQU Catalunya classification) according to the percentage of
graduates, degree subject and branch of activity...................................................................... 102
Index of figures
Figure 1. Stages of the Employers project .................................................................................. 15
Figure 2. Comparison of Employers surveys .............................................................................. 19
Index of graphs
Graph 1. Distribution of enterprises according to size and the proportion of employees with a
university degree ......................................................................................................................... 26
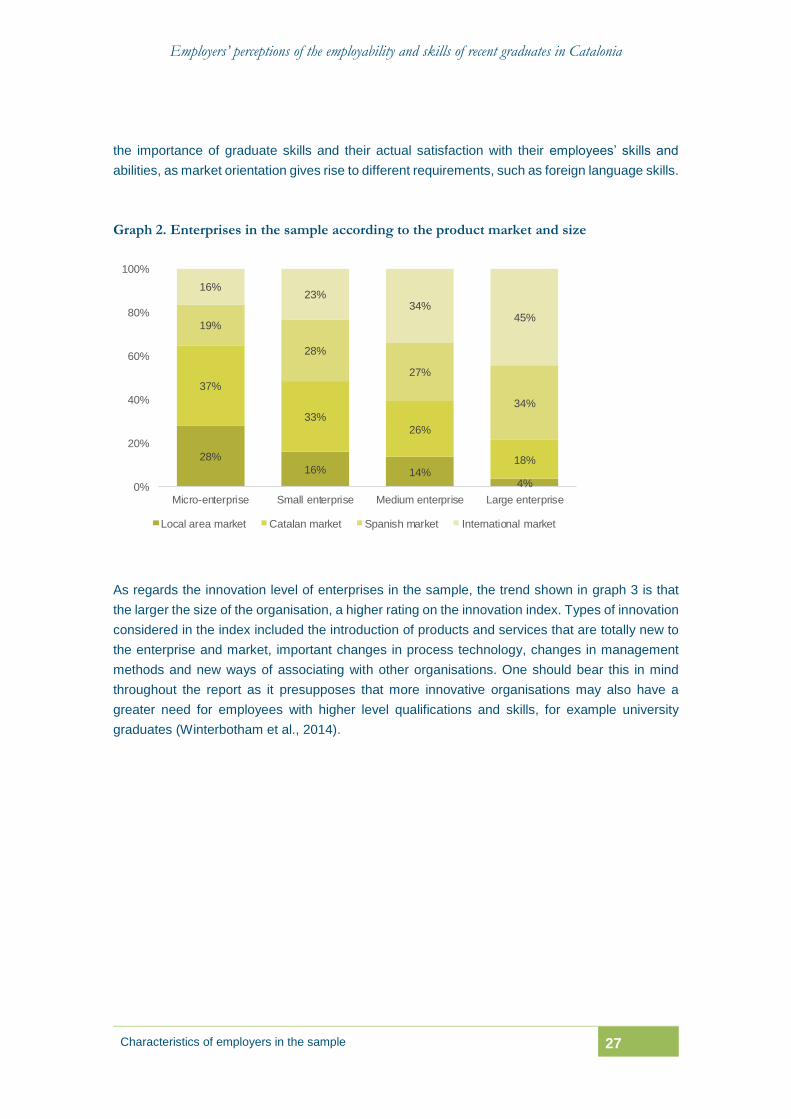
Graph 2. Enterprises in the sample according to the product market and size .......................... 27
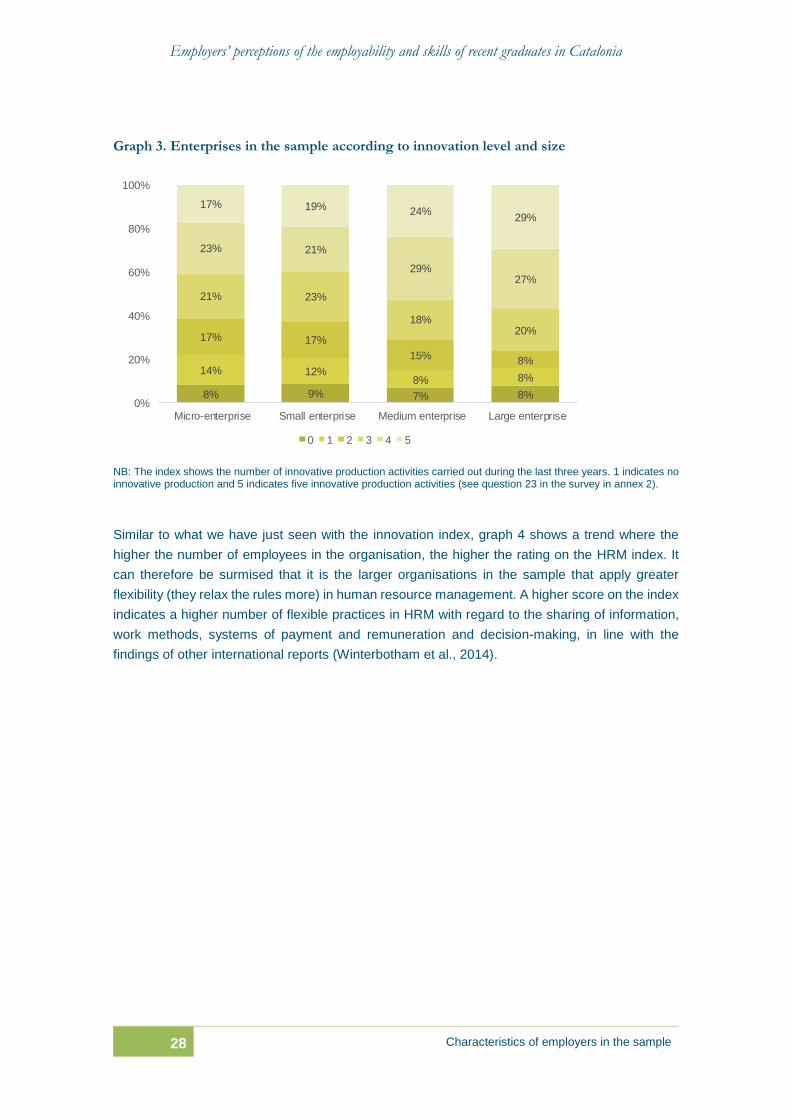
Graph 3. Enterprises in the sample according to innovation level and size ............................... 28
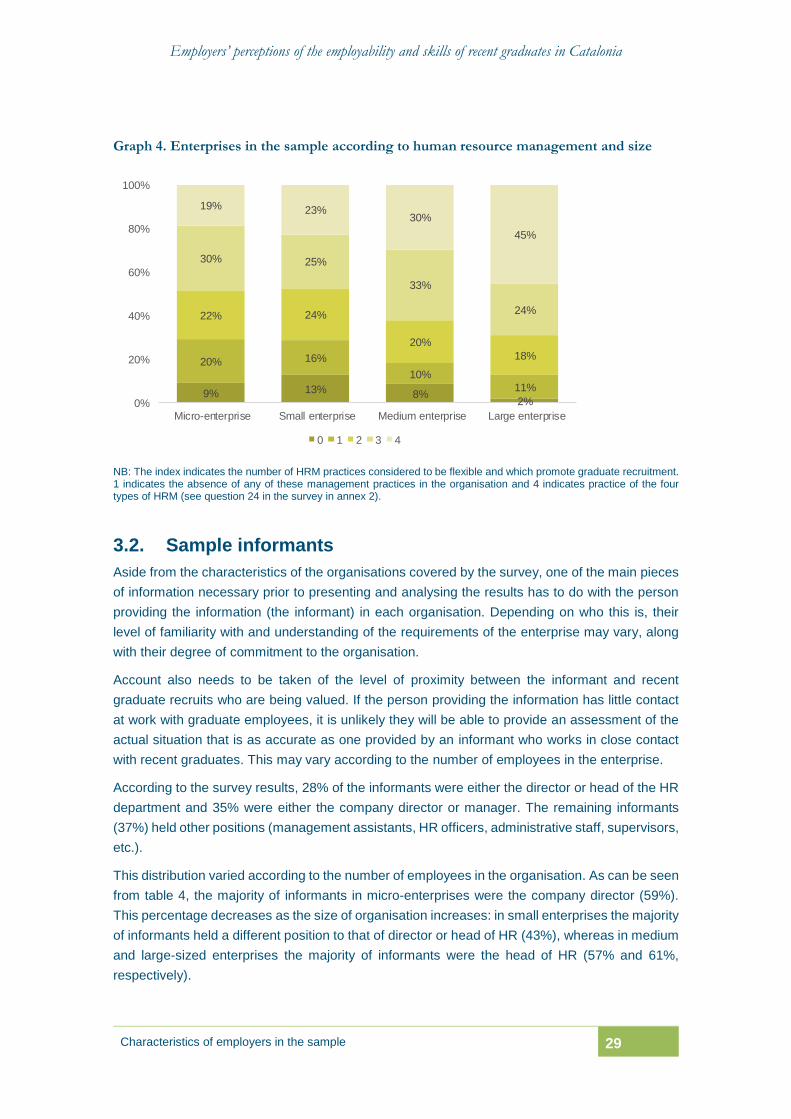
Graph 4. Enterprises in the sample according to human resource management and size ........ 29
Graph 5. Comparison between enterprises in general in Catalonia and those in the sample
according to size.......................................................................................................................... 31
Employers’ perceptions of the employability and skills of recent graduates in Catalonia
6 Table of contents
Graph 6. Comparison between enterprises in general in Catalonia and those in the sample
according to branch of activity ..................................................................................................... 32
Graph 7. Recent graduate recruitment in the last five years ....................................................... 36
Graph 8. Degree subjects of recent graduate recruits ................................................................ 37
Graph 9. Enterprises recruiting recent graduates according to size (last five years) ................. 38
Graph 10. Enterprises recruiting recent graduates according to the percentage of graduates in
the enterprise (last five years) ..................................................................................................... 39
Graph 11. Enterprises recruiting recent graduates according to the innovation index (last five
years) ........................................................................................................................................... 40
Graph 12. Enterprises recruiting recent graduates according to the human resource management
index (last five years) .................................................................................................................. 41
Graph 13. Importance of the type of degree in recruitment according to the size of enterprise . 42
Graph 14. Mean importance of recruitment ................................................................................ 43
Graph 15. Enterprises experiencing difficulties in the recruitment of recent graduates (last five
years) ........................................................................................................................................... 45
Graph 16. Enterprises experiencing difficulties in the recruitment of recent graduates, according
to size .......................................................................................................................................... 45
Graph 17. Enterprises experiencing difficulties in the recruitment of recent graduates according
to the percentage of employees with a higher education degree in the enterprise .................... 46
Graph 18. Reasons why enterprises have had difficulties in recruiting recent graduates .......... 47
Graph 19. Mean importance of the skills of recent graduates .................................................... 51
Graph 20. Mean satisfaction with the skills of recent graduates ................................................. 52
Graph 21. Comparison between the mean values for employers’ views concerning the importance
of and their satisfaction with the skills of recent graduates ......................................................... 53
Graph 22. Comparison between the overall mean values for employers’ views concerning the
importance of and their satisfaction with the skills of recent graduates according to branch of
activity .......................................................................................................................................... 54
Graph 23. Comparison between the mean values for employers’ views concerning the importance
of and their satisfaction with the skills of recent graduates according to branch of activity ........ 55
Graph 24. Comparison between the mean values for employers’ views concerning the importance
of and their satisfaction with the skills of recent graduates according to the size of enterprise . 58
Graph 25. Difference between the mean values for employers’ views concerning the importance
of and their satisfaction with the skills of recent graduates ......................................................... 60
Graph 26. Difference between the mean values for employers’ views concerning the importance
of and their satisfaction with the skills of recent graduates according to branch of activity ........ 62
Graph 27. Difference between the mean values for employers’ views concerning the importance
of and their satisfaction with the skills of recent graduates according to the size of enterprise . 65
Graph 28. Workplace training of recent graduates in the enterprise .......................................... 68
Employers’ perceptions of the employability and skills of recent graduates in Catalonia
Table of contents 7
Graph 29. Workplace training of recent graduates according to the size of the enterprise ........ 68
Graph 30. Workplace training of recent graduates according to the innovation
index........................................................................................................................................... 69
Graph 31. Workplace training of recent graduates according to the human resource management
index ............................................................................................................................................ 70
Graph 32. Reasons for the workplace training of recent graduates ........................................... 71
Graph 33. Frequency of enterprise-university cooperation ......................................................... 73
Graph 34. Importance of the measures for improving graduate employability ........................... 74

Employers’ perceptions of the employability and skills of recent graduates in Catalonia
Executive summary 9
0. EXECUTIVE SUMMARY
The Employers survey
The Employers survey forms part of a broader project to gain insight into the issues
being faced by enterprises (understood here to be companies and institutions as
employers) in relation to the employability of the population of recent higher
education graduates in Catalonia. The project consists of three stages: a survey of
graduate employers in Catalonia; discussion groups with graduate employers according
to their branch of economic activity; and grants to Catalan universities for research into a
better understanding and improvements to the employability of recent university
graduates.
On the basis of the results of the survey, this report provides information on the
perceptions and needs of employers regarding the skills and education level of
recent graduates.
The perceptions of employers complement those of higher education graduates,
which are detailed in the surveys on graduate employment outcomes that have
been carried out on an on-going basis in Catalonia since 2003. Given its
comparability with other European surveys such as Eurobarometer, the results of this
survey in Catalonia can also be seen and contextualised in an international context.
Given their particular characteristics, the health or education sectors were not
included in this survey, and separate surveys were conducted for these sectors.
Population and sample
A listing of enterprises was produced with the help of the universities’ careers and
information services, in addition to the medium and large enterprises operating in
Catalonia from the ACICSA 2014 yearbook.
The AQU Catalunya Employers survey consists of a total of 1,325 interviews carried
out with respondent enterprises operating in Catalonia. Interviews were conducted on-
line and by telephone.
66% of the enterprises in the sample were listed with the universities’ careers and
information services. They can therefore be viewed as being good respondents of
graduate skills.
Employers’ perceptions of the employability and skills of recent graduates in Catalonia
10 Executive summary
The sample is not representative of organisations with a production activity in
Catalonia. Medium and large-sized enterprises are over-represented in relation to the
overall group of enterprises in Catalonia, as they are the ones that recruit a higher volume
of university graduates.
Characteristics of the employers in the survey
In 47% of the enterprises contacted, more than half of all employees had a
university degree. Many of these organisations can be seen as having the capacity to
deliver value-added products and services.
The sales of medium and large-sized enterprises are aimed more at the Spanish
and international markets whereas the sales of micro and small enterprises are
concentrated in the Catalan market and at local area level. It is important to bear in
mind these differences in the assessment of graduate skills, particularly in foreign
languages and having either studied or worked abroad.
Among the enterprises contacted, those with a higher number of employees also tend
to be more innovative (introducing more new products and business services and the
market, changes in process technologies, etc.). Available evidence at the international
level shows that organisations that are more innovative tend to recruit more graduates.
Among the enterprises in the sample, the higher the number of employees in the
organisation, the more flexible practices in human resource management (HRM).
Flexible practices in HRM refers to the sharing of information, working methods and
procedures, payment and remuneration systems, and decision-making.
35% of the informants were the directors of the enterprise, 28% were heads of the
HR department and 37% held other positions in the organisation. Informants in
micro-enterprises tended to be the director or manager, whereas in medium and large-
sized enterprises it was either the director or head of the HR department who answered
the survey. In small enterprises the informants were more varied.
Recent graduate recruitment
Around 60% of the organisations in the sample had recruited recent graduates in
the last five years. This is an encouraging figure bearing in mind the context of economic
crisis in recent years
The main degree subjects of graduate recruits were Economics, Business
Management and Administration, and Business Sciences (34%); Production
Engineering (31%); and Information and Communications Technologies (28%).
Degrees in these subjects typically produce a high volume of graduates, although they
are more broad based and non-specific in terms of employment in any given occupation.
Enterprises that recruit a higher volume of graduates tend to be large entities, 60%
of their employees have a university degree and they are innovative in terms of their
products, services and processes.
91% of the employers in the sample considered a Bachelor’s degree to be an
important factor in recruitment, whereas most considered a Master’s (34%) or
Employers’ perceptions of the employability and skills of recent graduates in Catalonia
Executive summary 11
doctorate degree (8%) to be less important. The importance of a degree varied according
to the size of the enterprise.
The recruitment factors most highly rated by employers were, on a scale from 1 to
10, having studied abroad (6.6), work experience and internships (6,5), having worked
abroad (6.4) and the university’s reputation (5.5).
42% of employers recruiting graduates experienced challenges and/or difficulties
with recruitment, the main reasons being a shortage of applicants with the right skills
(60%); a shortage of graduates in a given field (30%); and a shortage of applicants willing
to accept the salary offered (20%).
Skills of recent graduates
On a scale from 1 to 10, the skills that employers in the sample considered to be
most important were demonstrating responsibility at work (8.9), the ability to acquire
new knowledge (8.4) and team working (8.3). The least important were negotiation skills
(6.4) and leadership (6.6).
Overall satisfaction with the skills of recruited graduates was 7 out of 10 (medium
to high). Although the rating varied according to the skill, all skills were given at least a
pass mark of 5.
On a scale from 1 to 10, the skills that employers in the sample were most satisfied
with were computer skills (7.9), demonstrating responsibility at work (7.6), team working
(7.5), theoretical skills (7.2) and the ability to acquire new knowledge (7.0). They were
least satisfied with leadership (5.8) and negotiation skills (5.7).
There was no marked variation in the levels of importance of and satisfaction with
the skills of recent graduates according to branch of activity nor size of the
organisation, except for foreign languages.
The branches of economic activity where foreign language skills were rated the
lowest were construction and building (6.1), mass communication media (6.8) and
business services (7.4).
Foreign language skills were considered to be more important in large enterprises
(8.4), compared to medium enterprises (7.9) and small and micro-enterprises (7.1).
The largest differences between the employers’ views concerning the importance
of and satisfaction with graduates’ skills were in problem solving (-1.7), practical
skills (-1.6) and the ability to generate new ideas (-1.5). These skills are therefore
considered to be where there is more scope for improvement.
Workplace training
74% of the organisations had provided graduate recruits with some kind of
training. This percentage varied according to the characteristics of the enterprise.
Large enterprises (87%) are those that provide the most training, compared to micro-
enterprises (67%), which offer the least.
Organisations that are more innovative (85%) provide more training than those that
are less innovative (50%).
Employers’ perceptions of the employability and skills of recent graduates in Catalonia
12 Executive summary
Organisations that are more flexible in terms of HRM (84%) provide more training than
those that have less flexible HRM practices (55%).
The main reasons for workplace training are the upgrading of sector-specific skills
and/or training (79%); to assist employees in adapting to the characteristics of the
enterprise and the corporate culture (65%); and improvements to soft skills (48%). Other
reasons include training due to lack of basic knowledge (34%) and to upgrade foreign
language skills.
Enterprise-university cooperation
More than 60% of the organisations cooperated with universities on a frequent basis by
offering work placements to undergraduate students.
86% of the employers in the sample had never been involved in the design and/or
discussion of curricula and study programmes.
According to employers in the survey, the best action for improving the employability of
graduates is the incorporation of work experience as part of the curriculum.
International comparison
At European level, organisations that recruit the most graduates are large enterprises
and the ones that are the most innovative. They are also the ones that most highly value
a Master’s degree.
One of the skills considered to be most important among both European and Catalan
employers is team working.
Coinciding with the assessment at European level, the two skills that employers in
Catalonia were most satisfied with are computing skills and team working.
In both Catalonia and Europe, the most frequent way in which universities and employers
collaborated is by offering work placements, experience and internships to undergraduate
students. This is also considered to be the best action for improving graduate
employability.
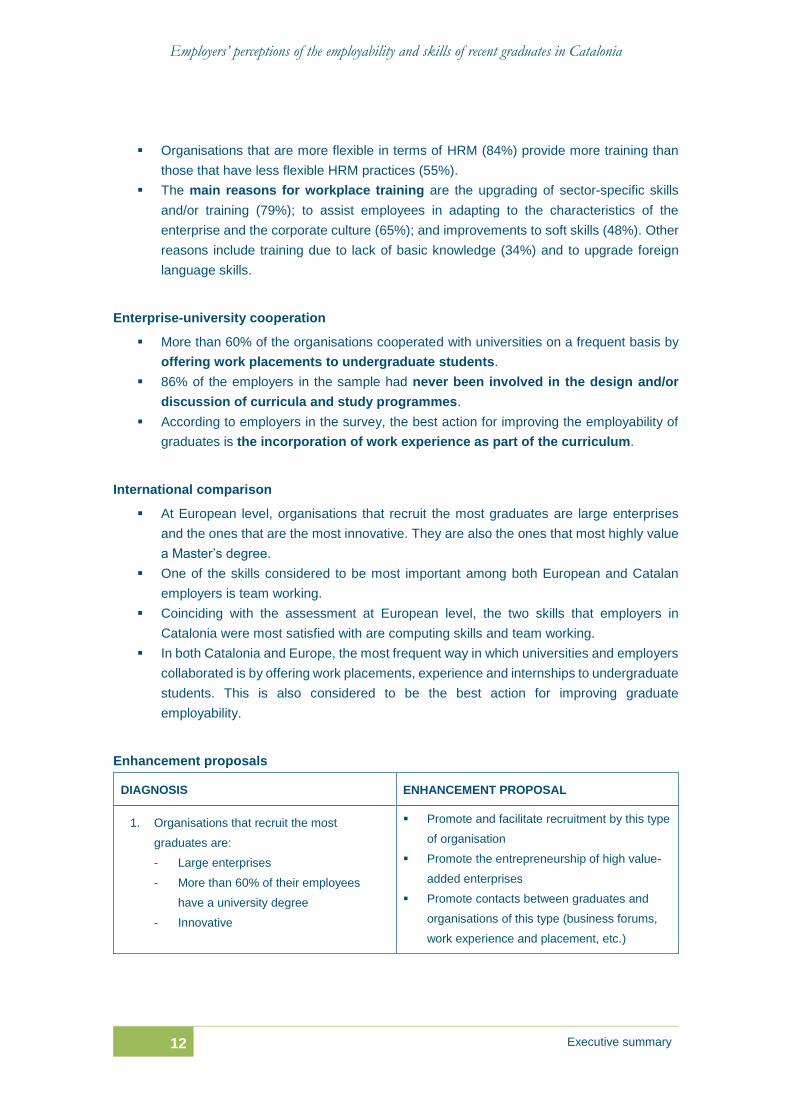
Enhancement proposals
DIAGNOSIS ENHANCEMENT PROPOSAL
1. Organisations that recruit the most
graduates are:
- Large enterprises
- More than 60% of their employees
have a university degree
- Innovative
Promote and facilitate recruitment by this type
of organisation
Promote the entrepreneurship of high value-
added enterprises
Promote contacts between graduates and
organisations of this type (business forums,
work experience and placement, etc.)
Employers’ perceptions of the employability and skills of recent graduates in Catalonia
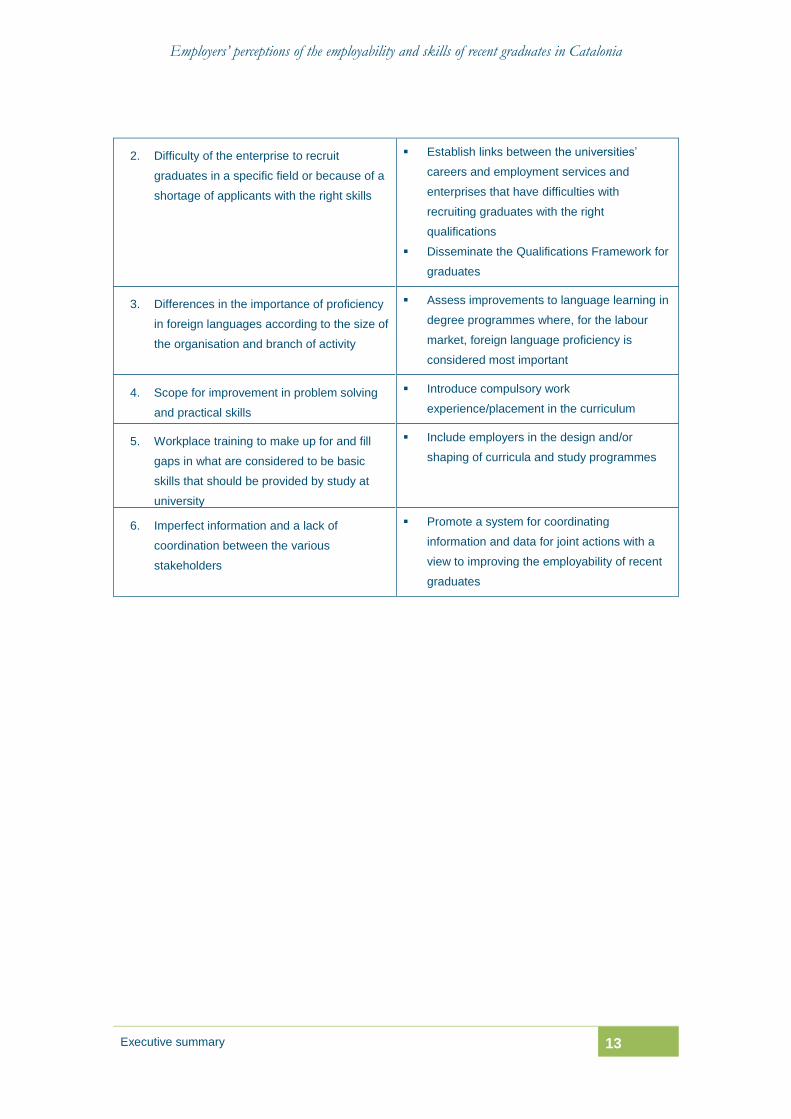
Executive summary 13
2. Difficulty of the enterprise to recruit
graduates in a specific field or because of a
shortage of applicants with the right skills
Establish links between the universities’
careers and employment services and
enterprises that have difficulties with
recruiting graduates with the right
qualifications
Disseminate the Qualifications Framework for
graduates
3. Differences in the importance of proficiency
in foreign languages according to the size of
the organisation and branch of activity
Assess improvements to language learning in
degree programmes where, for the labour
market, foreign language proficiency is
considered most important
4. Scope for improvement in problem solving
and practical skills
Introduce compulsory work
experience/placement in the curriculum
5. Workplace training to make up for and fill
gaps in what are considered to be basic
skills that should be provided by study at
university
Include employers in the design and/or
shaping of curricula and study programmes
6. Imperfect information and a lack of
coordination between the various
stakeholders
Promote a system for coordinating
information and data for joint actions with a
view to improving the employability of recent
graduates

Employers’ perceptions of the employability and skills of recent graduates in Catalonia
Introduction 15
1. INTRODUCTION
The Employers survey forms part of a broader project to obtain insight into the issues
being faced by employers and their perceptions regarding the employability of recent
graduates in Catalonia.
The purpose of the survey is to provide information on employers’ perspectives of the
skills and education level of recent university graduates in Catalonia.
The views of employers complement those of university graduates, which are detailed
in the surveys on graduate employment outcomes carried out on an on-going basis in
Catalonia since 2003. This overview of employers’ perspectives and graduate
employability in the university system in Catalonia is the first such study to provide
information on this subject in Spain.
1.1. The Employers project
The Employers (Ocupadors) project, which receives funding from Obra Social “la Caixa”, was
launched to complete the series of surveys on the employment outcomes of graduates in
Catalonia. The initial stage of the project consists of a survey to gather employers’ perceptions
on the skills and education level of the recent graduate population in Catalonia, the results of
which are presented in this report. The second stage of the Employers project consists of
discussion groups according to branches of economic activity that will follow up and discuss in
greater depth the general findings of the survey. The final stage of the project is a grant scheme
and a call for applications for more in-depth research into the match between the level of university
education of graduates and the requirements of the labour market (education-job skills match).
Employers’ perceptions of the employability and skills of recent graduates in Catalonia
16 Introduction
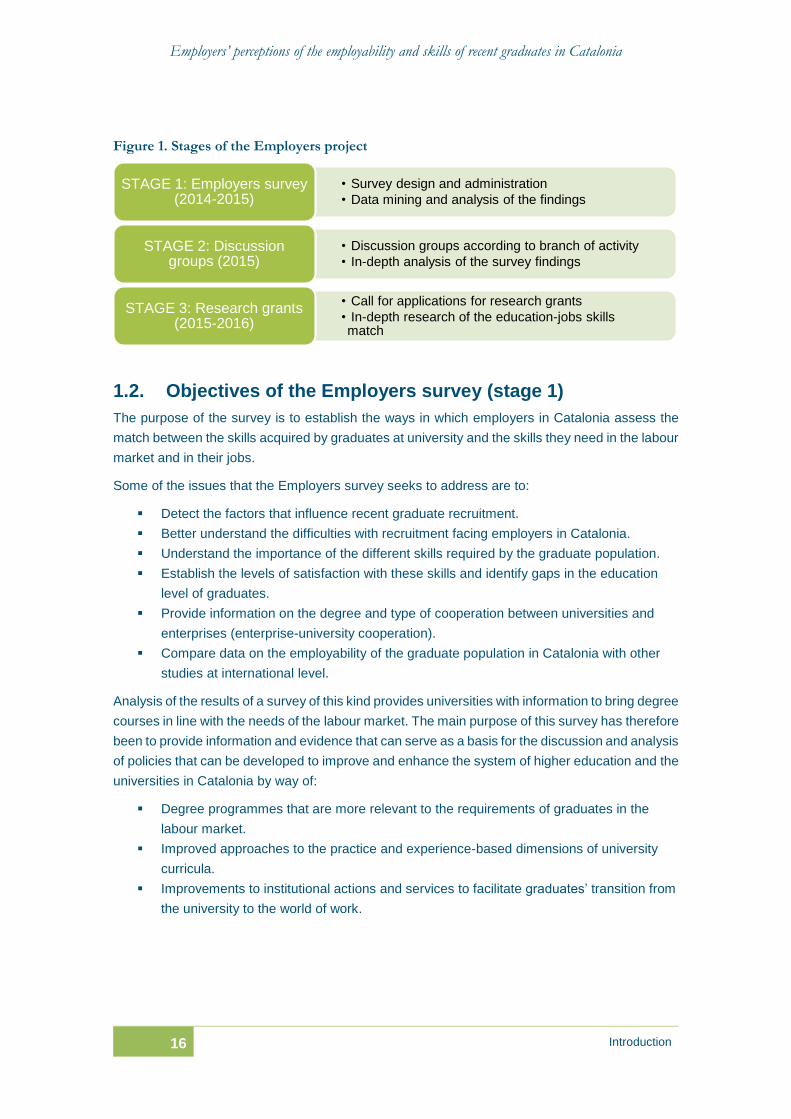
Figure 1. Stages of the Employers project
1.2. Objectives of the Employers survey (stage 1)
The purpose of the survey is to establish the ways in which employers in Catalonia assess the
match between the skills acquired by graduates at university and the skills they need in the labour
market and in their jobs.
Some of the issues that the Employers survey seeks to address are to:
Detect the factors that influence recent graduate recruitment.
Better understand the difficulties with recruitment facing employers in Catalonia.
Understand the importance of the different skills required by the graduate population.
Establish the levels of satisfaction with these skills and identify gaps in the education
level of graduates.
Provide information on the degree and type of cooperation between universities and
enterprises (enterprise-university cooperation).
Compare data on the employability of the graduate population in Catalonia with other
studies at international level.
Analysis of the results of a survey of this kind provides universities with information to bring degree
courses in line with the needs of the labour market. The main purpose of this survey has therefore
been to provide information and evidence that can serve as a basis for the discussion and analysis
of policies that can be developed to improve and enhance the system of higher education and the
universities in Catalonia by way of:
Degree programmes that are more relevant to the requirements of graduates in the
labour market.
Improved approaches to the practice and experience-based dimensions of university
curricula.
Improvements to institutional actions and services to facilitate graduates’ transition from
the university to the world of work.
• Survey design and administration
• Data mining and analysis of the findingsSTAGE 1: Employers survey
(2014-2015)
• Discussion groups according to branch of activity
• In-depth analysis of the survey findingsSTAGE 2: Discussion
groups (2015)
• Call for applications for research grants
• In-depth research of the education-jobs skills match
STAGE 3: Research grants (2015-2016)
Employers’ perceptions of the employability and skills of recent graduates in Catalonia
Introduction 17
1.3. The importance of the views and perceptions of employers
One of the functions of university is to provide people with knowledge and skills that are relevant
to the labour market (Santiago et al., 2008b). Although the main type of knowledge provided by
universities is of a theoretical nature, they are also responsible for introducing practical experience
in courses and skills that is relevant to the labour market (European
Commission/EACEA/Eurydice, 2014). In addition, the knowledge society increasingly requires
employees and workers to have higher-level skills and knowledge.
This is no easy task, given that the requirements and priorities of the labour market are constantly
changing and difficult to predict in the short term. According to the most extensive employers
survey carried out in the UK, more than 70% of employers anticipate that staff will need to acquire
new skills over the “coming year” (Winterbotham, Vivian, Shury, Davies, & Kik, 2014). The survey
also shows that professional occupations (mostly filled by graduates) are those most affected by
the need for “upskilling”.
The difficulty to predict future skills needs and requirements (CEDEFOP, 2008; Royal Society,
2010; PWC, 2015) means that efforts tend to focus on providing evidence as a way of raising
awareness on the subject, as to specific predictions being made and for each particular field
(European Commission, 2012; University of South Wales, 2014).
Universities and organisations therefore need to work together to achieve a good match between
the skills that are acquired by students at university and those used in the workplace. Cooperation
between universities and organisations is key to ensuring that the level of education and training
provided by both is complementary and satisfactory (QAA, 2014). The responsibilities need to be
separated out:
The universities need to educate and provide people with knowledge and skills that are
both general as well as soft skills, which can be potentially applied in most occupations
and branches of economic activity. They also need to provide the theoretical and practical
skills specific to a graduate’s field of study (European Commission/EACEA/Eurydice,
2014).
Enterprises and organisations need to complement a graduate’s level of education by
facilitating the practical application of theoretical knowledge acquired and the acquisition
of skills specific to the world of work, along with training in areas specific to the sector of
activity and/or the characteristics of the enterprise (QAA, 2010).
In terms of Catalonia, there is extensive and good quality information on the skills and level of
education of graduates and the actions carried out by the universities to upgrade and enhance
students’ skills (AQU Catalunya, 2014). Specific information on the views and needs of employers
in Catalonia as regards recent graduates has not available up until now, however, so part of the
picture concerning the assessment of recent graduate skills has been missing. This survey covers
the opinions of a sample group of employers in Catalonia as to how they value the skills of recent
graduates in terms of the education-job skills match. Although the sample is not representative of
all enterprises employing graduates in Catalonia, it does cover a wide range of branches of
economic activity and the different sizes (number of employees) of enterprises. It does therefore
Employers’ perceptions of the employability and skills of recent graduates in Catalonia
18 Introduction
fulfil the function of providing useful information that can be used for taking action to improve
graduate employability.
1.4. Other studies and surveys taken as reference
Two surveys of employers conducted in Europe were used as reference in the design and actual
carrying out of this survey: the European Commission’s Eurobarometer (The Gallup Organisation,
2010) titled “Employers’ perception of graduate employability” and the UK Commission’s
Employer Skills Survey 2013: UK Results (Winterbotham et al., 2014).
What these two studies have in common with this baseline survey in Catalonia is that all three
surveys were conducted to obtain information on employers’ views of skills, specifically of
university students, employees and recent graduates respectively. The three surveys also
coincide in that they focus on skills that are generic and transferable across different fields, as
survey responses referred to graduate employees from different fields of study. Individuals
answering the survey for enterprises were either in charge of selection and recruitment or
individuals in contact with recruits at work.
Figure 2 shows the main characteristics of these two other surveys in comparison with the survey
by AQU Catalunya as regards design and methodology, although not all the dimensions and
issues are exactly the same, i.e. totally comparable. Bearing in mind however that the purpose of
the survey is similar, the differences in certain results can be partially explained by the
methodology (population, geographical area, sample and year). The main results obtained in all
three studies are commented throughout this report.
Employers’ perceptions of the employability and skills of recent graduates in Catalonia
Introduction 19
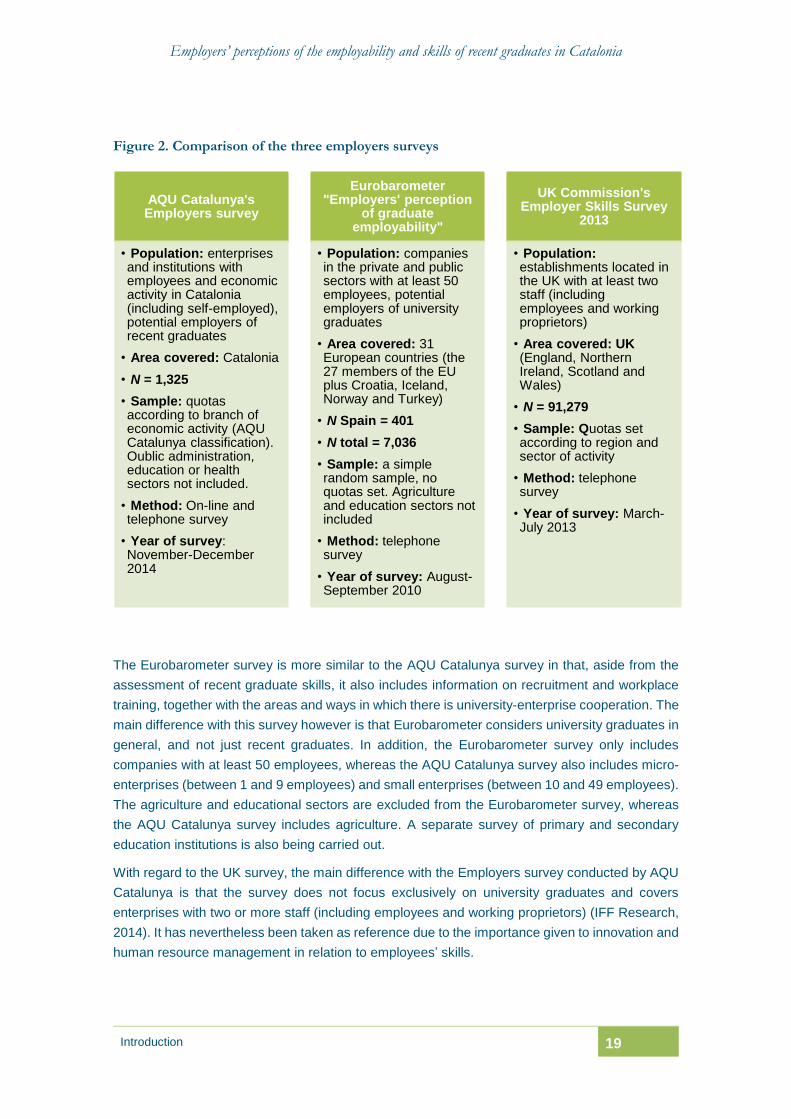
Figure 2. Comparison of the three employers surveys
The Eurobarometer survey is more similar to the AQU Catalunya survey in that, aside from the
assessment of recent graduate skills, it also includes information on recruitment and workplace
training, together with the areas and ways in which there is university-enterprise cooperation. The
main difference with this survey however is that Eurobarometer considers university graduates in
general, and not just recent graduates. In addition, the Eurobarometer survey only includes
companies with at least 50 employees, whereas the AQU Catalunya survey also includes micro-
enterprises (between 1 and 9 employees) and small enterprises (between 10 and 49 employees).
The agriculture and educational sectors are excluded from the Eurobarometer survey, whereas
the AQU Catalunya survey includes agriculture. A separate survey of primary and secondary
education institutions is also being carried out.
With regard to the UK survey, the main difference with the Employers survey conducted by AQU
Catalunya is that the survey does not focus exclusively on university graduates and covers
enterprises with two or more staff (including employees and working proprietors) (IFF Research,
2014). It has nevertheless been taken as reference due to the importance given to innovation and
human resource management in relation to employees’ skills.
AQU Catalunya's Employers survey
• Population: enterprises and institutions with employees and economic activity in Catalonia (including self-employed), potential employers of recent graduates
• Area covered: Catalonia
• N = 1,325
• Sample: quotas according to branch of economic activity (AQU Catalunya classification). Oublic administration, education or health sectors not included.
• Method: On-line and telephone survey
• Year of survey: November-December 2014
Eurobarometer "Employers' perception
of graduate employability"
• Population: companies in the private and public sectors with at least 50 employees, potential employers of university graduates
• Area covered: 31 European countries (the 27 members of the EU plus Croatia, Iceland, Norway and Turkey)
• N Spain = 401
• N total = 7,036
• Sample: a simple random sample, no quotas set. Agriculture and education sectors not included
• Method: telephone survey
• Year of survey: August-September 2010
UK Commission's Employer Skills Survey
2013
• Population: establishments located in the UK with at least two staff (including employees and working proprietors)
• Area covered: UK(England, Northern Ireland, Scotland and Wales)
• N = 91,279
• Sample: Quotas set according to region and sector of activity
• Method: telephone survey
• Year of survey: March-July 2013
Employers’ perceptions of the employability and skills of recent graduates in Catalonia
20 Introduction
Surveys of employers carried out so far in Spain have either only focused on graduates of a
particular university (Freire Seoane, 2007; García García, 2007; Observatori Ocupacional
Universitat Jaume I, 2005; Observatorio del Mercado de Trabajo, 2008; UPC, 2004; the
Vicerectorate's Office for Employment at the University of the Basque Country/UPV, 2004) or they
have only covered a small number of enterprises (ANECA, 2004). The AQU Catalunya survey is
the first of its kind in Spain to provide the university system with information on graduate skills
from the point of view of both graduates and employers.
The abundance of information and diversity made available by these main stakeholders
(graduates and employers) provides an accurate picture of graduate employability. It also
provides both the universities and society an evidence-based approach to better advise recent
graduates and make improvements to curricula in higher education, in a similar way to other
countries where leading developments in this field are taking place (ACNielsen Research
Services, 2000; M Mourshed, Farrell, & Barton, 2012).
Other surveys dealing with similar issues associated with the education-jobs skills match (the
level of education of graduates and the requirements of the labour market) were also taken into
account in the design and drawing up of this report. They were not used as main references
however due either to the differences in methodology, because they do not focus exclusively on
higher education graduates and/or because they do not include specific data on Spain and/or
Catalonia (CEDEFOP, 2013; European Commission/EACEA/Eurydice, 2014; Emerging, 2013;
Mourshed et al., 2013).
Employers’ perceptions of the employability and skills of recent graduates in Catalonia
Population and sample 21
2. POPULATION AND SAMPLE
The AQU Catalunya Employers survey is based on interview responses from 1,325
enterprises with a production activity in Catalonia. The interviews were conducted on-
line and by telephone.
66% of the enterprises in the sample were listed with the universities’ careers and
information services and as such can be considered to be good informants of
graduate skills.
The purpose of the sample was more to provide information for assessing and
enhancing recent graduate employability, and not the representativeness of the
enterprises employing graduates in Catalonia. In this regard, medium and large-sized
enterprises tend to be over-represented compared to the overall group of enterprises
in Catalonia as they recruit a higher volume of university graduates.
Unlike the AQU Catalunya surveys on graduate employment outcomes, one of the main
difficulties in conducting the Employers survey was to obtain a listing of enterprises, given that
there was no register of organisations operating in Catalonia that employ higher education
graduates.
Producing the listing of enterprises that employ recent graduates would have been impossible
without the cooperation of the universities’ careers and information services. Given that the
purpose of the survey was to obtain employers’ perceptions of recent graduate employability,
contact was made with enterprises that the universities were familiar with through their careers
and information services. Contact was also made with medium and large-size enterprises, due to
their higher capacity to recruit recent graduates (see annex 4 for more information).
Despite these efforts, neither the population nor the sample obtained can be considered to be
representative of all organisations employing recent graduates in Catalonia. The survey results
are therefore not inferable to all enterprises employing graduates in Catalonia, nor to all
enterprises operating in Catalonia.
The register of enterprises that was finally obtained consists of 16,757 entries of enterprises
contactable by either e.mail (11,570 enterprises) or telephone (13,779). 8,592 enterprises could
be contacted by both means.

Employers’ perceptions of the employability and skills of recent graduates in Catalonia
22 Population and sample
Administration of the questionnaires consisted of two stages:
Stage 1: the questionnaire was administered on-line, following initial contact in the form
of a letter signed by the Catalan Ministers for the Economy and Knowledge, on the one
hand, and Business and Labour, on the other, in which the project was explained. 534
useful responses were obtained from this stage.
Stage 2: the questionnaire was administered over the telephone. Enterprises listed as
having a telephone were contacted, together with those that had already been sent an
e.mail, but had failed to respond to the survey. From this stage 791 useful responses
were obtained.
The result was a sample of 1,325 enterprises that responded to the questionnaire, with an overall
response rate of 7.91% and a sample error of 0.0264. These can be considered to be within the
parameters of quality.
Table 1. Population and sample characteristics
Population Sample Response rate Sample error
On-line 11,570 534 4.62% 0.0423
Telephone 13,779 791 5.74% 0.0345
Total 16,757 1,325 7.91% 0.0264
NB: The population total does not correspond with the total of the on-line and telephone population, as contact was made with 8,592 entries by both e.mail and telephone.
Tables 2 and 3 show the comparison between the enterprises in both the population and sample.
Table 2 gives the distribution according to the number of employees and table 3 the distribution
according to branch of economic activity (AQU Catalunya classification; see annex 5 for more
information).
As regards the size of enterprise, micro-enterprises and SMEs (small and medium-size
enterprises) were more highly represented among enterprises in the sample as to the total
population. The number of employees was unknown in 19% of the organisations in the population.
Employers’ perceptions of the employability and skills of recent graduates in Catalonia
Population and sample 23
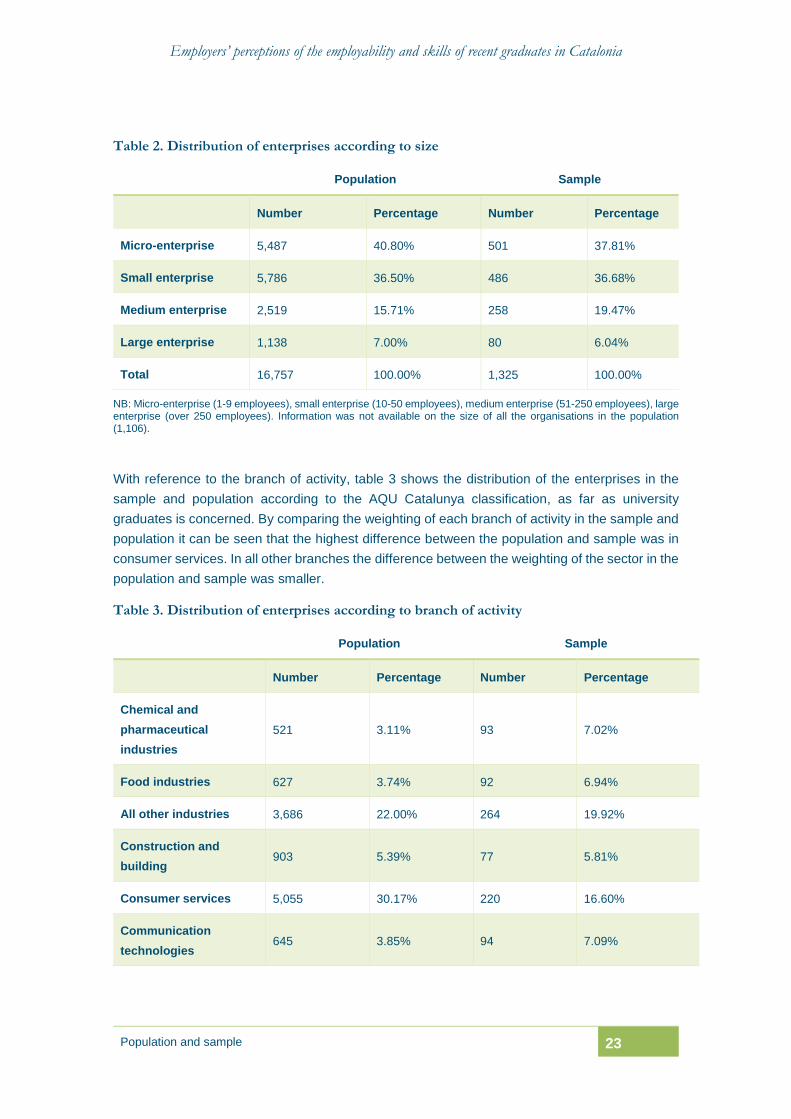
Table 2. Distribution of enterprises according to size
Population Sample
Number Percentage Number Percentage
Micro-enterprise 5,487 40.80% 501 37.81%
Small enterprise 5,786 36.50% 486 36.68%
Medium enterprise 2,519 15.71% 258 19.47%
Large enterprise 1,138 7.00% 80 6.04%
Total 16,757 100.00% 1,325 100.00%
NB: Micro-enterprise (1-9 employees), small enterprise (10-50 employees), medium enterprise (51-250 employees), large enterprise (over 250 employees). Information was not available on the size of all the organisations in the population (1,106).
With reference to the branch of activity, table 3 shows the distribution of the enterprises in the
sample and population according to the AQU Catalunya classification, as far as university
graduates is concerned. By comparing the weighting of each branch of activity in the sample and
population it can be seen that the highest difference between the population and sample was in
consumer services. In all other branches the difference between the weighting of the sector in the
population and sample was smaller.
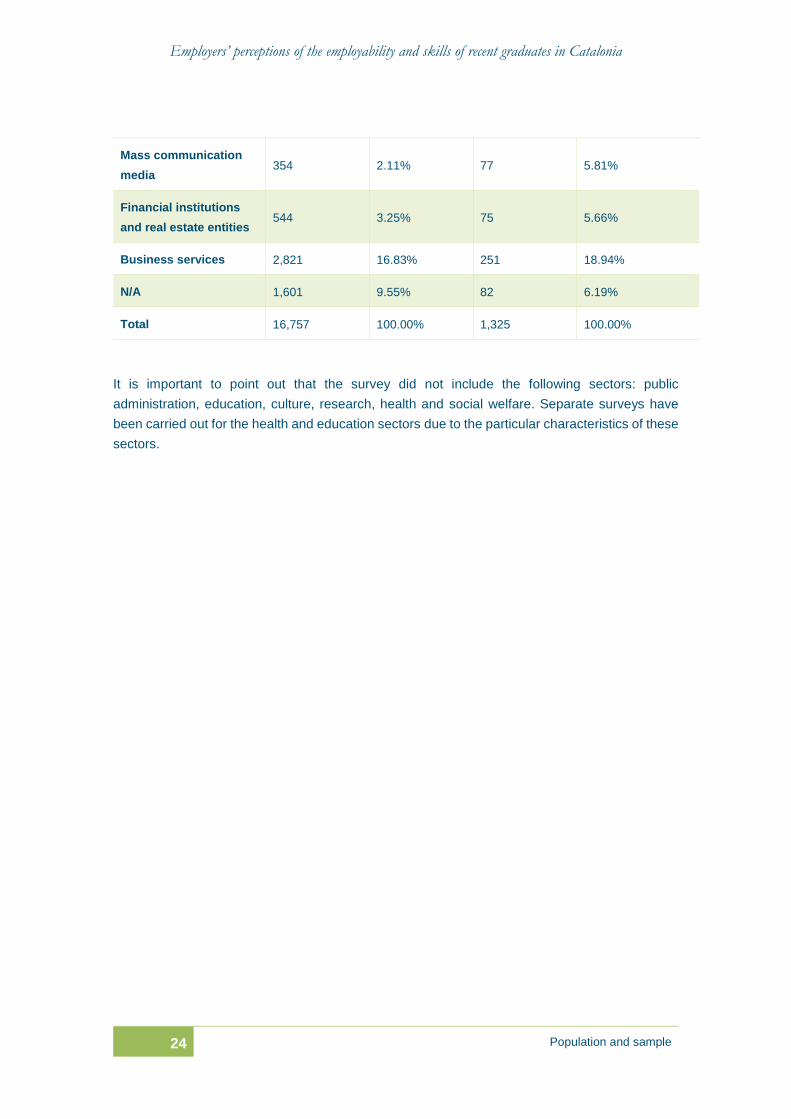
Table 3. Distribution of enterprises according to branch of activity
Population Sample
Number Percentage Number Percentage
Chemical and
pharmaceutical
industries
521 3.11% 93 7.02%
Food industries 627 3.74% 92 6.94%
All other industries 3,686 22.00% 264 19.92%
Construction and
building 903 5.39% 77 5.81%
Consumer services 5,055 30.17% 220 16.60%
Communication
technologies 645 3.85% 94 7.09%
Employers’ perceptions of the employability and skills of recent graduates in Catalonia
24 Population and sample
Mass communication
media 354 2.11% 77 5.81%
Financial institutions
and real estate entities 544 3.25% 75 5.66%
Business services 2,821 16.83% 251 18.94%
N/A 1,601 9.55% 82 6.19%
Total 16,757 100.00% 1,325 100.00%
It is important to point out that the survey did not include the following sectors: public
administration, education, culture, research, health and social welfare. Separate surveys have
been carried out for the health and education sectors due to the particular characteristics of these
sectors.
Employers’ perceptions of the employability and skills of recent graduates in Catalonia
Characteristics of employers in the sample 25
3. CHARACTERISTICS OF EMPLOYERS IN THE SAMPLE
In 47% of all enterprises in the sample, more than half of their employees were
graduates.
The sales of medium and large-sized enterprises were aimed more at the Spanish and
international markets whereas the sales of micro and small enterprises were
concentrated in the local area and Catalan markets.
Organisations with a higher number of employees also tend to be more innovative and
flexible HRM.
35% of the informants were the directors of the enterprise, 28% are the human
resources department head, and the rest held other positions within their
organisation.
3.1. Characteristics of the organisations in the sample
The results of the survey offer an initial picture of various distinctive features of the enterprises in
the sample. The main characteristic that stands out is the size of enterprise according to the
number of employees.
The characteristics of the enterprises participating in the survey in relation to their size and four
other factors are given below:
1. Percentage of graduate employees
2. Sales market
3. Level of innovation
4. Level of flexibility in human resource management (HRM)
As regards the proportion of graduate employees in the organisation, in 47% of the enterprises in
the survey over half of their employees were graduates. Nevertheless, the distribution of
organisations according to the percentage of graduate employees was polarised at the extremes:
in 31% of enterprises less than 20% of their staff were graduate employees, whereas in 28% over
80% of their staff were graduate employees.

Employers’ perceptions of the employability and skills of recent graduates in Catalonia
26 Characteristics of employers in the sample
This polarisation in the distribution according to the degree studies of an organisation’s employees
varied according to the size of enterprise. As can be seen from graph 1, around 50% of small and
medium-size enterprises had less than 30% graduate employees, whereas micro-enterprises and
large enterprises stand out as being more representative of organisations where more than 60%
of their staff were graduate employees.
These data point to two types of organisations that can potentially recruit recent graduates:
Enterprises with less than 10 employees (micro-enterprises), that specialise in a
specific field with a high value-added activity. Examples include specialist consultants,
law firms, architecture firms and enterprises specialising in communication.
Enterprises with over 250 employees (large enterprises), which can give recent
graduates their first job opportunity on entering the labour market, as well as offering
them the possibilities of in-company promotion. Examples include the chemical,
pharmaceutical and food industries.
Graph 1. Distribution of enterprises according to size and the proportion of graduate employees
As regards the distribution of enterprises according to their sales market, differences are clearly
evident according to the size of organisation. As can be seen from graph 2, the majority of the
sales of micro-enterprises were in the local area and regional market in Catalonia, whereas those
of large enterprises were aimed more at the international and Spanish markets.
Although these results are not surprising, the differences in the type of market that an organisation
is aimed at are a factor to be taken into account when comparing employers’ views concerning
24%
53% 50%
38%
19%
20% 22%
23%
57%
27% 28%
40%
0%
20%
40%
60%
80%
100%
Micro-enterprise Small enterprise Medium enterprise Large enterprise
0-30% 31-60% 61-100%
Employers’ perceptions of the employability and skills of recent graduates in Catalonia
Characteristics of employers in the sample 27
the importance of graduate skills and their actual satisfaction with their employees’ skills and
abilities, as market orientation gives rise to different requirements, such as foreign language skills.
Graph 2. Enterprises in the sample according to the product market and size
As regards the innovation level of enterprises in the sample, the trend shown in graph 3 is that
the larger the size of the organisation, a higher rating on the innovation index. Types of innovation
considered in the index included the introduction of products and services that are totally new to
the enterprise and market, important changes in process technology, changes in management
methods and new ways of associating with other organisations. One should bear this in mind
throughout the report as it presupposes that more innovative organisations may also have a
greater need for employees with higher level qualifications and skills, for example university
graduates (Winterbotham et al., 2014).
28%
16% 14%4%
37%
33%26%
18%
19%
28%
27%
34%
16%23%
34%45%
0%
20%
40%
60%
80%
100%
Micro-enterprise Small enterprise Medium enterprise Large enterprise
Local area market Catalan market Spanish market International market
Employers’ perceptions of the employability and skills of recent graduates in Catalonia
28 Characteristics of employers in the sample
Graph 3. Enterprises in the sample according to innovation level and size
NB: The index shows the number of innovative production activities carried out during the last three years. 1 indicates no innovative production and 5 indicates five innovative production activities (see question 23 in the survey in annex 2).
Similar to what we have just seen with the innovation index, graph 4 shows a trend where the
higher the number of employees in the organisation, the higher the rating on the HRM index. It
can therefore be surmised that it is the larger organisations in the sample that apply greater
flexibility (they relax the rules more) in human resource management. A higher score on the index
indicates a higher number of flexible practices in HRM with regard to the sharing of information,
work methods, systems of payment and remuneration and decision-making, in line with the
findings of other international reports (Winterbotham et al., 2014).
8% 9% 7% 8%
14% 12%8% 8%
17% 17%
15% 8%
21% 23%
18%20%
23% 21%
29%27%
17% 19% 24%29%
0%
20%
40%
60%
80%
100%
Micro-enterprise Small enterprise Medium enterprise Large enterprise
0 1 2 3 4 5
Employers’ perceptions of the employability and skills of recent graduates in Catalonia
Characteristics of employers in the sample 29
Graph 4. Enterprises in the sample according to human resource management and size
NB: The index indicates the number of HRM practices considered to be flexible and which promote graduate recruitment. 1 indicates the absence of any of these management practices in the organisation and 4 indicates practice of the four types of HRM (see question 24 in the survey in annex 2).
3.2. Sample informants
Aside from the characteristics of the organisations covered by the survey, one of the main pieces
of information necessary prior to presenting and analysing the results has to do with the person
providing the information (the informant) in each organisation. Depending on who this is, their
level of familiarity with and understanding of the requirements of the enterprise may vary, along
with their degree of commitment to the organisation.
Account also needs to be taken of the level of proximity between the informant and recent
graduate recruits who are being valued. If the person providing the information has little contact
at work with graduate employees, it is unlikely they will be able to provide an assessment of the
actual situation that is as accurate as one provided by an informant who works in close contact
with recent graduates. This may vary according to the number of employees in the enterprise.
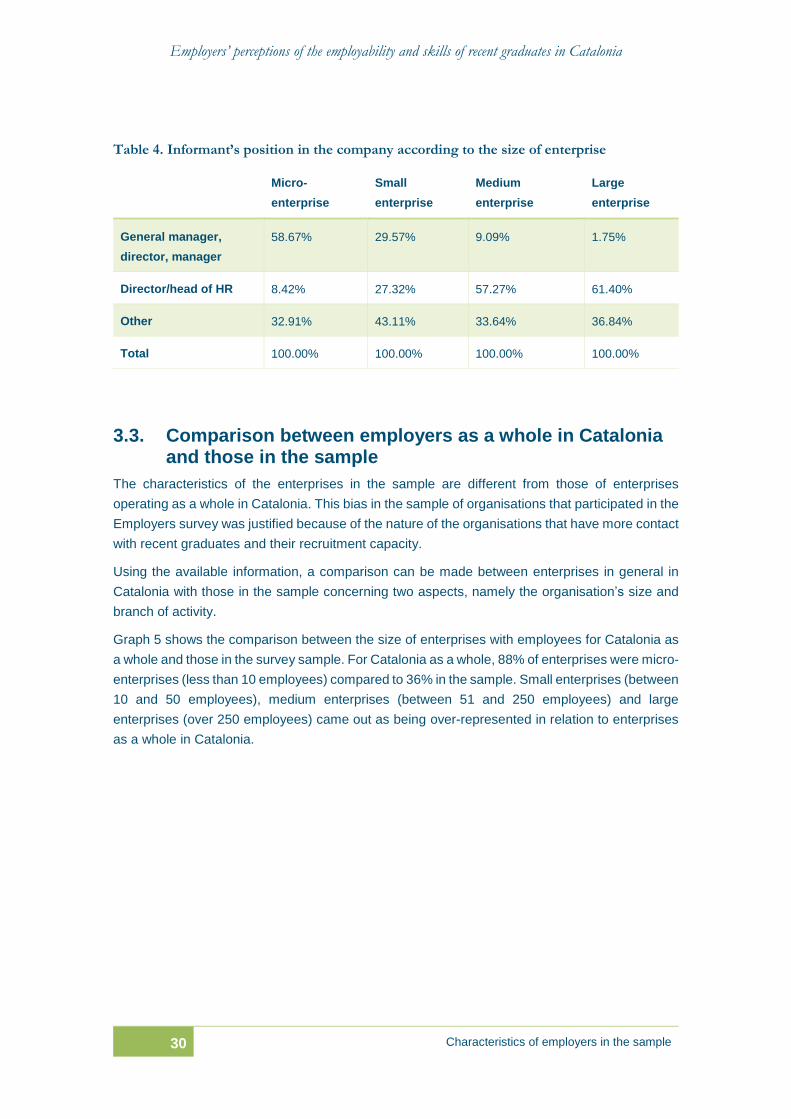
According to the survey results, 28% of the informants were either the director or head of the HR
department and 35% were either the company director or manager. The remaining informants
(37%) held other positions (management assistants, HR officers, administrative staff, supervisors,
etc.).
This distribution varied according to the number of employees in the organisation. As can be seen
from table 4, the majority of informants in micro-enterprises were the company director (59%).
This percentage decreases as the size of organisation increases: in small enterprises the majority
of informants held a different position to that of director or head of HR (43%), whereas in medium
and large-sized enterprises the majority of informants were the head of HR (57% and 61%,
respectively).
9% 13% 8%2%
20% 16%
10%
11%
22% 24%
20%
18%
30% 25%
33%
24%
19% 23%30%
45%
0%
20%
40%
60%
80%
100%
Micro-enterprise Small enterprise Medium enterprise Large enterprise
0 1 2 3 4
Employers’ perceptions of the employability and skills of recent graduates in Catalonia
30 Characteristics of employers in the sample
Table 4. Informant’s position in the company according to the size of enterprise
Micro-
enterprise
Small
enterprise
Medium
enterprise
Large
enterprise
General manager,
director, manager
58.67% 29.57% 9.09% 1.75%
Director/head of HR 8.42% 27.32% 57.27% 61.40%
Other 32.91% 43.11% 33.64% 36.84%
Total 100.00% 100.00% 100.00% 100.00%
3.3. Comparison between employers as a whole in Catalonia and those in the sample
The characteristics of the enterprises in the sample are different from those of enterprises
operating as a whole in Catalonia. This bias in the sample of organisations that participated in the
Employers survey was justified because of the nature of the organisations that have more contact
with recent graduates and their recruitment capacity.
Using the available information, a comparison can be made between enterprises in general in
Catalonia with those in the sample concerning two aspects, namely the organisation’s size and
branch of activity.
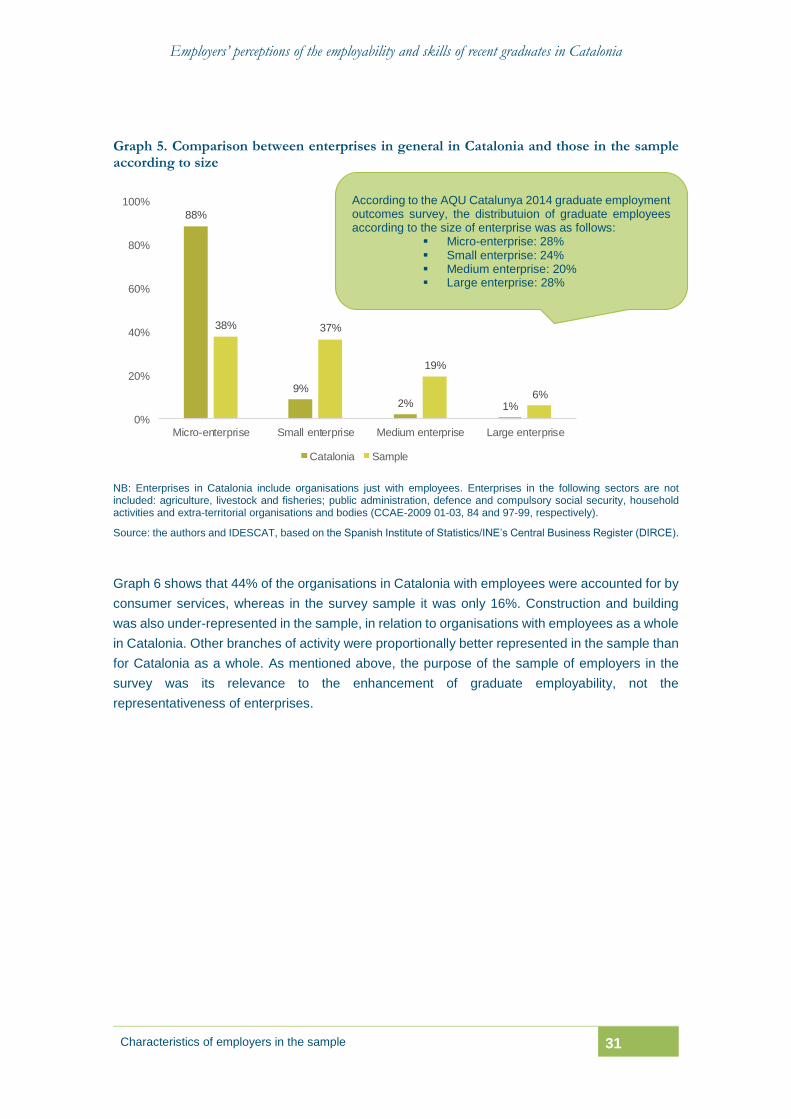
Graph 5 shows the comparison between the size of enterprises with employees for Catalonia as
a whole and those in the survey sample. For Catalonia as a whole, 88% of enterprises were micro-
enterprises (less than 10 employees) compared to 36% in the sample. Small enterprises (between
10 and 50 employees), medium enterprises (between 51 and 250 employees) and large
enterprises (over 250 employees) came out as being over-represented in relation to enterprises
as a whole in Catalonia.
Employers’ perceptions of the employability and skills of recent graduates in Catalonia
Characteristics of employers in the sample 31
Graph 5. Comparison between enterprises in general in Catalonia and those in the sample according to size
NB: Enterprises in Catalonia include organisations just with employees. Enterprises in the following sectors are not included: agriculture, livestock and fisheries; public administration, defence and compulsory social security, household activities and extra-territorial organisations and bodies (CCAE-2009 01-03, 84 and 97-99, respectively).
Source: the authors and IDESCAT, based on the Spanish Institute of Statistics/INE’s Central Business Register (DIRCE).
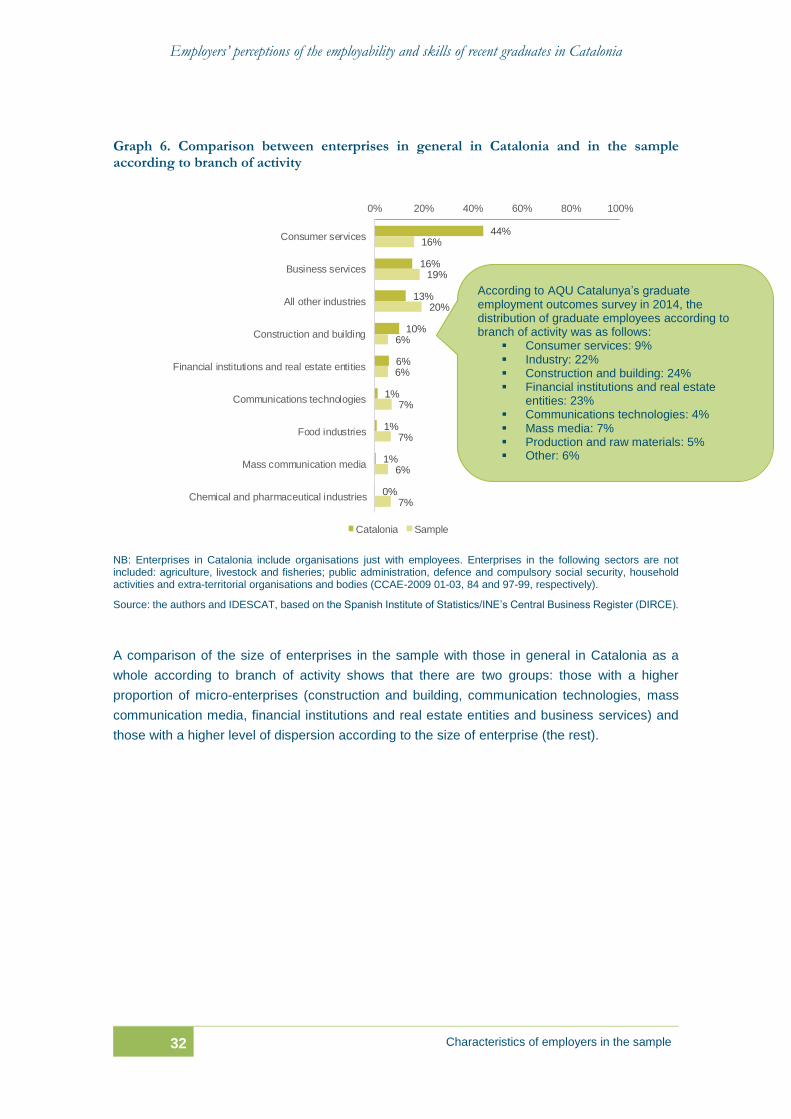
Graph 6 shows that 44% of the organisations in Catalonia with employees were accounted for by
consumer services, whereas in the survey sample it was only 16%. Construction and building
was also under-represented in the sample, in relation to organisations with employees as a whole
in Catalonia. Other branches of activity were proportionally better represented in the sample than
for Catalonia as a whole. As mentioned above, the purpose of the sample of employers in the
survey was its relevance to the enhancement of graduate employability, not the
representativeness of enterprises.
88%
9%
2% 1%
38% 37%
19%
6%
0%
20%
40%
60%
80%
100%
Micro-enterprise Small enterprise Medium enterprise Large enterprise
Catalonia Sample
According to the AQU Catalunya 2014 graduate employment outcomes survey, the distributuion of graduate employees according to the size of enterprise was as follows:
Micro-enterprise: 28% Small enterprise: 24% Medium enterprise: 20% Large enterprise: 28%
Employers’ perceptions of the employability and skills of recent graduates in Catalonia
32 Characteristics of employers in the sample
Graph 6. Comparison between enterprises in general in Catalonia and in the sample according to branch of activity
NB: Enterprises in Catalonia include organisations just with employees. Enterprises in the following sectors are not included: agriculture, livestock and fisheries; public administration, defence and compulsory social security, household activities and extra-territorial organisations and bodies (CCAE-2009 01-03, 84 and 97-99, respectively).
Source: the authors and IDESCAT, based on the Spanish Institute of Statistics/INE’s Central Business Register (DIRCE).
A comparison of the size of enterprises in the sample with those in general in Catalonia as a
whole according to branch of activity shows that there are two groups: those with a higher
proportion of micro-enterprises (construction and building, communication technologies, mass
communication media, financial institutions and real estate entities and business services) and
those with a higher level of dispersion according to the size of enterprise (the rest).
44%
16%
13%
10%
6%
1%
1%
1%
0%
16%
19%
20%
6%
6%
7%
7%
6%
7%
0% 20% 40% 60% 80% 100%
Consumer services
Business services
All other industries
Construction and building
Financial institutions and real estate entities
Communications technologies
Food industries
Mass communication media
Chemical and pharmaceutical industries
Catalonia Sample
According to AQU Catalunya’s graduate employment outcomes survey in 2014, the distribution of graduate employees according to branch of activity was as follows:
Consumer services: 9% Industry: 22% Construction and building: 24% Financial institutions and real estate
entities: 23% Communications technologies: 4% Mass media: 7% Production and raw materials: 5% Other: 6%
Employers’ perceptions of the employability and skills of recent graduates in Catalonia
Characteristics of employers in the sample 33
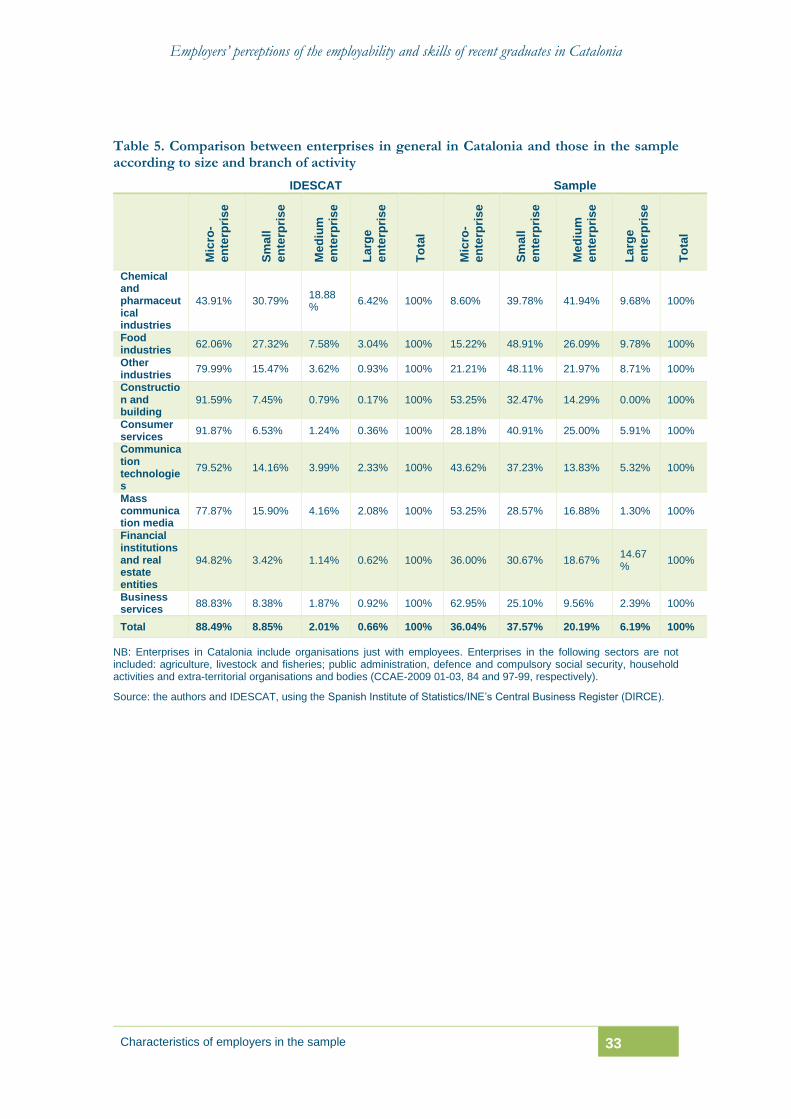
Table 5. Comparison between enterprises in general in Catalonia and those in the sample according to size and branch of activity
IDESCAT Sample
Mic
ro-
en
terp
ris
e
Sm
all
en
terp
ris
e
Me
diu
m
en
terp
ris
e
La
rge
en
terp
ris
e
To
tal
Mic
ro-
en
terp
ris
e
Sm
all
en
terp
ris
e
Me
diu
m
en
terp
ris
e
La
rge
en
terp
ris
e
To
tal
Chemical and pharmaceutical industries
43.91% 30.79% 18.88%
6.42% 100% 8.60% 39.78% 41.94% 9.68% 100%
Food industries
62.06% 27.32% 7.58% 3.04% 100% 15.22% 48.91% 26.09% 9.78% 100%
Other industries
79.99% 15.47% 3.62% 0.93% 100% 21.21% 48.11% 21.97% 8.71% 100%
Construction and building
91.59% 7.45% 0.79% 0.17% 100% 53.25% 32.47% 14.29% 0.00% 100%
Consumer services
91.87% 6.53% 1.24% 0.36% 100% 28.18% 40.91% 25.00% 5.91% 100%
Communication technologies
79.52% 14.16% 3.99% 2.33% 100% 43.62% 37.23% 13.83% 5.32% 100%
Mass communication media
77.87% 15.90% 4.16% 2.08% 100% 53.25% 28.57% 16.88% 1.30% 100%
Financial institutions and real estate entities
94.82% 3.42% 1.14% 0.62% 100% 36.00% 30.67% 18.67% 14.67%
100%
Business services
88.83% 8.38% 1.87% 0.92% 100% 62.95% 25.10% 9.56% 2.39% 100%
Total 88.49% 8.85% 2.01% 0.66% 100% 36.04% 37.57% 20.19% 6.19% 100%
NB: Enterprises in Catalonia include organisations just with employees. Enterprises in the following sectors are not included: agriculture, livestock and fisheries; public administration, defence and compulsory social security, household activities and extra-territorial organisations and bodies (CCAE-2009 01-03, 84 and 97-99, respectively).
Source: the authors and IDESCAT, using the Spanish Institute of Statistics/INE’s Central Business Register (DIRCE).

Employers’ perceptions of the employability and skills of recent graduates in Catalonia
Recent graduate recruitment 35
4. RECENT GRADUATE RECRUITMENT
59% of the enterprises in the sample had recruited recent graduates in the last five
years.
The main degree subjects of graduate recruits were Economics, Business
Management and Administration, and Business Sciences (34%); Production
Engineering (31%); and Information and Communications Technologies (28%).
Organisations that recruited a higher volume of graduates were large enterprises, 60%
of their employees had a university degree and they were innovative in terms of their
products, services and processes.
91% of employers in the sample considered a Bachelor’s degree (or its equivalent) to
be an important factor in recruitment, whereas a Master’s (34%) or doctorate degree
(8%) was considered to be less important by most organisations.
Having studied abroad, work placement and having either studied and/or worked
abroad were the recruitment factors most highly rated by employers in the sample.
42% of the organisations in the sample had experienced difficulties with recruitment,
the main reasons being a shortage of applicants with the right skills (60%); a shortage
of graduates in a given field (30%); and a shortage of applicants willing to accept the
salary offered (20%).
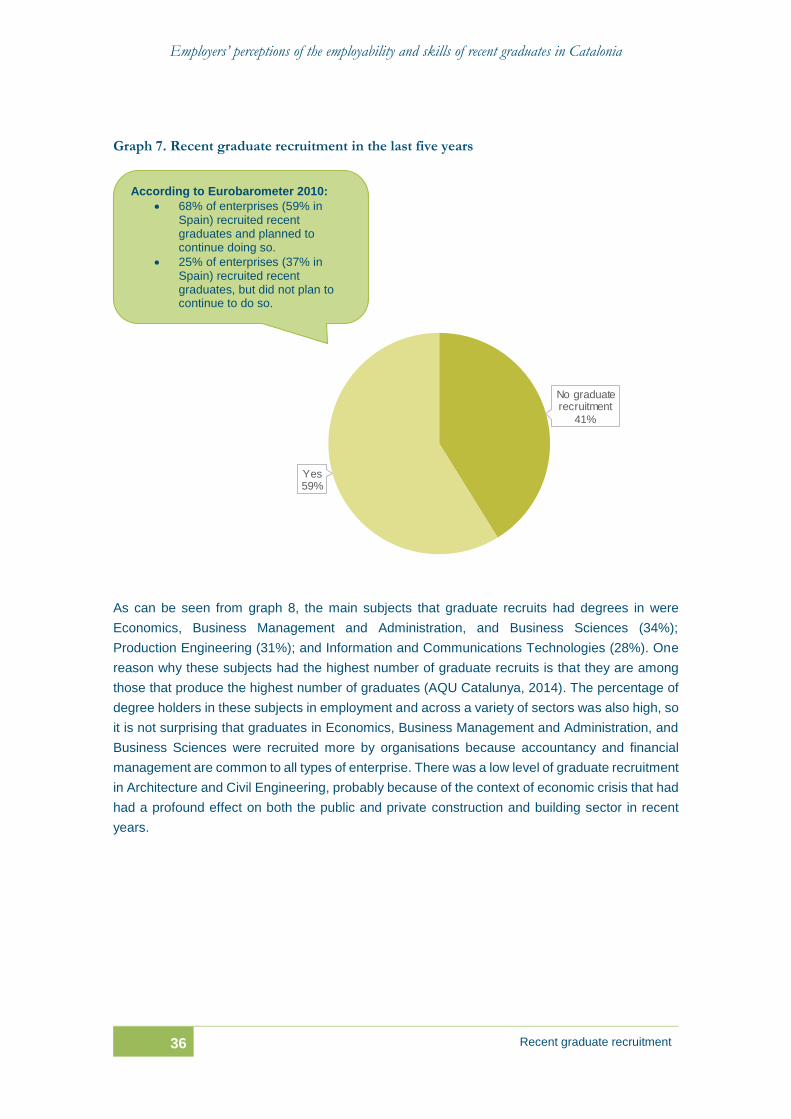
4.1. Recent graduate recruitment
59% of the enterprises in the survey had recruited recent graduates in the last five years. Given
that the survey covered employers that had some kind of contact with universities in Catalonia
and medium and large-sized enterprises, a higher percentage was to be expected. One should
however bear in mind the economic context in recent years, which led to a drop in the volume of
recruitment and made it more difficult for university graduates to find employment.
Employers’ perceptions of the employability and skills of recent graduates in Catalonia
36 Recent graduate recruitment
Graph 7. Recent graduate recruitment in the last five years
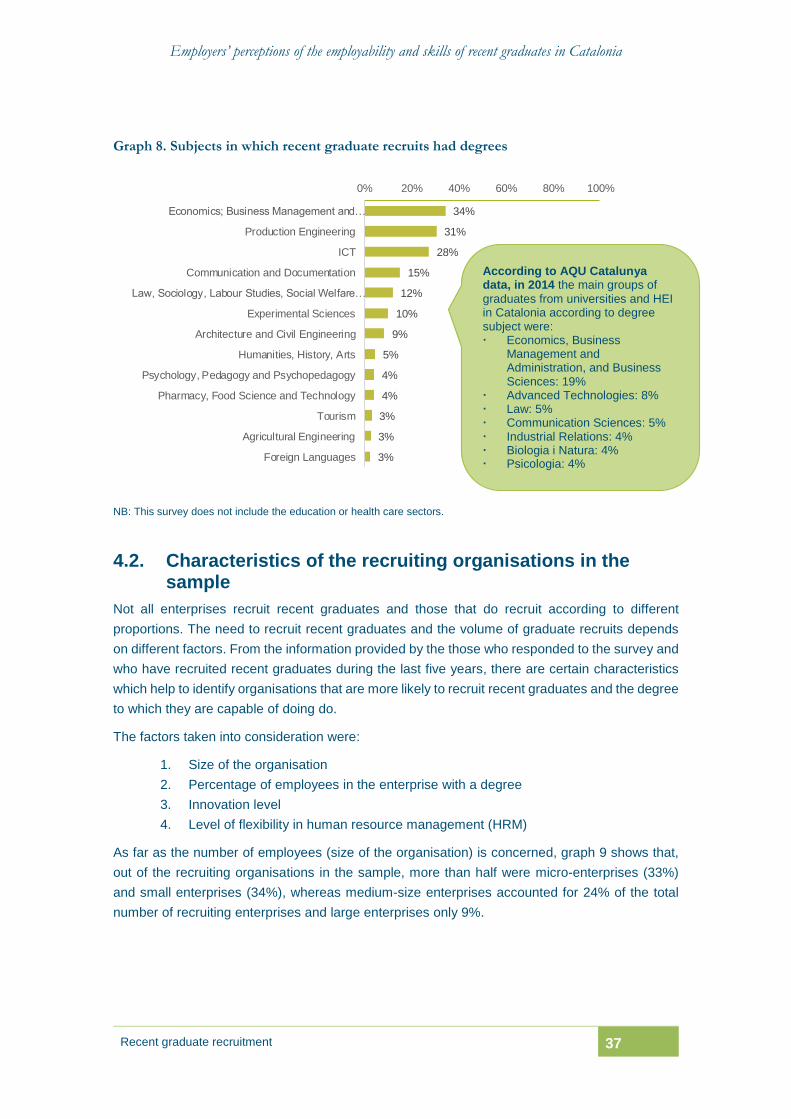
As can be seen from graph 8, the main subjects that graduate recruits had degrees in were
Economics, Business Management and Administration, and Business Sciences (34%);
Production Engineering (31%); and Information and Communications Technologies (28%). One
reason why these subjects had the highest number of graduate recruits is that they are among
those that produce the highest number of graduates (AQU Catalunya, 2014). The percentage of
degree holders in these subjects in employment and across a variety of sectors was also high, so
it is not surprising that graduates in Economics, Business Management and Administration, and
Business Sciences were recruited more by organisations because accountancy and financial
management are common to all types of enterprise. There was a low level of graduate recruitment
in Architecture and Civil Engineering, probably because of the context of economic crisis that had
had a profound effect on both the public and private construction and building sector in recent
years.
No graduate recruitment
41%
Yes59%
According to Eurobarometer 2010:
68% of enterprises (59% in Spain) recruited recent graduates and planned to continue doing so.
25% of enterprises (37% in Spain) recruited recent graduates, but did not plan to continue to do so.
Employers’ perceptions of the employability and skills of recent graduates in Catalonia
Recent graduate recruitment 37
Graph 8. Subjects in which recent graduate recruits had degrees
NB: This survey does not include the education or health care sectors.
4.2. Characteristics of the recruiting organisations in the sample
Not all enterprises recruit recent graduates and those that do recruit according to different
proportions. The need to recruit recent graduates and the volume of graduate recruits depends
on different factors. From the information provided by the those who responded to the survey and
who have recruited recent graduates during the last five years, there are certain characteristics
which help to identify organisations that are more likely to recruit recent graduates and the degree
to which they are capable of doing do.
The factors taken into consideration were:
1. Size of the organisation
2. Percentage of employees in the enterprise with a degree
3. Innovation level
4. Level of flexibility in human resource management (HRM)
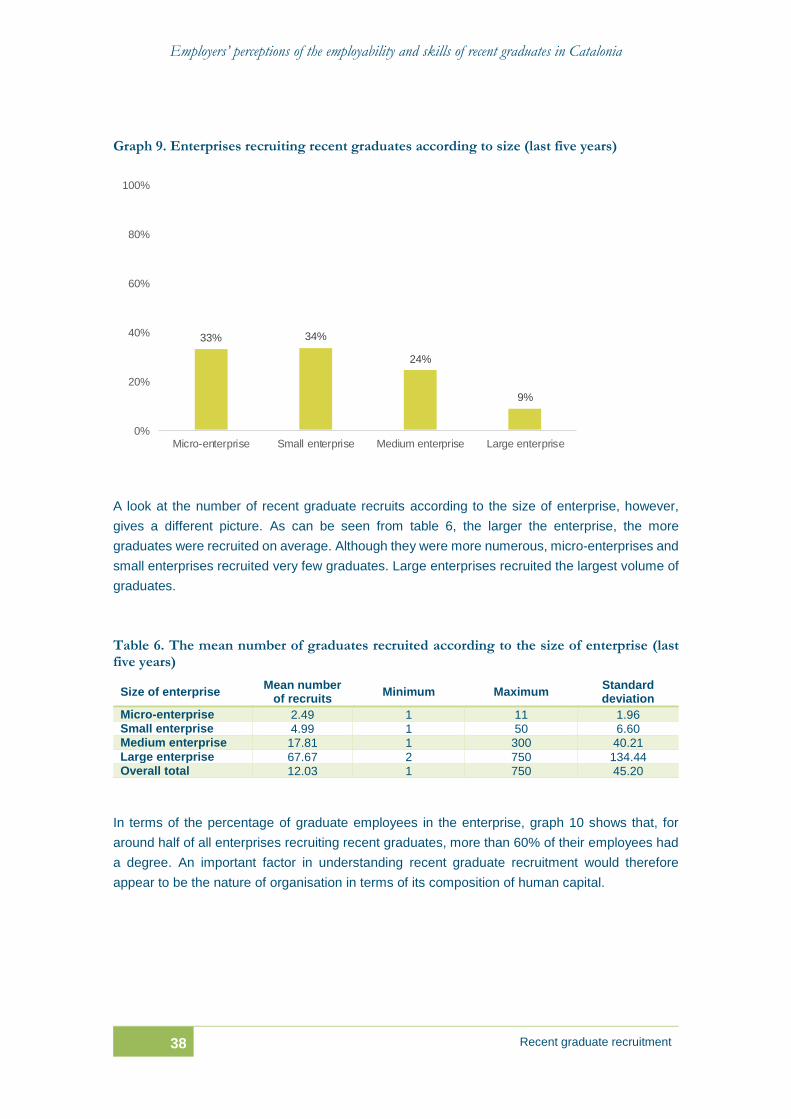
As far as the number of employees (size of the organisation) is concerned, graph 9 shows that,
out of the recruiting organisations in the sample, more than half were micro-enterprises (33%)
and small enterprises (34%), whereas medium-size enterprises accounted for 24% of the total
number of recruiting enterprises and large enterprises only 9%.
34%
31%
28%
15%
12%
10%
9%
5%
4%
4%
3%
3%
3%
0% 20% 40% 60% 80% 100%
Economics; Business Management and…
Production Engineering
ICT
Communication and Documentation
Law, Sociology, Labour Studies, Social Welfare…
Experimental Sciences
Architecture and Civil Engineering
Humanities, History, Arts
Psychology, Pedagogy and Psychopedagogy
Pharmacy, Food Science and Technology
Tourism
Agricultural Engineering
Foreign Languages
According to AQU Catalunya data, in 2014 the main groups of
graduates from universities and HEI in Catalonia according to degree subject were: Economics, Business
Management and Administration, and Business Sciences: 19%
Advanced Technologies: 8% Law: 5% Communication Sciences: 5% Industrial Relations: 4% Biologia i Natura: 4% Psicologia: 4%
Employers’ perceptions of the employability and skills of recent graduates in Catalonia
38 Recent graduate recruitment
Graph 9. Enterprises recruiting recent graduates according to size (last five years)
A look at the number of recent graduate recruits according to the size of enterprise, however,
gives a different picture. As can be seen from table 6, the larger the enterprise, the more
graduates were recruited on average. Although they were more numerous, micro-enterprises and
small enterprises recruited very few graduates. Large enterprises recruited the largest volume of
graduates.
Table 6. The mean number of graduates recruited according to the size of enterprise (last five years)
Size of enterprise Mean number
of recruits Minimum Maximum
Standard deviation
Micro-enterprise 2.49 1 11 1.96 Small enterprise 4.99 1 50 6.60 Medium enterprise 17.81 1 300 40.21 Large enterprise 67.67 2 750 134.44 Overall total 12.03 1 750 45.20
In terms of the percentage of graduate employees in the enterprise, graph 10 shows that, for
around half of all enterprises recruiting recent graduates, more than 60% of their employees had
a degree. An important factor in understanding recent graduate recruitment would therefore
appear to be the nature of organisation in terms of its composition of human capital.
33% 34%
24%
9%
0%
20%
40%
60%
80%
100%
Micro-enterprise Small enterprise Medium enterprise Large enterprise

Employers’ perceptions of the employability and skills of recent graduates in Catalonia
Recent graduate recruitment 39
Graph 10. Enterprises recruiting recent graduates according to the percentage of graduates in the enterprise (last five years)
Likewise, if the emphasis is placed on the volume of graduates, it can be seen from table 7 that
the higher the percentage of employees with a degree in the enterprise, the higher the level of
graduate recruitment. Enterprises with a higher percentage of graduate employees recruited on
average 18.31 recent graduates. There was a high variation (62.74) however due to the fact that,
within the group of enterprises with a high percentage of highly qualified employees, there were
both micro-enterprises (which have a limited recruitment capacity) and large enterprises (which
have a high volume of recruitment).
Table 7. The mean number of graduates recruited according to the percentage of graduate employees in the enterprise (last five years)
Percentage of graduates in the enterprise
Mean number of recruits
Minimum Maximum Standard deviation
0-30% 5.48 1 250 17.97 31-60% 7.96 1 100 13.86 61-100% 18.31 1 750 62.74 Overall total 12.19 1 750 45.55
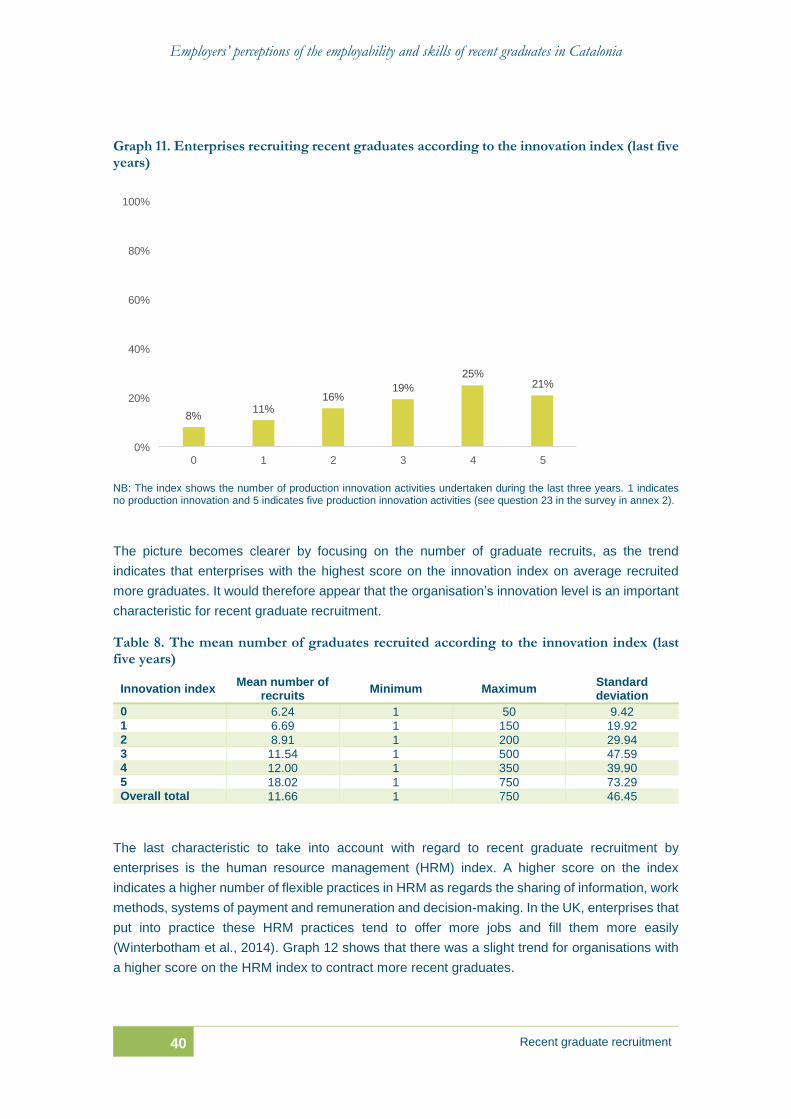
As regards the third important factor in graduate recruitment, graph 11 suggests a slight
relationship between the innovation level and recent graduate recruitment. The forms of
innovation include the introduction of products and services that are totally new to the enterprise
and market, important changes in process technology, changes in management methods and
new ways of associating with other enterprises. In the UK, it is enterprises that pursue innovation
that offer more jobs to graduates (Winterbotham et al., 2014).
31%
21%
48%
0%
20%
40%
60%
80%
100%
0-30% 31-60% 61-100%
Employers’ perceptions of the employability and skills of recent graduates in Catalonia
40 Recent graduate recruitment
Graph 11. Enterprises recruiting recent graduates according to the innovation index (last five years)
NB: The index shows the number of production innovation activities undertaken during the last three years. 1 indicates no production innovation and 5 indicates five production innovation activities (see question 23 in the survey in annex 2).
The picture becomes clearer by focusing on the number of graduate recruits, as the trend
indicates that enterprises with the highest score on the innovation index on average recruited
more graduates. It would therefore appear that the organisation’s innovation level is an important
characteristic for recent graduate recruitment.
Table 8. The mean number of graduates recruited according to the innovation index (last five years)
Innovation index Mean number of
recruits Minimum Maximum
Standard deviation
0 6.24 1 50 9.42 1 6.69 1 150 19.92 2 8.91 1 200 29.94 3 11.54 1 500 47.59 4 12.00 1 350 39.90 5 18.02 1 750 73.29 Overall total 11.66 1 750 46.45
The last characteristic to take into account with regard to recent graduate recruitment by
enterprises is the human resource management (HRM) index. A higher score on the index
indicates a higher number of flexible practices in HRM as regards the sharing of information, work
methods, systems of payment and remuneration and decision-making. In the UK, enterprises that
put into practice these HRM practices tend to offer more jobs and fill them more easily
(Winterbotham et al., 2014). Graph 12 shows that there was a slight trend for organisations with
a higher score on the HRM index to contract more recent graduates.
8%11%
16%19%
25%21%
0%
20%
40%
60%
80%
100%
0 1 2 3 4 5
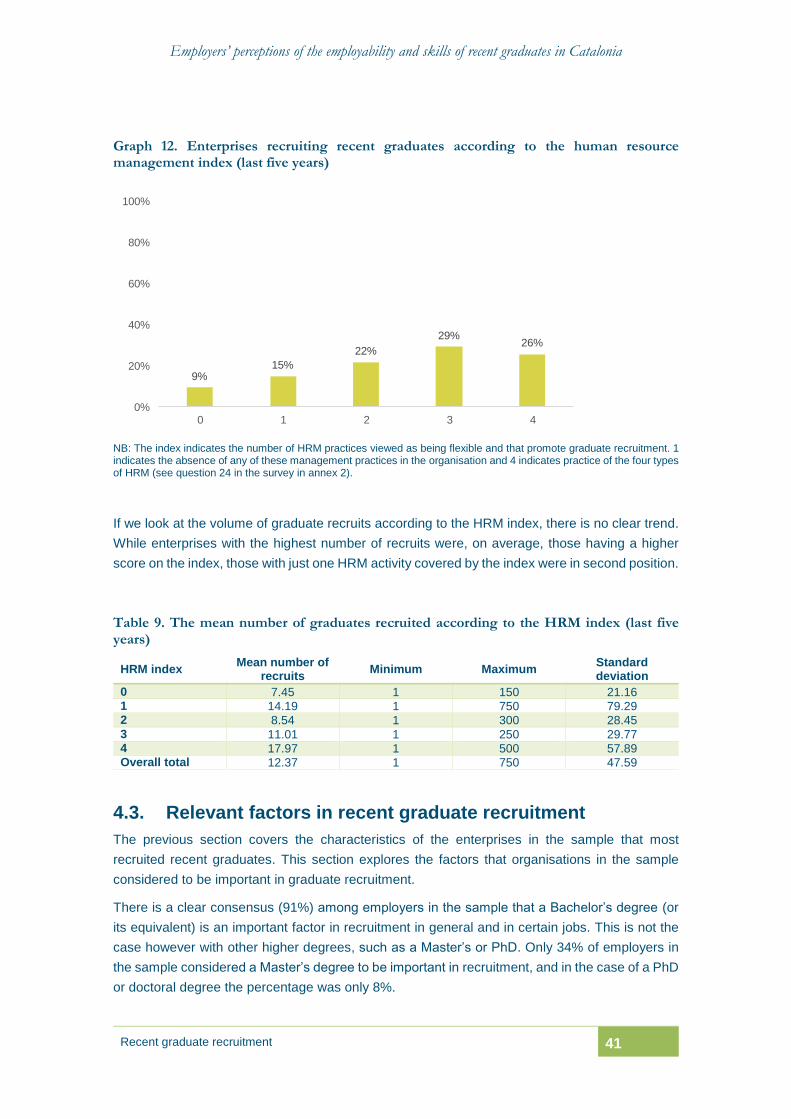
Employers’ perceptions of the employability and skills of recent graduates in Catalonia
Recent graduate recruitment 41
Graph 12. Enterprises recruiting recent graduates according to the human resource management index (last five years)
NB: The index indicates the number of HRM practices viewed as being flexible and that promote graduate recruitment. 1 indicates the absence of any of these management practices in the organisation and 4 indicates practice of the four types of HRM (see question 24 in the survey in annex 2).
If we look at the volume of graduate recruits according to the HRM index, there is no clear trend.
While enterprises with the highest number of recruits were, on average, those having a higher
score on the index, those with just one HRM activity covered by the index were in second position.
Table 9. The mean number of graduates recruited according to the HRM index (last five years)
HRM index Mean number of
recruits Minimum Maximum
Standard deviation
0 7.45 1 150 21.16 1 14.19 1 750 79.29 2 8.54 1 300 28.45 3 11.01 1 250 29.77 4 17.97 1 500 57.89 Overall total 12.37 1 750 47.59
4.3. Relevant factors in recent graduate recruitment
The previous section covers the characteristics of the enterprises in the sample that most
recruited recent graduates. This section explores the factors that organisations in the sample
considered to be important in graduate recruitment.
There is a clear consensus (91%) among employers in the sample that a Bachelor’s degree (or
its equivalent) is an important factor in recruitment in general and in certain jobs. This is not the
case however with other higher degrees, such as a Master’s or PhD. Only 34% of employers in
the sample considered a Master’s degree to be important in recruitment, and in the case of a PhD
or doctoral degree the percentage was only 8%.
9%15%
22%
29%26%
0%
20%
40%
60%
80%
100%
0 1 2 3 4
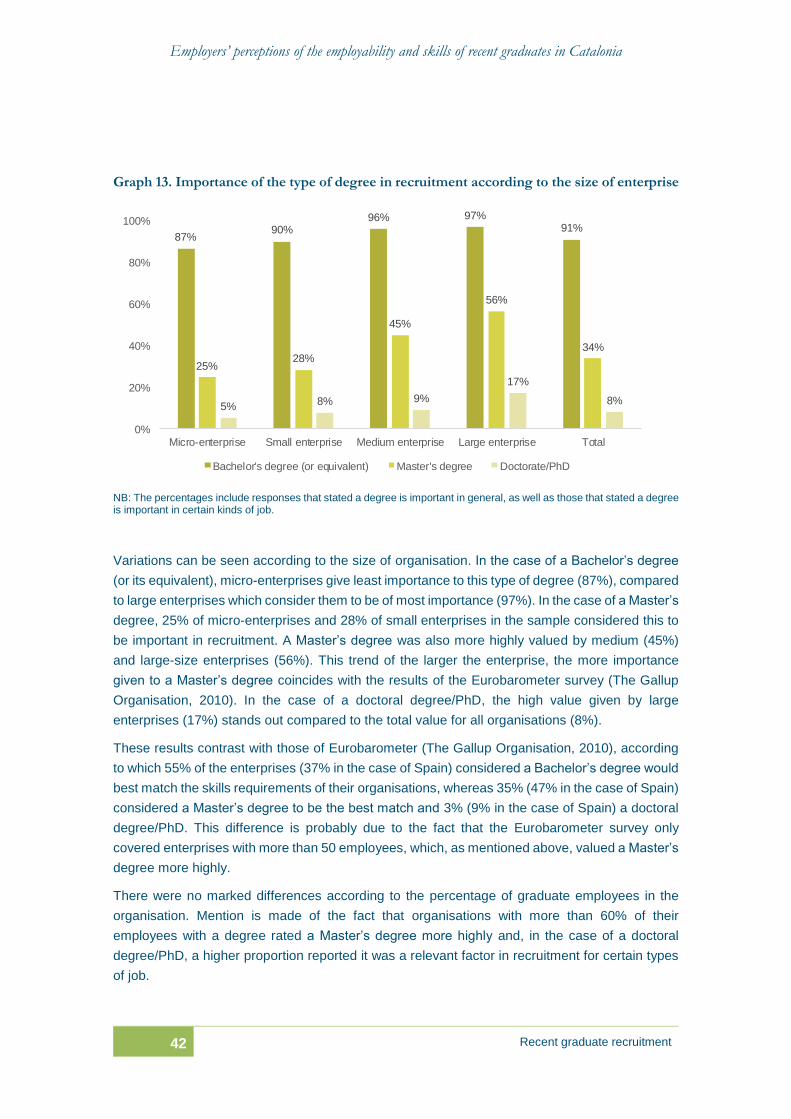
Employers’ perceptions of the employability and skills of recent graduates in Catalonia
42 Recent graduate recruitment
Graph 13. Importance of the type of degree in recruitment according to the size of enterprise
NB: The percentages include responses that stated a degree is important in general, as well as those that stated a degree is important in certain kinds of job.
Variations can be seen according to the size of organisation. In the case of a Bachelor’s degree
(or its equivalent), micro-enterprises give least importance to this type of degree (87%), compared
to large enterprises which consider them to be of most importance (97%). In the case of a Master’s
degree, 25% of micro-enterprises and 28% of small enterprises in the sample considered this to
be important in recruitment. A Master’s degree was also more highly valued by medium (45%)
and large-size enterprises (56%). This trend of the larger the enterprise, the more importance
given to a Master’s degree coincides with the results of the Eurobarometer survey (The Gallup
Organisation, 2010). In the case of a doctoral degree/PhD, the high value given by large
enterprises (17%) stands out compared to the total value for all organisations (8%).
These results contrast with those of Eurobarometer (The Gallup Organisation, 2010), according
to which 55% of the enterprises (37% in the case of Spain) considered a Bachelor’s degree would
best match the skills requirements of their organisations, whereas 35% (47% in the case of Spain)
considered a Master’s degree to be the best match and 3% (9% in the case of Spain) a doctoral
degree/PhD. This difference is probably due to the fact that the Eurobarometer survey only
covered enterprises with more than 50 employees, which, as mentioned above, valued a Master’s
degree more highly.
There were no marked differences according to the percentage of graduate employees in the
organisation. Mention is made of the fact that organisations with more than 60% of their
employees with a degree rated a Master’s degree more highly and, in the case of a doctoral
degree/PhD, a higher proportion reported it was a relevant factor in recruitment for certain types
of job.
87%90%
96% 97%91%
25%28%
45%
56%
34%
5%8% 9%
17%
8%
0%
20%
40%
60%
80%
100%
Micro-enterprise Small enterprise Medium enterprise Large enterprise Total
Bachelor's degree (or equivalent) Master's degree Doctorate/PhD
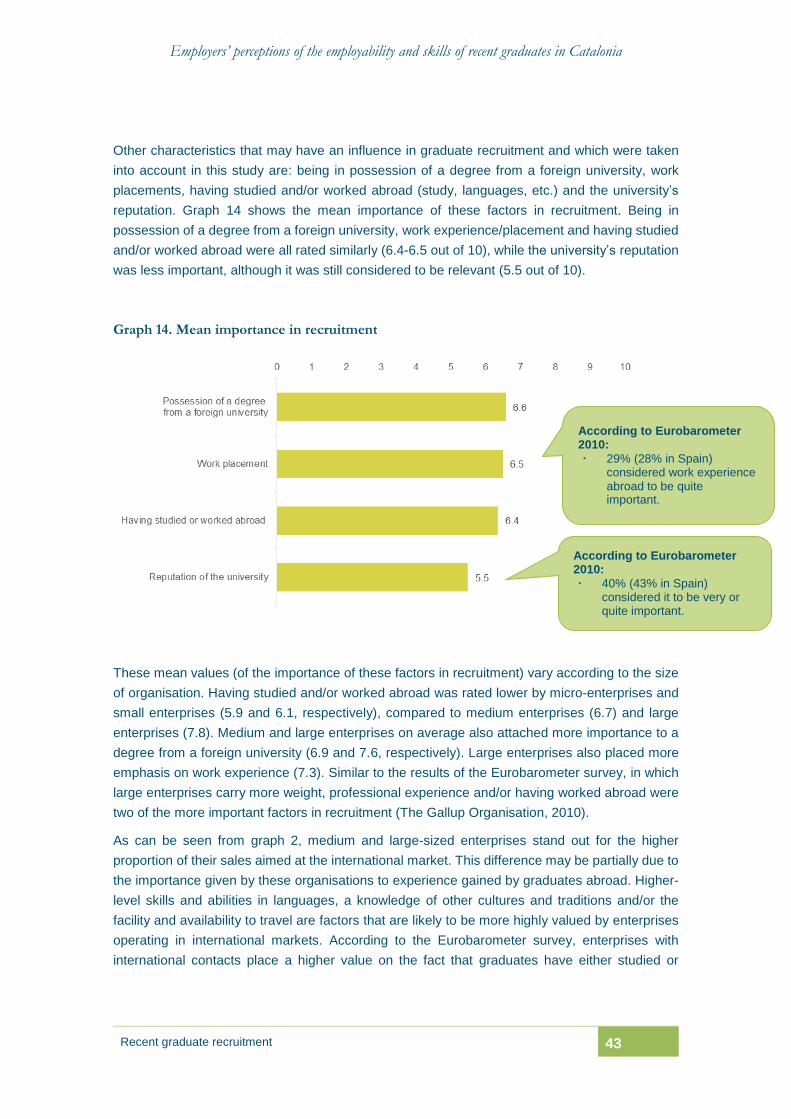
Employers’ perceptions of the employability and skills of recent graduates in Catalonia
Recent graduate recruitment 43
Other characteristics that may have an influence in graduate recruitment and which were taken
into account in this study are: being in possession of a degree from a foreign university, work
placements, having studied and/or worked abroad (study, languages, etc.) and the university’s
reputation. Graph 14 shows the mean importance of these factors in recruitment. Being in
possession of a degree from a foreign university, work experience/placement and having studied
and/or worked abroad were all rated similarly (6.4-6.5 out of 10), while the university’s reputation
was less important, although it was still considered to be relevant (5.5 out of 10).
Graph 14. Mean importance in recruitment
These mean values (of the importance of these factors in recruitment) vary according to the size
of organisation. Having studied and/or worked abroad was rated lower by micro-enterprises and
small enterprises (5.9 and 6.1, respectively), compared to medium enterprises (6.7) and large
enterprises (7.8). Medium and large enterprises on average also attached more importance to a
degree from a foreign university (6.9 and 7.6, respectively). Large enterprises also placed more
emphasis on work experience (7.3). Similar to the results of the Eurobarometer survey, in which
large enterprises carry more weight, professional experience and/or having worked abroad were
two of the more important factors in recruitment (The Gallup Organisation, 2010).
As can be seen from graph 2, medium and large-sized enterprises stand out for the higher
proportion of their sales aimed at the international market. This difference may be partially due to
the importance given by these organisations to experience gained by graduates abroad. Higher-
level skills and abilities in languages, a knowledge of other cultures and traditions and/or the
facility and availability to travel are factors that are likely to be more highly valued by enterprises
operating in international markets. According to the Eurobarometer survey, enterprises with
international contacts place a higher value on the fact that graduates have either studied or
According to Eurobarometer 2010:
40% (43% in Spain) considered it to be very or quite important.
According to Eurobarometer 2010:
29% (28% in Spain) considered work experience abroad to be quite important.
Employers’ perceptions of the employability and skills of recent graduates in Catalonia
44 Recent graduate recruitment
worked abroad (The Gallup Organisation, 2010). There were no marked differences regarding
the percentage of graduate employees in the enterprise.
4.4. Difficulties with the recruitment of recent graduates
In many countries there is a high level of unemployment at the same time that employers report
difficulties in finding people with the appropriate skills (Conseil d’orientation pour l’emploi, 2013;
Mourshed et al., 2012; OECD, 2012). This paradox reflects the difficulty in satisfactorily matching
supply (i.e. employees) and demand (company requirements) in the labour market. This
international trend is also evident in Catalonia, where a high unemployment rate has not served
to overcome the difficulties encountered by employers in graduate recruitment.
Although university graduates have a higher employment rate compared to people who only have
a secondary or primary education (Santiago et al., 2008a; AQU Catalunya, 2014; OECD, 2014),
they nevertheless receive criticism from employers who consider that there are often insufficient
candidates that are either suitable for the requirements of their organisations or have the right
skills. Part of this problem may be due to a matter of imperfect information in the labour market
between the knowledge and skills of graduates and those required by organisations; this could
be partially solved by disseminating and facilitating the information gathered in the Qualifications
Framework on degree programmes.
As mentioned in the previous section, 59% of employers in the sample had recruited recent
graduates in the last five years. 42% of these recruiting organisations stated they had experienced
difficulties with recruitment.
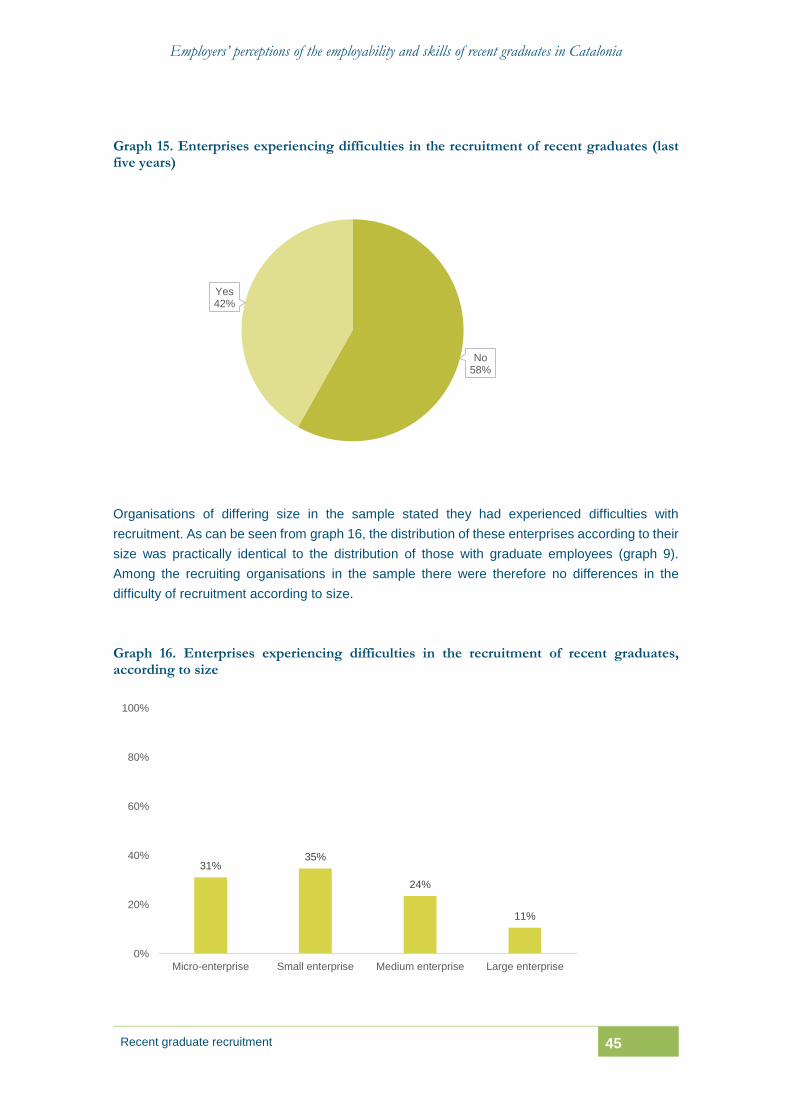
Employers’ perceptions of the employability and skills of recent graduates in Catalonia
Recent graduate recruitment 45
Graph 15. Enterprises experiencing difficulties in the recruitment of recent graduates (last five years)
Organisations of differing size in the sample stated they had experienced difficulties with
recruitment. As can be seen from graph 16, the distribution of these enterprises according to their
size was practically identical to the distribution of those with graduate employees (graph 9).
Among the recruiting organisations in the sample there were therefore no differences in the
difficulty of recruitment according to size.
Graph 16. Enterprises experiencing difficulties in the recruitment of recent graduates, according to size
No58%
Yes42%
31%35%
24%
11%
0%
20%
40%
60%
80%
100%
Micro-enterprise Small enterprise Medium enterprise Large enterprise
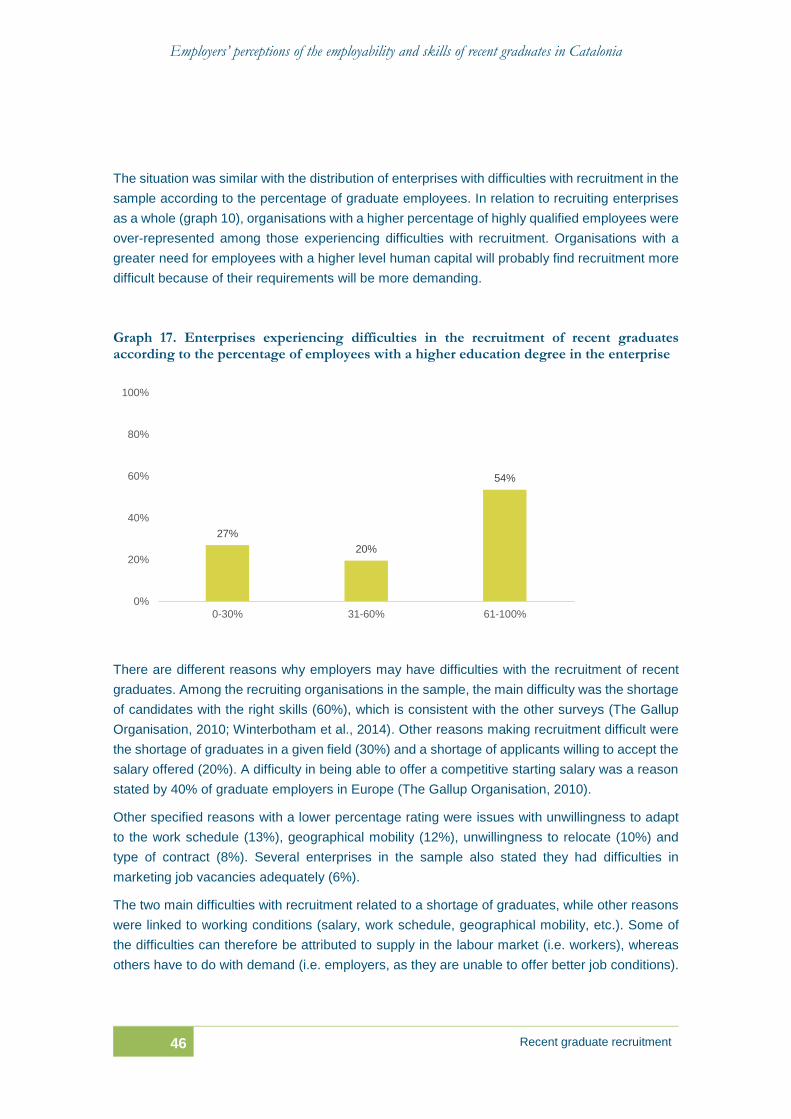
Employers’ perceptions of the employability and skills of recent graduates in Catalonia
46 Recent graduate recruitment
The situation was similar with the distribution of enterprises with difficulties with recruitment in the
sample according to the percentage of graduate employees. In relation to recruiting enterprises
as a whole (graph 10), organisations with a higher percentage of highly qualified employees were
over-represented among those experiencing difficulties with recruitment. Organisations with a
greater need for employees with a higher level human capital will probably find recruitment more
difficult because of their requirements will be more demanding.
Graph 17. Enterprises experiencing difficulties in the recruitment of recent graduates according to the percentage of employees with a higher education degree in the enterprise
There are different reasons why employers may have difficulties with the recruitment of recent
graduates. Among the recruiting organisations in the sample, the main difficulty was the shortage
of candidates with the right skills (60%), which is consistent with the other surveys (The Gallup
Organisation, 2010; Winterbotham et al., 2014). Other reasons making recruitment difficult were
the shortage of graduates in a given field (30%) and a shortage of applicants willing to accept the
salary offered (20%). A difficulty in being able to offer a competitive starting salary was a reason
stated by 40% of graduate employers in Europe (The Gallup Organisation, 2010).
Other specified reasons with a lower percentage rating were issues with unwillingness to adapt
to the work schedule (13%), geographical mobility (12%), unwillingness to relocate (10%) and
type of contract (8%). Several enterprises in the sample also stated they had difficulties in
marketing job vacancies adequately (6%).
The two main difficulties with recruitment related to a shortage of graduates, while other reasons
were linked to working conditions (salary, work schedule, geographical mobility, etc.). Some of
the difficulties can therefore be attributed to supply in the labour market (i.e. workers), whereas
others have to do with demand (i.e. employers, as they are unable to offer better job conditions).
27%
20%
54%
0%
20%
40%
60%
80%
100%
0-30% 31-60% 61-100%

Employers’ perceptions of the employability and skills of recent graduates in Catalonia
Recent graduate recruitment 47
Graph 18. Reasons why enterprises had difficulties in recruiting recent graduates
NB: Given that enterprises could give more than one reason for difficulty in recruitment, the total percentage does not come to 100.
Not all enterprises experienced these difficulties to the same degree. Compared to the survey
average, large enterprises had fewer difficulties in filling their job vacancies due to a shortage of
candidates with the right skills (50%), although they had more difficulties in finding graduates in a
given field (34%) and due to issues with geographical mobility (22%) and work schedule (16%).
Medium-size enterprises had more issues with the geographical mobility of candidates (18%)
compared to the average survey values. Small enterprises stand out for having more difficulties
in finding candidates with the right skills (66%) and who were willing to accept the salary (24%)
or type of contract (10%). In the case of micro-enterprises, there was no marked difference from
the mean values for any of the reasons given.
60%
30%
20%
13%
12%
10%
8%
6%
6%
0% 20% 40% 60% 80% 100%
Shortage of candidates with the right skills
Shortage of graduates in a given field
Shortage of candidates willing to accept the salary
Work schedule
Geographical mobility
Unwillingness of candidates to relocate
The type of contract
Limited resources to adequately publicise job vacancies
Other reasons
According to Eurobarometer 2010:
47% (36% in Spain) had experienced this difficulty.
According to Eurobarometer 2010:
22% (17% in Spain) had experienced this difficulty.
According to Eurobarometer 2010:
43% (41% in Spain) had experienced this difficulty.
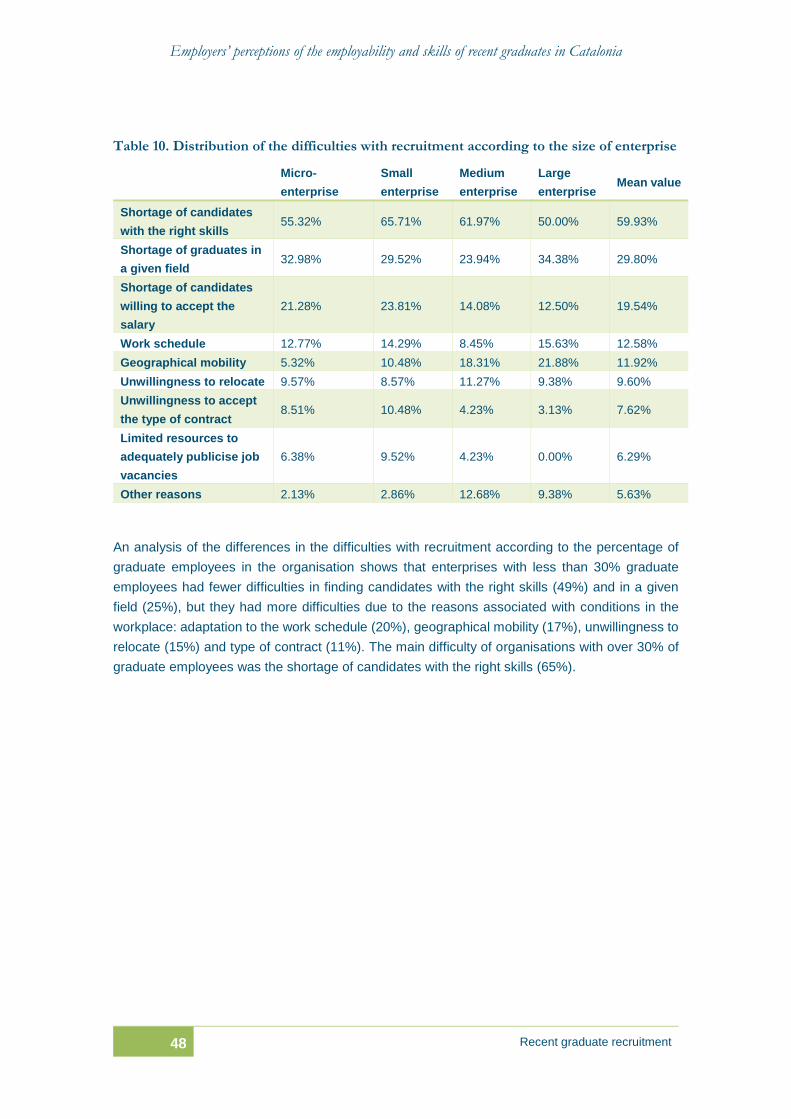
Employers’ perceptions of the employability and skills of recent graduates in Catalonia
48 Recent graduate recruitment
Table 10. Distribution of the difficulties with recruitment according to the size of enterprise
Micro-
enterprise
Small
enterprise
Medium
enterprise
Large
enterprise Mean value
Shortage of candidates
with the right skills 55.32% 65.71% 61.97% 50.00% 59.93%
Shortage of graduates in
a given field 32.98% 29.52% 23.94% 34.38% 29.80%
Shortage of candidates
willing to accept the
salary
21.28% 23.81% 14.08% 12.50% 19.54%
Work schedule 12.77% 14.29% 8.45% 15.63% 12.58%
Geographical mobility 5.32% 10.48% 18.31% 21.88% 11.92%
Unwillingness to relocate 9.57% 8.57% 11.27% 9.38% 9.60%
Unwillingness to accept
the type of contract 8.51% 10.48% 4.23% 3.13% 7.62%
Limited resources to
adequately publicise job
vacancies
6.38% 9.52% 4.23% 0.00% 6.29%
Other reasons 2.13% 2.86% 12.68% 9.38% 5.63%
An analysis of the differences in the difficulties with recruitment according to the percentage of
graduate employees in the organisation shows that enterprises with less than 30% graduate
employees had fewer difficulties in finding candidates with the right skills (49%) and in a given
field (25%), but they had more difficulties due to the reasons associated with conditions in the
workplace: adaptation to the work schedule (20%), geographical mobility (17%), unwillingness to
relocate (15%) and type of contract (11%). The main difficulty of organisations with over 30% of
graduate employees was the shortage of candidates with the right skills (65%).
Employers’ perceptions of the employability and skills of recent graduates in Catalonia
Skills of recent graduates 49
5. SKILLS OF RECENT GRADUATES
The skills that employers in the sample considered to be the most important were
demonstrating responsibility at work (8.9 out of 10), the ability to acquire new
knowledge (8.4) and team working (8.3). The least important were negotiation skills
(6.4) and leadership (6.6).
The overall satisfaction of employers with the skills of recent graduate recruits was 7
out of 10 (medium to high).
The skills that they were most satisfied with were computer skills (7.9 out of 10),
demonstrating responsibility at work (7.6), team working (7.5), theoretical skills (7.2)
and the ability to acquire new knowledge (7).
There was no marked variation in the levels of importance of and satisfaction with the
skills of recent graduates according to branch of activity nor size of the organisation,
except for foreign language skills.
The areas where there was more scope for improvement in fulfilling the requirements
of enterprises was in problem solving, practical skills and the ability to generate new
ideas.
5.1. Employers’ views concerning the importance of the skills of recent graduates and their actual satisfaction with their graduate recruits’ skills
As stated in the introduction to this report, the main objective of this study was to obtain
information on the views of employers’ concerning the skills of recent graduates. Their evaluation
of graduates’ skills was made from a dual perspective of their importance or relevance in the
world of work, and their satisfaction with their graduate recruits’ skills. This dual perspective
makes it possible to identify the skills that are most extensively required in the labour market (the
most important ones) and employers’ satisfaction with the level of these skills acquired by their
graduate recruits through their studies at a higher education institution (university). In order to be
able to prioritize where improvements are most necessary in this regard, focus needs to be put
on the skills with the biggest disparity between the level of satisfaction and level of importance,
instead of focusing just on those with a low level of satisfaction (Allen, Van Der Velden, 2005).
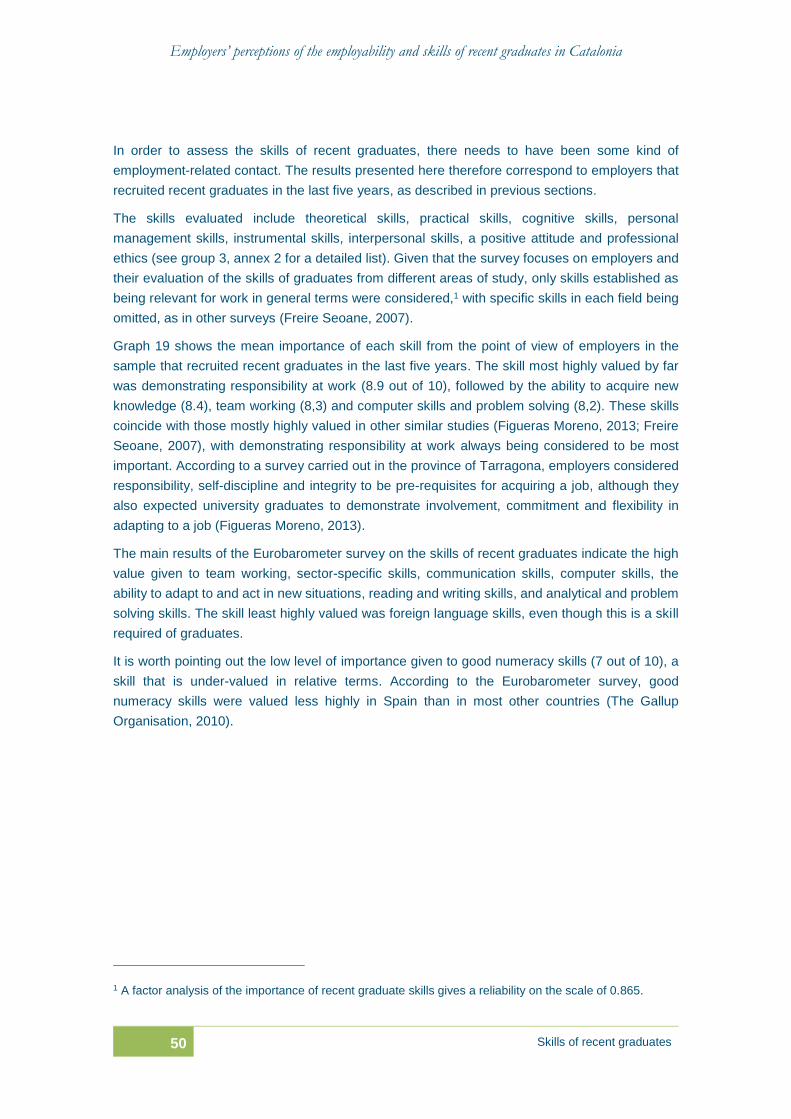
Employers’ perceptions of the employability and skills of recent graduates in Catalonia
50 Skills of recent graduates
In order to assess the skills of recent graduates, there needs to have been some kind of
employment-related contact. The results presented here therefore correspond to employers that
recruited recent graduates in the last five years, as described in previous sections.
The skills evaluated include theoretical skills, practical skills, cognitive skills, personal
management skills, instrumental skills, interpersonal skills, a positive attitude and professional
ethics (see group 3, annex 2 for a detailed list). Given that the survey focuses on employers and
their evaluation of the skills of graduates from different areas of study, only skills established as
being relevant for work in general terms were considered,1 with specific skills in each field being
omitted, as in other surveys (Freire Seoane, 2007).
Graph 19 shows the mean importance of each skill from the point of view of employers in the
sample that recruited recent graduates in the last five years. The skill most highly valued by far
was demonstrating responsibility at work (8.9 out of 10), followed by the ability to acquire new
knowledge (8.4), team working (8,3) and computer skills and problem solving (8,2). These skills
coincide with those mostly highly valued in other similar studies (Figueras Moreno, 2013; Freire
Seoane, 2007), with demonstrating responsibility at work always being considered to be most
important. According to a survey carried out in the province of Tarragona, employers considered
responsibility, self-discipline and integrity to be pre-requisites for acquiring a job, although they
also expected university graduates to demonstrate involvement, commitment and flexibility in
adapting to a job (Figueras Moreno, 2013).
The main results of the Eurobarometer survey on the skills of recent graduates indicate the high
value given to team working, sector-specific skills, communication skills, computer skills, the
ability to adapt to and act in new situations, reading and writing skills, and analytical and problem
solving skills. The skill least highly valued was foreign language skills, even though this is a skill
required of graduates.
It is worth pointing out the low level of importance given to good numeracy skills (7 out of 10), a
skill that is under-valued in relative terms. According to the Eurobarometer survey, good
numeracy skills were valued less highly in Spain than in most other countries (The Gallup
Organisation, 2010).
1 A factor analysis of the importance of recent graduate skills gives a reliability on the scale of 0.865.
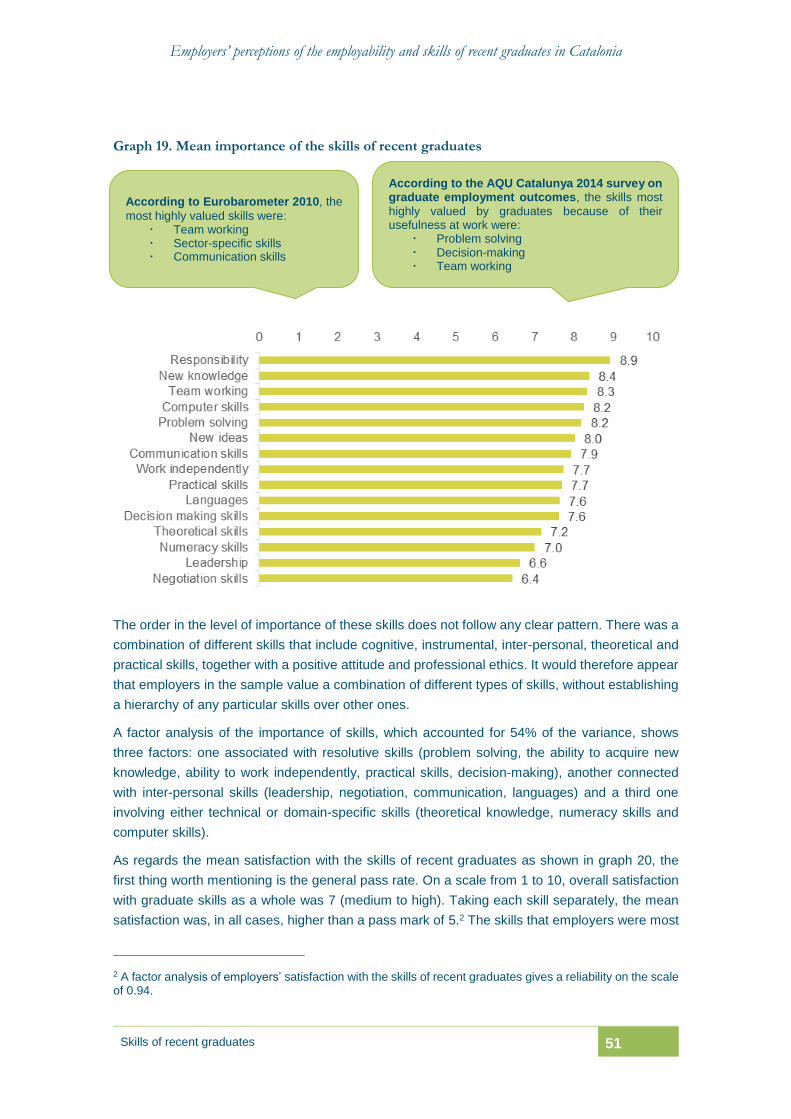
Employers’ perceptions of the employability and skills of recent graduates in Catalonia
Skills of recent graduates 51
Graph 19. Mean importance of the skills of recent graduates
The order in the level of importance of these skills does not follow any clear pattern. There was a
combination of different skills that include cognitive, instrumental, inter-personal, theoretical and
practical skills, together with a positive attitude and professional ethics. It would therefore appear
that employers in the sample value a combination of different types of skills, without establishing
a hierarchy of any particular skills over other ones.
A factor analysis of the importance of skills, which accounted for 54% of the variance, shows
three factors: one associated with resolutive skills (problem solving, the ability to acquire new
knowledge, ability to work independently, practical skills, decision-making), another connected
with inter-personal skills (leadership, negotiation, communication, languages) and a third one
involving either technical or domain-specific skills (theoretical knowledge, numeracy skills and
computer skills).
As regards the mean satisfaction with the skills of recent graduates as shown in graph 20, the
first thing worth mentioning is the general pass rate. On a scale from 1 to 10, overall satisfaction
with graduate skills as a whole was 7 (medium to high). Taking each skill separately, the mean
satisfaction was, in all cases, higher than a pass mark of 5.2 The skills that employers were most
2 A factor analysis of employers’ satisfaction with the skills of recent graduates gives a reliability on the scale of 0.94.
According to Eurobarometer 2010, the
most highly valued skills were: Team working Sector-specific skills Communication skills
According to the AQU Catalunya 2014 survey on graduate employment outcomes, the skills most
highly valued by graduates because of their usefulness at work were:
Problem solving Decision-making Team working
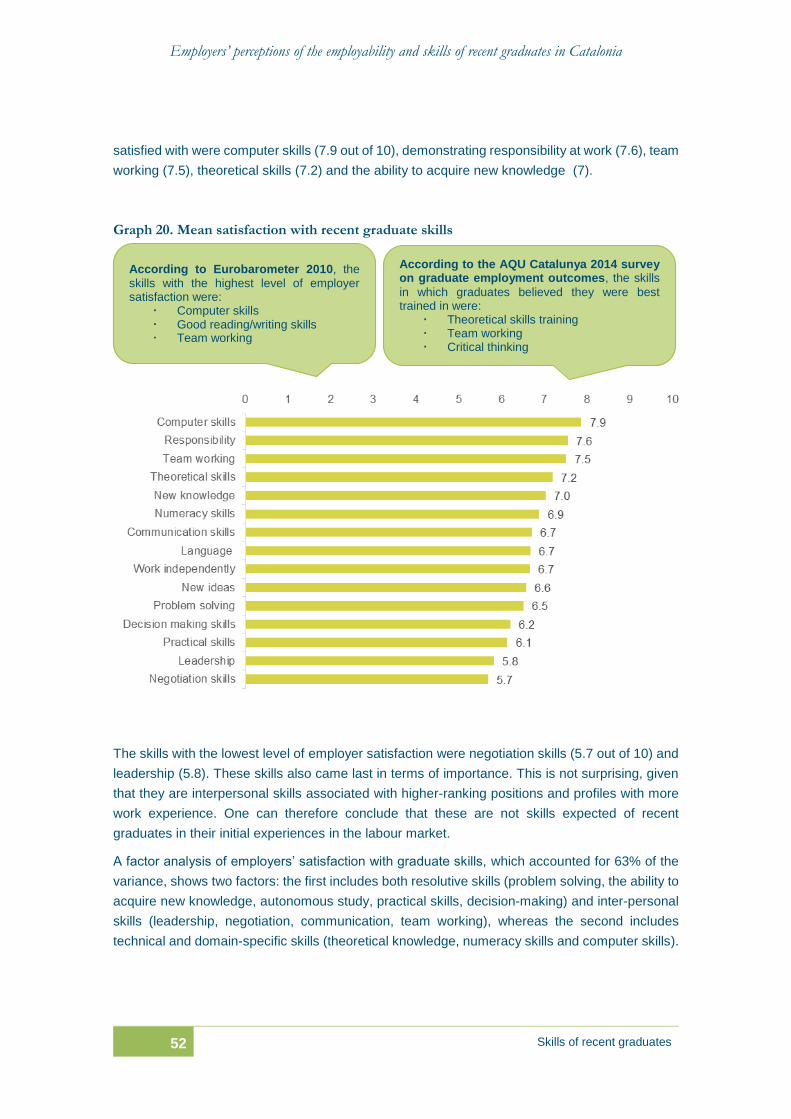
Employers’ perceptions of the employability and skills of recent graduates in Catalonia
52 Skills of recent graduates
satisfied with were computer skills (7.9 out of 10), demonstrating responsibility at work (7.6), team
working (7.5), theoretical skills (7.2) and the ability to acquire new knowledge (7).
Graph 20. Mean satisfaction with recent graduate skills
The skills with the lowest level of employer satisfaction were negotiation skills (5.7 out of 10) and
leadership (5.8). These skills also came last in terms of importance. This is not surprising, given
that they are interpersonal skills associated with higher-ranking positions and profiles with more
work experience. One can therefore conclude that these are not skills expected of recent
graduates in their initial experiences in the labour market.
A factor analysis of employers’ satisfaction with graduate skills, which accounted for 63% of the
variance, shows two factors: the first includes both resolutive skills (problem solving, the ability to
acquire new knowledge, autonomous study, practical skills, decision-making) and inter-personal
skills (leadership, negotiation, communication, team working), whereas the second includes
technical and domain-specific skills (theoretical knowledge, numeracy skills and computer skills).
According to Eurobarometer 2010, the
skills with the highest level of employer satisfaction were:
Computer skills Good reading/writing skills Team working
According to the AQU Catalunya 2014 survey on graduate employment outcomes, the skills
in which graduates believed they were best trained in were:
Theoretical skills training Team working Critical thinking
Employers’ perceptions of the employability and skills of recent graduates in Catalonia
Skills of recent graduates 53
5.2. Comparison between employers’ views concerning the importance of the skills of recent graduates and their actual satisfaction with their employees’ skills
Graph 21 shows the mean importance of each skill compared to the mean satisfaction of
employers with their recent graduate employees’ skills. In all cases, the level of employer
satisfaction with graduate skills was lower than the level of importance, except in the case of
theoretical skills, where there was a perfect match between the levels of importance and
satisfaction.
In the European study, employers were in general satisfied with graduate skills, given that the
differences between the importance of the skills of recent graduates and employer satisfaction
with graduate skills were not very great (The Gallup Organisation, 2010).
Graph 21. Comparison between the mean values for employers’ views concerning the importance of and their satisfaction with the skills of recent graduates
A positive trend can be seen between the importance given to each skill and the level of
satisfaction with the skill, i.e. the greater the importance given to a skill, the higher the level of
employer satisfaction with that skill. Given that it is a matter of subjective assessment, employers
tend to recruit according to the skills they consider to be most important; it is therefore logical for
the level of satisfaction to be close to that of importance, as an employer will choose those
candidates who better fulfil their selection criteria.
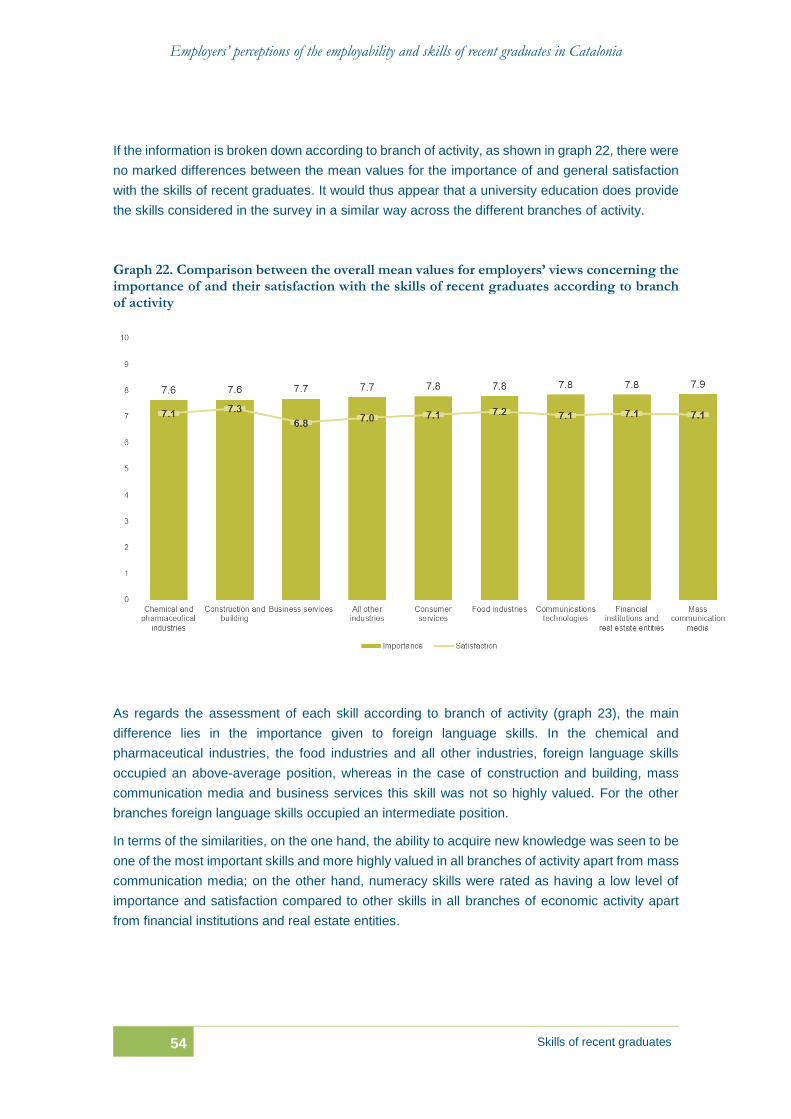
Employers’ perceptions of the employability and skills of recent graduates in Catalonia
54 Skills of recent graduates
If the information is broken down according to branch of activity, as shown in graph 22, there were
no marked differences between the mean values for the importance of and general satisfaction
with the skills of recent graduates. It would thus appear that a university education does provide
the skills considered in the survey in a similar way across the different branches of activity.
Graph 22. Comparison between the overall mean values for employers’ views concerning the importance of and their satisfaction with the skills of recent graduates according to branch of activity
As regards the assessment of each skill according to branch of activity (graph 23), the main
difference lies in the importance given to foreign language skills. In the chemical and
pharmaceutical industries, the food industries and all other industries, foreign language skills
occupied an above-average position, whereas in the case of construction and building, mass
communication media and business services this skill was not so highly valued. For the other
branches foreign language skills occupied an intermediate position.
In terms of the similarities, on the one hand, the ability to acquire new knowledge was seen to be
one of the most important skills and more highly valued in all branches of activity apart from mass
communication media; on the other hand, numeracy skills were rated as having a low level of
importance and satisfaction compared to other skills in all branches of economic activity apart
from financial institutions and real estate entities.
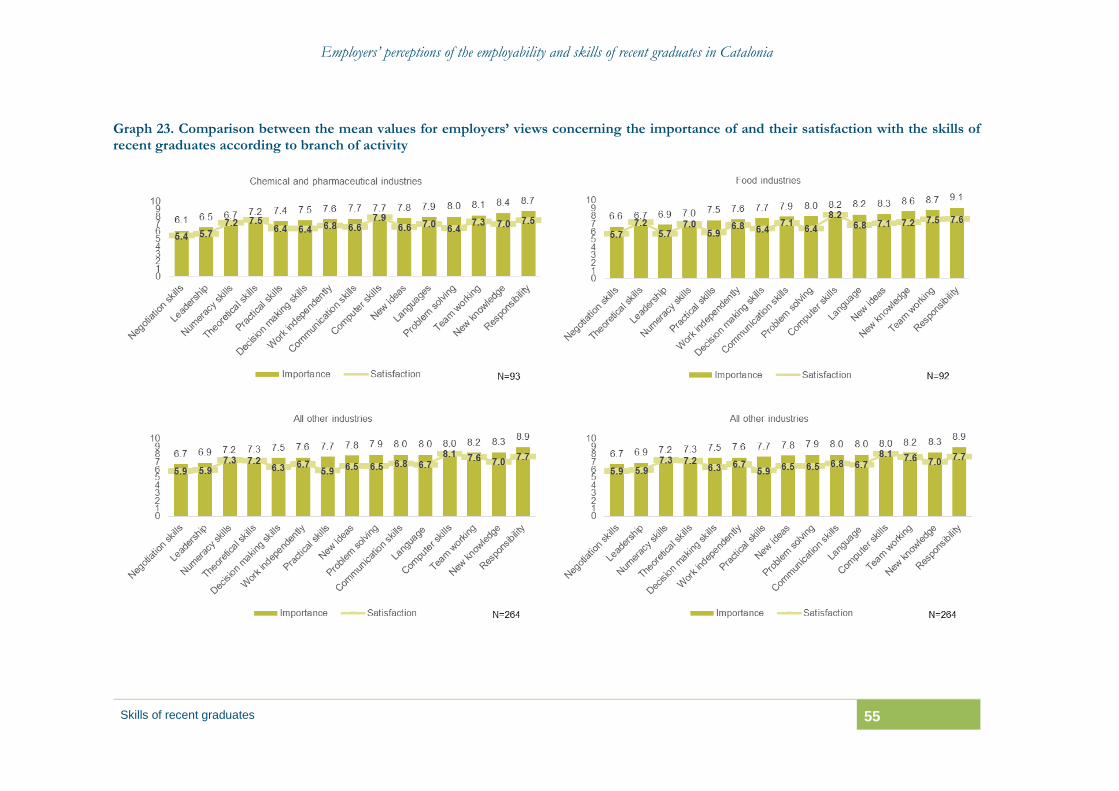
Employers’ perceptions of the employability and skills of recent graduates in Catalonia
Skills of recent graduates 55
Graph 23. Comparison between the mean values for employers’ views concerning the importance of and their satisfaction with the skills of recent graduates according to branch of activity
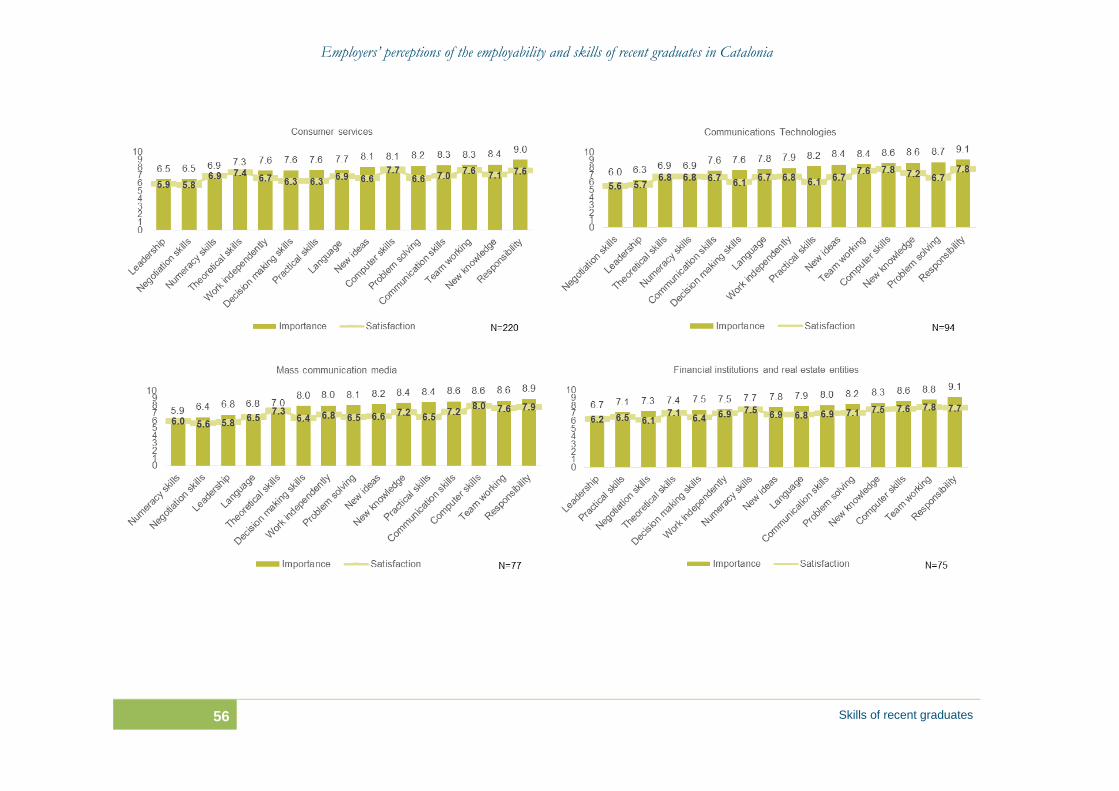
Employers’ perceptions of the employability and skills of recent graduates in Catalonia
56 Skills of recent graduates
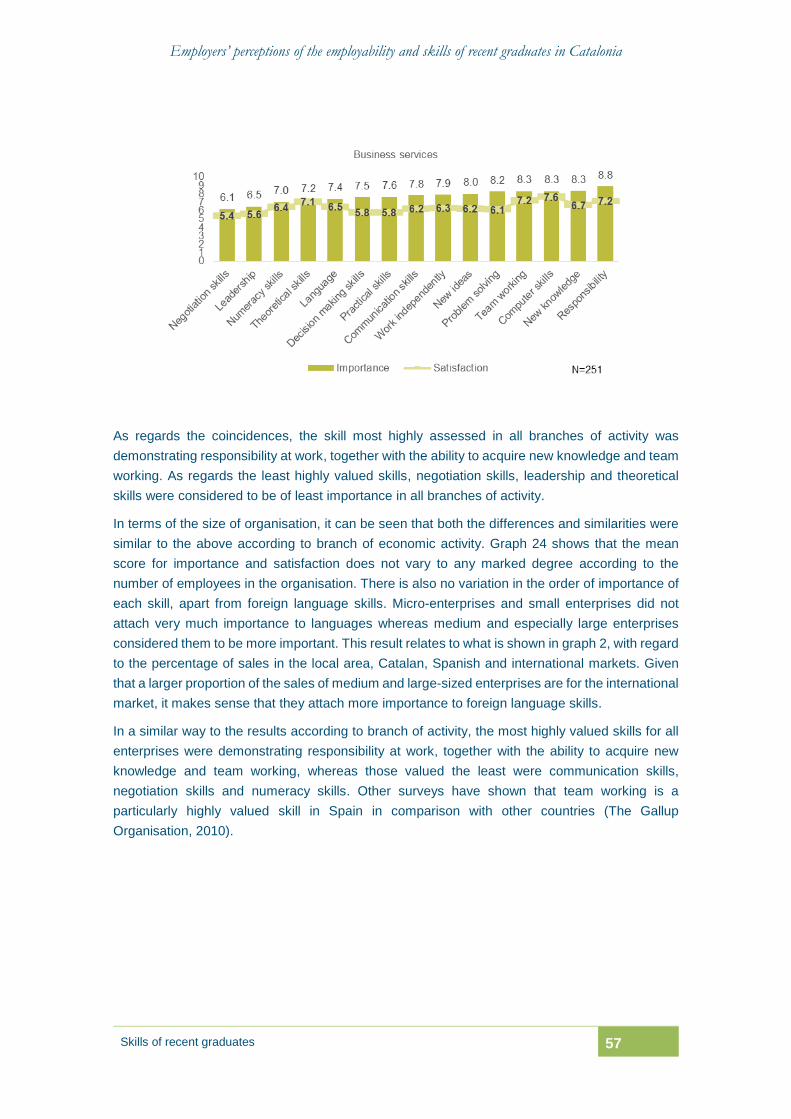
Employers’ perceptions of the employability and skills of recent graduates in Catalonia
Skills of recent graduates 57
As regards the coincidences, the skill most highly assessed in all branches of activity was
demonstrating responsibility at work, together with the ability to acquire new knowledge and team
working. As regards the least highly valued skills, negotiation skills, leadership and theoretical
skills were considered to be of least importance in all branches of activity.
In terms of the size of organisation, it can be seen that both the differences and similarities were
similar to the above according to branch of economic activity. Graph 24 shows that the mean
score for importance and satisfaction does not vary to any marked degree according to the
number of employees in the organisation. There is also no variation in the order of importance of
each skill, apart from foreign language skills. Micro-enterprises and small enterprises did not
attach very much importance to languages whereas medium and especially large enterprises
considered them to be more important. This result relates to what is shown in graph 2, with regard
to the percentage of sales in the local area, Catalan, Spanish and international markets. Given
that a larger proportion of the sales of medium and large-sized enterprises are for the international
market, it makes sense that they attach more importance to foreign language skills.
In a similar way to the results according to branch of activity, the most highly valued skills for all
enterprises were demonstrating responsibility at work, together with the ability to acquire new
knowledge and team working, whereas those valued the least were communication skills,
negotiation skills and numeracy skills. Other surveys have shown that team working is a
particularly highly valued skill in Spain in comparison with other countries (The Gallup
Organisation, 2010).
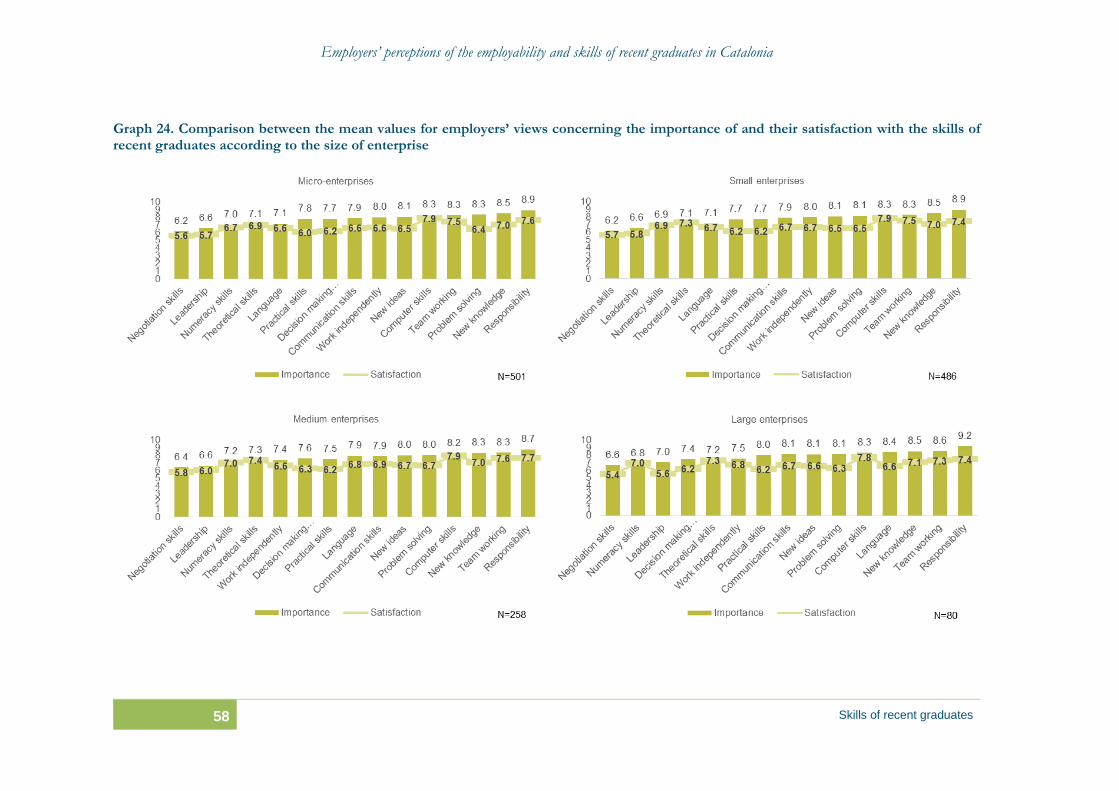
Employers’ perceptions of the employability and skills of recent graduates in Catalonia
58 Skills of recent graduates
Graph 24. Comparison between the mean values for employers’ views concerning the importance of and their satisfaction with the skills of recent graduates according to the size of enterprise
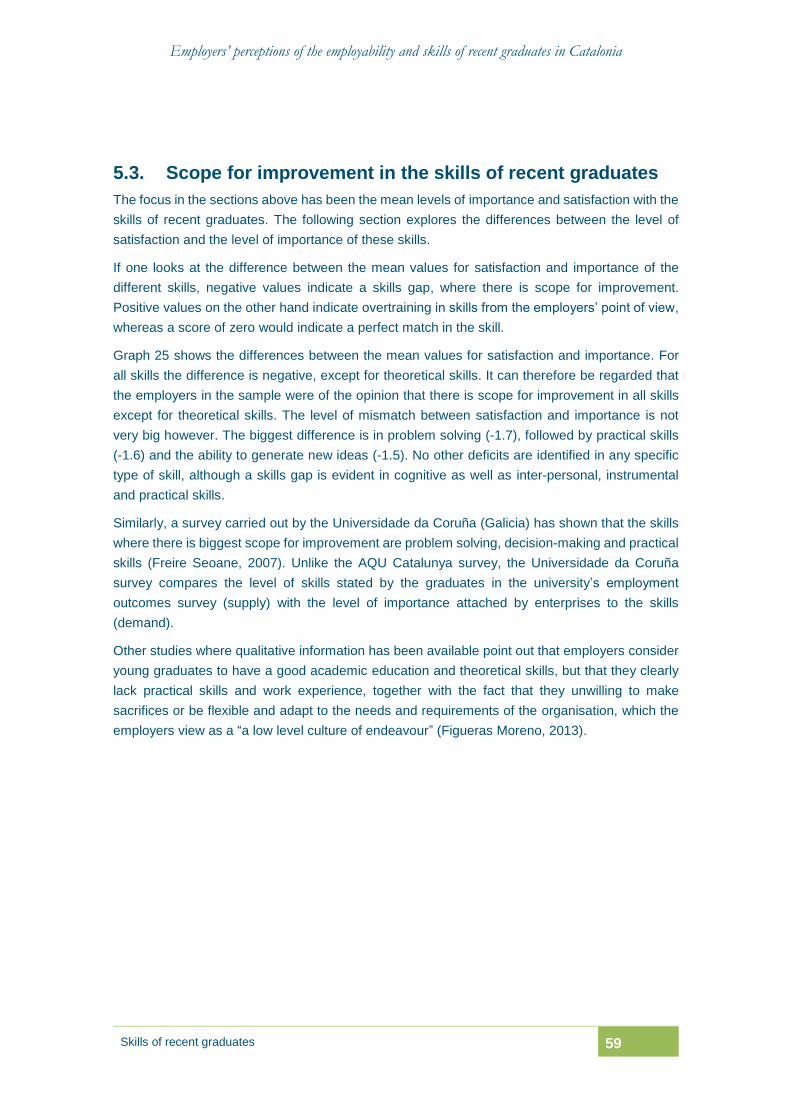
Employers’ perceptions of the employability and skills of recent graduates in Catalonia
Skills of recent graduates 59
5.3. Scope for improvement in the skills of recent graduates
The focus in the sections above has been the mean levels of importance and satisfaction with the
skills of recent graduates. The following section explores the differences between the level of
satisfaction and the level of importance of these skills.
If one looks at the difference between the mean values for satisfaction and importance of the
different skills, negative values indicate a skills gap, where there is scope for improvement.
Positive values on the other hand indicate overtraining in skills from the employers’ point of view,
whereas a score of zero would indicate a perfect match in the skill.
Graph 25 shows the differences between the mean values for satisfaction and importance. For
all skills the difference is negative, except for theoretical skills. It can therefore be regarded that
the employers in the sample were of the opinion that there is scope for improvement in all skills
except for theoretical skills. The level of mismatch between satisfaction and importance is not
very big however. The biggest difference is in problem solving (-1.7), followed by practical skills
(-1.6) and the ability to generate new ideas (-1.5). No other deficits are identified in any specific
type of skill, although a skills gap is evident in cognitive as well as inter-personal, instrumental
and practical skills.
Similarly, a survey carried out by the Universidade da Coruña (Galicia) has shown that the skills
where there is biggest scope for improvement are problem solving, decision-making and practical
skills (Freire Seoane, 2007). Unlike the AQU Catalunya survey, the Universidade da Coruña
survey compares the level of skills stated by the graduates in the university’s employment
outcomes survey (supply) with the level of importance attached by enterprises to the skills
(demand).
Other studies where qualitative information has been available point out that employers consider
young graduates to have a good academic education and theoretical skills, but that they clearly
lack practical skills and work experience, together with the fact that they unwilling to make
sacrifices or be flexible and adapt to the needs and requirements of the organisation, which the
employers view as a “a low level culture of endeavour” (Figueras Moreno, 2013).
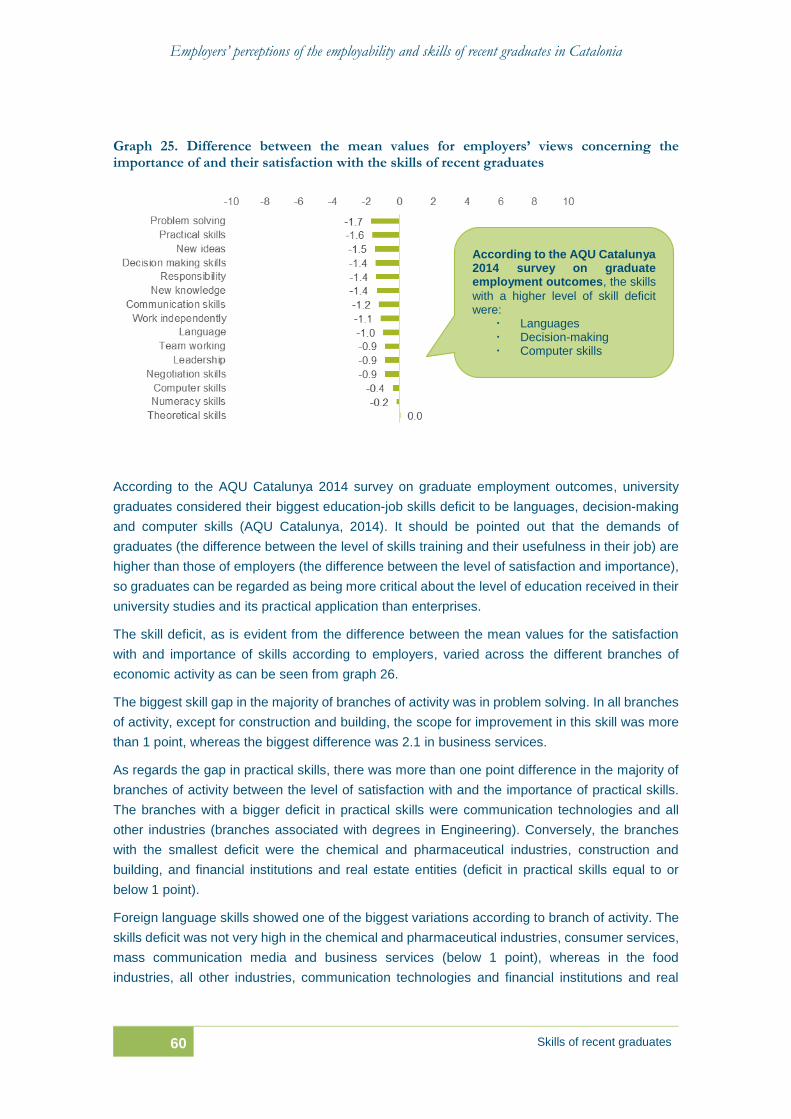
Employers’ perceptions of the employability and skills of recent graduates in Catalonia
60 Skills of recent graduates
Graph 25. Difference between the mean values for employers’ views concerning the importance of and their satisfaction with the skills of recent graduates
According to the AQU Catalunya 2014 survey on graduate employment outcomes, university
graduates considered their biggest education-job skills deficit to be languages, decision-making
and computer skills (AQU Catalunya, 2014). It should be pointed out that the demands of
graduates (the difference between the level of skills training and their usefulness in their job) are
higher than those of employers (the difference between the level of satisfaction and importance),
so graduates can be regarded as being more critical about the level of education received in their
university studies and its practical application than enterprises.
The skill deficit, as is evident from the difference between the mean values for the satisfaction
with and importance of skills according to employers, varied across the different branches of
economic activity as can be seen from graph 26.
The biggest skill gap in the majority of branches of activity was in problem solving. In all branches
of activity, except for construction and building, the scope for improvement in this skill was more
than 1 point, whereas the biggest difference was 2.1 in business services.
As regards the gap in practical skills, there was more than one point difference in the majority of
branches of activity between the level of satisfaction with and the importance of practical skills.
The branches with a bigger deficit in practical skills were communication technologies and all
other industries (branches associated with degrees in Engineering). Conversely, the branches
with the smallest deficit were the chemical and pharmaceutical industries, construction and
building, and financial institutions and real estate entities (deficit in practical skills equal to or
below 1 point).
Foreign language skills showed one of the biggest variations according to branch of activity. The
skills deficit was not very high in the chemical and pharmaceutical industries, consumer services,
mass communication media and business services (below 1 point), whereas in the food
industries, all other industries, communication technologies and financial institutions and real
According to the AQU Catalunya 2014 survey on graduate employment outcomes, the skills
with a higher level of skill deficit were:
Languages Decision-making Computer skills

Employers’ perceptions of the employability and skills of recent graduates in Catalonia
Skills of recent graduates 61
estate entities the deficit was more than 1 point. Construction and building was the only branch
where there was a slight excess in foreign language skills.
In all branches of activity there was a match for theoretical skills. Aside from business services,
there was also a match in numeracy skills in all other branches of activity with little scope for
improvement in this skill, according to the employers’ ratings in the survey.
Broadly speaking, the branches of economic activity with the lowest skills deficit were construction
and building and financial institutions and real estate entities, whereas the highest level of skills
deficit was in communication technologies and business services.
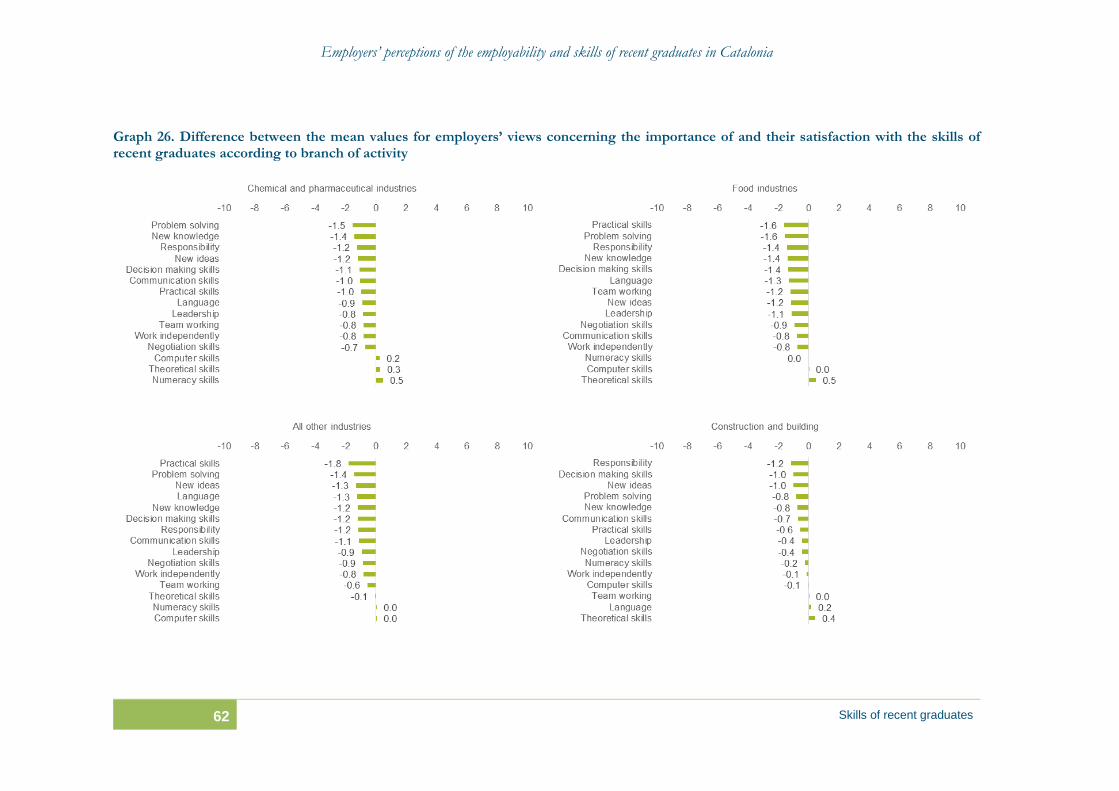
Employers’ perceptions of the employability and skills of recent graduates in Catalonia
62 Skills of recent graduates
Graph 26. Difference between the mean values for employers’ views concerning the importance of and their satisfaction with the skills of recent graduates according to branch of activity
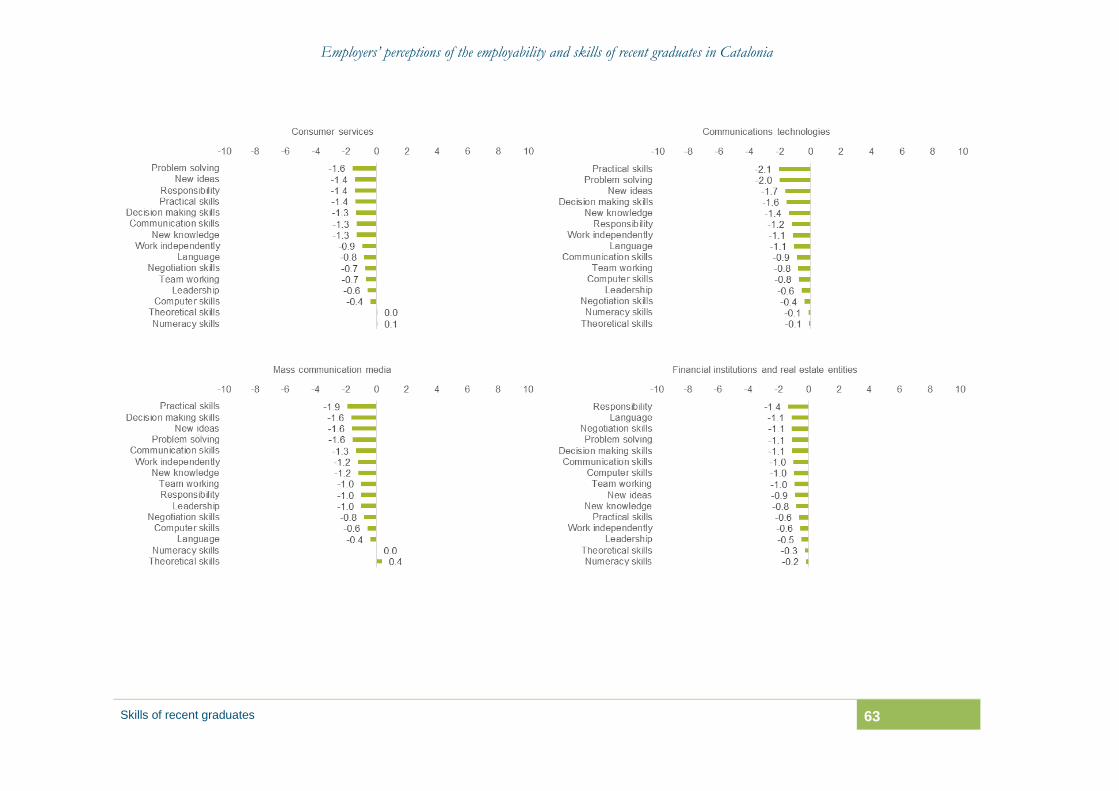
Employers’ perceptions of the employability and skills of recent graduates in Catalonia
Skills of recent graduates 63
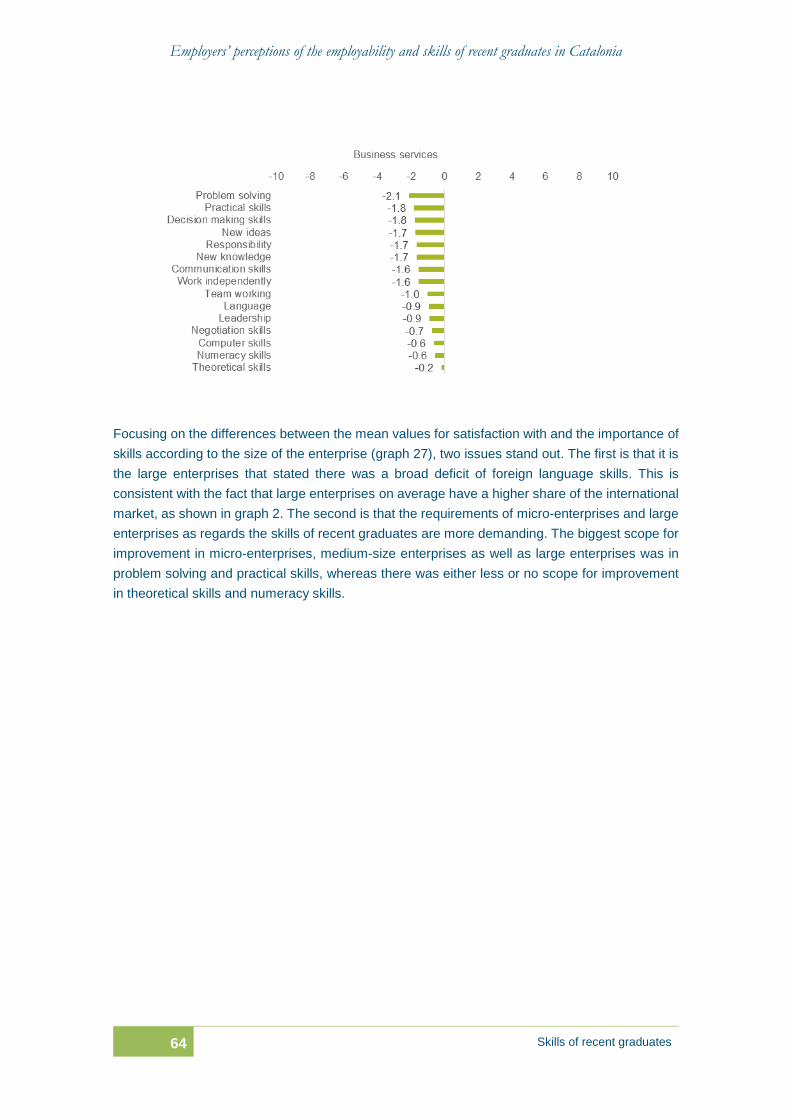
Employers’ perceptions of the employability and skills of recent graduates in Catalonia
64 Skills of recent graduates
Focusing on the differences between the mean values for satisfaction with and the importance of
skills according to the size of the enterprise (graph 27), two issues stand out. The first is that it is
the large enterprises that stated there was a broad deficit of foreign language skills. This is
consistent with the fact that large enterprises on average have a higher share of the international
market, as shown in graph 2. The second is that the requirements of micro-enterprises and large
enterprises as regards the skills of recent graduates are more demanding. The biggest scope for
improvement in micro-enterprises, medium-size enterprises as well as large enterprises was in
problem solving and practical skills, whereas there was either less or no scope for improvement
in theoretical skills and numeracy skills.
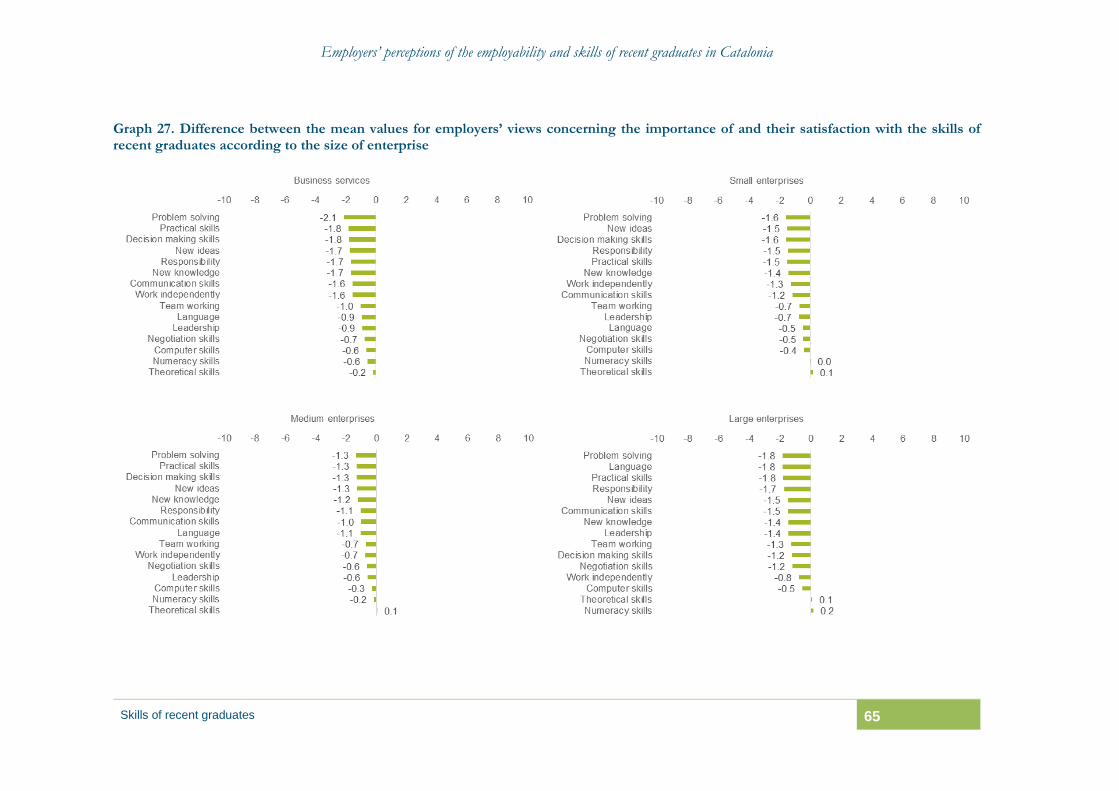
Employers’ perceptions of the employability and skills of recent graduates in Catalonia
Skills of recent graduates 65
Graph 27. Difference between the mean values for employers’ views concerning the importance of and their satisfaction with the skills of recent graduates according to the size of enterprise

Employers’ perceptions of the employability and skills of recent graduates in Catalonia
Workplace training of recent graduates 67
6. WORKPLACE TRAINING FOR RECENT GRADUATES
74% of the enterprises recruiting recent graduates provided them with some kind of
workplace training.
The main reasons were to improve sector-specific skills (79%), assist employees in
adapting to the characteristics and culture of the enterprise (65%) and improve soft
skills (48%). Training due to a shortage of basic knowledge (34%) and to improve
foreign language skills (33%) were other reasons taken into account.
It would appear that micro-enterprises and small enterprises find it more difficult to
provide training for recent graduates than medium and large-sized enterprises.
6.1. Workplace training
One of the main roles of the university is to form and train graduates in knowledge and skills that
are useful for the labour market. It cannot be responsible however for all of their training and much
less so when this needs to be highly specialised and either sector or job-specific. While the
university is expected to provide knowledge and skills of a more general and soft-skill nature, it is
enterprises that should be responsible for training recent graduates in the skills and practices that
are more specific to both the individual sector and the company (Mourshed et al., 2012).
The majority of organisations take into consideration this requirement and responsibility to train
their graduate recruits and complement the knowledge and skills they acquired at university. As
can be seen from graph 28, three quarters of all enterprises in the sample that recruit recent
graduates provided them with some kind of training. This percentage is very high compared to
average figures in Europe, according to which only one third of all enterprises provide some form
of training to their graduate employees (The Gallup Organisation, 2010) and employees as a
whole (Winterbotham et al., 2014). This proportion varies considerably according to country,
ranging from over 66% in Austria and the UK to less than 20% Romania and Bulgaria. At
European level, there has also been a decrease in the level of investment in training in recent
years.
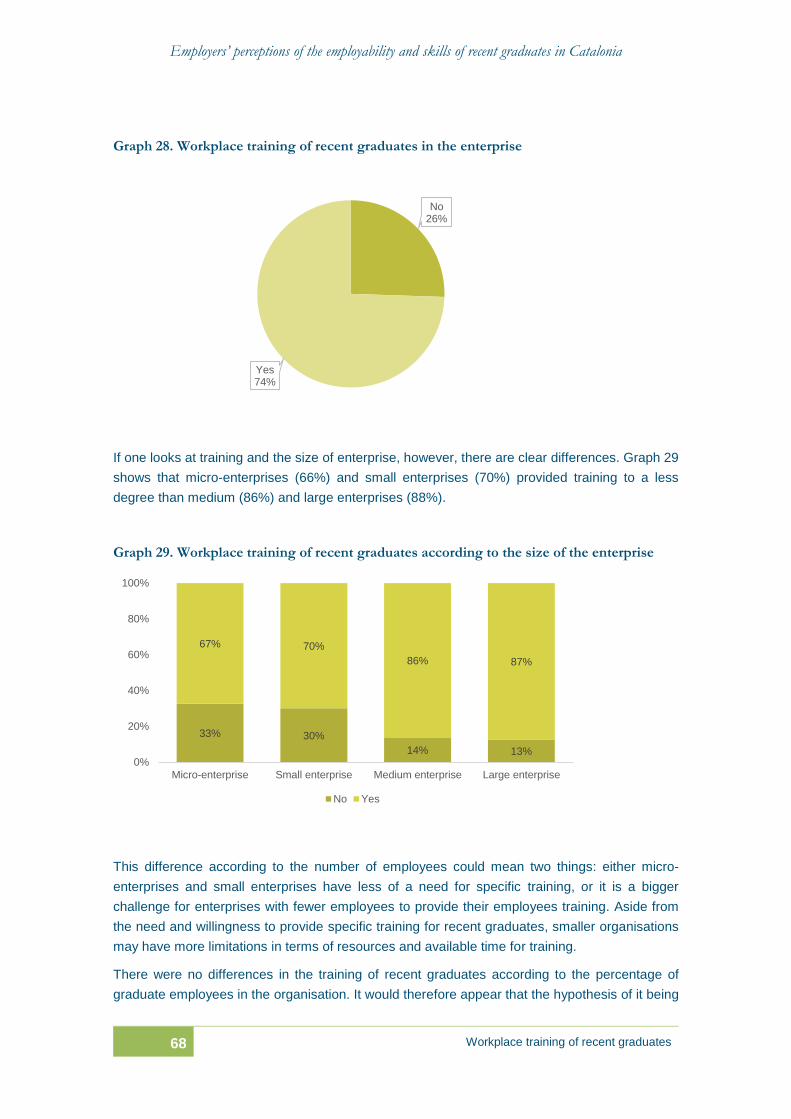
Employers’ perceptions of the employability and skills of recent graduates in Catalonia
68 Workplace training of recent graduates
Graph 28. Workplace training of recent graduates in the enterprise
If one looks at training and the size of enterprise, however, there are clear differences. Graph 29
shows that micro-enterprises (66%) and small enterprises (70%) provided training to a less
degree than medium (86%) and large enterprises (88%).
Graph 29. Workplace training of recent graduates according to the size of the enterprise
This difference according to the number of employees could mean two things: either micro-
enterprises and small enterprises have less of a need for specific training, or it is a bigger
challenge for enterprises with fewer employees to provide their employees training. Aside from
the need and willingness to provide specific training for recent graduates, smaller organisations
may have more limitations in terms of resources and available time for training.
There were no differences in the training of recent graduates according to the percentage of
graduate employees in the organisation. It would therefore appear that the hypothesis of it being
No26%
Yes74%
33% 30%
14% 13%
67% 70%
86% 87%
0%
20%
40%
60%
80%
100%
Micro-enterprise Small enterprise Medium enterprise Large enterprise
No Yes
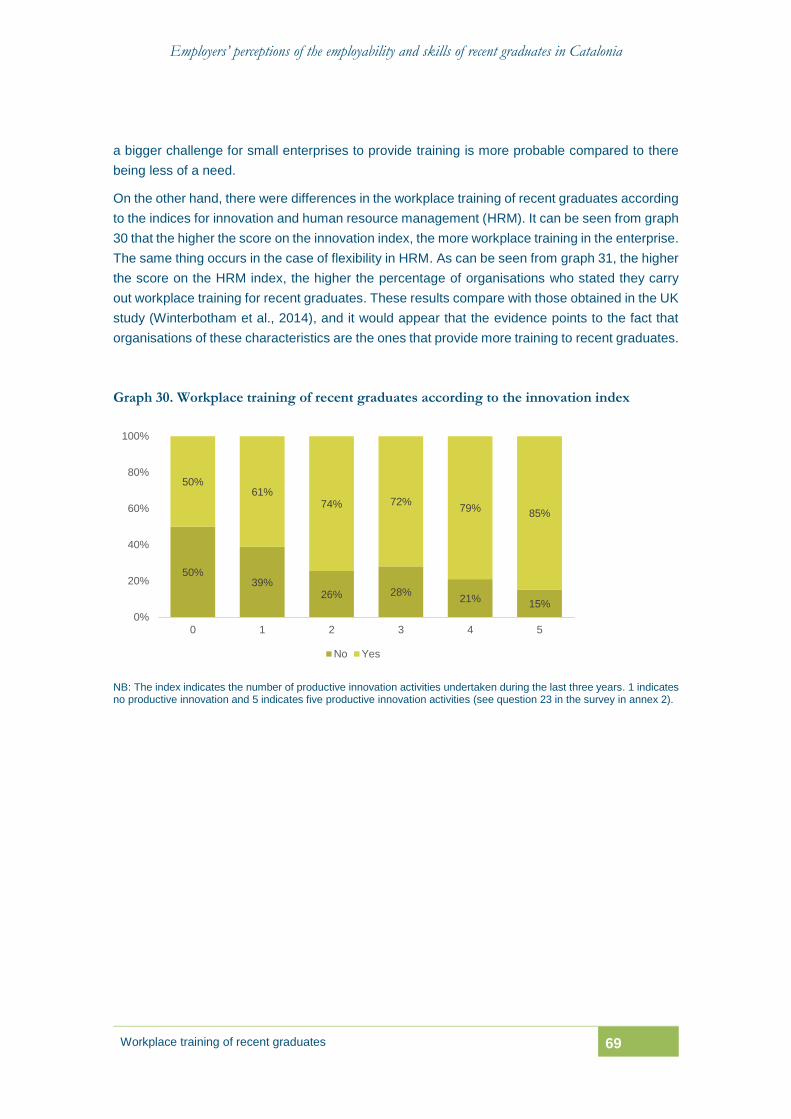
Employers’ perceptions of the employability and skills of recent graduates in Catalonia
Workplace training of recent graduates 69
a bigger challenge for small enterprises to provide training is more probable compared to there
being less of a need.
On the other hand, there were differences in the workplace training of recent graduates according
to the indices for innovation and human resource management (HRM). It can be seen from graph
30 that the higher the score on the innovation index, the more workplace training in the enterprise.
The same thing occurs in the case of flexibility in HRM. As can be seen from graph 31, the higher
the score on the HRM index, the higher the percentage of organisations who stated they carry
out workplace training for recent graduates. These results compare with those obtained in the UK
study (Winterbotham et al., 2014), and it would appear that the evidence points to the fact that
organisations of these characteristics are the ones that provide more training to recent graduates.
Graph 30. Workplace training of recent graduates according to the innovation index
NB: The index indicates the number of productive innovation activities undertaken during the last three years. 1 indicates no productive innovation and 5 indicates five productive innovation activities (see question 23 in the survey in annex 2).
50%39%
26% 28%21%
15%
50%61%
74% 72%79%
85%
0%
20%
40%
60%
80%
100%
0 1 2 3 4 5
No Yes
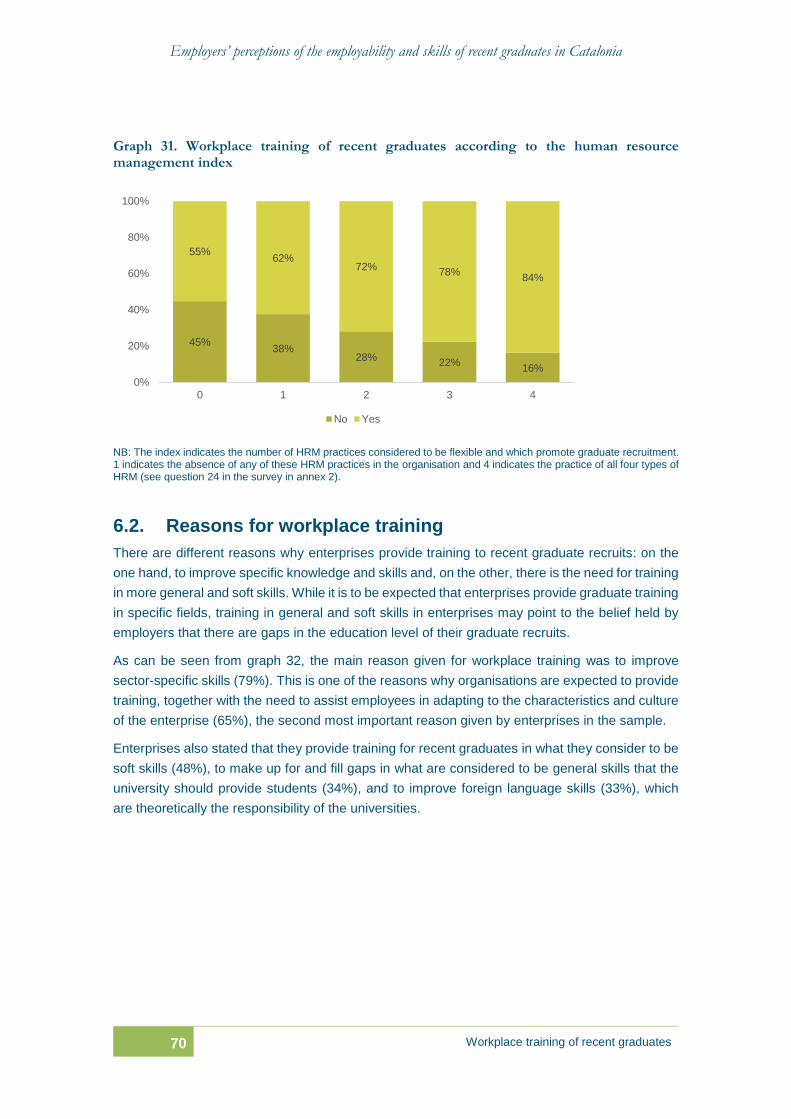
Employers’ perceptions of the employability and skills of recent graduates in Catalonia
70 Workplace training of recent graduates
Graph 31. Workplace training of recent graduates according to the human resource management index
NB: The index indicates the number of HRM practices considered to be flexible and which promote graduate recruitment. 1 indicates the absence of any of these HRM practices in the organisation and 4 indicates the practice of all four types of HRM (see question 24 in the survey in annex 2).
6.2. Reasons for workplace training
There are different reasons why enterprises provide training to recent graduate recruits: on the
one hand, to improve specific knowledge and skills and, on the other, there is the need for training
in more general and soft skills. While it is to be expected that enterprises provide graduate training
in specific fields, training in general and soft skills in enterprises may point to the belief held by
employers that there are gaps in the education level of their graduate recruits.
As can be seen from graph 32, the main reason given for workplace training was to improve
sector-specific skills (79%). This is one of the reasons why organisations are expected to provide
training, together with the need to assist employees in adapting to the characteristics and culture
of the enterprise (65%), the second most important reason given by enterprises in the sample.
Enterprises also stated that they provide training for recent graduates in what they consider to be
soft skills (48%), to make up for and fill gaps in what are considered to be general skills that the
university should provide students (34%), and to improve foreign language skills (33%), which
are theoretically the responsibility of the universities.
45%38%
28%22%
16%
55%62%
72%78%
84%
0%
20%
40%
60%
80%
100%
0 1 2 3 4
No Yes
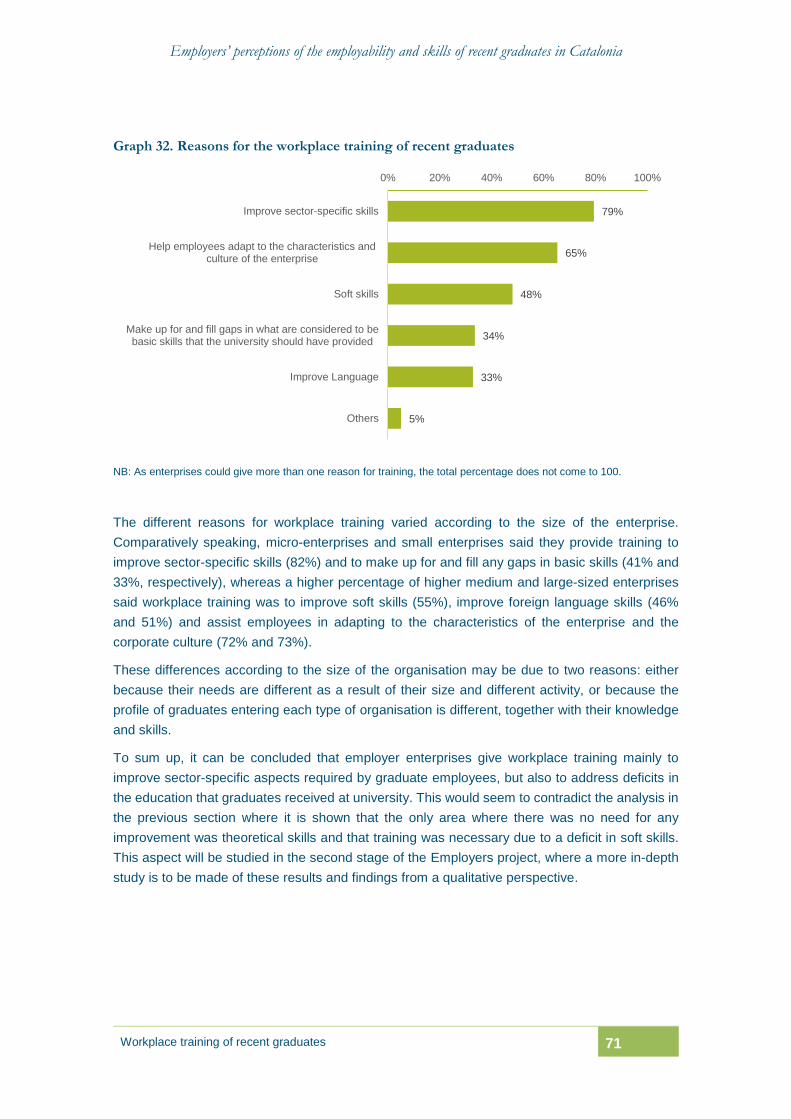
Employers’ perceptions of the employability and skills of recent graduates in Catalonia
Workplace training of recent graduates 71
Graph 32. Reasons for the workplace training of recent graduates
NB: As enterprises could give more than one reason for training, the total percentage does not come to 100.
The different reasons for workplace training varied according to the size of the enterprise.
Comparatively speaking, micro-enterprises and small enterprises said they provide training to
improve sector-specific skills (82%) and to make up for and fill any gaps in basic skills (41% and
33%, respectively), whereas a higher percentage of higher medium and large-sized enterprises
said workplace training was to improve soft skills (55%), improve foreign language skills (46%
and 51%) and assist employees in adapting to the characteristics of the enterprise and the
corporate culture (72% and 73%).
These differences according to the size of the organisation may be due to two reasons: either
because their needs are different as a result of their size and different activity, or because the
profile of graduates entering each type of organisation is different, together with their knowledge
and skills.
To sum up, it can be concluded that employer enterprises give workplace training mainly to
improve sector-specific aspects required by graduate employees, but also to address deficits in
the education that graduates received at university. This would seem to contradict the analysis in
the previous section where it is shown that the only area where there was no need for any
improvement was theoretical skills and that training was necessary due to a deficit in soft skills.
This aspect will be studied in the second stage of the Employers project, where a more in-depth
study is to be made of these results and findings from a qualitative perspective.
79%
65%
48%
34%
33%
5%
0% 20% 40% 60% 80% 100%
Improve sector-specific skills
Help employees adapt to the characteristics andculture of the enterprise
Soft skills
Make up for and fill gaps in what are considered to bebasic skills that the university should have provided
Improve Language
Others
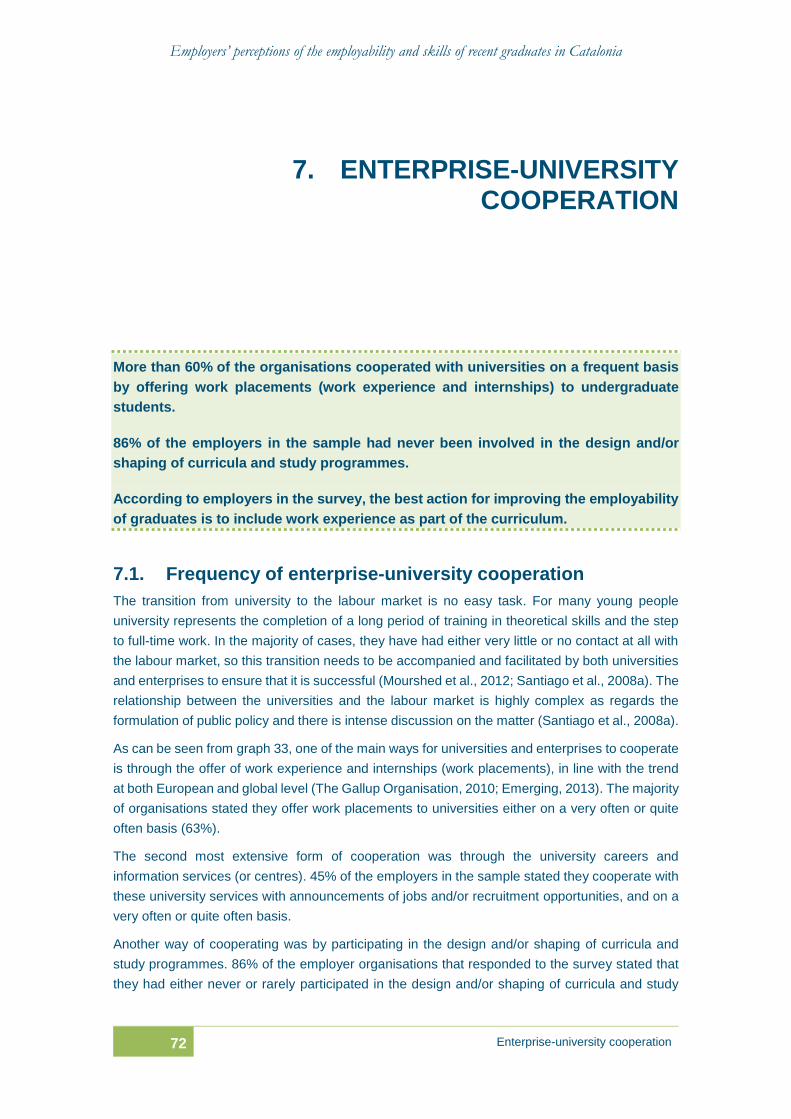
Employers’ perceptions of the employability and skills of recent graduates in Catalonia
72 Enterprise-university cooperation
7. ENTERPRISE-UNIVERSITY COOPERATION
More than 60% of the organisations cooperated with universities on a frequent basis
by offering work placements (work experience and internships) to undergraduate
students.
86% of the employers in the sample had never been involved in the design and/or
shaping of curricula and study programmes.
According to employers in the survey, the best action for improving the employability
of graduates is to include work experience as part of the curriculum.
7.1. Frequency of enterprise-university cooperation
The transition from university to the labour market is no easy task. For many young people
university represents the completion of a long period of training in theoretical skills and the step
to full-time work. In the majority of cases, they have had either very little or no contact at all with
the labour market, so this transition needs to be accompanied and facilitated by both universities
and enterprises to ensure that it is successful (Mourshed et al., 2012; Santiago et al., 2008a). The
relationship between the universities and the labour market is highly complex as regards the
formulation of public policy and there is intense discussion on the matter (Santiago et al., 2008a).
As can be seen from graph 33, one of the main ways for universities and enterprises to cooperate
is through the offer of work experience and internships (work placements), in line with the trend
at both European and global level (The Gallup Organisation, 2010; Emerging, 2013). The majority
of organisations stated they offer work placements to universities either on a very often or quite
often basis (63%).
The second most extensive form of cooperation was through the university careers and
information services (or centres). 45% of the employers in the sample stated they cooperate with
these university services with announcements of jobs and/or recruitment opportunities, and on a
very often or quite often basis.
Another way of cooperating was by participating in the design and/or shaping of curricula and
study programmes. 86% of the employer organisations that responded to the survey stated that
they had either never or rarely participated in the design and/or shaping of curricula and study
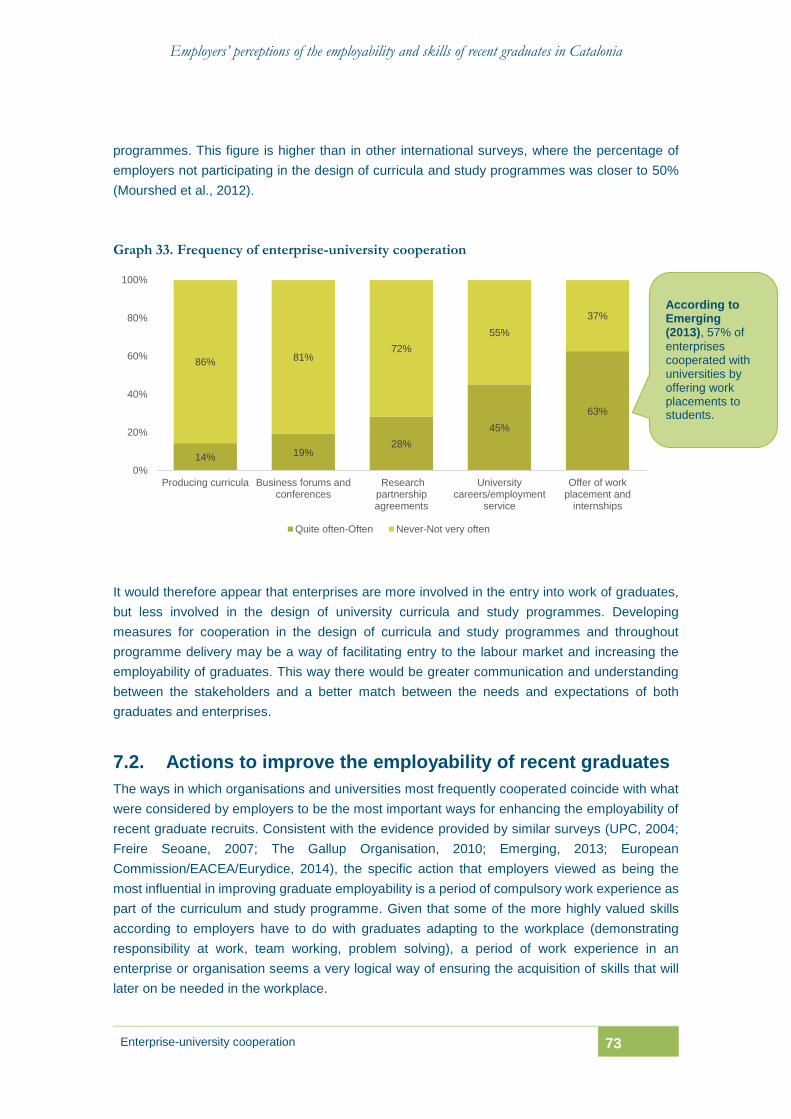
Employers’ perceptions of the employability and skills of recent graduates in Catalonia
Enterprise-university cooperation 73
programmes. This figure is higher than in other international surveys, where the percentage of
employers not participating in the design of curricula and study programmes was closer to 50%
(Mourshed et al., 2012).
Graph 33. Frequency of enterprise-university cooperation
It would therefore appear that enterprises are more involved in the entry into work of graduates,
but less involved in the design of university curricula and study programmes. Developing
measures for cooperation in the design of curricula and study programmes and throughout
programme delivery may be a way of facilitating entry to the labour market and increasing the
employability of graduates. This way there would be greater communication and understanding
between the stakeholders and a better match between the needs and expectations of both
graduates and enterprises.
7.2. Actions to improve the employability of recent graduates
The ways in which organisations and universities most frequently cooperated coincide with what
were considered by employers to be the most important ways for enhancing the employability of
recent graduate recruits. Consistent with the evidence provided by similar surveys (UPC, 2004;
Freire Seoane, 2007; The Gallup Organisation, 2010; Emerging, 2013; European
Commission/EACEA/Eurydice, 2014), the specific action that employers viewed as being the
most influential in improving graduate employability is a period of compulsory work experience as
part of the curriculum and study programme. Given that some of the more highly valued skills
according to employers have to do with graduates adapting to the workplace (demonstrating
responsibility at work, team working, problem solving), a period of work experience in an
enterprise or organisation seems a very logical way of ensuring the acquisition of skills that will
later on be needed in the workplace.
14% 19%28%
45%
63%
86% 81%72%
55%
37%
0%
20%
40%
60%
80%
100%
Producing curricula Business forums andconferences
Researchpartnershipagreements
Universitycareers/employment
service
Offer of workplacement and
internships
Quite often-Often Never-Not very often
According to Emerging (2013), 57% of
enterprises cooperated with universities by offering work placements to students.
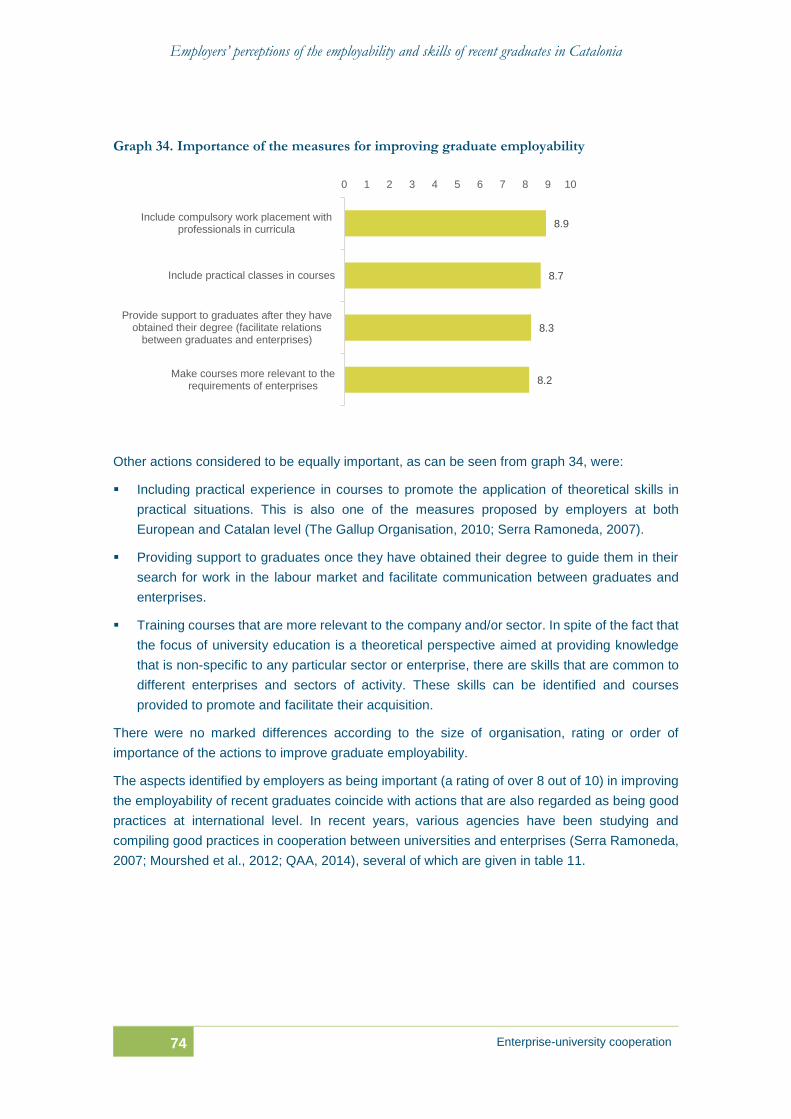
Employers’ perceptions of the employability and skills of recent graduates in Catalonia
74 Enterprise-university cooperation
Graph 34. Importance of the measures for improving graduate employability
Other actions considered to be equally important, as can be seen from graph 34, were:
Including practical experience in courses to promote the application of theoretical skills in
practical situations. This is also one of the measures proposed by employers at both
European and Catalan level (The Gallup Organisation, 2010; Serra Ramoneda, 2007).
Providing support to graduates once they have obtained their degree to guide them in their
search for work in the labour market and facilitate communication between graduates and
enterprises.
Training courses that are more relevant to the company and/or sector. In spite of the fact that
the focus of university education is a theoretical perspective aimed at providing knowledge
that is non-specific to any particular sector or enterprise, there are skills that are common to
different enterprises and sectors of activity. These skills can be identified and courses
provided to promote and facilitate their acquisition.
There were no marked differences according to the size of organisation, rating or order of
importance of the actions to improve graduate employability.
The aspects identified by employers as being important (a rating of over 8 out of 10) in improving
the employability of recent graduates coincide with actions that are also regarded as being good
practices at international level. In recent years, various agencies have been studying and
compiling good practices in cooperation between universities and enterprises (Serra Ramoneda,
2007; Mourshed et al., 2012; QAA, 2014), several of which are given in table 11.
8.9
8.7
8.3
8.2
Include compulsory work placement withprofessionals in curricula
Include practical classes in courses
Provide support to graduates after they haveobtained their degree (facilitate relations
between graduates and enterprises)
Make courses more relevant to therequirements of enterprises
0 1 2 3 4 5 6 7 8 9 10
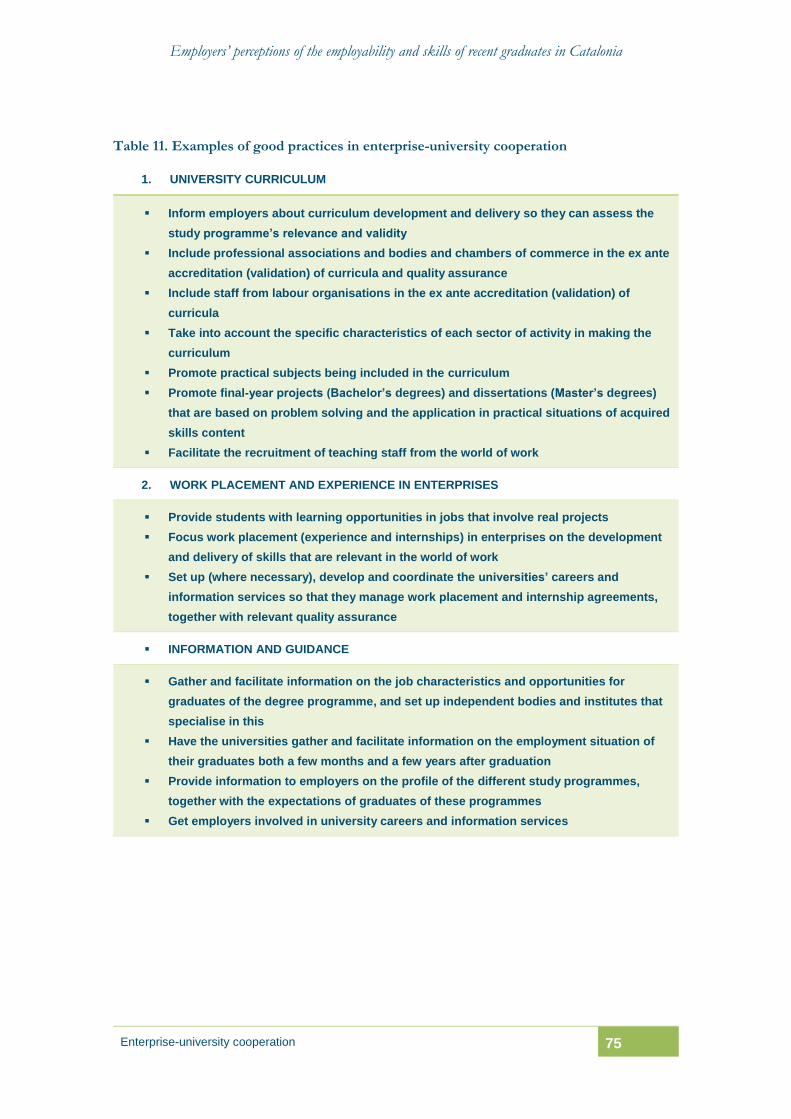
Employers’ perceptions of the employability and skills of recent graduates in Catalonia
Enterprise-university cooperation 75
Table 11. Examples of good practices in enterprise-university cooperation
1. UNIVERSITY CURRICULUM
Inform employers about curriculum development and delivery so they can assess the
study programme’s relevance and validity
Include professional associations and bodies and chambers of commerce in the ex ante
accreditation (validation) of curricula and quality assurance
Include staff from labour organisations in the ex ante accreditation (validation) of
curricula
Take into account the specific characteristics of each sector of activity in making the
curriculum
Promote practical subjects being included in the curriculum
Promote final-year projects (Bachelor’s degrees) and dissertations (Master’s degrees)
that are based on problem solving and the application in practical situations of acquired
skills content
Facilitate the recruitment of teaching staff from the world of work
2. WORK PLACEMENT AND EXPERIENCE IN ENTERPRISES
Provide students with learning opportunities in jobs that involve real projects
Focus work placement (experience and internships) in enterprises on the development
and delivery of skills that are relevant in the world of work
Set up (where necessary), develop and coordinate the universities’ careers and
information services so that they manage work placement and internship agreements,
together with relevant quality assurance
INFORMATION AND GUIDANCE
Gather and facilitate information on the job characteristics and opportunities for
graduates of the degree programme, and set up independent bodies and institutes that
specialise in this
Have the universities gather and facilitate information on the employment situation of
their graduates both a few months and a few years after graduation
Provide information to employers on the profile of the different study programmes,
together with the expectations of graduates of these programmes
Get employers involved in university careers and information services
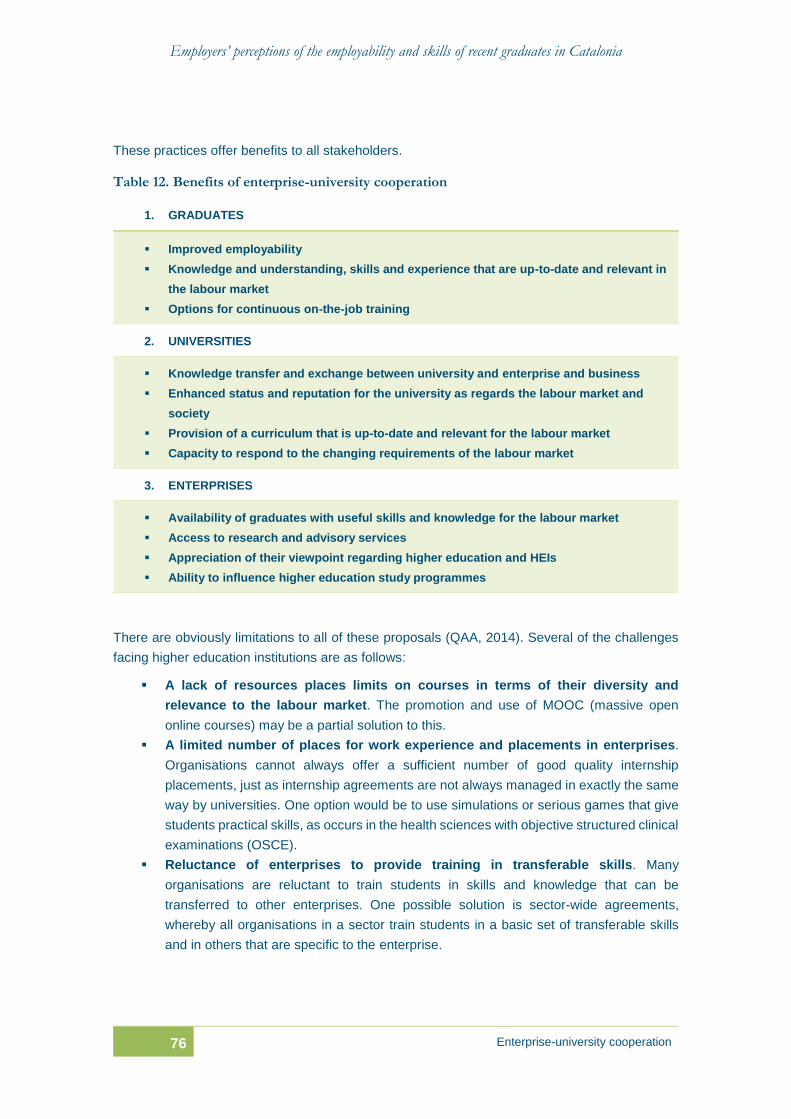
Employers’ perceptions of the employability and skills of recent graduates in Catalonia
76 Enterprise-university cooperation
These practices offer benefits to all stakeholders.
Table 12. Benefits of enterprise-university cooperation
1. GRADUATES
Improved employability
Knowledge and understanding, skills and experience that are up-to-date and relevant in
the labour market
Options for continuous on-the-job training
2. UNIVERSITIES
Knowledge transfer and exchange between university and enterprise and business
Enhanced status and reputation for the university as regards the labour market and
society
Provision of a curriculum that is up-to-date and relevant for the labour market
Capacity to respond to the changing requirements of the labour market
3. ENTERPRISES
Availability of graduates with useful skills and knowledge for the labour market
Access to research and advisory services
Appreciation of their viewpoint regarding higher education and HEIs
Ability to influence higher education study programmes
There are obviously limitations to all of these proposals (QAA, 2014). Several of the challenges
facing higher education institutions are as follows:
A lack of resources places limits on courses in terms of their diversity and
relevance to the labour market. The promotion and use of MOOC (massive open
online courses) may be a partial solution to this.
A limited number of places for work experience and placements in enterprises.
Organisations cannot always offer a sufficient number of good quality internship
placements, just as internship agreements are not always managed in exactly the same
way by universities. One option would be to use simulations or serious games that give
students practical skills, as occurs in the health sciences with objective structured clinical
examinations (OSCE).
Reluctance of enterprises to provide training in transferable skills. Many
organisations are reluctant to train students in skills and knowledge that can be
transferred to other enterprises. One possible solution is sector-wide agreements,
whereby all organisations in a sector train students in a basic set of transferable skills
and in others that are specific to the enterprise.
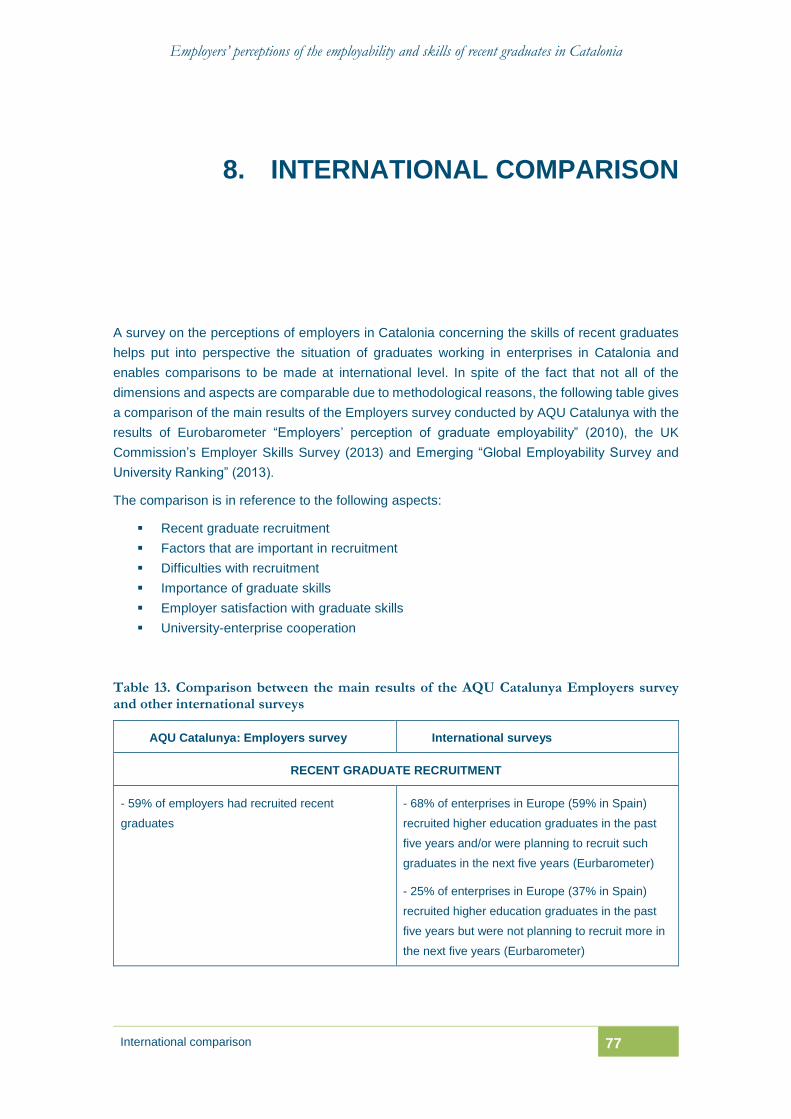
Employers’ perceptions of the employability and skills of recent graduates in Catalonia
International comparison 77
8. INTERNATIONAL COMPARISON
A survey on the perceptions of employers in Catalonia concerning the skills of recent graduates
helps put into perspective the situation of graduates working in enterprises in Catalonia and
enables comparisons to be made at international level. In spite of the fact that not all of the
dimensions and aspects are comparable due to methodological reasons, the following table gives
a comparison of the main results of the Employers survey conducted by AQU Catalunya with the
results of Eurobarometer “Employers’ perception of graduate employability” (2010), the UK
Commission’s Employer Skills Survey (2013) and Emerging “Global Employability Survey and
University Ranking” (2013).
The comparison is in reference to the following aspects:
Recent graduate recruitment
Factors that are important in recruitment
Difficulties with recruitment
Importance of graduate skills
Employer satisfaction with graduate skills
University-enterprise cooperation
Table 13. Comparison between the main results of the AQU Catalunya Employers survey and other international surveys
AQU Catalunya: Employers survey International surveys
RECENT GRADUATE RECRUITMENT
- 59% of employers had recruited recent
graduates
- 68% of enterprises in Europe (59% in Spain)
recruited higher education graduates in the past
five years and/or were planning to recruit such
graduates in the next five years (Eurbarometer)
- 25% of enterprises in Europe (37% in Spain)
recruited higher education graduates in the past
five years but were not planning to recruit more in
the next five years (Eurbarometer)
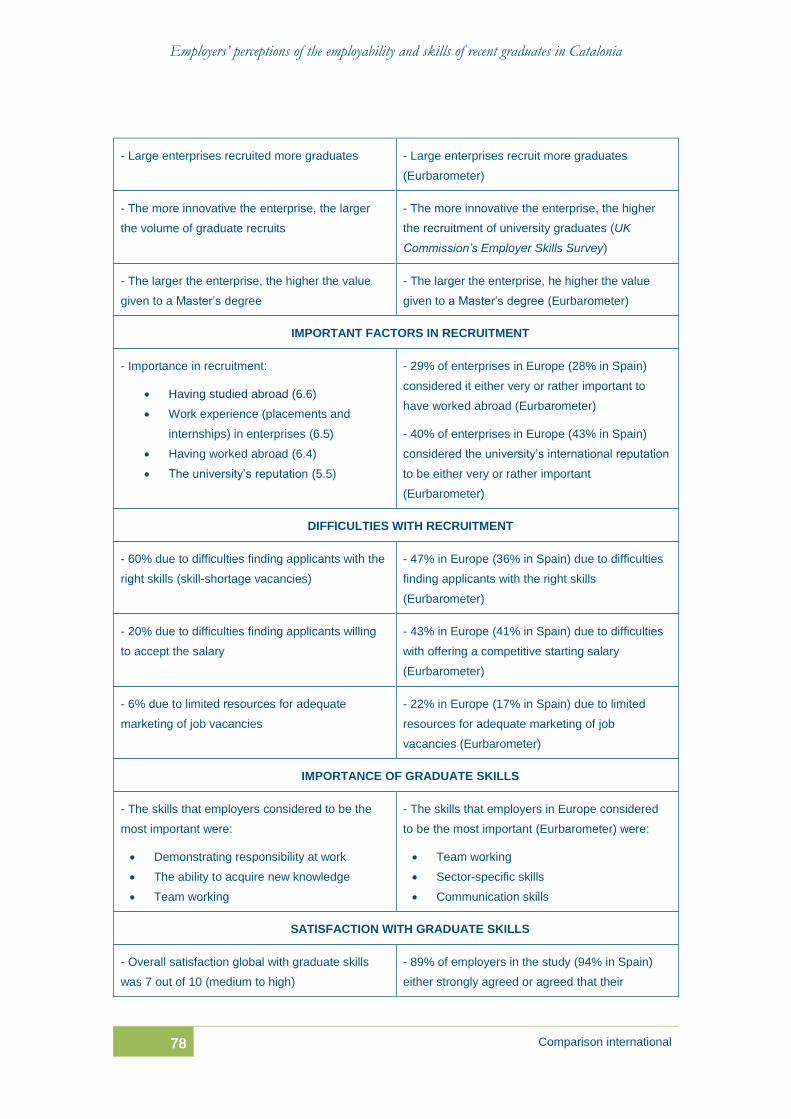
Employers’ perceptions of the employability and skills of recent graduates in Catalonia
78 Comparison international
- Large enterprises recruited more graduates - Large enterprises recruit more graduates
(Eurbarometer)
- The more innovative the enterprise, the larger
the volume of graduate recruits
- The more innovative the enterprise, the higher
the recruitment of university graduates (UK
Commission’s Employer Skills Survey)
- The larger the enterprise, the higher the value
given to a Master’s degree
- The larger the enterprise, he higher the value
given to a Master’s degree (Eurbarometer)
IMPORTANT FACTORS IN RECRUITMENT
- Importance in recruitment:
Having studied abroad (6.6)
Work experience (placements and
internships) in enterprises (6.5)
Having worked abroad (6.4)
The university’s reputation (5.5)
- 29% of enterprises in Europe (28% in Spain)
considered it either very or rather important to
have worked abroad (Eurbarometer)
- 40% of enterprises in Europe (43% in Spain)
considered the university’s international reputation
to be either very or rather important
(Eurbarometer)
DIFFICULTIES WITH RECRUITMENT
- 60% due to difficulties finding applicants with the
right skills (skill-shortage vacancies)
- 47% in Europe (36% in Spain) due to difficulties
finding applicants with the right skills
(Eurbarometer)
- 20% due to difficulties finding applicants willing
to accept the salary
- 43% in Europe (41% in Spain) due to difficulties
with offering a competitive starting salary
(Eurbarometer)
- 6% due to limited resources for adequate
marketing of job vacancies
- 22% in Europe (17% in Spain) due to limited
resources for adequate marketing of job
vacancies (Eurbarometer)
IMPORTANCE OF GRADUATE SKILLS
- The skills that employers considered to be the
most important were:
Demonstrating responsibility at work
The ability to acquire new knowledge
Team working
- The skills that employers in Europe considered
to be the most important (Eurbarometer) were:
Team working
Sector-specific skills
Communication skills
SATISFACTION WITH GRADUATE SKILLS
- Overall satisfaction global with graduate skills
was 7 out of 10 (medium to high)
- 89% of employers in the study (94% in Spain)
either strongly agreed or agreed that their
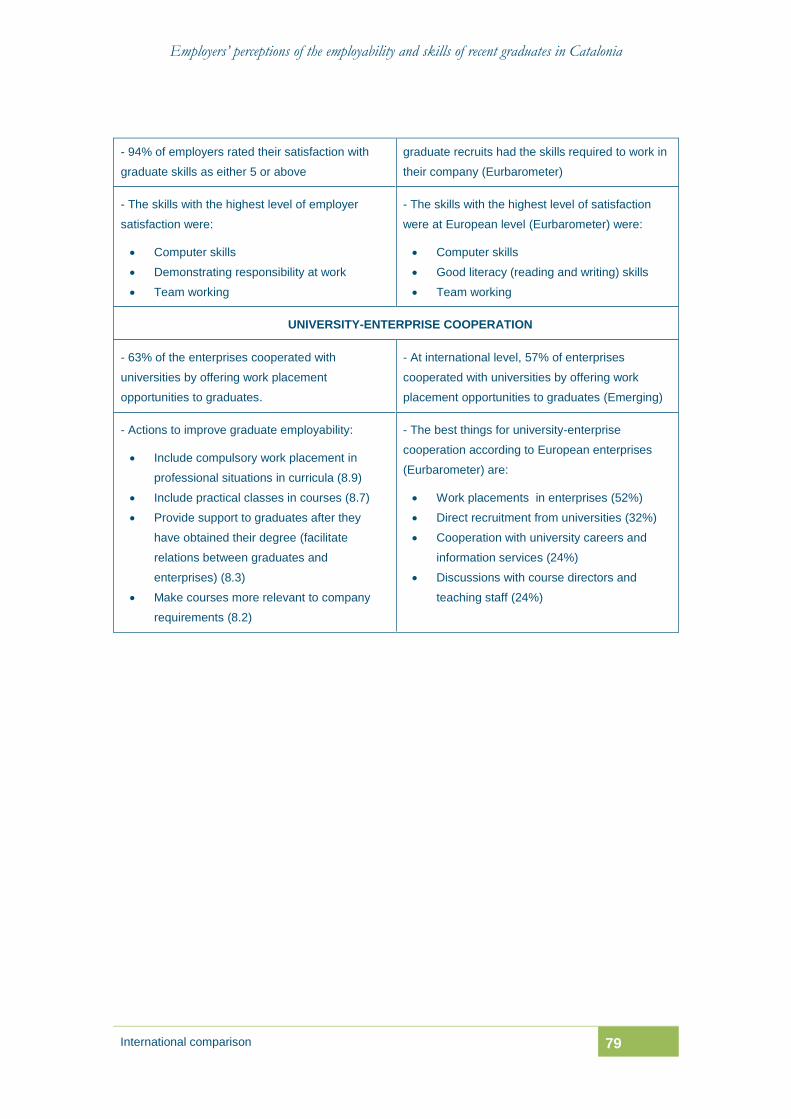
Employers’ perceptions of the employability and skills of recent graduates in Catalonia
International comparison 79
- 94% of employers rated their satisfaction with
graduate skills as either 5 or above
graduate recruits had the skills required to work in
their company (Eurbarometer)
- The skills with the highest level of employer
satisfaction were:
Computer skills
Demonstrating responsibility at work
Team working
- The skills with the highest level of satisfaction
were at European level (Eurbarometer) were:
Computer skills
Good literacy (reading and writing) skills
Team working
UNIVERSITY-ENTERPRISE COOPERATION
- 63% of the enterprises cooperated with
universities by offering work placement
opportunities to graduates.
- At international level, 57% of enterprises
cooperated with universities by offering work
placement opportunities to graduates (Emerging)
- Actions to improve graduate employability:
Include compulsory work placement in
professional situations in curricula (8.9)
Include practical classes in courses (8.7)
Provide support to graduates after they
have obtained their degree (facilitate
relations between graduates and
enterprises) (8.3)
Make courses more relevant to company
requirements (8.2)
- The best things for university-enterprise
cooperation according to European enterprises
(Eurbarometer) are:
Work placements in enterprises (52%)
Direct recruitment from universities (32%)
Cooperation with university careers and
information services (24%)
Discussions with course directors and
teaching staff (24%)

Employers’ perceptions of the employability and skills of recent graduates in Catalonia
Conclusions 81
9. CONCLUSIONS
The Employers project was designed to complement and provide additional evidence to that
provided by the AQU Catalunya surveys (graduate employment outcomes) on the skills of higher
education graduates in Catalonia. The aim of this study was to provide information on the views
of employers in Catalonia on the skills and education level of recent university graduates in order
to gain insight into the actual situation of both employers and graduates.
The results and findings of the survey reveal a series of strengths and weaknesses in recent
graduate employability that can be used as a basis for discussion and analysis of the development
of policies to improve and enhance programme curricula, as well as the relationship between the
universities and the labour market in Catalonia.
The good news from the survey is that the employers in the sample were satisfied with the skills
of recent graduates, which they rated from medium to high (7 out of 10). This information can
therefore be regarded as being a good sign of the level of education provided by Catalan
universities.
There is however always scope for improvement. The most noteworthy findings provided by this
survey on graduate employability are:
Recent graduate recruitment. Organisations recruiting more recent graduates were
typically large enterprises (more than 250 employees), where more than 60% of their
employees had a university degree and they were innovative organisations.
Enhancement actions Facilitate the recruitment of recent graduates by this
type of organisation, promote the entrepreneurship of enterprises with added
value and promote contacts between graduates and this type of organisation
(business forums, Work placement in enterprises, etc.).
Difficulties with recruitment. A high proportion of enterprises stated that they had
difficulties with recruitment due to the shortage of candidates with the right skills and the
shortage of graduates in a given field.
Enhancement actions Disseminate the university-level Qualifications
Framework among employers and establish links between the universities’
careers and information services and organisations having more difficulties with
recruitment.
Foreign language skills. The importance of and satisfaction with foreign language skills
varied according to the sector of activity and the size of enterprise.
Employers’ perceptions of the employability and skills of recent graduates in Catalonia
82 Conclusions
Enhancement action Assess improvements in foreign language learning in
degree programmes for which this skill is considered to be of greater importance
in the labour market.
Problem solving and practical skills. Problem solving and practical skills are where there
was the greatest scope for improvement as far as the employers in the AQU survey are
concerned.
Enhancement action Introduce compulsory work placement experience in in
the curriculum, and introduce courses with a more practical slant and that are
aimed at the labour market.
Workplace training in basic skills. One of the stated reasons for offering workplace
training was to make up for and fill gaps in what are considered to be basic skills that the
university should have provided students.
Enhancement action Include employers in discussing and shaping curricula
so that their views regarding the basic skills that students need to have acquired
on completion of their university studies can be taken into consideration.
The surveys at international level highlight two characteristics common to all of the successful
initiatives and programmes for enhancing graduate employability through university-enterprise
cooperation (Santiago et al., 2008a; Mourshed et al., 2012; QAA, 2014):
Close university-enterprise cooperation. Universities and enterprises work together
instead of having separate spheres of activity, and without barriers between the spheres
of activity within each organisation.
University-enterprise cooperation in the entire process. University-enterprise cooperation
begins from the moment that students have to choose what degree they are going to take
through to their transition to the labour market. Cooperation and collaboration need to
cover the entire period spanning the education and entry into the labour market of young
graduates, and not just the moment when they make the step from university to the labour
market.
Most countries do not have any such system for cooperation at the present time (Santiago et al.,
2008a). In order to establish one, a series of changes need to be made to facilitate coordination
of the information provided by students, universities, enterprises and labour organisations.
Broadly speaking, international experience in various different countries has shown that a series
of joint actions helps to improve the relation between higher education and the labour market
(Santiago et al., 2008a):
Coordination of education and labour policies. The transition from university to the labour
market implies the involvement of both education and the workplace. These two spheres
are often either cut off from each other at policy level or do not cooperate as much as
they could.
Employers’ perceptions of the employability and skills of recent graduates in Catalonia
Conclusions 83
Guidance for students, universities and enterprises. Over the entire period spanning the
education and entry into the labour market of young graduates, many decisions
(regarding, for example, which degree course, what kind of job, how to best design a
curriculum, or in the selection of employees) are made on the basis of a lack of complete
understanding and/or information by the different actors. Evidence-based guidance can
greatly improve and enhance the end result of decisions and actions taken.
Enhance the relevance of the Qualifications Framework. This can be of help to both
students and enterprises in dispelling doubts and having realistic expectations about what
can be expected from a given study programme or type of training. Disseminating this
tool and promoting its use can also facilitate decision-making.
Lifelong learning. The learning process does not come to an end when students graduate,
and rapid changes in market requirements increasingly call for continuous education and
further training. The university can take part in this by making timetables more flexible
and offering courses and training that are more employability-based and cater to different
student profiles, aside from the young full-time student. Cooperation with enterprises and
the fact that graduates are familiar with the university can facilitate the development and
delivery of on-campus employability training courses. Organisations will, in turn, also
need to continue to train their employees in skills that are specific to the enterprise
(sector-specific skills).
Response to labour market needs. Up-to-date information according to the different
sectors is important for keeping up with the needs of the labour market. A rapid response
to these needs is possible through the use of a coordination system whereby coordinators
and managers of relevant degree courses can connect with the information from different
branches of economic activity.
Information on good practices. The gathering and dissemination of good practices on all
levels (local area, in Catalonia, in Spain and at international level) would help to provide
ideas and keep up to date with the latest trends and developments so good practices can
be adapted and introduced.

Employers’ perceptions of the employability and skills of recent graduates in Catalonia
Bibliography 85
10. BIBLIOGRAPHY
ACNIELSEN RESEARCH SERVICES (2000) Employer Satisfaction with Graduate Skills: Research
Report (February).
ALLEN, J.; VAN DER VELDEN, R. (2005) "The Role of Self-Assessment in Measuring Skills". A:
REFLEX Working Paper, March, pp. 1-24.
<http://www.fdewb.unimaas.nl/roa/reflex/publicationspublic.htm>.
ANECA (2004) Las empresas y la inserción laboral de los universitarios. Madrid: Agencia
Nacional de Evaluación de la Calidad y Acreditación.
AQU CATALUNYA (2014) Universities and employment in Catalonia 2014. Barcelona: Agència
per a la Qualitat del Sistema Universitari de Catalunya.
CEDEFOP (2008) Future skill needs in Europe. Medium-term forecast. Office for Official
Publications of the European Communities.
CEDEFOP (2013) User guide to developing an employer survey on skill needs. Publications
Office of the European Union.
EUROPEAN COMMISSION/EACEA/EURYDICE (2014) Modernisation of Higher Education in Europe.
Access, Retention and Employability. Luxembourg: Eurydice Report.
<http://doi.org/10.2797/72146>.
CONSEIL D’ORIENTATION POUR L’EMPLOI (2013) Emplois durablement vacants et difficultés de
recrutement. COE.
EMERGING (2013) "Global Employability Survey and University Ranking 2013". A: Emerging,
Révéler les talents.
EUROPEAN COMMISSION (2012) Rethinking Education: Investing in skills for better socio-
economic outcomes. European Commission.
FIGUERAS MORENO, M. M. (2013) Model de competències personals per a l’empleabilitat
internacional dels alumnes de postgrau. Universitat Rovira i Virgili.
FREIRE SEOANE, M. J. (2007) Competencias profesionales de los universitarios. Consello Social
Universidade da Coruña, Universidade da Coruña.
FREIRE SEOANE, M. J., TEIJEIRO ÁLVAREZ, M. M., PAIS MONTES, C. (2011) "La adecuación entre
las competencias adquiridas por los graduados y las requeridas por los empresarios". A:
Revista de Educación, 362, pp. 13-41. http://doi.org/10.4438/1988-592X-RE-2011-362-151
Employers’ perceptions of the employability and skills of recent graduates in Catalonia
86 Bibliography
GARCÍA GARCÍA, L. A. (2007) ¿Qué demandan las empresas de los titulados universitarios?
Análisis desde la perspectiva del empresariado tinerfeño sobre el proceso de selección de
jóvenes titulados universitarios y las características competenciales de estos. Fundación
Canaria Empresa, Universidad de La Laguna.
IFF RESEARCH (2014) UK Commission’s Employer Skills Survey 2013: Technical Report. UK
Comission for Employment and Skills.
MOURSHED, M.; FARRELL, D.; BARTON, D. (2012) Education to employment: Designing a system
that works. McKinsey Center for Government.
MOURSHED, M.; PATEL, J.; SUDER, K. (2013) Education to employment: Getting Europe’s Youth
into Work. McKinsey Center for Government.
OBSERVATORI OCUPACIONAL UNIVERSITAT JAUME I (2005) Enquesta a ocupadors 2005. Entitats
de l’entorn de la Universitat Jaume I ocupadores de titulats universitaris. Oficina de Cooperació
Internacional i Educativa Universitat Jaume I.
OBSERVATORI DEL MERCAT DE TREBALL (2008) La opinión de los empleadores y de las personas
tituladas sobre el mercado de trabajo politécnico. Oficina d’Orientació i Inserció Laboral,
Associació d’Amics de la UPC.
OECD (2012) Better Skills Better Jobs Better Lives. A strategic approach to skills policies. Paris:
OECD Publishing.
OECD (2014) Education at a Glance 2014. OECD Indicators. Education. Paris: OECD
Publishing. <http://doi.org/10.1787/eag-2013-en>.
PWC (2015) The World in 2050. Will the shift in global economic power continue? PWC
Contents.
QAA (2010) Employer-responsive provision survey. A reflective report. The Quality Assurance
Agency for Higher Education.
QAA (2014) Employer Engagement. Emerging Practice from QAA Reviews Summary. The
Quality Assurance Agency for Higher Education.
ROYAL SOCIETY (2010) The Scientific Century. Securing our future prosperity. The Royal Society
Science Policy Centre.
SANTIAGO, P.; TREMBLAY, K.; BASRI, E.; ARNAL, E. (2008a) Tertiary Education for the Knowledge
Society (vol. 2: Special features: Equity, Innovation, Labour Market, Internationalisation). Paris:
OECD Publishing. http://doi.org/10.1787/9789264046535-en
SANTIAGO, P.; TREMBLAY, K.; BASRI, E.; ARNAL, E. (2008b) Tertiary Education for the Knowledge
Society (vol. 1: Special features: Governance, Funding, Quality). Paris: OECD Publishing.
http://doi.org/10.1787/9789264063518-hu
SERRA RAMONEDA, A. (2007) Educació superior i treball a Catalunya: anàlisi dels factors
d’inserció laboral. Barcelona: Agència per a la Qualitat del Sistema Universitari de Catalunya.
Employers’ perceptions of the employability and skills of recent graduates in Catalonia
Bibliography 87
THE GALLUP ORGANISATION (2010) Employers’ perception of graduate employability. Analytical
report. European Commission.
UNIVERSITY OF SOUTH WALES (2014) The Future of Work: Jobs and skills in 2030. UKCES.
UPC (2004) Observatorio de las Empresas 2003-2004. Oficina d’Orientació i Inserció Laboral,
Associació d’Amics de la UPC.
VICERRECTORADO DE EMPLEO DE LA UPV (2004) Los titulados de la Universidad Politécnica de
Valencia y los empleadores. València: Universitat Politècnica de València.
WINTERBOTHAM, M.; VIVIAN, D.; SHURY, J.; DAVIES, B.; KIK, G. (2014) UK Commission’s Employer
Skills Survey 2013: UK Results. UK Comission for Employment and Skills.

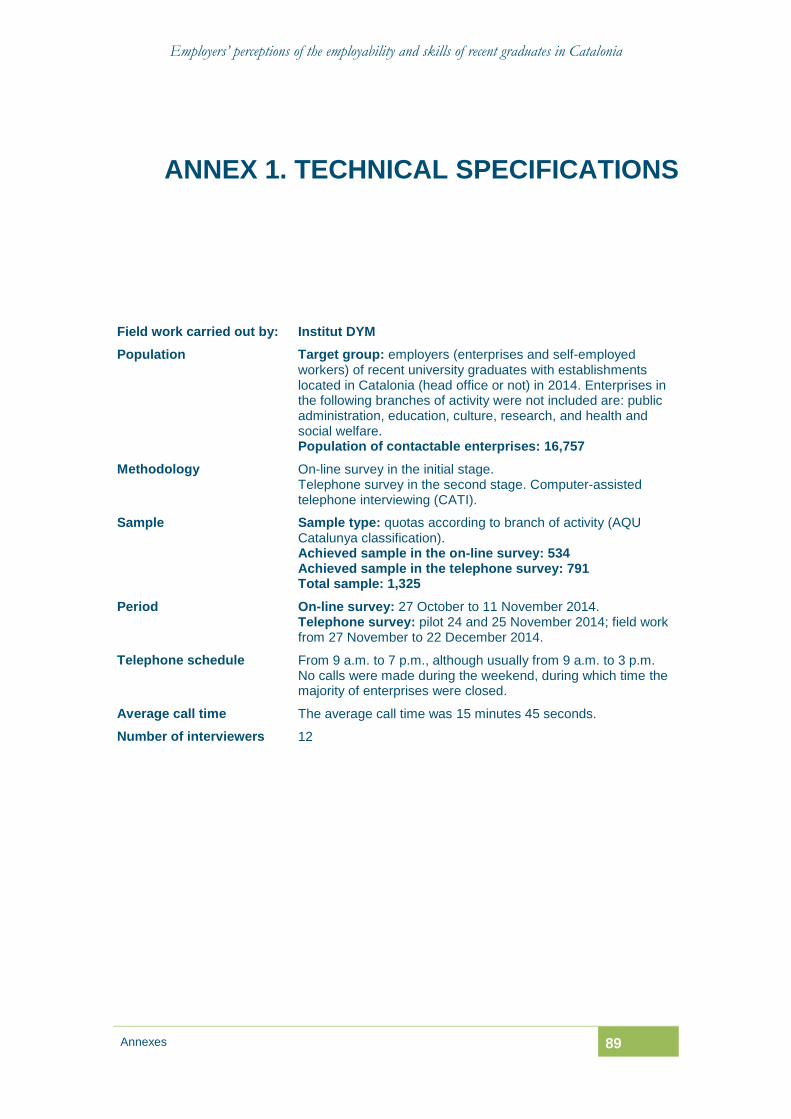
Employers’ perceptions of the employability and skills of recent graduates in Catalonia
Annexes 89
ANNEX 1. TECHNICAL SPECIFICATIONS
Field work carried out by: Institut DYM
Population Target group: employers (enterprises and self-employed workers) of recent university graduates with establishments located in Catalonia (head office or not) in 2014. Enterprises in the following branches of activity were not included are: public administration, education, culture, research, and health and social welfare. Population of contactable enterprises: 16,757
Methodology On-line survey in the initial stage. Telephone survey in the second stage. Computer-assisted telephone interviewing (CATI).
Sample Sample type: quotas according to branch of activity (AQU Catalunya classification). Achieved sample in the on-line survey: 534 Achieved sample in the telephone survey: 791 Total sample: 1,325
Period On-line survey: 27 October to 11 November 2014. Telephone survey: pilot 24 and 25 November 2014; field work from 27 November to 22 December 2014.
Telephone schedule From 9 a.m. to 7 p.m., although usually from 9 a.m. to 3 p.m. No calls were made during the weekend, during which time the majority of enterprises were closed.
Average call time The average call time was 15 minutes 45 seconds.
Number of interviewers 12
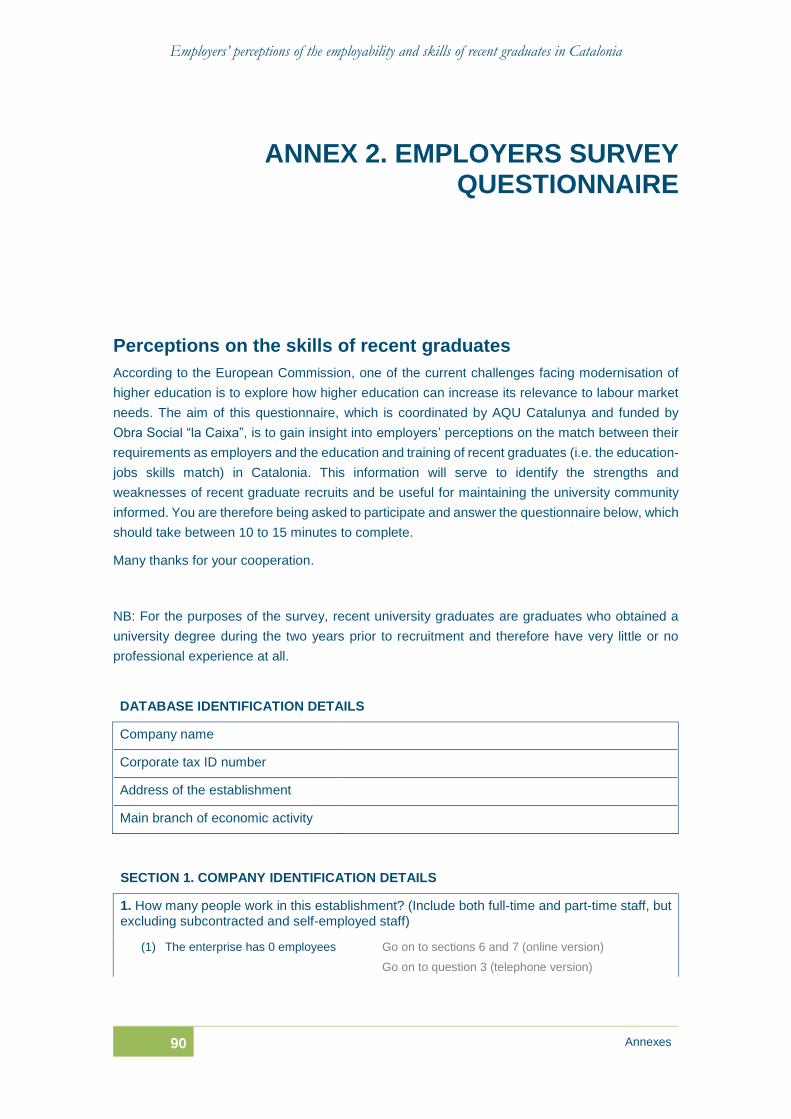
Employers’ perceptions of the employability and skills of recent graduates in Catalonia
90 Annexes
ANNEX 2. EMPLOYERS SURVEY QUESTIONNAIRE
Perceptions on the skills of recent graduates
According to the European Commission, one of the current challenges facing modernisation of
higher education is to explore how higher education can increase its relevance to labour market
needs. The aim of this questionnaire, which is coordinated by AQU Catalunya and funded by
Obra Social “la Caixa”, is to gain insight into employers’ perceptions on the match between their
requirements as employers and the education and training of recent graduates (i.e. the education-
jobs skills match) in Catalonia. This information will serve to identify the strengths and
weaknesses of recent graduate recruits and be useful for maintaining the university community
informed. You are therefore being asked to participate and answer the questionnaire below, which
should take between 10 to 15 minutes to complete.
Many thanks for your cooperation.
NB: For the purposes of the survey, recent university graduates are graduates who obtained a
university degree during the two years prior to recruitment and therefore have very little or no
professional experience at all.
SECTION 1. COMPANY IDENTIFICATION DETAILS
1. How many people work in this establishment? (Include both full-time and part-time staff, but excluding subcontracted and self-employed staff)
(1) The enterprise has 0 employees Go on to sections 6 and 7 (online version)
Go on to question 3 (telephone version)
DATABASE IDENTIFICATION DETAILS
Company name
Corporate tax ID number
Address of the establishment
Main branch of economic activity
Employers’ perceptions of the employability and skills of recent graduates in Catalonia
Annexes 91
(2) Between 1 and 9 (3) Between 10 and 50 (4) Between 51 and
100
(5) Between 101 and 200 (6) Between 201 and 250 (7) Between 251 and
500
(8) More than 500
2. Of the people working in the establishment, what is the approximate percentage of employees (both full-time and part-time) who have a university degree?
(1) Zero Go on to sections 6 and 7 (online version)
Go on to question 3 (telephone version)
(2) 1-10% (3) 11-20% (4) 21-30% (5) 31-40% (6) 41-50%
(7) 51-60% (8) 61-70% (9) 71-80% (10) 81-90% (11) 91-100%
3. Ownership of the enterprise:
(1) Public (2) Private (3) Other
4. In what year did activities start in this establishment? (4 digits)
5. This establishment:
(1) Is the only establishment the enterprise has Go on to question 6
(2) Is one of the enterprise’s establishments Go on to question 5.1
5.1. Is this establishment the enterprise’s main office/headquarters?
(1) Yes Go on to question 6
(2) No Go on to question 5.2
5.2. Where is the main office/headquarters?
(1) In Catalonia Go on to question 6
(2) Outside of Catalonia, but in Spain Go on to question 6
(3) Outside of Spain. Specify the country (code number) Go on to question 6
6. What is your establishment’s main activity (CCAE code3-2009)?
(1) Agriculture, forestry and fishing
(2) Mining and quarrying
(3) Manufacturing industries
(3.1) Chemical and/or pharmaceutical industries
(3.2) Food industries
(3.3) All other industries
(4) Electricity, gas, steam and air conditioning supply
(5) Water supply; sewerage, waste management and remediation activities
(6) Construction and building
3 Catalan Classification of Economic Activities
Employers’ perceptions of the employability and skills of recent graduates in Catalonia
92 Annexes
(7) Wholesale and retail trade; repair of motor vehicles and motorcycles
(8) Transportation and storage
(9) Accommodation and food service activities
(10) Information and communications
(10.1) Communication technologies (telecommunications, information technology services, information services)
(10.2) Mass communication media (publishing, motion picture, video and television programme activities; sound recording and music publishing activities, radio and television programming and broadcasting activities)
(11) Financial and insurance activities
(12) Real estate activities
(13) Professional, scientific and technical activities
(13.1) Research and development
(13.2) Veterinary activities
(13.3) Business services (legal, accounting, activities of head offices; management consultancy activities, architecture, engineering, technical testing and analysis activities, advertising and market research, other professional, scientific and technical activities)
(14) Administrative and support service activities
(15) Public administration and defence; compulsory social security
(16) Education
(17) Human health and social work activities
(18) Arts, entertainment and recreation
(18.1) Creative, arts and entertainment activities; Libraries, archives, museums and other cultural activities
(18.2) Gambling and betting activities; Sports activities and amusement and recreation activities
(19) Other services
(19.1) Activities of membership organisations
(19.2) Repair of computers and personal and household goods; Other personal service activities
(20) Activities of households as employers; undifferentiated goods- and services-producing activities of households for own use
(21) Activities of extraterritorial organisations and bodies
7. Approximately, what is the percentage distribution of either your sales or clients between the following different markets? (The percentage distribution total should come to 100.)
(1) Local (urban centre or local area) .........%
(2) Catalonia .........%
(3) Spain .........%
(4) International (outside of Spain) .........% If the answer is 0, go on to question 7.1
7.1. If your answer for international sales and/or services in the previous question was 0%, answer the following question. Is there any kind of international relationship involved in the activities of your enterprise?
(1) Yes If affirmative, specify the international activity or relationship (open-ended)
(2) No
Employers’ perceptions of the employability and skills of recent graduates in Catalonia
Annexes 93
SECTION 2. RECRUITMENT
This section includes questions concerning the recruitment of recent university graduates, i.e. graduates who obtained a university degree during the two years prior to recruitment and therefore have very little or no professional experience at all. Assess only recent university graduates who were recruited for tasks matched with their level of education (i.e. graduate-level skills).
8. In the last five years, did you recruit any recent graduates?
(1) Yes Go on to question 9
(2) No If in question 1 and 2 P(1) > 1 and P(2) > 1, go on to sections 6, 4 and 5 (only 23 and 24)
If in question 1 P(1) = 1, go on to section 6 and the end of the survey
If in question 2 P(2) = 1, go on to section 6 and the end of the survey
9. How many approximately (in the last five years)?
10. What subjects did your graduate recruits obtain degrees in (in the last five years)? You can
choose more than one option.
(1) Humanities, History, Arts (2) Foreign languages (3) Economics, Business Management and Administration, and Business Sciences
(4) Law, Sociology, Labour Studies, Social Welfare and Political Sciences
(5) Communication, Documentation
(6) Psychology, Pedagogy and Psychopedagogy
(7) Teaching and Social Education
(8) Tourism (9) Experimental Sciences: Chemistry, Environmental Science, etc.
(10) Nursing (11) Medicine, Dentistry (12) Pharmacy, Food Science and Technology
(13) Architecture and Civil Engineering
(14) Production Engineering (Industrial, Chemical, etc.)
(15) ICT (Computer Sciences, Telecommunications, Electronics)
(16) Agricultural Engineering
11. State if the following factors were important in the selection of recent university graduates:
(1) A specific degree Yes No For certain jobs N/A
(2) A Master’s degree Yes No For certain jobs N/A
(3) A doctoral degree/PhD Yes No For certain jobs N/A
12. Rate from 1 to 10 the level of importance of the following factors in the recruitment of recent university graduates (0 indicates not at all important and 10 very important).
Employers’ perceptions of the employability and skills of recent graduates in Catalonia
94 Annexes
(1) Possession of a degree from a
foreign university 0 1 2 3 4 5 6 7 8 9 10 N/A
(2) Having studied or worked abroad 0 1 2 3 4 5 6 7 8 9 10 N/A
(3) The reputation of the university
where they studied 0 1 2 3 4 5 6 7 8 9 10 N/A
(4) Work placement during studies 0 1 2 3 4 5 6 7 8 9 10 N/A
13. Have you had any difficulties to recruit the right people for any given job?
(1) Yes Go on to question 13.1
(2) No Go on to question 14
13.1. If your answer to the previous question was “Yes”, state the main reasons. If necessary, choose more than one option.
(1) Shortage of university graduates in a given field. Specify (open-ended)
(2) Shortage of candidates with the right skills for the job. Specify (open-ended)
(3) Shortage of candidates willing to be geographically mobile
(4) Shortage of candidates willing to adapt to the work schedule
(5) Shortage of candidates willing to accept to the type of contract
(6) Shortage of candidates willing to accept the salary
(7) Shortage of candidates willing to relocate
(8) Limited resources to allow adequate marketing of job vacancies. Specify (open-ended)
(9) Other reasons. Specify (open-ended)
14. If you wish to make any comment or remark regarding your answers to the questions in this section, please do so in the space provided below.
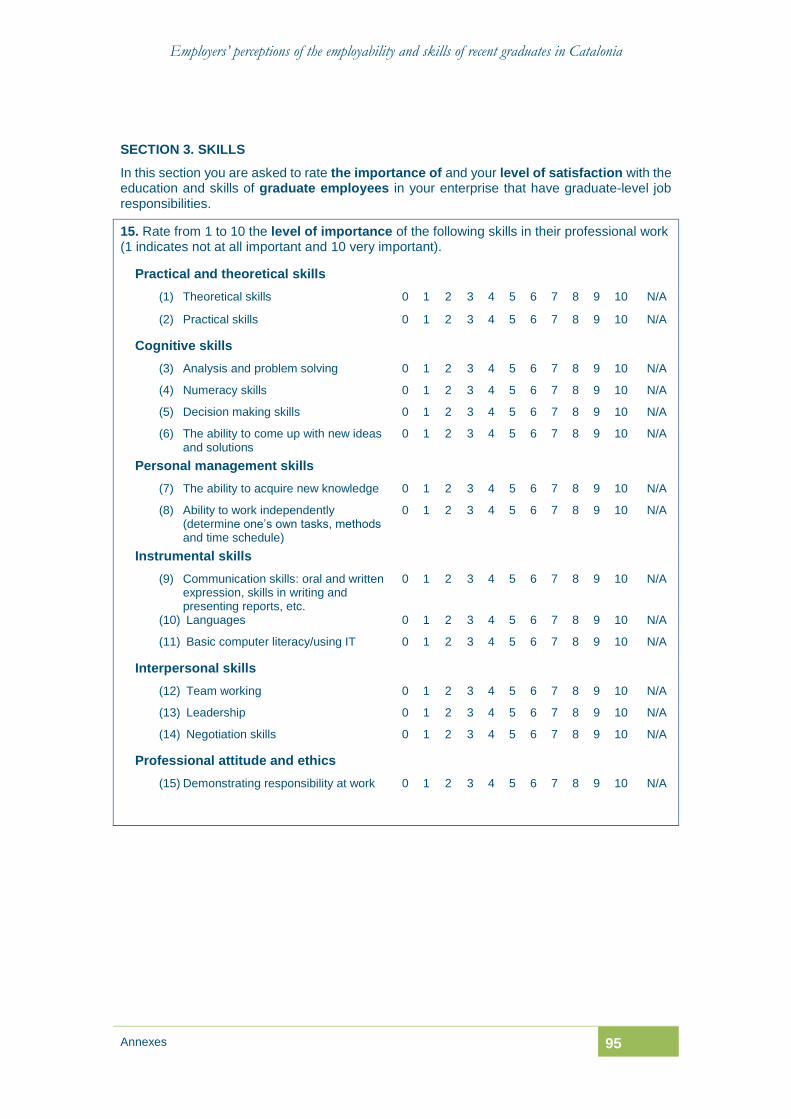
Employers’ perceptions of the employability and skills of recent graduates in Catalonia
Annexes 95
SECTION 3. SKILLS
In this section you are asked to rate the importance of and your level of satisfaction with the education and skills of graduate employees in your enterprise that have graduate-level job responsibilities.
15. Rate from 1 to 10 the level of importance of the following skills in their professional work (1 indicates not at all important and 10 very important).
Practical and theoretical skills
(1) Theoretical skills 0 1 2 3 4 5 6 7 8 9 10 N/A
(2) Practical skills 0 1 2 3 4 5 6 7 8 9 10 N/A
Cognitive skills
(3) Analysis and problem solving 0 1 2 3 4 5 6 7 8 9 10 N/A
(4) Numeracy skills 0 1 2 3 4 5 6 7 8 9 10 N/A
(5) Decision making skills 0 1 2 3 4 5 6 7 8 9 10 N/A
(6) The ability to come up with new ideas and solutions
0 1 2 3 4 5 6 7 8 9 10 N/A
Personal management skills
(7) The ability to acquire new knowledge 0 1 2 3 4 5 6 7 8 9 10 N/A
(8) Ability to work independently (determine one’s own tasks, methods and time schedule)
0 1 2 3 4 5 6 7 8 9 10 N/A
Instrumental skills
(9) Communication skills: oral and written expression, skills in writing and presenting reports, etc.
0 1 2 3 4 5 6 7 8 9 10 N/A
(10) Languages 0 1 2 3 4 5 6 7 8 9 10 N/A
(11) Basic computer literacy/using IT 0 1 2 3 4 5 6 7 8 9 10 N/A
Interpersonal skills
(12) Team working 0 1 2 3 4 5 6 7 8 9 10 N/A
(13) Leadership 0 1 2 3 4 5 6 7 8 9 10 N/A
(14) Negotiation skills 0 1 2 3 4 5 6 7 8 9 10 N/A
Professional attitude and ethics
(15) Demonstrating responsibility at work 0 1 2 3 4 5 6 7 8 9 10 N/A
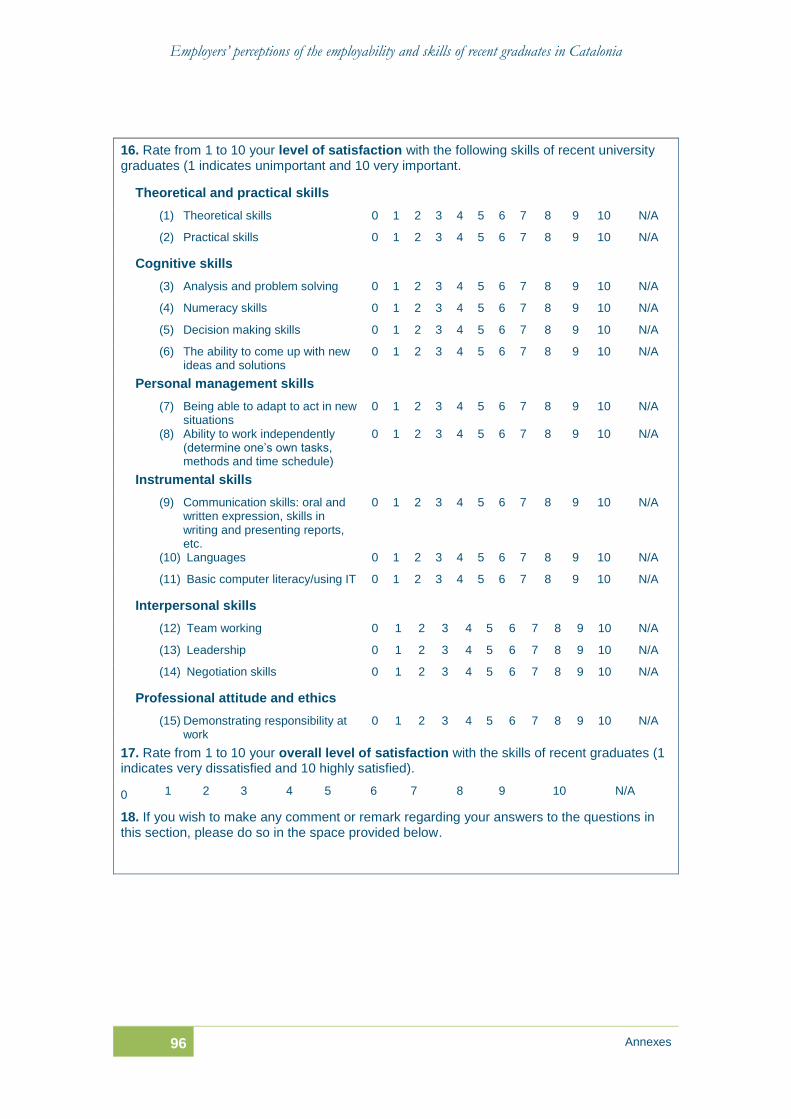
Employers’ perceptions of the employability and skills of recent graduates in Catalonia
96 Annexes
16. Rate from 1 to 10 your level of satisfaction with the following skills of recent university graduates (1 indicates unimportant and 10 very important.
Theoretical and practical skills
(1) Theoretical skills 0 1 2 3 4 5 6 7 8 9 10 N/A
(2) Practical skills 0 1 2 3 4 5 6 7 8 9 10 N/A
Cognitive skills
(3) Analysis and problem solving 0 1 2 3 4 5 6 7 8 9 10 N/A
(4) Numeracy skills 0 1 2 3 4 5 6 7 8 9 10 N/A
(5) Decision making skills 0 1 2 3 4 5 6 7 8 9 10 N/A
(6) The ability to come up with new ideas and solutions
0 1 2 3 4 5 6 7 8 9 10 N/A
Personal management skills
(7) Being able to adapt to act in new situations
0 1 2 3 4 5 6 7 8 9 10 N/A
(8) Ability to work independently (determine one’s own tasks, methods and time schedule)
0 1 2 3 4 5 6 7 8 9 10 N/A
Instrumental skills
(9) Communication skills: oral and written expression, skills in writing and presenting reports, etc.
0 1 2 3 4 5 6 7 8 9 10 N/A
(10) Languages 0 1 2 3 4 5 6 7 8 9 10 N/A
(11) Basic computer literacy/using IT 0 1 2 3 4 5 6 7 8 9 10 N/A
Interpersonal skills
(12) Team working 0 1 2 3 4 5 6 7 8 9 10 N/A
(13) Leadership 0 1 2 3 4 5 6 7 8 9 10 N/A
(14) Negotiation skills 0 1 2 3 4 5 6 7 8 9 10 N/A
Professional attitude and ethics
(15) Demonstrating responsibility at work
0 1 2 3 4 5 6 7 8 9 10 N/A
17. Rate from 1 to 10 your overall level of satisfaction with the skills of recent graduates (1 indicates very dissatisfied and 10 highly satisfied).
0 1 2 3 4 5 6 7 8 9 10 N/A
18. If you wish to make any comment or remark regarding your answers to the questions in this section, please do so in the space provided below.
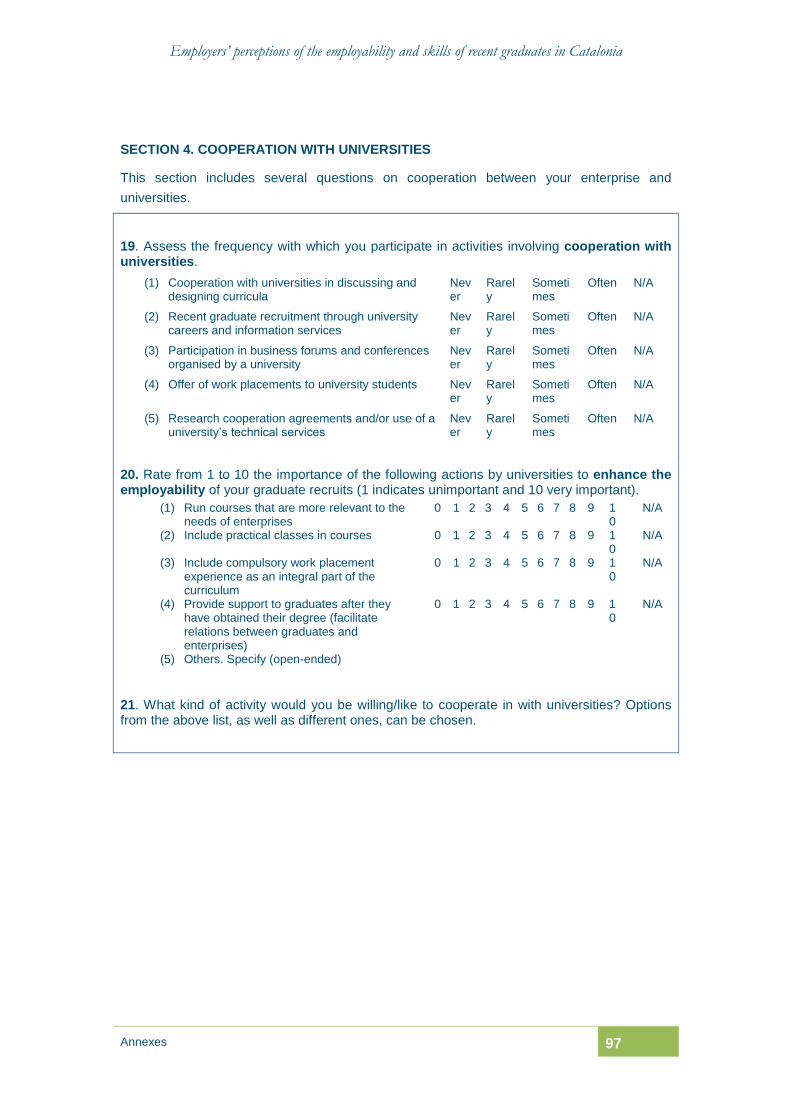
Employers’ perceptions of the employability and skills of recent graduates in Catalonia
Annexes 97
SECTION 4. COOPERATION WITH UNIVERSITIES
This section includes several questions on cooperation between your enterprise and
universities.
19. Assess the frequency with which you participate in activities involving cooperation with universities.
(1) Cooperation with universities in discussing and designing curricula
Never
Rarely
Sometimes
Often N/A
(2) Recent graduate recruitment through university careers and information services
Never
Rarely
Sometimes
Often N/A
(3) Participation in business forums and conferences organised by a university
Never
Rarely
Sometimes
Often N/A
(4) Offer of work placements to university students Never
Rarely
Sometimes
Often N/A
(5) Research cooperation agreements and/or use of a university’s technical services
Never
Rarely
Sometimes
Often N/A
20. Rate from 1 to 10 the importance of the following actions by universities to enhance the employability of your graduate recruits (1 indicates unimportant and 10 very important).
(1) Run courses that are more relevant to the needs of enterprises
0 1 2 3 4 5 6 7 8 9 10
N/A
(2) Include practical classes in courses 0 1 2 3 4 5 6 7 8 9 10
N/A
(3) Include compulsory work placement experience as an integral part of the curriculum
0 1 2 3 4 5 6 7 8 9 10
N/A
(4) Provide support to graduates after they have obtained their degree (facilitate relations between graduates and enterprises)
0 1 2 3 4 5 6 7 8 9 10
N/A
(5) Others. Specify (open-ended)
21. What kind of activity would you be willing/like to cooperate in with universities? Options from the above list, as well as different ones, can be chosen.
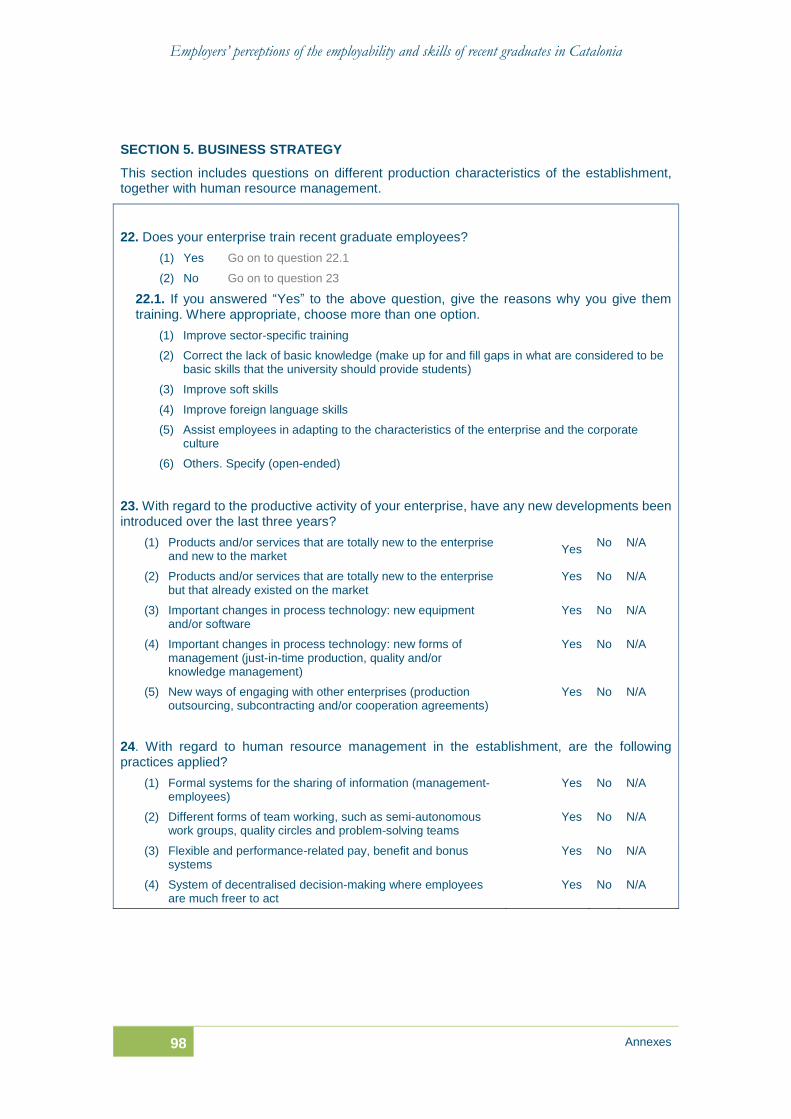
Employers’ perceptions of the employability and skills of recent graduates in Catalonia
98 Annexes
SECTION 5. BUSINESS STRATEGY
This section includes questions on different production characteristics of the establishment, together with human resource management.
22. Does your enterprise train recent graduate employees?
(1) Yes Go on to question 22.1
(2) No Go on to question 23
22.1. If you answered “Yes” to the above question, give the reasons why you give them training. Where appropriate, choose more than one option.
(1) Improve sector-specific training
(2) Correct the lack of basic knowledge (make up for and fill gaps in what are considered to be basic skills that the university should provide students)
(3) Improve soft skills
(4) Improve foreign language skills
(5) Assist employees in adapting to the characteristics of the enterprise and the corporate culture
(6) Others. Specify (open-ended)
23. With regard to the productive activity of your enterprise, have any new developments been introduced over the last three years?
(1) Products and/or services that are totally new to the enterprise and new to the market
Yes No N/A
(2) Products and/or services that are totally new to the enterprise but that already existed on the market
Yes No N/A
(3) Important changes in process technology: new equipment and/or software
Yes No N/A
(4) Important changes in process technology: new forms of management (just-in-time production, quality and/or knowledge management)
Yes No N/A
(5) New ways of engaging with other enterprises (production outsourcing, subcontracting and/or cooperation agreements)
Yes No N/A
24. With regard to human resource management in the establishment, are the following practices applied?
(1) Formal systems for the sharing of information (management-employees)
Yes No N/A
(2) Different forms of team working, such as semi-autonomous work groups, quality circles and problem-solving teams
Yes No N/A
(3) Flexible and performance-related pay, benefit and bonus systems
Yes No N/A
(4) System of decentralised decision-making where employees are much freer to act
Yes No N/A

Employers’ perceptions of the employability and skills of recent graduates in Catalonia
Annexes 99
SECTION 6: ENTERPRISES THAT DID NOT RECRUIT RECENT UNIVERSITY GRADUATES
9. What reasons are there for you not recruiting recent university graduates during the last five years? Where appropriate, choose more than one option.
(1) Lack of vacancies
(2) Graduates were recruited, but with previous work experience
(3) The enterprise’s activities do not call for the recruitment of employees with this level of
qualification
(4) Shortage of graduates in a given field
(5) Shortage of candidates with the right skills for the job
(6) Shortage of candidates willing to be geographically mobile
(7) Shortage of candidates willing to adapt to the work schedule
(8) Shortage of candidates willing to accept to the type of contract
(9) Shortage of candidates willing to accept the salary
(10) Shortage of candidates willing to relocate
(11) There were no applicants
(12) Others. Specify (open-ended)
SECTION 7: DETAILS OF THE INFORMANT (PERSON COMPLETING THE SURVEY)
What is your position in the enterprise?
(1) Director or head of HR (Human Resources) / head of an HR department
(2) Director general / director / manager
(3) Other. Specify (open-ended)
If AQU Catalunya happens to need more information on this matter, would you be willing to cooperate?
(1) Yes (2) No
Please,
Provide your name and surname ...................................
Provide your e.mail address ...................................
Many thanks for completing the survey questionnaire.
Employers’ perceptions of the employability and skills of recent graduates in Catalonia
100 Annexes
ANNEX 3. EDITORIAL TEAM
Editors
Queralt Capsada Munsech Technical officer, Quality Assurance/AQU
Anna Prades Nebot Project Manager, Quality Assurance/AQU
Contributors
Maria Giné Soca Secretary to AQU Catalunya and the AQU Board
Carme Edo Ros Project Manager, Quality Assurance/AQU
Scientific Committee
Jaume Garcia Villar Chair, Scientific Committee (UPF)
Pilar Figuera Gazo Scientific Committee member (UB)
Santiago Gilbert Fortet Scientific Committee member (CEMEX,
employers’ representative)
Ferran Mañé Vernet Scientific Committee member (URV)
Joan Miquel Verd Pericàs Scientific Committee member (UAB)
Sebastián Rodríguez Espinar Scientific Committee member (UB)
Sandra Nieto Viramontes Secretary, Scientific Committee (AQU Catalunya)
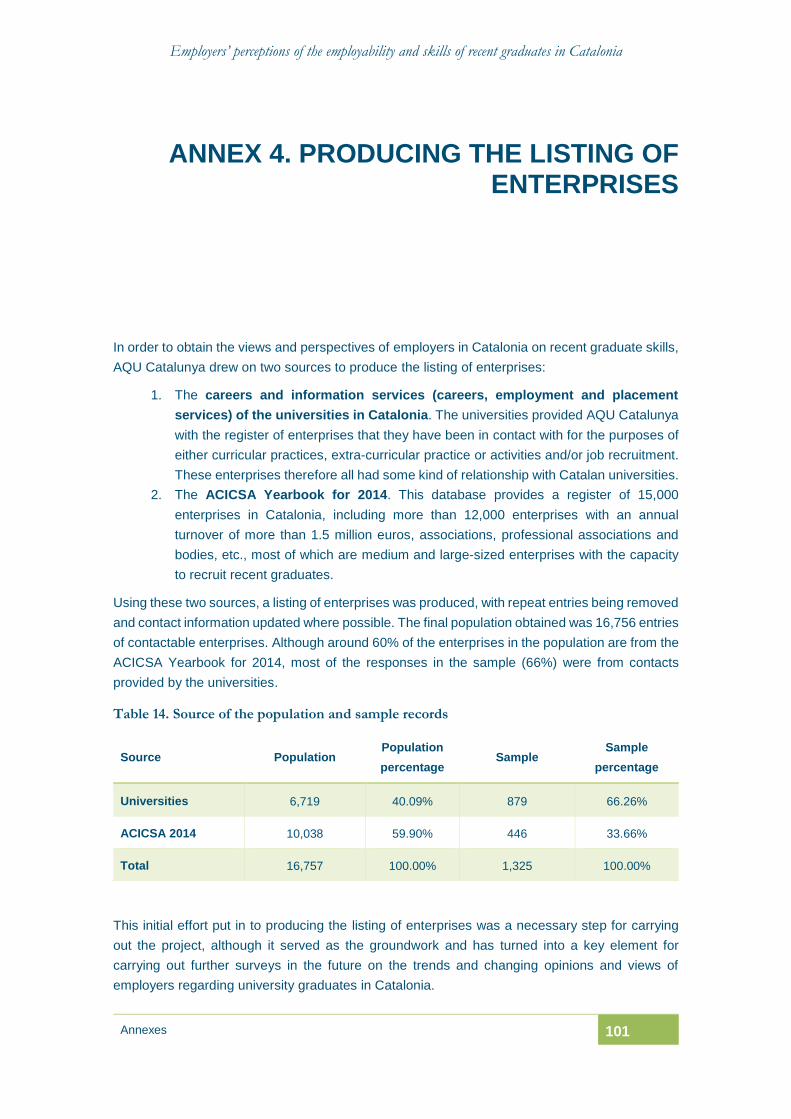
Employers’ perceptions of the employability and skills of recent graduates in Catalonia
Annexes 101
ANNEX 4. PRODUCING THE LISTING OF ENTERPRISES
In order to obtain the views and perspectives of employers in Catalonia on recent graduate skills,
AQU Catalunya drew on two sources to produce the listing of enterprises:
1. The careers and information services (careers, employment and placement
services) of the universities in Catalonia. The universities provided AQU Catalunya
with the register of enterprises that they have been in contact with for the purposes of
either curricular practices, extra-curricular practice or activities and/or job recruitment.
These enterprises therefore all had some kind of relationship with Catalan universities.
2. The ACICSA Yearbook for 2014. This database provides a register of 15,000
enterprises in Catalonia, including more than 12,000 enterprises with an annual
turnover of more than 1.5 million euros, associations, professional associations and
bodies, etc., most of which are medium and large-sized enterprises with the capacity
to recruit recent graduates.
Using these two sources, a listing of enterprises was produced, with repeat entries being removed
and contact information updated where possible. The final population obtained was 16,756 entries
of contactable enterprises. Although around 60% of the enterprises in the population are from the
ACICSA Yearbook for 2014, most of the responses in the sample (66%) were from contacts
provided by the universities.
Table 14. Source of the population and sample records
Source Population Population
percentage Sample
Sample
percentage
Universities 6,719 40.09% 879 66.26%
ACICSA 2014 10,038 59.90% 446 33.66%
Total 16,757 100.00% 1,325 100.00%
This initial effort put in to producing the listing of enterprises was a necessary step for carrying
out the project, although it served as the groundwork and has turned into a key element for
carrying out further surveys in the future on the trends and changing opinions and views of
employers regarding university graduates in Catalonia.
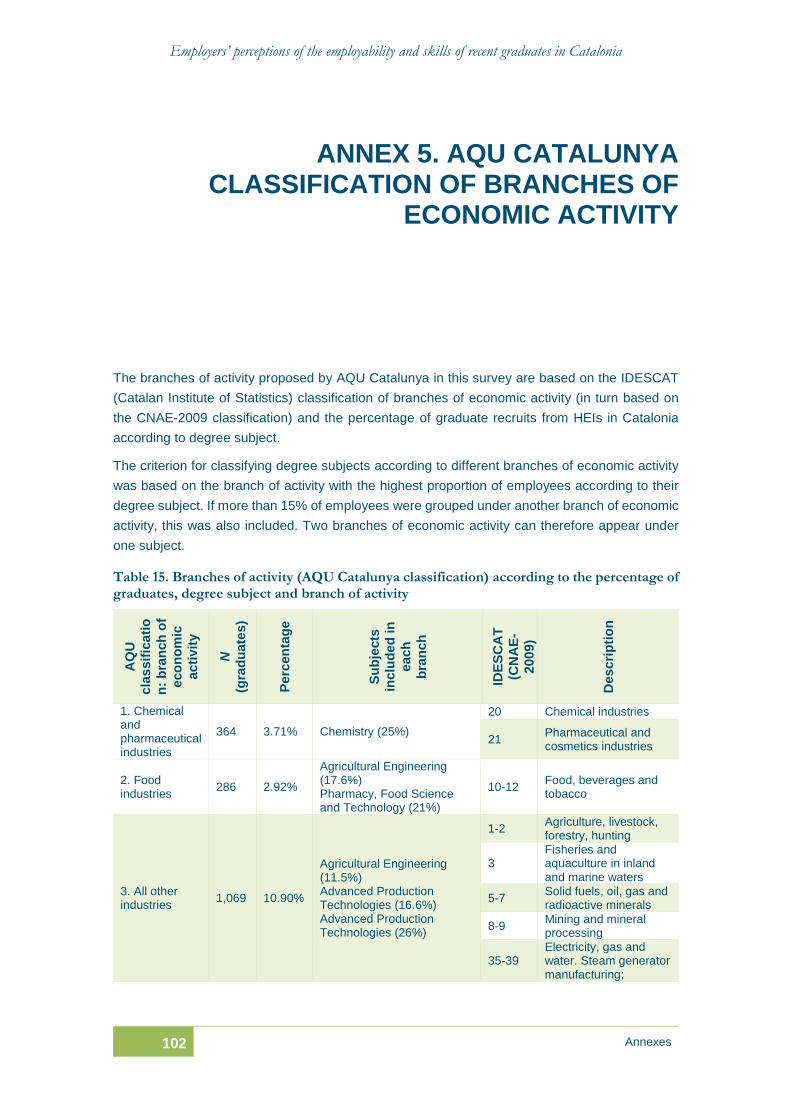
Employers’ perceptions of the employability and skills of recent graduates in Catalonia
102 Annexes
ANNEX 5. AQU CATALUNYA CLASSIFICATION OF BRANCHES OF
ECONOMIC ACTIVITY
The branches of activity proposed by AQU Catalunya in this survey are based on the IDESCAT
(Catalan Institute of Statistics) classification of branches of economic activity (in turn based on
the CNAE-2009 classification) and the percentage of graduate recruits from HEIs in Catalonia
according to degree subject.
The criterion for classifying degree subjects according to different branches of economic activity
was based on the branch of activity with the highest proportion of employees according to their
degree subject. If more than 15% of employees were grouped under another branch of economic
activity, this was also included. Two branches of economic activity can therefore appear under
one subject.
Table 15. Branches of activity (AQU Catalunya classification) according to the percentage of graduates, degree subject and branch of activity
AQ
U
cla
ssif
icati
o
n:
bra
nch
of
eco
no
mic
acti
vit
y
N
(gra
du
ate
s)
Perc
en
tag
e
Su
bje
cts
inclu
ded
in
each
bra
nch
IDE
SC
AT
(CN
AE
-
2009)
Desc
rip
tio
n
1. Chemical and pharmaceutical industries
364 3.71% Chemistry (25%)
20 Chemical industries
21 Pharmaceutical and cosmetics industries
2. Food industries
286 2.92%
Agricultural Engineering (17.6%) Pharmacy, Food Science and Technology (21%)
10-12 Food, beverages and tobacco
3. All other industries
1,069 10.90%
Agricultural Engineering (11.5%) Advanced Production Technologies (16.6%) Advanced Production Technologies (26%)
1-2 Agriculture, livestock, forestry, hunting
3 Fisheries and aquaculture in inland and marine waters
5-7 Solid fuels, oil, gas and radioactive minerals
8-9 Mining and mineral processing
35-39 Electricity, gas and water. Steam generator manufacturing;
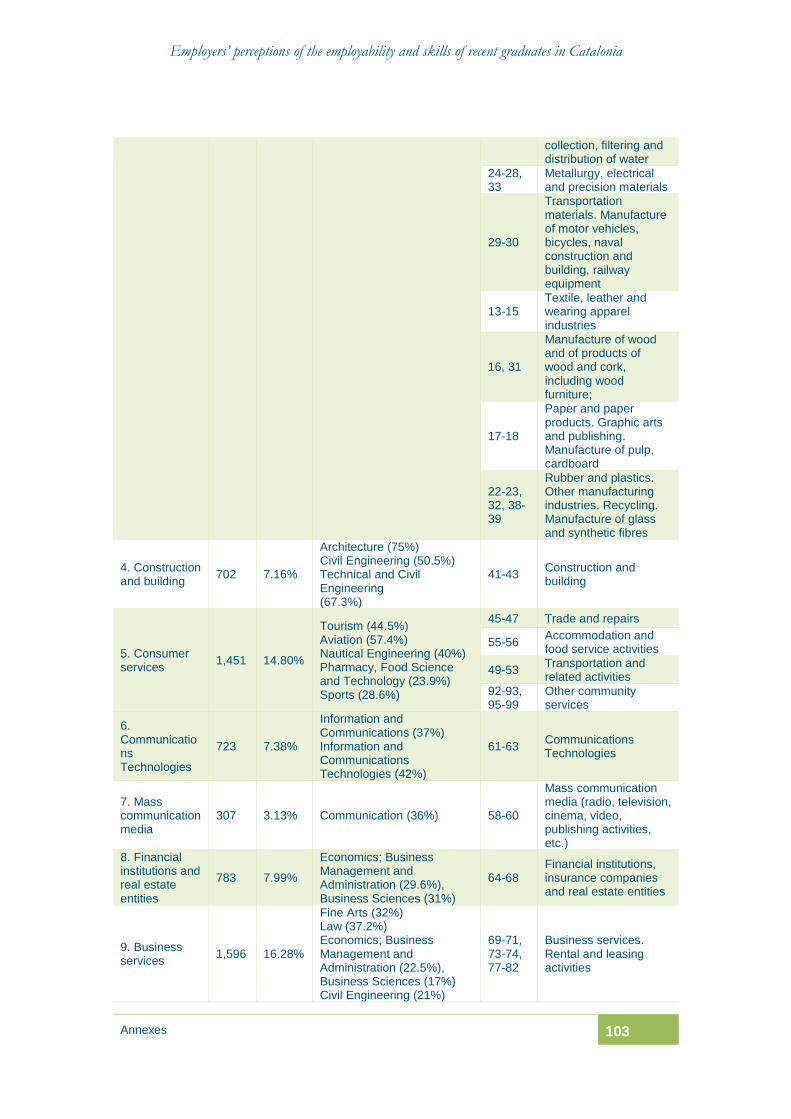
Employers’ perceptions of the employability and skills of recent graduates in Catalonia
Annexes 103
collection, filtering and distribution of water
24-28, 33
Metallurgy, electrical and precision materials
29-30
Transportation materials. Manufacture of motor vehicles, bicycles, naval construction and building, railway equipment
13-15 Textile, leather and wearing apparel industries
16, 31
Manufacture of wood and of products of wood and cork, including wood furniture;
17-18
Paper and paper products. Graphic arts and publishing. Manufacture of pulp, cardboard
22-23, 32, 38-39
Rubber and plastics. Other manufacturing industries. Recycling. Manufacture of glass and synthetic fibres
4. Construction and building
702 7.16%
Architecture (75%) Civil Engineering (50.5%) Technical and Civil Engineering (67.3%)
41-43 Construction and building
5. Consumer services
1,451 14.80%
Tourism (44.5%) Aviation (57.4%) Nautical Engineering (40%) Pharmacy, Food Science and Technology (23.9%) Sports (28.6%)
45-47 Trade and repairs
55-56 Accommodation and food service activities
49-53 Transportation and related activities
92-93, 95-99
Other community services
6. Communications Technologies
723 7.38%
Information and Communications (37%) Information and Communications Technologies (42%)
61-63 Communications Technologies
7. Mass communication media
307 3.13% Communication (36%) 58-60
Mass communication media (radio, television, cinema, video, publishing activities, etc.)
8. Financial institutions and real estate entities
783 7.99%
Economics; Business Management and Administration (29.6%), Business Sciences (31%)
64-68 Financial institutions, insurance companies and real estate entities
9. Business services
1,596 16.28%
Fine Arts (32%) Law (37.2%) Economics; Business Management and Administration (22.5%), Business Sciences (17%) Civil Engineering (21%)
69-71, 73-74, 77-82
Business services. Rental and leasing activities

Employers’ perceptions of the employability and skills of recent graduates in Catalonia
104 Annexes
Labour Studies (21%)