Employer Health Benefits 2010 Annual Survey - Report
212
69% $13,770 $5,049 2010 -and- THE KAISER FAMILY FOUNDATION - AND - HEALTH RESEARCH & EDUCATIONAL TRUST 2010 Annual Survey Employer Health Benefits
Transcript of Employer Health Benefits 2010 Annual Survey - Report

This publication (#8085) is available on the Kaiser Family Foundation’s website at www.kff.org. Multiple copies may be obtained from HRET by calling 1-800-242-2626 (order #097522).
September 2010
-and-
The Henry J. Kaiser Family Foundation
Headquarters 2400 Sand Hill Road
Menlo Park, CA 94025Phone 650-854-9400 Fax 650-854-4800
Washington Offices and
Barbara Jordan Conference Center
1330 G Street, NW
Washington, DC 20005
Phone 202-347-5270 Fax 202-347-5274
www.kff.org
Health Research & Educational Trust
155 North WalkerSuite 400
Chicago, IL 60606Phone 312-422-2600 Fax 312-422-4568
www.hret.org
69%$13,7
70
$5,0
49
2010-and-
T H E K A I S E R F A M I L y F O u N D A T I O N
- A N D -
H E A L T H R E S E A R C H &
E D u C A T I O N A L T R u S T
2 0 1 0A n n u a l S u r v e y
EmployerHeal th
Benef i t s
Employer H
ealth Benefits 20
10
AN
Nu
AL
Su
Rv
Ey
T
HE
KA
ISE
R F
AM
ILy F
Ou
ND
AT
ION
-AN
D- H
EA
LTH
RE
SE
AR
CH
& E
Du
CA
TIO
NA
L T
Ru
ST

The Kaiser Family Foundation is a non-profit private operating foundation, based in Menlo Park, California, dedicated to producing and communicating the best possible analysis and information on health issues.
Founded in 1944, the Health Research & Educational Trust (HRET) is a private, not-for-profit organization involved in research, education, and demonstration programs addressing health management and policy issues. An affiliate of the American Hospital Association (AHA), HRET collaborates with health care, government, academic, business, and community organizations across the united States to conduct research and disseminate findings that shape the future of health care. For more information about HRET, visit www.hret.org.
NORC, known since its founding in 1941 as the National Opinion Research Center, pursues objective research that serves the public interest. NORC has offices on the university of Chicago campus and in Chicago, Bethesda, MD, and Berkeley, CA, and a field staff that operates nationwide. NORC’s clients include government agencies, educational institutions, foundations, other nonprofit organizations, and private corporations. Its projects are interdisciplinary and are local, regional, national, and international in scope.
Copyright © 2010 Henry J. Kaiser Family Foundation, Menlo Park, California, and Health Research & Educational Trust, Chicago, Illinois. All rights reserved.
Printed in the united States of America.
ISBN: 978-0-87258-878-3
American Hospital Association/Health Research & Educational Trust Catalog Number 097522
Primary Authors:
KAISER FAMILY FOUNDATIONGary ClaxtonBianca DiJulioBenjamin FinderJanet Lundy
HEALTH RESEARCH & EDUCATIONAL TRUSTMegan McHughAwo Osei-Anto
NATIONAL OpINION RESEARCH CENTERHeidi Whitmore
Jeremy pickreign
Jon Gabel

-and-
t h e k a i s e r f a m i l y f o u n d a t i o n - A N D -
h e a l t h r e s e a r C h & e d u C a t i o n a l t r u s t
Employer Health
Benefits
2 0 1 0A n n u a l S u r v e y


iii
t h e k a i s e r fa m i ly f o u n d at i o n - a n d - h e a lt h r e s e a r C h & e d u C at i o n a l t r u s t
T A b l e o f C o N T e N T s
l i s T o f e x h i b i T s v
s u m m A ry o f f i N D i N g s 1
s u r v e y D e s i g N A N D m e T h o D s 9
s e C T i o N 1
Cost of Health Insurance 19
s e C T i o N 2
Health Benefits Offer Rates 35
s e C T i o N 3
Employee Coverage, Eligibility, and Participation 45
s e C T i o N 4
Types of Plans Offered 59
s e C T i o N 5
Market Shares of Health Plans 65
s e C T i o N 6
Worker and Employer Contributions for Premiums 69
s e C T i o N 7
Employee Cost Sharing 97
s e C T i o N 8
High-Deductible Health Plans with Savings Option 127
s e C T i o N 9
Prescription Drug Benefits 143
s e C T i o N 10
Plan Funding 153
s e C T i o N 11
Retiree Health Benefits 161
s e C T i o N 12
Wellness Programs, Health Risk Assessments, and Disease 169 Management Programs
s e C T i o N 13
Employer Opinions and Health Plan Practices 183


v
t h e k a i s e r fa m i ly f o u n d at i o n - a n d - h e a lt h r e s e a r C h & e d u C at i o n a l t r u s t
s u r v e y D e s i g N A N D m e T h o D s
exhibit m.1 15Selected Characteristics of Firms in the Survey Sample, 2010
exhibit m.2 16Distribution of Employers, Workers, and Workers Covered by Health Benefits, by Firm Size, 2010
exhibit m.3 17States by Region, 2010
Co s T o f h e A lT h i N s u r A N C e
exhibit 1.1 22Average Monthly and Annual Premiums for Covered Workers, Single and Family Coverage, by Plan Type, 2010
exhibit 1.2 23Average Monthly and Annual Premiums for Covered Workers, by Plan Type and Firm Size, 2010
exhibit 1.3 24Average Monthly and Annual Premiums for Covered Workers, by Plan Type and Region, 2010
exhibit 1.4 25Average Monthly and Annual Premiums for Covered Workers, by Plan Type and Industry, 2010
exhibit 1.5 27Average Annual Premiums for Covered Workers with Single Coverage, by Firm Characteristics, 2010
exhibit 1.6 28Average Annual Premiums for Covered Workers with Family Coverage, by Firm Characteristics, 2010
exhibit 1.7 29Distribution of Annual Premiums for Single and Family Coverage Relative to the Average Annual Single or Family Premium, 2010
exhibit 1.8 29Distribution of Premiums for Single and Family Coverage Relative to the Average Annual Single or Family Premium, 2010
exhibit 1.9 30Distribution of Annual Premiums for Covered Workers with Single Coverage, 2010
exhibit 1.10 30Distribution of Annual Premiums for Covered Workers with Family Coverage, 2010
exhibit 1.11 31Average Annual Premiums for Single and Family Coverage, 1999–2010
exhibit 1.12 32Average Annual Premiums for Covered Workers with Family Coverage, by Firm Size, 1999–2010
exhibit 1.13 32Average Annual Premiums for Covered Workers with Family Coverage, by Firm Size, 1999–2010
exhibit 1.14 33Among Workers in Large Firms (200 or More Workers), Average Health Insurance Premiums for Family Coverage, by Funding Arrangement, 1999–2010
h e A lT h b e N e f i T s o f f e r r AT e s
exhibit 2.1 38Percentage of Firms Offering Health Benefits, 1999–2010
exhibit 2.2 38Percentage of Firms Offering Health Benefits, by Firm Size, 1999–2010
exhibit 2.3 39Percentage of Firms Offering Health Benefits, by Firm Size, Region, and Industry, 2010
exhibit 2.4 40Percentage of Firms Offering Health Benefits, by Firm Characteristics, 2010
exhibit 2.5 41Among Firms Offering Health Benefits, Percentage That Offer Health Benefits to Part-Time Workers, by Firm Size, 1999–2010
exhibit 2.6 41Among Firms Offering Health Benefits, Percentage That Offer Health Benefits to Temporary Workers, by Firm Size, 1999–2010
l i s T o f e x h i b i T s

t h e k a i s e r fa m i ly f o u n d at i o n - a n d - h e a lt h r e s e a r C h & e d u C at i o n a l t r u s t
vi
exhibit 2.7 42Among Firms Offering Health Benefits, Percentage That Offer or Contribute to a Separate Benefit Plan Providing Dental or Vision Benefits, by Firm Size and Region, 2010
exhibit 2.8 43Among Firms Offering Health Benefits, Percentage That Offer or Contribute to a Separate Benefit Plan Providing Dental or Vision Benefits, by Firm Size, 2000–2010
exhibit 2.9 43Among Small Firms (3–199 Workers) Not Offering Health Benefits, Reasons for Not Offering, 2010
exhibit 2.10 44Among Small Firms (3–199 Workers) Not Offering Health Benefits, Percentage That Report the Following Activities Regarding Health Benefits, by Firm Size, 2010
e m p loye e Co v e r Ag e, e l i g i b i l i T y, A N D pA r T i C i pAT i o N
exhibit 3.1 48Percentage of All Workers Covered by Their Employers’ Health Benefits, in Firms Both Offering and Not Offering Health Benefits, by Firm Size, 1999–2010
exhibit 3.2 49Eligibility, Take-Up Rate, and Coverage in Firms Offering Health Benefits, by Firm Size, Region, and Industry, 2010
exhibit 3.3 50Among Workers in Firms Offering Health Benefits, Percentage of Workers Eligible for Health Benefits Offered by Their Firm, by Firm Characteristics, 2010
exhibit 3.4 51Among Workers in Firms Offering Health Benefits, Percentage of Eligible Workers Who Take Up Health Benefits Offered by Their Firm, by Firm Characteristics, 2010
exhibit 3.5 52Among Workers in Firms Offering Health Benefits, Percentage of Workers Covered by Health Benefits Offered by Their Firm, by Firm Characteristics, 2010
exhibit 3.6 53Eligibility, Take-Up Rate, and Coverage for Workers in Firms Offering Health Benefits, by Firm Size, 1999–2010
exhibit 3.7 54Percentage of Covered Workers in Firms with a Waiting Period for Coverage and Average Waiting Period in Months, by Firm Size, Region, and Industry, 2010
exhibit 3.8 55Distribution of Covered Workers with the Following Waiting Periods for Coverage, 2010
exhibit 3.9 55Distribution of Covered Workers Electing Single Coverage, Single Plus One Coverage, or Family Coverage, 2001–2010
exhibit 3.10 56Distribution of Covered Workers Electing Single Coverage, Single Plus One Coverage, or Family Coverage, by Firm Size, 2001–2010
exhibit 3.11 57Distribution of Firms with the Following Age Limits for Dependent Coverage for the Plan with the Largest Enrollment, 2010
exhibit 3.12 57Distribution of Firms with the Following Age Limits for Dependent Coverage for Full-Time Students for the Plan with the Largest Enrollment, 2010
T yp e s o f p l A N s o f f e r e D
exhibit 4.1 61Among Firms Offering Health Benefits, Percentage of Firms That Offer One, Two, or Three or More Plan Types, by Firm Size, 2010
exhibit 4.2 62Among Firms Offering Health Benefits, Percentage of Covered Workers in Firms Offering One, Two, or Three or More Plan Types, by Firm Size, 2010
exhibit 4.3 63Among Firms Offering Health Benefits, Percentage of Firms That Offer the Following Plan Types, by Firm Size, 2010
exhibit 4.4 63Among Firms Offering Health Benefits, Percentage of Covered Workers in Firms That Offer the Following Plan Types, by Firm Size, 2010

vii
t h e k a i s e r fa m i ly f o u n d at i o n - a n d - h e a lt h r e s e a r C h & e d u C at i o n a l t r u s t
m A r k e T s h A r e s o f h e A lT h p l A N s
exhibit 5.1 67Distribution of Health Plan Enrollment for Covered Workers, by Plan Type, 1988–2010
exhibit 5.2 68Distribution of Health Plan Enrollment for Covered Workers, by Firm Size, Region, and Industry, 2010
W o r k e r A N D e m p loye r Co N T r i b u T i o N s f o r p r e m i u m s
exhibit 6.1 72Average Percentage of Premium Paid by Covered Workers for Single and Family Coverage, 1999–2010
exhibit 6.2 73Average Monthly Worker Premium Contributions Paid by Covered Workers for Single and Family Coverage, 1999–2010
exhibit 6.3 74Average Annual Worker and Employer Contributions to Premiums and Total Premiums for Single Coverage, 1999–2010
exhibit 6.4 75Average Annual Worker and Employer Contributions to Premiums and Total Premiums for Family Coverage, 1999–2010
exhibit 6.5 76Average Annual Firm and Worker Premium Contributions and Total Premiums for Covered Workers for Single and Family Coverage, by Plan Type, 2010
exhibit 6.6 77Average Annual Worker Contributions for Covered Workers with Single Coverage, by Firm Size, 1999–2010
exhibit 6.7 78Average Annual Worker Contributions for Covered Workers with Family Coverage, by Firm Size, 1999–2010
exhibit 6.8 79Average Annual Worker Premium Contributions Paid by Covered Workers for Single and Family Coverage, by Firm Size, 1999–2010
exhibit 6.9 80Average Annual Firm and Worker Premium Contributions and Total Premiums for Covered Workers for Single Coverage, by Plan Type and Firm Size, 2010
exhibit 6.10 81Average Annual Firm and Worker Premium Contributions and Total Premiums for Covered Workers for Family Coverage, by Plan Type and Firm Size, 2010
exhibit 6.11 82Average Monthly and Annual Worker Premium Contributions Paid by Covered Workers for Single and Family Coverage, by Plan Type and Firm Size, 2010
exhibit 6.12 83Average Monthly and Annual Worker Premium Contributions Paid by Covered Workers for Single and Family Coverage, by Plan Type and Region, 2010
exhibit 6.13 84Average Monthly Worker Premium Contributions Paid by Covered Workers for Single and Family Coverage, by Plan Type, 1999–2010
exhibit 6.14 84Distribution of Worker Premium Contributions for Single and Family Coverage Relative to the Average Annual Worker Premium Contribution, 2010
exhibit 6.15 85Distribution of Percentage of Premium Paid by Covered Workers for Single and Family Coverage, 2002–2010
exhibit 6.16 86Distribution of Percentage of Premium Paid by Covered Workers for Single Coverage, by Firm Size, 2002–2010
exhibit 6.17 87Distribution of Percentage of Premium Paid by Covered Workers for Family Coverage, by Firm Size, 2002–2010
exhibit 6.18 88Distribution of the Percentage of Total Premium Paid by Covered Workers for Single and Family Coverage, by Wage, 2010
exhibit 6.19 89Average Percentage of Premium Paid by Covered Workers for Single Coverage, by Firm Characteristics, 2010
exhibit 6.20 90Average Percentage of Premium Paid by Covered Workers for Family Coverage, by Firm Characteristics, 2010

t h e k a i s e r fa m i ly f o u n d at i o n - a n d - h e a lt h r e s e a r C h & e d u C at i o n a l t r u s t
viii
exhibit 6.21 91Average Percentage of Premium Paid by Covered Workers for Single and Family Coverage, by Plan Type and Firm Size, 2010
exhibit 6.22 92Average Percentage of Premium Paid by Covered Workers for Single and Family Coverage, by Plan Type, 1999–2010
exhibit 6.23 93Average Percentage of Premium Paid by Covered Workers for Single and Family Coverage, by Plan Type and Region, 2010
exhibit 6.24 94Average Percentage of Premium Paid by Covered Workers, by Plan Type and Industry, 2010
exhibit 6.25 96Percentage of Covered Workers in Firms That Vary Worker Premium Contributions by Wage, by Firm Size and Region, 2010
e m p loye e Co s T s h A r i N g
exhibit 7.1 102Percentage of Covered Workers with No General Annual Health Plan Deductible for Single and Family Coverage, by Plan Type and Firm Size, 2010
exhibit 7.2 103Among Covered Workers with No General Annual Health Plan Deductible for Single and Family Coverage, Percentage Who Have the Following Types of Cost Sharing, by Plan Type, 2010
exhibit 7.3 104Among Covered Workers with a General Annual Health Plan Deductible for Single Coverage, Average Deductible, by Plan Type and Firm Size, 2010
exhibit 7.4 105Among Covered Workers with a General Annual Health Plan Deductible for Single Coverage, Average Deductible, by Plan Type and Region, 2010
exhibit 7.5 106Among Covered Workers with a General Annual Health Plan Deductible for Single Coverage, Average Deductible, by Plan Type, 2006–2010
exhibit 7.6 106Percentage of Covered Workers Enrolled in a Plan with a High General Annual Deductible for Single Coverage, By Firm Size, 2010
exhibit 7.7 107Percentage of Covered Workers Enrolled in a Plan with a General Annual Deductible of $1,000 or More for Single Coverage, By Firm Size, 2006–2010
exhibit 7.8 108Among Covered Workers with a General Annual Health Plan Deductible for Single PPO Coverage, Distribution of Deductibles, 2006–2010
exhibit 7.9 108Among Covered Workers with a General Annual Health Plan Deductible for Single POS Coverage, Distribution of Deductibles, 2006–2010
exhibit 7.10 109Distribution of Type of General Annual Deductible for Covered Workers with Family Coverage, by Plan Type and Firm Size, 2010
exhibit 7.11 110Among Covered Workers with a General Annual Health Plan Deductible, Average Deductibles for Family Coverage, by Deductible Type, Plan Type, and Firm Size, 2010
exhibit 7.12 111Among Covered Workers with a General Annual Health Plan Deductible for Family Coverage, Average Aggregate Deductible, by Plan Type, 2006–2010
exhibit 7.13 111Among Covered Workers with a General Annual Health Plan Deductible for Family Coverage, Distribution of Deductibles, by Plan Type and Deductible Type, 2010
exhibit 7.14 112Among Covered Workers with a Separate per Person General Annual Health Plan Deductible for Family Coverage, Distribution of Maximum Number of Family Members Required to Meet the Deductible, by Plan Type, 2010
exhibit 7.15 113Among Covered Workers with an Aggregate General Annual Health Plan Deductible for Family Coverage, Distribution of Aggregate Deductibles, by Plan Type, 2006–2010
exhibit 7.16 114Among Covered Workers with a General Annual Health Plan Deductible, Percentage with Coverage for the Following Services Without Having to First Meet the Deductible, by Plan Type, 2010

ix
t h e k a i s e r fa m i ly f o u n d at i o n - a n d - h e a lt h r e s e a r C h & e d u C at i o n a l t r u s t
exhibit 7.17 114Distribution of Covered Workers with Separate Cost Sharing for a Hospital Admission in Addition to Any General Annual Deductible, by Plan Type, 2010
exhibit 7.18 115Distribution of Covered Workers with Separate Cost Sharing for an Outpatient Surgery in Addition to Any General Annual Deductible, by Plan Type, 2010
exhibit 7.19 116Among Covered Workers with Separate Cost Sharing for a Hospital Admission or Outpatient Surgery in Addition to Any General Annual Deductible, Average Cost Sharing, by Plan Type, 2010
exhibit 7.20 117In Addition to Any General Annual Plan Deductible, Percentage of Covered Workers with the Following Types of Cost Sharing for Physician Office Visits and Emergency Room Visits, by Plan Type, 2010
exhibit 7.21 118In Addition to Any Plan Deductible, Percentage of Covered Workers with Emergency Room Cost Sharing, by Plan Type, 2010
exhibit 7.22 118Among Covered Workers with Copayments and/or Coinsurance for In-Network Physician Office and Emergency Room Visits, Average Copayments and Coinsurance, by Plan Type, 2010
exhibit 7.23 119Among Covered Workers with Copayments for a Physician Office Visit with a Primary Care Physician, Distribution of Copayments, by Plan Type, 2004–2010
exhibit 7.24 120Among Covered Workers with Copayments for a Physician Office Visit with a Specialty Care Physician, Distribution of Copayments, by Plan Type, 2006–2010
exhibit 7.25 121Among Covered Workers in HMOs with Copayments for a Physician Office Visit, Distribution of Percentage of Workers with Various Copayments, 1999–2010
exhibit 7.26 121Among Covered Workers with Coinsurance for Physician Office Visits, Distribution of Average Coinsurance Rates, by Plan Type, 2010
exhibit 7.27 122Percentage of Covered Workers Without an Annual Out-of-Pocket Maximum for Single and Family Coverage, by Plan Type, 2010
exhibit 7.28 122Among Covered Workers with an Annual Out-of-Pocket Maximum, Percentage Whose Spending for Various Services Does Not Count Towards the Out-of-Pocket Maximum, 2010
exhibit 7.29 123Among Covered Workers with an Out-of-Pocket Maximum for Single Coverage, Distribution of Out-of-Pocket Maximums, by Plan Type, 2010
exhibit 7.30 124Distribution of Type of Out-of-Pocket Maximum for Covered Workers with Family Coverage, by Plan Type and Firm Size, 2010
exhibit 7.31 125Among Covered Workers with an Aggregate Out-of-Pocket Maximum for Family Coverage, Distribution of Out-of-Pocket Maximums, by Plan Type, 2010
exhibit 7.32 126Among Covered Workers with a Separate per Person Out-of-Pocket Maximum for Family Coverage, Distribution of Out-of-Pocket Maximums, by Plan Type, 2010
exhibit 7.33 126Among Covered Workers with a Separate per Person Out-of-Pocket Maximum for Family Coverage, Distribution of Maximum Number of Family Members Required to Meet the Maximum, by Plan Type, 2010
h i g h - D e D u C T i b l e h e A lT h p l A N s W i T h s Av i N g s o p T i o N
exhibit 8.1 132Among Firms Offering Health Benefits, Percentage That Offer an HDHP/HRA and/or an HSA-Qualified HDHP, 2005–2010
exhibit 8.2 132Among Firms Offering Health Benefits, Percentage That Offer an HDHP/SO, by Firm Size, 2010
exhibit 8.3 133Among Firms Offering Health Benefits, Percentage That Offer an HDHP/SO, by Firm Size, 2005–2010

t h e k a i s e r fa m i ly f o u n d at i o n - a n d - h e a lt h r e s e a r C h & e d u C at i o n a l t r u s t
x
exhibit 8.4 133Percentage of Covered Workers Enrolled in an HDHP/HRA or HSA-Qualified HDHP, 2006–2010
exhibit 8.5 134Percentage of Covered Workers Enrolled in an HDHP/HRA or HSA-Qualified HDHP, by Firm Size, 2010
exhibit 8.6 134HDHP/HRA and HSA-Qualified HDHP Features for Covered Workers, 2010
exhibit 8.7 135Average Annual Premiums and Contributions to Savings Accounts for Covered Workers in HDHP/HRAs or HSA-Qualified HDHPs, Compared to All Non-HDHP/SO Plans, 2010
exhibit 8.8 136Distribution of Covered Workers with the Following General Annual Deductible Amounts for Single Coverage, HSA-Qualified HDHPs and HDHP/HRAs, 2010
exhibit 8.9 136Among Covered Workers, Distribution of Type of General Annual Deductible for Family Coverage, HDHP/HRAs and HSA-Qualified HDHPs, 2010
exhibit 8.10 137Distribution of Covered Workers with the Following Aggregate Family Deductible Amounts, HDHP/HRAs and HSA-Qualified HDHPs, 2010
exhibit 8.11 137Percentage of Covered Workers with Coverage for the Following Services Without Having to First Meet the Deductible, HDHP/HRAs and HSA-Qualified HDHPs, by Benefit Type, 2010
exhibit 8.12 138Percentage of Covered Workers in Partially or Completely Self-Funded HDHP/HRAs and HSA-Qualified HDHPs, 2010
exhibit 8.13 138Distribution of Covered Workers with the Following Annual Employer Contributions to their HRA or HSA, for Single Coverage, 2010
exhibit 8.14 139Distribution of Covered Workers with the Following Annual Employer Contributions to their HRA or HSA, for Family Coverage, 2010
exhibit 8.15 139Distribution of Firm Contributions to the HRA for Single and Family Coverage Relative to the Average Annual Firm Contribution to the HRA, 2010
exhibit 8.16 140Distribution of Firm Contributions to the HSA for Single and Family Coverage Relative to the Average Annual Firm Contribution to the HSA, 2010
exhibit 8.17 141Distribution of Covered Workers in HDHP/HRAs and HSA-Qualified HDHPs with the Following Types of Cost Sharing in Addition to the General Annual Deductible, 2010
p r e s C r i p T i o N D r u g b e N e f i T s
exhibit 9.1 146Distribution of Covered Workers Facing Different Cost-Sharing Formulas for Prescription Drug Benefits, 2000–2010
exhibit 9.2 147Distribution of Covered Workers Facing Different Cost-Sharing Formulas for Prescription Drug Benefits, by Plan Type, 2010
exhibit 9.3 148Among Workers with Three, Four, or More Tiers of Cost Sharing, Distribution of Covered Workers with the Following Types of Cost Sharing for Prescription Drugs, by Drug and Plan Type, 2010
exhibit 9.4 149Among Covered Workers with Three, Four, or More Tiers of Prescription Cost Sharing, Average Copayments and Average Coinsurance, 2000–2010
exhibit 9.5 150Among Workers with Two Tiers of Cost Sharing for Prescription Drugs, Distribution of Covered Workers with the Following Types of Cost Sharing for Prescription Drugs, by Drug and Plan Type, 2010
exhibit 9.6 151Among Covered Workers with Two Tiers of Prescription Cost Sharing, Average Copayments and Average Coinsurance, 2000–2010
exhibit 9.7 151Among Workers with the Same Cost Sharing Regardless of Type of Drug, Distribution of Covered Workers with the Following Types of Cost Sharing for Prescription Drugs, by Plan Type, 2010
exhibit 9.8 152Among Covered Workers with the Same Cost Sharing Regardless of Type of Drug, Average Copayments and Average Coinsurance, 2000–2010

xi
t h e k a i s e r fa m i ly f o u n d at i o n - a n d - h e a lt h r e s e a r C h & e d u C at i o n a l t r u s t
p l A N f u N D i N g
exhibit 10.1 155Percentage of Covered Workers in Partially or Completely Self-Funded Plans, by Firm Size, 1999–2010
exhibit 10.2 155Percentage of Covered Workers in Partially or Completely Self-Funded Plans, by Plan Type, 1999–2010
exhibit 10.3 156Percentage of Covered Workers in Partially or Completely Self-Funded Plans, by Firm Size, Region, and Industry, 2010
exhibit 10.4 157Percentage of Covered Workers in Partially or Completely Self-Funded Plans, by Plan Type and Firm Size, 2010
exhibit 10.5 157Percentage of Covered Workers in Partially or Completely Self-Funded HMO Plans, by Firm Size, 1999–2010
exhibit 10.6 158Percentage of Covered Workers in Partially or Completely Self-Funded PPO Plans, by Firm Size, 1999–2010
exhibit 10.7 158Percentage of Covered Workers in Partially or Completely Self-Funded POS Plans, by Firm Size, 1999–2010
exhibit 10.8 159Percentage of Covered Workers in Partially or Completely Self-Funded HDHP/SOs, by Firm Size, 2006–2010
r e T i r e e h e A lT h b e N e f i T s
exhibit 11.1 163Among All Large Firms (200 or More Workers) Offering Health Benefits to Active Workers, Percentage of Firms Offering Retiree Health Benefits, 1988–2010
exhibit 11.2 164Among Firms Offering Health Benefits to Active Workers, Percentage of Firms Offering Retiree Health Benefits, by Firm Size, Region, and Industry, 2010
exhibit 11.3 165Among All Large Firms (200 or More Workers) Offering Health Benefits to Active Workers, Percentage of Firms Offering Retiree Health Benefits, by Firm Characteristics, 2010
exhibit 11.4 166Among All Large Firms (200 or More Workers) Offering Health Benefits to Active Workers and Offering Retiree Coverage, Percentage of Firms Offering Health Benefits to Early and Medicare-Age Retirees, 2000–2010
exhibit 11.5 167Among All Large Firms (200 or More Workers) Offering Health Benefits to Active Workers and Offering Retiree Coverage, Percentage of Firms Offering Retiree Health Benefits to Early and Medicare-Age Retirees, by Firm Size, Region, and Industry, 2010
W e l l N e s s p r o g r A m s , h e A lT h r i s k A s s e s s m e N T s , A N D D i s e A s e m A N Ag e m e N T p r o g r A m s
exhibit 12.1 173Among Firms Offering Health Benefits, Percentage Offering a Particular Wellness Program to Their Employees, by Firm Size, Region, and Industry, 2010
exhibit 12.2 174Among Firms Offering Health Benefits, Percentage Offering a Particular Wellness Program to Their Employees, by Firm Size, Region, and Industry, 2010
exhibit 12.3 175Among Firms Offering Health Benefits, Percentage of Firms with the Following Features of Wellness Benefits, by Firm Size and Region, 2010
exhibit 12.4 176Among Firms Offering Health and Wellness Benefits, Percentage of Firms That Offer Specific Incentives to Employees Who Participate in Wellness Programs, by Firm Size and Region, 2010
exhibit 12.5 177Among Firms Offering Health Benefits and Wellness Programs, Percentage That Use Specific Methods to Identify Individuals and Encourage Participation in Wellness Programs, by Firm Size, Region, and Industry, 2010
exhibit 12.6 178Among Firms Offering Health Benefits and Wellness Programs, Percentage of Firms Reporting the Following as the Firm’s Primary Reason for Offering Wellness Programs, by Firm Size, 2010

xii
t h e k a i s e r fa m i ly f o u n d at i o n - a n d - h e a lt h r e s e a r C h & e d u C at i o n a l t r u s t
exhibit 12.7 178Among Firms Offering Health Benefits and Wellness Programs, Percentage of Firms That Think Offering Wellness Programs is Effective at Improving Health or Reducing Costs, 2010
exhibit 12.8 179Among Firms Offering Health Benefits, Percentage of Firms That Offer Employees Health Risk Assessments, Offer Incentives to Complete Assessments, and Use Assessments to Increase Wellness Participation, by Firm Size and Region, 2010
exhibit 12.9 180Among Firms Offering Financial Incentives for Health Risk Assessments, Percentage of Firms That Offer the Following Incentives to Complete Assessments, by Firm Size and Region, 2010
exhibit 12.10 180Among Firms Offering Health Benefits, Percentage of Firms That Offer a Disease Management Program for Their Plan with the Largest Enrollment and Percentage of Firms with Disease Management Offering Financial Incentives to Participate, by Firm Size, 2010
exhibit 12.11 181Among Firms Offering Health Benefits That Have a Disease Management Program for Their Plan with the Largest Enrollment, Percentage with a Particular Program, by Firm Size, Region, and Industry, 2010
exhibit 12.12 182Among Firms Offering Health Benefits That Have a Disease Management Program for Their Plan with the Largest Enrollment, Percentage with a Particular Program, by Firm Size, Region, and Industry, 2010
e m p loye r o p i N i o N s A N D h e A lT h p l A N p r AC T i C e s
exhibit 13.1 187Among Both Firms Offering and Not Offering Health Benefits, Distribution of Firms’ Opinions on the Effectiveness of the Following Strategies to Contain Health Insurance Costs, by Firm Size, 2010
exhibit 13.2 188Among Firms Offering Health Benefits, Percentage of Firms That Report They Made the Following Changes as a Result of the Economic Downturn, by Firm Size and Region, 2010
exhibit 13.3 189Percentage of Firms Offering Health Benefits That Shopped For a New Plan or Health Insurance Carrier in the Past Year, by Firm Size, 2010
exhibit 13.4 190Among Firms Offering Health Benefits That Shopped for a New Plan or Insurance Carrier, Percentage Reporting That They Changed Insurance Carrier and/or Health Plan Type in the Past Year, by Firm Size, 2010
exhibit 13.5 191Among Firms Offering More Than One Health Plan, Percentage of Firms That Offer Financial Incentives for Enrolling in a Lower Cost Plan or Higher Quality Plan, By Firm Size, 2010
exhibit 13.6 192Among Firms Offering Health Benefits, Percentage of Firms with Specific Plan Offerings and Features in Their Plan with The Largest Enrollment, By Firm Size, 2010
exhibit 13.7 193Percentage of Employers Reporting the Following as a Result of the Mental Health Parity and Addiction Equity Act of 2008, by Firm Size and Region, 2010
exhibit 13.8 194Percentage of Firms That Review Health Plan Performance Indicators, by Firm Size, 2010
exhibit 13.9 194Among Firms Reporting That They Review Health Plan Performance Indicators, Distribution of Firms’ Opinions on the Influence of and Satisfaction with the Indicators, by Firm Size, 2010
exhibit 13.10 195Among Firms Offering Health Benefits, Percentage of Firms Offering Flexible Spending Accounts and Pre-Tax Employee Premium Contributions, By Firm Size, 2010
exhibit 13.11 196Percentage of Covered Workers with an Annual Maximum Benefit for Single Coverage, by Plan Type, 2010
exhibit 13.12 196Percentage of Employers with Coverage for Prescription Contraceptives or Elective Abortions in the Plan with the Largest Enrollment, by Firm Size, 2010

t h e k a i s e r fa m i ly f o u n d at i o n - a n d - h e a lt h r e s e a r C h & e d u C at i o n a l t r u s t
1
The key findings from the 2010 survey, conducted from January through May 2010, include increases in the average single and family premium as well as in the amount workers pay for coverage. About a quarter (27%) of covered workers have a deductible of at least $1,000 for single coverage, and a greater proportion of workers are enrolled in high-deductible health plans with a savings option (HDHP/SO) than in 2009. Firms responded that they increased cost sharing or reduced the scope of coverage, or increased the amount workers pay for insurance as a result of the economic downturn. The 2010 survey continues to track the percentage of firms offering wellness benefits or health risk assessments and also included questions on health plan quality indicators and benefit changes made as result of the Mental Health Parity and Addiction Equity Act.
H E A L T H I N S U R A N C E P R E M I U M S A N D W O R K E R C O N T R I B U T I O N S
The average annual premiums for employer-sponsored health insurance in 2010 are $5,049 for single coverage and $13,770 for family coverage. Compared to 2009, premiums for single coverage are 5% higher ($4,824) and premiums for family coverage are 3% higher ($13,375). Since 2000, average premiums for family coverage have increased 114% (Exhibit A). Average premiums for family coverage are lower for workers in small firms (3–199 workers) than for workers in large firms (200 or more workers) ($13,250 vs. $14,038). Average premiums for high-deductible health plans with a savings option (HDHP/SOs) are lower than the overall average for all plan types for both single and family coverage (Exhibit B). For PPOs, the most common plan type, the average family premium topped $14,000 annually in 2010.
As a result of factors such as benefit differences and geographical cost differences, there is significant variation around the average annual premium. Twenty percent of covered workers are in plans with an annual total premium for family coverage of at least $16,524 (120% of the average premium), while 19% of covered workers are in plans where the family premium is less than $11,016 (80% of the average premium) (Exhibit C).
In 2010, covered workers contributed a greater share of the total premium, a notable change from the steady share workers have paid on average over the last decade. Covered workers on average contribute 19% of the total premium for single coverage (up from 17% in 2009) and 30% for family coverage (up from 27% in 2009). As with total premiums, the premium shares contributed by workers vary considerably around these averages. For single coverage, 28% of workers pay more than 25% of the total premium while 16% make no contribution.
Fifty-one percent of workers with family coverage pay more than 25% of the total premium; only 5% make no contribution (Exhibit D).
Looking at dollar amounts, the average annual worker contributions are $899 for single coverage and $3,997 for family coverage, up from $779 and $3,515 respectively in 2009.2 Workers in small firms (3–199 workers) contribute about the same amount for single coverage as workers in large firms (200 or more workers) ($865 vs. $917), but they contribute significantly more for family coverage ($4,665 vs. $3,652).
P L A N E N R O L L M E N T
The majority (58%) of covered workers are enrolled in preferred provider organizations (PPOs), followed by health maintenance organizations (HMOs) (19%), HDHP/SOs (13%), point-of-service (POS) plans (8%), and conventional plans (1%). Most notably, the percentage of covered workers in HDHP/SOs rose from 8% in 2009 to 13% in 2010.
S u m m a r y o f F i n d i n g s
Employer-sponsored insurance is the leading source of health insurance, covering about 157 million nonelderly
people in america.1 to provide current information about the nature of employer-sponsored health benefits,
the Kaiser family foundation (Kaiser) and the health research & educational trust (hret) conduct an annual
national survey of nonfederal private and public employers with three or more worKers. this is the twelfth
Kaiser/hret survey and reflects health benefit information for 2010.
Employer Contribution Worker Contribution
20102000
$3,997
$9,773
$13,770
$1,619
$4,819
$6,438
114%PremiumIncrease
147%Worker
ContributionIncrease
E x h i b i t A
Average Annual health insurance premiums and Worker Contributions for family Coverage, 2000–2010
source: kaiser/hret survey of employer-sponsored health Benefits, 2000–2010.

2
t h e k a i s e r fa m i ly f o u n d at i o n - a n d - h e a lt h r e s e a r C h & e d u C at i o n a l t r u s t
E M P L O Y E E C O S T S H A R I N G
Most covered workers face additional costs when they use health care services. Most workers in PPOs (77%) and POS plans (66%) have a general annual deductible for single coverage that must be met before all or most services are payable by the plan. In contrast, only 28% of workers in HMOs have a general annual deductible for single coverage, although it is up from 16% in 2009. Many workers with no deductible have other forms of cost sharing for office visits or other services.
Among workers with a deductible, the average general annual deductible for single coverage is $675 for workers in PPOs, $601 for workers in HMOs, $1,048 for workers in POS plans, and $1,903 for workers in HDHP/SOs (which by definition have high deductibles). As in recent years, workers in small firms (3–199 workers) with single
coverage have higher deductibles than workers in large firms (200 or more workers). Average deductibles for single coverage do not vary by region for any plan type. The percentage of covered workers in a plan with a deductible of at least $1,000 for single coverage grew from 22% to 27% in the past year. Covered workers in small firms remain more likely than covered workers in larger firms (46% vs. 17%) to be in plans with deductibles of at least $1,000 (Exhibit E).
Most plans cover certain services before the deductible is met. For example, in the most common plan type, PPOs, 91% of covered workers with a general annual deductible do not have to meet the deductible before preventive care is covered. Seventy percent of covered workers in PPOs do not have to meet the deductible before physician office visits are covered, and 92% do not have to meet the deductible before prescription drugs are covered.
The majority of workers also have to pay a portion of the cost of physician office visits. For example, 75% of covered workers pay a copayment (a fixed dollar amount) and 16% pay coinsurance (a percentage of the charge) for a primary care office visit, and for specialty care visits, 73% of covered workers pay a copayment and 17% pay coinsurance. Most covered workers in HMOs, PPOs, and POS plans face copayments, while covered workers in HDHP/SOs are more likely to have coinsurance requirements or no cost sharing after the deductible is met. Covered workers with a copayment pay an average of $22 for primary care and $31 for specialty physicians for in-network office visits, compared to $20 and $28 respectively for 2009. For covered workers with coinsurance, the average coinsurance is 18% both for primary care and specialty care. The survey collects information on in-network cost sharing, but we note that out-of-network cost sharing is often higher.
E x h i b i t b
Average Annual employer and Worker premium Contributions and Total premiums for Covered Workers for single and family Coverage, by plan Type, 2010
Single
HMO
Family
ALL PLANS
HDHP/SO
Single
Family
PPO
Single
Family
POS
Single
Single
Family
Family
Worker Contribution Employer Contribution
$0 $2,000 $4,000 $6,000 $8,000 $10,000 $12,000 $14,000 $16,000
$1,028*$4,102 $5,130
$4,357 $14,125$9,768
$899 $4,150
$905
$974
$5,195*
$4,265
$8,018*
$4,219
$14,033
$13,213
$12,384*
$13,770
$4,470*
$3,997 $9,773
$3,823
$5,124
$5,239
$10,210
$632*
$3,522
$3,839*
$8,861*
$5,049
* estimate is statistically different from all Plans estimate by coverage type (p<.05).
source: kaiser/hret survey of employer-sponsored health Benefits, 2010.

t h e k a i s e r fa m i ly f o u n d at i o n - a n d - h e a lt h r e s e a r C h & e d u C at i o n a l t r u s t
3
Almost all covered workers (99%) have prescription drug coverage, and the majority face cost sharing for their prescriptions. Over three-quarters (78%) of covered workers are in plans with three or more levels or tiers of cost sharing that are generally based on the type or cost of the drug. Copayments are more common than coinsurance for all four tiers. Among workers with three- or four-tier plans,
the average copayments per prescription are $11 for first-tier drugs, often called generics; $28 for second-tier drugs, often called preferred; $49 for third-tier drugs, often called nonpreferred; and $89 for fourth-tier drugs.
Cost sharing for prescription drugs varies by plan type. Covered workers in HDHP/SOs are more likely than workers in other plan
types to be in plans with no cost sharing after the deductible is met or in plans where the cost sharing is the same regardless of the type of drug.
Most workers also face additional cost sharing for a hospital admission or an outpatient surgery. For hospital admissions, after any general annual deductible, 53% of covered workers have coinsurance,
E x h i b i t C
Distribution of premiums for single and family Coverage relative to the Average Annual single or family premium, 2010
note: the average premium is $5,049 for single coverage and $13,770 for family coverage.
source: kaiser/hret survey of employer-sponsored health Benefits, 2010.
single Coverage family Coverage
premium range, relative to Average premium
Premium range, dollar amount
Percentage of Covered Workers in range
Premium range, dollar amount
Percentage of Covered Workers in range
less than 80% less than $4,039 20% less than $11,016 19%
80% to less than 90% $4,039 to <$4,544 16% $11,016 to <$12,393 18%
90% to less than average $4,544 to <$5,049 21% $12,393 to <$13,770 14%
average to less than 110% $5,049 to <$5,554 16% $13,770 to <$15,147 18%
110% to less than 120% $5,554 to <$6,058 10% $15,147 to <$16,524 12%
120% or more $6,058 or more 17% $16,524 or more 20%
E x h i b i t D
Distribution of the percentage of Total premium paid by Covered Workers for single and family Coverage, by firm size, 2010
* distributions for all small firms and all large firms are statistically different (p<.05).
source: kaiser/hret survey of employer-sponsored health Benefits, 2010.
0% 10% 20% 30% 40% 50% 60% 70% 80% 90% 100%
35% 39% 18% 8%
6% 65% 27%
1%
SINGLE COVERAGE
FAMILY COVERAGE
All Small Firms (3–199 Workers)*
All Large Firms (200 or More Workers)*
ALL FIRMS
All Small Firms (3–199 Workers)*
All Large Firms (200 or More Workers)*
ALL FIRMS
16% 56% 24%
13% 30% 25% 32%
1%50% 40% 8%
4%
5% 43% 35% 16%
Greater than 25%, less than or equal to 50%Greater than 50%
0%Greater than 0%, less than or equal to 25%

4
t h e k a i s e r fa m i ly f o u n d at i o n - a n d - h e a lt h r e s e a r C h & e d u C at i o n a l t r u s t
19% have a copayment, and 10% have both coinsurance and copayments. An additional 5% have a per day (per diem) payment and 5% have a separate annual hospital deductible. For hospital admissions, the average coinsurance rate is 18%, the average copayment is $232 per hospital admission, the average per diem charge is $228, and the average separate hospital deductible is $723.
Although covered workers are often responsible for cost sharing when accessing health services, there is often a limit to the amount of cost sharing workers must pay each year, generally referred to as an out-of-pocket maximum. Eighty-two percent of covered workers have an out-of-pocket maximum for single coverage, but the limits vary considerably. For example, among covered workers in plans that have an out-of-pocket maximum for single coverage, 31% are in plans with an annual out-of-pocket maximum of $3,000 or more, and 16% are in plans with an out-of-pocket maximum of less than $1,500. Even where plans have out-of-pocket limits, not all spending may count toward the out-of-pocket maximum. For example, among workers in PPOs with an out-of-pocket maximum, 74% are in
plans that do not count physician office visit copayments, 32% are in plans that do not count spending for the general annual deductible, and 80% are in plans that do not count prescription drug spending when determining if an enrollee has reached the out-of-pocket limit.
Some health plans limit the amount that the plan will pay in benefits for an enrollee in a year. Twelve percent of covered workers are in plans with an annual limit on benefits for single coverage.
A V A I L A B I L I T Y O F E M P L O Y E R -S P O N S O R E D C O V E R A G E
Sixty-nine percent of firms reported offering health benefits, which is significantly higher than the 60% reported last year (Exhibit F). The change is largely the result of a 13 percentage point increase in offering among firms with 3 to 9 workers. While there has been some instability in this size category in the past, this year’s change is much larger than previously observed, and the reason for such a change is unclear. Given the slow economic recovery and high unemployment, it seems unlikely that many firms began offering coverage.
A possible explanation is that non-offering firms were more likely to fail during the past year, and the attrition of non-offering firms led to a higher offer rate among surviving firms.
The higher offer rate observed for the smallest firms did not produce a large change in the percentage of workers in firms offering benefits because most workers are employed by large firms. The percentage of workers in firms offering health benefits rose from 91% in 2009 to 93% in 2010.
Even in firms that offer coverage, not all workers are covered. Some workers are not eligible to enroll as a result of waiting periods or minimum work-hour rules. Others choose not to enroll, perhaps because of the cost of coverage or their ability to access coverage through a spouse. Among firms that offer coverage, an average of 79% of workers are eligible for the health benefits offered by their employer. Of those eligible, 80% take up coverage, resulting in 63% of workers in firms offering health benefits having coverage through their employer. Among both firms that offer and do not offer health benefits, 59% of workers are covered by health plans offered by their employer, the same percentage as reported last year.
E x h i b i t E
percentage of Covered Workers enrolled in a plan with a general Annual Deductible of $1,000 or more for single Coverage, by firm size, 2006–2010
* estimate is statistically different from estimate for the previous year shown (p<.05).
note: these estimates include workers enrolled in hdhP/so and other plan types. Because we do not collect information on the attributes of conventional plans, to be conservative, we assumed that workers in conventional plans do not have a deductible of $1,000 or more. Because of the low enrollment in conventional plans, the impact of this assumption is minimal.
source: kaiser/hret survey of employer-sponsored health Benefits, 2006–2010.
2006 2007 2008 20102009
All Small Firms (3–199 Workers) All Large Firms (200 or More Workers) All Firms
0%
10%
20%
30%
40%
50%
16%
10%
6%
21%*
12%*
8%
35%*
18%*
9%
40%
22%*
13%*
46%
27%*
17%

t h e k a i s e r fa m i ly f o u n d at i o n - a n d - h e a lt h r e s e a r C h & e d u C at i o n a l t r u s t
5
H I G H - D E D U C T I B L E H E A L T H P L A N S W I T H S A V I N G S O P T I O NHigh-deductible health plans with a savings option include (1) health plans with a deductible of at least $1,000 for single coverage and $2,000 for family coverage offered with an Health Reimbursement Arrangement (HRA), referred to as “HDHP/HRAs,” and (2) high-deductible health plans that meet the federal legal requirements to permit an enrollee to establish and contribute to a Health Savings Account (HSA), referred to as “HSA-qualified HDHPs.”
Fifteen percent of firms offering health benefits offer an HDHP/SO in 2010. Among firms with 1,000 or more workers, 34% offer an HDHP/SO, up from 28% in 2009 and 22% in 2008.
Thirteen percent of covered workers are enrolled in HDHP/SOs, up from 8% in 2009. Seven percent of covered workers are enrolled in HDHP/HRAs, up from 3% in 2009. The percentage of covered workers enrolled in HSA-qualified HDHPs remained steady at 6%. Nine
percent of covered workers in small firms (3–199 workers) are enrolled in HSA-qualified HDHPs, compared to 5% of workers in large firms (200 or more workers) (Exhibit G).
Annual deductibles for single coverage for HDHP/HRAs and HSA-qualified HDHPs average $1,737 and $2,096, respectively, similar to last year. Workers in HSA-qualified HDHPs in small firms (3–199 workers) face higher deductibles for single coverage ($2,284) and family
E x h i b i t F
percentage of firms offering health benefits, by firm size, 1999–2010
* estimate is statistically different from estimate for the previous year shown (p<.05).
note: as noted in the survey design and methods section, estimates presented in this exhibit are based on the sample of both firms that completed the entire survey and those that answered just one question about whether they offer health benefits.
source: kaiser/hret survey of employer-sponsored health Benefits, 1999–2010.
FiRM SiZE 1999 2000 2001 2002 2003 2004 2005 2006 2007 2008 2009 2010
3–9 Workers 56% 57% 58% 58% 55% 52% 47% 48% 45% 49% 46% 59%*
10–24 Workers 74 80 77 70* 76 74 72 73 76 78 72 76
25–49 Workers 86 91 90 86 84 87 87 87 83 90* 87 92
50–199 Workers 97 97 96 95 95 92 93 92 94 94 95 95
All Small Firms (3–199 Workers) 65% 68% 68% 66% 65% 63% 59% 60% 59% 62% 59% 68%*
All Large Firms (200 or More Workers) 99% 99% 99% 98% 98% 99% 98% 98% 99% 99% 98% 99%
ALL FiRMS 66% 69% 68% 66% 66% 63% 60% 61% 60% 63% 60% 69%*
E x h i b i t G
percentage of Covered Workers enrolled in an hDhp/hrA or hsA-Qualified hDhp, by firm size, 2010
* estimates are statistically different between all small firms and all large firms within category (p<.05).
source: kaiser/hret survey of employer-sponsored health Benefits, 2010.
HDHP/HRA HSA-Quali�ed HDHP* HDHP/SO0%
10%
20%
30%
40%
All Small Firms (3–199 Workers)All Large Firms (200 or More Workers)All Firms
7%7% 7% 9%5% 6%
16%12% 13%

6
t h e k a i s e r fa m i ly f o u n d at i o n - a n d - h e a lt h r e s e a r C h & e d u C at i o n a l t r u s t
coverage ($4,258) than workers with HSA-qualified HDHPs in large firms (200 or more workers), where deductibles average $1,895 for single coverage and $3,734 for an aggregate deductible for family coverage.3 Like workers in other plan types, workers in small firms covered by an HDHP/HRA face higher deductibles than workers in large firms with these plans for single coverage ($2,119 vs. $1,541).4
The distinguishing aspect of these high-deductible plans is the savings feature available to employees. Workers enrolled in an HDHP/HRA receive an average annual contribution from their employer of $907 for single coverage and $1,619 for family coverage (Exhibit H). The average HSA contribution is $558 for single coverage and $1,006 for family coverage. Not all firms contribute to the HSA. About two in five firms offering these plans (covering about 65% of workers covered by HSA-qualified HDHPs) make contributions to the HSAs
of their workers. The average employer contributions to HSAs in these contributing firms are $858 for single coverage and $1,546 for family coverage.
The average premiums for single coverage for workers in HSA-qualified HDHPs and HDHP/HRAs are lower than the average premiums for workers in plans that are not HDHP/SOs. For family coverage, the average premium for HSA-qualified HDHPs is lower than the average family premium for workers in plans that are not HDHP/SOs. The average worker contributions to HSA-qualified HDHP single coverage are also lower than the average for non-HDHP/SO plans.
R E T I R E E C O V E R A G ETwenty-eight percent of large firms (200 or more workers) offer retiree health benefits in 2010, which is not statistically different from the 2009 offer rate of 30%, but down from 34% in 2005.5 Only a
small percentage (3%) of small firms (3–199 workers) offer retiree health benefits. Among large firms that offer retiree health benefits, 93% offer health benefits to early retirees (retiring before age 65) and 75% offer health benefits to Medicare-age retirees.
W E L L N E S S B E N E F I T S A N D D I S E A S E M A N A G E M E N TWorkplace wellness programs are seen by some to be an important tool for improving the health behaviors and health of workers and their families. Almost three-fourths (74%) of employers that offer health benefits offer at least one of the following wellness programs: weight loss program, gym membership discounts or on-site exercise facilities, smoking cessation program, personal health coaching, classes in nutrition or healthy living, web-based resources for healthy living, or a wellness newsletter. The percentage of firms offering wellness benefits increased in the past
E x h i b i t h
Average Annual premiums and Contributions to savings Accounts for Covered Workers in hDhp/hrAs or hsA-Qualified hDhps, Compared to All Non-hDhp/so plans, 2010
* estimate is statistically different from estimate for all non-hdhP/so Plans (p<.05). ‡ When those firms that do not contribute to the hsa (60% for single coverage and 61% for family coverage) are excluded from the calculation, the average firm contribution to the hsa
for covered workers is $858 for single coverage and $1,546 for family coverage. for hdhP/hras, we refer to the amount that the employer commits to make available to an hra as a contribution for ease of discussion. hras are notional accounts, and employers are not required to actually transfer funds until an employee incurs expenses. thus, employers may not expend the entire amount that they commit to make available to their employees through an hra. therefore, the employer contribution amounts to hras that we capture in the survey may exceed the amount that employers will actually spend.
§ in order to compare costs for hdhP/sos to all other plans that are not hdhP/sos, we created composite variables excluding hdhP/so data.
na: not applicable.
note: Values shown in the table may not equal the sum of their component parts. the averages presented in the table are aggregated at the firm level and then averaged, which is methodologically more appropriate than adding the averages. this is relevant for total annual Premium, total annual firm Contribution, and total annual Cost.
source: kaiser/hret survey of employer-sponsored health Benefits, 2010.
hDhP/hRA hSA-Qualified hDhP Non-hDhP/SO Plans§
single family single family single family
total Annual Premium $4,702* $13,068 $4,233* $11,683* $5,136 $13,979
Worker Contribution to Premium $799 $3,604 $444* $3,457 $939 $4,069
firm Contribution to Premium $3,903 $9,464 $3,789* $8,225* $4,197 $9,910
Annual Firm Contribution to the hRA or hSA‡ $907 $1,619 $558 $1,006 na na
total Annual Firm Contribution (firm share of Premium Plus firm Contribution to hra or hsa) $4,810* $11,083* $4,347 $9,231 $4,197 $9,910
total Annual Cost (total Premium Plus firm Contribution to hra or hsa, if applicable) $5,608* $14,687 $4,791* $12,688* $5,136 $13,979

t h e k a i s e r fa m i ly f o u n d at i o n - a n d - h e a lt h r e s e a r C h & e d u C at i o n a l t r u s t
7
year (from 58% in 2009), however the increase was primarily the result of a higher percentage of firms (51%) reporting the availability of web-based resources for healthy living in 2010 than in 2009 (36%). Firms offering health coverage and wellness benefits report that most wellness benefits (87%) are provided through the health plan rather than by the firm directly. Only a small percentage of firms (10%) offering health benefits and one of the specified wellness programs offer incentives for workers to participate in the wellness program.
Health risk assessments provide a way for employers and plans to identify potential health risks and needs of covered workers. Eleven percent of firms offering health benefits give their employees the option of completing a health risk assessment, and over one-half (53%) of these firms use health risk assessments as a method to identify people for participation in a wellness program.6 Large firms (200 or more workers) are more likely to offer a health risk assessment to employees than small firms (3– 199 workers) (55% vs. 10%). Twenty-two percent of firms offering health risk assessments offer financial incentives for workers to complete them. Large firms are more likely than small firms to offer financial incentives (36% vs. 19%). Among firms that reported offering financial incentives to employees that complete a health risk assessment,
39% of firms reported that they offer gift cards, travel, merchandise, or cash;7 14% of firms reported that employees pay a smaller share of the premium; 8% reported employees have a smaller deductible; and 1% reported employees have a lower coinsurance rate.
Thirty-one percent of firms offering health benefits reported that their largest plan includes one or more disease management programs, similar to the 26% reported in 2008 when the question was last asked. Large firms (200 or more workers) are more likely than small firms (3–199 workers) to include a disease management program in their largest plan (67% vs. 30%).
O T H E R T O P I C S
health Plan Quality. In 2010, we asked firms whether they review performance indicators on health plans’ clinical and service quality. Large firms (200 or more workers) were more likely to review performance indicators than small firms (3–199 workers) (34% vs. 5%). Among those who reported reviewing performance indicators, the most common indicators used were the Consumer Assessment of Healthcare Providers and Systems (CAHPS) (77%) and hospital outcomes data (61%). Seventy-four percent reported that they were “somewhat satisfied” or “very satisfied” with the information
available on health plan quality. However, only 49% reported that the information was “somewhat influential” or “very influential” in their decision to select health plans.
Response to the Economic Downturn. For the last two years we have asked employers about changes that they made to their health benefits in response to the poor economy. This year, 30% of employers responded that they reduced the scope of health benefits or increased cost sharing, and 23% said that they increased the share of the premium a worker has to pay. Among large firms (200 or more workers), 38% reported reducing the scope of benefits or increasing cost sharing, up from 22% in 2009, while 36% reported increasing their workers’ premium share, up from 22% in 2009.
Mental health Parity. The enactment of the Mental Health Parity and Addiction Equity Act in 2008 led firms with more than 50 workers to make changes in their mental health benefits.8 Thirty-one percent of firms with more than 50 workers responded that they had made changes; large firms (200 or more workers) were more likely to have done so than small firms (51–199 workers) (43% vs. 26%). Among firms that changed their benefits, two-thirds (66%) eliminated limits on coverage, 16% increased utilization management for mental health benefits, and 5% indicated they dropped mental health coverage (Exhibit I).
E x h i b i t i
percentage of firms With more Than 50 Workers reporting the following as a result of the 2008 mental health parity and Addiction equity Act, 2010
‡among firms reporting they made changes to the mental health benefits they offer as a result of the mental health Parity and addiction equity act of 2008.
source: kaiser/hret survey of employer-sponsored health Benefits, 2010.
0% 20% 40% 60% 80% 100%
Changed Mental Health Bene�ts
Eliminated Limits on Coverage‡
Dropped Mental Health Coverage‡
Increased Utilization Management of Mental Health Bene�ts‡
Other‡
31%
66%
5%
16%
23%

8
t h e k a i s e r fa m i ly f o u n d at i o n - a n d - h e a lt h r e s e a r C h & e d u C at i o n a l t r u s t
C O N C L U S I O N
The 2010 survey finds a continuation of the modest premium growth we have seen in recent years and higher out-of-pocket costs for employees. Premiums increased just 5% for single coverage and 3% for family coverage between 2009 and 2010. At the same time, workers saw their share of the premiums for single and family coverage
grow for the first time in several years. The percentage of workers in plans with a deductible of at least $1,000 for single coverage continues to climb, with over a quarter (27%) of workers in large firms and almost one-half (46%) of workers in small firms in such plans. The percentage of workers in HDHP/SOs rose significantly from 8% to 13% over the last year.
Tracking whether and how worker out-of-pocket costs continue to grow will be an important focus for the survey over the next few years. The slow economic recovery and continuing high unemployment suggests that this trend of increasing out-of-pocket costs will persist, as workers have little clout to demand better benefits or lower costs in the current labor environment.
__________________________________________________________________________________________________________________________________________________________1 kaiser family foundation, kaiser Commission on medicaid and the uninsured, The Uninsured: A Primer, october 2009.2 the average worker contributions include those workers with no contribution.3 data presented are for workers with a family aggregate deductible where spending by any covered person in the family counts toward the deductible.4 there are insufficient data for average hdhP/hra aggregate deductibles in small firms to make the comparison for family coverage.5 We now count the 0.46% of large firms that indicate they offer retiree coverage but have no retirees as offering retiree health benefits. historical numbers have been recalculated so that the
results are comparable.6 health risk assessments generally include questions on medical history, health status, and lifestyle.7 in 2010, we ask only those firms that offer financial incentives to employees who complete a health risk assessment if they provide gift cards, travel, merchandise, or cash, whereas in 2009, this
question was asked of all firms offering health risk assessments, including those who responded that they did not offer financial incentives.8 for more information on the mental health Parity and addiction equity act of 2008, see www.cms.gov/healthinsreformforconsume/04_thementalhealthparityact.asp.

69%$13,7
70
$5,0
49
2010
Employer Health Benefits2 0 1 0 a n n u a l s u r V e y
SurveyDesign
andMethods

Employer Health Benefits 2 0 1 0 An n u a l s u r vey
10
t h e k a i s e r fa m i ly f o u n d at i o n - a n d - h e a lt h r e s e a r C h & e d u C at i o n a l t r u s t
Survey Design and M
ethods
S u r v e y D e S i g n a n D M e t h o D S
the Kaiser family foundation and the health research & educational trust (Kaiser/hret )
conduct this annual survey of employer-sponsored health benefits. hret, a nonprofit research
organization, is an affiliate of the american hospital association. the Kaiser family foundation
designs, analyzes, and conducts this survey in partnership with hret, and also pays for the cost of
the survey. hret subcontracts with researchers at national opinion research center (norc) at the
university of chicago, who worK with foundation and hret researchers in conducting the study.
Kaiser/hret retained national research, llc (nr), a washington, d.c.-based survey research firm,
to conduct telephone interviews with human resource and benefits managers using the Kaiser/hret
survey instrument. from January to may 2010 nr completed full interviews with 2,046 firms.
s u r v e y T o p i C s
As in past years, Kaiser/HRET asked each participating firm as many as 400 questions about its largest health maintenance organization (HMO), preferred provider organization (PPO), point-of-service (POS) plan, and high-deductible health plan with a savings option (HDHP/SO).1 In 2006, Kaiser/HRET began asking employers if they had a health plan that was an exclusive provider organization (EPO). We treat EPOs and HMOs together as one plan type and report the information under the banner of “HMO;” if an employer sponsors both an HMO and an EPO, they are asked about the attributes of the plan with the larger enrollment.
New topics in the 2010 survey include questions on eligibility for dependent coverage, coverage for care received at retail clinics, health plan changes as a result of the Mental Health Parity and Addiction Equity Act of 2008, and disease management. As in past years, this year’s survey included questions on the cost of health insurance, offer rates, coverage, eligibility, enrollment patterns, premiums,2 employee cost sharing, prescription drug benefits, retiree health benefits, wellness benefits, and employer opinions.
1 hdhP/so includes high-deductible health plans offered with either a health reimbursement arrangement (hra) or a health savings account (hsa). although hras can be offered along with a health plan that is not an hdhP, the survey collected information only on hras that are offered along with hdhPs. for specific definitions of hdhPs, hras, and hsas, see the introduction to section 8.
2 hdhP/so premium estimates do not include contributions made by the employer to health savings accounts or health reimbursement arrangements.
3 in total, 185 firms participated in 2007 and 2009, 367 firms participated in 2008 and 2009, and 939 firms participated in 2007, 2008, and 2009.
n o t e :
r e s p o N s e r AT e
After determining the required sample from U.S. Census Bureau data, Kaiser/HRET drew its sample from a Survey Sampling Incorporated list (based on an original Dun and Bradstreet list) of the nation’s private employers and from the Census Bureau’s Census of Governments list of public employers with three or more workers. To increase precision, Kaiser/HRET stratified the sample by industry and the number of workers in the firm. Kaiser/HRET attempted to repeat interviews with prior years’ survey respondents (with at least ten employees) who also participated in either the 2008 or the 2009 survey, or both. As a result, 1,547 firms in this year’s total sample of 2,046 firms participated in either the 2008, 2009, or both surveys.3 The overall response rate is 47%.
The vast majority of questions are asked only of firms that offer health benefits. A total of 1,892 responding firms indicated that they offered health benefits. The overall response rate of firms that offer health benefits is 48%.
We asked one question of all firms in the study with which we made phone contact where the firm declined

Employer Health Benefits 2 0 1 0 An n u a l s u r vey
11
t h e k a i s e r fa m i ly f o u n d at i o n - a n d - h e a lt h r e s e a r C h & e d u C at i o n a l t r u s t
Survey Design and M
ethods
to participate. The question was, “Does your company offer a health insurance program as a benefit to any of your employees?” A total of 3,143 firms responded to this question (including 2,046 who responded to the full survey and 1,097 who responded to this one question). Their responses are included in our estimates of the percentage of firms offering health benefits.4 The response rate for this question is 73%.
f i r m s i z e C AT e g o r i e s A N D k e y D e f i N i T i o N s
Throughout the report, exhibits categorize data by size of firm, region, and industry. Firm size definitions are as follows: All Small, 3 to 199 workers; and All Large, 200 or more workers. Occasionally, firm size categories will be broken into smaller groups. The All Small group may be categorized by: 3 to 24 workers, and 25 to 199 workers; or 3 to 9 workers, 10 to 24 workers, 25 to 49 workers, and 50 to 199 workers. The All Large group may be categorized by: 200 to 999 workers, 1,000 to 4,999 workers, and 5,000 or more workers. Exhibit M.1 shows selected characteristics of the survey sample. Exhibit M.3 identifies which states are in each region.
Exhibit M.2 displays the distribution of the nation’s firms, workers, and covered workers (employees receiving coverage from their employer). Among the over three million firms nationally, approximately 59.6% are firms employing 3 to 9 workers; such firms employ 8.3% of workers and 5.5% of workers covered by health insurance. In contrast, one percent of firms are firms employing 1,000 or more workers; these firms employ 47.5% of workers and 51.3% of covered workers. Therefore, the smallest firms dominate any national statistics about what employers in general are doing. In contrast, firms with 1,000 or more workers are the most important employer group in calculating statistics regarding covered workers, since they employ the largest percentage of the nation’s workforce.
Throughout this report, we use the term “in-network” to refer to services received from a preferred provider. Family coverage is defined as health coverage for a family of four.
Each year, the survey asks firms for the percentage of their employees that earn less than a specified amount. This year, the income threshold remained at $23,000 per year. This threshold is based on the 25th percentile of workers’ earnings as reported by the Bureau of Labor
Statistics using data from the National Compensation Survey (2008), the most current data available at the time of the survey design. The threshold was then adjusted to account for the change in workers’ earnings from 2008 to 2009, using the Bureau of Labor Statistics’ Employment Cost Index.
r o u N D i N g A N D i m p u TAT i o N
Some exhibits in the report do not sum to totals due to rounding effects. In a few cases, numbers from distribution exhibits may not add to equal numbers referenced in the text due to rounding effects. Although overall totals and totals for size and industry are statistically valid, some breakdowns may not be available due to limited sample sizes. Where the unweighted sample size is fewer than 30, exhibits include the notation “NSD” (Not Sufficient Data).
To control for item nonresponse bias, Kaiser/HRET imputes values that are missing for most variables in the survey. In general, less than 5% of observations are imputed for any given variable. All variables are imputed following a hotdeck approach. In 2010, there were four variables where the imputation rate exceeded 20% but was less than 30%. For these cases, the unimputed variable was compared with the imputed variable and there is no statistically significant difference. There are a few variables that Kaiser/HRET has decided should not be imputed; these are typically variables where “don’t know” is considered a valid response option (for example, firms’ opinions about effectiveness of various strategies to control health insurance costs).
s A m p l e D e s i g N
We determined the sample requirements based on the universe of firms obtained from the U.S. Census. Prior to the 2009 survey, the sample requirements were based on the total counts provided by Survey Sampling Incorporated (SSI) (which obtains data from Dun and Bradstreet). Over the years, we have found the Dun and Bradstreet frequency counts to be volatile because of duplicate listings of firms, or firms that are no longer in business. These inaccuracies vary by firm size and industry. In 2003, we began using the more consistent and accurate counts provided by the Census Bureau’s Statistics of U.S. Businesses and the Census of Governments as the basis for post-stratification,
4 estimates presented in exhibits 2.1, 2.2 and 2.3 are based on the sample of both firms that completed the entire survey and those that answered just one question about whether they offer health benefits.
n o t e :

Employer Health Benefits 2 0 1 0 An n u a l s u r vey
12
t h e k a i s e r fa m i ly f o u n d at i o n - a n d - h e a lt h r e s e a r C h & e d u C at i o n a l t r u s t
Survey Design and M
ethods
although the sample was still drawn from a Dun and Bradstreet list. In order to further address this concern at the time of sampling, we now also use Census data as the basis for the sample.
We also define Education as a separate sampling category, rather than as a subgroup of the Service category. Prior to 2009, Education firms were a disproportionately large share of Service firms. Education is controlled for during post-stratification, and adjusting the sampling frame to also control for Education allows for a more accurate representation of both Education and Service industries.
In past years, both private and government firms were sampled from the Dun and Bradstreet database. Beginning in 2009, Government firms were sampled in-house from the 2007 Census of Governments. This change was made to eliminate the overlap of state agencies that were frequently sampled from the Dun and Bradstreet database. The sample of private firms is screened for firms that are related to state/local governments, and if these firms are identified in the Census of Governments, they are reclassified as government firms and a private firm is randomly drawn to replace the reclassified firm.
Finally, the data used to determine the 2010 Employer Health Benefits sample frame include the U.S. Census’ 2006 Statistics of U.S. Businesses and the 2007 Census of Governments. At the time of the sample design (December 2009), these data represented the most current information on the number of public and private firms nationwide with three or more workers. As in the past, the post-stratification is based on the most up-to-date Census data available (the 2007 update to the Census of U.S. Businesses was purchased during the survey field period) and the 2007 Census of Governments. The Census of Governments is conducted every five years, and this is the second year the data from the 2007 Census of Governments have been available for use.
W e i g h T i N g A N D s TAT i s T i C A l s i g N i f i C A N C e
Because Kaiser/HRET selects firms randomly, it is possible through the use of statistical weights to extrapolate the results to national (as well as firm size, regional, and industry) averages. These weights allow Kaiser/HRET to present findings based on the number of workers covered by health plans, the number of total workers, and the number of firms. In general, findings in dollar amounts (such as premiums, worker contributions, and cost sharing) are weighted by covered workers. Other estimates, such as the offer
rate, are weighted by firms. Specific weights were created to analyze the HDHP/SO plans that are offered with an HRA or that are HSA-qualified. These weights represent the proportion of employees enrolled in each of these arrangements.
Calculation of the weights follows a common approach. First, the basic weight is determined, followed by a nonresponse adjustment. As part of this nonresponse adjustment, Kaiser/HRET conducted a small follow-up survey of with small employers that refused to participate in the full survey. The follow-up survey is conducted in order to address concern regarding self-selection bias among small firms. Firms in the sample with 3–49 workers that did not complete the full survey are contacted and asked (or re-asked in the case of firms that previously responded to only one question about offering benefits) whether or not the firm offers health benefits. As part of the process, we conduct a McNemar test to verify that the results of the follow-up survey are comparable to the results from the original survey. If the test indicates that the results are comparable, a nonresponse adjustment is applied to the weights used when calculating firm offer rates. This year, for the first time since we began conducting the follow-up survey, the test indicated that the results from those answering the one question about offering health benefits in the original survey and those answering the follow-up survey were different (statistically significant difference at the p<0.05 level between the two surveys), suggesting the results are not comparable. Therefore, we did not use the results of this follow-up survey to adjust the weights as we have in the past. In the past, the nonresponse adjustment lowered the offer rate for smaller firms by one to three percentage points, so not making the adjustment this year makes the offer rate look somewhat higher when making comparisons to prior years. For 2010, we saw a very large and unexpected increase in the offer rate (from 60 percent in 2009 to 69 percent in 2010) overall and particularly for firms with 3 to 9 workers (from 46 percent in 2009 to 59 percent in 2010). While not making the adjustment this year added to the size of the change, there would have been a large and difficult to explain change even if a nonresponse adjustment comparable to previous years had been made.
Next, we trimmed the weights in order to reduce the influence of weight outliers. First, we identified common groups of observations. Within each group, we identified the median and the interquartile range of the weights and calculated the trimming cut point as the median plus six times the interquartile range (M + [6 * IQR]). Weight

Employer Health Benefits 2 0 1 0 An n u a l s u r vey
13
t h e k a i s e r fa m i ly f o u n d at i o n - a n d - h e a lt h r e s e a r C h & e d u C at i o n a l t r u s t
Survey Design and M
ethods
values larger than this cut point are trimmed to the cut point. In all instances, less than one percent of the weight values were trimmed.
Finally, we applied a post-stratification adjustment. We used the U.S. Census Bureau’s 2007 Statistics of U.S. Businesses as the basis for the stratification and the post-stratification adjustment for firms in the private sector, and we used the 2007 Census of Governments as the basis for post-stratification for public sector firms.
We continue to ask firms whether or not they offer a conventional health plan and, if so, how many of their covered workers are enrolled in that plan and whether it is self-funded or underwritten by an insurer. However, due to the declining market share of conventional health plans, in 2006, we stopped asking respondents additional questions about the attributes of the conventional plans they offer.5 As of 2009 our primary covered worker weight no longer includes those workers with conventional coverage. Therefore, premium and cost-sharing levels are estimated among workers covered by an HMO, PPO, POS plan, or HDHP/SO. Removing workers covered by conventional health insurance from the covered worker weight has little impact on the estimates reported for “All Plans,” such as the average single or family premium. In cases where a firm offers only conventional health plans, no information from that respondent is included in “All Plan” averages. The exception is for whether or not the plan is self-funded, for which we have information. For enrollment statistics, we weight the statistics by all covered workers, including those in conventional insurance.
The survey contains a few questions on employee cost sharing that are asked only of firms that indicate in a previous question that they have a certain cost-sharing provision. For example, the copayment amount for prescription drugs is asked only of those that report they have copayments for prescription drugs. Because the composite variables (using data from across all plan types) are reflective of only those plans with the provision, separate weights for the relevant variables were created in order to account for the fact that not all covered workers have such provisions.
The data are analyzed with SUDAAN,6 which computes appropriate standard error estimates by controlling for the complex design of the survey.7 All statistical tests are performed at the 0.05 level, unless otherwise noted. For figures with multiple years, statistical tests are conducted for each year against the previous year shown, unless otherwise noted. No statistical tests are conducted for years prior to 1999.
Statistical tests for a given subgroup (firms with 25–49 workers, for instance) are tested against all other firm sizes not included in that subgroup (all firm sizes NOT including firms with 25–49 workers, in this example). Tests are done similarly for region and industry; for example, Northeast is compared to all firms NOT in the Northeast (an aggregate of firms in the Midwest, South, and West). However, statistical tests for estimates compared across plan types (for example, average premiums in PPOs) are tested against the “All Plans” estimate. In some cases, we also test plan-specific estimates against similar estimates for other plan types (for example, single and family premiums for HDHP/SOs against single and family premiums for HMO, PPO, and POS plans); these are noted specifically in the text. The two types of statistical tests performed are the t-test and the Pearson Chi-square test.
The small number of observations for some variables, particularly variables specific to plans with Health Savings Accounts or Health Reimbursement Arrangements, resulted in large variability around the point estimates. These observations sometimes carry large weights, primarily for small firms. The reader should be cautioned that these influential weights may result in large movements in point estimates from year to year; however, often these movements are not statistically significant.
h i s T o r i C A l D ATA
Data in this report focus primarily on findings from surveys jointly authored by the Kaiser Family Foundation and the Health Research & Educational Trust, which have been conducted since 1999. Prior to 1999, the survey was conducted by the Health Insurance Association of America (HIAA) and KPMG using a similar survey instrument, but data are not
5 in 2010, 1% of covered workers are enrolled in a conventional plan.6 research triangle institute (2008). sudaan software for the statistical analysis of Correlated data, release 10.0, research
triangle Park, nC: research triangle institute.7 a technical supplement with standard errors for select estimates for the 2010 employer health Benefits survey can be found
online at www.kff.org/insurance/8085/index.cfm.
n o t e :

Employer Health Benefits 2 0 1 0 An n u a l s u r vey
14
t h e k a i s e r fa m i ly f o u n d at i o n - a n d - h e a lt h r e s e a r C h & e d u C at i o n a l t r u s t
Survey Design and M
ethods
available for all the intervening years. Following the survey’s introduction in 1987, the HIAA conducted the survey through 1990, but some data are not available for analysis. KPMG conducted the survey from 1991–1998. However, in 1991, 1992, 1994, and 1997, only larger firms were sampled. In 1993, 1995, 1996, and 1998, KPMG interviewed both large and small firms. In 1998, KPMG divested itself of its Compensation and Benefits Practice, and part of that divestiture included donating the annual survey of health benefits to HRET.
This report uses historical data from the 1993, 1996, and 1998 KPMG Surveys of Employer-Sponsored Health Benefits and the 1999-2009 Kaiser/HRET Survey of Employer-Sponsored Health Benefits. For a longer-term perspective, we also use the 1988 survey of the nation’s employers conducted by the HIAA, on which the KPMG and Kaiser/HRET surveys are based. The survey designs for the three surveys are similar.

Survey Design and M
ethodsEmployer Health Benefits 2 0 1 0 An n u a l s u r vey
15
t h e k a i s e r fa m i ly f o u n d at i o n - a n d - h e a lt h r e s e a r C h & e d u C at i o n a l t r u s t
kaiser/hret survey of employer-sponsored health Benefits, 2010.
s o u r c e :
e x h i B i t m .1
selec ted Charac ter ist ics of fi rms in the sur vey sample, 2010
sample sizesample distribution
after WeightingPercentage of total
for Weighted sample
firm size
3–9 Workers 91 2,030,546 59.6%
10–24 Workers 211 795,120 23.3
25–49 Workers 170 282,541 8.3
50–199 Workers 300 211,879 6.2
200–999 Workers 470 60,925 1.8
1,000–4,999 Workers 483 17,545 0.5
5,000 or more Workers 321 8,242 0.2
All firm sizes 2,046 3,406,798 100%
regioNnortheast 416 662,248 19.4%midwest 579 776,201 22.8south 678 1,167,470 34.3West 373 800,879 23.5
All regioNs 2,046 3,406,798 100%
iNDusTryagriculture/mining/Construction 126 421,087 12.4%manufacturing 201 209,101 6.1transportation/Communications/utilities 121 128,114 3.8Wholesale 105 193,150 5.7retail 142 423,924 12.4finance 130 234,153 6.9service 893 1,345,065 39.5state/local Government 138 50,587 1.5health Care 190 401,617 11.8
All iNDusTries 2,046 3,406,798 100%

Survey Design and M
ethods
Employer Health Benefits 2 0 1 0 An n u a l s u r vey
16
t h e k a i s e r fa m i ly f o u n d at i o n - a n d - h e a lt h r e s e a r C h & e d u C at i o n a l t r u s t
e x h i B i t m .2
distr ibution of employers, Workers, and Workers Covered by health Benef its, by firm size, 2010
0%
10%
20%
30%
40%
50%
60%
70%
80%
90%
100%
EMPLOYERS WORKERS COVERED WORKERS
5,000 OR MORE WORKERS
1,000–4,999 WORKERS
200–999 WORKERS
50–199 WORKERS
25–49 WORKERS
10–24 WORKERS
3–9 WORKERS
59.6%
8.3% 5.5%
8.3%
23.3%
7.5%
9.4%7.5%
7.6%
0.2% 0.5%
6.2%1.8%
34.6%
12.9%
13.4%
14.0%
36.9%
14.4%
13.8%
14.3%
note: data are based on a special data request to the u.s. Census Bureau for their most recent (2007) statistics of u.s. Businesses data on private sector firms. state and local government data are from the Census Bureau’s 2007 Census of Governments.
kaiser/hret survey of employer-sponsored health Benefits, 2010.
s o u r c e :

Survey Design and M
ethodsEmployer Health Benefits 2 0 1 0 An n u a l s u r vey
17
t h e k a i s e r fa m i ly f o u n d at i o n - a n d - h e a lt h r e s e a r C h & e d u C at i o n a l t r u s t
e x h i B i t m .3
states by region, 2010
kaiser/hret survey of employer-sponsored health Benefits, 2010; u.s. department of Commerce, economics and statistics administration, u.s. Census Bureau, available at http://www.census.gov/geo/www/us_regdiv.pdf.
s o u r c e :
Northeast midwest south West
Connecticut illinois alabama alaska
maine indiana arkansas arizona
massachusetts iowa delaware California
new hampshire kansas district of Columbia Colorado
new Jersey michigan florida hawaii
new york minnesota Georgia idaho
Pennsylvania missouri kentucky montana
rhode island nebraska louisiana nevada
Vermont north dakota maryland new mexico
ohio mississippi oregon
south dakota north Carolina utah
Wisconsin oklahoma Washington
south Carolina Wyoming
tennessee
texas
Virginia
West Virginia


69%$13,7
70
$5,0
49
2010
Employer Health Benefits2 0 1 0 a n n u a l s u r V e y
s ect ion
Cost of Health
Insurance
1

section
on
eC
ost of Health Insurance
1
Employer Health Benefits 2 0 1 0 An n u a l s u r vey
20
t h e k a i s e r fa m i ly f o u n d at i o n - a n d - h e a lt h r e s e a r C h & e d u C at i o n a l t r u s t
C o S t o f h e a l t h i n S u r a n C e
The average annual premiums in 2010 are $5,049 for single coverage and $13,770 for family coverage.
compared To 2009, The average premiums are abouT 5% and 3% higher for single and family coverage,
respecTively.
smaller firms (3–199 workers) have a lower average family premium ($13,250) Than larger firms (200
or more workers) ($14,038).
p r e m i u m C o s T s f o r s i N g l e
A N D fA m i ly C o v e r A g e
�The average cost of premiums for single coverage in 2010 is $421 per month or $5,049 per year (Exhibit 1.1). The average cost of premiums for family coverage is $1,147 per month or $13,770 per year (Exhibit 1.1).
�The average premiums for covered workers in HDHP/SOs are lower for single and family coverage than the overall average premiums for covered workers (Exhibit 1.1).
�The average premium for family coverage for covered workers in small firms (3–199 workers) is lower than the average premium for workers in large firms (200 or more workers) (Exhibit 1.2). The average single premiums are similar for covered workers in small and large firms.
�Average single and family premiums for covered workers are higher in the Northeast and lower in the South than the average premiums for covered workers in other regions (Exhibit 1.3).
�Premiums also vary by plan funding and workforce attributes.
Average single and family premiums are higher for covered workers in firms with at least some union workers than for covered workers in firms with no union employees (Exhibit 1.5 and 1.6).
Covered workers in firms where 35% or more of workers are age 50 or older have higher average single and family premiums than covered workers in firms with a lower percentage of workers age 50 or older (Exhibits 1.5 and 1.6).
Average single and family premiums are similar for covered workers in partially or fully self-funded plans or in fully insured plans (Exhibit 1.5 and 1.6). However, among large firms (200 or more workers), where most firms self fund their health benefits, workers in firms that are self-funded have lower single and family premiums than workers in firms that have insured benefits (Exhibits 1.5 and 1.6).
�There is a great deal of variation above and below the average premiums for both single and family coverage.
Seventeen percent of covered workers are employed by firms that have a single premium that is at least 20% higher than the average single premium of $5,049, while 20% of covered workers are in firms that have a single premium that is less than 80% of the average single premium (Exhibit 1.7 and 1.8).
For family coverage, 20% of covered workers are employed in a firm that has a family premium that is at least 20% higher than the average family premium of $13,770, while 19% of covered workers are in firms that have a family premium that is less than 80% of the average family premium (Exhibit 1.7 and 1.8).
p r e m i u m C h A N g e s o v e r T i m e
�In 2010, the average annual single premium ($5,049) is 5% higher than the average premium in 2009 ($4,824) and the family premium ($13,770) is about 3% higher than the average annual family premium we reported last year ($13,375) (Exhibit 1.11).
The $13,770 average annual family premium in 2010 is 27% higher than the average family premium in 2005 and 114% higher than the average family premium in 2000 (Exhibit 1.11).

section
on
e
1
Cost of H
ealth InsuranceEmployer Health Benefits 2 0 1 0 An n u a l s u r vey
21
t h e k a i s e r fa m i ly f o u n d at i o n - a n d - h e a lt h r e s e a r C h & e d u C at i o n a l t r u s t
�For the third year in a row, the average annual family premium for covered workers in small firms (3–199 workers) is significantly lower than the average annual family premium for covered workers in large firms (200 or more workers). The average annual family premiums for covered workers in small and large firms have been similar in most other earlier years (Exhibit 1.12).
The average annual family premiums for covered workers in small and large firms have grown at similar rates between 2005 and 2010 (25% in small firms vs. 27% in large firms). Between
2000 and 2010, the average annual family premium for covered workers in small firms increased 103%, compared to an increase of 120% for workers in large firms (Exhibit 1.13).
For large firms (200 or more workers), the average annual family premium for covered workers in firms that are fully insured has grown faster than for workers in fully or partially self-funded firms from 2005 to 2010 (35% in fully insured firms vs. 26% in self-funded firms) and from 2000 to 2010 (132% in fully insured firms vs. 116% in self-funded firms) (Exhibit 1.14).

section
on
eC
ost of Health Insurance
1
Employer Health Benefits 2 0 1 0 An n u a l s u r vey
22
t h e k a i s e r fa m i ly f o u n d at i o n - a n d - h e a lt h r e s e a r C h & e d u C at i o n a l t r u s t
e x h i B i t 1 .1
average monthly and annual Premiums for Covered Workers, s ingle and family Coverage, by Plan type, 2010
monthly annual
hmo
single Coverage $428 $5,130
family Coverage $1,177 $14,125
ppo
single Coverage $427 $5,124
family Coverage $1,169 $14,033
possingle Coverage $437 $5,239family Coverage $1,101 $13,213
hDhp/so
single Coverage $373* $4,470*
family Coverage $1,032* $12,384*
All plAN Typessingle Coverage $421 $5,049family Coverage $1,147 $13,770
* estimate is statistically different from all Plans estimate (p<.05).
kaiser/hret survey of employer-sponsored health Benefits, 2010.
s o u r c e :

section
on
e
1
Cost of H
ealth InsuranceEmployer Health Benefits 2 0 1 0 An n u a l s u r vey
23
t h e k a i s e r fa m i ly f o u n d at i o n - a n d - h e a lt h r e s e a r C h & e d u C at i o n a l t r u s t
e x h i B i t 1 .2
average monthly and annual Premiums for Covered Workers, by Plan type and firm size, 2010
monthly annual
single Coverage family Coverage single Coverage family Coverage
hmo all small firms (3–199 Workers) $428 $1,107* $5,133 $13,285*all large firms (200 or more Workers) 427 1,208* 5,129 14,492*
All firm sizes $428 $1,177 $5,130 $14,125
ppoall small firms (3–199 Workers) $431 $1,145 $5,169 $13,735all large firms (200 or more Workers) 425 1,180 5,104 14,161
All firm sizes $427 $1,169 $5,124 $14,033
pos all small firms (3–199 Workers) $429 $1,069 $5,145 $12,825all large firms (200 or more Workers) 450 1,154 5,402 13,850
All firm sizes $437 $1,101 $5,239 $13,213
hDhp/soall small firms (3–199 Workers) $371 $1,002 $4,454 $12,022all large firms (200 or more Workers) 373 1,053 4,482 12,640
All firm sizes $373 $1,032 $4,470 $12,384
All plANsall small firms (3–199 Workers) $420 $1,104* $5,046 $13,250*all large firms (200 or more Workers) 421 1,170* 5,050 14,038*
All firm sizes $421 $1,147 $5,049 $13,770
* estimates are statistically different within plan type between all small firms and all large firms (p<.05).
kaiser/hret survey of employer-sponsored health Benefits, 2010.
s o u r c e :

section
on
eC
ost of Health Insurance
1
Employer Health Benefits 2 0 1 0 An n u a l s u r vey
24
t h e k a i s e r fa m i ly f o u n d at i o n - a n d - h e a lt h r e s e a r C h & e d u C at i o n a l t r u s t
e x h i B i t 1 .3
average monthly and annual Premiums for Covered Workers, by Plan type and region, 2010
monthly annual
single Coverage family Coverage single Coverage family Coverage
hmo
northeast $480* $1,257* $5,756* $15,082*
midwest 421 1,197 5,049 14,364
south 414 1,129 4,972 13,550
West 401* 1,142 4,817* 13,703
All regioNs $428 $1,177 $5,130 $14,125
pponortheast $457* $1,243* $5,484* $14,917*midwest 430 1,204 5,154 14,451south 404* 1,121* 4,846* 13,448*West 445 1,157 5,338 13,880
All regioNs $427 $1,169 $5,124 $14,033
posnortheast $481* $1,235 $5,776* $14,820midwest 482 1,290* 5,788 15,484*south 402* 1,029 4,826* 12,347West 433 1,007 5,197 12,084
All regioNs $437 $1,101 $5,239 $13,213
hDhp/sonortheast $398 $1,156 $4,779 $13,869midwest 359 985 4,313 11,818south 371 1,029 4,451 12,345West 372 989 4,459 11,873
All regioNs $373 $1,032 $4,470 $12,384
All plANsnortheast $457* $1,235* $5,484* $14,815*midwest 417 1,164 5,009 13,973south 402* 1,103* 4,820* 13,238*West 421 1,122 5,056 13,463
All regioNs $421 $1,147 $5,049 $13,770
* estimate is statistically different within plan type from estimate for all firms not in the indicated region (p<.05).
kaiser/hret survey of employer-sponsored health Benefits, 2010.
s o u r c e :

section
on
e
1
Cost of H
ealth InsuranceEmployer Health Benefits 2 0 1 0 An n u a l s u r vey
25
t h e k a i s e r fa m i ly f o u n d at i o n - a n d - h e a lt h r e s e a r C h & e d u C at i o n a l t r u s t
e x h i B i t 1 .4
average monthly and annual Premiums for Covered Workers, by Plan type and industr y, 2010
monthly annual
single Coverage family Coverage single Coverage family Coverage
hmoagriculture/mining/Construction nsd nsd nsd nsdmanufacturing $395* $1,159 $4,744* $13,911transportation/Communications/ utilities
412 1,195 4,946 14,336
Wholesale nsd nsd nsd nsdretail nsd nsd nsd nsdfinance 396 1,169 4,749 14,032service 446 1,134 5,348 13,603state/local Government 471 1,269 5,651 15,222health Care 457* 1,290* 5,484* 15,476*
All iNDusTries $428 $1,177 $5,130 $14,125
ppoagriculture/mining/Construction $384* $1,073* $4,608* $12,871*manufacturing 407 1,171 4,886 14,053transportation/Communications/ utilities
402* 1,143 4,829* 13,712
Wholesale 402 1,158 4,830 13,892retail 399 1,038* 4,794 12,456*finance 427 1,244* 5,119 14,932*service 423 1,163 5,079 13,959state/local Government 512* 1,260 6,145* 15,122health Care 484* 1,264 5,811* 15,172
All iNDusTries $427 $1,169 $5,124 $14,033
pos agriculture/mining/Construction nsd nsd nsd nsdmanufacturing nsd nsd nsd nsdtransportation/Communications/ utilities
nsd nsd nsd nsd
Wholesale nsd nsd nsd nsdretail nsd nsd nsd nsdfinance nsd nsd nsd nsdservice $443 $1,088 $5,310 $13,055state/local Government nsd nsd nsd nsdhealth Care nsd nsd nsd nsd
All iNDusTries $437 $1,101 $5,239 $13,213
Continued on next page

section
on
eC
ost of Health Insurance
1
Employer Health Benefits 2 0 1 0 An n u a l s u r vey
26
t h e k a i s e r fa m i ly f o u n d at i o n - a n d - h e a lt h r e s e a r C h & e d u C at i o n a l t r u s t
e x h i B i t 1 .4
average monthly and annual Premiums for Covered Workers, by Plan type and industr y, 2010
monthly annual
single Coverage family Coverage single Coverage family Coverage
hDhp/soagriculture/mining/Construction nsd nsd nsd nsdmanufacturing $390 $1,036 $4,685 $12,428transportation/Communications/ utilities
352 987 4,221 11,847
Wholesale 368 1,040 4,419 12,485retail nsd nsd nsd nsdfinance 346 999 4,147 11,984service 376 1,051 4,517 12,615state/local Government nsd nsd nsd nsdhealth Care 377 1,041 4,529 12,497
All iNDusTries $373 $1,032 $4,470 $12,384
All plANsagriculture/mining/Construction $386* $1,057* $4,628* $12,689*manufacturing 402 1,144 4,818 13,729transportation/Communications/ utilities
397* 1,133 4,763* 13,591
Wholesale 399 1,143 4,783 13,712retail 398 1,032* 4,782 12,387*finance 407 1,192 4,883 14,310service 423 1,135 5,073 13,619state/local Government 488* 1,224 5,852* 14,684health Care 459* 1,241* 5,507* 14,888*
All iNDusTries $421 $1,147 $5,049 $13,770
* estimate is statistically different within plan type from estimate for all firms not in the indicated industry (p<.05).
nsd: not sufficient data.
kaiser/hret survey of employer-sponsored health Benefits, 2010.
s o u r c e :
Continued from previous page

section
on
e
1
Cost of H
ealth InsuranceEmployer Health Benefits 2 0 1 0 An n u a l s u r vey
27
t h e k a i s e r fa m i ly f o u n d at i o n - a n d - h e a lt h r e s e a r C h & e d u C at i o n a l t r u s t
e x h i B i t 1 .5
average annual Premiums for Covered Workers with single Coverage, by firm Charac ter ist ics, 2010
all small firms (3–199 Workers)
all large firms (200 or more
Workers)all firms
Wage levelfew Workers are lower-Wage (less than 35% earn $23,000 a year or less)
$5,052 $5,074 $5,067
many Workers are lower-Wage (35% or more earn $23,000 a year or less)
$4,998 $4,859 $4,907
unions
firm has at least some union Workers $5,726 $5,196* $5,263*
firm does not have any union Workers $4,948 $4,926* $4,936*
younger Workersless than 35% of Workers are age 26 or younger $5,043 $5,080* $5,06735% or more Workers are age 26 or younger $5,092 $4,724* $4,827
older Workersless than 35% of Workers are age 50 or older $4,825* $4,969* $4,918*35% or more Workers are age 50 or older $5,466* $5,200* $5,291*
funding Arrangement
fully insured $4,972 $5,286* $5,060
self-funded $5,428 $5,001* $5,041
* estimates are statistically different from each other within firm size category (p<.05).
kaiser/hret survey of employer-sponsored health Benefits, 2010.
s o u r c e :

section
on
eC
ost of Health Insurance
1
Employer Health Benefits 2 0 1 0 An n u a l s u r vey
28
t h e k a i s e r fa m i ly f o u n d at i o n - a n d - h e a lt h r e s e a r C h & e d u C at i o n a l t r u s t
e x h i B i t 1 .6
average annual Premiums for Covered Workers with family Coverage, by firm Characteristics, 2010
all small firms (3–199 Workers)
all large firms (200 or more
Workers)all firms
Wage levelfew Workers are lower-Wage (less than 35% earn $23,000 a year or less)
$13,358 $14,021 $13,795
many Workers are lower-Wage (35% or more earn $23,000 a year or less)
$12,411 $14,174 $13,567
unions
firm has at least some union Workers $14,858* $14,249 $14,327*
firm does not have any union Workers $13,010* $13,857 $13,472*
younger Workers
less than 35% of Workers are age 26 or younger $13,241 $14,113* $13,811
35% or more Workers are age 26 or younger $13,406 $13,195* $13,252
older Workersless than 35% of Workers are age 50 or older $12,908* $13,791* $13,489*35% or more Workers are age 50 or older $13,888* $14,490* $14,286*
funding Arrangement
fully insured $13,203 $14,678* $13,626
self-funded $13,493 $13,903* $13,865
* estimates are statistically different from each other within firm size category (p<.05).
kaiser/hret survey of employer-sponsored health Benefits, 2010.
s o u r c e :

section
on
e
1
Cost of H
ealth InsuranceEmployer Health Benefits 2 0 1 0 An n u a l s u r vey
29
t h e k a i s e r fa m i ly f o u n d at i o n - a n d - h e a lt h r e s e a r C h & e d u C at i o n a l t r u s t
e x h i B i t 1 .7
distr ibution of annual Premiums for s ingle and family Coverage relat ive to the average annual s ingle or family Premium, 2010
Family Coverage
Single Coverage 20% 16% 21% 16% 10% 17%
19% 18% 14% 18% 12% 20%
$5,049
$13,770
LESS THAN 80% OF AVERAGE
80% TO LESS THAN 90% OF AVERAGE
90% TO LESS THAN AVERAGE
AVERAGE TO 110% OF AVERAGE
GREATER THAN 110% OF AVERAGE TO 120% OF AVERAGE
GREATER THAN OR EQUAL TO 120% OF AVERAGE
>=$6,058<$4,039
>=$16,524<$11,016
kaiser/hret survey of employer-sponsored health Benefits, 2010.
s o u r c e :
e x h i B i t 1 .8
distr ibution of Premiums for s ingle and family Coverage relat ive to the average annual s ingle or family Premium, 2010
single Coverage family Coverage
Premium range, relative to average Premium
Premium range, dollar amount
Percent Covered Workers in range
Premium range, dollar amount
Percent Covered Workers in range
less than 80% less than $4,039 20% less than $11,016 19%
80% to less than 90% $4,039 to <$4,544 16% $11,016 to <$12,393 18%
90% to less than average $4,544 to <$5,049 21% $12,393 to <$13,770 14%
average to less than 110% $5,049 to <$5,554 16% $13,770 to <$15,147 18%
110% to less than 120% $5,554 to <$6,058 10% $15,147 to <$16,524 12%
120% or more $6,058 or more 17% $16,524 or more 20%
note: the average premium is $5,049 for single coverage and $13,770 for family coverage. the premium distribution is relative to the average single or family premium. for example, $4,039 is 80% of the average single premium, $4,544 is 90% of the average single premium, $5,554 is 110% of the average single premium, and $6,058 is 120% of the average single premium. the same break points relative to the average are used for the distribution for family coverage.
kaiser/hret survey of employer-sponsored health Benefits, 2010.
s o u r c e :

section
on
eC
ost of Health Insurance
1
Employer Health Benefits 2 0 1 0 An n u a l s u r vey
30
t h e k a i s e r fa m i ly f o u n d at i o n - a n d - h e a lt h r e s e a r C h & e d u C at i o n a l t r u s t
e x h i B i t 1 .9
distr ibution of annual Premiums for Covered Workers with single Coverage, 2010
e x h i B i t 1 .10
distr ibution of annual Premiums for Covered Workers with family Coverage, 2010
0%
10%
20%
30%
40%
50%
Average: $5,049
<1%0%
3%
16%
34%
28%
11%
4% 4%
LESS THAN$1,000
$1,000–$1,999
$2,000–$2,999
$3,000–$3,999
$4,000–$4,999
$5,000–$5,999
$6,000–$6,999
$7,000–$7,999
$8,000 OR MORE
Percentage of Covered Workers:
Average: $13,770
LESS THAN$6,000
$6,000–$7,999
$8,000–$9,999
$10,000–$11,999
$12,000–$13,999
$14,000–$15,999
$16,000–$17,999
$18,000–$19,999
$20,000 OR MORE
Percentage of Covered Workers:
0%
10%
20%
30%
40%
50%
1%3%
10%
18%
23% 22%
13%
7%4%
kaiser/hret survey of employer-sponsored health Benefits, 2010.
s o u r c e :
kaiser/hret survey of employer-sponsored health Benefits, 2010.
s o u r c e :

section
on
e
1
Cost of H
ealth InsuranceEmployer Health Benefits 2 0 1 0 An n u a l s u r vey
31
t h e k a i s e r fa m i ly f o u n d at i o n - a n d - h e a lt h r e s e a r C h & e d u C at i o n a l t r u s t
$0 $2,000 $4,000 $6,000 $8,000 $10,000 $12,000 $14,000 $16,000
SINGLE COVERAGE
FAMILY COVERAGE
1999
2000
2001
2002
2003
2004
2005
2006
2007
2008
2009
2010
$2,196$5,791
$2,471*$6,438*
$2,689*$7,061*
$3,083*$8,003*
$3,383*$9,068*
$3,695*$9,950*
$4,024*$10,880*
$4,242*$11,480*
$4,479*$12,106*
$4,704*$12,680*
$4,824$13,375*
$5,049*$13,770*
e x h i B i t 1 .11
average annual Premiums for s ingle and family Coverage, 1999–2010
* estimate is statistically different from estimate for the previous year shown (p<.05).
kaiser/hret survey of employer-sponsored health Benefits, 1999–2010.
s o u r c e :

section
on
eC
ost of Health Insurance
1
Employer Health Benefits 2 0 1 0 An n u a l s u r vey
32
t h e k a i s e r fa m i ly f o u n d at i o n - a n d - h e a lt h r e s e a r C h & e d u C at i o n a l t r u s t
$0
$2,000
$4,000
$6,000
$8,000
$10,000
$12,000
$14,000
$16,000
ALL LARGE FIRMS (200 OR MORE WORKERS)
ALL SMALL FIRMS (3–199 WORKERS)
1999 2000 2001 2002 2003 2004 2005 2006 2007 2009 20102008
$13,250
$5,845
$5,683
$6,521*
$6,395*
$7,113*
$6,959*
$8,109*
$7,781*
$9,127*
$8,946*
$10,046*
$9,737*
$11,025*
$10,587*
$11,575*
$11,306*
$12,233*$12,973*
$11,835 $12,091
$14,038
$12,696
$13,704*
e x h i B i t 1 .13
average annual Premiums for Covered Workers with family Coverage, by firm size, 1999–2010
* estimate is statistically different from estimate for the previous year shown (p<.05).
kaiser/hret survey of employer-sponsored health Benefits, 1999–2010.
s o u r c e :
e x h i B i t 1 .12
average annual Premiums for Covered Workers with family Coverage, by firm size, 1999–2010
* estimate is statistically different between all small firms and all large firms within year (p<.05).
kaiser/hret survey of employer-sponsored health Benefits, 1999–2010.
s o u r c e :
all small firms (3–199 Workers) all large firms (200 or more Workers)
1999 $5,683 $5,8452000 $6,521 $6,3952001 $6,959 $7,1132002* $7,781 $8,1092003 $8,946 $9,1272004 $9,737 $10,0462005* $10,587 $11,0252006 $11,306 $11,5752007 $11,835 $12,2332008* $12,091 $12,9732009* $12,696 $13,7042010* $13,250 $14,038

section
on
e
1
Cost of H
ealth InsuranceEmployer Health Benefits 2 0 1 0 An n u a l s u r vey
33
t h e k a i s e r fa m i ly f o u n d at i o n - a n d - h e a lt h r e s e a r C h & e d u C at i o n a l t r u s t
e x h i B i t 1 .14
among Workers in large firms (200 or more Workers) , average health insurance Premiums for family Coverage, by funding arrangement, 1999–2010
* estimate is statistically different from estimate for the previous year shown (p<.05).
note: for definitions of self-funded and fully insured Plans, see the introduction to section 10. due to a change in the survey questionnaire, funding status was not asked of firms with conventional plans in 2006. therefore, conventional plan funding status is not included in this exhibit for 2006.
kaiser/hret survey of employer-sponsored health Benefits, 1999–2010.
s o u r c e :
funding arrangement fully insured self-funded
1999 $5,769 $5,896
2000 $6,315* $6,430*
2001 $7,169* $7,086*
2002 $7,950* $8,192*
2003 $9,070* $9,149*
2004 $10,217* $9,984*
2005 $10,870* $11,077*
2006 $11,222 $11,673*
2007 $11,968* $12,315*
2008 $13,029* $12,956*
2009 $13,870* $13,655*
2010 $14,678* $13,903


69%$13,7
70
$5,0
49
2010
Employer Health Benefits2 0 1 0 a n n u a l s u r V e y
s ect ion
HealthBenefits
Offer Rates
22
HealthBenefits
Offer Rates

sec
tion
two
Health B
enefits Offer R
ates
2
Employer Health Benefits 2 0 1 0 An n u a l s u r vey
36
t h e k a i s e r fa m i ly f o u n d at i o n - a n d - h e a lt h r e s e a r C h & e d u C at i o n a l t r u s t
h e a l t h B e n e f i t S o f f e r r a t e S
nearly all large firms (200 or more workers) offer healTh benefiTs; small firms (3–199 workers) are
significanTly less likely To do so.
The percenTage of firms offering healTh benefiTs in 2010 increased significanTly from 2009. The reason
for The increase is unclear, buT iT is primarily driven by a 13 percenTage poinT jump in The percenTage of
firms wiTh 3 To 9 employees offering coverage, from 46% in 2009 To 59% in 2010. we have seen some
flucTuaTion in This caTegory in The pasT buT never of This magniTude. The offer raTe reflecTs informaTion
abouT firms ThaT are sTill in business in 2010 and does noT accounT for firms ThaT have gone ouT of
business due To The economic recession. a possible explanaTion for The increase in The offer raTe is ThaT
non-offering firms were more likely To fail during The pasT year, and The aTTriTion of non-offering firms
led To a higher offer raTe among surviving firms. for more discussion of The offer raTe, see The survey
design and meThods secTion. because mosT workers are employed by large firms, The change in offering
among The smallesT firms did noT have a dramaTic effecT on The percenTage of workers in firms offering
healTh benefiTs (93 percenT in 2010 vs. 91 percenT in 2009).
�In 2010, sixty-nine percent of firms offer health benefits, which is statistically different from the 60% reported in 2009 (Exhibit 2.1).
Ninety-nine percent of large firms (200 or more workers) offer health benefits in 2010, not statistically different from 2009 (Exhibit 2.2). In contrast, 68% of small firms (3–199 workers) offer health benefits in 2010, a statistically significant increase from the 59% reported in 2009.
Between 1999 and 2010, the offer rate for large firms (200 or more workers) has not dropped below 98%. Among small firms (3–199 workers), the offer rate has varied from a high of 68% in 2000, 2001 and 2010, to a low of 59% in 2005, 2007 and 2009. These variations are driven primarily by changes in the percentages of the smallest firms (3–9 workers) offering health benefits.
�Offer rates vary across different types of firms.
The smallest firms are least likely to offer health insurance. Fifty-nine percent of firms with 3 to 9 workers offer coverage, compared to 76% of firms with 10 to 24 workers, 92% of firms with 25 to 49 workers (Exhibit 2.3), and over 95% of firms with 50 or more employees.
Firms with fewer lower-wage workers (less than 35% of workers earn $23,000 or less annually) are significantly more likely to offer health insurance than firms with many lower-wage workers (35% or more of workers earn $23,000 or less annually). Seventy-four percent of firms with fewer lower-wage workers offer health benefits, compared with only 48% of firms with many lower-wage workers (Exhibit 2.4).
Firms that employ at least some union workers are much more likely than firms without union workers to offer health benefits to their employees. Ninety-four percent of firms with some union workers offer health benefits, compared to 67% of firms that do not have union employees (Exhibit 2.4).
The age of the workforce significantly affects the probability of a firm offering health benefits as well. Firms with 35% or more of its workers age 26 or younger are far less likely to offer health benefits than firms where less than 35% of workers are age 26 or younger (31% and 73%, respectively) (Exhibit 2.4).

sec
tion
two
Health B
enefits Offer R
ates
2
Employer Health Benefits 2 0 1 0 An n u a l s u r vey
37
t h e k a i s e r fa m i ly f o u n d at i o n - a n d - h e a lt h r e s e a r C h & e d u C at i o n a l t r u s t
�Among firms offering health benefits, relatively few offer benefits to their part-time and temporary workers.
In 2010, 25% of all firms that offer health benefits offer them to part-time workers (Exhibit 2.5). Firms with 200 or more workers are more likely to offer health benefits to part-time employees than firms with 3 to 199 workers (42% vs. 24%).
A very small percentage (2%) of firms offering health benefits offer them to temporary workers (Exhibit 2.6), and this figure has remained stable over time. Firms with 200 or more workers are more likely to offer health benefits to temporary workers than firms with 3 to 199 workers (7% vs. 1%).
D e N TA l A N D v i s i o N b e N e f i T s
�Forty-seven percent of firms offering health benefits offer or contribute to a dental insurance benefit for their employees that is separate from any dental coverage the health plans might include. This is not statistically different from the 44% reported in 2008, which is the last time we asked about dental benefits (Exhibit 2.8). Large firms (200 or more workers) are far more likely than small firms (3–199 workers) to offer or contribute to a separate dental health benefit, at 87% versus 45% (Exhibit 2.7).
�Eighteen percent of firms offer or contribute to a vision benefit for their employees that is separate from any vision coverage the health plan might include, similar to the 17% reported in 2008, which is the last time we asked about vision benefits (Exhibit 2.8). Large firms (200 or more workers) are much more likely than small firms (3–199 workers) to offer or contribute to a separate vision care benefit, at 55% versus 17% (Exhibit 2.7).
f i r m s N o T o f f e r i N g h e A lT h b e N e f i T s
�The survey asks firms that do not offer health benefits if they have offered insurance or shopped for insurance in the recent past, whether the firm stopped offering due to the recent economic downturn, and about their most important reasons for not offering. Because such a small percentage of large firms (200 or more workers) report not offering health benefits, we present the information for employers with 3 to 199 workers, 32% of which do not offer health benefits.
�Despite a slowing of health insurance cost growth in recent years, the cost of health insurance remains the primary reason cited by firms for not offering health benefits.1
Among small firms (3–199 workers) not offering health benefits, 54% cite high cost as “the most important reason” for not doing so. Other factors frequently cited by firms as the most important reason for not offering coverage include: firm is too small (12%) and employees are covered elsewhere (6%) (Exhibit 2.9).
�Many non-offering firms have either offered health benefits in the past five years, or shopped for coverage recently.
Twenty-seven percent of non-offering small firms (3–199 workers) have offered health benefits in the past five years, while 30% have shopped for coverage in the past year (Exhibit 2.10). Forty-seven percent of those that stopped offering within the past five years reported doing so due to the economic downturn.
1 the question asking non-offering firms their most important reason for not offering health benefits is an open-ended question.
n o T e :

sec
tion
two
Health B
enefits Offer R
ates
2
Employer Health Benefits 2 0 1 0 An n u a l s u r vey
38
t h e k a i s e r fa m i ly f o u n d at i o n - a n d - h e a lt h r e s e a r C h & e d u C at i o n a l t r u s t
e x h i B i t 2 .1
Percentage of fi rms o ffer ing health Benef its, 1999–2010
* estimate is statistically different from estimate for the previous year shown (p<.05).
note: as noted in the survey design and methods section, estimates presented in this exhibit are based on the sample of both firms that completed the entire survey and those that answered just one question about whether they offer health benefits.
kaiser/hret survey of employer-sponsored health Benefits, 1999–2010.
s o u r c e :
1999 2000 2001 2002 2003 2004 2005 2006 20102009200820070%
10%
20%
30%
40%
50%
60%
70%
80%
90%
100%
66%69% 68% 66% 66%
63%60% 61% 63%
69%*
60%60%
e x h i B i t 2 .2
Percentage of fi rms o ffer ing health Benef its, by firm size, 1999–2010
firm size 1999 2000 2001 2002 2003 2004 2005 2006 2007 2008 2009 2010
3–9 Workers 56% 57% 58% 58% 55% 52% 47% 48% 45% 49% 46% 59%*10–24 Workers 74 80 77 70* 76 74 72 73 76 78 72 7625–49 Workers 86 91 90 86 84 87 87 87 83 90* 87 9250–199 Workers 97 97 96 95 95 92 93 92 94 94 95 95
All small firms (3–199 Workers) 65% 68% 68% 66% 65% 63% 59% 60% 59% 62% 59% 68%*
All large firms (200 or more Workers) 99% 99% 99% 98% 98% 99% 98% 98% 99% 99% 98% 99%
All firms 66% 69% 68% 66% 66% 63% 60% 61% 60% 63% 60% 69%*

sec
tion
two
Health B
enefits Offer R
ates
2
Employer Health Benefits 2 0 1 0 An n u a l s u r vey
39
t h e k a i s e r fa m i ly f o u n d at i o n - a n d - h e a lt h r e s e a r C h & e d u C at i o n a l t r u s t
e x h i B i t 2 .3
Percentage of fi rms o ffer ing health Benef its, by firm size, region, and industr y, 2010
Percentage of firms offering health Benefits
firm size 3–9 Workers 59%*10–24 Workers 76*25–49 Workers 92*50–199 Workers 95*200–999 Workers 98*1,000–4,999 Workers 99*5,000 or more Workers 99*
All small firms (3–199 Workers) 68%*All large firms (200 or more Workers) 99%*
regioNnortheast 78%*midwest 63south 67West 70
iNDusTryagriculture/mining/Construction 67%manufacturing 78transportation/Communications/utilities 85Wholesale 79retail 57finance 71service 72state/local Government 72health Care 57*
All firms 69%
* estimate is statistically different from estimate for all other firms not in the indicated size, region, or industry category (p<.05).
note: as noted in the survey design and methods section, estimates presented in this exhibit are based on the sample of both firms that completed the entire survey and those that answered just one question about whether they offer health benefits.
kaiser/hret survey of employer-sponsored health Benefits, 2010.
s o u r c e :

sec
tion
two
Health B
enefits Offer R
ates
2
Employer Health Benefits 2 0 1 0 An n u a l s u r vey
40
t h e k a i s e r fa m i ly f o u n d at i o n - a n d - h e a lt h r e s e a r C h & e d u C at i o n a l t r u s t
e x h i B i t 2 .4
Percentage of fi rms o ffer ing health Benef its, by firm Charac ter ist ics, 2010
* estimates are statistically different from each other within category (p<.05).
kaiser/hret survey of employer-sponsored health Benefits, 2010.
s o u r c e :
FIRM DOES NOT HAVE ANY UNION WORKERS
FIRM HAS AT LEAST SOME UNION WORKERS
FEW WORKERS ARE LOWER-WAGE(LESS THAN 35% EARN $23,000 A YEAR OR LESS)
MANY WORKERS ARE LOWER-WAGE (35% ORMORE EARN $23,000 A YEAR OR LESS)
FEW WORKERS ARE PART-TIME(LESS THAN 35% WORK PART-TIME)
MANY WORKERS ARE PART-TIME(35% OR MORE WORK PART-TIME)
WAGE LEVEL*
PART-TIME WORKERS
UNIONS*
35% OR MORE WORKERS ARE AGE 26 OR YOUNGER
LESS THAN 35% OF WORKERS ARE AGE 26 OR YOUNGER
YOUNGER WORKERS*
35% OR MORE WORKERS ARE AGE 50 OR OLDER
LESS THAN 35% OF WORKERS ARE AGE 50 OR OLDER
OLDER WORKERS
0% 10% 20% 30% 40% 50% 60% 70% 80% 90% 100%
67%
73%
31%
66%
72%
94%
60%
71%
48%
74%

sec
tion
two
Health B
enefits Offer R
ates
2
Employer Health Benefits 2 0 1 0 An n u a l s u r vey
41
t h e k a i s e r fa m i ly f o u n d at i o n - a n d - h e a lt h r e s e a r C h & e d u C at i o n a l t r u s t
* estimate is statistically different from estimate for the previous year shown (p<.05).
kaiser/hret survey of employer-sponsored health Benefits, 1999–2010.
s o u r c e :
* estimate is statistically different from estimate for the previous year shown (p<.05).
kaiser/hret survey of employer-sponsored health Benefits, 1999–2010.
s o u r c e :
e x h i B i t 2 .5
among firms offering health Benefits, Percentage that offer health Benefits to Par t-time Workers, by firm size, 1999–2010
e x h i B i t 2 .6
among firms o ffer ing health Benef its, Percentage that o ffer health Benef its to temporar y Workers, by firm size, 1999–2010
firm size 1999 2000 2001 2002 2003 2004 2005 2006 2007 2008 2009 2010
3–24 Workers 19% 21% 17% 21% 24% 20% 27% 30% 23% 22% 31% 24%25–199 Workers 26 25 31 29 29 29 29 28 26 30 27 28200–999 Workers 36 33 42 43 38 41 33 40 37 40 44 35*1,000–4,999 Workers 53 48 55 60 57 50 46 55 54 53 55 555,000 or more Workers 61 52 60 58 57 59 61 63 63 67 60 61
All firms 21% 23% 21% 24% 26% 23% 28% 31% 24% 25% 31% 25%
firm size 1999 2000 2001 2002 2003 2004 2005 2006 2007 2008 2009 2010
3–24 Workers 5% 2% 4% 3% 1% 4% 2% 3% 2% 3% 4% 1%25–199 Workers 3 7 3 4 3 3 5 4 4 3 3 4200–999 Workers 3 8 6 5 9 8 5 5 7 4 4 61,000–4,999 Workers 6 8 9 8 7 6 5 9 9 7 7 85,000 or more Workers 8 9 7 7 10 7 9 11 6* 8 9 8
All firms 4% 4% 4% 3% 2% 4% 3% 3% 2% 3% 3% 2%

sec
tion
two
Health B
enefits Offer R
ates
2
Employer Health Benefits 2 0 1 0 An n u a l s u r vey
42
t h e k a i s e r fa m i ly f o u n d at i o n - a n d - h e a lt h r e s e a r C h & e d u C at i o n a l t r u s t
e x h i B i t 2 .7
among firms o ffer ing health Benef its, Percentage that o ffer or Contr ibute to a separate Benef it Plan Providing dental or Vis ion Benef its, by firm size and region, 2010
* estimate is statistically different from estimate for all firms not in the indicated size or region category (p<.05).
note: the survey asks firms that offer health benefits if they offer or contribute to a dental or vision insurance program that is separate from any dental or vision coverage the health plans might include.
kaiser/hret survey of employer-sponsored health Benefits, 2010.
s o u r c e :
separate dental Benefits separate Vision Benefits
firm size200–999 Workers 87%* 51%*1,000–4,999 Workers 88* 64*5,000 or more Workers 90* 68*
All small firms (3–199 Workers) 45%* 17%*All large firms (200 or more Workers) 87%* 55%*
regioNnortheast 49% 13%midwest 41 11*south 56 19West 36 27
All firms 47% 18%

sec
tion
two
Health B
enefits Offer R
ates
2
Employer Health Benefits 2 0 1 0 An n u a l s u r vey
43
t h e k a i s e r fa m i ly f o u n d at i o n - a n d - h e a lt h r e s e a r C h & e d u C at i o n a l t r u s t
e x h i B i t 2 .8
among firms o ffer ing health Benef its, Percentage that o ffer or Contr ibute to a separate Benef it Plan Providing dental or Vis ion Benef its, by firm size, 2000–2010
* estimate is statistically different from estimate for the previous year shown (p<.05).
note: data on vision benefits was not collected in 2000 and 2003. the survey asks firms that offer health benefits if they offer or contribute to a dental or vision insurance program that is separate from any dental or vision coverage the health plans might include.
kaiser/hret survey of employer-sponsored health Benefits, 2000–2010.
s o u r c e :
2000 2003 2006 2008 2010
Dental benefitsall small firms (3–199 workers) 30% 37% 49%* 43% 45%all large firms (200 or more Workers) 62 79* 80 82 87*
All firms 31% 39% 50%* 44% 47%
vision benefitsall small firms (3–199 workers) — — 20% 15% 17%all large firms (200 or more Workers) — — 44 49 55*
All firms — — 21% 17% 18%
e x h i B i t 2 .9
among smal l fi rms (3–199 Workers) not o ffer ing health Benef its, reasons for not o ffer ing, 2010
most important reason
Cost of health insurance is too high 54%
the firm is too small 12
employees are generally covered under another plan 6
employee turnover is too great 5
no interest/employees don't want it 4
other 8
don’t know 11
note: the question asking non-offering firms their most important reason for not offering health benefits is an open-ended question.
kaiser/hret survey of employer-sponsored health Benefits, 2010.
s o u r c e :

sec
tion
two
Health B
enefits Offer R
ates
2
Employer Health Benefits 2 0 1 0 An n u a l s u r vey
44
t h e k a i s e r fa m i ly f o u n d at i o n - a n d - h e a lt h r e s e a r C h & e d u C at i o n a l t r u s t
e x h i B i t 2 .10
among smal l fi rms (3–199 Workers) not o ffer ing health Benef its, Percentage that repor t the fol lowing ac t iv it ies regarding health Benef its, by firm size, 2010
OFFERED HEALTH INSURANCEWITHIN THE PAST FIVE YEARS
SHOPPED FOR HEALTH INSURANCE WITHIN THE PAST YEAR
STOPPED OFFERING HEALTH INSURANCEDUE TO ECONOMIC DOWNTURN‡
0%
10%
20%
30%
40%
50%
60%
70%
80%
90%
100%
27%30%
47%
‡ among those firms who reported offering health insurance within the past five years.
kaiser/hret survey of employer-sponsored health Benefits, 2010.
s o u r c e :

69%$13,7
70
$5,0
49
2010
Employer Health Benefits2 0 1 0 a n n u a l s u r V e y
s ect ion
Employee Coverage,
Eligibility, and Participation
3

Employer Health Benefits 2 0 1 0 An n u a l s u r vey
section
three
Em
ployee Coverage, E
ligibility, and Participation
3
46
t h e k a i s e r fa m i ly f o u n d at i o n - a n d - h e a lt h r e s e a r C h & e d u C at i o n a l t r u s t
e M p l o y e e C o v e r a g e , e l i g i B i l i t y , a n D p a r t i C i p a t i o n
employers are The principal source of healTh insurance in The uniTed sTaTes, providing healTh benefiTs
for abouT 157 million nonelderly people in america.1 mosT workers are offered healTh coverage aT
work, and The vasT majoriTy of workers who are offered coverage Take iT. workers may noT be covered
by Their own employer for several reasons: Their employer may noT offer coverage, They may be ineligible
for benefiTs offered by Their firm, They may choose To elecT coverage Through Their spouse’s employer, or
They may refuse an offer of coverage from Their firm.
�Among firms offering health benefits, 63% percent of workers are covered by health benefits through their own employer (Exhibit 3.2). This percentage is reduced to 59% when considering all workers, regardless of whether they are in a firm offering health benefits or not (Exhibit 3.1). The coverage rate has remained fairly stable over time.
�Not all employees are eligible for the health benefits offered by their firm, and not all eligible employees who are offered health coverage take up the offer of coverage. The share of workers covered in a firm is a product of both the percentage of workers who are eligible for the firm’s health insurance and the percentage who choose to “take up” (i.e., elect to participate in) the benefit.
Seventy-nine percent of workers in firms offering health benefits are eligible for the coverage offered by their employer in 2010, the same as last year (Exhibit 3.2).
Eligibility varies considerably by wage level. Employees in firms with a lower proportion of lower-wage workers (less than 35% of workers earn $23,000 or less annually) are more likely to be eligible for health benefits than employees in firms with a higher proportion of lower-wage workers (where 35% or more of workers earn $23,000 or less annually) (81% vs. 68%) (Exhibit 3.3).
�Employees who are offered coverage through their employer generally elect to take up coverage. Eighty percent of eligible workers take up coverage when it is offered to them, similar to the 81% reported last year (Exhibit 3.2).2
The likelihood of a worker accepting a firm’s offer of coverage also varies by firm wage level. Eligible employees in firms with a lower proportion of lower-wage workers are more likely to take up coverage (82%) than eligible employees in firms with a higher proportion of lower-wage workers (35% or more of workers earn $23,000 or less annually) (69%) (Exhibit 3.4).
�The rate of coverage varies by certain firm characteristics.
There is significant variation in the coverage rate by industry among workers in firms offering health benefits. For example, only forty-eight percent of workers in retail firms are covered by health benefits offered by their firm, compared to 80% of workers in state and local government, 76% of workers in the manufacturing industry, and 74% of workers in the transportation/communications/utilities industry category (Exhibit 3.2).
1 kaiser family foundation, kaiser Commission on medicaid and the uninsured, the uninsured: a Primer, october 2009.2 in 2009, kaiser/hret began weighting the percentage of workers that take up coverage by the number of workers
eligible for coverage. the historical take up estimates have also been updated. see the survey design and methods section for more information.
n o T e :

Employer Health Benefits 2 0 1 0 An n u a l s u r veysectio
n th
ree
3
Em
ployee Coverage, E
ligibility, and Participation
47
t h e k a i s e r fa m i ly f o u n d at i o n - a n d - h e a lt h r e s e a r C h & e d u C at i o n a l t r u s t
Among workers in firms offering health benefits, those in firms with relatively few part-time workers (less than 35% of workers are part-time) are much more likely to be covered by their own firm than workers in firms with a greater percentage of part-time workers (70% vs. 38%) (Exhibit 3.5).
Among workers in firms offering health benefits, those in firms with fewer lower-wage workers (less than 35% of workers earn $23,000 or less annually) are more likely to be covered by their own firm than workers in firms with many lower-wage workers (35% or more of workers earn $23,000 or less annually) (66% vs. 47%) (Exhibit 3.5).
Among workers in firms offering health benefits, those in firms with fewer younger workers (less than 35% of workers are age 26 or younger) are more likely to be covered by their own firm than workers in firms with many younger workers (35% or more of workers are age 26 or younger) (66% vs. 44%) (Exhibit 3.5).
�Seventy-four percent of covered workers face a waiting period before coverage is available. Covered workers in the Northeast are less likely (64%) than workers in other regions to face a waiting period. Covered workers in retail (90%), health care (86%), and agriculture/mining/construction (85%) firms are more likely than workers in other industries to face a waiting period (Exhibit 3.7).
The average waiting period among covered workers who face a waiting period is 2.2 months (Exhibit 3.7). Thirty-one percent of covered workers face a waiting period of 3 months or more (Exhibit 3.8).
�The distribution of covered workers electing single coverage, single plus one coverage, or family coverage is 47%, 19%, and 34% respectively in 2010 (Exhibit 3.9). Workers in small firms (3–199 workers) are significantly more likely to enroll in single coverage and less likely to enroll in family coverage than are workers in large firms (200 or more workers), at 55% versus 42% for single coverage and 30% versus 36% for family coverage (Exhibit 3.10).
�The survey asked firms about the age at which dependents and dependents who are full-time students are no longer eligible for coverage in the plan with the largest enrollment.
Fifty-two percent of firms limit the age at which dependents are no longer eligible for dependent coverage to 18 or 19 years old, and another 19% limit the age to 20 or 21 years of age (Exhibit 3.11).
For dependents who are full-time students, the age limit is generally higher. Sixty-six percent of firms limit the age at which full-time students are no longer eligible for dependent coverage to 24 or older (Exhibit 3.12).3
3 averages and distributions exclude 1% of firms with no limit on the age at which dependents are no longer are eligible for coverage for the plan with the largest enrollment, and 2% of firms that have no limit for dependents that are full-time students.
n o T e :

Employer Health Benefits 2 0 1 0 An n u a l s u r vey
48
t h e k a i s e r fa m i ly f o u n d at i o n - a n d - h e a lt h r e s e a r C h & e d u C at i o n a l t r u s t
section
three
Em
ployee Coverage, E
ligibility, and Participation
3
* tests found no statistical difference from estimate for the previous year shown (p<.05).
kaiser/hret survey of employer-sponsored health Benefits, 1999–2010.
s o u r c e :
e x h i B i t 3 .1
Percentage of al l Workers Covered by their employers’ health Benef its, in firms Both o ffer ing and not o ffer ing health Benef its, by firm size, 1999–2010*
firm size 1999 2000 2001 2002 2003 2004 2005 2006 2007 2008 2009 2010
3–24 Workers 50% 50% 49% 45% 44% 43% 41% 45% 42% 43% 39% 44%25–49 Workers 56 63 62 57 59 56 55 55 51 57 54 5950–199 Workers 61 62 67 64 61 56 59 62 59 60 59 60200–999 Workers 69 69 71 69 68 69 65 66 65 67 63 611,000–4,999 Workers 68 68 69 70 69 68 69 68 69 69 67 665,000 or more Workers 64 66 69 68 68 67 66 60 63 64 65 63
All small firms (3–199 Workers) 55% 57% 58% 54% 53% 50% 50% 53% 50% 52% 49% 52%All large firms (200 or more Workers) 66% 67% 69% 69% 68% 68% 66% 63% 65% 66% 65% 63%
All firms 62% 63% 65% 63% 62% 61% 60% 59% 59% 60% 59% 59%

Employer Health Benefits 2 0 1 0 An n u a l s u r vey
49
t h e k a i s e r fa m i ly f o u n d at i o n - a n d - h e a lt h r e s e a r C h & e d u C at i o n a l t r u s t
section
three
Em
ployee Coverage, E
ligibility, and Participation
3
e x h i B i t 3 .2
el igibi l i ty, take -up r ate, and Coverage in firms o ffer ing health Benef its, by firm size, region, and industr y, 2010
* estimate for eligibility, take-up rate, or coverage is statistically different from all other firms not in the indicated size, region, or industry category (p<.05).
note: in 2009, kaiser/hret began weighting the percentage of workers that take up coverage by the number of workers eligible for coverage. see the survey design and methods section for more information.
kaiser/hret survey of employer-sponsored health Benefits, 2010.
s o u r c e :
Percentage of Workers eligible
for health Benefits offered by their
employer
Percentage of eligible Workers Who Participate
in their employers’ Plan (take-up rate)
Percentage of Workers Covered
by their employers’ health Benefits
firm size3–24 Workers 83% 76%* 63%25–49 Workers 84* 77 6450–199 Workers 80 79 63200–999 Workers 76 81 621,000–4,999 Workers 80 83* 665,000 or more Workers 76 82 63
All small firms (3–199 Workers) 82%* 77%* 63%All large firms (200 or more Workers) 77%* 82%* 63%
regioNnortheast 78% 83%* 64%midwest 78 80 62south 80 79 63West 79 81 64
iNDusTryagriculture/mining/Construction 83% 77% 65%manufacturing 92* 83 76*transportation/Communications/utilities 87* 85* 74*Wholesale 78 83 66retail 63* 75 48*finance 90* 82 74*service 74* 77 57*state/local Government 86* 93* 80*health Care 77 79 61
All firms 79% 80% 63%

Employer Health Benefits 2 0 1 0 An n u a l s u r vey
50
t h e k a i s e r fa m i ly f o u n d at i o n - a n d - h e a lt h r e s e a r C h & e d u C at i o n a l t r u s t
section
three
Em
ployee Coverage, E
ligibility, and Participation
3
e x h i B i t 3 .3
among Workers in firms o ffer ing health Benef its, Percentage of Workers e l igible for health Benef its o ffered by their fi rm, by firm Charac ter ist ics, 2010
* estimates are statistically different from each other within category (p<.05).
kaiser/hret survey of employer-sponsored health Benefits, 2010.
s o u r c e :
0% 10% 20% 30% 40% 50% 60% 70% 80% 90% 100%
FIRM DOES NOT HAVE ANY UNION WORKERS
FIRM HAS AT LEAST SOME UNION WORKERS
FEW WORKERS ARE LOWER-WAGE(LESS THAN 35% EARN $23,000 A YEAR OR LESS)
MANY WORKERS ARE LOWER-WAGE (35% ORMORE EARN $23,000 A YEAR OR LESS)
FEW WORKERS ARE PART-TIME(LESS THAN 35% WORK PART-TIME)
MANY WORKERS ARE PART-TIME(35% OR MORE WORK PART-TIME)
WAGE LEVEL*
PART-TIME WORKERS*
UNIONS
35% OR MORE WORKERS ARE AGE 26 OR YOUNGER
LESS THAN 35% OF WORKERS ARE AGE 26 OR YOUNGER
YOUNGER WORKERS*
35% OR MORE WORKERS ARE AGE 50 OR OLDER
LESS THAN 35% OF WORKERS ARE AGE 50 OR OLDER
OLDER WORKERS
78%
81%
60%
78%
80%
80%
53%
85%
68%
81%

Employer Health Benefits 2 0 1 0 An n u a l s u r vey
51
t h e k a i s e r fa m i ly f o u n d at i o n - a n d - h e a lt h r e s e a r C h & e d u C at i o n a l t r u s t
section
three
Em
ployee Coverage, E
ligibility, and Participation
3
e x h i B i t 3 .4
among Workers in firms o ffer ing health Benef its, Percentage of e l igible Workers Who take up health Benef its o ffered by their fi rm, by firm Charac ter ist ics, 2010
* estimates are statistically different from each other within category (p<.05).
note: in 2009, kaiser/hret began weighting the percentage of workers that take up coverage by the number of workers eligible for coverage. see the survey design and methods section for more information.
kaiser/hret survey of employer-sponsored health Benefits, 2010.
s o u r c e :
0% 10% 20% 30% 40% 50% 60% 70% 80% 90% 100%
FIRM DOES NOT HAVE ANY UNION WORKERS
FIRM HAS AT LEAST SOME UNION WORKERS
FEW WORKERS ARE LOWER-WAGE(LESS THAN 35% EARN $23,000 A YEAR OR LESS)
MANY WORKERS ARE LOWER-WAGE (35% ORMORE EARN $23,000 A YEAR OR LESS)
FEW WORKERS ARE PART-TIME(LESS THAN 35% WORK PART-TIME)
MANY WORKERS ARE PART-TIME(35% OR MORE WORK PART-TIME)
WAGE LEVEL*
PART-TIME WORKERS
UNIONS*
35% OR MORE WORKERS ARE AGE 26 OR YOUNGER
LESS THAN 35% OF WORKERS ARE AGE 26 OR YOUNGER
YOUNGER WORKERS*
35% OR MORE WORKERS ARE AGE 50 OR OLDER
LESS THAN 35% OF WORKERS ARE AGE 50 OR OLDER
OLDER WORKERS
78%
81%
73%
79%
82%
85%
70%
82%
69%
82%

Employer Health Benefits 2 0 1 0 An n u a l s u r vey
52
t h e k a i s e r fa m i ly f o u n d at i o n - a n d - h e a lt h r e s e a r C h & e d u C at i o n a l t r u s t
section
three
Em
ployee Coverage, E
ligibility, and Participation
3
e x h i B i t 3 .5
among Workers in firms o ffer ing health Benef its, Percentage of Workers Covered by health Benef its o ffered by their fi rm, by firm Charac ter ist ics, 2010
* estimates are statistically different from each other within category (p<.05).
kaiser/hret survey of employer-sponsored health Benefits, 2010.
s o u r c e :
0% 10% 20% 30% 40% 50% 60% 70% 80% 90% 100%
FIRM DOES NOT HAVE ANY UNION WORKERS
FIRM HAS AT LEAST SOME UNION WORKERS
FEW WORKERS ARE LOWER-WAGE(LESS THAN 35% EARN $23,000 A YEAR OR LESS)
MANY WORKERS ARE LOWER-WAGE (35% ORMORE EARN $23,000 A YEAR OR LESS)
FEW WORKERS ARE PART-TIME(LESS THAN 35% WORK PART-TIME)
MANY WORKERS ARE PART-TIME(35% OR MORE WORK PART-TIME)
WAGE LEVEL*
PART-TIME WORKERS*
UNIONS*
35% OR MORE WORKERS ARE AGE 26 OR YOUNGER
LESS THAN 35% OF WORKERS ARE AGE 26 OR YOUNGER
YOUNGER WORKERS*
35% OR MORE WORKERS ARE AGE 50 OR OLDER
LESS THAN 35% OF WORKERS ARE AGE 50 OR OLDER
OLDER WORKERS
61%
66%
44%
62%
65%
68%
38%
70%
47%
66%

Employer Health Benefits 2 0 1 0 An n u a l s u r vey
53
t h e k a i s e r fa m i ly f o u n d at i o n - a n d - h e a lt h r e s e a r C h & e d u C at i o n a l t r u s t
section
three
Em
ployee Coverage, E
ligibility, and Participation
3
* estimate is statistically different from estimate for the previous year shown (p<.05).
note: in 2009, kaiser/hret began weighting the percentage of workers that take up coverage by the number of workers eligible for coverage. the historical take-up estimates have also been updated. see the survey design and methods section for more information.
kaiser/hret survey of employer-sponsored health Benefits, 1999–2010.
s o u r c e :
e x h i B i t 3 .6
el igibi l i ty, take -up r ate, and Coverage for Workers in firms o ffer ing health Benef its, by firm size, 1999–2010
1999 2000 2001 2002 2003 2004 2005 2006 2007 2008 2009 2010
percentage eligible all small firms (3–199 Workers) 81% 82% 85% 82%* 84% 80% 81% 83% 80% 81% 81% 82%all large firms (200 or more Workers) 78 80 82 80 80 81 79 76 78 79 79 77
All firms 79% 81% 83% 81%* 81% 80% 80% 78% 79% 80% 79% 79%
percentage of eligible that Take up all small firms (3–199 Workers) 83% 83% 83% 82% 81% 80% 81% 81% 80% 80% 79% 77%all large firms (200 or more Workers) 86 84 85 86 85 84 85 84 84 84 82 82
All firms 85% 84% 84% 85% 84% 83% 83% 83% 82% 82% 81% 80%
percentage Covered all small firms (3–199 Workers) 67% 68% 71% 67% 68% 64% 65% 67% 64% 65% 64% 63%all large firms (200 or more Workers) 66 67 69 69 68 68 67 63 65 66 65 63
All firms 66% 68% 70% 68% 68% 67% 66% 65% 65% 65% 65% 63%

Employer Health Benefits 2 0 1 0 An n u a l s u r vey
54
t h e k a i s e r fa m i ly f o u n d at i o n - a n d - h e a lt h r e s e a r C h & e d u C at i o n a l t r u s t
section
three
Em
ployee Coverage, E
ligibility, and Participation
3
e x h i B i t 3 .7
Percentage of Covered Workers in firms with a Wait ing Per iod for Coverage and average Wait ing Per iod in months, by firm size, region, and industr y, 2010
* estimate is statistically different from estimate for all other firms not in the indicated size, region, or industry category (p<.05).
source: kaiser/hret survey of employer-sponsored health Benefits, 2010.
s o u r c e :
Percentage of Covered Workers in firms with a Waiting Period
among Covered Workers with a Waiting Period, average
Waiting Period (months)
firm size all small firms (3–199 Workers) 76% 2.5*all large firms (200 or more Workers) 73 2.0*
regioNnortheast 64%* 2.1midwest 74 2.0*south 78 2.3West 77 2.4
iNDusTryagriculture/mining/Construction 85%* 2.8*manufacturing 71 2.3transportation/Communications/utilities 64 2.2Wholesale 77 2.2retail 90* 2.8*finance 73 1.9service 67* 2.2state/local Government 70 1.7*health Care 86* 1.9*
All firms 74% 2.2

Employer Health Benefits 2 0 1 0 An n u a l S u r vey
55
T h e K a i s e r Fa m i ly F o u n d aT i o n - a n d - h e a lT h r e s e a r c h & e d u c aT i o n a l T r u s T
section
three
Em
ployee Coverage, E
ligibility, and Participation
3
NO WAITING PERIOD
1 MONTH
ALL LARGE FIRMS(200 OR MORE
WORKERS)*
ALL SMALL FIRMS(3−199 WORKERS)*
ALL FIRMS
0% 10% 20% 30% 40% 50% 60% 70% 80% 90% 100%
8%
7%
7%
26% 8% 34%
34% 13% 18%
31% 11% 24%
24%
27%
26%
2 MONTHS
3 MONTHS
4 OR MORE MONTHS
e x h i b i T 3 .8
distr ibution of covered Workers with the Fol lowing Wait ing Per iods for coverage, 2010
* distributions are statistically different between all large Firms and all small Firms (p<.05).
Kaiser/hreT survey of employer-sponsored health benefits, 2010.
s o u r c e :
e x h i b i T 3 .9
distr ibution of covered Workers e lec t ing single coverage, s ingle Plus one coverage, or Family coverage, 2001–2010*
0% 10% 20% 30% 40% 50% 60% 70% 80% 90% 100%
2005
2008
2010
2006
2003
2001
SINGLE COVERAGE
SINGLE PLUS ONE COVERAGE
FAMILY COVERAGE
16%45%
45% 14%
45% 17%
39%
41%
38%
44% 18% 38%
46% 19% 36%
47% 19% 34%
* Tests found no statistical difference from distribution for previous year shown (p<.05).
note: single Plus one coverage includes either an employee plus a spouse or an employee plus a child.
Kaiser/hreT survey of employer-sponsored health benefits, 2001–2010.
s o u r c e :

Employer Health Benefits 2 0 1 0 An n u a l S u r vey
56
T h e K a i s e r Fa m i ly F o u n d aT i o n - a n d - h e a lT h r e s e a r c h & e d u c aT i o n a l T r u s T
section
three
Em
ployee Coverage, E
ligibility, and Participation
3
e x h i b i T 3 .10
distr ibution of covered Workers e lec t ing single coverage, s ingle Plus one coverage, or Family coverage, by Firm size, 2001–2010*
* Tests found no statistical difference within size category from distribution for previous year shown (p<.05).
note: single Plus one coverage includes either an employee plus a spouse or an employee plus a child.
Kaiser/hreT survey of employer-sponsored health benefits, 2001–2010.
s o u r c e :
0% 10% 20% 30% 40% 50% 60% 70% 80% 90% 100%
ALL SMALL FIRMS(3–199 WORKERS)
ALL LARGE FIRMS(200 OR MORE WORKERS)
SINGLE COVERAGE
SINGLE PLUS ONE COVERAGE
FAMILY COVERAGE
2005
2008
2010
2006
2003
2001
18%41%
41% 16%
40% 19%
41%
43%
41%
40% 20% 40%
42% 21% 38%
42% 21% 36%
2005
2008
2010
2006
2003
2001
13%54%
51% 10%
54% 13%
33%
39%
32%
51% 15% 34%
53% 14% 32%
55% 15% 30%

Employer Health Benefits 2 0 1 0 An n u a l S u r vey
57
T h e K a i s e r Fa m i ly F o u n d aT i o n - a n d - h e a lT h r e s e a r c h & e d u c aT i o n a l T r u s T
section
three
Em
ployee Coverage, E
ligibility, and Participation
3
18 OR 19 YEARS OLD
20 OR 21 YEARS OLD
22 OR 23 YEARS OLD
24 OR 25 YEARS OLD
26 YEARS OLD OR MORE
ALL LARGE FIRMS(200 OR MORE
WORKERS)*
ALL SMALL FIRMS(3−199 WORKERS)*
ALL FIRMS
0% 10% 20% 30% 40% 50% 60% 70% 80% 90% 100%
12%
9%
12%
20% 4% 12%
5% 5% 14%
19% 4% 12%
52%
67%
52%
18 OR 19 YEARS OLD
20 OR 21 YEARS OLD
22 OR 23 YEARS OLD
24 OR 25 YEARS OLD
26 YEARS OLD OR MORE
ALL LARGE FIRMS(200 OR MORE
WORKERS)
ALL SMALL FIRMS(3−199 WORKERS)
ALL FIRMS
0% 10% 20% 30% 40% 50% 60% 70% 80% 90% 100%
21%
19%
21%
22%6% 44%
21% 57%
<1%
22% 45%
6%
3%
6% 6%
e x h i b i T 3 .11
distr ibution of Fi rms with the Fol lowing age limits for dependent coverage for the Plan with the largest enrol lment, 2010
e x h i b i T 3 .12
distr ibution of Fi rms with the Fol lowing age limits for dependent coverage for Ful l -Time students for the Plan with the largest enrol lment, 2010*
* distributions are statistically different between all large Firms and all small Firms (p<.05).
note: distributions exclude those firms (1%) with no limit on the age at which dependents no longer are eligible for coverage for the plan with the largest enrollment.
Kaiser/hreT survey of employer-sponsored health benefits, 2010.
s o u r c e :
* Tests found no statistical difference between distributions for all large Firms and all small Firms (p<.05).
note: distributions exclude those firms (2%) with no limit on the age at which dependents who are full-time students no longer are eligible for coverage for the plan with the largest enrollment.
Kaiser/hreT survey of employer-sponsored health benefits, 2010.
s o u r c e :


69%$13,7
70
$5,0
49
2010
Employer Health Benefits2 0 1 0 a n n u a l s u r V e y
s ect ion
Types ofPlans
Offered
4

Employer Health Benefits 2 0 1 0 An n u a l s u r vey
sec
tion
fou
rTypes of Plans O
ffered
4
60
t h e k a i s e r fa m i ly f o u n d at i o n - a n d - h e a lt h r e s e a r C h & e d u C at i o n a l t r u s t
t y p e S o f p l a n S o f f e r e D
mosT firms ThaT offer healTh benefiTs offer only one Type of healTh plan (84%) (see TexT box). larger
firms are more likely To offer more Than one Type of healTh plan. employers are mosT likely To offer
Their workers a ppo, hmo, or pos plan and are leasT likely To offer a convenTional plan.
�Eighty-four percent of firms offering health benefits offer only one type of health plan. Large firms (200 or more workers) are more likely to offer more than one plan type than small firms (3–199 workers): 44% vs. 15% (Exhibit 4.1).
�Just over half (52%) of covered workers are employed in a firm that offers more than one health plan type. Sixty-seven percent of covered workers in large firms are employed by a firm that offers more than one plan type, compared to 24% in small firms (Exhibit 4.2).
�About four in five (79%) covered workers in firms offering health benefits work in a firm that offers one or more PPOs; 42% work in firms that offer one or more HMOs; 32% work in firms that offer one or more HDHP/SOs; 14% work in firms that offer one or more POS plans; and 6% work in firms that offer one or more conventional plans (Exhibit 4.4).1
The survey asks firms how many plans of each given type they offer. However, we do not know if each plan type is offered to all covered workers at the firm. For example, some workers might be offered one type of plan at one location, while workers at another location are offered a different type of plan.
1 this year we include firms that said they offer a plan type even if there are no covered workers in that plan type.
n o T e :

sec
tion
fou
rTypes of Plans O
fferedEmployer Health Benefits 2 0 1 0 An n u a l s u r vey
61
t h e k a i s e r fa m i ly f o u n d at i o n - a n d - h e a lt h r e s e a r C h & e d u C at i o n a l t r u s t
4
e x h i B i t 4 .1
among firms o ffer ing health Benef its, Percentage of fi rms that o ffer one, two, or three or more Plan types, by firm size, 2010 ‡
0%
10%
20%
30%
40%
50%
60%
70%
80%
90%
100%
200–999WORKERS*
ALL SMALL FIRMS(3–199 WORKERS)*
1,000–4,999WORKERS*
5,000 OR MOREWORKERS*
ALL LARGE FIRMS(200 OR MORE WORKERS)*
ALL FIRMS
THREE OR MORE PLAN TYPES
TWO PLAN TYPES
ONE PLAN TYPE
2%
7%14%
31%
11%
2%
13%
31%
41%
39%
34%
14%
85%
63%
45%
29%
56%
84%
* distribution is statistically different from distribution for all other firms not in the indicated size category (p<.05).
‡ although firms may offer more than one of each plan type, the survey asks how many are offered among the following types: conventional, hmo, PPo, Pos, and hdhP/so.
note: the survey asks firms how many plans of each given type they offer. however, we do not know if each plan type is offered to all covered workers at the firm. for example, some workers might be offered one type of plan at one location, while at another location they are offered a different type of plan.
kaiser/hret survey of employer-sponsored health Benefits, 2010.
s o u r c e :

Employer Health Benefits 2 0 1 0 An n u a l s u r vey
62
t h e k a i s e r fa m i ly f o u n d at i o n - a n d - h e a lt h r e s e a r C h & e d u C at i o n a l t r u s t
sec
tion
fou
rTypes of Plans O
ffered
4
e x h i B i t 4 .2
among firms o ffer ing health Benef its, Percentage of Covered Workers in firms o ffer ing one, two, or three or more Plan types, by firm size, 2010 ‡
0%
10%
20%
30%
40%
50%
60%
70%
80%
90%
100%
200–999WORKERS*
ALL SMALL FIRMS(3–199 WORKERS)*
1,000–4,999WORKERS
5,000 OR MOREWORKERS*
ALL LARGE FIRMS(200 OR MORE WORKERS)*
ALL FIRMS
THREE OR MORE PLAN TYPES
TWO PLAN TYPES
ONE PLAN TYPE
3%
7%16%
34%
25%17%
21%
35%
42%
45%
42%
35%
76%
58%
43%
20%
33%
48%
* distribution is statistically different from distribution for all other firms not in the indicated size category (p<.05).
‡ although firms may offer more than one of each plan type, the survey asks how many are offered among the following types: conventional, hmo, PPo, Pos, and hdhP/so.
note: the survey asks firms how many plans of each given type they offer. however, we do not know if each plan type is offered to all covered workers at the firm. for example, some workers might be offered one type of plan at one location, while at another location they are offered a different type of plan.
kaiser/hret survey of employer-sponsored health Benefits, 2010.
s o u r c e :

sec
tion
fou
rTypes of Plans O
fferedEmployer Health Benefits 2 0 1 0 An n u a l s u r vey
63
t h e k a i s e r fa m i ly f o u n d at i o n - a n d - h e a lt h r e s e a r C h & e d u C at i o n a l t r u s t
4
e x h i B i t 4 .3
among firms o ffer ing health Benef its, Percentage of fi rms that o ffer the fol lowing Plan types, by firm size, 2010
e x h i B i t 4 .4
among firms o ffer ing health Benef its, Percentage of Covered Workers in firms that o ffer the fol lowing Plan types, by firm size, 2010
* estimate is statistically different within plan type from estimate for all other firms not in the indicated size category (p<.05).
note: the survey asks firms how many plans of each given type they offer. however, we do not know if each plan type is offered to all covered workers at the firm. for example, some workers might be offered one type of plan at one location, while workers at another location are offered a different type of plan.
kaiser/hret survey of employer-sponsored health Benefits, 2010.
s o u r c e :
Conventional hmo PPo Pos hdhP/so
firm sizes200–999 Workers 3% 27% 80%* 13%* 21%1,000–4,999 Workers 5* 39* 89* 8* 30*5,000 or more Workers 7* 55* 93* 11* 41*
All small firms (3–199 Workers) 2% 24% 51%* 25%* 15%*All large firms (200 or more Workers) 3% 32% 83%* 12%* 25%*
All firms 2% 24% 53% 25% 15%
Conventional hmo PPo Pos hdhP/so
firm sizes200–999 Workers 2% 31%* 84% 10%* 23%*1,000–4,999 Workers 4 40 90* 7* 335,000 or more Workers 11* 64* 88* 14 45*
All small firms (3–199 Workers) 2%* 23%* 62%* 20%* 22%*All large firms (200 or more Workers) 8%* 52%* 88%* 12%* 38%*
All firms 6% 42% 79% 14% 32%


69%$13,7
70
$5,0
49
2010
Employer Health Benefits2 0 1 0 a n n u a l s u r V e y
s ect ion
MarketShares of
Health Plans
5

Employer Health Benefits 2 0 1 0 An n u a l s u r vey
Market Shares of H
ealth Plansse
ctio
n fiv
e
5
66
t h e k a i s e r fa m i ly f o u n d at i o n - a n d - h e a lt h r e s e a r C h & e d u C at i o n a l t r u s t
M a r k e t S h a r e S o f h e a l t h p l a n S
enrollmenT remains highesT in ppos, wiTh more Than half of covered workers, followed by hmos, pos
plans, hdhp/sos, and convenTional plans.
�Fifty-eight percent of covered workers are enrolled in PPOs, followed by HMOs (19%), HDHP/SOs (13%), POS plans (8%), and conventional plans (1%) (Exhibit 5.1).
�Enrollment in HDHP/SOs rose to 13% of covered workers in 2010, up from 8% in 2009 (Exhibit 5.1).
�Plan enrollment patterns vary by firm size. Workers in large firms (200 or more workers) are more likely than workers in small firms (3–199 workers) to enroll in PPOs (63% vs. 51%). Workers in small firms are more likely than workers in large firms to enroll in POS plans (15% vs. 5%) (Exhibit 5.2).
�Plan enrollment patterns also differ across regions.
HMO enrollment is significantly higher in the West (33%) and Northeast (26%) and significantly lower in the South (12%) and Midwest (11%) (Exhibit 5.2).
Workers in the South (67%) are more likely to be enrolled in PPO plans than workers in other regions; workers in the West (47%) are less likely to be enrolled in a PPO (Exhibit 5.2).
Enrollment in HDHP/SOs is higher among workers in the Midwest (20%) than in other regions (Exhibit 5.2).

Market Shares of H
ealth PlansEmployer Health Benefits 2 0 1 0 An n u a l s u r vey
67
t h e k a i s e r fa m i ly f o u n d at i o n - a n d - h e a lt h r e s e a r C h & e d u C at i o n a l t r u s t
sec
tion
five
5
e x h i B i t 5 .1
distr ibution of health Plan enrol lment for Covered Workers, by Plan type, 1988–2010
CONVENTIONAL
HMO
PPO
POS
HDHP/SO
0% 20% 40% 60% 80% 100%
1988
1993
1996
1999
2000*
2001*
2002*
2003
2004
2005*
2006
2007
2009
2008*
31%
73%
46%
27%
10%
8%
7%
4%
5% 24%
5% 25%
3% 21%
3% 20%
3% 21%
2% 20%
1% 20%
2010* 1% 19% 8%
27%
24%
29%
28%
21%
16%
28% 14%
54% 17%
55% 15%
61% 15%
60% 13% 4%
57% 13% 5%
58% 12% 8%
60% 10% 8%
58% 13%
52% 18%
46% 23%
42% 21%
39% 24%
26% 7%
11%
* distribution is statistically different from the previous year shown (p<.05). no statistical tests were conducted for years prior to 1999. no statistical tests are conducted between 2005 and 2006 due to the addition of hdhP/so as a new plan type in 2006.
note: information was not obtained for Pos plans in 1988. a portion of the change in plan type enrollment for 2005 is likely attributable to incorporating more recent Census Bureau estimates of the number of state and local government workers and removing federal workers from the weights. see the survey design and methods section from the 2005 kaiser/hret survey of employer-sponsored health Benefits for additional information.
kaiser/hret survey of employer-sponsored health Benefits, 1999–2010; kPmG survey of employer-sponsored health Benefits, 1993, 1996; the health insurance association of america (hiaa), 1988.
s o u r c e :

Market Shares of H
ealth Plans
Employer Health Benefits 2 0 1 0 An n u a l s u r vey
68
t h e k a i s e r fa m i ly f o u n d at i o n - a n d - h e a lt h r e s e a r C h & e d u C at i o n a l t r u s t
sec
tion
five
5
e x h i B i t 5 .2
distr ibution of health Plan enrollment for Covered Workers, by firm size, region, and industr y, 2010
* estimate is statistically different within plan type from estimate for all other firms not in the indicated size, region, or industry category (p<.05).
kaiser/hret survey of employer-sponsored health Benefits, 2010.
s o u r c e :
Conventional hmo PPo Pos hdhP/so
firm size 3–24 Workers 1% 20% 47%* 16%* 16%25–49 Workers 1 12* 54 13 1950–199 Workers 1 18 52 14* 15200–999 Workers 1 20 63 6 101,000–4,999 Workers 1 18 67* 3* 105,000 or more Workers 1 21 61 4* 13
All small firms (3–199 Workers) 1% 18% 51%* 15%* 16%All large firms (200 or more Workers) 1% 21% 63%* 5%* 12%
regioNnortheast 1% 26%* 53% 8% 13%midwest 1 11* 62 6 20*south 1 12* 67* 10 10West 1 33* 47* 7 12
iNDusTry agriculture/mining/Construction 1% 14% 57% 9% 18%manufacturing <1* 14* 68* 5 12transportation/Communications/ utilities
1 21 65 5 8
Wholesale <1* 11* 61 7 21retail 2 13 63 11 10finance 1 28 52 3* 16service 1 21 56 8 14state/local Government 1 17 57 17 8health Care 2 27 50* 9 13
All firms 1% 19% 58% 8% 13%

69%$13,7
70
$5,0
49
2010
Employer Health Benefits2 0 1 0 a n n u a l s u r V e y
s ect ion
Worker and Employer
Contributions for Premiums
6

Worker and E
mployer C
ontributions for Premium
sse
ctio
n six
6
Employer Health Benefits 2 0 1 0 An n u a l s u r vey
70
t h e k a i s e r fa m i ly f o u n d at i o n - a n d - h e a lt h r e s e a r C h & e d u C at i o n a l t r u s t
W o r k e r a n D e M p l o y e r C o n t r i B u t i o n S f o r p r e M i u M S
premium conTribuTions by covered workers averaged 19% for single coverage and 30% for family coverage,
a significanT increase from The percenTages reporTed in 2009 for boTh single and family coverage.1 The
average monThly worker conTribuTions are $75 for single coverage and $333 for family coverage.
In 2010, covered workers on average contribute 19% of the premium for single coverage, a significant increase from 17% in 2009, and 30% of the premium for family coverage, up from 27% in 2009 (Exhibit 6.1). This is the first statistically significant increase since Kaiser/HRET began the survey in 1999.
The average monthly worker contributions increased for both single and family coverage in 2010.
On average, workers with single coverage contribute $75 per month and workers with family coverage contribute $333 per month towards their health insurance premiums; the amounts are higher than the $65 and $293 reported in 2009 (Exhibit 6.2).
Workers enrolled in HDHP/SOs contribute a lower amount annually than the overall average worker contribution for single coverage ($632 compared to $899), while workers in HMO plans with single coverage contribute a higher amount annually ($1,028). Workers enrolled in POS plans contribute a larger amount annually ($5,195) than the overall average worker contribution for family coverage ($3,997) (Exhibit 6.5).
Workers in small firms (3–199 workers) contribute an annual amount of $865 for single coverage, which is similar to the $917 contributed by workers in large firms (200 or more workers) (Exhibit 6.8). In contrast, workers in small firms with family coverage contribute significantly more annually than workers with family coverage in large firms, ($4,665 vs. $3,652) (Exhibit 6.8).
From 2009 to 2010, the average annual worker contribution increased significantly for covered workers in small firms (3–199 workers) with single coverage (from $625 to $865) (Exhibit 6.6). For family coverage, the average annual worker contribution increased from 2009 to 2010 for workers in large firms (200 or more workers) (from $3,182 to $3,652) (Exhibit 6.7). The average annual worker contribution remained stable from 2009 to 2010 for covered workers with single coverage in large firms and family coverage in small firms (Exhibits 6.6 and 6.7).
There is a great deal of variation in worker contributions.
Thirty-four percent of covered workers contribute at least $1,079 annually (120% of the average worker contribution) for single coverage, while 42% of covered workers have an annual worker contribution of less than $719 (80% of the average worker contribution) (Exhibit 6.14).
For family coverage, 28% of covered workers contribute at least $4,797 annually (120% of the average worker contribution), while 46% of covered workers have an annual worker contribution of less than $3,198 (80% of the average worker contribution) (Exhibit 6.14).
The majority of covered workers are employed by a firm that contributes at least half of the premium.
Sixteen percent of workers with single coverage and 5% of workers with family coverage work for a firm that pays 100% of the premium (Exhibit 6.15).
1 estimates for premiums, worker contributions to premiums, and employer contributions to premiums presented in section 6 do not include contributions made by the employer to health savings accounts or health reimbursement arrangements. see section 8 for estimates of employer contributions to hsas and hras.
n o T e :

sec
tion
sixW
orker and Em
ployer Contributions for Prem
iums
6
Employer Health Benefits 2 0 1 0 An n u a l s u r vey
71
t h e k a i s e r fa m i ly f o u n d at i o n - a n d - h e a lt h r e s e a r C h & e d u C at i o n a l t r u s t
2 for definitions of self-funded and fully insured plans, see the introduction to section 10.
n o T e :
Covered workers in small firms (3–199 workers) are more likely to work for a firm that pays 100% of the premium than workers in large firms (200 or more workers). Thirty-five percent of covered workers in small firms have an employer that pays the full premium for single coverage, compared to 6% of covered workers in large firms (Exhibit 6.16). For family coverage, 13% percent of covered workers in small firms have an employer that pays the full premium for family coverage, compared to 1% of covered workers in large firms (Exhibit 6.17).
Eight percent of covered workers in small firms (3–199 workers) contribute more than 50% of the premium for single coverage, compared to 1% of covered workers in large firms (200 or more workers) (Exhibit 6.16). For family coverage, 32% of covered workers in small firms work in a firm where they must contribute more than 50% of the premium, compared to 8% of covered workers in large firms (Exhibit 6.17).
The percentage of the premium paid by covered workers varies by several firm characteristics.
For single coverage, workers in firms with many lower-wage workers (where 35% or more earn $23,000 a year or less) contribute a greater percentage of the premium than those in firms with fewer lower-wage workers (where less than 35% earn $23,000 a year or less) (24% vs. 18%) (Exhibit 6.19).
For family coverage, workers in firms with many lower-wage workers (35% or more earn $23,000 or less annually) contribute a greater percentage of the premium than those in firms with fewer lower-wage workers (less than 35% earn $23,000 or less annually) (35% vs. 29%) (Exhibit 6.20).
Workers with family coverage in firms that are partially or completely self-funded contribute a significantly lower percentage of the premium than those in firms that are fully insured (26% vs. 36%).2 Among small firms, contributions for workers in self-insured plans are 27% compared to 38% for fully insured plans. For large firms, the contributions are 25% and 32% (Exhibit 6.20).
Workers with family coverage in firms that have at least some union workers contribute a significantly lower percentage of the premium than those in firms without any union workers (24% vs. 33%) (Exhibit 6.20).
Some workers are employed by firms that vary premium contributions by workers’ wages.
Thirteen percent of covered workers are in firms that vary worker premium contributions by wage level, which is statistically unchanged from the 10% reported in 2008, which was the last time the question was asked. Workers in large firms are more likely to be employed by a firm that varies contributions by wage than workers in small firms (17% vs. 6%) (Exhibit 6.25).

Worker and E
mployer C
ontributions for Premium
sse
ctio
n six
6
Employer Health Benefits 2 0 1 0 An n u a l s u r vey
72
t h e k a i s e r fa m i ly f o u n d at i o n - a n d - h e a lt h r e s e a r C h & e d u C at i o n a l t r u s t
0%
5%
10%
15%
20%
25%
30%
35%
40%
45%
50%
FAMILY COVERAGE
SINGLE COVERAGE
1999 2000 2001 2002 2003 2004 2005 2006 2007 201020092008
27%
14%
26%
14%
26%
14%
28%
16%
27%
16%
28%
16%
26%
16%
27%
16%
28%
16%
30%*
19%*
27%
17%
27%
16%
e x h i B i t 6 .1
average Percentage of Premium Paid by Covered Workers for single and family Coverage, 1999–2010
* estimate is statistically different from estimate for the previous year shown (p<.05).
kaiser/hret survey of employer-sponsored health Benefits, 1999–2010.
s o u r c e :

sec
tion
sixW
orker and Em
ployer Contributions for Prem
iums
6
Employer Health Benefits 2 0 1 0 An n u a l s u r vey
73
t h e k a i s e r fa m i ly f o u n d at i o n - a n d - h e a lt h r e s e a r C h & e d u C at i o n a l t r u s t
$0
$50
$100
$150
$200
$250
$300
$350
$400
$450
$500
FAMILY COVERAGE
SINGLE COVERAGE
1999 2000 2001 2002 2003 2004 2005 2006 2007 201020092008
$129 $135$149*
$178*$201*
$222* $226$248*
$273*
$333*
$293$280
$27 $28 $30 $39* $42 $47 $51 $52 $58*$75*$65$60
e x h i B i t 6 .2
average monthly Worker Premium Contr ibutions Paid by Covered Workers for s ingle and family Coverage, 1999–2010
* estimate is statistically different from estimate for the previous year shown (p<.05).
kaiser/hret survey of employer-sponsored health Benefits, 1999–2010.
s o u r c e :

Worker and E
mployer C
ontributions for Premium
sse
ctio
n six
6
Employer Health Benefits 2 0 1 0 An n u a l S u r vey
74
T h e K a i s e r Fa m i ly F o u n d aT i o n - a n d - h e a lT h r e s e a r c h & e d u c aT i o n a l T r u s T
2004
2007
2008
2009
2000
2001
2002
2003
2005
2006
1999
WORKER CONTRIBUTION
EMPLOYER CONTRIBUTION
$0 $500 $1,000 $1,500 $2,000 $2,500 $3,000 $3,500 $4,000 $4,500 $5,000 $5,500
$318 $1,878
$334 $2,137*
$355 $2,334*
$466* $2,617*
$508 $2,875*
$558 $3,136*
$610 $3,413*
$627 $3,615*
$694* $3,785
$721 $3,983
$779
$899*
$4,045
2010 $4,150
$2,196
$2,471*
$2,689*
$3,083*
$3,383*
$3,695*
$4,024*
$4,242*
$4,479*
$4,704*
$4,824
$5,049*
e x h i b i T 6 .3
average annual Worker and employer contr ibutions to Premiums and Total Premiums for s ingle coverage, 1999–2010
* estimate is statistically different from estimate for the previous year shown (p<.05).
Kaiser/hreT survey of employer-sponsored health benefits, 1999–2010.
s o u r c e :

sec
tion
sixW
orker and Em
ployer Contributions for Prem
iums
6
Employer Health Benefits 2 0 1 0 An n u a l s u r vey
75
t h e k a i s e r fa m i ly f o u n d at i o n - a n d - h e a lt h r e s e a r C h & e d u C at i o n a l t r u s t
WORKER CONTRIBUTION
EMPLOYER CONTRIBUTION
$0 $2,000 $4,000 $6,000 $8,000 $10,000 $12,000 $14,000 $16,000
$1,543 $4,247
$1,619 $4,819*
$1,787* $5,269*
$2,137* $5,866*
$2,412* $6,657*
$2,661* $7,289*
$2,713 $8,167*
$2,973* $8,508*
$3,281* $8,824
$3,354 $9,325*
$3,515 $9,860*
2004
2007
2008
2009
2000
2001
2002
2003
2005
2006
1999
2010 $3,997* $9,773
$5,791
$6,438*
$7,061*
$8,003*
$9,068*
$9,950*
$10,880*
$11,480*
$12,106*
$12,680*
$13,375*
$13,770*
e x h i B i t 6 .4
average annual Worker and employer Contr ibutions to Premiums and total Premiums for family Coverage, 1999–2010
* estimate is statistically different from estimate for the previous year shown (p<.05).
kaiser/hret survey of employer-sponsored health Benefits, 1999–2010.
s o u r c e :

Worker and E
mployer C
ontributions for Premium
sse
ctio
n six
6
Employer Health Benefits 2 0 1 0 An n u a l s u r vey
76
t h e k a i s e r fa m i ly f o u n d at i o n - a n d - h e a lt h r e s e a r C h & e d u C at i o n a l t r u s t
$0 $2,000 $4,000 $6,000 $8,000 $10,000 $12,000 $14,000 $16,000
SINGLEHMO
FAMILY
ALL PLANS
HDHP/SO
SINGLE
FAMILY
PPOSINGLE
FAMILY
POS
SINGLE
SINGLE
FAMILY
FAMILY
$1,028* $5,130
$4,357 $14,125
$899
$905
$974
$5,195*
$14,033
$13,213
$12,384*
$13,770
$4,470*
$3,997
$3,823
$5,124
$5,239
$632*
$3,522
$4,102
$9,768
$4,150
$4,265
$8,018*
$4,219
$9,773
$10,210
$3,839*
$8,861*
$5,049
WORKER CONTRIBUTION
EMPLOYER CONTRIBUTION
e x h i B i t 6 .5
average annual fi rm and Worker Premium Contr ibutions and total Premiums for Covered Workers for s ingle and family Coverage, by Plan type, 2010
* estimate is statistically different from all Plans estimate by coverage type (p<.05).
kaiser/hret survey of employer-sponsored health Benefits, 2010.
s o u r c e :

sec
tion
sixW
orker and Em
ployer Contributions for Prem
iums
6
Employer Health Benefits 2 0 1 0 An n u a l s u r vey
77
t h e k a i s e r fa m i ly f o u n d at i o n - a n d - h e a lt h r e s e a r C h & e d u C at i o n a l t r u s t
$0
$100
$200
$300
$400
$500
$600
$700
$800
$900
$1,000
ALL SMALL FIRMS (3–199 WORKERS)
ALL LARGE FIRMS (200 OR MORE WORKERS)
1999 2000 2001 2002 2003 2004 2005 2006 2007 201020092008
$334
$286
$363
$280
$380
$306
$495*
$406*
$536
$450
$578
$513
$638*
$556
$689
$515
$759*
$561
$917
$865*
$854*
$625
$769
$624
e x h i B i t 6 .6
average annual Worker Contr ibutions for Covered Workers with single Coverage, by firm size, 1999–2010
* estimate is statistically different from estimate for the previous year shown (p<.05).
kaiser/hret survey of employer-sponsored health Benefits, 1999–2010.
s o u r c e :

Worker and E
mployer C
ontributions for Premium
sse
ctio
n six
6
Employer Health Benefits 2 0 1 0 An n u a l s u r vey
78
t h e k a i s e r fa m i ly f o u n d at i o n - a n d - h e a lt h r e s e a r C h & e d u C at i o n a l t r u s t
$0
$1,000
$2,000
$3,000
$4,000
$5,000
ALL SMALL FIRMS (3–199 WORKERS)
ALL LARGE FIRMS (200 OR MORE WORKERS)
1999 2000 2001 2002 2003 2004 2005 2006 2007 201020092008
$1,831
$1,398
$1,940
$1,453
$2,254*
$1,551
$2,647*
$1,893*
$2,970
$2,146*
$3,382*
$2,340*
$3,170
$2,487
$3,550
$2,658
$4,236*
$2,831
$4,665
$3,652*
$4,204
$3,182
$4,101
$2,982
e x h i B i t 6 .7
average annual Worker Contr ibutions for Covered Workers with family Coverage, by firm size, 1999–2010
* estimate is statistically different from estimate for the previous year shown (p<.05).
kaiser/hret survey of employer-sponsored health Benefits, 1999–2010.
s o u r c e :
* estimate is statistically different from estimate for the previous year shown (p<.05).
kaiser/hret survey of employer-sponsored health Benefits, 1999–2010.
s o u r c e :

sec
tion
sixW
orker and Em
ployer Contributions for Prem
iums
6
Employer Health Benefits 2 0 1 0 An n u a l s u r vey
79
t h e k a i s e r fa m i ly f o u n d at i o n - a n d - h e a lt h r e s e a r C h & e d u C at i o n a l t r u s t
e x h i B i t 6 .8
average annual Worker Premium Contr ibutions Paid by Covered Workers for s ingle and family Coverage, by firm size, 1999–2010
* estimate is statistically different between all small firms and all large firms within year (p<.05).
kaiser/hret survey of employer-sponsored health Benefits, 1999–2010.
s o u r c e :
single Coverage family Coverage
all small firms (3–199 Workers)
all large firms (200 or more Workers)
all small firms (3–199 Workers)
all large firms (200 or more Workers)
1999 $286 $334 $1,831* $1,398*
2000 $280* $363* $1,940* $1,453*
2001 $306* $380* $2,254* $1,551*
2002 $406* $495* $2,647* $1,893*
2003 $450 $536 $2,970* $2,146*
2004 $513 $578 $3,382* $2,340*
2005 $556 $638 $3,170* $2,487*
2006 $515* $689* $3,550* $2,658*
2007 $561* $759* $4,236* $2,831*
2008 $624* $769* $4,101* $2,982*
2009 $625* $854* $4,204* $3,182*
2010 $865 $917 $4,665* $3,652*

Worker and E
mployer C
ontributions for Premium
sse
ctio
n six
6
Employer Health Benefits 2 0 1 0 An n u a l s u r vey
80
t h e k a i s e r fa m i ly f o u n d at i o n - a n d - h e a lt h r e s e a r C h & e d u C at i o n a l t r u s t
Worker
Contributionemployer
Contributiontotal Premium
hmoall small firms (3–199 Workers) $991 $4,141 $5,133all large firms (200 or more Workers) $1,045 $4,085 $5,129
ppoall small firms (3–199 Workers) $787* $4,382 $5,169all large firms (200 or more Workers) $956* $4,148 $5,104
posall small firms (3–199 Workers) $1,145 $4,000 $5,145all large firms (200 or more Workers) $676 $4,725 $5,402
hDhp/soall small firms (3–199 Workers) $716 $3,738 $4,454all large firms (200 or more Workers) $571 $3,911 $4,482
All plANsall small firms (3–199 Workers) $865 $4,180 $5,046all large firms (200 or more Workers) $917 $4,133 $5,050
e x h i B i t 6 .9
average annual fi rm and Worker Premium Contr ibutions and total Premiums for Covered Workers for s ingle Coverage, by Plan type and firm size, 2010
* estimates are statistically different within plan type between all small firms and all large firms (p<.05).
kaiser/hret survey of employer-sponsored health Benefits, 2010.
s o u r c e :

sec
tion
sixW
orker and Em
ployer Contributions for Prem
iums
6
Employer Health Benefits 2 0 1 0 An n u a l s u r vey
81
t h e k a i s e r fa m i ly f o u n d at i o n - a n d - h e a lt h r e s e a r C h & e d u C at i o n a l t r u s t
Worker
Contributionemployer
Contributiontotal Premium
hmoall small firms (3–199 Workers) $4,972 $8,313* $13,285*all large firms (200 or more Workers) $4,089 $10,403* $14,492*
ppoall small firms (3–199 Workers) $4,380* $9,355* $13,735all large firms (200 or more Workers) $3,586* $10,574* $14,161
posall small firms (3–199 Workers) $5,536 $7,289 $12,825all large firms (200 or more Workers) $4,634 $9,216 $13,850
hDhp/soall small firms (3–199 Workers) $4,472* $7,550* $12,022all large firms (200 or more Workers) $2,849* $9,791* $12,640
All plANsall small firms (3–199 Workers) $4,665* $8,585* $13,250*all large firms (200 or more Workers) $3,652* $10,386* $14,038*
e x h i B i t 6 .10
average annual fi rm and Worker Premium Contr ibutions and total Premiums for Covered Workers for family Coverage, by Plan type and firm size, 2010
* estimates are statistically different within plan type between all small firms and all large firms (p<.05).
kaiser/hret survey of employer-sponsored health Benefits, 2010.
s o u r c e :

Worker and E
mployer C
ontributions for Premium
sse
ctio
n six
6
Employer Health Benefits 2 0 1 0 An n u a l s u r vey
82
t h e k a i s e r fa m i ly f o u n d at i o n - a n d - h e a lt h r e s e a r C h & e d u C at i o n a l t r u s t
e x h i B i t 6 .11
average monthly and annual Worker Premium Contr ibutions Paid by Covered Workers for s ingle and family Coverage, by Plan type and firm size, 2010
monthly annual
single Coverage family Coverage single Coverage family Coverage
hmo all small firms (3–199 Workers) $83 $414 $991 $4,972all large firms (200 or more Workers) 87 341 1,045 4,089
All firm sizes $86 $363 $1,028 $4,357
ppo all small firms (3–199 Workers) $66* $365* $787* $4,380*all large firms (200 or more Workers) 80* 299* 956* 3,586*
All firm sizes $75 $319 $905 $3,823
pos all small firms (3–199 Workers) $95 $461 $1,145 $5,536all large firms (200 or more Workers) 56 386 676 4,634
All firm sizes $81 $433 $974 $5,195
hDhp/soall small firms (3–199 Workers) $60 $373* $716 $4,472*all large firms (200 or more Workers) 48 237* 571 2,849*
All firm sizes $53 $294 $632 $3,522
All plANsall small firms (3–199 Workers) $72 $389* $865 $4,665*all large firms (200 or more Workers) 76 304* 917 3,652*
All firm sizes $75 $333 $899 $3,997
* estimates are statistically different within plan type between all small firms and all large firms (p<.05).
kaiser/hret survey of employer-sponsored health Benefits, 2010.
s o u r c e :

sec
tion
sixW
orker and Em
ployer Contributions for Prem
iums
6
Employer Health Benefits 2 0 1 0 An n u a l s u r vey
83
t h e k a i s e r fa m i ly f o u n d at i o n - a n d - h e a lt h r e s e a r C h & e d u C at i o n a l t r u s t
e x h i B i t 6 .12
average monthly and annual Worker Premium Contr ibutions Paid by Covered Workers for s ingle and family Coverage, by Plan type and region, 2010
monthly annual
single Coverage family Coverage single Coverage family Coverage
hmonortheast $111* $339 $1,333* $4,069midwest 76 345 908 4,145south 77 340 929 4,082West 76 401 916 4,809
All regioNs $86 $363 $1,028 $4,357
pponortheast $83 $282* $998 $3,388*midwest 79 326 947 3,916south 71 348* 848 4,177*West 73 280 882 3,359
All regioNs $75 $319 $905 $3,823
posnortheast $167 $375 $2,000 $4,495midwest 67 394 808 4,733south 52 443 628 5,317West 76 484 907 5,813
All regioNs $81 $433 $974 $5,195
hDhp/sonortheast $59 $357 $707 $4,278midwest 55 230* 658 2,765*south 59 363 710 4,358West 32* 242 382* 2,903
All regioNs $53 $294 $632 $3,522
All plANsnortheast $94* $313 $1,123* $3,754midwest 73 313 876 3,759south 68* 358* 822* 4,300*West 70 331 841 3,978
All regioNs $75 $333 $899 $3,997
* estimate is statistically different within plan type from estimate for all other firms not in the indicated region (p<.05).
kaiser/hret survey of employer-sponsored health Benefits, 2010.
s o u r c e :

Worker and E
mployer C
ontributions for Premium
sse
ctio
n six
6
Employer Health Benefits 2 0 1 0 An n u a l s u r vey
84
t h e k a i s e r fa m i ly f o u n d at i o n - a n d - h e a lt h r e s e a r C h & e d u C at i o n a l t r u s t
* estimate is statistically different from estimate for the previous year shown (p<.05).
^ information was not obtained for hdhP/sos prior to 2006.
kaiser/hret survey of employer-sponsored health Benefits, 1999-2010.
s o u r c e :
e x h i B i t 6 .13
average monthly Worker Premium Contr ibutions Paid by Covered Workers for s ingle and family Coverage, by Plan type, 1999–2010
1999 2000 2001 2002 2003 2004 2005 2006 2007 2008 2009 2010
single Coverage hmo $28 $26 $32 $38 $42 $46 $47 $49 $59 $59 $68 $86*PPo 27 29 29 39* 44 48 50 53 60* 61 67* 75*Pos 27 28 29 40* 41 45 61* 53 52 72 62 81hdhP/so ^ ^ ^ ^ ^ ^ ^ 47 43 39 45 53
All plANs $27 $28 $30 $39* $42 $47 $51 $52 $58* $60 $65 $75*
family Coveragehmo $124 $131 $150 $164 $179 $223* $217 $257* $276 $282 $307 $363*PPo 128 141 153 188* 210* 224 220 243* 270* 279 289 319*Pos 141 136 143 180* 206 218 271* 269 305 311 346 433*hdhP/so ^ ^ ^ ^ ^ ^ ^ 187 238 234 223 294*
All plANs $129 $135 $149* $178* $201* $222* $226 $248* $273* $280 $293 $333*
e x h i B i t 6 .14
distr ibution of Worker Premium Contr ibutions for s ingle and family Coverage relat ive to the average annual Worker Premium Contr ibution, 2010
note: the average annual worker contribution is $899 for single coverage and $3,997 for family coverage. the worker contribution distribution is relative to the average single or family worker contribution. for example, $719 is 80% of the average single worker contribution and $1,079 is 120% of the average single worker contribution. the same break points relative to the average are used for the distribution for family coverage.
kaiser/hret survey of employer-sponsored health Benefits, 2010.
s o u r c e :
single Coverage family Coverage
Premium Contribution range, relative to average
Premium Contribution
Premium Contribution range,
dollar amount
Percentage of Covered Workers
in range
Premium Contribution range,
dollar amount
Percentage of Covered Workers
in range
less than 80% less than $719 42% less than $3,198 46%
80% to less than average $719 to <$899 12% $3,198 to <$3,997 16%
average to less than 120% $899 to <$1,079 12% $3,997 to <$4,797 11%
120% or more $1,079 or more 34% $4,797 or more 28%

sec
tion
sixW
orker and Em
ployer Contributions for Prem
iums
6
Employer Health Benefits 2 0 1 0 An n u a l s u r vey
85
t h e k a i s e r fa m i ly f o u n d at i o n - a n d - h e a lt h r e s e a r C h & e d u C at i o n a l t r u s t
0% 20% 40% 60% 80% 100%
0%
GREATER THAN 0%, LESS THAN OR EQUAL TO 25%
GREATER THAN 25%, LESS THAN OR EQUAL TO 50%
GREATER THAN 50%
2004*
2006
2008
2009*
2010*
2002
2003*
2005
2007
2004*
2006
2008
2009
2010*
2002
2003*
2005*
2007*
SINGLECOVERAGE
FAMILYCOVERAGE
24%56%16%
13% 5%58%24%
17% 3%57%24%
21% 2%56%21%
19% 3%57%21%
18% 2%56%23%
21% 2%56%20%
19% 2%59%20%
22% 1%58%18%
35% 16%43%5%
29% 16%46%9%
31% 14%47%8%
36% 13%44%7%
32% 13%46%9%
37% 12%42%9%
31% 15%47%6%
33% 14%46%7%
33% 12%48%6%
4%
e x h i B i t 6 .15
distr ibution of Percentage of Premium Paid by Covered Workers for s ingle and family Coverage, 2002–2010
* distribution is statistically different within coverage type from distribution for the previous year shown (p<.05).
kaiser/hret survey of employer-sponsored health Benefits, 2002–2010.
s o u r c e :

Worker and E
mployer C
ontributions for Premium
sse
ctio
n six
6
Employer Health Benefits 2 0 1 0 An n u a l s u r vey
86
t h e k a i s e r fa m i ly f o u n d at i o n - a n d - h e a lt h r e s e a r C h & e d u C at i o n a l t r u s t
0% 20% 40% 60% 80% 100%
0%
GREATER THAN 0%, LESS THAN OR EQUAL TO 25%
GREATER THAN 25%, LESS THAN OR EQUAL TO 50%
GREATER THAN 50%
2004
2006
2008
2009
2010*
2002
2003
2005
2007
2004*
2006
2008
2009*
2010*
2002
2003*
2005
2007*
ALL SMALL FIRMS(3–199 WORKERS)
ALL LARGE FIRMS(200 OR MORE
WORKERS)
18% 8%39%35%
13% 8%35%45%
14% 6%35%45%
17% 5%35%42%
18% 6%36%41%
14%38%43%
16%36%44%
16%40%40%
19%40%39%
27% 1%65%6%
14% 4%69%14%
18% 1%67%14%
23% 1%65%11%
20% 1%67%12%
20% 1%66%13%
23% 2%66%9%
20% 1%68%10%
24% 1%67%8%
4%
4%
5%
3%
e x h i B i t 6 .16
distr ibution of Percentage of Premium Paid by Covered Workers for s ingle Coverage, by firm size, 2002–2010
* distribution is statistically different within size category from distribution for the previous year shown (p<.05).
kaiser/hret survey of employer-sponsored health Benefits, 2002–2010.
s o u r c e :

sec
tion
sixW
orker and Em
ployer Contributions for Prem
iums
6
Employer Health Benefits 2 0 1 0 An n u a l s u r vey
87
t h e k a i s e r fa m i ly f o u n d at i o n - a n d - h e a lt h r e s e a r C h & e d u C at i o n a l t r u s t
0% 20% 40% 60% 80% 100%
0%
GREATER THAN 0%, LESS THAN OR EQUAL TO 25%
GREATER THAN 25%, LESS THAN OR EQUAL TO 50%
GREATER THAN 50%
2004*
2006
2008*
2009
2010
2002
2003
2005*
2007*
2004
2006*
2008
2009*
2010*
2002
2003*
2005
2007*
ALL SMALL FIRMS(3–199 WORKERS)
ALL LARGE FIRMS(200 OR MORE
WORKERS)
25% 32%30%13%
28% 31%23%18%
26% 31%28%15%
39% 28%17%15%
37% 23%22%18%
38%20%17%
25%25%13%
31%27%13%
28%28%14%
40% 8%50%1%
29% 9%57%5%
33% 6%57%4%
34% 6%56%4%
30% 7%57%5%
36% 5%54%5%
34% 5%58%3%
34% 6%56%4%
36% 4%58%2%
24%
37%
30%
30%
e x h i B i t 6 .17
distr ibution of Percentage of Premium Paid by Covered Workers for family Coverage, by firm size, 2002–2010
* distribution is statistically different within size category from distribution for the previous year shown (p<.05).
kaiser/hret survey of employer-sponsored health Benefits, 2002–2010.
s o u r c e :

Worker and E
mployer C
ontributions for Premium
sse
ctio
n six
6
Employer Health Benefits 2 0 1 0 An n u a l S u r vey
88
T h e K a i s e r Fa m i ly F o u n d aT i o n - a n d - h e a lT h r e s e a r c h & e d u c aT i o n a l T r u s T
0% 10% 20% 30% 40% 50% 60% 70% 80% 90% 100%
FEW WORKERS ARE LOWER-WAGE(LESS THAN 35% EARN $23,000 A YEAR OR LESS)*
MANY WORKERS ARE LOWER-WAGE (35% ORMORE EARN $23,000 A YEAR OR LESS)*
FEW WORKERS ARE LOWER-WAGE(LESS THAN 35% EARN $23,000 A YEAR OR LESS)
MANY WORKERS ARE LOWER-WAGE (35% ORMORE EARN $23,000 A YEAR OR LESS)
SINGLE COVERAGE
FAMILY COVERAGE
3%22%16% 58%
6%40%17% 37%
16%34%6% 45%
21%41%5% 33%
0%
GREATER THAN 0%, LESS THAN OR EQUAL TO 25%
GREATER THAN 25%, LESS THAN OR EQUAL TO 50%
GREATER THAN 50%
e x h i b i T 6 .18
distr ibution of the Percentage of Total Premium Paid by covered Workers for s ingle and Family coverage, by Wage, 2010
* distributions for higher-Wage and lower-Wage Firms are statistically different (p<.05).
Kaiser/hreT survey of employer-sponsored health benefits, 2010.
s o u r c e :

sec
tion
sixW
orker and Em
ployer Contributions for Prem
iums
6
Employer Health Benefits 2 0 1 0 An n u a l s u r vey
89
t h e k a i s e r fa m i ly f o u n d at i o n - a n d - h e a lt h r e s e a r C h & e d u C at i o n a l t r u s t
e x h i B i t 6 .19
average Percentage of Premium Paid by Covered Workers for s ingle Coverage, by firm Charac ter ist ics, 2010
* estimates are statistically different from each other within firm size category (p<.05).
kaiser/hret survey of employer-sponsored health Benefits, 2010.
s o u r c e :
all small firms (3–199 Workers)
all large firms (200 or more
Workers)all firms
Wage level few Workers are lower-Wage (less than 35% earn $23,000 a year or less)
17% 18%* 18%*
many Workers are lower-Wage (35% or more earn $23,000 a year or less)
19% 26%* 24%*
unions firm has at least some union Workers 17% 17%* 17%firm does not have any union Workers 18% 21%* 19%
younger Workers less than 35% of Workers are age 26 or younger 17% 19% 18%35% or more Workers are age 26 or younger 24% 22% 22%
older Workers less than 35% of Workers are age 50 or older 19% 19% 19%35% or more Workers are age 50 or older 15% 18% 17%
funding Arrangementfully insured 18% 20% 18%self-funded 17% 19% 19%

Worker and E
mployer C
ontributions for Premium
sse
ctio
n six
6
Employer Health Benefits 2 0 1 0 An n u a l s u r vey
90
t h e k a i s e r fa m i ly f o u n d at i o n - a n d - h e a lt h r e s e a r C h & e d u C at i o n a l t r u s t
e x h i B i t 6 .20
average Percentage of Premium Paid by Covered Workers for family Coverage, by firm Charac ter ist ics, 2010
* estimates are statistically different from each other within firm size category (p<.05).
kaiser/hret survey of employer-sponsored health Benefits, 2010.
s o u r c e :
all small firms (3–199 Workers)
all large firms (200 or more
Workers)all firms
Wage level few Workers are lower-Wage (less than 35% earn $23,000 a year or less)
36% 26%* 29%*
many Workers are lower-Wage (35% or more earn $23,000 a year or less)
38% 33%* 35%*
unions firm has at least some union Workers 26%* 23%* 24%*firm does not have any union Workers 37%* 29%* 33%*
younger Workers less than 35% of Workers are age 26 or younger 35% 26% 29%35% or more Workers are age 26 or younger 46% 31% 35%
older Workers less than 35% of Workers are age 50 or older 37% 26% 30%35% or more Workers are age 50 or older 33% 28% 30%
funding Arrangementfully insured 38%* 32%* 36%*self-funded 27%* 25%* 26%*

sec
tion
sixW
orker and Em
ployer Contributions for Prem
iums
6
Employer Health Benefits 2 0 1 0 An n u a l s u r vey
91
t h e k a i s e r fa m i ly f o u n d at i o n - a n d - h e a lt h r e s e a r C h & e d u C at i o n a l t r u s t
e x h i B i t 6 .21
average Percentage of Premium Paid by Covered Workers for s ingle and family Coverage, by Plan type and firm size, 2010
* estimates are statistically different within plan type between all small firms and all large firms (p<.05).
kaiser/hret survey of employer-sponsored health Benefits, 2010.
s o u r c e :
single Coverage family Coverage
hmoall small firms (3–199 Workers) 20% 37%*all large firms (200 or more Workers) 21 29*
All firm sizes 21% 31%
ppoall small firms (3–199 Workers) 16%* 33%*all large firms (200 or more Workers) 20* 26*
All firm sizes 19% 28%
posall small firms (3–199 Workers) 23% 42%all large firms (200 or more Workers) 12 35
All firm sizes 19% 39%
hDhp/soall small firms (3–199 Workers) 15% 37%*all large firms (200 or more Workers) 14 22*
All firm sizes 14% 28%
All plANsall small firms (3–199 Workers) 18% 36%*all large firms (200 or more Workers) 19 27*
All firm sizes 19% 30%

Worker and E
mployer C
ontributions for Premium
sse
ctio
n six
6
Employer Health Benefits 2 0 1 0 An n u a l s u r vey
92
t h e k a i s e r fa m i ly f o u n d at i o n - a n d - h e a lt h r e s e a r C h & e d u C at i o n a l t r u s t
* estimate is statistically different from estimate for the previous year shown (p<.05).
^ information was not obtained for hdhP/sos prior to 2006.
kaiser/hret survey of employer-sponsored health Benefits, 1999–2010.
s o u r c e :
e x h i B i t 6 .22
average Percentage of Premium Paid by Covered Workers for s ingle and family Coverage, by Plan type, 1999–2010
1999 2000 2001 2002 2003 2004 2005 2006 2007 2008 2009 2010
single Coverage hmo 16% 14% 18% 16% 17% 16% 16% 15% 17% 16% 18% 21%*PPo 13 14 13 16* 16 16 15 15 17 16 17 19Pos 15 14 13 16* 16 16 19 16 14 18 16 19hdhP/so ^ ^ ^ ^ ^ ^ ^ 18 15 11 14 14
All plANs 14% 14% 14% 16% 16% 16% 16% 16% 16% 16% 17% 19%*
family Coveragehmo 28% 26% 29% 27% 26% 29% 26% 28% 28% 26% 28% 31%PPo 26 27 26 29* 28 27 25 26 27 27 26 28Pos 28 26 25 28 28 28 31 30 32 31 32 39hdhP/so ^ ^ ^ ^ ^ ^ ^ 25 27 29 25 28
All plANs 27% 26% 26% 28% 27% 28% 26% 27% 28% 27% 27% 30%*

sec
tion
sixW
orker and Em
ployer Contributions for Prem
iums
6
Employer Health Benefits 2 0 1 0 An n u a l s u r vey
93
t h e k a i s e r fa m i ly f o u n d at i o n - a n d - h e a lt h r e s e a r C h & e d u C at i o n a l t r u s t
e x h i B i t 6 .23
average Percentage of Premium Paid by Covered Workers for s ingle and family Coverage, by Plan type and region, 2010
* estimate is statistically different within plan type from estimate for all other firms not in the indicated region (p<.05).
kaiser/hret survey of employer-sponsored health Benefits, 2010.
s o u r c e :
single Coverage family Coverage
hmonortheast 23% 27%*midwest 19 30south 20 31West 20 35
All regioNs 21% 31%
pponortheast 19% 24%*midwest 19 27south 19 33*West 17 24*
All regioNs 19% 28%
posnortheast 33% 29%*midwest 16 30south 14 42West 19 49
All regioNs 19% 39%
hDhp/sonortheast 15% 31%midwest 16 23*south 15 36*West 9* 25
All regioNs 14% 28%
All plANsnortheast 21% 26%*midwest 18 27*south 18 34*West 17 30
All regioNs 19% 30%

Worker and E
mployer C
ontributions for Premium
sse
ctio
n six
6
Employer Health Benefits 2 0 1 0 An n u a l s u r vey
94
t h e k a i s e r fa m i ly f o u n d at i o n - a n d - h e a lt h r e s e a r C h & e d u C at i o n a l t r u s t
e x h i B i t 6 .24
average Percentage of Premium Paid by Covered Workers, by Plan type and industr y, 2010
single Coverage family Coverage
hmoagriculture/mining/Construction nsd nsdmanufacturing 25% 24%*transportation/Communications/utilities 18 23*Wholesale nsd nsdretail nsd nsdfinance 20 28service 22 36*state/local Government 12* 20*health Care 20 35
All iNDusTries 21% 31%
ppoagriculture/mining/Construction 21% 32%manufacturing 22* 26transportation/Communications/utilities 19 28Wholesale 20 29retail 22 38finance 22* 27service 18 31state/local Government 10* 21*health Care 16 29
All iNDusTries 19% 28%
posagriculture/mining/Construction nsd nsdmanufacturing nsd nsdtransportation/Communications/utilities nsd nsdWholesale nsd nsdretail nsd nsdfinance nsd nsdservice 14% 31%*state/local Government nsd nsdhealth Care nsd nsd
All iNDusTries 19% 39%
Continued on next page
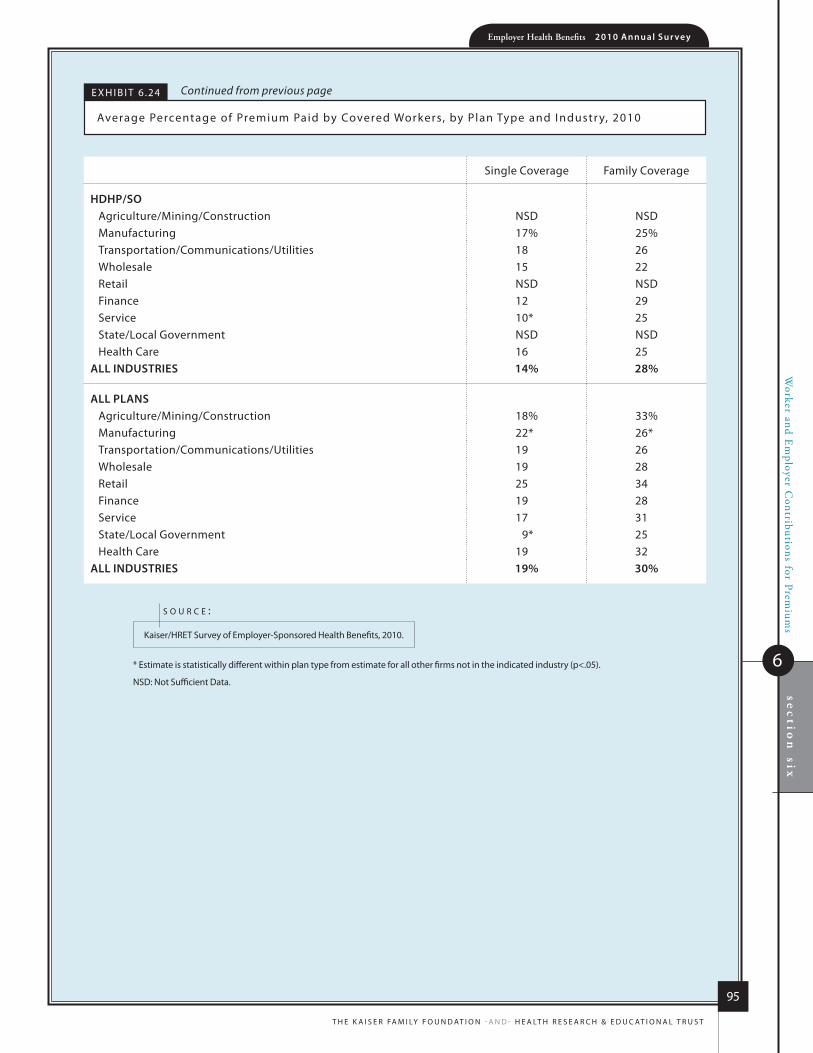
sec
tion
sixW
orker and Em
ployer Contributions for Prem
iums
6
Employer Health Benefits 2 0 1 0 An n u a l s u r vey
95
t h e k a i s e r fa m i ly f o u n d at i o n - a n d - h e a lt h r e s e a r C h & e d u C at i o n a l t r u s t
e x h i B i t 6 .24
average Percentage of Premium Paid by Covered Workers, by Plan type and industr y, 2010
* estimate is statistically different within plan type from estimate for all other firms not in the indicated industry (p<.05).
nsd: not sufficient data.
kaiser/hret survey of employer-sponsored health Benefits, 2010.
s o u r c e :
single Coverage family Coverage
hDhp/soagriculture/mining/Construction nsd nsdmanufacturing 17% 25%transportation/Communications/utilities 18 26Wholesale 15 22retail nsd nsdfinance 12 29service 10* 25state/local Government nsd nsdhealth Care 16 25
All iNDusTries 14% 28%
All plANsagriculture/mining/Construction 18% 33%manufacturing 22* 26*transportation/Communications/utilities 19 26Wholesale 19 28retail 25 34finance 19 28service 17 31state/local Government 9* 25health Care 19 32
All iNDusTries 19% 30%
Continued from previous page

Worker and E
mployer C
ontributions for Premium
sse
ctio
n six
6
Employer Health Benefits 2 0 1 0 An n u a l s u r vey
96
t h e k a i s e r fa m i ly f o u n d at i o n - a n d - h e a lt h r e s e a r C h & e d u C at i o n a l t r u s t
e x h i B i t 6 .25
Percentage of Covered Workers in firms that Var y Worker Premium Contr ibutions by Wage, by firm size and region, 2010
* estimate is statistically different from estimate for all firms not in the indicated size or region category (p<.05).
kaiser/hret survey of employer-sponsored health Benefits, 2010.
s o u r c e :
Percentage of Covered Workers in firms that Vary Worker Premium
Contributions by Wage level
firm size200–999 Workers 9%1,000–4,999 Workers 165,000 or more Workers 21*
All small firms (3–199 Workers) 6%*All large firms (200 or more Workers) 17%*
regioNnortheast 20%midwest 11south 12West 13
All firms 13%

69%$13,7
70
$5,0
49
2010
Employer Health Benefits2 0 1 0 a n n u a l s u r V e y
s ect ion
EmployeeCost Sharing
7

Em
ployee Cost Sharing
7sectio
n seven
Employer Health Benefits 2 0 1 0 An n u a l s u r vey
98
t h e k a i s e r fa m i ly f o u n d at i o n - a n d - h e a lt h r e s e a r C h & e d u C at i o n a l t r u s t
e M p l o y e e C o S t S h a r i n g
in addiTion To any required premium conTribuTions, covered workers may face cosT sharing for The
medical services ThaT They use. cosT sharing for medical services can Take a varieTy of forms, including
deducTibles (an amounT ThaT musT be paid before some or all services are covered), copaymenTs (fixed
dollar amounTs), and/or coinsurance (a percenTage of The charge for services). The Type and level of
cosT sharing ofTen varies by The Type of plan in which The worker is enrolled. cosT sharing may also vary
by The Type of service received such as office visiTs, hospiTalizaTions, or prescripTion drugs.
The cosT-sharing amounTs reporTed here are for covered workers using services provided in-neTwork by
parTicipaTing providers. plan enrollees receiving services from providers ThaT do noT parTicipaTe in plan
neTworks ofTen face higher cosT sharing and may be responsible for charges ThaT exceed plan allowable
amounTs. The framework of This survey does noT allow us To capTure all of The complex cosT-sharing
requiremenTs in modern plans, parTicularly for ancillary services (such as durable medical equipmenT
or physical Therapy) or cosT-sharing arrangemenTs ThaT vary across differenT seTTings (such as Tiered
neTworks). Therefore, we do noT collecT informaTion on all of The plan provisions and limiTs ThaT affecT
enrollee ouT-of-pockeT liabiliTy.
g e N e r A l A N N u A l D e D u C T i b l e s
�A general annual deductible is an amount that must be paid by the enrollee before all or most services are covered by their health plan. The likelihood of having a deductible varies by plan type.
Workers in HMOs are least likely to have a general annual deductible for single coverage compared to other plan types. Seventy-two percent of workers in HMOs with single coverage do not have a general annual deductible, compared to 34% of workers in POS plans and 23% of workers in PPOs. The percentages are similar for family coverage (Exhibit 7.1). Between 2009 and 2010 the percentage of workers in HMOs without a deductible for single or family coverage decreased from 84% to 72%.
Workers without a general annual plan deductible often have other forms of cost sharing for medical services. For workers without a general annual deductible for single coverage, 78% of workers in HMOs, 75% of workers in PPOs, and 74% of workers in POS plans are
in plans that require cost sharing for hospital admissions. The percentages are similar for family coverage (Exhibit 7.2).
�Deductibles vary greatly by plan type and firm size.
The average annual deductibles among those workers with a deductible for single coverage are $601 for HMOs, $675 for PPOs, $1,048 for POS plans, and $1,903 for HDHP/SOs (Exhibit 7.3).
For each of the plan types, there is no statistically significant change in deductible amounts from 2009 to 2010 for single or family coverage. Since 2006, the earliest year for which we have comparable deductible data, the average deductible for workers with PPOs has increased from $473 to $675 in 2010 for single coverage (Exhibit 7.5) and, for aggregate family deductibles, from $1,034 to $1,518 in 2010 (Exhibit 7.12).
Deductibles are generally higher for covered workers in plans sponsored by small firms (3–199 workers) than for covered workers in large firms (200 or more workers) (Exhibit 7.3 and Exhibit 7.11).

Em
ployee Cost Sharing
7
section
sevenEmployer Health Benefits 2 0 1 0 An n u a l s u r vey
99
t h e k a i s e r fa m i ly f o u n d at i o n - a n d - h e a lt h r e s e a r C h & e d u C at i o n a l t r u s t
�For family coverage, the majority of workers with general annual deductibles have an aggregate deductible, meaning all family members’ out-of-pocket expenses count toward meeting the deductible amount. Among those with a general annual deductible for family coverage, the percentage of covered workers with an aggregate general annual deductible ranges from 65% for PPOs to 89% for HDHP/SOs.
The average amounts for workers with an aggregate deductible for family coverage are $1,321 for HMOs, $1,518 for PPOs, $2,253 for POS plans, and $3,780 for HDHP/SOs (Exhibit 7.11).
�The other type of family deductible, a separate per-person deductible, requires each family member to meet a separate per-person deductible amount before the plan covers expenses for that member. Most plans with separate per-person family deductibles consider the deductible met if a prescribed number of family members each reach their separate deductible amounts.
For covered workers in health plans that have separate per-person general annual deductible amounts for family coverage, the average plan deductible amounts are $500 for HMOs, $596 for PPOs, $1,164 for POS plans, and $2,053 for HDHP/SOs (Exhibit 7.11). Most covered workers in plans with a separate general annual deductible for family coverage have a limit to the number of family members required to meet the separate deductible amounts (Exhibit 7.14).1 Among those workers in plans with a limit on the number of family members, the average number of family members required to meet the separate deductible amounts is three for PPOs and HMOs and two for HDHP/SOs.2
�The percentage of workers with deductibles of $1,000 or more for single coverage continues to increase.
From 2006 to 2010, the percentage of covered workers with a deductible of $1,000 or more for single coverage has almost tripled, from 10%
to 27% (Exhibit 7.7). Workers in small firms (3–199 workers) are more likely to have a general annual deductible of $1,000 or more for single coverage than workers in large firms (200 or more workers) (46% vs. 17%) (Exhibit 7.6).
�The majority of covered workers with a deductible are in plans where the deductible does not have to be met before certain services, such as physician office visits, preventive care, or prescription drugs, are covered.
Roughly four-fifths (83%) of covered workers with general plan deductibles in HMOs , POS plans (81%), and PPOs (70%) are enrolled in plans where the deductible does not have to be met before physician office visits for primary care are covered (Exhibit 7.16).
Higher shares of covered workers do not have to meet the deductible before preventive care is covered in HMOs (96%), PPOs (91%), POS plans (87%), and HDHP/SOs (93%) (Exhibit 7.16).
Similarly, among workers with a general annual deductible, covered workers in HMOs (94%), PPOs (92%), and POS plans (92%) are enrolled in plans where the general annual deductible does not have to be met before prescription drugs are covered (Exhibit 7.16).
h o s p i TA l C o s T s h A r i N g
�We continue to examine and sometimes modify the questions on hospital and outpatient surgery cost sharing because this can be a complex component of health benefit plans. As in past years, we collected information on the cost-sharing provisions for hospital admissions and outpatient surgery that are in addition to any general annual plan deductible. Beginning with the 2009 survey, in order to better capture the prevalence of combinations of cost sharing, the survey was changed to ask a series of yes or no questions. Previously, the question asked respondents to select one response from a list of types of cost sharing, such as separate deductibles, copayments, coinsurance, and per diem payments
1 some workers with separate per-person deductibles or out-of-pocket maximums for family coverage do not have a specific number of family members that are required to meet the deductible amount and instead have another type of limit, such as a per-person amount with a total dollar amount limit. these responses are included in the averages and distributions for separate family deductibles and out-of-pocket maximums.
2 there is insufficient data to report the average number of family members required to meet the separate deductible amount for Pos plans.
n o T e :

Em
ployee Cost Sharing
7sectio
n seven
Employer Health Benefits 2 0 1 0 An n u a l s u r vey
100
t h e k a i s e r fa m i ly f o u n d at i o n - a n d - h e a lt h r e s e a r C h & e d u C at i o n a l t r u s t
(for hospitalization only). Due to the change in question format, the distribution of workers with types of cost sharing does not equal 100% as workers may face a combination of types of cost sharing. In addition, the average copayment and coinsurance rate for hospital admissions include workers that may have a combination of types of cost sharing.
�Whether or not a worker has a general annual deductible, most workers face additional types of cost sharing when admitted to a hospital, such as a copayment, coinsurance, or a per diem charge.
The majority of workers have copayments or coinsurance when they are admitted to a hospital, whether or not the worker has a general annual deductible (Exhibit 7.17). Fifty-three percent of covered workers have coinsurance and 19% have copayments for hospital admissions. Lower percentages of workers have per day (per diem) payments (5%), a separate hospital deductible (5%), or both copayments and coinsurance (10%), while 19% have no cost sharing for hospital admissions. For hospital admissions, the average coinsurance rate is 18%, the average copayment is $232 per hospital admission, the average per diem charge is $228, and the average separate hospital deductible is $723 (Exhibit 7.19).
The cost-sharing provisions for outpatient surgery are similar to those for hospital admissions, as most workers have coinsurance or copayments. Fifty-eight percent of covered workers have coinsurance and 20% have copayments for an outpatient surgery episode. In addition, 2% have a separate annual deductible for outpatient surgery, and 4% have both copayments and coinsurance, while 20% have no cost sharing for an outpatient surgery (Exhibit 7.18). For covered workers with cost sharing for each outpatient surgery episode, the average coinsurance is 17%, the average copayment is $132, and the average separate annual outpatient surgery deductible is $963 (Exhibit 7.19).
C o s T s h A r i N g f o r p h y s i C i A N o f f i C e v i s i T s
�The majority of covered workers are enrolled in health plans that require cost sharing for an in-network physician office visit, in addition to any general annual deductible.3
The most common form of physician office visit cost sharing for in-network services is copayments. Seventy-five percent of covered workers have a copayment for a primary care physician office visit and 16% have coinsurance. For office visits with a specialty physician, 73% of covered workers have copayments and 17% have coinsurance. Workers in HMOs, PPOs, and POS plans are much more likely to have copayments than workers in HDHP/SOs for both primary care and specialty care physician office visits. For example, the majority of workers in HDHP/SOs have coinsurance (51%) or no cost sharing (30%) for primary care physician office visits after the deductible is met (Exhibit 7.20).
Among covered workers with a copayment for in-network physician office visits, the average copayment is $22 for primary care and $31 for specialty physicians (Exhibit 7.22), up significantly from $20 and $28 reported in 2009. Forty-nine percent of covered workers have a copayment of $15 or $20 for a primary care office visit (Exhibit 7.23). For specialty care office visits, 28% of covered workers have copayments of $20 or $25 (Exhibit 7.24).4
Among workers with coinsurance for in-network physician office visits, the average coinsurance rate for a visit with a primary care or specialty care physician is 18% (Exhibit 7.22).
e m e r g e N C y r o o m v i s i T C o s T s h A r i N g
�The majority of covered workers have cost sharing when they visit an emergency room.
�Ninety-two percent of covered workers have cost sharing for emergency room visits (Exhibit 7.21). Sixty-one percent of workers pay a copayment
3 in 2010, the survey asked about the prevalence and cost of physician office visits separately for primary care and specialty care. Prior to the 2010 survey if the respondent indicated the plan had a copayment for office visits, we assumed the plan had a copayment for both primary and specialty care visits. the survey did not allow for a respondent to report that a plan had a copayment for primary care visits and coinsurance for visits with a specialist physician. the changes made in 2010 allow for variations in the type of cost sharing for primary care and specialty care. this year the survey includes cost sharing for in-network services only. see the 2007 survey for information on out-of-network office visit cost sharing.
4 the average copayments and the average coinsurance for primary and specialty care include workers who may have a more than one type of cost sharing.
n o T e :

Em
ployee Cost Sharing
7
section
sevenEmployer Health Benefits 2 0 1 0 An n u a l s u r vey
101
t h e k a i s e r fa m i ly f o u n d at i o n - a n d - h e a lt h r e s e a r C h & e d u C at i o n a l t r u s t
while 17% pay a coinsurance (Exhibit 7.20). The average copayment is $107 while the average coinsurance is 17% (Exhibit 7.22).5
Covered workers may find their emergency room cost sharing is waived if they are admitted to the hospital. Among workers with cost sharing for emergency room visits, 72% have the cost sharing waived if they are admitted to the hospital (Exhibit 7.21).
o u T - o f - p o C k e T m A x i m u m A m o u N T s
�Most covered workers are in a plan that partially or totally limits the cost sharing that a plan enrollee must pay in a year. These limits are generally referred to as out-of-pocket maximum amounts. Enrollee cost sharing such as deductibles, office visit cost sharing, or spending on prescription drugs may or may not apply to the out-of-pocket maximum. Therefore, the survey asks what types of out-of-pocket expenses plans count when determining whether a covered worker has met the plan out-of-pocket maximum. When a plan does not count certain types of spending, it effectively increases the amount a worker may pay out-of-pocket.
�Eighteen percent of covered workers enrolled in single coverage and 17% of covered workers enrolled in family coverage are in a plan that does not limit the amount of cost sharing enrollees have to pay (Exhibit 7.27).
Covered workers with single coverage in HMOs (37%) and POS plans (32%) are more likely to be enrolled in a plan that does not limit the amount of cost sharing than workers in PPOs (13%) (Exhibit 7.27). The percentage of workers without an out-of-pocket maximum in POS plans increased from 19% of covered workers in 2009 to 32% of covered workers in 2010.
Covered workers without an out-of-pocket maximum, however, may not have large cost-sharing responsibilities. For example, 78% of covered workers in HMOs with no out-of-pocket maximum for single coverage have no general annual deductible, and only 5% have coinsurance for a hospital admission and 4% have coinsurance for each outpatient surgery episode.
HSA-qualified HDHPs are required by law to have an out-of-pocket maximum of no more than $5,950 for single coverage and $11,900 for family coverage in 2010. HDHP/HRAs have no such requirement, and among workers enrolled in these plans, 8% have no out-of-pocket maximum for single or family coverage.
�For covered workers with out-of-pocket maximums, there is wide variation in spending limits.
Thirty-five percent of workers with an out-of-pocket maximum for single coverage have an out-of-pocket maximum of less than $2,000, while 31% have an out-of-pocket maximum of $3,000 or more (Exhibit 7.29).
Like deductibles, some plans have an aggregate out-of-pocket maximum amount for family coverage that applies to cost sharing for all family members, while others have a per-person out-of-pocket maximum that limits the amount of cost sharing that the family must pay on behalf of each family member. For covered workers with an aggregate out-of-pocket maximum for family coverage, 33% have an out-of-pocket maximum of less than $4,000 (Exhibit 7.31). Among workers with separate per-person out-of-pocket limits for family coverage, 83% have out-of-pocket maximums of less than $4,000 (Exhibit 7.32).
�As noted above, covered workers with an out-of-pocket maximum may be enrolled in a plan where not all spending counts toward the out-of-pocket maximum, potentially exposing workers to higher out-of-pocket spending.
Among workers enrolled in PPO plans with an out-of-pocket maximum for single or family coverage, 32% are in plans that do not count spending for the general annual deductible toward the out-of-pocket limit (Exhibit 7.28).
It is more common for covered workers to be in plans that do not count prescription drug cost sharing toward the out-of-pocket limit. Eighty percent of workers in PPOs and 75% in HMOs are in plans that do not count prescription drug spending towards the out-of-pocket maximum (Exhibit 7.28).
5 the average copayments and the average coinsurance for emergency room visits include workers who may have more than one type of cost sharing.
n o T e :

Em
ployee Cost Sharing
7sectio
n seven
Employer Health Benefits 2 0 1 0 An n u a l s u r vey
102
t h e k a i s e r fa m i ly f o u n d at i o n - a n d - h e a lt h r e s e a r C h & e d u C at i o n a l t r u s t
single Coverage family Coverage
hmo200–999 Workers 68% 68%1,000–4,999 Workers 80 805,000 or more Workers 77 77All small firms (3–199 Workers) 66% 65%All large firms (200 or more Workers) 75% 75%
All firm sizes 72% 72%
ppo200–999 Workers 26% 26%1,000–4,999 Workers 24 245,000 or more Workers 23 23All small firms (3–199 Workers) 20% 20%All large firms (200 or more Workers) 24% 24%
All firm sizes 23% 23%
pos200–999 Workers 34% 34%1,000–4,999 Workers 70* 70*5,000 or more Workers 15* 15*All small firms (3–199 Workers) 36% 32%All large firms (200 or more Workers) 30% 30%
All firm sizes 34% 31%
e x h i B i t 7 .1
Percentage of Covered Workers with no General annual health Plan deduc tible for s ingle and family Coverage, by Plan type and firm size, 2010
* estimate is statistically different within plan type from estimate for all other firms not in the indicated size category (p<.05).
note: hdhP/sos are not shown because all covered workers in these plans face a minimum deductible. in hdhP/hra plans, as defined by the survey, the minimum deductible is $1,000 for single coverage and $2,000 for family coverage. in hsa-qualified hdhPs, the legal minimum deductible for 2010 is $1,200 for single coverage and $2,400 for family coverage. average general annual health plan deductibles for PPos, Pos plans, and hdhP/sos are for in-network services.
kaiser/hret survey of employer-sponsored health Benefits, 2010.
s o u r c e :

Em
ployee Cost Sharing
7
section
sevenEmployer Health Benefits 2 0 1 0 An n u a l s u r vey
103
t h e k a i s e r fa m i ly f o u n d at i o n - a n d - h e a lt h r e s e a r C h & e d u C at i o n a l t r u s t
single Coverage family Coverage
separate Cost sharing for a hospital Admissionhmo 78% 78%PPo 75 75Pos 74 71
separate Cost sharing for an outpatient surgery episodehmo 74% 74%PPo 72 72Pos 72 70
e x h i B i t 7 .2
among Covered Workers with no General annual health Plan deduc tible for s ingle and family Coverage, Percentage Who have the fol lowing types of Cost shar ing, by Plan type, 2010 ‡
‡ separate cost sharing for each hospital admission includes the following types: separate annual deductible, copayment, coinsurance, and/or a charge per day (per diem). Cost sharing for each outpatient surgery episode includes the following types: separate annual deductible, copayment, and/or coinsurance.
note: hdhP/sos are not shown because all covered workers in these plans face a deductible. in hdhP/hra plans, as defined by the survey, the minimum deductible is $1,000 for single coverage and $2,000 for family coverage. in hsa-qualified hdhPs, the legal minimum deductible for 2010 is $1,200 for single coverage and $2,400 for family coverage. average general annual health plan deductibles for PPos and Pos plans are for in-network services.
kaiser/hret survey of employer-sponsored health Benefits, 2010.
s o u r c e :
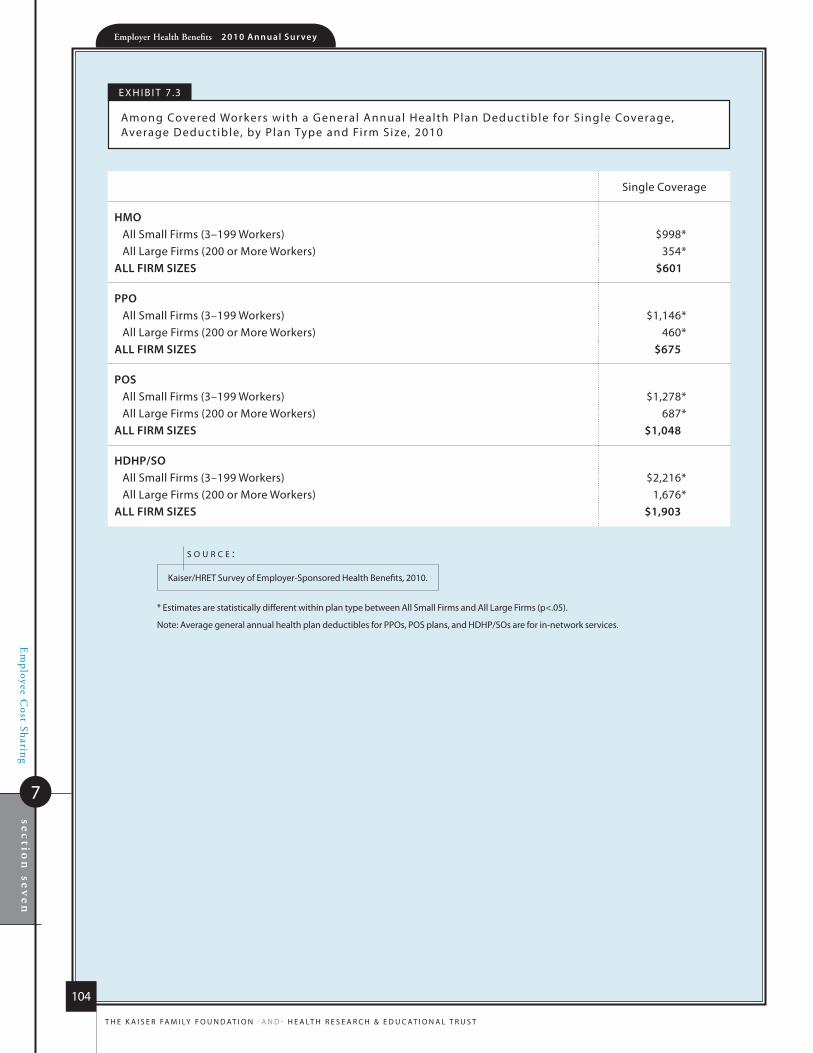
Em
ployee Cost Sharing
7sectio
n seven
Employer Health Benefits 2 0 1 0 An n u a l s u r vey
104
t h e k a i s e r fa m i ly f o u n d at i o n - a n d - h e a lt h r e s e a r C h & e d u C at i o n a l t r u s t
single Coverage
hmoall small firms (3–199 Workers) $998*all large firms (200 or more Workers) 354*
All firm sizes $601
ppoall small firms (3–199 Workers) $1,146*all large firms (200 or more Workers) 460*
All firm sizes $675
posall small firms (3–199 Workers) $1,278*all large firms (200 or more Workers) 687*
All firm sizes $1,048
hDhp/soall small firms (3–199 Workers) $2,216*all large firms (200 or more Workers) 1,676*
All firm sizes $1,903
e x h i B i t 7 .3
among Covered Workers with a General annual health Plan deduc tible for s ingle Coverage, average deduc tible, by Plan type and firm size, 2010
* estimates are statistically different within plan type between all small firms and all large firms (p<.05).
note: average general annual health plan deductibles for PPos, Pos plans, and hdhP/sos are for in-network services.
kaiser/hret survey of employer-sponsored health Benefits, 2010.
s o u r c e :

Em
ployee Cost Sharing
7
section
sevenEmployer Health Benefits 2 0 1 0 An n u a l s u r vey
105
t h e k a i s e r fa m i ly f o u n d at i o n - a n d - h e a lt h r e s e a r C h & e d u C at i o n a l t r u s t
single Coverage
hmonortheast $693midwest 516south 696West nsd
All regioNs $601
pponortheast $561midwest 660south 673West 814
All regioNs $675
pos northeast nsdmidwest $908south 1,065West nsd
All regioNs $1,048
hDhp/sonortheast $1,765midwest 2,000south 1,902West 1,868
All regioNs $1,903
e x h i B i t 7 .4
among Covered Workers with a General annual health Plan deduc tible for s ingle Coverage, average deduc tible, by Plan type and region, 2010*
* tests found no statistical differences by region (p<.05).
nsd: not sufficient data.
note: average general annual health plan deductibles for PPos, Pos plans, and hdhP/sos are for in-network services.
kaiser/hret survey of employer-sponsored health Benefits, 2010.
s o u r c e :

Em
ployee Cost Sharing
7sectio
n seven
Employer Health Benefits 2 0 1 0 An n u a l s u r vey
106
t h e k a i s e r fa m i ly f o u n d at i o n - a n d - h e a lt h r e s e a r C h & e d u C at i o n a l t r u s t
0%
10%
20%
30%
40%
50%
60%
70%
80%
90%
100%
PERCENTAGE OF COVERED WORKERS WITH A SINGLE DEDUCTIBLE OF $1,000 OR MORE*
PERCENTAGE OF COVERED WORKERS WITH A SINGLE DEDUCTIBLE OF $2,000 OR MORE*
46%
17%
27%20%
10%4%
ALL SMALL FIRMS(3–199 WORKERS)
ALL LARGE FIRMS(200 OR MORE WORKERS)
ALL FIRMS
e x h i B i t 7 .6
Percentage of Covered Workers enrol led in a Plan with a high General annual deduc tible for s ingle Coverage, By firm size, 2010
* estimate is statistically different between all small firms and all large firms within category (p<.05).
note: these estimates include workers enrolled in hdhP/so and other plan types. Because we do not collect information on the attributes of conventional plans, to be conservative, we assumed that workers in conventional plans do not have a deductible of $1,000 or more. Because of the low enrollment in conventional plans, the impact of this assumption is minimal. average general annual health plan deductibles for PPos, Pos plans, and hdhP/sos are for in-network services.
kaiser/hret survey of employer-sponsored health Benefits, 2010.
s o u r c e :
2006 2007 2008 2009 2010
hmo $352 $401 $503 $699* $601PPo 473 461 560* 634 675Pos 553 621 752 1,061 1,048hdhP/so 1,715 1,729 1,812 1,838 1,903
e x h i B i t 7 .5
among Covered Workers with a General annual health Plan deduc tible for s ingle Coverage, average deduc tible, by Plan type, 2006–2010
* estimate is statistically different from estimate for the previous year shown by plan type (p<.05).
note: average general annual health plan deductibles for PPos, Pos plans, and hdhP/sos are for in-network services.
kaiser/hret survey of employer-sponsored health Benefits, 2006–2010.
s o u r c e :

Em
ployee Cost Sharing
7
section
sevenEmployer Health Benefits 2 0 1 0 An n u a l s u r vey
107
t h e k a i s e r fa m i ly f o u n d at i o n - a n d - h e a lt h r e s e a r C h & e d u C at i o n a l t r u s t
0%
10%
20%
30%
40%
50%
ALL SMALL FIRMS (3–199 WORKERS)
ALL LARGE FIRMS (200 OR MORE WORKERS)
ALL FIRMS
2006 2007 2008 2009 2010
16%
10%
21%*
12%*
35%*
40%
22%*
18%*
46%
27%*
6%8%
13%*
9%
17%
e x h i B i t 7 .7
Percentage of Covered Workers enrol led in a Plan with a General annual deduc tible of $1,000 or more for s ingle Coverage, By firm size, 2006–2010
* estimate is statistically different from estimate for the previous year shown (p<.05).
note: these estimates include workers enrolled in hdhP/so and other plan types. Because we do not collect information on the attributes of conventional plans, to be conservative, we assumed that workers in conventional plans do not have a deductible of $1,000 or more. Because of the low enrollment in conventional plans, the impact of this assumption is minimal. average general annual health plan deductibles for PPos, Pos plans, and hdhP/sos are for in-network services.
kaiser/hret survey of employer-sponsored health Benefits, 2006–2010.
s o u r c e :

Em
ployee Cost Sharing
7sectio
n seven
Employer Health Benefits 2 0 1 0 An n u a l s u r vey
108
t h e k a i s e r fa m i ly f o u n d at i o n - a n d - h e a lt h r e s e a r C h & e d u C at i o n a l t r u s t
0% 10% 20% 30% 40% 50% 60% 70% 80% 90% 100%
2008*
2009*
2007*
2006
26%50%
38% 44%
33% 32%
19%
16%
25%
5%
1%
10%
29% 24% 29% 18%
2010* 16% 35% 31% 17%
$1–$499
$500–$999
$1,000–$1,999
$2,000 OR MORE
0% 10% 20% 30% 40% 50% 60% 70% 80% 90% 100%
2008*
2009
2007*
2006
24%64%
62% 26%
52% 30%
10%
8%
13%
2%
4%
4%
48% 32% 14% 6%
2010 49% 29% 16% 6%
$1–$499
$500–$999
$1,000–$1,999
$2,000 OR MORE
e x h i B i t 7 .8
among Covered Workers with a General annual health Plan deduc tible for s ingle PPo Coverage, distr ibution of deduc tibles, 2006–2010
e x h i B i t 7 .9
among Covered workers with a General annual health Plan deduc tible for s ingle Pos Coverage, distr ibution of deduc tibles, 2006–2010
* distribution is statistically different from distribution for the previous year shown (p<.05).
note: deductibles for PPo plans are for in-network services.
kaiser/hret survey of employer-sponsored health Benefits, 2006–2010.
s o u r c e :
* distribution is statistically different from distribution for the previous year shown (p<.05).
note: deductibles for Pos plans are for in-network services.
kaiser/hret survey of employer-sponsored health Benefits, 2006–2010.
s o u r c e :

Em
ployee Cost Sharing
7
section
sevenEmployer Health Benefits 2 0 1 0 An n u a l s u r vey
109
t h e k a i s e r fa m i ly f o u n d at i o n - a n d - h e a lt h r e s e a r C h & e d u C at i o n a l t r u s t
no deductible aggregate amountseparate amount
per Person
hmoall small firms (3–199 Workers) 65% 28% 7%all large firms (200 or more Workers) 75 18 7
All firm sizes 72% 21% 7%
ppoall small firms (3–199 Workers) 20% 56% 24%all large firms (200 or more Workers) 24 47 29
All firm sizes 23% 50% 27%
posall small firms (3–199 Workers) 32% 50% 18%all large firms (200 or more Workers) 30 62 8
All firm sizes 31% 54% 14%
hDhp/soall small firms (3–199 Workers) na 85% 15%all large firms (200 or more Workers) na 91 9
All firm sizes NA 89% 11%
e x h i B i t 7 .10
distr ibution of type of General annual deduc tible for Covered Workers with family Coverage, by Plan type and firm size, 2010*
* tests found no statistical difference between distributions for all small firms and all large firms within plan type (p<.05).
na: not applicable. all covered workers in hdhP/sos face a general annual deductible. in hdhP/hra plans, as defined by the survey, the minimum deductible is $1,000 for single coverage and $2,000 for family coverage. in hsa-qualified hdhPs, the legal minimum deductible for 2010 is $1,200 for single coverage and $2,400 for family coverage.
note: the survey distinguished between plans that have an aggregate deductible amount in which all family members’ out-of-pocket expenses count toward the deductible and plans that have a separate amount for each family member, typically with a limit on the number of family members required to reach that amount. among workers with a general annual deductible, 76% of workers in hmos have an aggregate deductible, 65% in PPos have an aggregate deductible, and 79% in Pos plans have an aggregate deductible. average general annual health plan deductibles for PPos, Pos plans, and hdhP/sos are for in-network services.
kaiser/hret survey of employer-sponsored health Benefits, 2010.
s o u r c e :

Em
ployee Cost Sharing
7sectio
n seven
Employer Health Benefits 2 0 1 0 An n u a l s u r vey
110
t h e k a i s e r fa m i ly f o u n d at i o n - a n d - h e a lt h r e s e a r C h & e d u C at i o n a l t r u s t
aggregate amount separate amount per Person
hmoall small firms (3–199 Workers) $2,138* nsdall large firms (200 or more Workers) 774* $344
All firm sizes $1,321 $500
ppoall small firms (3–199 Workers) $2,347* $1,065*all large firms (200 or more Workers) 1,103* 430*
All firm sizes $1,518 $596
posall small firms (3–199 Workers) $2,596 nsdall large firms (200 or more Workers) 1,806 nsd
All firm sizes $2,253 $1,164
hDhp/soall small firms (3–199 Workers) $4,306* nsdall large firms (200 or more Workers) 3,429* $1,815
All firm sizes $3,780 $2,053
e x h i B i t 7 .11
among Covered Workers with a General annual health Plan deduc tible, average deduc tibles for family Coverage, by deduc tible type, Plan type, and firm size, 2010
* estimates are statistically different within plan and deductible type between all small firms and all large firms (p<.05).
nsd: not sufficient data.
note: average general annual health plan deductibles for PPos, Pos plans, and hdhP/sos are for in-network services. the survey distinguished between plans that have an aggregate deductible amount in which all family members’ out-of-pocket expenses count toward the deductible and plans that have a separate amount for each family member, typically with a limit on the number of family members required to reach that amount.
kaiser/hret survey of employer-sponsored health Benefits, 2010.
s o u r c e :

Em
ployee Cost Sharing
7
section
sevenEmployer Health Benefits 2 0 1 0 An n u a l s u r vey
111
t h e k a i s e r fa m i ly f o u n d at i o n - a n d - h e a lt h r e s e a r C h & e d u C at i o n a l t r u s t
e x h i B i t 7 .12
among Covered Workers with a General annual health Plan deduc tible for family Coverage, average aggregate deduc tible, by Plan type, 2006–2010
* estimate is statistically different from estimate for the previous year shown by plan type (p<.05).
note: average general annual health plan deductibles for PPos, Pos plans, and hdhP/sos are for in-network services.
kaiser/hret survey of employer-sponsored health Benefits, 2006–2010.
s o u r c e :
2006 2007 2008 2009 2010
hmo $751 $759 $1,053 $1,524* $1,321PPo $1,034 $1,040 $1,344* $1,488 $1,518Pos $1,227 $1,359 $1,860 $2,191 $2,253hdhP/so $3,511 $3,596 $3,559 $3,626 $3,780
$1–$499 $500–$999 $1,000–$1,999 $2,000 or more
hmoaggregate amount 28% 9% 36% 27%separate amount 50% 33% 16% 1%
ppoaggregate amount 7% 33% 35% 24%separate amount 58% 24% 12% 6%
posaggregate amount 7% 9% 21% 63%separate amount 18% 22% 37% 23%
hDhp/so‡ aggregate amount 0% 0% 0% 100%separate amount 0% 0% 48% 52%
e x h i B i t 7 .13
among Covered Workers with a General annual health Plan deduc tible for family Coverage, distr ibution of deduc tibles, by Plan type and deduc tible type, 2010
‡ By definition, 100% of covered workers in hdhP/sos with an aggregate deductible have a family deductible of $2,000 or more.
note: average general annual health plan deductibles for PPos, Pos plans, and hdhP/sos are for in-network services. the survey distinguished between plans that have an aggregate deductible amount in which all family members’ out-of-pocket expenses count toward the deductible and plans that have a separate amount for each family member, typically with a limit on the number of family members required to reach that amount.
kaiser/hret survey of employer-sponsored health Benefits, 2010.
s o u r c e :

Em
ployee Cost Sharing
7sectio
n seven
Employer Health Benefits 2 0 1 0 An n u a l s u r vey
112
t h e k a i s e r fa m i ly f o u n d at i o n - a n d - h e a lt h r e s e a r C h & e d u C at i o n a l t r u s t
0% 10% 20% 30% 40% 50% 60% 70% 80% 90% 100%
HDHP/SO
POS
HMO
PPO
TWO
THREE
FOUR OR MORE (WITH SPECIFIED LIMIT)
NO LIMIT
OTHER
44%38%
35% 17%8%40%
39% 16%
11% 6%
<1%
38% 7%
51%
<1%
2% 1%
22% 23%
e x h i B i t 7 .14
among Covered Workers with a separate per Person General annual health Plan deduc tible for family Coverage, distr ibution of maximum number of family members required to meet the deduc tible, by Plan type, 2010
note: average general annual health plan deductibles for PPos, Pos plans, and hdhP/sos are for in-network services. the survey distinguished between plans that have an aggregate deductible amount in which all family members’ out-of-pocket expenses count toward the deductible and plans that have a separate amount for each family member, typically with a limit on the number of family members required to reach that amount. the “other” category refers to workers that have another type of limit on per-person deductibles, such as a per-person amount with a total dollar cap.
kaiser/hret survey of employer-sponsored health Benefits, 2010.
s o u r c e :

Em
ployee Cost Sharing
7
section
sevenEmployer Health Benefits 2 0 1 0 An n u a l s u r vey
113
t h e k a i s e r fa m i ly f o u n d at i o n - a n d - h e a lt h r e s e a r C h & e d u C at i o n a l t r u s t
$1–$499 $500–$999 $1,000–$1,999 $2,000 or more
hmo2006 27% 42% 23% 7%2007 22 48 23 82008* 31 26 20 232009* 7 22 33 382010* 28 9 36 27
ppo2006 20% 42% 27% 12%2007* 14 49 25 122008* 11 38 32 192009* 12 30 35 232010 7 33 35 24
pos2006 12% 26% 45% 18%2007* 32 13 29 252008 23 14 24 392009* 3 18 30 492010 7 9 21 63
e x h i B i t 7 .15
among Covered Workers with an aggregate General annual health Plan deduc tible for family Coverage, distr ibution of aggregate deduc tibles, by Plan type, 2006–2010
* distribution is statistically different from distribution for the previous year shown (p<.05).
note: By definition, 100% of covered workers in hdhP/sos with an aggregate deductible have a family deductible of $2,000 or more. average general annual health plan deductibles for PPos and Pos plans are for in-network services. the survey distinguished between plans that have an aggregate deductible amount in which all family members’ out-of-pocket expenses count toward the deductible and plans that have a separate amount for each family member, typically with a limit on the number of family members required to reach that amount.
kaiser/hret survey of employer-sponsored health Benefits, 2006–2010.
s o u r c e :

Em
ployee Cost Sharing
7sectio
n seven
Employer Health Benefits 2 0 1 0 An n u a l s u r vey
114
t h e k a i s e r fa m i ly f o u n d at i o n - a n d - h e a lt h r e s e a r C h & e d u C at i o n a l t r u s t
hmo PPo Pos hdhP/so
Physician office Visits for Primary Care 83% 70% 81% 37%§
Preventive Care 96% 91% 87% 93%Prescription drugs 94% 92% 92% 56%§
separate Cost sharing for a hospital Admission hmo PPo Pos hdhP/so§ All plANs
separate annual deductible for hospitalizations 5% 6% 2%* <1%* 5%Copayment and/or Coinsurance
Copayment 44* 16 25 2* 19Coinsurance 17* 63* 37* 59 53Both Copayment and Coinsurance‡ 10 10 16 <1* 10
Charge Per day 11* 3* 14 1* 5none 22 15* 20 38* 19
e x h i B i t 7 .16
among Covered Workers with a General annual health Plan deduc tible, Percentage with Coverage for the fol lowing ser vices Without having to first meet the deduc tible, by Plan type, 2010
e x h i B i t 7 .17
distr ibution of Covered Workers with separate Cost shar ing for a hospital admission in addit ion to any General annual deduc tible, by Plan type, 2010
§ Percentage is for covered workers in hdhP/hras only. Both hdhP/hras and hsa-qualified hdhPs were asked about preventive benefits, but only hdhP/hras were asked about physician office visits for primary care and prescription drugs. hsa-qualified hdhPs are required by law to apply the plan deductible to nearly all services.
note: these questions are asked of firms with a deductible for single or family coverage. average general annual health plan deductibles for PPos, Pos plans, and hdhP/sos are for in-network services.
kaiser/hret survey of employer-sponsored health Benefits, 2010.
s o u r c e :
* estimate is statistically different from all Plans estimate (p<.05).‡ this includes enrollees who are required to pay the higher amount of either the copayment or coinsurance under the plan.§ information on separate deductibles for hospital admissions was collected only for hdhP/hras because federal regulations
for hsa-qualified hdhPs make it unlikely these plans would have a separate deductible for specific services.
note: as in past years, we collected information on the cost-sharing provisions for hospital admissions that are in addition to any general annual plan deductible. however, beginning with the 2009 survey, in order to better capture the prevalence of combinations of cost sharing, the survey was changed to ask a series of yes or no questions. Previously, the question asked respondents to select one response from a list of types of cost sharing, such as separate deductibles, copayments, coinsurance, and per diem payments (for hospitalization only). due to the change in question format, the distribution of workers with types of cost sharing does not equal 100% as workers may face a combination of types of cost sharing. less than 1% of covered workers have an “other” type of cost sharing for a hospital admission.
kaiser/hret survey of employer-sponsored health Benefits, 2010.
s o u r c e :

Em
ployee Cost Sharing
7
section
sevenEmployer Health Benefits 2 0 1 0 An n u a l s u r vey
115
t h e k a i s e r fa m i ly f o u n d at i o n - a n d - h e a lt h r e s e a r C h & e d u C at i o n a l t r u s t
separate Cost sharing for an outpatient surgery hmo PPo Pos hdhP/so§ All plANs
separate annual deductible for outpatient surgery 4% 1% <1%* 1% 2%Copayment and/or Coinsurance
Copayment 48* 13* 28 4* 20Coinsurance 22* 70* 49 59 58Both Copayment and Coinsurance‡ 3 5 4 0* 4
none 27 16 21 37* 20
e x h i B i t 7 .18
distr ibution of Covered Workers with separate Cost shar ing for an outpatient surger y in addit ion to any General annual deduc tible, by Plan type, 2010
* estimate is statistically different from all Plans estimate (p<.05).‡ this includes enrollees who are required to pay the higher amount of either the copayment or coinsurance under the plan.§ information on separate deductibles for outpatient surgery was collected only for hdhP/hras because federal regulations for
hsa-qualified hdhPs make it unlikely these plans would have a separate deductible for specific services.
note: as in past years, we collected information on the cost-sharing provisions for outpatient surgery that are in addition to any general annual plan deductible. however, beginning with the 2009 survey, in order to better capture the prevalence of combinations of cost sharing, the survey was changed to ask a series of yes or no questions. Previously, the question asked respondents to select one response from a list of types of cost sharing, such as separate deductibles, copayments, coinsurance, and per diem payments (for hospitalization only). due to the change in question format, the distribution of workers with types of cost sharing does not equal 100% as workers may face a combination of types of cost sharing. less than 1% of covered workers have an “other” type of cost sharing for an outpatient surgery.
kaiser/hret survey of employer-sponsored health Benefits, 2010.
s o u r c e :

Em
ployee Cost Sharing
7sectio
n seven
Employer Health Benefits 2 0 1 0 An n u a l s u r vey
116
t h e k a i s e r fa m i ly f o u n d at i o n - a n d - h e a lt h r e s e a r C h & e d u C at i o n a l t r u s t
average Copayment
average Coinsurance
Charge Per day
separate Cost sharing for a hospital Admissionhmo $267 17% $245PPo 213 17 157*Pos 206 19 303hdhP/so nsd 19 nsd
All plANs $232 18% $228
separate Cost sharing for an outpatient surgeryhmo $134 16% naPPo 127 17 naPos 146 18 nahdhP/so nsd 19 na
All plANs $132 17% NA
e x h i B i t 7 .19
among Covered Workers with separate Cost shar ing for a hospital admission or outpatient surger y in addit ion to any General annual deduc tible, average Cost shar ing, by Plan type, 2010
* estimate is statistically different from all Plans estimate (p<.05).
nsd: not sufficient data.
na: not applicable. the survey did not offer “Charge Per day” (per diem) as a response option for questions about separate cost sharing for each outpatient surgery episode.
note: the average separate annual deductible for hospital admission is $723 and the average separate deductible for outpatient surgery is $963. in most cases there were too few observations to present the average estimates by plan type. the average amounts include workers who may have a combination of types of cost sharing. all Plans estimates are weighted by workers in firms that reported cost sharing. see the survey design and methods section for more information on weighting.
kaiser/hret survey of employer-sponsored health Benefits, 2010.
s o u r c e :

Em
ployee Cost Sharing
7
section
sevenEmployer Health Benefits 2 0 1 0 An n u a l s u r vey
117
t h e k a i s e r fa m i ly f o u n d at i o n - a n d - h e a lt h r e s e a r C h & e d u C at i o n a l t r u s t
Copay onlyCoinsurance
onlyBoth Copay
and Coinsurance‡ no Cost sharingnone of the
above
primary Carehmo* 94% 1% 4% 1% <1%PPo* 80 16 3 1 <1Pos* 90 4 3 2 0hdhP/so* 15 51 3 30 2
All plANs 75% 16% 3% 5% <1%
specialty Carehmo* 93% 1% 4% 2% <1%PPo* 77 17 3 3 1Pos* 90 5 4 2 <1hdhP/so* 13 50 3 32 2
All plANs 73% 17% 3% 6% 1%
emergency room visitshmo* 85% 5% 6% 4% 0%PPo* 62 18 13 5 1Pos* 69 10 19 2 <1hdhP/so* 15 37 15 31 1
All plANs 61% 17% 13% 8% 1%
e x h i B i t 7 .20
in addition to any General annual Plan deductible, Percentage of Covered Workers with the following types of Cost sharing for Physician office Visits and emergency room Visits, by Plan type, 2010
* distribution is statistically different from all Plans distribution (p<.05).‡ this includes enrollees who are required to pay the higher amount of either the copayment or coinsurance under the plan.
note: in 2010, the survey includes questions on cost sharing for in-network services only. see the 2007 survey for information on out-of-network office visit cost sharing. in 2010, the survey asked about the prevalence and cost of physician office visits separately for primary care and specialty care. Prior to the 2010 survey if the respondent indicated the plan had a copayment for office visits, we assumed the plan had a copayment for both primary and specialty care visits. the survey did not allow for a respondent to report that a plan had a copayment for primary care visits and coinsurance for visits with a specialist physician. the changes made in 2010 allow for variations in the type of cost sharing for primary care and specialty care.
kaiser/hret survey of employer-sponsored health Benefits, 2010.
s o u r c e :

Em
ployee Cost Sharing
7sectio
n seven
Employer Health Benefits 2 0 1 0 An n u a l s u r vey
118
t h e k a i s e r fa m i ly f o u n d at i o n - a n d - h e a lt h r e s e a r C h & e d u C at i o n a l t r u s t
Percentage of Covered Workers with emergency room Cost sharing
among Workers with emergency room Cost sharing, Percentage of Covered Workers with Cost sharing Waived if
individual is admitted to the hospital
hmo 96%* 85%*PPo 95* 71Pos 98* 82*hdhP/so 69* 48*
All plANs 92% 72%
hmo PPo PoshdhP/
soAll
plANs
primary Careaverage Copay for Primary Care Physician office Visit $21* $22 $24* $25 $22average Coinsurance for Primary Care Physician office Visit nsd 18% nsd 18% 18%
specialty Careaverage Copay for specialist Physician office Visit $29 $31 $36 $34 $31average Coinsurance for specialist Physician Physician office Visit nsd 18% nsd 18% 18%
emergency room visitsaverage Copay for emergency room Visits $95* $109 $110 $124* $107average Coinsurance for emergency room Visits 15% 17% 19%* 17% 17%
e x h i B i t 7 .21
in addit ion to any Plan deduc tible, Percentage of Covered Workers with emergenc y room Cost shar ing, by Plan type, 2010
e x h i B i t 7 .22
among Covered Workers with Copayments and/or Coinsurance for in-network Physic ian o ff ice and emergenc y room Vis i ts , average Copayments and Coinsurance, by Plan type, 2010
* estimate is statistically different from all Plans estimate (p<.05).
kaiser/hret survey of employer-sponsored health Benefits, 2010.
s o u r c e :
* estimate is statistically different from all Plans estimate (p<.05).
nsd: not sufficient data.
note: the survey asks respondents if the plan has cost sharing for in-network office visits. in 2010, the survey asked about the prevalence and cost of physician office visits separately for primary care and specialty care. Prior to the 2010 survey if the respondent indicated the plan had a copayment for office visits, we assumed the plan had a copayment for both primary and specialty care visits. the survey did not allow for a respondent to report that a plan had a copayment for primary care visits and coinsurance for visits with a specialist physician. the changes made in 2010 allow for variations in the type of cost sharing for primary care and specialty care.
kaiser/hret survey of employer-sponsored health Benefits, 2010.
s o u r c e :

Em
ployee Cost Sharing
7
section
sevenEmployer Health Benefits 2 0 1 0 An n u a l s u r vey
119
t h e k a i s e r fa m i ly f o u n d at i o n - a n d - h e a lt h r e s e a r C h & e d u C at i o n a l t r u s t
$5 Per Visit $10 Per Visit $15 Per Visit $20 Per Visit $25 Per Visit $30 Per Visit other
hmo2004 3% 28% 40% 22% 3% 3% 1%2005* 5 23 34 27 6 4 12006 3 21 37 25 8 5 22007* 3 20 25 34 13 4 12008* 6 16 29 30 11 5 32009 5 11 29 31 13 8 32010* 1 8 22 38 15 12 4
ppo2004 1% 17% 35% 28% 11% 4% 3%2005* <1 16 25 34 15 5 42006 <1 12 25 35 17 7 32007* 2 11 24 35 19 7 22008 1 11 22 34 21 8 32009* <1 11 18 34 23 11 22010* 1 7 16 31 25 13 6
pos2004 3% 17% 34% 36% 8% <1% 1%2005* 2 16 35 30 11 6 12006* 2 22 26 27 16 6 <12007* 2 10 36 25 15 6 52008* 2 14 19 27 21 12 72009* 1 8 14 39 21 12 42010* 1 7 11 24 20 29 8
hDhp/so‡
2007 7% <1% 12% 38% 13% 19% 12%2008 0 2 17 33 9 18 212009 <1 4 24 29 11 29 42010 0 2 17 34 10 17 20
All plANs2004 1% 19% 37% 27% 9% 3% 3%2005* 2 17 29 32 12 5 32006 2 15 28 32 15 6 32007 2 14 25 34 17 7 22008 2 13 23 33 18 8 42009* 2 10 21 34 20 11 22010* 1 7 18 32 22 15 6
e x h i B i t 7 .23
among Covered Workers with Copayments for a Physician office Visit with a Primar y Care Physician, distr ibution of Copayments, by Plan type, 2004–2010
* distribution is statistically different from distribution for the previous year shown (p<.05).‡ there are insufficient data to report the results from the 2006 survey. information was not obtained for hdhP/sos prior to 2006.
note: Copayments for PPo, Pos, and hdhP/so plans are for in-network providers. the survey has asked specifically about copayments for primary care physicians since 2005. in 2004, the survey question did not specify primary or specialist physician.
kaiser/hret survey of employer-sponsored health Benefits, 2004–2010.
s o u r c e :

Em
ployee Cost Sharing
7sectio
n seven
Employer Health Benefits 2 0 1 0 An n u a l s u r vey
120
t h e k a i s e r fa m i ly f o u n d at i o n - a n d - h e a lt h r e s e a r C h & e d u C at i o n a l t r u s t
$5 Per Visit
$10 Per Visit
$15 Per Visit
$20 Per Visit
$25 Per Visit
$30 Per Visit
$35 Per Visit
$40 Per Visit
other
hmo2006 3% 14% 20% 20% 17% 13% 5% 5% 4%2007* 2 11 12 26 22 14 5 7 22008* 2 13 14 18 20 16 5 5 72009* 3 6 17 15 17 18 7 9 82010* 1 4 9 18 12 18 9 19 10
ppo2006 <1% 9% 15% 25% 20% 15% 6% 5% 5%2007 1 8 13 24 18 16 8 7 42008* <1 7 14 21 17 15 9 9 82009* <1 8 10 20 14 15 11 11 112010* 1 4 8 14 15 16 12 17 14
pos2006 2% 13% 13% 17% 18% 17% 8% 5% 8%2007* 7 6 10 21 19 16 6 6 92008* 1 7 8 14 13 21 11 9 172009 1 4 5 17 11 25 6 14 172010* 1 5 4 10 15 17 6 10 31
hDhp/so‡
2007 0% 7% 5% 23% 7% 18% 5% 21% 15%2008 0 2 11 18 4 27 3 9 282009 <1 4 11 18 8 23 15 11 92010 0 2 5 16 12 12 5 22 26
All plANs2006 2% 10% 15% 22% 19% 16% 6% 5% 5%2007 2 8 12 24 20 16 6 7 52008* 1 9 13 18 17 16 8 8 102009* 1 7 11 18 14 17 10 11 112010* 1 4 8 14 14 17 10 18 15
e x h i B i t 7 .24
among Covered Workers with Copayments for a Physician office Visit with a specialty Care Physician, distr ibution of Copayments, by Plan type, 2006–2010
* distribution is statistically different from distribution for the previous year shown (p<.05).‡ there are insufficient data to report the results from the 2006 survey.
note: Copayments for PPo, Pos, and hdhP/so plans are for in-network providers. information on copayments for specialty physician office visits was not obtained prior to 2006. the survey asks respondents if the plan has cost sharing for in-network office visits. Prior to the 2010 survey if the respondent indicated the plan had a copayment for office visits, we assumed the plan had a copayment for both primary and specialty care visits. the survey did not allow for a respondent to report that a plan had a copayment for primary care visits and coinsurance for visits with a specialist physician. the changes made in 2010 allow for variations in the type of cost sharing for primary care and specialty care.
kaiser/hret survey of employer-sponsored health Benefits, 2006–2010.
s o u r c e :

Em
ployee Cost Sharing
7
section
sevenEmployer Health Benefits 2 0 1 0 An n u a l s u r vey
121
t h e k a i s e r fa m i ly f o u n d at i o n - a n d - h e a lt h r e s e a r C h & e d u C at i o n a l t r u s t
$5 Per Visit $10 Per Visit $15 Per Visit $20 Per Visit other
1999 23% 60% 12% 1% 3%2000* 22 54 16 3 62001* 15 56 22 3 42002* 7 52 27 11 32003* 4 35 37 12 122004* 3 28 40 22 72005* 5 23 34 27 112006 3 21 37 25 152007* 3 20 25 34 182008* 6 16 29 30 192009 5 11 29 31 242010* 1 8 22 38 31
Coinsurance rates 10% or 15% 20% or 25% 30% or 35% 40% or 45% other
primary CarePPo 31% 67% 2% <1% 1%hdhP/so 40 53 7 0 1
All plANs 33% 64% 3% <1% <1%
specialty CarePPo 27% 70% 2% 1% 1%hdhP/so* 39 50 6 0 4
All plANs 30% 65% 3% <1% 2%
e x h i B i t 7 .25
among Covered Workers in hmos with Copayments for a Physic ian o ff ice Vis i t , distr ibution of Percentage of Workers with Var ious Copayments, 1999–2010
e x h i B i t 7 .26
among Covered Workers with Coinsurance for Physic ian o ff ice Vis i ts , distr ibution of average Coinsurance r ates, by Plan type, 2010
* distribution is statistically different from distribution for the previous year shown (p<.05).
note: the survey has asked specifically about copayments for primary care physicians since 2005. Prior to 2005, the survey question did not specify primary or specialist physician.
kaiser/hret survey of employer-sponsored health Benefits, 1999–2010.
s o u r c e :
* distribution is statistically different from all Plans distribution (p<.05).
note: Coinsurance rates for hmo and Pos plans are not shown because there is not sufficient data as only 1% or 4% of covered workers, respectively, face coinsurance for primary care office visits and 1% or 5% of covered workers, respectively, face coinsurance for specialty care office visits.
kaiser/hret survey of employer-sponsored health Benefits, 2010.
s o u r c e :

Em
ployee Cost Sharing
7sectio
n seven
Employer Health Benefits 2 0 1 0 An n u a l s u r vey
122
t h e k a i s e r fa m i ly f o u n d at i o n - a n d - h e a lt h r e s e a r C h & e d u C at i o n a l t r u s t
single Coverage family Coverage
hmo 37%* 38%*PPo 13* 13*Pos 32* 30*hdhP/so na na
All plANs 18% 17%
e x h i B i t 7 .27
Percentage of Covered Workers Without an annual out- of-Pocket maximum for s ingle and family Coverage, by Plan type, 2010
* estimate is statistically different from all Plans estimate (p<.05).
na: not applicable. hsa-qualified hdhPs are required to have an annual maximum out-of-pocket liability of no more than $5,950 for single coverage and $11,900 for family coverage in 2010. hdhP/hras have no such requirement, and the percentage of covered workers in hdhP/hras with “no limit” for annual out-of-pocket maximum for single and family coverage is 8% and 8%, respectively.
kaiser/hret survey of employer-sponsored health Benefits, 2010.
s o u r c e :
hmo PPo Pos hdhP/so‡
General annual Plan deductible 19% 32% 20% 9%any additional Plan deductibles nsd 57% nsd nsdPhysician office Visit Copayments 54% 74% 50% 53%Physician office Visit Coinsurance nsd 4% nsd 1%Prescription drug Cost sharing 75% 80% 73% 42%
e x h i B i t 7 .28
among Covered Workers with an annual out- of-Pocket maximum, Percentage Whose spending for Var ious ser vices does not Count towards the out- of-Pocket maximum, 2010
‡ among hdhP/so plans, questions other than “overall plan deductible” were asked only of hdhP/hras and not of hsa-qualified hdhPs. hsa-qualified hdhPs are required to apply most cost sharing to the out-of-pocket maximum. When hdhP/hras are considered exclusively, among covered workers with an annual out-of-pocket maximum, the percentage whose out-of-pocket maximum does not include certain services is as follows: any additional plan deductibles is nsd, office visit copayments is 52%, office visit coinsurance is 1%, and prescription drug cost sharing is 42%.
nsd: not sufficient data.
note: this series of questions is asked if the plan has an out-of-pocket maximum for single or family coverage.
kaiser/hret survey of employer-sponsored health Benefits, 2010.
s o u r c e :

Em
ployee Cost Sharing
7
section
sevenEmployer Health Benefits 2 0 1 0 An n u a l s u r vey
123
t h e k a i s e r fa m i ly f o u n d at i o n - a n d - h e a lt h r e s e a r C h & e d u C at i o n a l t r u s t
0% 20% 40% 60% 80% 100%
POS*
PPO*
HMO*
$999 OR LESS
$1,000–$1,499
$1,500–$1,999
$2,000–$2,499
$2,500–$2,999
$3,000 OR MORE(WITH A SPECIFIED LIMIT)
19% 22%5% 16%
5% 10%
14%3% 6%
12%
32%
15% 27%
27%
8% 21%24%
35%
HDHP/SO* 7%
2%
14% 17% 59%
ALL PLANS 4% 13% 18% 21% 13% 31%
e x h i B i t 7 .29
among Covered Workers with an out- of-Pocket maximum for s ingle Coverage, distr ibution of out- of-Pocket maximums, by Plan type, 2010
* distribution is statistically different from all Plans distribution (p<.05).
note: distributions are among covered workers facing a specified limit for out-of-pocket maximum amounts. hsa-qualified hdhPs are required by law to have an out-of-pocket maximum of no more than $5,950 for single coverage and $11,900 for family coverage in 2010.
kaiser/hret survey of employer-sponsored health Benefits, 2010.
s o u r c e :

Em
ployee Cost Sharing
7sectio
n seven
Employer Health Benefits 2 0 1 0 An n u a l s u r vey
124
t h e k a i s e r fa m i ly f o u n d at i o n - a n d - h e a lt h r e s e a r C h & e d u C at i o n a l t r u s t
no limit aggregate amountseparate amount
per Person
hmoall small firms (3–199 Workers) 40% 47% 13%all large firms (200 or more Workers) 37 49 14
All firm sizes 38% 48% 14%
ppoall small firms (3–199 Workers) 19% 58% 23%all large firms (200 or more Workers) 11 65 24
All firm sizes 13% 63% 24%
posall small firms (3–199 Workers) 37% 56% 7%all large firms (200 or more Workers) 19 71 9
All firm sizes 30% 62% 8%
hDhp/so‡ all small firms (3–199 Workers) 8% 81% 10%all large firms (200 or more Workers) 1 93 5
All firm sizes 4% 88% 7%
All firmsall small firms (3–199 Workers)* 24% 59% 17%all large firms (200 or more Workers)* 14 66 20
All firm sizes 17% 63% 19%
e x h i B i t 7 .30
distr ibution of type of out- of-Pocket maximum for Covered Workers with family Coverage, by Plan type and firm size, 2010
* distributions are statistically different beween all small firms and all large firms within plan type (p<.05).‡ hsa-qualified hdhPs are required by law to have an annual maximum out-of-pocket liability of no more than $5,950 for single
coverage and $11,900 for family coverage in 2010. When they are excluded from the calculation, the distribution of type of out-of-pocket maximum for hdhP/hras only is as follows: all small firms – 20% no limit, 69% aggregate amount, and 12% separate amount per Person; all large firms – 2% no limit, 92% aggregate amount, and 5% separate amount per Person; all firm sizes – 8% no limit, 84% aggregate amount, and 8% separate amount per Person.
note: the survey distinguished between plans that have a family aggregate out-of-pocket maximum that applies to spending by any covered person in the family or a separate per person out-of-pocket maximum that applies to spending by each family member or a limited number of family members. among workers with an out-of-pocket maximum, 78% of workers in hmos have an aggregate out-of-pocket maximum, 72% in PPos have an aggregate out-of-pocket maximum, 89% in Pos plans have an aggregate out-of-pocket maximum, and 77% in all Plans have an aggregate out-of-pocket maximum.
kaiser/hret survey of employer-sponsored health Benefits, 2010.
s o u r c e :

Em
ployee Cost Sharing
7
section
sevenEmployer Health Benefits 2 0 1 0 An n u a l s u r vey
125
t h e k a i s e r fa m i ly f o u n d at i o n - a n d - h e a lt h r e s e a r C h & e d u C at i o n a l t r u s t
0% 20% 40% 60% 80% 100%
POS*
PPO*
HMO*
$1,999 OR LESS
$2,000–$2,999
$3,000–$3,999
$4,000–$4,999
$5,000–$5,999
$6,000 OR MORE(WITH A SPECIFIED LIMIT)
20% 20%5% 12%
6% 8%
12%3% 7%
12%
32%
5%
30%
8% 35%12%
14% 60%
HDHP/SO* 3% 6% 18%14% 58%
ALL PLANS 4% 10% 19% 17% 13% 37%
<1%
e x h i B i t 7 .31
among Covered Workers with an aggregate out- of-Pocket maximum for family Coverage, distr ibution of out- of-Pocket maximums, by Plan type, 2010
* distribution is statistically different from all Plans distribution (p<.05).
note: distributions are among covered workers facing a specified limit for out-of-pocket maximum amounts. hsa-qualified hdhPs are required by law to have an out-of-pocket maximum of no more than $5,950 for single coverage and $11,900 for family coverage in 2010. the survey distinguished between plans that have a family aggregate out-of-pocket maximum that applies to spending by any covered person in the family or a separate per person out-of-pocket maximum that applies to spending by each family member or a limited number of family members.
kaiser/hret survey of employer-sponsored health Benefits, 2010.
s o u r c e :

Em
ployee Cost Sharing
7sectio
n seven
Employer Health Benefits 2 0 1 0 An n u a l s u r vey
126
t h e k a i s e r fa m i ly f o u n d at i o n - a n d - h e a lt h r e s e a r C h & e d u C at i o n a l t r u s t
0% 20% 40% 60% 80% 100%
PPO
HMO
<1%11%44% 27%
43%
57% 23%
17%
17% 13%
1%
26%
1%19%HDHP/SO
44% 11%1%
17%28%ALL PLANS
TWO
THREE
FOUR OR MORE (WITH A SPECIFIED LIMIT)
NO LIMIT
OTHER
0% 20% 40% 60% 80% 100%
PPO
HMO*
$1,999 OR LESS
$2,000–$2,999
$3,000–$3,999
$4,000–$4,999
$5,000–$5,999
$6,000 OR MORE(WITH A SPECIFIED LIMIT)
12% 4%6%42% 31%
45%
11% 6% 39%
4%
18% 9%
<1%
28%
33% 10% 1%HDHP/SO*
40% 9%15% 6%28% 2%ALL PLANS
e x h i B i t 7 .32
among Covered Workers with a separate per Person out- of-Pocket maximum for family Coverage, distr ibution of out- of-Pocket maximums, by Plan type, 2010
* distribution is statistically different from all Plans distribution (p<.05).
note: distributions are among covered workers facing a specified limit for out-of-pocket maximum amounts. the survey distinguished between plans that have a family aggregate out-of-pocket maximum that applies to spending by any covered person in the family or a separate per person out-of-pocket maximum that applies to spending by each family member or a limited number of family members. distribution for out-of-pocket maximum for Pos plans is not show due to an insufficient number of observations.
kaiser/hret survey of employer-sponsored health Benefits, 2010.
s o u r c e :
e x h i B i t 7 .33
among Covered Workers with a separate per Person out- of-Pocket maximum for family Coverage, distr ibution of maximum number of family members required to meet the maximum, by Plan type, 2010*
* tests found no statistical difference between plan type distributions and the all Plans distribution (p<.05).
note: the survey distinguished between plans that have a family aggregate out-of-pocket maximum that applies to spending by any covered person in the family or a separate out-of-pocket maximum that applies to spending by each family member or a limited number of family members. distribution for out-of-pocket maximum for Pos plans is not show due to an insufficient number of observations. the “other” category refers to workers that have another type of limit on per-person out-of-pocket maximums, such as a per-person amount with a total dollar cap.
kaiser/hret survey of employer-sponsored health Benefits, 2010.
s o u r c e :

69%$13,7
70
$5,0
49
2010
Employer Health Benefits2 0 1 0 a n n u a l s u r V e y
s ect ion
High-Deductible Health Plans with Savings
Option
8

High-D
eductible Health Plans w
ith Savings Option
8
section
eight
Employer Health Benefits 2 0 1 0 An n u a l s u r vey
128
t h e k a i s e r fa m i ly f o u n d at i o n - a n d - h e a lt h r e s e a r C h & e d u C at i o n a l t r u s t
h i g h - D e D u C t i B l e h e a l t h p l a n S W i t h S a v i n g S o p t i o n
changes in law over The pasT few years have permiTTed The esTablishmenT of new Types of savings
arrangemenTs for healTh care. The Two mosT common are healTh reimbursemenT arrangemenTs (hras)
and healTh savings accounTs (hsas). hras and hsas are boTh financial accounTs ThaT workers or Their
family members can use To pay for healTh care services. These savings arrangemenTs are ofTen (or, in The
case of hsas, always) paired wiTh healTh plans wiTh high deducTibles. The survey TreaTs high-deducTible
plans ThaT can be paired wiTh a savings opTion as a disTincT plan Type—high-deducTible healTh plan wiTh
savings opTion (hdhp/so)—even if The plan would oTherwise be considered a ppo, hmo, pos plan, or
convenTional healTh plan. specifically for The survey, hdhp/sos are defined as (1) healTh plans wiTh a
deducTible of aT leasT $1,000 for single coverage and $2,000 for family coverage1 offered wiTh an hra
(referred To as hdhp/hras); or (2) high-deducTible healTh plans ThaT meeT The federal legal requiremenTs
To permiT an enrollee To esTablish and conTribuTe To an hsa (referred To as hsa-qualified hdhps).2
1 there is no legal requirement for the minimum deductible in a plan offered with an hra. the survey defines a high-deductible plan as a plan with a deductible of at least $1,000 for single coverage and $2,000 for family coverage. federal law requires a deductible of at least $1,200 for single coverage and $2,400 for family coverage for hsa-qualified hdhPs in 2010. see the text Box for more information on hdhP/hras and hsa-qualified hdhPs.
2 the definitions of hdhP/sos do not include other consumer-driven plan options, such as arrangements that combine an hra with a lower-deductible health plan or arrangements in which an insurer (rather than the employer as in the case of hras or the enrollee as in the case of hsas) establishes an account for each enrollee. other arrangements may be included in future surveys as the market evolves.
n o T e :
p e r C e N TA g e o f f i r m s o f f e r i N g
h D h p / h r A s A N D h s A - Q u A l i f i e D h D h p s ,
A N D e N r o l l m e N T
�Fifteen percent of firms offering health benefits offer an HDHP/HRA, an HSA-qualified HDHP, or both in 2010, similar to last year. Among firms offering health benefits, 4% offer an HDHP/HRA and 12% offer an HSA-qualified HDHP (Exhibit 8.1), also not statistically different from the percentages reported last year.
Firms with 1,000 or more workers are more likely to offer an HDHP/SO than smaller firms. Thirty-four percent of firms with 1,000 or more workers offer an HDHP/SO compared to 15% of firms with 3 to 199 workers or 21% of firms with 200-999 workers (Exhibit 8.2).
The percentage of firms with 1,000 or more workers offering an HDHP/SO increased in 2010 to 34% from 28% in 2009 (Exhibit 8.3).
�Enrollment in HDHP/SOs increased from 8% to 13% of covered workers in 2010 (Exhibit 8.4).
Seven percent of covered workers are enrolled in HDHP/HRAs and 6% are enrolled in HSA-qualified HDHPs. HDHP/HRA enrollment increased from 3% in 2009 to 7% in 2010. Enrollment in HSA-qualified HDHPs remained at 6% in 2010, the same percentage as 2009 (Exhibit 8.4).
Nine percent of covered workers in small firms (3–199 workers) are enrolled in HSA-qualified HDHPs, compared to 5% of workers in large firms (200 or more workers) (Exhibit 8.5).
p l A N D e D u C T i b l e s
�As expected, workers enrolled in HDHP/SOs have higher deductibles than workers enrolled in HMOs, PPOs, or POS plans.
The average general annual deductible for single coverage is $1,737 for HDHP/HRAs and $2,096 for HSA-qualified HDHPs (Exhibit 8.6). These averages are similar to the amounts reported in 2009. There is wide variation in the average general annual deductible amounts for single coverage (Exhibit 8.8).

High-D
eductible Health Plans w
ith Savings Option
8
section
eight
Employer Health Benefits 2 0 1 0 An n u a l s u r vey
129
t h e k a i s e r fa m i ly f o u n d at i o n - a n d - h e a lt h r e s e a r C h & e d u C at i o n a l t r u s t
Most workers in HDHP/HRAs (94%) and HSA-qualified HDHPs (92%) do not have to meet the general annual deductible before preventive care is covered (Exhibit 8.11).
�Since 2006, the survey has collected information on two types of family deductibles. The survey asks employers whether the family deductible amount is (1) an aggregate amount (i.e., the out-of-pocket expenses of all family members are counted until the deductible is satisfied), or (2) a per-person amount that applies to each family member (typically with a limit on the number of family members that would be required to meet the deductible amount).
The average aggregate deductibles for workers with family coverage are $3,577 for HDHP/HRAs and $4,006 for HSA-qualified HDHPs
(Exhibit 8.6). There is wide variation in the average aggregate general annual deductible amounts for family coverage (Exhibit 8.10).
Workers in HSA-qualified HDHPs in small firms face significantly higher deductibles for single coverage ($2,284) and family coverage ($4,258) than workers with HSA-qualified HDHPs in large firms, where deductibles average $1,895 for single coverage and $3,734 for an aggregate deductible for family coverage.
o u T - o f - p o C k e T m A x i m u m A m o u N T s
�HSA-qualified HDHPs are legally required to have a maximum annual out-of-pocket liability of no more than $5,950 for single coverage and $11,900 for family coverage in 2010. HDHP/HRAs have no similar requirement.
Health Reimbursement Arrangements (HRAs) are medical care reimbursement plans established by employers that can be used by employees to pay for health care. HRAs are funded solely by employers. Employers typically commit to make a specified amount of money available in the HRA for premiums and medical expenses incurred by employees or their dependents. HRAs are accounting devices, and employers are not required to expend funds until an employee incurs expenses that would be covered by the HRA. Unspent funds in the HRA usually can be carried over to the next year (sometimes with a limit). Employees cannot take their HRA balances with them if they leave their job, although an employer can choose to make the remaining balance available to former employees to pay for health care.
HRAs often are offered along with a high-deductible health plan (HDHP). In such cases, the employee pays for health care first from his or her HRA and then out-of-pocket until the health plan deductible is met. Sometimes certain preventive services or other services such as prescription drugs are paid for by the plan before the employee meets the deductible.
Health Savings Accounts (HSAs) are savings accounts created by individuals to pay for health
care. An individual may establish an HSA if he or she is covered by a “qualified health plan” which is a plan with a high deductible (i.e., a deductible of at least $1,200 for single coverage and $2,400 for family coverage in 2010) that also meets other requirements.1 Employers can encourage their employees to create HSAs by offering an HDHP that meets the federal requirements. Employers in some cases also may assist their employees by identifying HSA options, facilitating applications, or negotiating favorable fees from HSA vendors.
Both employers and employees can contribute to an HSA, up to the statutory cap of $3,050 for single coverage and $6,150 for family coverage in 2010. Employee contributions to the HSA are made on a pre-income tax basis, and some employers arrange for their employees to fund their HSAs through payroll deductions. Employers are not required to contribute to HSAs established by their employees but, if they elect to do so, their contributions are not taxable to the employee. Interest and other earnings on amounts in an HSA are not taxable. Withdrawals from the HSA by the account owner to pay for qualified health care expenses are not taxed. The savings account is owned by the individual who creates the account, so employees retain their HSA balances if they leave their job.
1 see u.s. department of the treasury, health savings accounts, available at http://www.treasury.gov/offices/public-affairs/hsa/pdf/2010-hsa-%20indexed-amts.pdf.

High-D
eductible Health Plans w
ith Savings Option
8
section
eight
Employer Health Benefits 2 0 1 0 An n u a l s u r vey
130
t h e k a i s e r fa m i ly f o u n d at i o n - a n d - h e a lt h r e s e a r C h & e d u C at i o n a l t r u s t
The average annual out-of-pocket maximum for single coverage is $3,622 for HDHP/HRAs3 and $3,186 for HSA-qualified HDHPs (Exhibit 8.6).
As with deductibles, the survey asks employers whether the family out-of-pocket maximum liability is (1) an aggregate amount that applies to spending by any covered person in the family, or (2) a separate per person amount that applies to spending by each family member or a limited number of family members. The survey also asks whether spending by enrollees on various services counts towards meeting the plan out-of-pocket maximum.
Among covered workers with family coverage whose out-of-pocket maximum is an aggregate amount that applies to spending by any covered person in the family, the average annual amounts are $7,096 for HDHP/HRAs and $6,066 for HSA-qualified HDHPs (Exhibit 8.6).
p r e m i u m s
�In 2010, the average annual premiums for HDHP/HRAs are $4,702 for single coverage and $13,068 for family coverage. The HDHP/HRA average premium for covered workers with single coverage is lower than the average premiums for single coverage for workers in plans that are not HDHP/SOs (Exhibit 8.7).
�The average annual premium for workers in HSA-qualified HDHPs is $4,233 for single coverage and $11,683 for family coverage. These amounts are lower than the average single and family premium for workers in plans that are not HDHP/SOs (Exhibit 8.7). Premiums increased significantly between 2009 and 2010 for HSA-qualified HDHPs from $3,829 to $4,233 for single coverage and from $10,396 to $11,683 for family coverage.
W o r k e r C o N T r i b u T i o N s T o p r e m i u m s
�The average annual worker contributions to premiums for workers enrolled in HDHP/HRAs are $799 for single coverage and $3,604 for family coverage (Exhibit 8.6).
�The average annual worker contributions to premiums for workers in HSA-qualified plans are $444 for single coverage and $3,457 for family coverage (Exhibit 8.6). The average contribution for single coverage for workers in HSA-qualified HDHPs is significantly less than the average premium contribution made by covered workers in plans that are not HDHP/SOs (Exhibit 8.7).
e m p l o y e r C o N T r i b u T i o N s T o p r e m i u m s
A N D s A v i N g s o p T i o N s
�Employers contribute to HDHP/SOs in two ways: through their contributions toward the premium for the health plan and through their contributions (if any, in the case of HSAs) to the savings account option (i.e., the HRAs or HSAs themselves).
Looking just at the annual employer contributions to premiums, covered workers in HDHP/HRAs on average receive employer contributions of $3,903 for single coverage and $9,464 for family coverage. (Exhibit 8.7).
The average annual employer contributions to premiums for workers in HSA-qualified HDHPs are $3,789 for single coverage and $8,225 for family coverage. These amounts are lower than the average contributions for single or family coverage for workers in plans that are not HDHP/SOs (Exhibit 8.7).
3 the average out-of-pocket maximum for hdhP/hras is calculated for plans with an out-of-pocket maximum. about 10% of covered workers in hdhP/hras with single coverage or family coverage are in plans that reported having no limit on out-of-pocket expenses.
n o T e :

High-D
eductible Health Plans w
ith Savings Option
8
section
eight
Employer Health Benefits 2 0 1 0 An n u a l s u r vey
131
t h e k a i s e r fa m i ly f o u n d at i o n - a n d - h e a lt h r e s e a r C h & e d u C at i o n a l t r u s t
�When looking at employer contributions to the savings option workers enrolled in HDHP/HRAs receive, on average, an annual employer contribution to their HRA of $907 for single coverage and $1,619 for family coverage (Exhibit 8.7). These values are not statistically different from the 2009 values of $1,052 for single coverage and $2,073 for family coverage.
In looking at employer contributions to HRAs, we note that some HRAs are structured in such a way that employers may not actually spend the whole amount that they make available to their employees’ HRAs.4 Amounts committed to an employee’s HRA that are not used by the employee generally roll over and can be used in future years, but any balance may revert back to the employer if the employee leaves his or her job. Thus, the employer contribution amounts to HRAs that we capture in the survey may exceed the amount that employers will actually spend.
�Workers enrolled in HSA-qualified HDHPs on average receive an annual employer contribution to their HSA of $558 for single coverage and $1,006 for family coverage (Exhibit 8.7). These values are not statistically different from the 2009 values of $688 for single coverage and $1,126 for family coverage.
In looking at employer contributions to HSAs, we note that not all employers make contributions towards HSAs established by their employees. Sixty percent of employers offering single and 61% offering family coverage through HSA-qualified HDHPs do not make contributions towards the HSAs that their workers establish. In terms of covered workers, 35% do not receive an account contribution from their employer for single or family coverage.
The average HSA contributions reported above include the portion of covered workers whose employer contribution to the HSA is zero. When those firms that do not contribute to the HSA are excluded from the calculation, the average employer contribution for covered workers is $858 for single coverage and $1,546 for family coverage, which are not statistically different from last year.
�Employer contributions to savings account options (i.e., the HRAs and HSAs themselves) for their employees can be added to their health plan premium contributions to calculate total employer contributions toward HDHP/SOs.
For HDHP/HRAs, the average annual total employer contribution for covered workers is $4,810 for single coverage and $11,083 for family coverage. The average total employer contribution amounts for single and family coverage in HDHP/HRAs is higher than the average amount that employers contribute towards single and family coverage in health plans that are not HDHP/SOs (Exhibit 8.7).
For HSA-qualified HDHPs, the average annual total employer contribution for covered workers is $4,347 for single coverage and $9,231 for workers with family coverage. The total amounts contributed for workers in HSA-qualified HDHPs for single and family coverage are similar to that contributed for workers not in HDHP/SOs (Exhibit 8.7).
4 in the survey, we ask, “up to what dollar amount does your firm promise to contribute each year to an employee’s hra or health reimbursement arrangement for single coverage?” We refer to the amount that the employer commits to make available to an hra as a contribution for ease of discussion. as discussed, hras are notional accounts, and employers are not required to actually transfer funds until an employee incurs expenses. thus, employers may not expend the entire amount that they commit to make available to their employees through an hra.
n o T e :

High-D
eductible Health Plans w
ith Savings Option
8
section
eight
Employer Health Benefits 2 0 1 0 An n u a l s u r vey
132
t h e k a i s e r fa m i ly f o u n d at i o n - a n d - h e a lt h r e s e a r C h & e d u C at i o n a l t r u s t
0%
10%
20%
30%
40%
50%
3–199 WORKERS* 200–999 WORKERS 1,000 OR MORE WORKERS*
15%21%
34%
HDHP/HRA HSA-QUALIFIED HDHP EITHER HDHP/HRA OR HSA-QUALIFIED HDHP‡
2005
2006
2007
2008
2009
2010
0%
10%
20%
30%
40%
50%
2% 1% 3% 2% 4%3% 2%6%* 7%
10% 12%11%
4%7%
10%15%
12%13%
e x h i B i t 8 .1
among firms offering health Benefits, Percentage that offer an hdhP/hra and/or an hsa-Qualif ied hdhP, 2005–2010
e x h i B i t 8 .2
among firms o ffer ing health Benef its, Percentage that o ffer an hdhP/so, by firm size, 2010
* estimate is statistically different from estimate for the previous year shown (p<.05).‡ the 2010 estimate includes 0.3% of all firms offering health benefits that offer both an hdhP/hra and an hsa-qualified hdhP.
the comparable percentages for 2005, 2006, 2007, 2008 and 2009 are 0.3%, 0.4%, 0.2%, 0.3% and 0.1%, respectively.
kaiser/hret survey of employer-sponsored health Benefits, 2005-2010.
s o u r c e :
* estimate is statistically different from estimate for all other firms not in the indicated size category (p<.05).
note: the 2010 estimates include 0.3% of all firms offering health benefits that offer both an hdhP/hra and an hsa-qualified hdhP.
kaiser/hret survey of employer-sponsored health Benefits, 2010.
s o u r c e :

High-D
eductible Health Plans w
ith Savings Option
8
section
eight
Employer Health Benefits 2 0 1 0 An n u a l s u r vey
133
t h e k a i s e r fa m i ly f o u n d at i o n - a n d - h e a lt h r e s e a r C h & e d u C at i o n a l t r u s t
3–199 WORKERS 200–999 WORKERS 1,000 OR MORE WORKERS0%
10%
20%
30%
40%
50%
4%7%
10% 11%15%13%
4% 5%
13%*18%
21%
15%10%
17%* 18%
28%*
34%*
22%
2005
2006
2007
2008
2009
2010
e x h i B i t 8 .3
among firms o ffer ing health Benefits, Percentage that o ffer an hdhP/so, by firm size, 2005–2010
* estimate is statistically different from estimate for previous year shown (p<.05).
note: the 2010 estimate includes 0.3% of all firms offering health benefits that offer both an hdhP/hra and an hsa-qualified hdhP. the comparable percentages for 2005, 2006, 2007, 2008 and 2009 are 0.3%, 0.4%, 0.2%, 0.3% and 0.1%, respectively.
kaiser/hret survey of employer-sponsored health Benefits, 2005–2010.
s o u r c e :
HDHP/HRA HSA-QUALIFIED HDHP HDHP/SO
0%
10%
20%
30%
40%
50%
2% 3% 3%7%*
3% 2% 3%6% 6%4%* 4% 5%
8%13%*
8%*
2006
2007
2008
2009
2010
e x h i B i t 8 .4
Percentage of Covered Workers enrol led in an hdhP/hra or hsa-Quali f ied hdhP, 2006–2010
* estimate is statistically different from estimate for the previous year shown (p<.05).
kaiser/hret survey of employer-sponsored health Benefits, 2006–2010.
s o u r c e :

High-D
eductible Health Plans w
ith Savings Option
8
section
eight
Employer Health Benefits 2 0 1 0 An n u a l s u r vey
134
t h e k a i s e r fa m i ly f o u n d at i o n - a n d - h e a lt h r e s e a r C h & e d u C at i o n a l t r u s t
HDHP/HRA HSA-QUALIFIED HDHP* HDHP/SO
ALL SMALL FIRMS (3–199 WORKERS)
ALL LARGE FIRMS (200 OR MORE WORKERS)
ALL FIRMS
0%
10%
20%
30%
40%
50%
7% 7% 7% 9%5% 6%
16%12% 13%
e x h i B i t 8 .5
Percentage of Covered Workers enrol led in an hdhP/hra or hsa-Quali f ied hdhP, by firm size, 2010
* estimates are statistically different between all small firms and all large firms within category (p<.05).
kaiser/hret survey of employer-sponsored health Benefits, 2010.
s o u r c e :
e x h i B i t 8 .6
hdhP/hra and hsa- Qual i f ied hdhP features for Covered Workers, 2010
hDhp/hrA hsA-Qualified hDhp
Annual plan Averages for: single family single family
Premium $4,702 $13,068 $4,233 $11,683Worker Contribution to Premium $799 $3,604 $444 $3,457General annual deductible‡ $1,737 $3,577 $2,096 $4,006
out-of-Pocket maximum liability‡ $3,622 $7,096 $3,186 $6,066
firm Contribution to the hra or hsa§ $907 $1,619 $558 $1,006
‡ eight percent of workers enrolled in hdhP/hras have employers that reported no out-of-pocket maximum for single coverage and family coverage. these workers are excluded from the hdhP/hra out-of-pocket maximum liability calculation. the deductible and out-of-pocket maximum averages shown for both hdhP/hras and hsa-qualified hdhPs for family coverage are for covered workers whose firms report that they face an aggregate amount. among covered workers in hdhP/hras, 16% are in plans whose family deductible is a separate per person amount and 8% are in a plan where the family out-of-pocket maximum is a separate per person amount. among covered workers in hsa-qualified hdhPs, the percentages are 7% for deductibles and 7% for out-of-pocket maximums.
§ When those firms that do not contribute to the hsa (60% for single and 61% for family coverage) are excluded from the calculation, the average firm contribution to the hsa for covered workers is $858 for single coverage and $1,546 for family coverage. for hdhP/hras, we refer to the amount that the employer commits to make available to an hra as a contribution for ease of discussion. hras are notional accounts, and employers are not required to actually transfer funds until an employee incurs expenses. thus, employers may not expend the entire amount that they commit to make available to their employees through an hra. therefore, the employer contribution amounts to hras that we capture in the survey may exceed the amount that employers will actually spend.
kaiser/hret survey of employer-sponsored health Benefits, 2010.
s o u r c e :

High-D
eductible Health Plans w
ith Savings Option
8
section
eight
Employer Health Benefits 2 0 1 0 An n u a l s u r vey
135
t h e k a i s e r fa m i ly f o u n d at i o n - a n d - h e a lt h r e s e a r C h & e d u C at i o n a l t r u s t
e x h i B i t 8 .7
average annual Premiums and Contributions to savings accounts for Covered Workers in hdhP/hras or hsa-Qualified hdhPs, Compared to all non-hdhP/so Plans, 2010
hDhp/hrA hsA-Qualified hDhp Non-hDhp/so plans§
single family single family single family
Total Annual premium $4,702* $13,068 $4,233* $11,683* $5,136 $13,979Worker Contribution to Premium $799 $3,604 $444* $3,457 $939 $4,069firm Contribution to Premium $3,903 $9,464 $3,789* $8,225* $4,197 $9,910
Annual firm Contribution to the hrA or hsA‡
$907 $1,619 $558 $1,006 na na
Total Annual firm Contribution (firm share of Premium Plus firm Contribution to hra or hsa)
$4,810* $11,083* $4,347 $9,231 $4,197 $9,910
Total Annual Cost (total Premium Plus firm Contribution to hra or hsa, if applicable)
$5,608* $14,687 $4,791* $12,688* $5,136 $13,979
* estimate is statistically different from estimate for all non-hdhP/so Plans (p<.05).‡ When those firms that do not contribute to the hsa (60% for single and 61% for family coverage) are excluded from the
calculation, the average firm contribution to the hsa for covered workers is $858 for single coverage and $1,546 for family coverage. for hdhP/hras, we refer to the amount that the employer commits to make available to an hra as a contribution for ease of discussion. hras are notional accounts, and employers are not required to actually transfer funds until an employee incurs expenses. thus, employers may not expend the entire amount that they commit to make available to their employees through an hra. therefore, the employer contribution amounts to hras that we capture in the survey may exceed the amount that employers will actually spend.
§ in order to compare costs for hdhP/sos to all other plans that are not hdhP/sos, we created composite variables excluding hdhP/so data.
na: not applicable.
note: Values shown in the table may not equal the sum of their component parts. the averages presented in the table are aggregated at the firm level and then averaged, which is methodologically more appropriate than adding the averages. this is relevant for total annual Premium, total annual firm Contribution, and total annual Cost.
kaiser/hret survey of employer-sponsored health Benefits, 2010.
s o u r c e :

High-D
eductible Health Plans w
ith Savings Option
8
section
eight
Employer Health Benefits 2 0 1 0 An n u a l s u r vey
136
t h e k a i s e r fa m i ly f o u n d at i o n - a n d - h e a lt h r e s e a r C h & e d u C at i o n a l t r u s t
HDHP/SO
HSA-QUALIFIED HDHP
HDHP/HRA
$1,000–$1,499
$1,500–$1,999
$2,000–$2,999
$3,000 OR MORE
0% 10% 20% 30% 40% 50% 60% 70% 80% 90% 100%
25%16%
28% 43%
23% 35%
46%
22%
33%
13%
6%
9%
e x h i B i t 8 .8
distr ibution of Covered Workers with the fol lowing General annual deductible amounts for single Coverage, hsa-Quali f ied hdhPs and hdhP/hras, 2010
note: the minimum annual deductible for workers enrolled in hsa-qualified hdhPs is $1,200 in 2010 according to federal regulation. therefore, the distribution for hsa-qualified hdhPs starts at $1,200.
kaiser/hret survey of employer-sponsored health Benefits, 2010.
s o u r c e :
aggregate amount separate amount per Person
hdhP/hra 84% 16%
hsa-Qualified hdhP 93 7
hDhp/so 89% 11%
e x h i B i t 8 .9
among Covered Workers, distr ibution of type of General annual deduc tible for family Coverage, hdhP/hras and hsa- Qual i f ied hdhPs, 2010
note: the survey distinguished between plans that have an aggregate deductible amount in which all family members’ out-of-pocket expenses count toward the deductible, and plans that have a separate amount for each family member, typically with a limit on the number of family members required to reach that amount.
kaiser/hret survey of employer-sponsored health Benefits, 2010.
s o u r c e :

High-D
eductible Health Plans w
ith Savings Option
8
section
eight
Employer Health Benefits 2 0 1 0 An n u a l s u r vey
137
t h e k a i s e r fa m i ly f o u n d at i o n - a n d - h e a lt h r e s e a r C h & e d u C at i o n a l t r u s t
0% 10% 20% 30% 40% 50% 60% 70% 80% 90% 100%
HDHP/SO
HSA-QUALIFIED HDHP
HDHP/HRA
$2,000–$2,499
$2,500–$2,999
$3,000–$3,999
$4,000–$4,999
$5,000 OR MORE
7%8%
17% 24%
13% 16%
27%
33%
30%
28% 29%
11% 15%
20% 22%
e x h i B i t 8 .10
distr ibution of Covered Workers with the fol lowing aggregate family deductible amounts, hdhP/hras and hsa-Quali f ied hdhPs, 2010
note: the survey distinguished between family deductibles that are an aggregate amount in which all family members’ out-of-pocket expenses count toward the deductible, and plans that have a separate amount for each family member, typically with a limit on the number of family members required to reach that amount. the minimum annual family deductible for workers enrolled in hsa-qualified hdhPs is $2,400 in 2010 according to federal regulation. therefore, the distribution for hsa-qualified hdhPs starts at $2,400.
kaiser/hret survey of employer-sponsored health Benefits, 2010.
s o u r c e :
hdhP/hra hsa-Qualified hdhP hdhP/so
Preventive Care 94% 92% 93%
Physician office Visits for Primary Care 37% na na
Prescription drugs 56% na na
e x h i B i t 8 .11
Percentage of Covered Workers with Coverage for the fol lowing ser vices Without having to first meet the deduc tible, hdhP/hras and hsa- Qual i f ied hdhPs, by Benef it type, 2010
na: not applicable. firms with either hdhP/hras or hsa-qualified hdhPs were asked about preventive benefits, but only firms with hdhP/hras were asked about physician office visits for primary care or prescription drugs. hsa-qualified hdhPs are required by law to apply the plan deductible to nearly all services.
kaiser/hret survey of employer-sponsored health Benefits, 2010.
s o u r c e :

High-D
eductible Health Plans w
ith Savings Option
8
section
eight
Employer Health Benefits 2 0 1 0 An n u a l s u r vey
138
t h e k a i s e r fa m i ly f o u n d at i o n - a n d - h e a lt h r e s e a r C h & e d u C at i o n a l t r u s t
0%
10%
20%
30%
40%
50%
60%
70%
80%
90%
100%
HDHP/HRA HSA-QUALIFIED HDHP HDHP/SO
73%
48%
61%
e x h i B i t 8 .12
Percentage of Covered Workers in Partially or Completely self-funded hdhP/hras and hsa-Qualified hdhPs, 2010
note: for definitions of self-funded and fully insured Plans, see the introduction to section 10.
kaiser/hret survey of employer-sponsored health Benefits, 2010.
s o u r c e :
0% 10% 20% 30% 40% 50% 60% 70% 80% 90% 100%
HSA-QUALIFIED HDHP
HDHP/HRA
$0
$1–$399
$400–$599
$600–$799
$800–$999
$1,000–$1,199
$1,200 OR MORE
7%35%
4% 39%
19%
23%
17% 6% 15%
1%
16% 17%2%
e x h i B i t 8 .13
distr ibution of Covered Workers with the fol lowing annual employer Contr ibutions to their hra or hsa, for s ingle Coverage, 2010
note: for single coverage, 60% of employers offering hsa-qualified hdhPs (covering 35% of workers enrolled in these plans) do not make contributions towards the hsas that their workers establish.
kaiser/hret survey of employer-sponsored health Benefits, 2010.
s o u r c e :

High-D
eductible Health Plans w
ith Savings Option
8
section
eight
Employer Health Benefits 2 0 1 0 An n u a l s u r vey
139
t h e k a i s e r fa m i ly f o u n d at i o n - a n d - h e a lt h r e s e a r C h & e d u C at i o n a l t r u s t
0% 10% 20% 30% 40% 50% 60% 70% 80% 90% 100%
HSA-QUALIFIED HDHP
HDHP/HRA
$0
$1–$999
$1,000–$1,499
$1,500–$1,999
$2,000–$2,499
$2,500–$2,999
$3,000 OR MORE
21%35%
9% 45%
19%
20%
11% 4% 8%
13% 3% 10%1%
e x h i B i t 8 .14
distr ibution of Covered Workers with the fol lowing annual employer Contr ibutions to their hra or hsa, for family Coverage, 2010
note: for family coverage, 61% of employers offering hsa-qualified hdhPs (covering 35% of workers enrolled in these plans) do not make contributions towards the hsas that their workers establish.
kaiser/hret survey of employer-sponsored health Benefits, 2010.
s o u r c e :
single Coverage family Coverage
Contribution range, relative to average Contribution
Contribution range
Percentage of Covered Workers
in range
Contribution range
Percentage of Covered Workers
in range
less than 80% less than $725 51% less than $1,295 50%80% to less than average $725 to <$907 16% $1,295 to <$1,619 23%average to less than 120% $907 to <$1,088 16% $1,619 to <$1,943 1%120% or more $1,088 or more 17% $1,943 or more 26%
e x h i B i t 8 .15
distr ibution of fi rm Contr ibutions to the hra for s ingle and family Coverage relat ive to the average annual fi rm Contr ibution to the hra, 2010
note: the average annual firm contribution to the hra is $907 for single coverage and $1,619 for family coverage. the hra account contribution distribution is relative to the average single or family account contribution. for example, $725 is 80% of the average single hra account contribution and $1,088 is 120% of the average single hra account contribution. the same break points relative to the average are used for the distribution for family coverage.
kaiser/hret survey of employer-sponsored health Benefits, 2010.
s o u r c e :

High-D
eductible Health Plans w
ith Savings Option
8
section
eight
Employer Health Benefits 2 0 1 0 An n u a l s u r vey
140
t h e k a i s e r fa m i ly f o u n d at i o n - a n d - h e a lt h r e s e a r C h & e d u C at i o n a l t r u s t
e x h i B i t 8 .16
distr ibution of fi rm Contr ibutions to the hsa for s ingle and family Coverage relat ive to the average annual fi rm Contr ibution to the hsa, 2010
note: the average annual firm contribution to the hsa is $558 for single coverage and $1,006 for family coverage. the distribution includes workers in firms who do not make any contribution. the hsa account contribution distribution is relative to the average single or family account contribution. for example, $446 is 80% of the average single hsa account contribution and $670 is 120% of the average single hsa account contribution. the same break points relative to the average are used for the distribution for family coverage.
kaiser/hret survey of employer-sponsored health Benefits, 2010.
s o u r c e :
single Coverage family Coverage
Contribution range, relative to average Contribution
Contribution range
Percentage of Covered Workers
in range
Contribution range
Percentage of Covered Workers
in range
less than 80% less than $446 43% less than $804 47%80% to less than average $446 to <$558 17% $804 to <$1,006 10%average to less than 120% $558 to <$670 5% $1,006 to <$1,207 8%120% or more $670 or more 35% $1,207 or more 36%

High-D
eductible Health Plans w
ith Savings Option
8
section
eight
Employer Health Benefits 2 0 1 0 An n u a l s u r vey
141
t h e k a i s e r fa m i ly f o u n d at i o n - a n d - h e a lt h r e s e a r C h & e d u C at i o n a l t r u s t
separate Cost sharing for a hospital Admission hdhP/hrahsa-Qualified
hdhPhdhP/so§
deductible <1% na <1%Copayment and/or Coinsurance Copayment 3 1% 2 Coinsurance 71 44 59 Both Copay and Coinsurance‡ <1 0 <1Charge Per day <1 1 1none 25 54 38
separate Cost sharing for an outpatient surgery episode
deductible 3% na 1%Copayment and/or Coinsurance Copayment 7 1% 4 Coinsurance 70 46 59 Both Copay and Coinsurance‡ 0 0 0none 23 53 37
separate Cost sharing for primary Care physician office visits
Copayment only 22% 7% 15%Coinsurance only 57 42 51Both Copayment and Coinsurance‡ 6 0 3none 15 47 30
separate Cost sharing for specialty Care physician office visits
Copayment only 21% 4% 13%Coinsurance only 57 42 50Both Copayment and Coinsurance‡ 6 0 3none 15 51 32
separate Cost sharing for emergency room visits
Copayment only 26% 4% 15%Coinsurance only 32 42 37Both Copayment and Coinsurance‡ 27 2 15none 15 50 31
e x h i B i t 8 .17
distr ibution of Covered Workers in hdhP/hras and hsa- Qual i f ied hdhPs with the fol lowing types of Cost shar ing in addit ion to the General annual deduc tible, 2010
‡ this includes enrollees who are required to pay the higher amount of either the copayment or coinsurance under the plan.§ information on separate deductibles for hospital admissions or outpatient surgery was collected for hdhP/hras only.
na: not applicable. information on separate annual deductibles for hospital admissions or outpatient surgery was not collected for hsa-qualified hdhPs because federal regulations make it unlikely the plan would have a separate deductible for specific services.
note: the distribution of workers with types of cost sharing does not equal 100% as workers may face a combination of types of cost sharing. no covered workers in hdhP/sos have an “other” type of cost sharing for a hospital admission or for an outpatient surgery, 2% have an “other” type of cost sharing for primary care physician office visits, 2% have an “other” type of cost sharing for specialist physician office visits, and 1% have an “other” type of cost sharing for emergency room visits.
kaiser/hret survey of employer-sponsored health Benefits, 2010.
s o u r c e :


69%$13,7
70
$5,0
49
2010
Employer Health Benefits2 0 1 0 a n n u a l s u r V e y
s ect ion
Prescription Drug Benefits
9

Employer Health Benefits 2 0 1 0 An n u a l s u r vey
section
nin
ePrescription D
rug Benefits
9
144
t h e k a i s e r fa m i ly f o u n d at i o n - a n d - h e a lt h r e s e a r C h & e d u C at i o n a l t r u s t
p r e S C r i p t i o n D r u g B e n e f i t S
almosT all covered workers have coverage for prescripTion drugs. more Than Three in four covered
workers are in plans wiTh Three or more cosT-sharing Tiers for prescripTion drugs. copaymenTs raTher
Than coinsurance conTinue To be The dominanT form of cosT sharing for prescripTion drugs.
As in prior years, nearly all (99%) covered workers in employer-sponsored plans have a prescription drug benefit.
A large majority of covered workers (89%) in 2010 have a tiered cost-sharing formula for prescription drugs (Exhibit 9.1). Cost-sharing tiers generally are associated with a health plan placing a drug on a formulary or preferred drug list, which classifies drugs as generic, preferred, or nonpreferred. Over the past years, an increasing number of plans have created a fourth tier of drug cost sharing, which may be used for lifestyle drugs or expensive biologics.
Seventy-eight percent of covered workers are enrolled in plans with three, four, or more tiers of cost sharing for prescription drugs, the same percentage as last year (Exhibit 9.1).
HDHP/SOs have different cost-sharing patterns for prescription drugs than other plan types. Only 53% of covered workers in HDHP/SOs are in a plan with three or more tiers of cost sharing for prescription drugs. Thirty percent are in plans that pay 100% of prescription costs once the plan deductible is met (Exhibit 9.2).
Among workers covered by plans with three or more tiers of cost sharing for prescription drugs, a large majority face copayments rather than coinsurance (Exhibit 9.3). The percentages differ slightly across drug types because some plans have copayments for some drug tiers and coinsurance for other drug tiers.
For covered workers in plans with three, four, or more tiers of cost sharing for prescription drugs, the average drug copayments for first-tier drugs ($11) was consistent with the amount reported last year ($10). The average copayments reported for second-tier drugs ($28), and third-tier drugs ($49) were slightly higher than the amounts reported in 2009 (Exhibit 9.4).
For covered workers in plans with three, four, or more tiers of cost sharing for prescription drugs who face coinsurance rather than copayments, coinsurance levels average 17% for first-tier drugs, 25% for second-tier drugs, and 38% for third-tier drugs, which are similar to the percentages reported last year (Exhibit 9.4).
Thirteen percent of covered workers are in a plan that has four or more tiers of cost sharing for prescription drugs (Exhibit 9.1). For covered workers in plans with four cost-sharing tiers, 46% face a copayment for fourth-tier drugs and 24% face coinsurance (Exhibit 9.3).
The average copayment for a fourth-tier drug is $89 and the average coinsurance is 36%. These amounts are not statistically different from the amounts reported in 2009 (Exhibit 9.4).
Eleven percent of covered workers are in a plan that has two tiers for prescription drug cost sharing (Exhibit 9.1). Similar to workers in plans with alternative cost-sharing tiers, copayments are more common than coinsurance for workers in plans with two tiers (Exhibit 9.5). The average copayment for the first tier is $10, and the average copayment for the second tier is $28 (Exhibit 9.6). The average coinsurance rate for the second tier is 27%; there was insufficient data to report the coinsurance rate for the first tier (Exhibit 9.6).
Five percent of covered workers are covered by plans in which cost sharing is the same regardless of the type of drug chosen (Exhibit 9.1). Among these covered workers, 51% have copayments and 39% have coinsurance (Exhibit 9.7). Unlike the other plan types, covered workers in HDHP/SOs with the same cost sharing regardless of the type of drug were more likely to face coinsurance rather than copayments (84% vs. 12%) for prescriptions (Exhibit 9.7).
For those workers with the same cost sharing regardless of the type of drug, the average copayment is $13 and the average coinsurance is 24% (Exhibit 9.8).

Employer Health Benefits 2 0 1 0 An n u a l s u r veysectio
n n
ine
9
Prescription Drug B
enefits
145
t h e k a i s e r fa m i ly f o u n d at i o n - a n d - h e a lt h r e s e a r C h & e d u C at i o n a l t r u s t
Generic drugs: A drug product that is no longer covered by patent protection and thus may be produced and/or distributed by multiple drug companies.
Preferred drugs: Drugs included on a formulary or preferred drug list; for example, a brand-name drug without a generic substitute.
Nonpreferred drugs: Drugs not included on a formulary or preferred drug list; for example, a brand-name drug with a generic substitute.
Fourth-tier drugs: New types of cost-sharing arrangements that typically build additional layers of higher copayments or coinsurance for specifically identified types of drugs, such as lifestyle drugs or biologics.
Brand-name drugs: Generally, a drug product that is covered by a patent and is thus manufactured and sold exclusively by one firm. Cross-licensing occasionally occurs, allowing an additional firm to market the drug. After the patent expires, multiple firms can produce the drug product, but the brand name or trademark remains with the original manufacturer’s product.

section
nin
ePrescription D
rug Benefits
9
Employer Health Benefits 2 0 1 0 An n u a l s u r vey
146
t h e k a i s e r fa m i ly f o u n d at i o n - a n d - h e a lt h r e s e a r C h & e d u C at i o n a l t r u s t
0% 20% 40% 60% 80% 100%
2000
2010*
2009*
2008*
2007‡
2006
2005*
2004‡
2003*
2002*
2001*
FOUR OR MORE TIERS
THREE TIERS
TWO TIERS
PAYMENT IS THE SAME REGARDLESS OF TYPE OF DRUG
NO COST SHARING AFTER DEDUCTIBLE IS MET
OTHER
27% 49% 2%
1%
1%
2%
1%
2%
2%
1%
1%
22%
41% 41% 18%
55% 30% 13%
63% 23% 13%
65% 20% 10%
70% 15% 8%
69% 16% 8%
68% 16% 6%
70%
3%
4%
5%
7%
7% 15% 4%
1%65%13% 11% 4%5%
3%67%11% 12% 3%5%
2%
3%
e x h i B i t 9 .1
distr ibution of Covered Workers facing dif ferent Cost-shar ing formulas for Prescr ipt ion drug Benef its, 2000–2010
* distribution is statistically different from distribution for the previous year shown (p<.05). ‡ no statistical tests are conducted between 2003 and 2004 or between 2006 and 2007 due
to the addition of a new category.
note: fourth-tier drug cost-sharing information was not obtained prior to 2004.
kaiser/hret survey of employer-sponsored health Benefits, 2000–2010.
s o u r c e :

section
nin
e
9
Prescription Drug B
enefitsEmployer Health Benefits 2 0 1 0 An n u a l s u r vey
147
t h e k a i s e r fa m i ly f o u n d at i o n - a n d - h e a lt h r e s e a r C h & e d u C at i o n a l t r u s t
0% 20% 40% 60% 80% 100%
POS*
PPO*
HMO*
ALL PLANS
HDHP/SO*
FOUR OR MORE TIERS
THREE TIERS
TWO TIERS
PAYMENT IS THE SAME REGARDLESS OF TYPE OF DRUG
NO COST SHARING AFTER DEDUCTIBLE IS MET
OTHER
11% 65% 2%
1%
2%
<1%
1%
1%
14% 9%
14% 69% 11% 3%
24% 51% 14%
6% 11%5%47% 30%
65% 11% 5% 4%13%
<1%
3%7%
<1%
e x h i B i t 9 .2
distr ibution of Covered Workers facing dif ferent Cost-shar ing formulas for Prescr ipt ion drug Benef its, by Plan type, 2010
* distribution is statistically different from all Plans distribution (p<.05).
kaiser/hret survey of employer-sponsored health Benefits, 2010.
s o u r c e :

section
nin
ePrescription D
rug Benefits
9
Employer Health Benefits 2 0 1 0 An n u a l s u r vey
148
t h e k a i s e r fa m i ly f o u n d at i o n - a n d - h e a lt h r e s e a r C h & e d u C at i o n a l t r u s t
first-Tier Drugs, often Called generic DrugsCopay only
Coinsurance only
either Copay or
Coinsurance‡
Plan Pays entire Cost after any
deductibles are met
some other
amount
hmo* 91% 2% 2% 1% 4%PPo 84 8 4 1 2Pos* 95 1 1 2 1hdhP/so* 71 20 3 4 2
All plANs 84% 8% 4% 1% 3%
second-Tier Drugs, often Called preferred Drugs
Copay or Coinsurance
Plus any difference§
hmo* 79% 9% 3% 0% 10%PPo 72 13 9 <1 7Pos* 96 1 2 0 1hdhP/so* 64 16 16 0 4
All plANs 72% 12% 9% <1% 7%
Third-Tier Drugs, often Called Nonpreferred Drugs
hmo* 77% 10% 3% 0% 10%PPo 68 14 10 <1 8Pos* 93 3 2 <1 1hdhP/so* 60 18 16 2 4
All plANs 69% 14% 9% <1% 8%
fourth-Tier Drugs
hmo* 72% 16% 2% 2% 7%PPo 42 29 2 1 27Pos* 33 8 2 0 57hdhP/so* 40 42 0 0 18
All plANs 46% 24% 2% 1% 26%
e x h i B i t 9 .3
among Workers with three, four, or more tiers of Cost shar ing, distr ibution of Covered Workers with the fol lowing types of Cost shar ing for Prescr ipt ion drugs, by drug and Plan type, 2010
* distribution is statistically different from all Plans distribution within drug type (p<.05).‡ Category includes enrollees who are required to pay the higher amount of either the copayment or coinsurance under the plan. § Category includes workers who pay a copayment or coinsurance plus the difference between the cost of the prescription and the cost
of a comparable generic drug.
note: these distributions do not include the 1% of covered workers whose employers report “none of the above” to the survey question about the type of prescription drug cost-sharing formula. for definitions of Generic, Preferred, nonpreferred, and fourth-tier drugs, see the text Box in the introduction to section 9.
kaiser/hret survey of employer-sponsored health Benefits, 2010.
s o u r c e :

section
nin
e
9
Prescription Drug B
enefitsEmployer Health Benefits 2 0 1 0 An n u a l s u r vey
149
t h e k a i s e r fa m i ly f o u n d at i o n - a n d - h e a lt h r e s e a r C h & e d u C at i o n a l t r u s t
* estimate is statistically different from estimate for the previous year shown (p<.05). ^ fourth-tier drug copayment or coinsurance information was not obtained prior to 2004. nsd: not sufficient data.
kaiser/hret survey of employer-sponsored health Benefits, 2000–2010.
s o u r c e :
e x h i B i t 9 .4
among Covered Workers with three, four, or more tiers of Prescr ipt ion Cost shar ing, average Copayments and average Coinsurance, 2000–2010
2000 2001 2002 2003 2004 2005 2006 2007 2008 2009 2010
Average Copaymentsfirst-tier drugs, often Called Generic $8 $8 $9 $9* $10* $10 $11* $11 $10 $10 $11second-tier drugs, often Called Preferred $15 $16* $18* $20* $22* $23* $25* $25 $26 $27 $28*third-tier drugs, often Called nonpreferred $29 $28 $32* $35* $38* $40* $43* $43 $46* $46 $49*fourth-tier drugs ^ ^ ^ ^ $59 $74 $59 $71* $75 $85 $89
Average Coinsurancefirst-tier drugs, often Called Generic 18% 18% 18% 18% 18% 19% 19% 21% 21% 20% 17%second-tier drugs, often Called Preferred nsd 23% 24% 23% 25% 27% 26% 26% 25% 26% 25%third-tier drugs, often Called nonpreferred 28% 33% 40% 34%* 34% 38% 38% 40% 38% 37% 38%fourth-tier drugs ^ ^ ^ ^ 30% 43%* 42% 36% 28% 31% 36%

section
nin
ePrescription D
rug Benefits
9
Employer Health Benefits 2 0 1 0 An n u a l s u r vey
150
t h e k a i s e r fa m i ly f o u n d at i o n - a n d - h e a lt h r e s e a r C h & e d u C at i o n a l t r u s t
e x h i B i t 9 .5
among Workers with two tiers of Cost sharing for Prescription drugs, distribution of Covered Workers with the following types of Cost sharing for Prescription drugs, by drug and Plan type, 2010
* distribution is statistically different from all Plans distribution within drug type (p<.05). ‡ this includes enrollees who are required to pay the higher amount of either the copayment or coinsurance under the plan. § Category includes workers who pay a copayment or coinsurance plus the difference between the cost of the prescription
and the cost of a comparable generic drug.
nsd: not sufficient data.
note: these distributions do not include the 1% of covered workers whose employers report “none of the above” to the survey question about the type of prescription drug cost-sharing formula. for definitions of Generic and Preferred drugs, see the text Box in the introduction to section 9.
kaiser/hret survey of employer-sponsored health Benefits, 2010.
s o u r c e :
first-Tier Drugs, often Called generic DrugsCopay only
Coinsurance only
either Copay or
Coinsurance‡
Plan Pays entire Cost after any
deductibles are met
some other
amount
hmo* 98% 2% <1% 0% 1%PPo 85 7 5 3 1Pos nsd nsd nsd nsd nsdhdhP/so nsd nsd nsd nsd nsd
All plANs 88% 6% 3% 2% 1%
second-Tier Drugs, often Called preferred Drugs
Copay only
Coinsurance only
either Copay or
Coinsurance‡
Copay or Coinsurance
Plus difference§
some other
amount
hmo* 88% 11% <1% 0% 1%PPo* 47 21 9 0 23Pos nsd nsd nsd nsd nsdhdhP/so nsd nsd nsd nsd nsd
All plANs 62% 18% 6% 0% 15%

section
nin
e
9
Prescription Drug B
enefitsEmployer Health Benefits 2 0 1 0 An n u a l s u r vey
151
t h e k a i s e r fa m i ly f o u n d at i o n - a n d - h e a lt h r e s e a r C h & e d u C at i o n a l t r u s t
e x h i B i t 9 .7
among Workers with the same Cost sharing regardless of type of drug, distribution of Covered Workers with the following types of Cost sharing for Prescription drugs, by Plan type, 2010
* distribution is statistically different from all Plans distribution (p<.05).‡ this includes enrollees who are required to pay the higher amount of either the copayment or coinsurance under the plan.
nsd: not sufficient data.
note: these distributions do not include the 1% of covered workers whose employers report “none of the above” to the survey question about the type of prescription drug cost sharing formula.
kaiser/hret survey of employer-sponsored health Benefits, 2010.
s o u r c e :
Copay only
Coinsurance only
either Copay or
Coinsurance‡
some other amount
hmo* 87% 9% 0% 4%PPo* 23 61 1 15Pos nsd nsd nsd nsdhdhP/so* 12 84 0 4
All plANs 51% 39% <1% 9%
* estimate is statistically different from estimate for the previous year shown (p<.05).
nsd: not sufficient data.
kaiser/hret survey of employer-sponsored health Benefits, 2000–2010.
s o u r c e :
e x h i B i t 9 .6
among Covered Workers with two tiers of Prescription Cost sharing, average Copayments and average Coinsurance, 2000–2010
2000 2001 2002 2003 2004 2005 2006 2007 2008 2009 2010
Average Copaymentsfirst-tier drugs, often Called Generic $7 $8* $9* $9 $10 $10 $11 $10 $11 $10 $10second-tier drugs, often Called Preferred $14 $15* $18* $20* $22* $22 $23 $23 $24 $26 $28
Average Coinsurancefirst-tier drugs, often Called Generic 19% 17% 20% 21% 17% 16% 22% 21% 19% nsd nsdsecond-tier drugs, often Called Preferred 28% 25% 25% 28% 25% 24% 27% 28% 32% 28% 27%

section
nin
ePrescription D
rug Benefits
9
Employer Health Benefits 2 0 1 0 An n u a l s u r vey
152
t h e k a i s e r fa m i ly f o u n d at i o n - a n d - h e a lt h r e s e a r C h & e d u C at i o n a l t r u s t
* estimate is statistically different from estimate for the previous year shown (p<.05).
kaiser/hret survey of employer-sponsored health Benefits, 2000–2010.
s o u r c e :
e x h i B i t 9 .8
among Covered Workers with the same Cost sharing regardless of type of drug, average Copayments and average Coinsurance, 2000–2010
2000 2001 2002 2003 2004 2005 2006 2007 2008 2009 2010
Average Copayments $8 $10* $10 $10 $14* $10* $13* $13 $15 $15 $13
Average Coinsurance 22% 20% 23% 22% 25% 23% 23% 22% 24% 22% 24%

69%$13,7
70
$5,0
49
2010
Employer Health Benefits2 0 1 0 a n n u a l s u r V e y
s ect ion
Plan Funding
10

Employer Health Benefits 2 0 1 0 An n u a l s u r vey
sec
tion
ten
Plan Funding
10
154
t h e k a i s e r fa m i ly f o u n d at i o n - a n d - h e a lt h r e s e a r C h & e d u C at i o n a l t r u s t
p l a n f u n D i n g
The employee reTiremenT income securiTy acT (erisa) of 1974 exempTs self-funded plans from sTaTe
insurance laws, including reser ve requiremenTs, mandaTed benefiTs, premium Taxes, and consumer
proTecTion regulaTions. over one half (59%) of covered workers are in a self-funded healTh plan.
because larger firms have more employees over whom To spread The risk of cosTly claims, self funding is
more common and less risky for larger firms Than for smaller ones.
�Slightly more than half (59%) of covered workers are in a self-funded plan (Exhibit 10.1). The percentage of covered workers who are in a plan that is completely or partially self-funded has remained stable over the last few years, but has increased from 44% in 1999.
By plan type, 67% of covered workers in PPOs, 61% in HDHP/SOs, 61% in conventional health plans, 41% in HMOs, and 32% in POS plans are in a self-funded plan (Exhibit 10.2).
As expected, covered workers in large firms (200 or more workers) are more likely to be in a self-funded plan than workers in small firms (3–199 workers) (83% vs. 16%) (Exhibit 10.3). The percentage of covered workers in self-funded plans increases as the number of employees in a firm increases. Eighty percent of covered workers in firms with 1,000 to 4,999 workers and 93% of covered workers in firms with 5,000 or more workers are in self-funded plans in 2010 (Exhibit 10.3).
Self-Funded Plan: An insurance arrangement in which the employer assumes direct financial responsibility for the costs of enrollees’ medical claims. Employers sponsoring self-funded plans typically contract with a third-party administrator or insurer to provide administrative services for the self-funded plan. In some cases, the employer may buy stop-loss coverage from an insurer to protect the employer against very large claims.
Fully Insured Plan: An insurance arrangement in which the employer contracts with a health plan that assumes financial responsibility for the costs of enrollees’ medical claims.

sec
tion
ten
Plan FundingEmployer Health Benefits 2 0 1 0 An n u a l s u r vey
155
t h e k a i s e r fa m i ly f o u n d at i o n - a n d - h e a lt h r e s e a r C h & e d u C at i o n a l t r u s t
10
* estimate is statistically different from estimate for the previous year shown (p<.05).
note: due to a change in the survey questionnaire, funding status was not asked of firms with conventional plans in 2006. therefore, conventional plan funding status is not included in this exhibit for 2006. for definitions of self-funded and fully insured plans, see the introduction to section 10.
kaiser/hret survey of employer-sponsored health Benefits, 1999–2010.
s o u r c e :
* estimate is statistically different from estimate for the previous year shown (p<.05).
^ information was not obtained for conventional plans in 2006 and hdhP/so plans prior to 2006.
note: due to a change in the survey questionnaire, funding status was not asked of firms with conventional plans in 2006. therefore, conventional plan funding status is not included in this exhibit for 2006. for definitions of self-funded and fully insured plans, see the introduction to section 10.
kaiser/hret survey of employer-sponsored health Benefits, 1999–2010.
s o u r c e :
e x h i B i t 10.1
Percentage of Covered Workers in Partially or Completely self-funded Plans, by firm size, 1999–2010
e x h i B i t 10.2
Percentage of Covered Workers in Partially or Completely self-funded Plans, by Plan type, 1999–2010
1999 2000 2001 2002 2003 2004 2005 2006 2007 2008 2009 2010
3–199 Workers 13% 15% 17% 13% 10% 10% 13% 13% 12% 12% 15% 16%200–999 Workers 51 53 52 48 50 50 53 53 53 47 48 58*1,000–4,999 Workers 62 69 66 67 71 78 78 77 76 76 80 805,000 or more Workers 62 72 70 72 79 80 82 89 86 89 88 93
All firms 44% 49% 49% 49% 52% 54% 54% 55% 55% 55% 57% 59%
1999 2000 2001 2002 2003 2004 2005 2006 2007 2008 2009 2010
Conventional 65% 64% 65% 58% 49% 43% 53% ^ 53% 47% 48% 61%hmo 16 23* 31* 27 29 29 32 33 34 40 40 41PPo 60 63 61 61 61 64 65 63 65 64 67 67Pos 42 45 42 40 44 46 36 32 34 29 25 32hdhP/so ^ ^ ^ ^ ^ ^ ^ 50 41 35 48* 61*
All plANs 44% 49% 49% 49% 52% 54% 54% 55% 55% 55% 57% 59%

Employer Health Benefits 2 0 1 0 An n u a l s u r vey
156
t h e k a i s e r fa m i ly f o u n d at i o n - a n d - h e a lt h r e s e a r C h & e d u C at i o n a l t r u s t
sec
tion
ten
Plan Funding
10
* estimate is statistically different from estimate for all other firms not in the indicated size, region, or industry category (p<.05).
note: for definitions of self-funded and fully insured plans, see the introduction to section 10.
kaiser/hret survey of employer-sponsored health Benefits, 2010.
s o u r c e :
e x h i B i t 10.3
Percentage of Covered Workers in Par t ia l ly or Completely sel f -funded Plans, by firm size, region, and industr y, 2010
self-funded (employer Bears some or all of financial risk)
firm size200–999 Workers 58%1,000–4,999 Workers 80*5,000 or more Workers 93*
All small firms (3–199 Workers) 16%*All large firms (200 or more Workers) 83%*
regioNnortheast 58%midwest 66*south 60West 53
iNDusTryagriculture/mining/Construction 35%*manufacturing 71*transportation/Communications/utilities 72*Wholesale 66retail 63finance 63service 53*state/local Government 66health Care 56
All firms 59%

sec
tion
ten
Plan FundingEmployer Health Benefits 2 0 1 0 An n u a l s u r vey
157
t h e k a i s e r fa m i ly f o u n d at i o n - a n d - h e a lt h r e s e a r C h & e d u C at i o n a l t r u s t
10
e x h i B i t 10.4
Percentage of Covered Workers in Partially or Completely self-funded Plans, by Plan type and firm size, 2010
* estimate is statistically different from estimate for all other firms not in the indicated size category within plan type (p<.05).
note: for definitions of self-funded and fully insured plans, see the introduction to section 10.
nsd: not sufficient data.
kaiser/hret survey of employer-sponsored health Benefits, 2010.
s o u r c e :
Conventional hmo PPo Pos hdhP/so
3–199 Workers nsd 9%* 18%* 9* 24%*200–999 Workers nsd 23* 69 53 531,000–4,999 Workers nsd 59* 85* 60* 88*5,000 or more Workers nsd 65* 96* 85* 99*
All firms 61% 41% 67% 32% 61%
* estimate is statistically different from estimate for the previous year shown (p<.05).
note: for definitions of self-funded and fully insured plans, see the introduction to section 10.
kaiser/hret survey of employer-sponsored health Benefits, 1999–2010.
s o u r c e :
e x h i B i t 10.5
Percentage of Covered Workers in Par t ia l ly or Completely sel f -funded hmo Plans, by firm size, 1999–2010
1999 2000 2001 2002 2003 2004 2005 2006 2007 2008 2009 2010
3–199 Workers 5% 4% 14% 10% 5% 4% 10% 3% 1% 10% 6% 9%200–999 Workers 14 13 23 16 21 18 17 29 19 22 26 231,000–4,999 Workers 22 27 32 31 37 49 50 54 44 48 50 595,000 or more Workers 19 35* 40 38 44 40 44 47 58 66 61 65
All hmo plANs 16% 23%* 31%* 27% 29% 29% 32% 33% 34% 40% 40% 41%

Employer Health Benefits 2 0 1 0 An n u a l s u r vey
158
t h e k a i s e r fa m i ly f o u n d at i o n - a n d - h e a lt h r e s e a r C h & e d u C at i o n a l t r u s t
sec
tion
ten
Plan Funding
10
* estimate is statistically different from estimate for the previous year shown (p<.05).
note: for definitions of self-funded and fully insured plans, see the introduction to section 10.
kaiser/hret survey of employer-sponsored health Benefits, 1999–2010.
s o u r c e :
* estimate is statistically different from estimate for the previous year shown (p<.05).
note: for definitions of self-funded and fully insured plans, see the introduction to section 10.
kaiser/hret survey of employer-sponsored health Benefits, 1999–2010.
s o u r c e :
e x h i B i t 10.6
Percentage of Covered Workers in Par t ia l ly or Completely sel f -funded PPo Plans, by firm size, 1999–2010
e x h i B i t 10.7
Percentage of Covered Workers in Par t ia l ly or Completely sel f -funded Pos Plans, by firm size, 1999–2010
1999 2000 2001 2002 2003 2004 2005 2006 2007 2008 2009 2010
3–199 Workers 19% 23% 23% 15% 13% 13% 18% 19% 17% 15% 21% 18%200–999 Workers 69 72 66 63 60 63 67 61 65 55 55 69*1,000–4,999 Workers 84 89 87 83 85 88 88 85 87 85 87 855,000 or more Workers 87 88 87 93 93 93 95 97 90* 94 93 96
All ppo plANs 60% 63% 61% 61% 61% 64% 65% 63% 65% 64% 67% 67%
1999 2000 2001 2002 2003 2004 2005 2006 2007 2008 2009 2010
3–199 Workers 10% 10% 10% 10% 8% 9% 9% 6% 14% 9% 5% 9%200–999 Workers 35 39 40 21* 42* 42 31 36 33 20 39 531,000–4,999 Workers 62 71 60 67 73 63 48 62 47 52 53 605,000 or more Workers 75 77 76 67 71 77 74 80 89 65 76 85
All pos plANs 42% 45% 42% 40% 44% 46% 36% 32% 34% 29% 25% 32%

sec
tion
ten
Plan FundingEmployer Health Benefits 2 0 1 0 An n u a l s u r vey
159
t h e k a i s e r fa m i ly f o u n d at i o n - a n d - h e a lt h r e s e a r C h & e d u C at i o n a l t r u s t
10
* estimate is statistically different from estimate for the previous year shown (p<.05).
note: information on funding status for hdhP/sos was not collected prior to 2006. for definitions of self-funded and fully insured plans, see the introduction to section 10.
kaiser/hret survey of employer-sponsored health Benefits, 2006–2010.
s o u r c e :
e x h i B i t 10.8
Percentage of Covered Workers in Par t ia l ly or Completely sel f -funded hdhP/sos, by firm size, 2006–2010
2006 2007 2008 2009 2010
3–199 Workers 7% 4% 7% 18% 24%200–999 Workers 57 27 48 36 531,000–4,999 Workers 81 86 72 81 885,000 or more Workers 100 97 91 96 99
All hDhp/sos 50% 41% 35% 48%* 61%*


69%$13,7
70
$5,0
49
2010
Employer Health Benefits2 0 1 0 a n n u a l s u r V e y
s ect ion
Retiree Health Benefits
11

Employer Health Benefits 2 0 1 0 An n u a l s u r vey
section
elevenR
etiree Health B
enefits
11
162
t h e k a i s e r fa m i ly f o u n d at i o n - a n d - h e a lt h r e s e a r C h & e d u C at i o n a l t r u s t
r e t i r e e h e a l t h B e n e f i t S
reTiree healTh benefiTs are an imporTanT consideraTion for older workers making decisions abouT Their
reTiremenT. healTh benefiTs for reTirees also provide an imporTanT supplemenT To medicare for reTirees
age 65 or older. among firms offering healTh benefiTs To Their workers, large firms (200 or more
workers) are much more likely Than small firms (3–199 workers) To offer reTiree healTh benefiTs. afTer
falling dramaTically in The laTe 1980s and early 1990s, The percenTage of large firms (200 or more
workers) offering reTiree healTh benefiTs has remained relaTively consTanT.
Twenty-eight percent of large firms (200 or more workers) that offer health benefits to their employees offer retiree coverage in 2010, similar to 30% in 2009, but down from 34% in 2005 and 66% in 1988 (Exhibit 11.1).1
Offering retiree health benefits varies considerably by firm characteristics.
Large firms are much more likely to offer retiree health benefits than small firms—28% vs. 3% (Exhibit 11.2).
Among large firms that offer health benefits, state and local governments are more likely (87%) than large firms in other industries to offer retiree health benefits. In contrast, large firms in the health care industry are less likely (17%) to offer retiree health benefits when compared to large firms in other industries (Exhibit 11.2).
Large firms with fewer part-time workers (less than 35% work part time) are more likely to offer retiree health benefits than large firms with many part-time workers (35% or more work part time)—30% vs. 17% (Exhibit 11.3).
Large firms with union workers are more likely to offer retiree health benefits than large firms without union workers—41% vs. 21% (Exhibit 11.3).
Large firms with more older workers (35% or more are age 50 or older) are more likely to offer retiree benefits than large firms with fewer older workers (less than 35% are age 50 or older)—34% vs. 25% (Exhibit 11.3).
Among firms offering health benefits, virtually all large firms that offer retiree health benefits offer them to early retirees under the age of 65 (93%). A lower percentage (75%) of large firms offering retiree health benefits offer them to Medicare-age retirees (Exhibit 11.4).
1 We now count the 0.46% of large firms that indicate they offer retiree coverage but have no retirees as offering retiree health benefits. historical numbers have been recalculated so that the results are comparable.
n o T e :

section
elevenR
etiree Health B
enefits
11
Employer Health Benefits 2 0 1 0 An n u a l s u r vey
163
t h e k a i s e r fa m i ly f o u n d at i o n - a n d - h e a lt h r e s e a r C h & e d u C at i o n a l t r u s t
1988 1991 1993 1995 1998 1999 2000 2001 2002 2003 2004 2005 2006 2007 2010200920080%
10%
20%
30%
40%
50%
60%
70%
80%
90%
100%
66%
46%
36%40% 40% 41%
35%39% 36% 38% 37% 34% 35% 34%
28%30%31%
e x h i B i t 11.1
among al l large firms (200 or more Workers) o ffer ing health Benef its to ac t ive Workers, Percentage of fi rms o ffer ing ret iree health Benef its, 1988–2010*
* tests found no statistical difference from estimate for the previous year shown (p<.05). no statistical tests are conducted for years prior to 1999.
note: data have been edited to include the less than 1% of large firms who report “yes, but no retiree” responses in 2010. historical numbers have been recalculated so that the results are comparable.
kaiser/hret survey of employer-sponsored health Benefits, 1999–2010; kPmG survey of employer-sponsored health Benefits, 1991, 1993, 1995, 1998; the health insurance association of america (hiaa), 1988.
s o u r c e :
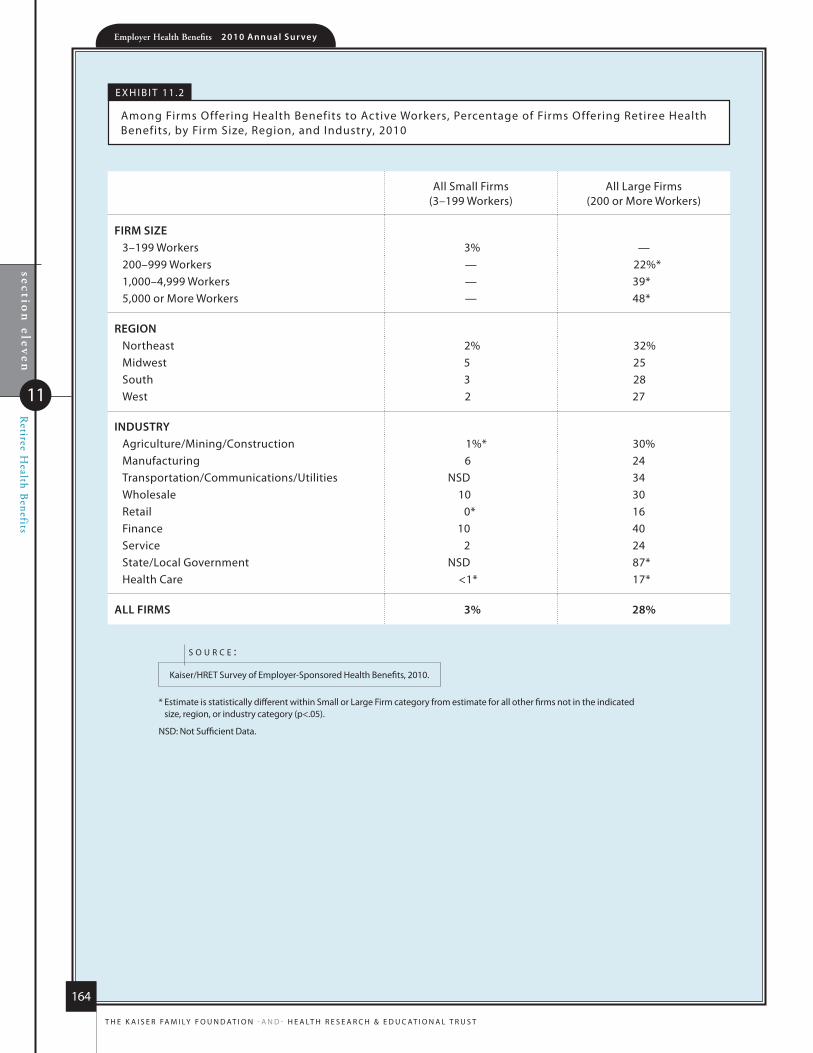
section
elevenR
etiree Health B
enefits
11
Employer Health Benefits 2 0 1 0 An n u a l s u r vey
164
t h e k a i s e r fa m i ly f o u n d at i o n - a n d - h e a lt h r e s e a r C h & e d u C at i o n a l t r u s t
e x h i B i t 11.2
among firms offering health Benefits to active Workers, Percentage of firms offering retiree health Benefits, by firm size, region, and industry, 2010
* estimate is statistically different within small or large firm category from estimate for all other firms not in the indicated size, region, or industry category (p<.05).
nsd: not sufficient data.
kaiser/hret survey of employer-sponsored health Benefits, 2010.
s o u r c e :
all small firms (3–199 Workers)
all large firms (200 or more Workers)
firm size3–199 Workers 3% —200–999 Workers — 22%*1,000–4,999 Workers — 39*5,000 or more Workers — 48*
regioNnortheast 2% 32%midwest 5 25south 3 28West 2 27
iNDusTryagriculture/mining/Construction 1%* 30%manufacturing 6 24transportation/Communications/utilities nsd 34Wholesale 10 30retail 0* 16finance 10 40service 2 24state/local Government nsd 87*health Care <1* 17*
All firms 3% 28%

section
elevenR
etiree Health B
enefits
11
Employer Health Benefits 2 0 1 0 An n u a l s u r vey
165
t h e k a i s e r fa m i ly f o u n d at i o n - a n d - h e a lt h r e s e a r C h & e d u C at i o n a l t r u s t
e x h i B i t 11.3
among al l large firms (200 or more Workers) o ffer ing health Benef its to ac t ive Workers, Percentage of fi rms o ffer ing ret iree health Benef its, by firm Charac ter ist ics, 2010
FIRM DOES NOT HAVE ANY UNION WORKERS
FIRM HAS AT LEAST SOME UNION WORKERS
FEW WORKERS ARE LOWER-WAGE(LESS THAN 35% EARN $23,000 A YEAR OR LESS)
MANY WORKERS ARE LOWER-WAGE (35% OR MORE EARN $23,000 A YEAR OR LESS)
FEW WORKERS ARE PART-TIME(LESS THAN 35% WORK PART-TIME)
MANY WORKERS ARE PART-TIME(35% OR MORE WORK PART-TIME)
WAGE LEVEL
PART-TIME WORKERS*
UNIONS*
35% OR MORE WORKERS ARE 50 OR OLDER
LESS THAN 35% OF WORKERS ARE 50 OR OLDER
OLDER WORKERS*
35% OR MORE WORKERS ARE 26 OR YOUNGER
LESS THAN 35% OF WORKERS ARE 26 OR YOUNGER
YOUNGER WORKERS*
0% 10% 20% 30% 40% 50%
22%
29%
17%
30%
21%
29%
20%
25%
34%
41%
* estimates are statistically different from each other within category (p<.05).
kaiser/hret survey of employer-sponsored health Benefits, 2010.
s o u r c e :

section
elevenR
etiree Health B
enefits
11
Employer Health Benefits 2 0 1 0 An n u a l s u r vey
166
t h e k a i s e r fa m i ly f o u n d at i o n - a n d - h e a lt h r e s e a r C h & e d u C at i o n a l t r u s t
OFFER HEALTH BENEFITS TO EARLY RETIREES OFFER HEALTH BENEFITS TO MEDICARE-AGE RETIREES
0%
10%
20%
30%
40%
50%
60%
70%
80%
90%
100%93%
89%
98%* 96% 93% 96% 94% 94% 92% 92%93%
75%71% 73% 76% 78% 75%
81%77%
71%75%
68%
2000 2001 2002 2003 2004 2005 2006 2007 2008 2009 2010 2000 2001 2002 2003 2004 2005 2006 2007 2008 20102009
e x h i B i t 11.4
among al l large firms (200 or more Workers) o ffer ing health Benef its to ac t ive Workers and o ffer ing ret iree Coverage, Percentage of fi rms o ffer ing health Benef its to ear ly and medicare -age ret irees, 2000–2010
* estimate is statistically different from estimate for the previous year shown (p<.05).
early retirees: Workers retiring before age 65.
kaiser/hret survey of employer-sponsored health Benefits, 2000–2010.
s o u r c e :

section
elevenR
etiree Health B
enefits
11
Employer Health Benefits 2 0 1 0 An n u a l s u r vey
167
t h e k a i s e r fa m i ly f o u n d at i o n - a n d - h e a lt h r e s e a r C h & e d u C at i o n a l t r u s t
e x h i B i t 11.5
among all large firms (200 or more Workers) offering health Benefits to active Workers and offering retiree Coverage, Percentage of firms offering retiree health Benefits to early and medicare-age retirees, by firm size, region, and industry, 2010
* estimate is statistically different from estimate for all other large firms not in the indicated size, region, or industry category (p<.05).
early retirees: Workers retiring before age 65.
nsd: not sufficient data.
kaiser/hret survey of employer-sponsored health Benefits, 2010.
s o u r c e :
Percentage of large employers offering
retiree health Benefits to early retirees
Percentage of large employers offering
retiree health Benefits to medicare-age retirees
firm size200–999 Workers 92% 72%1,000–4,999 Workers 93 815,000 or more Workers 93 76
regioNnortheast 91% 77%midwest 97* 76south 91 71West 93 79
iNDusTryagriculture/mining/Construction nsd nsdmanufacturing 93% 71%transportation/Communications/utilities 100* 75Wholesale nsd nsdretail nsd nsdfinance 88 77service 96 72state/local Government 98* 76health Care nsd nsd
All lArge firms (200 or more Workers) 93% 75%


69%$13,7
70
$5,0
49
2010
Employer Health Benefits2 0 1 0 a n n u a l s u r V e y
s ect ion
12
Wellness Programs, Health Risk
Assessments, and Disease Management
Programs

Employer Health Benefits 2 0 1 0 An n u a l s u r vey
section
twelve
Wellness Program
s, Health R
isk Assessm
ents, and Disease M
anagement Program
s
12
170
t h e k a i s e r fa m i ly f o u n d at i o n - a n d - h e a lt h r e s e a r C h & e d u C at i o n a l t r u s t
W e l l n e S S p r o g r a M S , h e a l t h r i S k a S S e S S M e n t S , a n D D i S e a S e M a n a g e M e n t p r o g r a M S
many firms also provide wellness programs To Their employees. This year’s survey included quesTions on
The wellness programs offered To employees, incenTives for parTicipaTion in wellness programs, employer
opinions of wellness programs, healTh risk assessmenTs and relaTed incenTives, and disease managemenT
programs.
W e l l N e s s b e N e f i T s
�In an effort to improve health and lower costs, some employers and health plans offer wellness programs. Wellness programs may range from classes in nutrition or healthy living to a wellness newsletter.
Seventy-four percent of firms offering health benefits offer at least one of the following wellness programs: weight loss programs, gym membership discounts or on-site exercise facilities, smoking cessation programs, personal health coaching, classes in nutrition or healthy living, web-based resources for healthy living, or a wellness newsletter.1 The offer rate for each type of wellness benefit included in the survey is presented in Exhibit 12.1 and Exhibit 12.2. Forty-eight percent of firms offering health benefits and wellness benefits offer the wellness benefits to spouses or dependents (Exhibit 12.3).
The percentage of firms offering at least one wellness program increased from 58% in 2009 to 74% in 2010. However the increase was primarily the result of a higher percentage of firms reporting the availability of web-based resources for healthy living in 2010 (51%) than in 2009 (36%). The increase was also mainly driven by small firms. The percentage of small firms (3–199 workers) offering at least one wellness program increased from 57% in 2009 to 74% in 2010, while the percentage of large firms (200 or more workers) did not statistically increase.
Among firms offering health benefits and at least one wellness program, 87% of employers report that most of the wellness benefits they offer are provided through the health plan (Exhibit 12.3).2 There is a significant difference between small firms (3–199 workers) and large firms (200 or more workers) in the percentage reporting that most wellness programs are provided by the health plan (88% vs. 67%) (Exhibit 12.3).
�In order to encourage participation in wellness programs, firms may offer financial incentives to employees who participate.3
Eight percent of firms offering health benefits offer gift cards, travel, merchandise, or cash to workers who participate in wellness programs, and large firms (200 or more workers) are more likely to offer these incentives than small firms (3–199 workers) (23% vs. 7%) (Exhibit 12.4).
Very few firms offering health benefits vary premium contributions (1%) or deductibles (1%). Among firms that offer a high-deductible plan paired with a HRA or HSA, 2% of firms offer workers who participate in wellness programs higher HSA or HRA contributions than employees who do not participate (Exhibit 12.4).
1 respondents were given the option to report “other” types of wellness programs. if those firms that responded “other” are included, the percentage offering at least one wellness benefit is 76%.
2 the survey asks firms offering at least one wellness program if most of the wellness benefits are provided by the health plan or by the firm.
3 firms that offer only web-based resources or a wellness newsletter are not asked questions about any financial incentives provided.
n o T e s :

section
twelve
Wellness Program
s, Health R
isk Assessm
ents, and Disease M
anagement Program
s
12
Employer Health Benefits 2 0 1 0 An n u a l s u r vey
171
t h e k a i s e r fa m i ly f o u n d at i o n - a n d - h e a lt h r e s e a r C h & e d u C at i o n a l t r u s t
4 less than 1% of firms reported “don’t know” when asked their primary reason for offering wellness programs.5 seven percent of firms responded “don’t know” to whether they think offering wellness programs is effective in improving the
health of employees. six percent said “don’t know” to whether they think wellness programs are effective in reducing health care costs.
n o T e :
Although few firms offer financial incentives for wellness, large firms (200 or more workers) are more likely to offer financial incentives than small firms (3–199 workers) including a smaller share of the premium (10% vs. 1%) or, for those firms offering a high-deductible plan with a savings option, higher account contributions (7% vs. 1%) (Exhibit 12.4).
�Firms sometimes use methods such as health fairs or health claims that identify health risks to identify individuals and encourage participation in wellness programs.
Nine percent of firms offering health benefits and wellness programs use health fairs to identify individuals and encourage participation in wellness programs, down from 20% in 2009. About 8% of firms report the use of claims to identify individuals and encourage wellness participation, statistically similar to the 15% reported in 2009 (Exhibit 12.5).
Large firms (200 or more workers) are more likely than small firms (3–199 workers) to use health fairs or claims information to encourage wellness participation. Fifty-one percent of large firms (200 or more workers) offering health benefits and wellness benefits use health fairs to encourage participation in wellness programs, compared to 6% of small firms (3–199 workers). Thirty-seven percent of large firms offering health benefits and wellness benefits use claims to identify individuals and encourage participation in wellness, compared to 6% of small firms (Exhibit 12.5).
�Among firms offering health benefits and wellness programs, 20% of employers report their primary reason for offering wellness programs is to improve the health of employees and reduce absenteeism. Fifty-six percent of employers offering health benefits and wellness programs state their primary reason is that the benefits were part of the health plan. Large firms are more likely than small firms to
report that reducing health care costs (28% vs. 4%) or improving the health of employees and reducing absenteeism (34% vs. 19%) was a primary reason for offering wellness (Exhibit 12.6).4
�Among firms offering an HDHP/SO and wellness benefits, 8% report that their decision to offer a wellness program was related to their decision to offer a high-deductible health plan.
�Among firms offering health benefits and wellness programs, a majority (59%) of employers think offering wellness programs is effective in improving the health of the firm’s employees. Among those firms offering health coverage and wellness programs, 44% of employers think offering wellness programs is effective in reducing their firm’s health care costs. Large firms are more likely than small firms to think offering wellness programs is effective in improving health (81% vs. 57%) or in reducing health care costs (69% vs. 42%) (Exhibit 12.7).5
h e A lT h r i s k A s s e s s m e N T s
�Some firms give their employees the option of completing a health risk assessment to identify potential health risks. Health risk assessments generally include questions about medical history, health status, and lifestyle.
Overall, 11% of firms offering health benefits offer health risk assessments to their employees, which is statistically similar to the 16% reported last year. Fifty-five percent of large firms (200 or more workers) provide the option, compared to 10% of small firms (3–199 workers) (Exhibit 12.8).
Over half (53%) of firms that offer health risk assessments use them as a method to identify individuals and encourage their participation in wellness programs. Sixty-nine percent of large firms use health risk assessments to encourage participation in wellness programs, compared to 48% of small firms (Exhibit 12.8).

Employer Health Benefits 2 0 1 0 An n u a l s u r vey
section
twelve
Wellness Program
s, Health R
isk Assessm
ents, and Disease M
anagement Program
s
12
172
t h e k a i s e r fa m i ly f o u n d at i o n - a n d - h e a lt h r e s e a r C h & e d u C at i o n a l t r u s t
�Some firms offer financial incentives to encourage employees to complete health risk assessments.
Of those firms offering health insurance that offer health risk assessments, 22% offer a financial incentive to employees who complete a health risk assessment, with large firms (200 or more workers) more likely than small firms (3–199 workers) to do so (36% vs. 19%) (Exhibit 12.8).
The survey asked those firms that reported offering financial incentives about some specific types of incentives they may offer. Among firms that reported offering financial incentives to employees who complete a health risk assessment, 39% of firms reported that they offer gift cards, travel, merchandise, or cash; 14% of firms reported that employees pay a smaller share of the premium; 8% reported employees have a smaller deductible; and only 1% reported employees have a lower coinsurance rate (Exhibit 12.9). Twenty-nine percent of large firms offer a smaller share of the premium, compared to 8% of small firms (Exhibit 12.9).6
D i s e A s e m A N A g e m e N T
�Disease management programs try to improve the health of and reduce the costs associated with people with chronic illnesses by teaching patients about their disease, suggesting treatment options, and assessing the treatment process and outcomes.
The proportion of firms where the largest plan includes one or more disease management programs is 31% in 2010, similar to the 26% reported in 2008, the last time this question was asked. The percentage of large firms (200 or more workers) that include disease management in their plan with the largest enrollment increased from 59% in 2008 to 67% in 2010. Large firms (200 or more workers) are more likely than small firms (3–199 workers) to have a disease management program (67% vs. 30%). To encourage participation, 2% of firms offer financial incentives to employees who participate in disease management programs (Exhibit 12.10).
6 this year, we ask only those firms that offer financial incentives to employees who complete a health risk assessment if they provide gift cards, travel, merchandise, or cash, whereas in 2009, this question was asked of all firms offering health risk assessments, including those who responded that they did not offer financial incentives.
n o T e s :

section
twelve
Wellness Program
s, Health R
isk Assessm
ents, and Disease M
anagement Program
s
12
Employer Health Benefits 2 0 1 0 An n u a l s u r vey
173
t h e k a i s e r fa m i ly f o u n d at i o n - a n d - h e a lt h r e s e a r C h & e d u C at i o n a l t r u s t
e x h i B i t 12.1
among firms offering health Benefits, Percentage offering a Particular Wellness Program to their employees, by firm size, region, and industry, 2010
* estimate is statistically different within type of wellness program from estimate for all other firms not in the indicated size, region, or industry category (p<.05).
note: the offer rates for additional types of wellness programs are presented in exhibit 12.2.
kaiser/hret survey of employer-sponsored health Benefits, 2010.
s o u r c e :
Gym membership discounts or
on-site exercise facilities
smoking Cessation Program
Web-based resources for healthy
living
Wellness newsletter
Personal health
Coaching
firm size3–24 Workers 27% 19%* 49% 42% 8%*25–199 Workers 35 35* 52 46 20*200–999 Workers 59* 57* 78* 59* 40*1,000–4,999 Workers 71* 66* 84* 58* 44*5,000 or more Workers 77* 76* 92* 64* 56*
All small firms (3–199 Workers) 29%* 23%* 49%* 43%* 11%*All large firms (200 or more Workers) 63%* 60%* 80%* 60%* 42%*
regioNnortheast 58%* 46%* 56% 62%* 11%midwest 29 22 46 27* 16south 22 14* 59 44 10West 15* 19 37 40 12
iNDusTryagriculture/mining/Construction 5%* 8%* 37% 28% 6%manufacturing 30 34 59 38 20transportation/Communications/utilities 33 30 73 29 23Wholesale 38 29 43 47 18retail 5* 10* 17* 12* 6finance 27 24 49 71* 28service 39 24 52 46 10state/local Government 14 12 86* 81* 7health Care 39 45 70 65 7
All firms 30% 24% 51% 44% 12%

section
twelve
Wellness Program
s, Health R
isk Assessm
ents, and Disease M
anagement Program
s
12
Employer Health Benefits 2 0 1 0 An n u a l s u r vey
174
t h e k a i s e r fa m i ly f o u n d at i o n - a n d - h e a lt h r e s e a r C h & e d u C at i o n a l t r u s t
e x h i B i t 12.2
among firms offering health Benefits, Percentage offering a Particular Wellness Program to their employees, by firm size, region, and industry, 2010
* estimate is statistically different within type of wellness program from estimate for all other firms not in the indicated size, region, or industry category (p<.05).
‡ includes the following wellness programs: weight loss programs, gym membership discounts or on-site exercise facilities, smoking cessation programs, personal health coaching, classes in nutrition or healthy living, web-based resources for healthy living, or a wellness newsletter. respondents were given the option to reply that they offer another type of wellness benefit. if those that responded “other” are included in the percentage of firms offering at least one wellness benefit, the percentage is 76%.
note: the offer rates for additional types of wellness programs are presented in exhibit 12.1.
kaiser/hret survey of employer-sponsored health Benefits, 2010.
s o u r c e :
Weight loss Programs
Classes in nutrition/
healthy living
offer at least one specified
Wellness Program‡
other Wellness Program
firm size3–24 Workers 27% 22% 74% 5%*25–199 Workers 33 24 72 20*200–999 Workers 49* 44* 91* 29*1,000–4,999 Workers 61* 52* 96* 36*5,000 or more Workers 66* 57* 98* 47*
All small firms (3–199 Workers) 29%* 23%* 74%* 8%*All large firms (200 or more Workers) 53%* 47%* 92%* 32%*
regioNnortheast 50%* 38% 78% 14%midwest 18 27 69 6south 20 13* 82 7West 33 22 65 7
iNDusTryagriculture/mining/Construction 10%* 6%* 55% 19%manufacturing 26 23 76 12transportation/Communications/utilities 28 26 91* 8Wholesale 36 27 65 8retail 32 31 68 3*finance 27 30 90* 16service 31 22 75 5state/local Government 10* 7* 93* 8health Care 45 43 86 11
All firms 29% 24% 74% 9%

section
twelve
Wellness Program
s, Health R
isk Assessm
ents, and Disease M
anagement Program
s
12
Employer Health Benefits 2 0 1 0 An n u a l s u r vey
175
t h e k a i s e r fa m i ly f o u n d at i o n - a n d - h e a lt h r e s e a r C h & e d u C at i o n a l t r u s t
e x h i B i t 12.3
among firms offering health Benefits, Percentage of firms with the following features of Wellness Benefits, by firm size and region, 2010
* estimate is statistically different from estimate for all other firms not in the indicated size or region (p<.05).
note: the survey asks firms offering at least one wellness program if most of the wellness benefits are provided by the health plan or by the firm.
kaiser/hret survey of employer-sponsored health Benefits, 2010.
s o u r c e :
Wellness Benefits offered to spouses or dependents
most Wellness Benefits are Provided By the health Plan
firm size3–24 Workers 45% 89%25–199 Workers 56 86200–999 Workers 66* 69*1,000–4,999 Workers 67* 65*5,000 or more Workers 79* 57*
All small firms (3–199 Workers) 47%* 88%*All large firms (200 or more Workers) 68%* 67%*
regioNnortheast 52% 95%midwest 42 78south 53 83West 40 94
All firms 48% 87%

section
twelve
Wellness Program
s, Health R
isk Assessm
ents, and Disease M
anagement Program
s
12
Employer Health Benefits 2 0 1 0 An n u a l s u r vey
176
t h e k a i s e r fa m i ly f o u n d at i o n - a n d - h e a lt h r e s e a r C h & e d u C at i o n a l t r u s t
e x h i B i t 12.4
among firms offering health and Wellness Benefits, Percentage of firms that offer specific incentives to employees Who Participate in Wellness Programs, by firm size and region, 2010
* estimate is statistically different within type of incentive from estimate for all other firms not in the indicated size or region (p<.05).‡ only firms that offer an hdhP/hra or hsa-qualified hdhP were asked if participating employees receive higher contributions as an
incentive to participate in wellness programs.
nsd: not sufficient data.
kaiser/hret survey of employer-sponsored health Benefits, 2010.
s o u r c e :
Workers Pay smaller Percentage
of the Premium
Workers have smaller deductible
Workers receive higher
hra or hsa Contributions‡
Workers receive Gift
Cards, travel, merchandise,
or Cash
firm size3–24 Workers 0%* 1% nsd 5%*25–199 Workers 2 0 2% 16*200–999 Workers 8* 2 5 21*1,000–4,999 Workers 15* 4* 5 27*5,000 or more Workers 13* 2 16* 28*
All small firms (3–199 Workers) 1%* <1%* 1%* 7%*All large firms (200 or more Workers) 10%* 2%* 7%* 23%*
regioNnortheast <1%* 1% 1% 9%midwest 2 <1 2 8south 1 1 5 9West 1 <1 <1* 7
All firms 1% 1% 2% 8%

section
twelve
Wellness Program
s, Health R
isk Assessm
ents, and Disease M
anagement Program
s
12
Employer Health Benefits 2 0 1 0 An n u a l s u r vey
177
t h e k a i s e r fa m i ly f o u n d at i o n - a n d - h e a lt h r e s e a r C h & e d u C at i o n a l t r u s t
e x h i B i t 12.5
among firms offering health Benefits and Wellness Programs, Percentage that use specific methods to identify individuals and encourage Participation in Wellness Programs, by firm size, region, and industry, 2010
* estimate is statistically different from all firms not in the indicated size, region, or industry category (p<.05). ‡ a firm’s use of health risk assessments to encourage participation in wellness is asked only of firms who offer employees the
option to take a health risk assessment. a health risk assessment includes questions about medical history, health status, and lifestyle, and is designed to identify the health risks of the person being assessed.
nsd: not sufficient data.
kaiser/hret survey of employer-sponsored health Benefits, 2010.
s o u r c e :
health fairsuse of Claims
to identify health risks
health risk assessments‡
firm size3–24 Workers 3%* 4%* nsd25–199 Workers 13 12 49%200–999 Workers 48* 30* 671,000–4,999 Workers 52* 47* 675,000 or more Workers 66* 59* 80*
All small firms (3–199 Workers) 6%* 6%* 48%*All large firms (200 or more Workers) 51%* 37%* 69%*
regioNnortheast 8% 5% 64%midwest 6 15 55south 11 8 52West 9 6 44
iNDusTryagriculture/mining/Construction 3%* 7% nsdmanufacturing 10 9 62%transportation/Communications/utilities 24 13 45Wholesale 6 28 38retail 2* 2* 31finance 11 20 41service 8 5 61state/local Government 27* 15 52health Care 11 5 71
All firms 9% 8% 53%

section
twelve
Wellness Program
s, Health R
isk Assessm
ents, and Disease M
anagement Program
s
12
Employer Health Benefits 2 0 1 0 An n u a l s u r vey
178
t h e k a i s e r fa m i ly f o u n d at i o n - a n d - h e a lt h r e s e a r C h & e d u C at i o n a l t r u s t
IMPROVE THE HEALTHOF EMPLOYEES/REDUCE
ABSENTEEISM*
REDUCE HEALTH CARE COSTS*
IMPROVE EMPLOYEEMORALE AND
PRODUCTIVITY
PART OF THE HEALTHPLAN*
OTHER*0%
10%
20%
30%
40%
50%
60%
70%
80%
90%
100%
19%
34%
20%
4%
28%
6%11%
5%10%
59%
19%
56%
6%13%
6%
ALL SMALL FIRMS (3–199 WORKERS)
ALL LARGE FIRMS (200 OR MORE WORKERS)
ALL FIRMS
e x h i B i t 12.6
among firms offering health Benefits and Wellness Programs, Percentage of firms reporting the following as the firm’s Primary reason for offering Wellness Programs, by firm size, 2010
e x h i B i t 12.7
among firms offering health Benefits and Wellness Programs, Percentage of firms that think offering Wellness Programs is effective at improving health or reducing Costs, 2010
* estimate is statistically different from estimate for all other firms not in the indicated size category (p<.05).
note: seven percent of firms responded “don’t know” to whether they think offering wellness programs is effective in improving the health of employees. six percent said “don’t know” to whether they think wellness programs are effective in reducing the firm’s health care costs.
kaiser/hret survey of employer-sponsored health Benefits, 2010.
s o u r c e :
effective in improving the health of employees
effective in reducing the firm's health Care Costs
firm size3–24 Workers 53% 37%*25–199 Workers 70 57200–999 Workers 81* 70*1,000–4,999 Workers 79* 65*5,000 or more Workers 79* 74*
All small firms (3–199 Workers) 57%* 42%*All large firms (200 or more Workers) 81%* 69%*
All firms 59% 44%
* estimate is statistically different between all small firms and all large firms within category (p<.05).
note: less than 1% percent of firms reported “don’t know” to the question about their primary reason for offering wellness.
kaiser/hret survey of employer-sponsored health Benefits, 2010.
s o u r c e :

section
twelve
Wellness Program
s, Health R
isk Assessm
ents, and Disease M
anagement Program
s
12
Employer Health Benefits 2 0 1 0 An n u a l s u r vey
179
t h e k a i s e r fa m i ly f o u n d at i o n - a n d - h e a lt h r e s e a r C h & e d u C at i o n a l t r u s t
e x h i B i t 12.8
among firms o ffer ing health Benef its, Percentage of fi rms that o ffer employees health r isk assessments, o ffer incentives to Complete assessments, and use assessments to increase Wel lness Par t ic ipat ion, by firm size and region, 2010
* estimate is statistically different from estimate for all other firms not in the indicated size or region (p<.05).‡ among firms offering employees the option to complete a health risk assessment.
note: a health risk assessment includes questions about medical history, health status, and lifestyle, and is designed to identify the health risks of the person being assessed.
nsd: not sufficient data.
kaiser/hret survey of employer-sponsored health Benefits, 2010.
s o u r c e :
offer employees option to
Complete health risk assessment
offer financial incentives to
employees Who Complete
an assessment‡
use health risk assessments to
increase Wellness Participation‡
firm size3–24 Workers 6%* nsd nsd25–199 Workers 23* 17% 49%200–999 Workers 50* 30 671,000–4,999 Workers 60* 44* 675,000 or more Workers 79* 49* 80*
All small firms (3–199 Workers) 10%* 19%* 48%*All large firms (200 or more Workers) 55%* 36%* 69%*
regioNnortheast 11% 35% 64%midwest 7 33 55south 15 15 52West 11 16 44
All firms 11% 22% 53%

section
twelve
Wellness Program
s, Health R
isk Assessm
ents, and Disease M
anagement Program
s
12
Employer Health Benefits 2 0 1 0 An n u a l s u r vey
180
t h e k a i s e r fa m i ly f o u n d at i o n - a n d - h e a lt h r e s e a r C h & e d u C at i o n a l t r u s t
e x h i B i t 12.9
among firms offering financial incentives for health risk assessments, Percentage of firms that offer the following incentives to Complete assessments, by firm size and region, 2010
* estimate is statistically different from estimate for all other firms not in the indicated size or region (p<.05).
note: a health risk assessment includes questions about medical history, health status, and lifestyle, and is designed to identify the health risks of the person being assessed.
kaiser/hret survey of employer-sponsored health Benefits, 2010.
s o u r c e :
Workers Pay smaller
Percentage of the Premium
Workers have smaller deductible
Workers have lower Coinsurance
Workers receive Gift Cards, travel,
merchandise, or Cash
firm size
200–999 Workers 19% 10% 8% 59%1,000–4,999 Workers 39* 7 2 495,000 or more Workers 41* 6 2 48
All small firms (3–199 Workers) 8%* 7% 0% 33%All large firms (200 or more Workers) 29%* 8% 5% 54%
regioNnortheast 6% 2% 2% 17%*midwest 38* 4 3 49south 12 20 <1 46West 5 1 0 62
All firms 14% 8% 1% 39%
e x h i B i t 12.10
among firms offering health Benefits, Percentage of firms that offer a disease management Program for their Plan with the largest enrollment and Percentage of firms with disease management offering financial incentives to Participate, by firm size, 2010
0%
10%
20%
30%
40%
50%
60%
70%
80%
90%
100%
30%
67%
31%
1%7% 2%
PLAN INCLUDES A DISEASE MANAGEMENT PROGRAM*
FIRM OFFERS FINANCIAL INCENTIVES TO PARTICIPATE IN A DISEASE MANAGEMENT PROGRAM*‡
ALL SMALL FIRMS (3–199 WORKERS)
ALL LARGE FIRMS (200 OR MORE WORKERS)
ALL FIRMS* estimate is statistically different between all small firms and all large firms within
category (p<.05).‡ among firms offering health benefits that offer a disease management program for
their plan with the largest enrollment.
kaiser/hret survey of employer-sponsored health Benefits, 2010.
s o u r c e :

section
twelve
Wellness Program
s, Health R
isk Assessm
ents, and Disease M
anagement Program
s
12
Employer Health Benefits 2 0 1 0 An n u a l s u r vey
181
t h e k a i s e r fa m i ly f o u n d at i o n - a n d - h e a lt h r e s e a r C h & e d u C at i o n a l t r u s t
e x h i B i t 12.11
among firms offering health Benefits that have a disease management Program for their Plan with the largest enrollment, Percentage with a Particular Program, by firm size, region, and industry, 2010
* estimate is statistically different from all firms not in the indicated size, region, or industry category (p<.05).
note: the offer rates for additional types of disease management programs are presented in exhibit 12.12. the survey defines disease management programs as programs that try to improve the health of and reduce the costs associated with people with chronic illnesses by teaching patients about such illnesses, suggesting treatment options, and assessing treatment processes and outcomes.
kaiser/hret survey of employer-sponsored health Benefits, 2010.
s o u r c e :
diabetes asthma hypertension high Cholesterol
firm sizeall small firms (3–199 Workers) 100%* 92% 88% 83%all large firms (200 or more Workers) 98%* 89% 90% 83%
regioNnortheast 100% 98% 96% 89%midwest 100 93 92 87south 100 84 74 72West 100 94 96 88
iNDusTryagriculture/mining/Construction 100% 97% 54% 57%manufacturing 100 95 89 90transportation/Communications/ utilities
100 83 93 80
Wholesale 100 98 96 94retail 100 98 98* 76finance 100 99 91 73service 100 95 95 92state/local Government 100 34* 31* 30*health Care 100 99 98* 96*
All firms 100% 92% 88% 83%

section
twelve
Wellness Program
s, Health R
isk Assessm
ents, and Disease M
anagement Program
s
12
Employer Health Benefits 2 0 1 0 An n u a l s u r vey
182
t h e k a i s e r fa m i ly f o u n d at i o n - a n d - h e a lt h r e s e a r C h & e d u C at i o n a l t r u s t
e x h i B i t 12.12
among firms o ffer ing health Benef its that have a disease management Program for their Plan with the largest enrol lment, Percentage with a Par t icular Program, by firm size, region, and industr y, 2010
* estimate is statistically different from all firms not in the indicated size, region, or industry category (p<.05).
note: the offer rates for additional types of disease management programs are presented in exhibit 12.11. the survey defines disease management programs as programs that try to improve the health of and reduce the costs associated with people with chronic illnesses by teaching patients about such illnesses, suggesting treatment options, and assessing treatment processes and outcomes. the imputation rates for questions on lower back pain and depression disease management programs are high, at 27% and 21%, respectively. see the survey design and methods section for more information on imputation.
kaiser/hret survey of employer-sponsored health Benefits, 2010.
s o u r c e :
lower Back Pain depression obesity
firm sizeall small firms (3–199 Workers) 46% 68% 70%all large firms (200 or more Workers) 48% 59% 63%
regioNnortheast 49% 75% 83%midwest 63 66 77south 31 67 48*West 54 55 71
iNDusTryagriculture/mining/Construction 24% 38% 47%manufacturing 22* 69 75transportation/Communications/utilities 16* 79 18*Wholesale 71 36* 79retail 82* 38 52finance 55 62 68service 67* 80 83state/local Government 29 31 28health Care 24 90* 91*
All firms 46% 68% 69%

69%$13,7
70
$5,0
49
2010
Employer Health Benefits2 0 1 0 a n n u a l s u r V e y
s ect ion
Employer Opinions and Health Plan
Practices
13

Employer Health Benefits 2 0 1 0 An n u a l s u r vey
Em
ployer Opinions and H
ealth Plan Practicessectio
n th
irteen
13
184
t h e k a i s e r fa m i ly f o u n d at i o n - a n d - h e a lt h r e s e a r C h & e d u C at i o n a l t r u s t
e M p l o y e r o p i n i o n S a n D h e a l t h p l a n p r a C t i C e S
employers play a significanT role in healTh insurance coverage—sponsoring healTh benefiTs for abouT
157 million nonelderly people in america1—so Their opinions and experiences are imporTanT facTors
in healTh policy discussions. employers were asked how They view differenT approaches To conTaining
cosT increases and abouT employer healTh plan pracTices, such as changes in response To The menTal
healTh pariTy and addicTion equiTy acT, review of qualiTy indicaTors, and wheTher They shopped for (or
swiTched To) a new healTh plan.
e m p l o y e r o p i N i o N s o N C o s T C o N TA i N m e N T
�All firms, including those that offer and do not offer health benefits, were asked to rate how effective several different strategies would be in reducing the growth of health insurance costs. Few firms rate any of the suggested strategies as “very effective” at controlling costs (between 13% and 25% of firms, depending on the strategy). About one-third of firms (between 30% and 36%) report that each of the approaches we asked about would be “somewhat effective” at controlling cost growth (Exhibit 13.1).
About a quarter of employers rate consumer-driven health plans (25%) or disease management (24%) as “very effective” in controlling the cost of health insurance (Exhibit 13.1). Fewer employers report that higher employee cost sharing (13%), or tighter managed care restrictions (16%) would be “very effective” in reducing the growth of health care costs. Small firms (3–199 workers) are more likely to say tighter managed care restrictions would be “very effective” than large firms (200 or more workers) (16% vs. 9%).
e m p l o y e r ’ s r e s p o N s e T o T h e e C o N o m i C
D o W N T u r N
�To gauge employer responses to the economic downturn, a couple of questions were included in this year’s survey about whether employers have reduced their health benefits or increased cost sharing due to the downturn.
Thirty percent of employers report reducing the scope of health benefits or increasing cost sharing and 23% report increasing the share of the premium employees pay for coverage in response to the economic downturn. In 2010, compared to 2009, more large firms report reducing the scope of health benefits or increasing cost sharing (38% in 2010 vs. 22% in 2009), or increasing the amount employees pay for coverage (36% in 2010 vs. 22% in 2009). More large firms than small firms report increasing the share of the premium that the employee pays (36% vs. 22%) (Exhibit 13.2).
For the first time, the survey asked firms if they downsized during the recent economic downturn. Among firms offering benefits, 42% of firms report downsizing, with large firms being more likely to downsize than small firms (53% vs. 42%) (Exhibit 13.2).
m A r k e T T u r N o v e r
�We asked firms that offer health insurance if they have shopped for a new insurance carrier or a new health plan in the past year.
Sixty percent of firms that offer health insurance shopped for a new health plan or insurance carrier in the past year (Exhibit 13.3). Among those firms that shopped in the past year, 27% changed their insurance carrier and 33% changed the type of health plan (Exhibit 13.4).
1 kaiser family foundation, kaiser Commission on medicaid and the uninsured, the uninsured: a Primer, october 2009.
n o T e :

Employer Health Benefits 2 0 1 0 An n u a l s u r veyE
mployer O
pinions and Health Plan Practices
section
thirteen
13
185
t h e k a i s e r fa m i ly f o u n d at i o n - a n d - h e a lt h r e s e a r C h & e d u C at i o n a l t r u s t
2 for more information on the mental health Parity and addiction equity act of 2008, see https://www.cms.gov/healthinsreformforconsume/04_thementalhealthparityact.asp.
n o T e :
e N r o l l m e N T i N C e N T i v e s
�This year we asked firms offering workers more than one health plan whether they offered financial incentives for workers to select lower cost or higher quality plans.
Fourteen percent of employers reported offering workers a financial incentive to enroll in a lower cost health plan and 2% percent reported offering workers a financial incentive to enroll in higher quality health plans. There are no statistical differences between small and large firms (Exhibit 13.5).
h i g h p e r f o r m A N C e N e T W o r k s
�A high performance network is one that groups providers into the network based on quality, cost, and/or the efficiency of the care they deliver. These networks encourage patients to visit the most efficient doctors by either restricting networks to efficient providers, or by having different copayments or coinsurance for providers in different tiers in the network.
Sixteen percent of firms include a high performance or tiered provider network in the health plan with the largest enrollment. The difference between small firms (3–199 workers) and large firms (200 or more workers) is not statistically significant (Exhibit 13.6).
r e TA i l h e A lT h C l i N i C s
�For the first time, the survey asked about the coverage for care received at a retail health clinic. A retail clinic is a health care clinic located in retail stores, supermarkets, and pharmacies that treats minor illnesses and provides preventive health care services.
Forty-three percent of firms report that care received at a retail clinic is covered by their plan with the largest enrollment (Exhibit 13.6). Among those firms reporting their largest health plan covers care received at a retail clinic, 5% responded that workers have a financial incentive such as lower cost sharing to visit a retail clinic instead of a traditional physician’s office. Large firms (200 or more workers) are more likely to report that workers have a financial incentive to use retail health clinics than small firms (3–199 workers) (16% vs. 4%).
m e N TA l h e A lT h pA r i T y
�In 2008 the Mental Health Parity and Addiction Equity Act modified the 1996 Mental Health Parity Act to eliminate limits specific to mental health or substance abuse treatment and require cost sharing to be the same for mental health and substance abuse treatments as for other types of health care.2 As a result of this change in law, we asked firms with more than 50 workers if they changed the mental health benefits they offer as a result of the Mental Health Parity and Addiction Equity Act.
Thirty-one percent of firms made changes in the mental health benefits they offer as a result of the Mental Health Parity and Addiction Equity Act. (Exhibit 13.7). Large firms were more likely to make changes than small firms (51-199 workers) (43% vs. 26%).
Among those firms who made changes, 66% eliminated limits on coverage, 16% increased utilization management of mental health benefits, and 5% dropped mental health coverage. In addition, 23% of firms said they made some other sort of change to their mental health coverage as a result of the Act (Exhibit 13.7).

Employer Health Benefits 2 0 1 0 An n u a l s u r vey
Em
ployer Opinions and H
ealth Plan Practicessectio
n th
irteen
13
186
t h e k a i s e r fa m i ly f o u n d at i o n - a n d - h e a lt h r e s e a r C h & e d u C at i o n a l t r u s t
p e r f o r m A N C e i N D i C AT o r s
�The survey asked employers if they review performance indicators for their health plan’s service or clinical quality.
Overall, 6% of employers review performance indicators for their health plan’s service or clinical quality. Large firms (200 or more workers) are more likely to review performance indicators than small firms (3–199 workers) (34% vs. 5%) (Exhibit 13.8).
Large firms that review performance indicators report reviewing the following types of information: hospital outcomes data (76%), NCQA accreditation (58%), CAHPS or another measure of consumer satisfaction (57%), HEDIS measures (33%), and URAC accreditation (23%) (Exhibit 13.8).
When those firms that review performance measures were asked how influential the performance measures were to the firm’s decision to select their health plan or plans, 16% said “very influential” and 34% said “somewhat influential.” In terms of satisfaction, 18% of firms said they are “very satisfied” with the level of information available on health plan quality, and an additional 56% said “somewhat satisfied” (Exhibit 13.9).
TA x - p r e f e r r e D h e A lT h s p e N D i N g
�Fifty-five percent of firms that offer health benefits allow employees to use pre-tax dollars to pay for health insurance premiums as allowable under Section 125 of the Internal Revenue Code. Virtually all large firms (200 or more workers) do so, at 92%, versus 54% of small firms (3–199 workers) (Exhibit 13.10).3
�Eighteen percent of firms that offer health benefits offer a flexible spending account (FSA). A FSA allows employees to set aside funds on a pre-tax basis to pay for medical expenses not covered by health insurance. Typically, employees decide at the beginning of the year how much to set aside in a FSA, and their employer deducts that amount from the employee’s paycheck over the year. Funds set aside in a FSA must be used by the end of the year
or are forfeited by the employee. FSAs are different from HRAs and HSAs. Substantial differences exist by firm size: 77% of large firms (200 or more workers) offer FSAs, compared with just 15% of small firms (3–199 workers) (Exhibit 13.10).
A N N u A l b e N e f i T m A x i m u m s
�Few covered workers are in plans with an annual limit on the amount of benefits a plan will pay for an employee.
Overall, 12% of covered workers are in plans with an annual maximum on benefits for single coverage (Exhibit 13.11).
By plan type, 20% of covered workers in HDHP/SOs, 12% of covered workers in PPOs, 4% of covered workers in HMOs, and 9% of covered workers in POS plans have an annual benefit maximum for single coverage (Exhibit 13.11).
C o N T r A C e p T i v e A N D e l e C T i v e
A b o r T i o N C o v e r A g e
�The 2010 survey included questions about coverage for prescription contraceptives and elective abortions.
The majority of firms (63%) report that their plan with the largest enrollment covers prescription contraceptives, such as birth control pills, patches, implants, shots, IUDs, or diaphragms. However, an additional 31% responded “Don’t Know” (Exhibit 13.12). More large firms report that their largest plan covers prescription contraceptives than small firms (85% vs. 62%). Large firms were also less likely to say “Don’t Know” when asked whether their largest plan covers prescription contraceptives than small firms (4% vs. 32%).
The majority of firms (71%) responded “Don’t Know” to a question on whether the plan with the largest enrollment covers elective abortions, while an additional 9% said that elective abortions are covered (Exhibit 13.12). Large firms are more likely than small firms to report that their largest plan covers elective abortions (19% vs. 9%) and are less likely to say “Don’t Know” (31% vs. 72%).
3 fifteen percent of firms responded “not applicable;” for example, the firm pays for 100% of the cost of coverage.
n o T e :

Em
ployer Opinions and H
ealth Plan PracticesEmployer Health Benefits 2 0 1 0 An n u a l s u r vey
187
t h e k a i s e r fa m i ly f o u n d at i o n - a n d - h e a lt h r e s e a r C h & e d u C at i o n a l t r u s t
section
thirteen
13
e x h i B i t 13.1
among Both firms offering and not offering health Benefits, distribution of firms’ opinions on the effectiveness of the following strategies to Contain health insurance Costs, by firm size, 2010
* distributions are statistically different between all small firms and all large firms within category (p<.05).
kaiser/hret survey of employer-sponsored health Benefits, 2010.
s o u r c e :
Very effective
somewhat effective
not too effective
not at all effective
don’t know
Tighter managed Care restrictions*all small firms (3–199 Workers) 16% 32% 23% 21% 8%all large firms (200 or more Workers) 9% 34% 35% 18% 4%
All firms 16% 32% 24% 21% 8%
Consumer-Driven health plans (ex: high-Deductible plan Combined with a health savings Account)
all small firms (3–199 Workers) 25% 34% 18% 17% 6%all large firms (200 or more Workers) 21% 38% 22% 16% 3%
All firms 25% 34% 18% 17% 6%
higher employee Cost sharingall small firms (3–199 Workers) 13% 30% 25% 27% 5%all large firms (200 or more Workers) 18% 36% 26% 18% 2%
All firms 13% 30% 25% 27% 5%
Disease management programs*all small firms (3–199 Workers) 23% 36% 14% 22% 5%all large firms (200 or more Workers) 31% 40% 21% 6% 3%
All firms 24% 36% 14% 21% 5%

Em
ployer Opinions and H
ealth Plan Practices
Employer Health Benefits 2 0 1 0 An n u a l s u r vey
188
t h e k a i s e r fa m i ly f o u n d at i o n - a n d - h e a lt h r e s e a r C h & e d u C at i o n a l t r u s t
section
thirteen
13
e x h i B i t 13.2
among firms offering health Benefits, Percentage of firms that report they made the following Changes as a result of the economic downturn, by firm size and region, 2010
* estimate is statistically different from estimate for all other firms not in the indicated size or region (p<.05).
kaiser/hret survey of employer-sponsored health Benefits, 2010.
s o u r c e :
reduced scope of health Benefits or increased Cost
sharing
increased the Worker's share
of the Premium
Company downsized
firm size200–999 Workers 36% 35%* 50%1,000–4,999 Workers 42* 38* 59*5,000 or more Workers 42 43* 62*
All small firms (3–199 Workers) 30% 22%* 42%*All large firms (200 or more Workers) 38% 36%* 53%*
regioNnortheast 36% 26% 40%midwest 32 13* 48south 28 34 44West 26 14 36
All firms 30% 23% 42%

Em
ployer Opinions and H
ealth Plan PracticesEmployer Health Benefits 2 0 1 0 An n u a l s u r vey
189
t h e k a i s e r fa m i ly f o u n d at i o n - a n d - h e a lt h r e s e a r C h & e d u C at i o n a l t r u s t
section
thirteen
13
e x h i B i t 13.3
Percentage of firms offering health Benefits that shopped for a new Plan or health insurance Carrier in the Past year, by firm size, 2010
3–199WORKERS
200–999WORKERS
1,000–4,999WORKERS*
5,000 ORMORE
WORKERS*
ALL FIRMS0%
20%
40%
60%
80%
100%
60%56%
40% 38%
60%
* estimate is statistically different within category from estimate for firms not in the indicated size category (p<.05).
kaiser/hret survey of employer-sponsored health Benefits, 2010.
s o u r c e :

Em
ployer Opinions and H
ealth Plan Practices
Employer Health Benefits 2 0 1 0 An n u a l s u r vey
190
t h e k a i s e r fa m i ly f o u n d at i o n - a n d - h e a lt h r e s e a r C h & e d u C at i o n a l t r u s t
section
thirteen
13
0%
5%
10%
15%
20%
25%
30%
35%
40%
45%
50%
CHANGED INSURANCE CARRIER CHANGED HEALTH PLAN TYPE
3–199 WORKERS
200–999 WORKERS
1,000–4,999 WORKERS
5,000 OR MORE WORKERS
ALL FIRMS
28%
33%
22%
34%
27%
34%
21%
28%
33%
18%*
e x h i B i t 13.4
among firms offering health Benefits that shopped for a new Plan or insurance Carrier, Percentage reporting that they Changed insurance Carrier and/or health Plan type in the Past year, by firm size, 2010
* estimate is statistically different within category from estimate for firms not in the indicated size category (p<.05).
kaiser/hret survey of employer-sponsored health Benefits, 2010.
s o u r c e :

Em
ployer Opinions and H
ealth Plan PracticesEmployer Health Benefits 2 0 1 0 An n u a l s u r vey
191
t h e k a i s e r fa m i ly f o u n d at i o n - a n d - h e a lt h r e s e a r C h & e d u C at i o n a l t r u s t
section
thirteen
13
e x h i B i t 13.5
among firms offering more than one health Plan, Percentage of firms that offer financial incentives for enrolling in a lower Cost Plan or higher Quality Plan, By firm size, 2010*
0%
10%
20%
30%
40%
50%
60%
70%
80%
90%
100%
OFFER EMPLOYEES INCENTIVE TO ENROLL IN A LOWER COST PLAN OFFER EMPLOYEES INCENTIVE TO ENROLL IN A HIGHER QUALITY PLAN
ALL SMALL FIRMS (3–199 WORKERS)
ALL LARGE FIRMS (200 OR MORE WORKERS)
ALL FIRMS
14%20%
14%
2% 2%3%
* tests found no statistical difference between all small firms and all large firms within category (p<.05).
kaiser/hret survey of employer-sponsored health Benefits, 2010.
s o u r c e :

Em
ployer Opinions and H
ealth Plan Practices
Employer Health Benefits 2 0 1 0 An n u a l s u r vey
192
t h e k a i s e r fa m i ly f o u n d at i o n - a n d - h e a lt h r e s e a r C h & e d u C at i o n a l t r u s t
section
thirteen
13
0%
10%
20%
30%
40%
50%
60%
70%
80%
90%
100%
HIGHER PERFORMANCE NETWORK/TIERED NETWORK COVER CARE RECEIVED AT A RETAIL CLINIC FINANCIAL INCENTIVE TO USE RETAIL CLINICS*‡
ALL SMALL FIRMS (3–199 WORKERS)
ALL LARGE FIRMS (200 OR MORE WORKERS)
ALL FIRMS
16% 18% 16%
43%48%
43%
4%
16%
5%
e x h i B i t 13.6
among firms o ffer ing health Benef its, Percentage of fi rms with specif ic Plan o ffer ings and features in their Plan with the largest enrol lment, By firm size, 2010
* estimate is statistically different between all small firms and all large firms within category (p<.05).
‡ among firms where their plan with the largest enrollment covers care received at a retail clinic.
note: a high performance network is one that groups providers into the network based on quality, cost, and/or the efficiency of the care they deliver. these networks encourage patients to visit the most efficient doctors by either restricting networks to efficient providers, or by having different copayments or coinsurance for providers in different tiers in the network.
kaiser/hret survey of employer-sponsored health Benefits, 2010.
s o u r c e :

Em
ployer Opinions and H
ealth Plan PracticesEmployer Health Benefits 2 0 1 0 An n u a l s u r vey
193
t h e k a i s e r fa m i ly f o u n d at i o n - a n d - h e a lt h r e s e a r C h & e d u C at i o n a l t r u s t
section
thirteen
13
e x h i B i t 13.7
Percentage of employers reporting the following as a result of the mental health Parity and addiction equity act of 2008, by firm size and region, 2010
Changed mental health
Benefits
eliminated limits on
Coverage‡
dropped mental health
Coverage‡
increased utilization
management of mental
health Benefits‡
other‡
firm size51–199 Workers 26%* 61% 7% 18% 20%200–999 Workers 35 70 4 13 301,000–4,999 Workers 58* 79* 1 15 245,000 or more Workers 71* 85* 1 11 16
All small firms (51–199 Workers) 26%* 61% 7% 18% 20%All large firms (200 or more Workers) 43%* 75% 2% 13% 26%
regioNnortheast 21%* 68% <1% 11% 30%midwest 35 77 1 8 19south 36 68 1 27* 20West 29 51 18 11 26
All firms (51 or more Workers) 31% 66% 5% 16% 23%
* estimate is statistically different from estimate for all other firms not in the indicated size or region (p<.05).‡ among firms reporting they made changes to the mental health benefits they offer as a result of the mental
health Parity and addiction equity act of 2008.
note: asked of firms with more than 50 workers.
kaiser/hret survey of employer-sponsored health Benefits, 2010.
s o u r c e :

Em
ployer Opinions and H
ealth Plan Practices
Employer Health Benefits 2 0 1 0 An n u a l s u r vey
194
t h e k a i s e r fa m i ly f o u n d at i o n - a n d - h e a lt h r e s e a r C h & e d u C at i o n a l t r u s t
section
thirteen
13
e x h i B i t 13.8
Percentage of firms that review health Plan Per formance indicators, by firm size, 2010
e x h i B i t 13.9
among firms reporting that they review health Plan Per formance indicators, distribution of firms’ opinions on the influence of and satisfaction with the indicators, by firm size, 2010*
all small firms (3-199 workers)
all large firms (200 or more
Workers)All firms
reviews performance indicators* 5% 34% 6%
Type of performance indicator reviewedhedis measures* 15% 33% 18%CahPs or another measure of Consumer satisfaction* 83% 57% 77%nCQa accreditation* 31% 58% 36%uraC accreditation* 12% 23% 15%hospital outcomes data* 57% 76% 61%other 18% 19% 19%
performance measures’ influence on Decision to select the health plan or plans
Very influential
somewhat influential
not too influential
not at all influential
don’t know
all small firms (3–199 Workers) 16% 32% 30% 17% 5%all large firms (200 or more Workers) 15% 39% 30% 10% 5%
All firms 16% 34% 30% 16% 5%
level of satisfaction with information Available on health plan Quality
Very satisfied
somewhat satisfied
not too satisfied
not at all satisfied
don't know
all small firms (3–199 Workers) 19% 57% 13% 7% 4%all large firms (200 or more Workers) 16% 49% 28% 6% 1%
All firms 18% 56% 16% 7% 3%
* estimate is statistically different between all small firms and all large firms within category (p<.05).
note: the performance indicators are defined as follows: hedis is the healthcare effectiveness data and information set, CahPs is the Consumer assessment of healthcare Providers and systems, nCQa is the national Committee for Quality assurance, uraC is an accreditation and certification organization for health care organizations.
kaiser/hret survey of employer-sponsored health Benefits, 2010.
s o u r c e :
* tests found no statistical differences between distributions for all small firms and all large firms (p<.05).
kaiser/hret survey of employer-sponsored health Benefits, 2010.
s o u r c e :

Em
ployer Opinions and H
ealth Plan PracticesEmployer Health Benefits 2 0 1 0 An n u a l S u r vey
195
T h e K a i s e r Fa m i ly F o u n d aT i o n - a n d - h e a lT h r e s e a r c h & e d u c aT i o n a l T r u s T
section
thirteen
13
0%
10%
20%
30%
40%
50%
60%
70%
80%
90%
100%
FSA* PRE-TAX PREMIUM PAYMENTS*
ALL SMALL FIRMS (3–199 WORKERS)
ALL LARGE FIRMS (200 OR MORE WORKERS)
ALL FIRMS
15%
77%
18%
54% 55%
92%
e x h i b i T 13.10
among Firms offering health benefits, Percentage of Firms offering Flexible spending accounts and Pre-Tax employee Premium contributions, by Firm size, 2010
* estimate is statistically different between all small Firms and all large Firms within category (p<.05).
note: section 125 of the internal revenue code permits employees to pay for health insurance premiums with pre-tax dollars. section 125 also allows the establishment of flexible spending accounts (Fsas). an Fsa allows employees to set aside funds on a pre-tax basis to pay for medical expenses not covered by health insurance. Typically, employees decide at the beginning of the year how much to set aside in a Fsa, and their employer deducts that amount from the employee’s paycheck over the year. Funds set aside in a Fsa must be used by the end of the year or are forfeited by the employee. Fsas are different from hras and hsas. Fifteen percent of firms responded “not applicable;” for example, the firm pays for 100 percent of the cost of coverage.
Kaiser/hreT survey of employer-sponsored health benefits, 2010.
s o u r c e :

Em
ployer Opinions and H
ealth Plan Practices
Employer Health Benefits 2 0 1 0 An n u a l s u r vey
196
t h e k a i s e r fa m i ly f o u n d at i o n - a n d - h e a lt h r e s e a r C h & e d u C at i o n a l t r u s t
section
thirteen
13
e x h i B i t 13.11
Percentage of Covered Workers with an annual maximum Benefit for single Coverage, by Plan type, 2010*
HMO PPO POS HDHP/SO ALL PLANS0%
20%
40%
60%
80%
100%
4%
12%9%
20%
12%
* tests found no statistical differences between plan type estimate and estimate for all Plans (p<.05).
kaiser/hret survey of employer-sponsored health Benefits, 2010.
s o u r c e :
e x h i B i t 13.12
Percentage of employers with Coverage for Prescription Contraceptives or elective abortions in the Plan with the largest enrollment, by firm size, 2010
yes no don't know
prescription Contraceptivesall small firms (3–199 Workers)* 62% 6% 32%all large firms (200 or more Workers)* 85 11 4
All firms 63% 6% 31%
elective Abortionsall small firms (3–199 Workers)* 9% 19% 72%all large firms (200 or more Workers)* 19 50 31
All firms 9% 20% 71%
* distributions are statistically different between all small firms and all large firms within category (p<.05).
note: Prescription contraceptives include, for example, birth control pills, patches, implants, shots, iuds, or diaphragms.
kaiser/hret survey of employer-sponsored health Benefits, 2010.
s o u r c e :

The Kaiser Family Foundation is a non-profit private operating foundation, based in Menlo Park, California, dedicated to producing and communicating the best possible analysis and information on health issues.
Founded in 1944, the Health Research & Educational Trust (HRET) is a private, not-for-profit organization involved in research, education, and demonstration programs addressing health management and policy issues. An affiliate of the American Hospital Association (AHA), HRET collaborates with health care, government, academic, business, and community organizations across the united States to conduct research and disseminate findings that shape the future of health care. For more information about HRET, visit www.hret.org.
NORC, known since its founding in 1941 as the National Opinion Research Center, pursues objective research that serves the public interest. NORC has offices on the university of Chicago campus and in Chicago, Bethesda, MD, and Berkeley, CA, and a field staff that operates nationwide. NORC’s clients include government agencies, educational institutions, foundations, other nonprofit organizations, and private corporations. Its projects are interdisciplinary and are local, regional, national, and international in scope.
Copyright © 2010 Henry J. Kaiser Family Foundation, Menlo Park, California, and Health Research & Educational Trust, Chicago, Illinois. All rights reserved.
Printed in the united States of America.
ISBN: 978-0-87258-878-3
American Hospital Association/Health Research & Educational Trust Catalog Number 097522
Primary Authors:
KAISER FAMILY FOUNDATIONGary ClaxtonBianca DiJulioBenjamin FinderJanet Lundy
HEALTH RESEARCH & EDUCATIONAL TRUSTMegan McHughAwo Osei-Anto
NATIONAL OpINION RESEARCH CENTERHeidi Whitmore
Jeremy pickreign
Jon Gabel

This publication (#8085) is available on the Kaiser Family Foundation’s website at www.kff.org. Multiple copies may be obtained from HRET by calling 1-800-242-2626 (order #097522).
September 2010
-and-
The Henry J. Kaiser Family Foundation
Headquarters 2400 Sand Hill Road
Menlo Park, CA 94025Phone 650-854-9400 Fax 650-854-4800
Washington Offices and
Barbara Jordan Conference Center
1330 G Street, NW
Washington, DC 20005
Phone 202-347-5270 Fax 202-347-5274
www.kff.org
Health Research & Educational Trust
155 North WalkerSuite 400
Chicago, IL 60606Phone 312-422-2600 Fax 312-422-4568
www.hret.org
69%
$13,7
70
$5,0
49
2010-and-
T H E K A I S E R F A M I L y F O u N D A T I O N
- A N D -
H E A L T H R E S E A R C H &
E D u C A T I O N A L T R u S T
2 0 1 0A n n u a l S u r v e y
EmployerHeal th
Benef i t s
Employer H
ealth Benefits 20
10
AN
Nu
AL
Su
Rv
Ey
T
HE
KA
ISE
R F
AM
ILy F
Ou
ND
AT
ION
-AN
D- H
EA
LTH
RE
SE
AR
CH
& E
Du
CA
TIO
NA
L T
Ru
ST