EMPLOYEE-BASED BRAND EQUITY: WHY FIRMS WITH …faculty.london.edu/rchandy/brandequity.pdf ·...
47
EMPLOYEE-BASED BRAND EQUITY: WHY FIRMS WITH STRONG BRANDS PAY THEIR EXECUTIVES LESS Nader T. Tavassoli, Alina Sorescu, and Rajesh Chandy* *Nader T. Tavassoli is Professor of Marketing, London Business School ([email protected]). Alina Sorescu is Rebecca U. ’74 and William S. Nichols III ’74 Associate Professor of Marketing, Mays Business School, Texas A&M University ([email protected]). Rajesh Chandy is Professor of Marketing, Tony and Maureen Wheeler Chair in Entrepreneurship, and Academic Director of the Deloitte Institute for Innovation and Entrepreneurship at London Business School ([email protected]). The authors are grateful to BAV Consulting, a Y&R Brands company, for providing the brand data used in this study, as well as to Ed Lebar and Stephen Lenzen for their assistance. The authors contributed equally to this article.
-
Upload
truongcong -
Category
Documents
-
view
215 -
download
2
Transcript of EMPLOYEE-BASED BRAND EQUITY: WHY FIRMS WITH …faculty.london.edu/rchandy/brandequity.pdf ·...
EMPLOYEE-BASED BRAND EQUITY:
WHY FIRMS WITH STRONG BRANDS PAY THEIR EXECUTIVES LESS
Nader T. Tavassoli, Alina Sorescu, and Rajesh Chandy*
*Nader T. Tavassoli is Professor of Marketing, London Business School
([email protected]). Alina Sorescu is Rebecca U. ’74 and William S. Nichols III ’74
Associate Professor of Marketing, Mays Business School, Texas A&M University
([email protected]). Rajesh Chandy is Professor of Marketing, Tony and Maureen Wheeler
Chair in Entrepreneurship, and Academic Director of the Deloitte Institute for Innovation and
Entrepreneurship at London Business School ([email protected]). The authors are grateful to
BAV Consulting, a Y&R Brands company, for providing the brand data used in this study, as
well as to Ed Lebar and Stephen Lenzen for their assistance. The authors contributed equally to
this article.
EMPLOYEE-BASED BRAND EQUITY:
WHY FIRMS WITH STRONG BRANDS PAY THEIR EXECUTIVES LESS
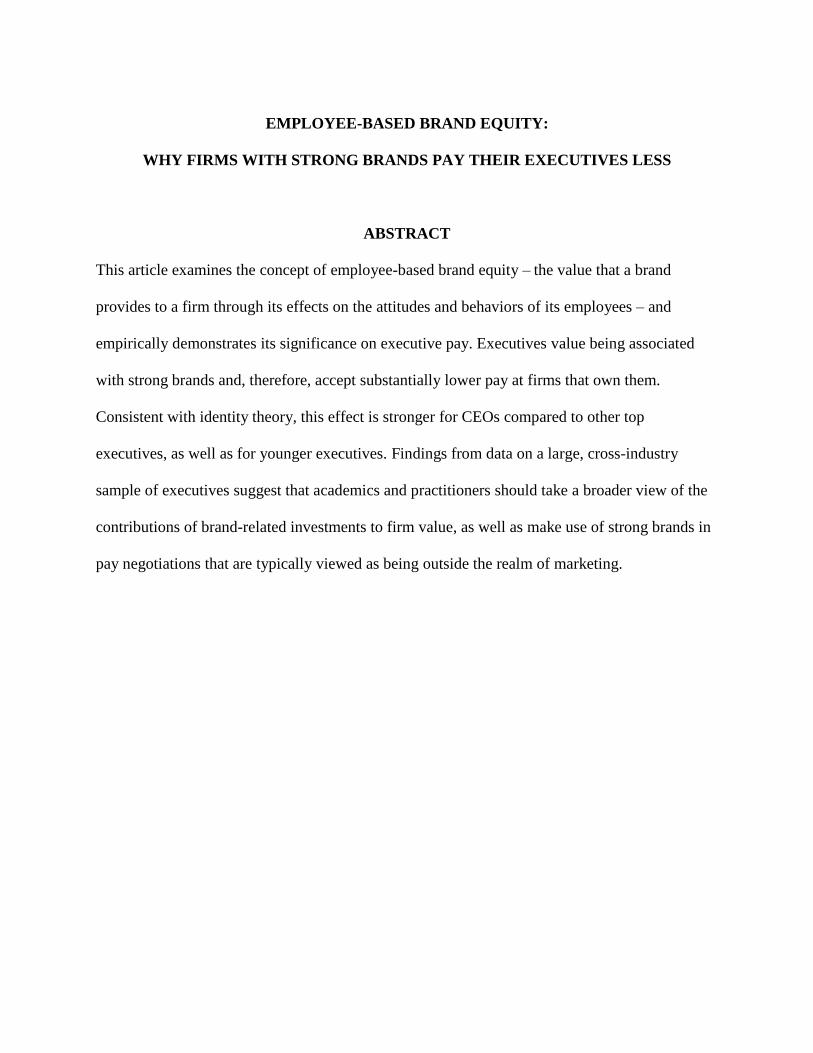
ABSTRACT
This article examines the concept of employee-based brand equity – the value that a brand
provides to a firm through its effects on the attitudes and behaviors of its employees – and
empirically demonstrates its significance on executive pay. Executives value being associated
with strong brands and, therefore, accept substantially lower pay at firms that own them.
Consistent with identity theory, this effect is stronger for CEOs compared to other top
executives, as well as for younger executives. Findings from data on a large, cross-industry
sample of executives suggest that academics and practitioners should take a broader view of the
contributions of brand-related investments to firm value, as well as make use of strong brands in
pay negotiations that are typically viewed as being outside the realm of marketing.
1
INTRODUCTION
Managers recognize the value of strong brands – those that project a clear and consistent
set of positive associations at high levels of awareness (Keller 2003) – and dedicate significant
resources to building brand strength. The power of brands has not been lost on marketing
academics either, who have spent decades conceptualizing brand equity (e.g., Aaker 1991, Keller
1993) and demonstrating its consequences (for a review, see Christodoulides and de Chernatony
2010). An assumption that is generally taken for granted is that brands generate value for firms
by affecting how customers think and what they do; that “[t]he power of brands lies in the minds
of consumers” (Leone et al. 2006, p. 126). Whether such thoughts and behaviors are captured by
measuring customers’ increased intention to purchase (e.g., Cobb-Walgren et al. 1995), their
willingness to accept price premiums (e.g., Ailawadi, Lehmann, and Neslin 2003), or their
adoption of products and consequent increases in market share and cash flow (e.g., Agarwal and
Rao 1996; Mizik and Jacobson 2008), the focus of existing academic research and managerial
attention has overwhelmingly been on how brands help firms win the battle for customers.
We argue that a focus on customer-based outcomes, while undoubtedly important, may
offer an incomplete accounting of brand value, one that understates brands’ true contributions to
the firm. This is because firms not only compete for customers, but also for employees. Our
central thesis is that just as strong brands can help attract customers at higher prices, they should
also help attract employees at lower levels of pay. This is a non-trivial matter, as pay represents
the biggest cost in many organizations (Gomez-Mejia 2001) with salaries alone accounting for
between 20% to 50% of operating expenses (Society for Human Resource Management 2008)
and 30% of U.S. firms’ revenues, on average (PwC Saratoga 2012). A significant (and
increasingly controversial) aspect of this pay is devoted to top executives. We seek to motivate,
2
explain, and demonstrate the effect of employee-based brand equity in the realm of executive
pay.
We aim to make four contributions to theory and practice. First, on a substantive front,
we highlight the concept of employee-based brand equity – which we define as the value that a
brand provides to a firm through its effects on the attitudes and behaviors of its employees – and
outline some of its implications for marketing, management, and economics. The concept of
employee-based brand equity offers the potential to extend the domain of returns to branding.1 A
traditional notion, embedded at least implicitly in most research on returns to marketing, is that
the payoff to brand investments largely exists in the revenue gains that they can yield. Our
approach flips this notion by looking at the cost side of profits, an area rarely examined in
marketing (e.g., Srivastava, Shervani, and Fahey 1998).2 We suggest that a significant part of the
returns to marketing investments in brands may be in reducing payroll costs.
Second, on a conceptual front, we offer an identity-based framework that integrates
research in psychology, economics, management, and marketing to explain the role of strong
brands in limiting executive pay. This also allows us to propose hypotheses regarding
contingencies under which the effect of strong brands on executive pay is likely to be especially
pronounced. Identity is one of the most widely applied concepts in social psychology and
consumer behavior (for a marketing review, see Reed et al. 2012). We highlight its potential in
explaining the impact of strong brands at the highest executive levels of the firm.
Third, on an empirical front, we integrate dispersed data on brands, firms, and executives.
1 Ambler (2003; chapter 7) and King and Grace (2009) have used the term employee-based brand equity to note that
brand knowledge can affect employee behavior. They have not, however, considered that it may lower pay.
2 Srivastava et al. (1998) note that brand equity could potentially lower costs by increasing advertising and
promotion efficiency. However, they also “clearly emphasize that the value of any asset ultimately is realized,
directly or indirectly, in the external product marketplace” (p.4).
3
We examine the link between brand strength and executive pay using a large sample of
executives employed by publicly traded U.S. firms. Our sample incorporates brand strength data
from BAV Consulting’s Brand Asset Valuator (BAV), executive pay data from COMPUSTAT’s
ExecuComp, and data on a host of supporting variables from various other sources. These data
demonstrate a negative effect of brand strength on executive pay, one that is stronger for CEOs
and younger executives.
Fourth, on a prescriptive front, the concept of employee-based brand equity offers the
potential to extend the domain of marketing research to areas that have rarely been studied by
marketers: the stratospheric pay levels of top executives. As executive pay levels seem to reach
ever higher, they have fuelled a heated debate and a torrent of academic studies in management,
finance, and economics. Many of the recommendations from these discussions call for increased
government regulation of executive pay (see Cadman et al. 2012; The Economist 2013). We
highlight an inherently marketing-based approach that allows firms to self-regulate executive
pay: by investing in strong brands. If top executives are prepared to accept lower pay for the
privilege of running firms with strong brands, then pay levels can be grounded, at least to some
extent. This implies that practitioners should take a broader view of how to assess the
contributions of brands to firm value, and to more actively leverage brand strength in pay
negotiations that are typically viewed as outside the realm of marketing.
The remainder of this article is structured as follows. We first introduce our theoretical
framework, which articulates how identity theory applies to organizations and their brands, how
it facilitates equity transfer to employees, and how it impacts pay. This framework describes
specific conditions under which equity transfer from brands to employees is most likely to
4
materialize or be most valued. We then describe the data and method used to empirically test our
hypotheses, present and discuss our results and their implications.
THEORETICAL FRAMEWORK
Identity theory
A core human need is to define our identity – both in how we view and understand our
own selves, and in how others perceive us (Tajfel and Turner 1985). A substantial literature in
management has examined how employees’ identities are affected by their organizational
affiliations (e.g., Mael and Ashforth 1992; Dutton, Dukerich, and Harquail 1994; Tajfel 1978). A
smaller literature in economics has analytically linked identity theory to employee compensation
(Akerlof and Kranton 2008). Quite separately, a substantial literature in marketing has
demonstrated how consumers’ identities are affected by the brands they consume (e.g., Reed et
al. 2012). These clusters of research share common ancestors (see Cable and Turban 2003; Reed
et al. 2012). Yet, like with Darwin’s finches, many years of separation have caused each research
cluster to evolve differently, and to pursue different sources of sustenance.
We seek to integrate these streams of research and propose an identity-based framework
that describes why executives accept lower pay to manage firms that own strong brands. The
overarching theme underlying this effect is self-enhancement: strong brands offer greater
possibilities for self-enhancement to the executives associated with them than do weak brands.
This benefit should lead to a willingness to accept lower pay. We further draw from several
elements shared by employee- and consumer identity research to explain two contingencies that
buttress the negative effect of brand strength on executive pay. Specifically, we argue that the
higher the perceived (1) strength of identification between the individual and the brand, or (2)
5
potential for uncertainty reduction afforded by the association with the brand, the higher the
executive’s willingness to accept lower pay.
Self-enhancement
Identity theory proposes that self-enhancement – the accrual of social, psychological, or
economic benefits – is a core motivation for individuals to identify with particular entities.
Previous research has shown that the more positive an entity’s social standing, the stronger the
identification individuals tend to have with it, because individuals (vicariously or otherwise)
partake in the success and status of the entity (Ashforth and Mael 1989). This is a robust
relationship found for sports teams (Cialdini et al. 1976), employers (Johnson et al. 2006), alma
maters (Mael and Ashforth 1992), and brands (Hughes and Ahearne 2010).
The process by which brand equity is transmitted from the brand to those identified with
it is referred to as brand equity transfer. Marketing research has shown that individuals use brand
affiliations to affirm, express and enhance their identity both privately (e.g., self-esteem) and
publicly (e.g., status) (Bearden and Etzel 1982; Levy 1959; Solomon 1983). For example,
owning an iPhone may affect both the consumer’s own perception of her or his identity, as well
as the identity that others ascribe to her or him. Consumers do so, in particular, by vesting their
self-conceptions in entities that they and relevant others perceive as being successful and well-
respected (e.g., luxury brands, Han, Nunes, and Drèze 2010). Brands can also diminish
consumers’ identities. For example, a Blackberry-wielding journalist recently lamented that the
brand is no longer cool and that he will have to replace it, adding: “No longer being an object of
public derision would, of course, be an added bonus” (Garrahan 2013).
Analogous to why people value products that enhance their identity, people seek
employment at firms that own strong brands, at least in part, to benefit their self-esteem (e.g.,
6
Cable and Turban 2003) and social standing (Tajfel 1978). Indeed, the place you choose to work
at might say more about you than the products you consume (Du Gay 1995): working at
Blackberry or Apple as an “insider” may well contribute to one’s identity more than owning a
Blackberry or an Apple product as an “outsider” (Scott and Lane 2000). Moreover, individuals
consume numerous products but typically hold only one job at a time. And, while a customer
chooses a product, a job entails a choice by both the employee and the firm. This “stamp-of-
approval” inference is akin to consumer beliefs that a strong brand will only partner with other
high-quality brands, as it would otherwise diminish their own brand (Cao and Sorescu 2013).
These self-enhancement arguments offer an identity-based explanation for why strong
brands can pay their executives less. We next build on this explanation to describe two constructs
that help answer a contingent question: Why do strong brands offer some executives greater
opportunities for self-enhancement, and thus make them more willing to accept lower pay?
Strength of identification
One basis is strength of identification, the degree to which individuals perceive
themselves as one with an entity (Ashforth and Mael 1989; Dutton et al. 1994; Muniz and
O’Guinn 2001). Self-enhancement benefits derived from associating with a strong brand should
increase with the strength of the individual’s identification with the brand.
Why would some executives perceive greater identification with a strong brand than
others? One possible reason is that strength of identification increases with the salience of the
association, or the extent to which the individuals in question are visibly and prominently
associated with the entity (Bearden and Etzel 1982; Dutton et al. 1994). The more visible the
association, the more likely it is that social benefits can be derived from it. For example, equity
transfer from brands to consumers is stronger when consumption is public rather than private
7
(Bearden and Etzel 1982). Similarly, executives’ leadership positions publicly confirm their
stewardship of strong brands, making it more likely they identity with them and rely on equity
transfer as a source of self-definition (Hogg and Terry 2000). This increases both the
opportunities for and the potency of self-enhancement derived from a brand association (Dutton
et al. 1994).
Potential for uncertainty reduction
Uncertainty about an individual’s identity increases with the lack of relevant information
that could be used to define her or his identity. Thus, the potential for uncertainty reduction is
highest for individuals whose identity is unclear or yet to be fully shaped (Hogg and Terry 2000).
In such cases, equity transfer from brands can serve as a basis for inferring the missing
information (e.g., Shapiro 1982).
Given a strong brand, why would some executives perceive greater potential for
uncertainty reduction via association with strong brands than others? A substantial literature in
psychology and economics implies that those executives who have had fewer opportunities to
define their identity (and therefore those who have greater uncertainty associated with their
social identities) are likely to perceive greater opportunities for self-enhancement via association
with strong brands. Association with strong brands offers such executives the ability to signal
their own unobserved quality to themselves as well as to others who matter to their
psychological- (e.g., peers, friends and family; Hogg and Terry 2000) and financial well-being
(e.g., future employers and future peers; Spence 1973; Weiss 1995).
HYPOTHESES
Self-enhancement as a substitute for pay
8
Research in marketing has shown that consumers value the self-enhancement benefits
offered by strong brands and that this translates into top-line financial benefits that include price
and volume premiums and a higher customer lifetime value (e.g., Ailawadi, Lehmann, and
Neslin 2003; Gupta, Lehmann, and Stuart 2004; Srinivasan, Park, and Chang 2005). The
theoretical framework outlined above suggests that strong brands can also form a basis for
employee-based equity, by enhancing the bottom line in terms of reduced payroll costs. This is
because employees should value the self-enhancement benefits offered by firms that own strong
brands. We consider these benefits as a non-financial reward of employment: a substitute for
pay.
Economists have recently added identity-based benefits to utility models of wages
(Akerlof and Kranton 2008), but empirical evidence remains lacking. The only empirical support
for the role of brands on pay can be found in laboratory studies in which undergraduate students
indicated that they would hypothetically take a lower pay to work for a strong brand
(DelVecchio et al. 2007) or for a firm with good corporate reputation (Cable and Turban 2003).
Whether this relationship holds for actual job searches, more experienced job seekers, in more
ecologically valid environments, and for actual pay, remains to be seen. It is possible, for
example, that brand strength effects are limited to early stages of the recruitment cycle where
awareness leads to consideration, and where the lack of information on job attributes leads to
halo-type inferences (Uggerslev, Fassina, and Kraichy 2012).
This being said, our theoretical framework suggests that executives’ leadership positions
allow them to credibly position the brands that they are charged to manage as a central part of
their identity, and to rely on equity transfer from these brands as a potent source of self-
definition. This is because professional peers, future employers and current or future members of
9
their social circle may (rightly or wrongly) associate part of the brand equity of the firm to the
actions and qualities of its leaders (Phillips and Lord 1981). Executives, as leaders of their firms,
will derive current and future utility from being at the helm of firms with high brand equity
thereby having an increased willingness to accept lower pay for such positions. More formally,
H1: Firms with strong brands pay their executives less.
CEO visibility and strength of identification
Our theoretical framework also suggests that the size of the negative effect of strong
brands on executive pay should vary by the type of executive. Taking the above arguments
further, we expect that the highest ranked executive, the CEO, will be most willing to accept
lower pay for being at the helm of firms with strong brands. CEOs are typically the most
prominent members of an organization (Hogg and Terry 2000). They give a public face to an
otherwise abstract identity, resulting in many outsiders viewing them as one and the same (Scott
and Lane 2000). Given the CEO’s responsibility for a firm as a whole and their highly visible
role, external parties are likely to identify the CEO with the firm and its brands in particular
(Bettman and Weitz 1983; Dutton and Dukerich 1991). Hence, strong brands are likely to
provide more social self-enhancement benefits to CEOs than to other high ranking executives at
the firm. We therefore expect that CEO pay will show a greater negative impact of brand
strength than the compensation of other executives. More formally,
H2: The negative effect of brand strength on executive pay is strongest for the CEO
compared to other executives.
10
Uncertainty about younger executives’ identities
From an uncertainty-reduction perspective, our framework suggests that younger
executives should be more likely to value the equity transfer they could obtain through
employment in firms with strong brands. Working for a strong brand reduces uncertainty in two
ways. First, in the short term, younger executives have fewer building blocks to define their
identity, which makes the contemporaneous equity transfer from their current employment
especially valuable in terms of their private (e.g., self-esteem) and public (e.g., status) identity.
Second, from the perspective of making an investment into future employment
opportunities, a strong brand can serve as a signal about executives’ unobserved qualities. For
less experienced, younger executives, brand equity transfer from their current employment
should be more significant in terms of reducing uncertainty about their human capital for
potential future employment opportunities. Previous research has shown that an individual’s
schooling and work experience can be used as signals of that person’s abilities, traits and values
(Spence 1973; Weiss 1995). Experimental evidence shows that brands can also be used as
signals and have the ability to boost résumé power. Specifically, in a hypothetical setting,
undergraduates indicated that they would be willing to accept a lower wage from a strong brand
(Jack Daniels whiskey or Ray-Ban sunglasses) than a weak brand (Old Forester whiskey or
SunGear sunglasses) as a signal of their competency (DelVecchio et al. 2007). Therefore, an
employee might view working for a firm with a strong brand for lower pay as an investment in
their identity, because future employers may rely on the brand affiliation as a credible indicator
of human capital, even beyond the skills associated with the previous employment experience.
Because younger executives have longer careers ahead of them, they are also likely to have
11
greater opportunities to leverage this equity for social or economic gains. Younger executives
should, therefore, value any brand equity transfer more than older executives. More formally,
H3: The negative effect of brand strength on executive pay is stronger for younger
executives compared to older executives.
METHOD AND MEASURES
We obtain brand strength data from the U.S. Young & Rubicam BAV metrics survey.
Samples of 1,200 or more consumers are selected each quarter from a panel of 15,000
individuals who are asked to complete a 45 minute survey no more than once per year. Survey
respondents provide answers to multiple-item scales that yield measures of brand strength. The
BAV is one of the few sources of brand equity data that span over 10 years. It also has the value
of precedent, having been used by other researchers who have shown that brand strength is
positively related to customer lifetime value metrics (Stahl et al. 2012), cost of debt (Larkin
2013), and firm performance (Mizik and Jacobson 2009).
We obtain compensation data from ExecuComp. ExecuComp is a Standard & Poor’s
database that contains data on total pay as well as fixed and variable components of pay for one
or more of the top five highest compensated executives working for companies that are part of
the S&P1500 index. These executives are typically the CEO, the CFO and various other top
executives such as chief operating officers and senior vice-presidents. Firm size and performance
data are from COMPUSTAT. Data on control variables – which we describe later in the
measures section – are from BoardEx (a database of executive characteristics which includes,
among other data, information on pay and board membership), the Fortune magazine 100 Best
Companies to Work For annual ranking, Fortune’s 100 Most Admired Companies annual
ranking, and Trading Economics (a website that aggregates historical data for more than 300,000
12
economic indicators, exchange rates, stock market indexes, government bond yields and
commodity prices).
The intersection of the BAV metrics data and executive pay data results in data for 2,717
executives, 495 of whom are CEOs. Data is available in an unbalanced format between 2000 and
2010. Not all brands are included in every annual edition of the BAV survey and not all
executives appear in ExecuComp for the duration of our sample. We exclude the year of the
appointment and the terminal year where compensation might not reflect a full 12-month period,
and would therefore not be readily comparable to the remaining years for which compensation is
computed on an annual basis.3 We also exclude CEOs who are the founders of the company, as
their pay structure tends to be distorted from that of the average CEO (He 2008). The
intersection of the brand, executive level (compensation and board membership) and firm level
data yields a sample of 10,107 observations for all executives and 1,869 observations for CEOs,
across 393 firms.
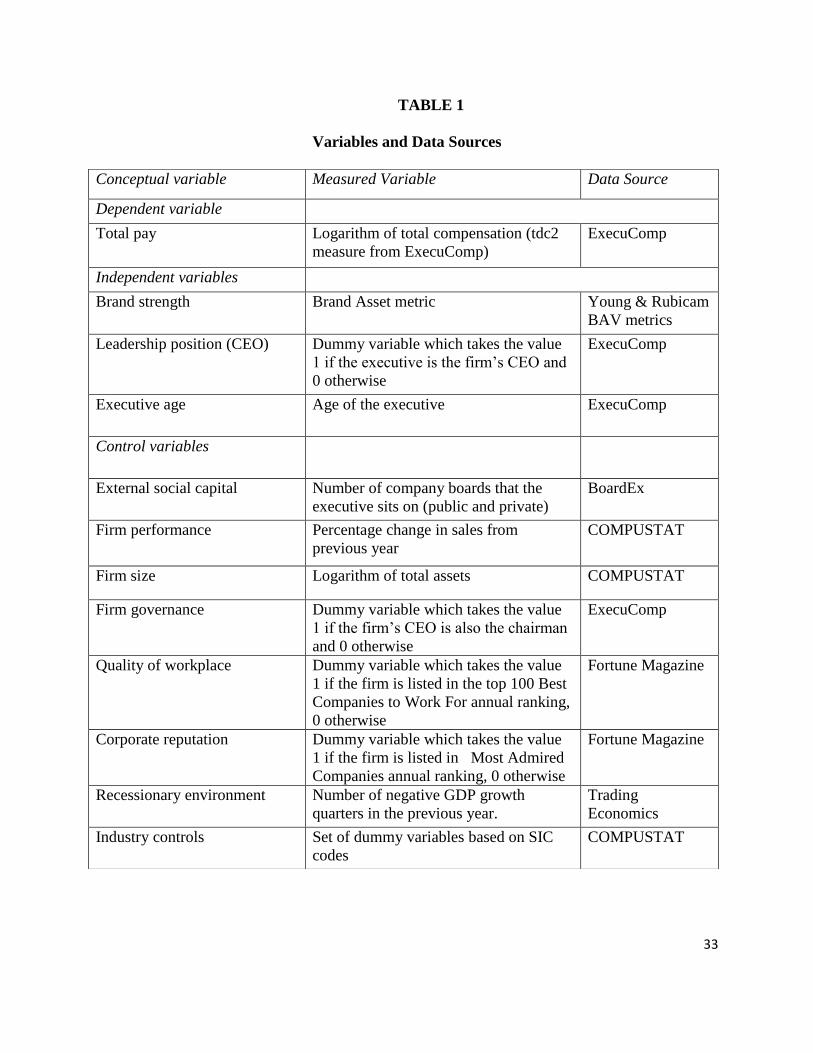
Below, we present measures for our dependent and independent variables, as well as
controls included in our empirical models. These measures are summarized in Table 1.
Dependent variable: Total pay
We use total pay as reported in ExecuComp, a measure used in numerous previous
studies (e.g., Deng and Gao 2013; Kaplan and Rauh 2010; Webb 2008). This measure includes
salary, bonus, other annual pay, restricted stock grants, long term incentive plan payouts, net
value of options exercised and all other payments. Kaplan and Rauh (2010) argue that this
measure of pay, which estimates the total compensation realized by an executive in a given year,
is the closest measure to an executive’s true adjusted gross income. In order to reduce skewness
3 This also reduces the likelihood that our measure of compensation includes sign-up (golden hello) or sign-off
(golden parachute) bonuses, which are not a typical part of annual compensation.
13
in the raw pay data, and in line with previous research (e.g., Deng and Gao 2013; Kaplan and
Rauh 2010; Webb 2008), we apply a log transformation to the raw data when including it in our
empirical model.
Alternative dependent variables: Salary and equity based pay
We also investigate whether brand strength has a differential effect on various
components of total pay. Specifically, we use, as alternative dependent variables, (1) the
logarithm of salary as reported in ExecuComp and (2) the logarithm value of equity based pay
which is calculated as the value of the stock-related and option-related awards that the company
gave to the executive in each fiscal year.
Independent variables
Brand strength. Our measure of brand strength is based on the BAV model from BAV
Consulting (part of Young & Rubicam); this data is derived from the world's largest study of
consumer attitudes, beliefs, familiarity, and evaluation of different product brands. The BAV
model includes data on four brand pillars: Brand Knowledge (familiarity), Esteem (quality,
value, etc.), Energized Differentiation (the extent to which the brand is distinctive, unique, and
dynamic) and Relevance (the extent to which consumers can relate to the brand). The BAV
combines these pillars into a single Brand Asset measure. Since the pillars which compose the
Brand Asset are highly correlated (cf. Stahl et al. 2012) and we have no theoretical reason to
expect a differential effect of any of these components on pay, we use BAV’s Brand Asset metric
as our measure of brand strength.
The BAV data has several advantages. Most importantly, it is a direct measure of
consumers’ assessment of a brand rather than one derived from firm or stock market variables,
which decreases the probability of a spurious correlation with executive pay. Second, the
14
sampling for the BAV surveys is representative of the US population, thereby broadly capturing
public sentiment. Finally, the brands surveyed are designed to maintain a fair representation of
all major industry competitors, thus providing varying degrees of brand strength across at least
the major brands.
Merging BAV and COMPUSTAT data
In the majority of cases, BAV assesses brand strength at the product level (e.g., Tide) and
only in a few cases also at the firm level should these differ (e.g., P&G), which is the unit of
analysis for the CEO and financial data. Given nature of this data, some previous authors have
restricted their analysis to mono-brand firms (e.g., Mizik and Jacobson 2009). These are firms in
which a single brand represents the bulk of the firm’s business (such as AOL, IBM, Starbucks,
and Wal-Mart). Focusing just on mono-brands, however, would unduly reduce the sample size
(Larkin 2013). Firms using the more common multi-brand strategy include Kimberly-Clark,
which owns brands such as Kleenex, Huggies, and Cottonelle. Importantly, consumers may not
even recognize the corporate name in the case of a multi-brand strategy, or they may not be able
to match familiar product brands to familiar company names. One way to try to address some of
these challenges could be to use a weighted average of a firm's brands. However, not all firms’
major brands are typically surveyed and it is unclear how to weight these, especially as data on
brand-level sales is not readily available. In order to merge the BAV data with firm-level CEO
and financial data, we therefore select, for each firm, the brand with BAV’s highest Brand Asset
Score available. For robustness, we also report additional analyses of our model (1) using the
average brand strength score for all brands tracked by BAV for each firm; and (2) using the sub-
sample of mono-brand firms for which the BAV score is available at the firm level.
15
Leadership position (CEO). Executive pay is typically higher for the CEO than for other
top executives within the same firm (Frydman and Saks 2010). We use a dummy variable which
takes the value one if the executive is the CEO and zero otherwise. We obtain this data from
ExecuComp.
Executive’s age. Pay typically increases with the age of the executive (McKnight et al.
2000). We obtain the age of each executive – a time varying, annual variable – from
ExecuComp.
Control variables
External social capital. In line with prior research (Belliveau, O’Reilly, and Wade 1996)
we use the number of boards that the executive sits on for each year in the sample to capture the
executive’s external social capital.
Firm performance. Based on Gomez-Mejia, Tosi, and Hinkin (1987) we use percentage
change in sales from the previous year as our focal measure of firm performance. For robustness,
we also use earnings per share (EPS) and change in market value from the previous year. All
these three measures have been used as metrics of firm performance in studies included in the
Tosi et al. (2000) meta-analysis of executive pay research.
Firm size. In line with prior studies we measure firm size using the log of the firm’s
assets (e.g., Deng and Gao 2013). This data is obtained from COMPUSTAT.
Firm governance. Firms where the CEO is also the Chairman of the Board of Directors
are typically deemed to have weaker governance (e.g., Bebchuk and Fried 2004). Such firms
may be more prone to agency problems and may pay their executives more. We use a dummy
variable that takes the value one if a firm’s CEO is also its Chairman and zero otherwise. We
obtain this data from ExecuComp.
16
Quality of workplace. It is possible that an executive may accept lower pay if the firm is a
great place to work. We control for this theoretical possibility using Fortune magazine’s annual
ranking of the 100 Best Companies to Work For (e.g., Faleye and Trahan 2011). We use a
dummy variable that takes the value of one if the firm is listed in a given year and zero
otherwise.
Corporate reputation. Our model includes a 1-0 variable for whether a firm is ranked
among Fortune’s 100 Most Admired Companies (FMAC) in a given year. FMAC rankings have
been used as a reputation metric in 42% of empirical studies on corporate reputation (for a meta-
analysis, see Walker 2010). On the one hand, corporate reputation and brand equity are
interrelated constructs as they build on each other, and damage to one can weaken the other
(Aaker 2004). On the other hand, they are conceptually distinct and, while a good corporate
reputation might be associated with strong brands, prior research has shown that corporate
reputation alone is not sufficient to build strong brands (Page and Fearn 2005).
FMAC rankings are based on a highly correlated (α = .97) set of subcomponents – ability
to attract and retain talented people, quality of management, social responsibility,
innovativeness, quality of products or services, wise use of corporate assets, financial soundness,
long-term investment value, and effectiveness in doing business globally – with a single factor
accounting for 84% of variance subcomponents (Fombrun and Shanley 1990). Their correlation
is likely due to a halo effect based on financial performance. FMAC has been further criticized
for assessing only the perceptions of a limited set of stakeholders – i.e., industry peers – whilst
ignoring other relevant stakeholders such as customers, employees, regulators, etc. (Brown and
Perry 1994). These are not concerns for our purposes, however, as peer perceptions (even if
biased) may capture incremental identity effects beyond what the brand image (i.e., BAV’s
17
Brand Asset) captures. If so, we would expect that a strong reputation would have the same
negative effect on pay as a strong brand.
Industry effects. We control for industry effects by including in our models SIC code
dummies for each industry in our sample. Data is obtained from COMPUSTAT.
Year. We include the year to capture the effects of inflation as well as other time-specific
drivers of pay such as level of effort required (Hermalin 2005).
Recessionary environment. We measure the intensity of the recessionary environment
with the number of negative GDP growth quarters in the previous year. We obtained data on
GDP growth from Trading Economics.
MODEL
We test our hypotheses using a panel regression model with Driscoll and Kraay robust
standard errors that account for heteroskedasticity, autocorrelation and cross-sectional
dependence among panel units (in our case, the panel units are the executives) (Driscoll and
Kraay 1998; Hoechle 2007). We found evidence in our panel of both heteroskedasticity
(documented using a likelihood test that compares the fit of a model model with panel-level
heteroskedasticity correction to one without) and autocorrelation (documented using the
Wooldridge test for autocorrelation,Wooldridge 2002, p. 282–283). The nature of our panel,
where a significant number of units (executives) are present for only one to three time periods
does not allow a formal test for cross-sectional dependence. Nevertheless this dependence is
likely in the subsample of executives tracked for a longer period of time since compensation
committees often use the compensation of peers at similar firms in determining the pay for their
firm’s executives. In sum, as described in Hoechle (2007), the Driscoll and Kraay model utilizes
“a nonparametric covariance matrix estimator that produces heteroskedasticity- and
18
autocorrelation-consistent standard errors that are robust to general forms of spatial and temporal
dependence” (Hoechle, 2007, p.282), and therefore this specification controls for all crucial
econometric issues present in our empirical context. The results obtained with this specification
are substantively identical to these obtained with a simpler random effects model (in terms of
direction and significance), with the only difference being the larger magnitude of the Driscoll
and Kraay standard errors.
A panel regression with Driscoll and Kraay standard errors can be estimated either as a
pooled or as a fixed effects specification. A fixed effects model is not ideal in our setting for
several reasons. First, 631 of the 2,717 executives have only one full year of compensation data
(excluding the year they were appointed and their terminal year). These observations cannot be
leveraged in a fixed effects specification. Second, in a fixed effects specification we cannot
estimate the effects of covariates that do not vary with time, such as industry effects;
furthermore, other variables in our model such as the quality of workplace, firm governance and
external capital have a small variance within units, which limits the inferences that can be drawn
from the coefficients of these variables (Clark and Linzer 2013).
We estimate the following model for the overall sample of executives:
Payit = α0 + α1BrandStrengthit + α2CEOit + α3BrandStrength *CEOit + α4Ageit +
+α5BrandStrength*Ageit + α6FirmPerformanceit + α7FirmSizeit+ α8WorkplaceQualityit+
+α9ExternalSocialCapitalit + α10FirmGovernanceit + α11CorporateReputationit +
+α12Recessionit + α13Yearit +ε1it (1)
Where i stands for executive and t stands for year.
The model described in Equation (1) is estimated over the full sample of data, excluding
the year of appointment and the terminal year, as explained earlier in the data section. In the
19
robustness section we describe an alternative specification where the models are estimated over
the first full year of appointment to the specific executive position.
RESULTS AND ROBUSTNESS CHECKS
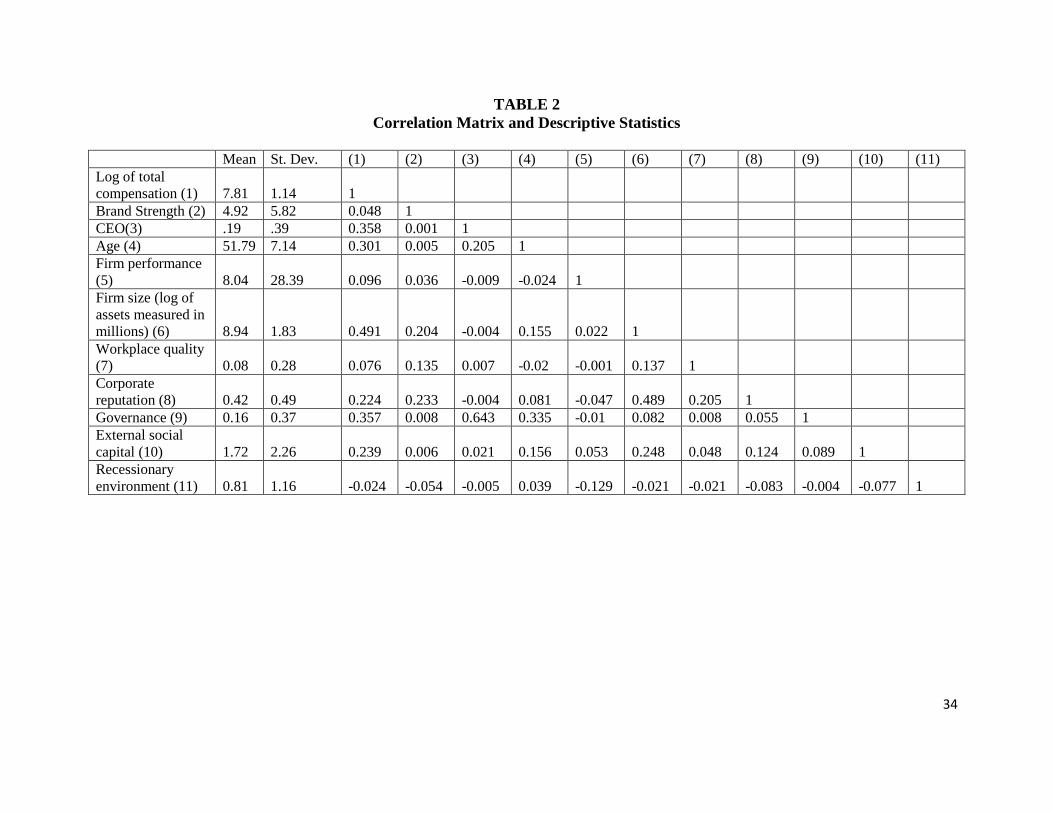
We present in Table 2 statistics that describe the characteristics of the executives and
firms included in our sample. The executives’ average age is 52, and ranges from 28 to 90 and
the average CEO age is 55, and ranges from 33 (Edward Rosenfeld, CEO of Steven Madden) to
81 years old (Ralph J. Roberts, CEO of Comcast). Sixty five percent of CEOs also chair the
Board of Directors of their respective firms. The average number of external boards that the
CEOs in our sample sit on is 1.72, but some sit on as many as 6 external company (public and
private) boards.
Total pay also varies significantly across the sample. On average, executives in our
sample are awarded about $5 million in total compensation per year. CEOs make, on average,
about $10 million per year while the other top executives make on average about $3.7 million
per year.
Brand strength is 4.92, on average, and exhibits significant variance across firms
(ranging from .01 to 54.61), despite the fact that the BAV survey tends to focus on well-known
brands. Brand strength also varies inter-temporally within company. For example, the rating for
Disney dropped from 54.61 in 2002 to 22.58 in 2010.
Descriptive statistics on control variables reveal that the firms in our sample range from
relatively small ones such as Visteon and Verisign to behemoths such as Ford and Exxon Mobil.
The average annual sales growth of the companies in our sample is about 8%.
Test of hypotheses
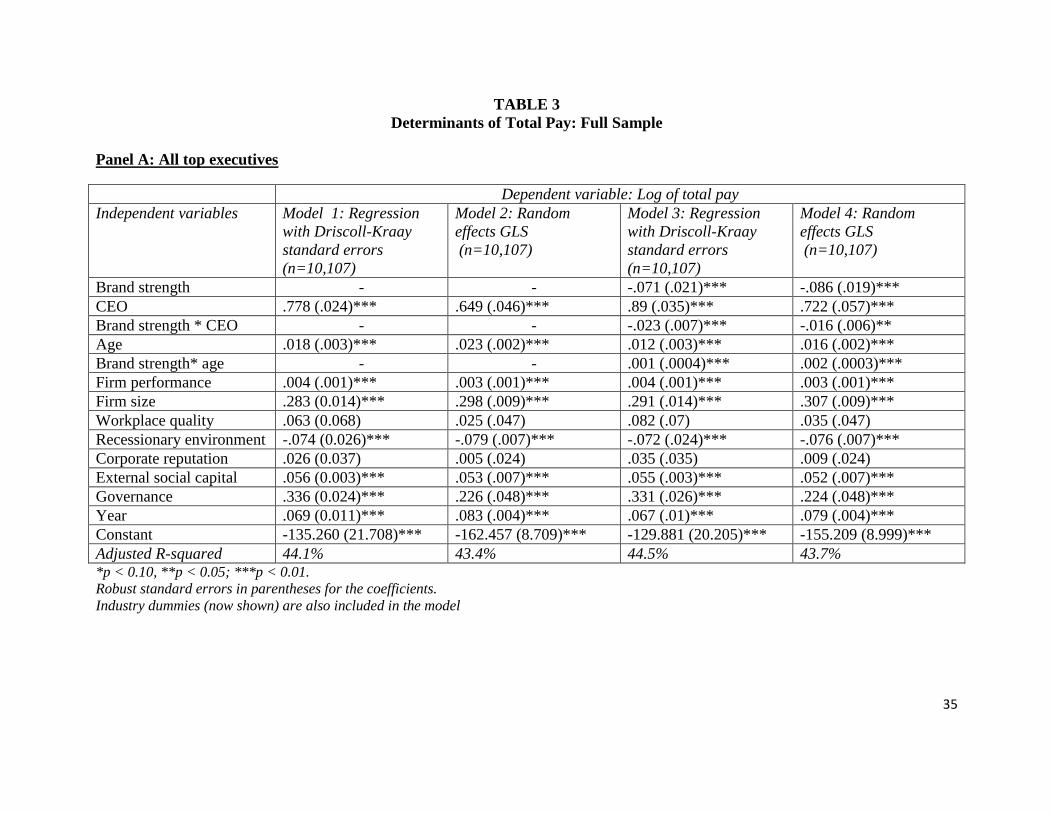
Results from the estimation of Equation (1) are presented in Panel A of Table 3. Model 1
20
establishes the effect of previously documented determinants of executive pay. In line with prior
research, we find that the pay is higher for CEOs (p<.01), older executives (p<.01), executives
working for companies where the CEO is also the chairman, and executives working for large
(p<.01) and well performing firms (p<.01). Total pay increases over time but is lower following
a recessionary year (p<.01). Being listed in either Fortune’s 100 Best Companies to Work For
ranking or the Most Admired Companies ranking does not significantly impact pay, consistent
with previous research (Faleye and Trahan 2011). We also find that executives with higher
external social capital are paid more, on average (p<.01). Model 2 presents, for comparison, the
results of the same equation estimated with a simpler GLS random effects method. The direction
and significance of coefficients is essentially the same as the one in Model 1.
Model 3 includes brand strength and the two hypothesized interactions. As predicted,
brand strength negatively impacts pay (H1) and further lowers the total pay for CEOs (H2) and
younger executives (H3) (all p values<.01). The direction of the effects of the control variables
remains consistent with that obtained in the benchmark model. The fact that the effect of brand
strength remains significant even when we control for external social capital, a variable that is
indicative of the quality of the executive (Belliveau, O’Reilly and Wade 1996), means that the
negative effect of brand strength on pay should not be a reflection of such brands attracting lower
quality executives.4 Model 4 reports the results using a GLS random effects model, which are
consistent with the ones obtained from Model 3.5
4 Several of our other control variables have also been used as indicators of human capital in previous research on
executive compensation (e.g., age, McKnight et al. 2000; tenure, Graham, Li and Qui 2012; dual chairman roles,
Core, Holthausen, and Larcker 1999; firm size, Rosen 1982; and firm performance, Terviö 2008).
5 We also considered the possibility of simultaneity between brand strength and the 100 Best Companies to Work
For, respectively Most Admired Companies ranking. We note, however, that in Table 3 we present results from an
estimation that measures the effect of brand strength on pay above and beyond the effect of a good work
environment and good corporate reputation. As Table 3 indicates, the workplace quality and corporate reputation
21
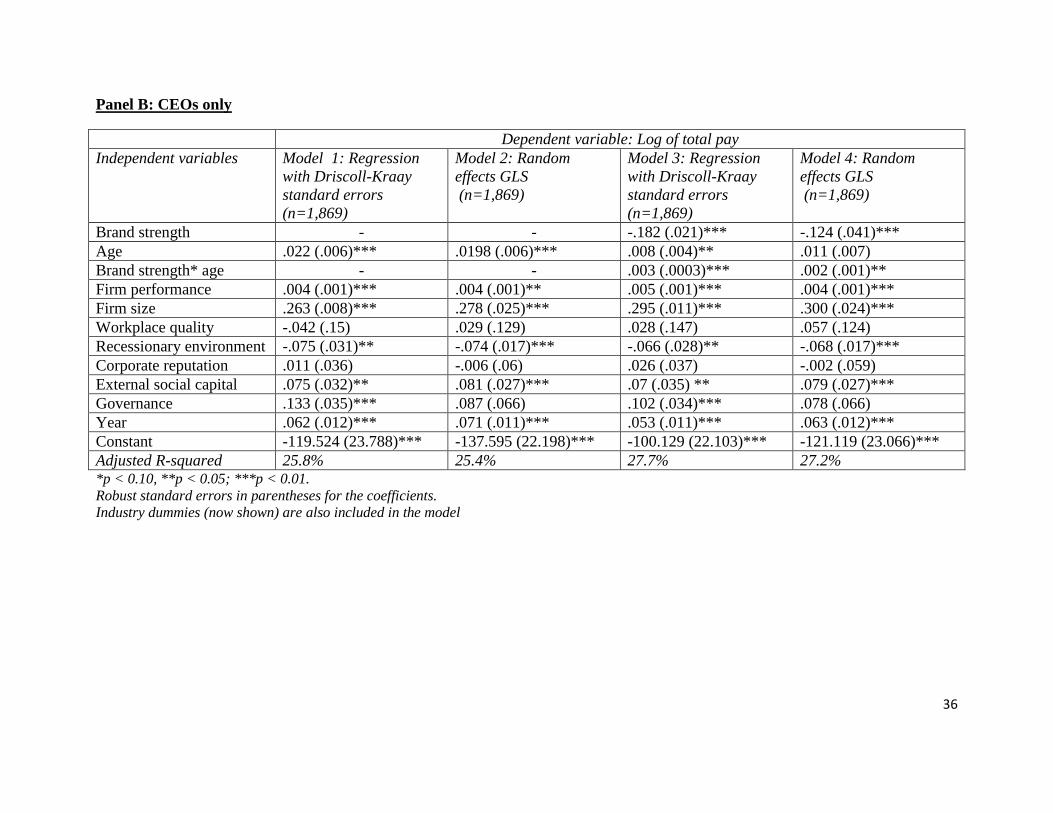
Panel B of Table 3 presents results for the sample of CEOs only. This analysis is useful
because a significant part of compensation literature (and a significant part of the controversy
around executive pay) focuses on CEOs only, as their pay tends to be significantly higher than
that of the other top executives at the same firm, and as such is a more important component of
firm costs.
All results obtained using the subsample of CEOs are consistent with these obtained for
the full sample of executives. The main effect of brand strength remains negative (p<.01) and the
interaction of CEO age and brand strength remains positive (p<.01). We also note that the
significance of hypothesized effects is maintained if a random effects model with robust cluster
error is used instead of the regression with Driscoll Kraay standard errors (Models 2 and 4 in this
panel).
Economic interpretation of results
In order to obtain an economic interpretation of our results, we first seek to provide a
financial value of our main effect for both CEOs and non-CEOs. To that end, we re-estimate our
model using mean-centered age and firm performance variables for both the CEO and non-CEO
sample and compute the percentage change in pay as 1- exp(brand strength coefficient * standard
deviation of brand strength). For the subsample of CEOs we find that one standard deviation
increase in brand strength is associated with a 12.13% decrease in pay, or $1,268,130 in savings
for the average CEO compensation. For the subsample of non-CEOs we find a 2.42% decrease in
pay for one standard deviation increase in brand strength, or $89,978 in savings for the average
variables do not have a significant effect on pay when brand equity is included in the model. Further, as Model 1
(Table 3) shows, the effect of the two variables on pay when brand strength is excluded from the model predicting
pay remains non-significant, while the adjusted R-square of the model is reduced. Thus, we conclude that potential
simultaneity between brand strength and the workplace quality and corporate reputation variables does not explain
our pattern of results.
22
non-CEO compensation. Thus, the decrease in pay is higher in both absolute and relative value
for CEOs, as predicted by our theory.
We also seek to provide a dollar estimate of the interaction effects. We first examine the
interaction between CEO status and brand strength. This interaction shows that the stronger the
brand, the smaller the pay differential between CEOs and non-CEOs. Using the coefficients of
the full model reported in Table 3 we obtain that at median brand strength, CEOs are paid 2.29
times more than the average non-CEO executive. For a brand whose strength is in the 75th
percentile they are paid only 2.09 times more. The average dollar savings obtained from the
difference between CEO and non-CEO executive compensation when moving from the 50th
to
75th
brand strength percentile is $744,853.
We interpret the interaction between brand strength and age in a similar manner. From
Table 3 we obtain that at median brand strength, pay increases for each year of age by 1.59%.
For brand strength in the 75th
percentile pay increases for each year of age by 2.12%. Therefore,
an executive who is 10 years younger than the average would make 21.2-15.9 = 5.3% less at a
firm with brand strength in the 75th
percentile than at one in the 50th
percentile. For the average
top 5 executive, this results into savings of $263,379.
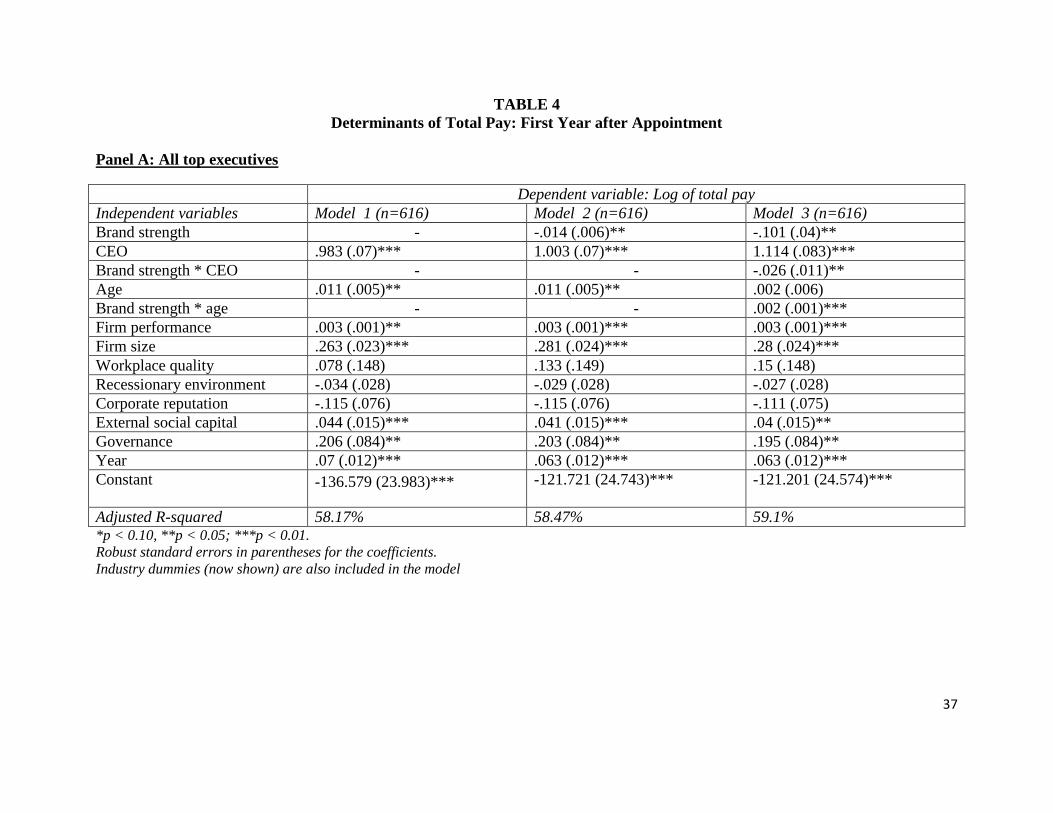
Robustness tests and additional analysis
Does brand strength impact the initial pay that an executive receives upon a new
appointment? A skilled executive could positively impact the performance of a firm, which in
turn could increase both brand strength and the executive’s pay. In order to tease out the effect
that executives’ actions have on brand strength as well as on their pay, we estimate Equation (1)
over a subsample which includes only the first full year of appointment to the executive position.
23
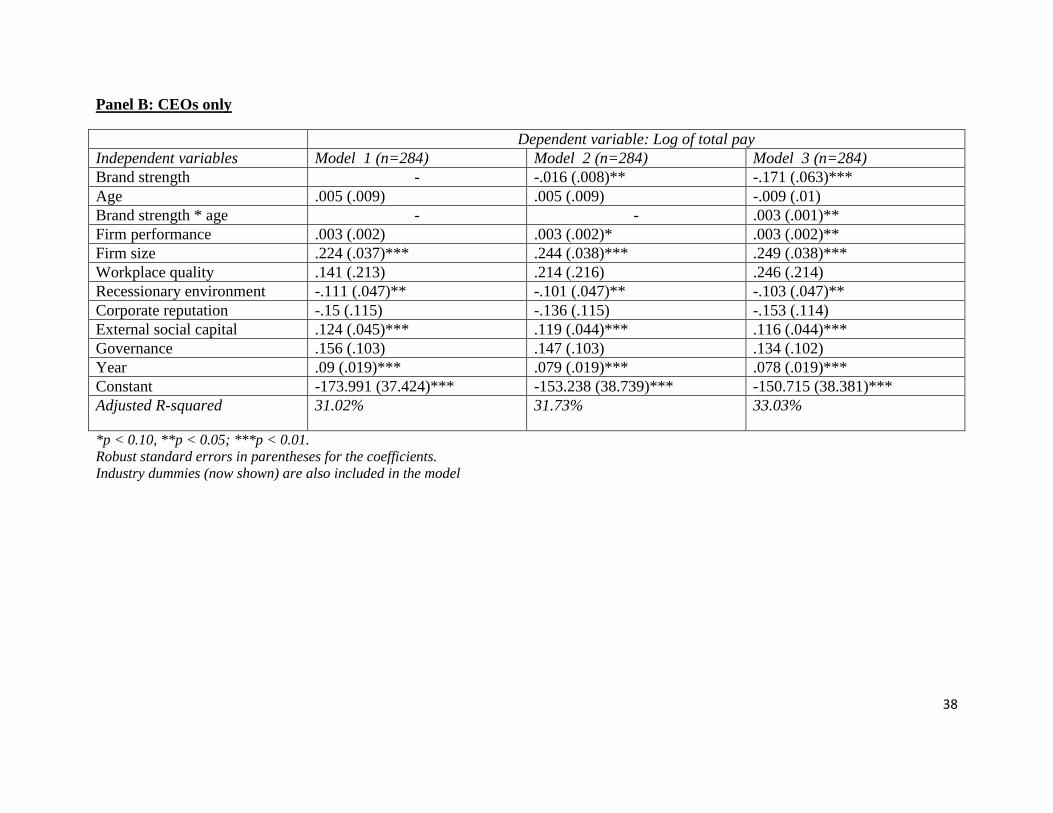
This subsample is much smaller (n=284 for CEOs and n=616 for all executives) and
contains one observation per executive. We therefore use OLS to estimate two models which
include the same dependent and independent variables as in equations (1) and (2). Results are
reported in Panel A of Table 4 for the overall sample of executives and in Panel B of Table 4 for
CEOs. The effect of brand strength on pay remains significantly negative for both subsamples
(p<.05). Furthermore, the negative effect of brand strength remains more pronounced for CEOs
than other executives (p<.01), and for younger executives (p<.05).
Are the results robust to alternative specifications of our models?
We next present results from a series of analyses designed to check the robustness of our
results.
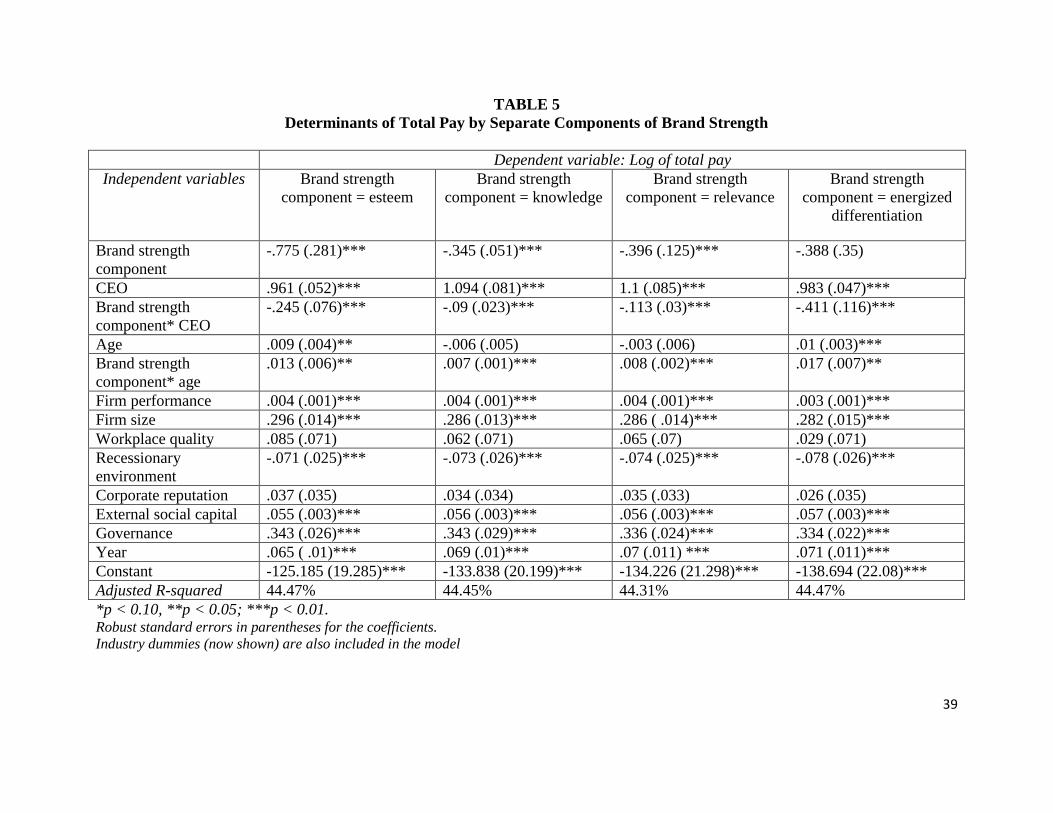
1. Alternate measures of the independent variables: As mentioned earlier, brand strength
is a composite measure of what is commonly referred to as the four brand pillars of brand equity:
Knowledge, Esteem, Relevance and Energized Differentiation. We verify the robustness of our
results for each of the four pillars. We replace brand strength by Knowledge, respectively
Esteem, Relevance and Energized Differentiation in Equation (1) and estimate our model in each
of these four cases. The results are presented in Table 5. H2 and H3 are supported for all four
components of brand strength while H1 is supported for Knowledge, Esteem and Relevance
(p<.05) but not for Energized Differentiation.
Second, we re-estimate our model using two alternate measures of firm performance. We
obtain results consistent with these presented in Table 3 if we replace our main performance
variable (percentage change in sales) with earnings per share, respectively changes in market
value obtained from COMPUSTAT. Third, we check whether the results hold for the subsample
of firms using a mono-brand (branded house) versus a house of brands strategy. Seventy-seven
24
percent of our observations belong to firms that can be ascribed to a mono-brand strategy: all our
results hold for this subsample. H1and H3 are also supported in the much smaller subsample of
firms that do not use their corporate brands on the products they sell, but H2 is not. The fact that
the negative effect of brand strength on pay is not stronger for CEOs in this subsample could be
due to the significantly lower power of the statistical tests (the effect is directionally consistent
with the one obtained in the larger sample), but it could also be due to a weaker identity transfer
from the equity of the firm’s brands to the CEO.
2. Alternate measures of the dependent variable. In line with prior research (Deng and
Gao 2013; Kaplan and Rauh 2010; Webb 2008) our primary model specification and results use
total pay as the dependent variable. This measure has the merit of being the most comprehensive
measure of executive pay. To test robustness to alternate specifications, we also examine if our
hypothesized variables have a similar effect on the equity-based portion of executive
compensation. We estimate Model 3 from Table 3 using the log of equity-based portion of total
compensation as the dependent variable, first for the overall sample of all executives and then for
the sample of CEOs. The results (available from the authors) mirror closely those presented in
Table 4 for total pay. All three hypotheses are supported if this partial measure of pay is used in
each of the two samples (p<.05 or smaller). Additionally, we use the log of salary as a dependent
variable and we re-estimate Model 3 for each of the two samples. None of the hypothesized
relationships are supported if salary alone is used as a dependent measure of performance.
3. Additional control variables. We collected data on an additional set of control
variables that could potentially impact pay. To check for differences in pay between male and
female executives, we added a gender dummy to the model (less than 10% of all executives in
our data are women). Gender has no effect on pay. We also investigated whether idiosyncratic
25
firm risk, measured using stock return volatility over the previous time period, is positively
related to pay, but we did not find a significant effect.
Finally, for the subsample of CEOs only, we were able to obtain the date when they
joined the company. We considered the possibility that job tenure is positively related to brand
strength; in other words that executives may stay longer with companies that own strong brands,
and that their lower compensation may be a result of fewer opportunities for market adjustments
in pay. A correlation of .15 over the sample of CEOs suggests a weak positive association
between tenure and brand strength. Furthermore, our theoretical arguments of self-enhancement
can also explain why executives may stay longer at firms with strong brands, particularly the
CEOs who benefit from salient associations with these brands. To test the effect of tenure on
compensation we tried two alternative specifications of our main model: one that included the
number of years of tenure in the company, and one that included a dummy that captures whether
the CEO was an internal or an external hire. None of these potential control variables are a
significant determinant of executive pay in our sample.
An additional avenue of investigation could involve direct process measures of the
psychological processes we describe in the article. We did not have access to the executives’
own brand perceptions or to the degree to which they perceived brand-based benefits. Such an
investigation is beyond the scope of this article and we leave it as an opportunity for future
research.
4. Endogeneity check. We acknowledge the possibility that there may be determinants of
compensation that we have not accounted for, despite our best efforts to retrieve all previously
documented drivers of executive pay. If there are variables not included in our model that are
positively associated with brand strength and negatively associated with compensation, then our
26
estimation could suffer from endogeneity. As a first step in alleviating such concerns we provide
a robustness check that suggests that endogeneity cannot fully explain the pattern of our results.
We use as instruments “deep lags” of variables that are related to the potentially endogenous
variable (see Malmendier, Tate, and Yan 2010). Although correlated with the endogenous
variable in question, the appropriate instrumental variable in this case should not be correlated
with the error term in the explanatory equation.
We use deep lags of advertising expenditures as instruments for brand strength.
Specifically, we use the log of advertising expenditures measured five years prior to the year in
which brand strength is measured as the instrumental variable in a 2SLS equation. Past
advertising expenditures should have contributed to building a stronger brand and should be
correlated with brand strength. At the same time, advertising expenditures lagged five years are
not correlated with the error term in the equation that predicts executive pay. We estimate a
generalized 2SLS type model for panel data which uses lagged advertising as an instrument for
brand strength. The first stage regression shows that lagged advertising is a strong determinant of
brand strength (z=6.48, p<0.01). The second stage regression shows that the main effect of brand
strength, as well as our two hypothesized interactions remain significant at p<.05 even when
brand strength is instrumented. Though not definitive, these results suggest that our results are
robust when an instrumentation approach is used.
Additional analysis and alternative explanations
1. Can executives employed by strong brands use this brand equity to command a higher
salary in subsequent jobs? An affirmative answer to this question would provide an additional
test of our theory. However, the data requirements for empirically testing it are stringent.
Specifically, we need a subsample of executives who have moved from one public S&P 1500
27
company to another, in the same year or consecutive years within our sample period, and who
have remained one of the top five paid executives in their new firm in order to be listed in
ExecuComp. Furthermore, we also need to ensure that the previous company that the executive
has been at should have their brand(s) tracked by BAV Consulting, and ideally that the new
company that the executive has joined should have their brand(s) tracked by BAV Consulting.
There are only 84 executives who fulfil the first two conditions and 41 who fulfil all three
conditions. For these executives, in the first year on their new job, we do indeed find a positive
relationship between previous brand strength and current total pay using a simple OLS model
with heteroskedasticity adjusted robust standard errors. We note that in the sample of 41
executives for which we have brand strength for both their past and current job we no longer find
a significant effect of the current brand strength, even though the sign continues to be negative.
We caution that these results constitute just a preliminary foray into studying the relationship
between previous job brand strength and current pay and more research using larger sample is
needed to draw definitive conclusions.
2. Could firm risk explain the effects? A different source of employee-based brand equity
– one not related to identity – is that high brand equity is associated with lower firm risk
(Madden, Fehle, and Fournier 2006). For example, brand strength has been linked to increased
revenue certainty and decreased revenue volatility based on brand loyalty. This has been linked
to a lower cost of debt via higher credit ratings (Larkin 2013) and, more generally, the value of
the firm beyond what is captured by current revenues (Mizik and Jacobson 2009). From an
executive’s perspective, lower financial risk translates into lower expected earnings volatility and
higher job security. A risk-averse executive would, therefore, require lower levels of pay at
strong brands because earnings are more certain (e.g., Akerlof and Kranton 2005).
28
While this risk-based explanation has the potential to explain or contribute to the main
effect in H1, it does not predict the significant interactions proposed by H2 and H3. Indeed, it
makes precisely the opposite prediction of H3. This is because older executives are typically
more risk averse (e.g., Hambrick and Mason 1984; Veiga 1983), and they should value strong
brands’ lower expected risk and associated earnings and job certainty more than do younger
executives. We found the opposite, namely that younger and not older executives are more
willing to accept lower pay at stronger brands. We also note that we did not find a significant
effect of idiosyncratic firm risk on total compensation, but that the effect of brand strength on
compensation remains significantly negative even when risk is added to the compensation
model.
IMPLICATIONS
Our overarching message is an appeal to broaden contemporary thinking and practice
about the scope of brand equity. Our findings imply that academics and practitioners should
extend the scope of their thinking and actions about the ways in which (1) brands create value,
(2) returns to marketing are measured, and (3) marketers can engage in human resource and
finance activities.
Look for brand value beyond customer-based brand equity
The employee-based view of brand equity that we propose should encourage managers to
fundamentally rethink how brands create value for firms. Brand equity is generally seen as
synonymous with customer-based brand equity; consequently, the focus has overwhelmingly
been on returns to brand equity through potential increases in revenues. This perspective is
advocated by leading academics who study customer-based returns to brand equity (such as
loyalty, retention and cross selling) while explicitly excluding other sources of brand value: “a
29
mature business would be hard-pressed to increase profits otherwise” (Rust, Zeithaml and
Lemon 2004, p. 110). Popular measures of brand value are similarly predicated only on
customer-based returns. For instance, WPP, the world’s largest marketing services company,
argues that the financial contribution of brands to firms’ earnings is based on “the power of
brand where it most counts—in the mind of the consumer” (Roth 2013). And, Interbrand’s Brand
Value Chain is based on “the portion of the purchase decision that is attributable to the brand …
and the ability of the brand to create loyalty and, therefore, to keep generating demand and profit
into the future” (Interbrand 2013).
We argue that brand equity is a far broader construct. The employee-based view of brand
equity emphasizes that strong brands can enhance earnings through cost reductions, making it
possible for firms to employ key personnel more cheaply. Moreover, our theoretical arguments
and empirical results suggest that the impact of these investments may touch those at the very
pinnacle of firms: the top managers who are so often accused of underappreciating the value of
marketing in their firms. As we note below, this broadened view of brand equity offers new
possibilities for research and practice on how to value brands on the balance sheet, how to
measure returns to investments in brands, and how to transcend traditional functional boundaries.
Broaden the scope of marketing metrics
A recent survey suggests that “The majority (70 per cent) of CEOs have lost trust in
marketers’ ability to deliver growth after becoming frustrated by what they see as an inability to
prove ROI” (Marketing Week 2012). Marketing academics have similarly argued that the
inability to account for marketing’s contribution to firm performance is a key factor in
marketers’ loss of internal stature (Webster, Malter, and Ganesan 2005), a conclusion that
reflects over a decade of scholarly debate about marketers facing pressures for greater
30
accountability (Rust et al. 2004). The insights from our research suggest that the challenge of
assessing returns to marketing will not be resolved solely by measuring things right (Ambler
2003). Marketing researchers should also seek to measure the right things. Thus, we hope that
our findings provide an impetus for more research that demonstrates how market based assets
can lead to employee-based returns.
Make brand core to human resource practices
One reason brands may not be emphasized as much as they should be in human resource
(HR) management is that brands are often seen as the domain of marketing. In the realm of pay,
HR-led communications are likely to emphasize the firm’s credentials as a great place to work.
Research on employer branding (see Ambler and Barrow 1996) has focused mostly on the extent
to which HR can leverage brands to successfully recruit (e.g., Hieronimus, Schaefer, and
Schröder 2005). Our research shows that a strong brand can do more than help recruit; it can go
as far as to lower the compensation that new recruits are willing to take. Thus, in their
recruitment efforts and the popular practice of pay benchmarking, HR departments should
leverage the strength of the brand just as they leverage the tangible advantages that employees of
the firm receive. A better understanding of the role brands play in recruitment might help break
down the organizational silos on which marketing and HR departments operate. Our research
represents merely an early beginning to what could be a promising field of study of the impact of
brands on HR practices.
Expand the scope of research on the marketing-finance interface
The employee-based brand equity perspective also has implications for the marketing-
finance interface. Although research on this has seen an explosive growth in recent years (for a
review, see Srinivasan and Hanssens 2009) most papers tend to focus on how Wall Street
31
responds to marketing actions and investments. By combining research on a core finance
variable, executive pay, with a core marketing variable, brand equity, we propose here another
promising area for research on the interface between marketing and finance.
Many discussions of the seemingly inexorable increases in executive pay in recent
decades imply that executives hold much of the bargaining power in pay discussions, and that
nothing short of government action can alter this equilibrium. Backlash to what has been
considered obscene executive pay has ranged from the “say-on-pay” provision of the Dodd-
Frank Wall Street Reform and Consumer Protection Act which requires shareholder approval of
executive compensation, to national referendums like the one held in Switzerland where 68% of
voters backed curbs on corporate wages that take the power away from company boards
(Economist 2013).
Our results suggest that compensation committees can use brand equity as an effective
bargaining tool when establishing executive pay. Among all executives, strong brands are most
likely to be effective in negotiations with CEOs, who because of their apparent power, influence,
and wealth, are seen by many as the archetypical “fat cats.” In executive compensation
negotiations, governing boards of firms with strong brands should, therefore, emphasize the
equity transfer benefits of strong brands and also adjust peer pay benchmarks according to brand
strength.
Researchers in corporate finance and strategy who study the determinants of executive
pay typically focus on observable firm characteristics such as firm size and performance, or
managerial characteristics such as gender and rank in the organization (e.g., Graham, Li, and Qiu
2012; Tosi et al. 2010). Our research presents theoretical arguments and empirical evidence to
suggest that the effects of these factors – which have been the focus of a vast literature in
32
finance, economics, and management – are actually contingent on a key marketing variable:
brand equity. Failing to recognize these contingencies can result in potentially erroneous
conclusions on the highly charged topic of executive pay.
CONCLUSION
The employee-based brand equity perspective we offer argues and empirically
demonstrates a novel dimension of the impact of brand equity. Conceptually, we highlight the
role that brands play in shaping executives’ identity, a core human need, and one of the most
widely applied concepts in social psychology and consumer behavior. Empirically, we use data
on 2,717 top executives over an 11 year period to show that firms with strong brands pay their
top executives less than other firms, and that this effect is stronger for CEOs and for younger
executives. Our results imply that academics and practitioners should take a broader view of the
contributions of brands to firm value. Moreover, they should make use of strong brands in pay
negotiations that are typically viewed as being outside the realm of marketing.
33
TABLE 1
Variables and Data Sources
Conceptual variable Measured Variable Data Source
Dependent variable
Total pay Logarithm of total compensation (tdc2
measure from ExecuComp)
ExecuComp
Independent variables
Brand strength Brand Asset metric Young & Rubicam
BAV metrics
Leadership position (CEO) Dummy variable which takes the value
1 if the executive is the firm’s CEO and
0 otherwise
ExecuComp
Executive age Age of the executive ExecuComp
Control variables
External social capital Number of company boards that the
executive sits on (public and private)
BoardEx
Firm performance Percentage change in sales from
previous year
COMPUSTAT
Firm size Logarithm of total assets COMPUSTAT
Firm governance Dummy variable which takes the value
1 if the firm’s CEO is also the chairman
and 0 otherwise
ExecuComp
Quality of workplace Dummy variable which takes the value
1 if the firm is listed in the top 100 Best
Companies to Work For annual ranking,
0 otherwise
Fortune Magazine
Corporate reputation Dummy variable which takes the value
1 if the firm is listed in Most Admired
Companies annual ranking, 0 otherwise
Fortune Magazine
Recessionary environment Number of negative GDP growth
quarters in the previous year.
Trading
Economics
Industry controls Set of dummy variables based on SIC
codes
COMPUSTAT
34
TABLE 2
Correlation Matrix and Descriptive Statistics
Mean St. Dev. (1) (2) (3) (4) (5) (6) (7) (8) (9) (10) (11)
Log of total
compensation (1)
7.81
1.14 1
Brand Strength (2) 4.92 5.82 0.048 1
CEO(3) .19 .39 0.358 0.001 1
Age (4) 51.79 7.14 0.301 0.005 0.205 1
Firm performance
(5)
8.04
28.39 0.096 0.036 -0.009 -0.024 1
Firm size (log of
assets measured in
millions) (6)
8.94
1.83 0.491 0.204 -0.004 0.155 0.022 1
Workplace quality
(7)
0.08
0.28 0.076 0.135 0.007 -0.02 -0.001 0.137 1
Corporate
reputation (8)
0.42
0.49 0.224 0.233 -0.004 0.081 -0.047 0.489 0.205 1
Governance (9) 0.16 0.37 0.357 0.008 0.643 0.335 -0.01 0.082 0.008 0.055 1
External social
capital (10)
1.72
2.26 0.239 0.006 0.021 0.156 0.053 0.248 0.048 0.124 0.089 1
Recessionary
environment (11)
0.81
1.16 -0.024 -0.054 -0.005 0.039 -0.129 -0.021 -0.021 -0.083 -0.004 -0.077 1
35
TABLE 3
Determinants of Total Pay: Full Sample
Panel A: All top executives
Dependent variable: Log of total pay
Independent variables Model 1: Regression
with Driscoll-Kraay
standard errors
(n=10,107)
Model 2: Random
effects GLS
(n=10,107)
Model 3: Regression
with Driscoll-Kraay
standard errors
(n=10,107)
Model 4: Random
effects GLS
(n=10,107)
Brand strength - - -.071 (.021)*** -.086 (.019)***
CEO .778 (.024)*** .649 (.046)*** .89 (.035)*** .722 (.057)***
Brand strength * CEO - - -.023 (.007)*** -.016 (.006)**
Age .018 (.003)*** .023 (.002)*** .012 (.003)*** .016 (.002)***
Brand strength* age - - .001 (.0004)*** .002 (.0003)***
Firm performance .004 (.001)*** .003 (.001)*** .004 (.001)*** .003 (.001)***
Firm size .283 (0.014)*** .298 (.009)*** .291 (.014)*** .307 (.009)***
Workplace quality .063 (0.068) .025 (.047) .082 (.07) .035 (.047)
Recessionary environment -.074 (0.026)*** -.079 (.007)*** -.072 (.024)*** -.076 (.007)***
Corporate reputation .026 (0.037) .005 (.024) .035 (.035) .009 (.024)
External social capital .056 (0.003)*** .053 (.007)*** .055 (.003)*** .052 (.007)***
Governance .336 (0.024)*** .226 (.048)*** .331 (.026)*** .224 (.048)***
Year .069 (0.011)*** .083 (.004)*** .067 (.01)*** .079 (.004)***
Constant -135.260 (21.708)*** -162.457 (8.709)*** -129.881 (20.205)*** -155.209 (8.999)***
Adjusted R-squared 44.1% 43.4% 44.5% 43.7% *p < 0.10, **p < 0.05; ***p < 0.01.
Robust standard errors in parentheses for the coefficients.
Industry dummies (now shown) are also included in the model
36
Panel B: CEOs only
Dependent variable: Log of total pay
Independent variables Model 1: Regression
with Driscoll-Kraay
standard errors
(n=1,869)
Model 2: Random
effects GLS
(n=1,869)
Model 3: Regression
with Driscoll-Kraay
standard errors
(n=1,869)
Model 4: Random
effects GLS
(n=1,869)
Brand strength - - -.182 (.021)*** -.124 (.041)***
Age .022 (.006)*** .0198 (.006)*** .008 (.004)** .011 (.007)
Brand strength* age - - .003 (.0003)*** .002 (.001)**
Firm performance .004 (.001)*** .004 (.001)** .005 (.001)*** .004 (.001)***
Firm size .263 (.008)*** .278 (.025)*** .295 (.011)*** .300 (.024)***
Workplace quality -.042 (.15) .029 (.129) .028 (.147) .057 (.124)
Recessionary environment -.075 (.031)** -.074 (.017)*** -.066 (.028)** -.068 (.017)***
Corporate reputation .011 (.036) -.006 (.06) .026 (.037) -.002 (.059)
External social capital .075 (.032)** .081 (.027)*** .07 (.035) ** .079 (.027)***
Governance .133 (.035)*** .087 (.066) .102 (.034)*** .078 (.066)
Year .062 (.012)*** .071 (.011)*** .053 (.011)*** .063 (.012)***
Constant -119.524 (23.788)*** -137.595 (22.198)*** -100.129 (22.103)*** -121.119 (23.066)***
Adjusted R-squared 25.8% 25.4% 27.7% 27.2% *p < 0.10, **p < 0.05; ***p < 0.01.
Robust standard errors in parentheses for the coefficients.
Industry dummies (now shown) are also included in the model
37
TABLE 4
Determinants of Total Pay: First Year after Appointment
Panel A: All top executives
Dependent variable: Log of total pay
Independent variables Model 1 (n=616) Model 2 (n=616) Model 3 (n=616)
Brand strength - -.014 (.006)** -.101 (.04)**
CEO .983 (.07)*** 1.003 (.07)*** 1.114 (.083)***
Brand strength * CEO - - -.026 (.011)**
Age .011 (.005)** .011 (.005)** .002 (.006)
Brand strength * age - - .002 (.001)***
Firm performance .003 (.001)** .003 (.001)*** .003 (.001)***
Firm size .263 (.023)*** .281 (.024)*** .28 (.024)***
Workplace quality .078 (.148) .133 (.149) .15 (.148)
Recessionary environment -.034 (.028) -.029 (.028) -.027 (.028)
Corporate reputation -.115 (.076) -.115 (.076) -.111 (.075)
External social capital .044 (.015)*** .041 (.015)*** .04 (.015)**
Governance .206 (.084)** .203 (.084)** .195 (.084)**
Year .07 (.012)*** .063 (.012)*** .063 (.012)***
Constant -136.579 (23.983)*** -121.721 (24.743)*** -121.201 (24.574)***
Adjusted R-squared 58.17% 58.47% 59.1% *p < 0.10, **p < 0.05; ***p < 0.01.
Robust standard errors in parentheses for the coefficients.
Industry dummies (now shown) are also included in the model
38
Panel B: CEOs only
Dependent variable: Log of total pay
Independent variables Model 1 (n=284) Model 2 (n=284) Model 3 (n=284)
Brand strength - -.016 (.008)** -.171 (.063)***
Age .005 (.009) .005 (.009) -.009 (.01)
Brand strength * age - - .003 (.001)**
Firm performance .003 (.002) .003 (.002)* .003 (.002)**
Firm size .224 (.037)*** .244 (.038)*** .249 (.038)***
Workplace quality .141 (.213) .214 (.216) .246 (.214)
Recessionary environment -.111 (.047)** -.101 (.047)** -.103 (.047)**
Corporate reputation -.15 (.115) -.136 (.115) -.153 (.114)
External social capital .124 (.045)*** .119 (.044)*** .116 (.044)***
Governance .156 (.103) .147 (.103) .134 (.102)
Year .09 (.019)*** .079 (.019)*** .078 (.019)***
Constant -173.991 (37.424)*** -153.238 (38.739)*** -150.715 (38.381)***
Adjusted R-squared 31.02% 31.73% 33.03%
*p < 0.10, **p < 0.05; ***p < 0.01.
Robust standard errors in parentheses for the coefficients.
Industry dummies (now shown) are also included in the model
39
TABLE 5
Determinants of Total Pay by Separate Components of Brand Strength
Dependent variable: Log of total pay
Independent variables Brand strength
component = esteem
Brand strength
component = knowledge
Brand strength
component = relevance
Brand strength
component = energized
differentiation
Brand strength
component
-.775 (.281)*** -.345 (.051)*** -.396 (.125)*** -.388 (.35)
CEO .961 (.052)*** 1.094 (.081)*** 1.1 (.085)*** .983 (.047)***
Brand strength
component* CEO
-.245 (.076)*** -.09 (.023)*** -.113 (.03)*** -.411 (.116)***
Age .009 (.004)** -.006 (.005) -.003 (.006) .01 (.003)***
Brand strength
component* age
.013 (.006)** .007 (.001)*** .008 (.002)*** .017 (.007)**
Firm performance .004 (.001)*** .004 (.001)*** .004 (.001)*** .003 (.001)***
Firm size .296 (.014)*** .286 (.013)*** .286 ( .014)*** .282 (.015)***
Workplace quality .085 (.071) .062 (.071) .065 (.07) .029 (.071)
Recessionary
environment
-.071 (.025)*** -.073 (.026)*** -.074 (.025)*** -.078 (.026)***
Corporate reputation .037 (.035) .034 (.034) .035 (.033) .026 (.035)
External social capital .055 (.003)*** .056 (.003)*** .056 (.003)*** .057 (.003)***
Governance .343 (.026)*** .343 (.029)*** .336 (.024)*** .334 (.022)***
Year .065 ( .01)*** .069 (.01)*** .07 (.011) *** .071 (.011)***
Constant -125.185 (19.285)*** -133.838 (20.199)*** -134.226 (21.298)*** -138.694 (22.08)***
Adjusted R-squared 44.47% 44.45% 44.31% 44.47%
*p < 0.10, **p < 0.05; ***p < 0.01. Robust standard errors in parentheses for the coefficients.
Industry dummies (now shown) are also included in the model
40
REFERENCES
Aaker, David A. (1991), Managing Brand Equity: Capitalizing on the Value of a Brand
Name, New York: The Free Press.
Aaker, David A. (2004), “Leveraging the Corporate Brand,” California Management Review,
46(3), 6-18.
Agarwal, Manoj K. and Rao, Vithala R. (1996), “An Empirical Comparison of Consumer-
Based Measures of Brand Equity,’’ Marketing Letters, 7 (3), 237-247.
Ailawadi, Kusum L., Donald R. Lehmann, and Scott A. Neslin (2003), “Revenue Premium as
an Outcome Measure of Brand Equity,” Journal of Marketing, 67 (October), 1–17.
Akerlof, George A. and Rachel E. Kranton (2005), “Identity and the Economics of
Organizations,” The Journal of Economic Perspectives, 19 (Winter), 9-32.
——— and ——— (2008), “Identity, Supervision, and Work Groups,” The American
Economic Review, 98(2), 212-217.
Ambler, Tim (2003), Marketing and the Bottom Line: The Marketing Metrics that Will Pump
Up Cash Flow, Pearson Education.
———& Barrow, Simon (1996), “The Employer Brand,” Journal of Brand Management, 4,
185-206.
Ashforth, Blake E. and Fred Mael (1989), “Social Identity Theory and the Organization,”
Academy of Management Review, 14 (January), 20–39.
Bearden, William O. and Michael J. Etzel (1982), “Reference Group Influence on Product
and Brand Purchase Decisions,” Journal of Consumer Research, 9 (September), 183-194.
Bebchuk, Lucian A. and Jesse M. Fried (2004), Pay Without Performance: The Unfulfilled
Promise of Executive Compensation. Harvard University Press, Cambridge, Massachusetts
and London, England.
Belliveau, Maura A., Charles A. O’Reilly III, and James B. Wade (1996), “Social Capital at
the Top: Effects of Social Similarity and Status on CEO Compensation,” Academy of
Management Journal, 39 (6), 1568-1593.
Bettman, James R. and Barton A. Weitz (1983), “Attributions in the Board Room: Causal
Reasoning in Corporate Annual Reports,” Administrative Science Quarterly, 28 (June), 165–
184.
Brown, Brad, and Susan Perry (1994), “Removing the Financial Performance Halo from
Fortune's ‘Most Admired’ Companies,” Academy of Management Journal, 37(5), 1347-1359.
Cable, Daniel M. and Daniel B. Turban (2003), “The Value of Organizational Reputation in
the Recruiting Context: A brand Equity Perspective,” Journal of Applied Social Psychology,
33 (November), 2244–2266.
41
Cadman, Brian, Mary Ellen Carter, and Luann Lynch (2012), “Executive Compensation
Restrictions: Do They Restrict Firms' Willingness to Participate in TARP?” Journal of
Business Finance & Accounting. 39 (7/8), 997-1027.
Cao, Zixia and Alina Sorescu (2013), “Wedded Bliss or Tainted Love?: Stock Market
Reactions to the Introduction of Co-branded Products,” Marketing Science, 32(6), 939-959.
Christodoulides, George and Leslie de Chernatony (2010), “Consumer Based Brand Equity
Conceptualization and Measurement: A Literature Review,” International Journal of
Research in Marketing, 52(1), 43-66.
Cialdini, Robert B., Richard J. Borden, Avril Thorne, Marcus R. Walker, Stephen Freeman,
and Lloyd R. Sloan (1976), “Basking in Reflected Glory: Three (Football) Field Studies,”
Journal of Personality and Social Psychology, 34 (3), 366-375.
Clark, Tom S. and Linzer, Drew A. (2013), “Should I Use Fixed or Random Effects?”
(accessed June 29, 2013), [available at
http://userwww.service.emory.edu/~tclark7/randomeffects.pdf].
Cobb-Walgren, Cathy J., Ruble, Cynthia A., and Donthu, Naveen (1995), “Brand Equity,
Brand Preference, and Purchase Intent,” Journal of Advertising, 24(3), 25-40.
Core, John E., Robert W. Holthausen, and David F. Larcker (1999), “Corporate Governance,
Chief Executive Officer Compensation, and Firm Performance,” Journal of Financial
Economics, 51 (March), 371-406.
Deng, Xin, and Huasheng Gao (2013), "Nonmonetary Benefits, Quality Of Life, and
Executive Compensation," Journal of Financial and Quantitative Analysis, 48(1), 197-218.
DelVecchio, Devon, Cheryl B. Jarvis, Richard R. Klink and Brian R. Dineen (2007),
“Leveraging Brand Equity to Attract Human Capital,” Marketing Letters, 18 (April), 149–
164.
Driscoll, John and Aart C. Kraay (1998), “Consistent Covariance Matrix Estimation with
Spatially Dependent Data,” Review of Economics and Statistics, 80: 549-560.
Du Gay, Paul (1995), Consumption and Identity at Work, Thousand Oaks, CA: Sage.
Dutton, Jane E. and Janet M. Dukerich (1991), “Keeping An Eye on the Mirror: Image and
Identity In Organizational Adaptation”, Academy of Management Journal, 34 (3), 517–554.
———, ——— and Celia V. Harquail (1994), “Organizational Images and Member
Identification,” Administrative Science Quarterly, 39 (2), 239-263.
Faleye, Olubunmi, and Emery A. Trahan (2011), “Labor-Friendly Corporate Practices: Is
What is Good for Employees Good for Shareholders?” Journal of Business Ethics, 101, 1–27.
Fombrun, Charles and Mark Shanley (1990), “What’s in a Name? Reputation Building and
Corporate Strategy,” Academy of Management Journal, 33(2), 233-258.
Frydman, Carola and Raven E. Saks (2010), “Executive Compensation: A New View from a
Long-Term Perspective, 1936–2005,” Review of Financial Studies, 23 (5), 2009-2138.
42
Garrahan, Matthew (2013), “Loneliness of 72m BlackBerry Owners,” Financial Times,
August 28, www.ft.com.
Gomez-Mejia, Luis R. (2001), Managing Human Resources. New Jersey: Prentice Hall.
Gomez-Mejia, L. R., Tosi, H., and Hinkin, T. (1987), “Managerial Control, Performance, and
Executive Compensation,” Academy Of Management Journal, 30(1), 51-70.
Graham, John R., Si Li, and Jiaping Qiu (2012), “Managerial Attributes and Executive
Compensation,” Review of Financial Studies, 25 (1), 144-186.
Gupta, Sunil, Lehmann, Donald, and Ames Stuart, Jennifer. (2004), “Valuing
Customers.” Journal of Marketing Research, 7-18.
Hambrick, Donald C. and Phyllis A. Mason (1984), “Upper Echelons: The Organization as a
Reflection of Its Top Managers,” AMR, 9 (2), 193-206.
Han, Young Jee, Joseph C. Nunes, and Xavier Drèze (2010), “Signaling Status with Luxury
Goods: The Role of Brand Prominence,” Journal of Marketing, 74 (July), 15-30.
He, Lerong (2008), “Do Founders Matter? A Study of Executive Compensation, Governance
Structure and Firm Performance,” Journal of Business Venturing, 22 (3), 257-279.
Hermalin, Benjamin E. (2005), “Trends in Corporate Governance,” Journal of Finance, 60
(5), 2351-2384.
Hieronimus, Fabian, Katharina Schaefer, and Jurgen Schroder (2005), “Using Branding to
Attract Talent,” The McKinsey Quarterly, 3, 12–14.
Hoechle, Daniel (2007), “Robust Standard Erros for Panel Regressions with Cross-Sectional
Dependence,” The Stata Journal, 7(3), 281-312.
Hogg, Michael A. and Deborah I. Terry (2000), “Social Identity and Self-Categorization
Processes in Organizational Contexts,” The Academy of Management Review, 25 (1), 121-
140.
Hughes, Douglas E. and Michael Ahearne (2010), “Energizing the Reseller's Sales Force:
The Power of Brand Identification,” Journal of Marketing, 74 (4), 81-96.
Interbrand (2013), “Brand Valuation: A Versatile Strategic Tool for Business,”
http://www.interbrand.com/Libraries/Articles/Brand_Valuation_Final.sflb.ashx; accessed
30/8/2013.
Johnson, Michael D., Frederick P. Morgeson, Daniel R. Ilgen, Christopher J. Meyer, and
James W. Lloyd (2006), “Multiple Professional Identities: Examining Differences in
Identification Across Work Related Targets,” Journal of Applied Psychology, 91 (2), 498–
506.
Kaplan, Steven N., and Joshua Rauh (2010), "Wall Street and Main Street: What Contributes
to the Rise in the Highest Incomes?," Review of Financial Studies 23(3), 1004-1050.
43
Keller, Kevin Lane (1993), “Conceptualizing, Measuring, and Managing Customer-Based
Brand Equity,” Journal of Marketing, 57 (January), 1–22.
——— (2003), “Brand Synthesis: The Multidimensionality of Brand Knowledge,” Journal of
Consumer Research, 29(4), 595-600.
King, Ceridwyn and Debra Grace. "Employee Based Brand Equity: A Third Perspective,"
Services Marketing Quarterly 30( 2), 122-147.
Larkin, Yelena (2013), “Brand Perception, Cash Flow Stability, and Financial Policy,”
Journal of Financial Economics, 110(1), 232-253.
Leone, Robert P., Vithala R. Rao, Kevin Lane Keller, Anita Man Luo, Leigh McAlister, and
Rajendra Srivastava (2006), "Linking Brand Equity to Customer Equity," Journal Of Service
Research, 9(2), 125-138
Levy, Sidney J. (1959), “Symbols for Sale,” Harvard Business Review, 37 (July-August),
117-24.
Madden, Thomas. J., Fehle, Frank, and Fournier, Susan (2006), “Brands Matter: An
Empirical Demonstration of the Creation of Shareholder Value through Branding,” Journal of
the Academy of Marketing Science, 34(2), 224-235
Mael, Fred and Blake E. Ashforth (1992), “Alumni and Their Alma Mater: A Partial Test of
the Reformulated Model of Organizational Identification,” Journal of Organizational
Behavior, 13 (2), 103–123.
Malmendier, Ulrike, Tate, Geoffrey and Yan Jonathan (2010), “Overconfidence and Early-
Life Experiences: The Impact of Managerial Traits on Corporate Financial Policies,” NBER
Working Paper Series, available at http://www.nber.org/papers/w15659.pdf
McKnight, Phillip J., Cyril Tomkins, Charlie Weir, and David Hobson (2000), “CEO Age
and Top Executive Pay: A UK Empirical Study,” Journal of Management and Governance, 4
(3), 173–187.
Mizik, Natalie and Robert Jacobson (2008), “The Financial Value Impact of Perceptual
Brand Attributes,” Journal of Marketing Research, 45 (February), 15–32.
——— and ——— (2009), “Valuing Branded Businesses,” Journal of Marketing Research,
73 (6), 137–153.
Muniz, Albert M. , Jr. and Thomas C. O’Guinn (2010), “Brand Community,” Journal of
Consumer Research, 27(4), 412-432.
Phillips, James S., and Lord, Robert G. (1981), “Causal Attributions and Perceptions of
Leadership,” Organizational Behavior and Human Performance, 28(2), 143-163.
Page, Graham and Helen Fearn (2005), “Corporate Reputation: What Do Consumers Really
Care About?” Journal of Advertising Research, 45, 305-313.

44
PwC Saratoga (2012), “Key Trends in Human Capital 2012: A global perspective,”
http://www.pwc.com/en_GX/gx/hr-management-services/pdf/pwc-key-trends-in-human-
capital-management.pdf.
Reed II, Americus, Mark Forehand, Stefano Puntoni, and Luk Warlop(2012), "Identity-based
Consumer Behavior." International Journal of Research in Marketing, 29, 310-321.
Rosen, Sherwin (1982), “Authority, Control, and the Distribution of Earnings,” Bell Journal
of Economics, 13 (2), 311-323.
Roth, David (2013), “BrandZ Top 100 Most Valuable Brands 2013,”
http://www.wpp.com/~/media/Reading-
Room/BrandZ/brandz_2013_top_100_report_may13.pdf; accessed 30/8/2013.
Rust, Roland T., Tim Ambler, Gregory S. Carpenter, V. Kumar, and Rajendra K. Srivastava
(2004), "Measuring Marketing Productivity: Current Knowledge and Future Directions,"
Journal Of Marketing 68(4), 76-89.
_________, Valerie A. Zeithaml, and Katherine N. Lemon (2004), “Customer-Centered
Brand Management,” Harvard Business Review, 82(September), 110–118.
Scott, Susanne G., and Vicki R. Lane (2000), “A Stakeholder Approach to Organizational
Identity,” Academy of Management Review, 25(1), 43-62.
Shapiro, Carl (1982), “Consumer Information, Product Quality and Seller Reputation,” The
Bell Journal of Economics, 13(1), 20-35.
Society for Human Resource Management (2008), “SHRM 2011-2012 Human Capital
Benchmarking Study,” Alexandria, VA: SHRM.
Solomon, Michael R. (1983), “The Role of Products as Social Stimuli: A Symbolic
Interactionism Perspective,” Journal of Consumer Research, 10 (December), 319-329.
Spence, Michael (1973), “Job Market Signaling,” The Quarterly Journal of Economics, 87
(3), 355-374.
Srinivasan, V., Chan Su Park, and Dae Ryun Chang (2005), “An Approach to the
Measurement, Analysis, and Prediction of Brand Equity and its Sources,” Management
Science, 51 (9), 1433–48.
Srinivasan, Shuba, and Dominique M Hanssens (2009), "Marketing and Firm Value: Metrics,
Methods, Findings, and Future Directions," Journal of Marketing Research 46(3), 293-312.
Srivastava, Rajendra K., Tasadduq A. Shervani, and Liam Fahey (1998), “Market-Based
Assets and Shareholder Value: A Framework for Analysis,” Journal of Marketing, 62
(January), 2–18.
Stahl, Florian, Mark Heitmann, Donald R. Lehmann, and Scott A. Neslin (2012), “The
Impact of Brand Equity on Customer Acquisition, Retention, and Profit Margin,” Journal of
Marketing, 76 (January), 44-63.
45
Tajfel, Henri (1978), Differentiation Between Social Group: Studies in the Social Psychology
of Intergroup Relations. London: Academic Press.
——— and John C. Turner (1985), “The Social Identity Theory of Intergroup Behavior,” in
Psychology of Intergroup Relations. 2nd
ed. William G. Austin and Stephen Worchel, eds.
Chicago: Nelson-Hall, 7-24.
Terviö, Marko (2008), “The Difference That CEOs Make: An Assignment Model Approach,”
The American Economic Review, 98 (3), 642-668.
The Economist (2013), “Fixing the Fat Cats: Switzerland Votes to Curb Executive Pay,”
March.
Tosi, Henry L., Steve Werner, Jeffrey Katz, and Lyus R. Gomes-Meija (2000), “How Much
Does Performance Matter? A Meta-Analysis of CEO Pay Studies,” Journal of Management,
26 (2), 301-339.
Uggerslev, Krista L., Neil E. Fassina and David Kraichy (2012), “Recruiting Through the
Stages: A Meta-Analytic Test of Predictors of Applicant Attraction at Different Stages of the
Recruiting Process,” Personnel Psychology, 65(3), 597-660.
Veiga, John F. (1983), “Mobility Influences During Managerial Career Stages,” Academy of
Management Journal, 26 (1), 64–85.
Walker, Kent (2010), “A Systematic Review of the Corporate Reputation Literature:
Definition, Measurement, and Theory,” Corporate Reputation Review,12(4), 357-87.
Webb, Elizabeth (2008), “Regulator Scrutiny and Bank CEO Incentives,” Journal of
Financial Services Research, 33(1), 5-20.
Webster, Frederick E. Jr. and Alan J. Malter, and Shankar Ganesan (2005), "The Decline and
Dispersion of Marketing Competence," MIT Sloan Management Review 46(4), 35-43.
Weiss, Andrew (1995), “Human Capital vs. Signalling Explanations of Wages,” The Journal
of Economic Perspectives, 9(4), 133-154.
Wooldridge, Jeffrey M. (2002), Econometric Analysis of Cross Section and Panel Data.
Cambridge, MA: MIT Press.