
Empirical and fundamental mechanical tests in the...
192
ALMA MATER STUDIORUM – UNIVERSITÀ DI BOLOGNA Facoltà di Agraria Dipartimento di Scienze degli Alimenti Dottorato di Ricerca in Scienze degli Alimenti (AGR/15) Empirical and fundamental mechanical tests in the evaluation of dough and bread rheological properties Presentata da: Dr.ssa Federica Balestra Coordinatore: Relatore: Prof. Claudio Cavani Prof. Gian Gaetano Pinnavaia XXI Ciclo - Esame finale anno 2009 1
Transcript of Empirical and fundamental mechanical tests in the...

ALMA MATER STUDIORUM – UNIVERSITÀ DI BOLOGNA Facoltà di Agraria
Dipartimento di Scienze degli Alimenti
Dottorato di Ricerca in Scienze degli Alimenti
(AGR/15)
Empirical and fundamental mechanical tests
in the evaluation of
dough and bread rheological properties
Presentata da: Dr.ssa Federica Balestra
Coordinatore: Relatore:
Prof. Claudio Cavani Prof. Gian Gaetano Pinnavaia
XXI Ciclo - Esame finale anno 2009
1

ABSTRACT
Bread dough and particularly wheat dough, due to its viscoelastic behaviour, is probably the
most dynamic and complicated rheological system and its characteristics are very important
since they highly affect final products’ textural and sensorial properties. The study of dough
rheology has been a very challenging task for many researchers since it can provide numerous
information about dough formulation, structure and processing. This explains why dough
rheology has been a matter of investigation for several decades.
In this research rheological assessment of doughs and breads was performed by using
empirical and fundamental methods at both small and large deformation, in order to
characterize different types of doughs and final products such as bread. In order to study the
structural aspects of food products, image analysis techniques was used for the integration of
the information coming from empirical and fundamental rheological measurements.
Evaluation of dough properties was carried out by texture profile analysis (TPA), dough
stickiness (Chen and Hoseney cell) and uniaxial extensibility determination (Kieffer test) by
using a Texture Analyser; small deformation rheological measurements, were performed on a
controlled stress–strain rheometer; moreover the structure of different doughs was observed
by using the image analysis; while bread characteristics were studied by using texture profile
analysis (TPA) and image analysis.
The objective of this research was to understand if the different rheological measurements
were able to characterize and differentiate the different samples analysed. This in order to
investigate the effect of different formulation and processing conditions on dough and final
product from a structural point of view.
For this aim the following different materials were performed and analysed:
- frozen dough realized without yeast;
- frozen dough and bread made with frozen dough;
- doughs obtained by using different fermentation method;
- doughs made by Kamut® flour;
- dough and bread realized with the addition of ginger powder;
- final products coming from different bakeries.

The influence of sub-zero storage time on non-fermented and fermented dough viscoelastic
performance and on final product (bread) was evaluated by using small deformation and large
deformation methods. In general, the longer the sub-zero storage time the lower the positive
viscoelastic attributes.
The effect of fermentation time and of different type of fermentation (straight-dough method;
sponge-and-dough procedure and poolish method) on rheological properties of doughs were
investigated using empirical and fundamental analysis and image analysis was used to integrate this
information throughout the evaluation of the dough’s structure. The results of fundamental
rheological test showed that the incorporation of sourdough (poolish method) provoked changes
that were different from those seen in the others type of fermentation.
The affirmative action of some ingredients (extra-virgin olive oil and a liposomic lecithin
emulsifier) to improve rheological characteristics of Kamut® dough has been confirmed also when
subjected to low temperatures (24 hours and 48 hours at 4°C).
Small deformation oscillatory measurements and large deformation mechanical tests performed
provided useful information on the rheological properties of samples realized by using different
amounts of ginger powder, showing that the sample with the highest amount of ginger powder (6%)
had worse rheological characteristics compared to the other samples.
Moisture content, specific volume, texture and crumb grain characteristics are the major quality
attributes of bread products. The different sample analyzed, “Coppia Ferrarese”, “Pane Comune
Romagnolo” and “Filone Terra di San Marino”, showed a decrease of crumb moisture and an
increase in hardness over the storage time. Parameters such as cohesiveness and springiness,
evaluated by TPA that are indicator of quality of fresh bread, decreased during the storage. By using
empirical rheological tests we found several differences among the samples, due to the different
ingredients used in formulation and the different process adopted to prepare the sample, but since
these products are handmade, the differences could be account as a surplus value.

In conclusion small deformation (in fundamental units) and large deformation methods showed a
significant role in monitoring the influence of different ingredients used in formulation, different
processing and storage conditions on dough viscoelastic performance and on final product.
Finally the knowledge of formulation, processing and storage conditions together with the
evaluation of structural and rheological characteristics is fundamental for the study of complex
matrices like bakery products, where numerous variable can influence their final quality (e.g. raw
material, bread-making procedure, time and temperature of the fermentation and baking).

CONTENTS INTRODUCTION ........................................................................................................................ 1
1. BREAD MAKING PROCESS .......................................................................................... 3
1.1 Ingredients .............................................................................................................................. 5
1.2 Processing ............................................................................................................................... 7
1.2.1 The functions of mixing ................................................................................................ 7
1.2.2 Fermentation .................................................................................................................. 8
1.2.3 Baking .......................................................................................................................... 11
1.3 Types of dough-making processes ....................................................................................... 13
1.3.1 Straight dough method ................................................................................................ 13
1.3.2 Sponge-and-dough procedure ...................................................................................... 15
1.3.3 Sourdough method ....................................................................................................... 16
1.3.4 Mechanical dough development .................................................................................. 18
Continuous bread-making procedure................................................................................ 18
Chorleywood bread process.............................................................................................. 18
Brimec process ................................................................................................................. 21
1.4 Textural changes in bread during storage ............................................................................. 22
1.5 Frozen bakery products ........................................................................................................ 24
1.5.1 Refrigeration applied to bread dough .......................................................................... 25
1.5.2 Technological problems, solutions, and requirements ................................................ 27
2. RHEOLOGICAL TESTS ....................................................................................................... 38
2.1 Rheological test methods ...................................................................................................... 40
2.1.1 Descriptive empirical measurements ........................................................................... 40
Texture Profile Analysis (TPA test) ................................................................................. 43
Dough stickiness ............................................................................................................... 55
Dough extensibility .......................................................................................................... 64
2.1.2 Fundamental rheological tests ..................................................................................... 67
Dynamic oscillation measurements .................................................................................. 67
I
II
3. MATERIALS AND METHODS ............................................................................................ 72
3.1 Formulation and samples preparation ................................................................................... 72
3.1.1 Frozen dough without yeast ........................................................................................ 72
3.1.2 Frozen dough and bread made with frozen dough ...................................................... 75
3.1.3 Doughs obtained by using different fermentation methods ........................................ 79
3.1.4 Doughs made by Kamut® flour ................................................................................... 83
3.1.5 Dough and bread with ginger powder ......................................................................... 85
3.1.6 Final products coming from different bakeries ........................................................... 87
3.2 Analyses ................................................................................................................................ 90
3.2.1 Dough and bread Texture Profile Analysis (TPA) ...................................................... 90
TPA on dough .................................................................................................................. 91
TPA on bread ................................................................................................................... 93
3.2.2 Dough uni-axial extensibility (Kieffer method).......................................................... 97
3.2.3 Dough stickiness ....................................................................................................... 105
3.2.4 Fundamental rheological tests ................................................................................... 107
3.2.5 Image analysis ........................................................................................................... 109
Image Analysis on bread ................................................................................................ 112
Image Analysis on dough ............................................................................................... 114
3.3 Statistical analysis ............................................................................................................... 115
4. RESULTS AND DISCUSSION ........................................................................................... 116
4.1 Frozen dough without yeast ................................................................................................ 116
4.2 Frozen dough and bread made with frozen dough .............................................................. 120
4.3 Doughs obtained by using different fermentation methods ................................................ 125
4.4 Doughs made by Kamut® flour ........................................................................................... 135
4.5 Dough and bread with ginger powder ................................................................................. 143
4.6 Final products coming from different bakeries ................................................................... 149
CONCLUSIONS ....................................................................................................................... 167
REFERENCES.......................................................................................................................... 169
INTRODUCTION
Rheology principles and theory can be used as an aid in process control and design, and as a
tool in the simulation and prediction of the materials response to the complex flows and
deformation conditions often found in practical processing situations which can be
inaccessible to normal rheological measurement. For instance, it is difficult to access dough
during mixing, sheeting, proving and baking without interrupting the process or disturbing the
structure of the material.
The general aims of rheological measurements are: to obtain a quantitative description of the
materials' mechanical properties; to obtain information related to the molecular structure and
composition of the material; to characterise and simulate the material's performance during
processing and for quality control.
Rheology can be also related to product functionality: many rheological tests have been used
to attempt to predict final product quality such as mixing behaviour, baking performance.
This is based on the structural engineering analysis of materials, where small-scale laboratory
measurements of mechanical properties have successfully been extrapolated to the behaviour
of large engineered structures such as bridges, buildings, pressure vessels etc. resulting in the
idea that controlled tests on well-defined small samples of food in the laboratory can be
related to the larger, more complex multi-component situations found in practical processing
conditions (Dobraszczyk, B.J. and Morgenster, M.P., 2003).
People often intuitively assess the quality of solid foods by gently squeezing them, or liquid
viscosity is assessed by gently rotating the liquid in its container, and indeed these sort of tests
are often applied on the factory floor as a crude measure of quality. These intuitive
assessments gradually became formalised into quantitative descriptions of material properties
by scientists such as Newton, Boyle, Pascal, Hooke, Young and Cauchy.
Within the cereal science community, there is a widespread conviction that the rheological
properties of dough are related to baking quality, mainly due to a long tradition of subjective
manual assessments of dough rheology prior to baking; for example the practice among
bakers of kneading and stretching the dough by hand to assess its quality. Although this is a
very subjective method of measuring rheology, it gives us an indication of the sort of
rheological measurements we should be making in order to predict baking performance.
1
Since then rheology has grown rapidly as a science and contributed to a number of
applications such as colloids, suspensions and emulsions, polymer processing, extrusion and
polymer modelling. Recent developments in polymer rheology have established a quantitative
link between the molecular size and structure of polymers to their rheology and end-use
performance. Rheological measurements are increasingly being used as rapid, sensitive
indicators of polymer molecular structure and predictors of end-use performance and are
being applied to bread doughs as indicators of the gluten polymer molecular structure and
predictors of its functional behaviour in breadmaking (Dobraszczyk, B.J., 2003).
Full understanding of the rheological behaviour of flour dough is of great importance from the
practical point of view. Dough rheology directly affects the baking performance of flours, and
rheological analyses have been made in order to optimize dough formulation. Although dough
rheology has long been investigated, there remains a significant lack of understanding. This
lacks of progress is due to the complexity of this biological system (Masi, P. et al., 2001).
Wheat flour and water mixtures, doughs, are used in the manufacture of many different food
products. A wheat flour and water mixture when subjected to input of mechanical energy such
as mixing will allow for the formation of dough. Even a simple wheat flour and water based
dough is a complex system. Thus, the complexity of dough is not restricted to its chemical
composition, but also includes physical properties. The rheological properties of dough reflect
its machining properties during processing and the quality of the final product. Effective
quality control of dough based products should therefore include its characterization during
all stages of processing. Additionally the rheological properties of dough at many stages in
processing can be indicative of the quality of the finished product. Thus, knowledge or
characterization of the rheological properties of dough can be effective in predicting its
behaviour during processing and controlling its quality (Ross, K.A. et al., 2004).
2
1. BREAD MAKING PROCESS
The aim of the bread making process is quite simple: namely to convert wheat flour and other
ingredients into a light, aerated and palatable food. Bread is probably the oldest “processed”
food. We are unlikely to ever identify the moment when bread was “discovered” though it is
probable that the place of discovery was in the Middle East where the origins of cereal
farming also lie in antiquity. Early forms of bread would have been very different from how
we see it in industrialized countries today and it would probably be closest in character to the
modern flat breads of the Middle East. We will probably never know whether the gathering
and cooking of wild grass seeds provided the spur to arable farming or whether the ability to
grow and harvest the forerunners of modern wheats provided the impetus for breadmaking.
Whichever way round the two events occurred there is no doubt that one depends on the other
and this simple relationship is the foundation of all modern breadmaking. The move to
improve the digestibility of the wild grass seed forerunners of early wheat types through
fermentation and baking represents a major step in the evolution of human food production.
To make this step requires an appreciation, but not necessarily a scientific understanding, of
the unique properties of the proteins in wheat with their ability to form a cohesive mass of
dough once the flour has been wetted (hydrated) and subjected to the energy of mixing, even
by hand. This cohesive mass is the one bakers call ‘gluten’ and once it has formed into a
dough it has the ability to trap gases during resting (fermentation and proof) and baking and
this allows the mass to expand to become a softer, lighter and even more palatable food after
the final heat processing. The discovery that dough left for long periods of time would
increase in volume without being subjected to the high temperatures of baking identified the
basis of fermentation (gas production). There is no doubt that the changes in the rheological
character of the dough would have been observed by those in charge of food production. The
combined effect of these changes is for the subsequent baked mass to further increase in
volume and give a product with an even softer, more digestible character and different
flavour. Gradually the appreciation of the actions of wild yeasts and portions of old dough
(e.g. starter dough) were to lead to the transfer of fermentation technology from the brewing
industry and eventually to the production of specialised bakers’ yeast. There are a few basic
steps which form the basis of all bread making. They can be listed as follows:
3

• The mixing of wheat flour and water, together with yeast and salt, and other specified
ingredients in appropriate ratios.
• The development of a gluten structure in the dough through the application of energy during
mixing, often referred to as “kneading”.
• The incorporation of air bubbles within the dough during mixing.
• The continued “development” of the gluten structure created as the result of kneading in
order to modify the rheological properties of the dough and to improve its ability to expand
when gas pressures increase because of the generation of carbon dioxide gas in the fermenting
dough. This stage of dough development may also be referred to as “ripening” or “maturing”
of the dough.
• The creation and modification of particular flavour compounds in the dough.
• The sub-division of the dough mass into unit pieces.
• A preliminary modification of the shape of the divided dough pieces.
• A short delay in processing to further modify physical and rheological properties of the
dough pieces.
• The shaping of the dough pieces to achieve their required configurations.
• The fermentation and expansion of the shaped dough pieces during “proof”.
• Further expansion of the dough pieces and fixation of the final bread structure during baking
(Cauvain, S.P., 2001).
4

1.1 Ingredients
The minimum formula for bread is flour, yeast, salt and water. If any one of these ingredients
is missing, the product is not bread. Other ingredients that are often found in the formula are
fat, sugar, milk or milk solids, oxidants, various enzyme preparations (included malted grain),
surfactants, and additives to protect against moulds. Each of the components in the formula
performs a function in producing the finished loaf.
The flour, of course, is the major component and is responsible for the structure of the bread.
It allows the formation of a viscoelastic dough that retain gas (Hoseney, R.C.,1994).
Since the formation of gluten the flour is an essential component of breadmaking processes
and wheat is the contributor of the proteins necessary for its formation, it follows that a
significant factor that determines final bread quality comes from the wheat via the flour from
the mill. The level and quality of the gluten-forming proteins depend heavily on the wheat
variety, agricultural practices and environmental effects. The protein content of wheat flour
varies according to the wheats that are used by the millers and adjustments they may make in
the mill. In general, the higher the protein content in the wheat, the higher the protein content
of the flours produced from it. The higher the protein content of a flour, the better is its ability
to trap and retain carbon dioxide gas and the larger can be the bread volume.
Protein quality also influences final product quality. It is most often judged by some form of
dough rheological test though the prediction of final product quality is less certain because
most dough rheological testing methods are carried out using conditions that have a limited
relationship to the breadmaking process in which the flour will be used. Protein quality testing
relies heavily on the interpretation of the rheological data by experts.
The grade colour figure (GCF), ash or Branscan values of flour are measures of the amount of
bran that is present in a white flour. The higher the GCF, ash or Branscan value, the lower
will be bread volume, in part because of the dilution effect on the functional protein content.
During the growing cycle for the wheat plant there are a large number of enzymes at work. Of
interest to us are the ones known collectively as amylases, and especially alpha-amylase. The
term alpha-amylase is used to describe a range of enzymes capable of breaking down
damaged starch granules into dextrins and, in combination with beta-amylase, they will
produce maltose. Alpha-amylase is produced during the growing cycle and can achieve quite
high levels if the period around harvesting is wet. Large numbers of the starch granules are
5

damaged during milling. These damaged starch granules absorb more water than the
undamaged granules, so that the larger the proportion of damaged starch the higher the water
absorption of the flour (Cauvain, S.P., 2003).
Yeast is one of the fundamental ingredients; its major role is to convert fermentable
carbohydrates into carbon dioxide and ethanol. The gases that result from that conversion
provide the lift that produces a light, or leavened, loaf of bread. In addition to its gas
production, the yeast has a very marked effect on the rheological properties of the dough.
Salt is generally used at levels of about 1-2% based on the flour weight. It appears to have two
major functions. First is taste; bread made with no salt is quite tasteless. The second is to
affect the dough’s rheological properties, salt makes dough stronger, presumably by shielding
charges on the dough proteins (Hoseney, R.C., 1994). Moreover the salt has an inhibiting
effect on the formation of gluten during mixing (Cauvain, S.P., 2003).
The last fundamental ingredient is water, which is a plasticizer and solvent. Without water, we
have no dough and therefore no viscous flow properties, and many of the reactions that take
place during fermentation cannot occur because there is no solvent (Hoseney, R.C., 1994).
The term improvers covers any ingredient added to “improve” the breadmaking potential of a
given flour. Different breadmaking processes use different flours and different improver
formulations. The functional ingredients used in improvers vary but typically contain one or
more of the following ingredients:
• Oxidising agents to improve the gas retention abilities of the dough. The functions of the
oxidant are complex and at the protein molecule level are currently thought to be
mostly related to “cross-linking” of proteins. By improving dough development we
will get larger product volume and improved crumb softness.
• Reducing agents such as L-cysteine may be added to “weaken” the dough structure. It
will be used only at low levels in improvers but by reducing dough resistance to
deformation it helps in moulding and shape forming without structural damage.
• Emulsifiers may be added to bread to improve its quality, each one acting slightly
differently and having its own special effects. There are four commonly used
emulsifiers: DATA (diacetyl tartaric acid esters of mono- and di-glycerides) esters,
sodium stearoyl lactylate, distilled monoglycerides and lecithins.
• Enzyme-active materials have become important to many sectors of the baking industry
following the limitations placed on the use of oxidants. Those most commonly used
6
are the alpha-amylases (fungal and cereal) and the hemicellulases. Proteolytic
enzymes may be used in the USA .
• Full-fat, enzyme-active soya flour may be used as a functional dough ingredient. It has
two principal beneficial functions, both arising from its lypoxygenase enzyme system.
They are to bleach the flour and assist in dough oxidation (Cauvain, S.P., 2003).
1.2 Processing
The processing of bread can be divided into three basic operations: mixing or dough
formation, fermentation, and baking.
1.2.1 The functions of mixing
In the breadmaking processes mixing plays a major role on forming and developing the gluten
structure in the dough and incorporating the necessary gas bubbles for cell structure formation
in the baked product. It is the latter which makes bread a light, aerated and palatable food.
In essence mixing is the homogenisation of the ingredients, whereas kneading is the
development of the dough (gluten) structure by “work done” after the initial mixing.
However, in the context of modern breadmaking both processes take place within the mixing
machine and so can be considered as one rather than two processes.
The sub-processes taking place during mixing can be summarised as follows:
1. The uniform dispersion of the recipe ingredients.
2. Dissolution and hydration of those ingredients, in particular the flour proteins and the
damaged starch.
3. The development of a gluten (hydrated flour protein) structure in the dough arising from
the input of mechanical energy by the mixing action.
4. The incorporation of air bubbles within the dough to provide the gas bubble nuclei for the
carbon dioxide which will be generated by yeast fermentation and oxygen for oxidation and
yeast activity.
5. The formation of a dough with suitable rheological properties for subsequent processing.
The production of a defined cellular structure in the baked bread depends entirely on the
creation of gas bubbles in the dough during mixing and their retention during subsequent
7
processing. After mixing has been completed the only “new” gas which becomes available is
the carbon dioxide gas generated by the yeast fermentation. Carbon dioxide gas has high
solubility relative to other gases and in bread dough cannot form gas bubbles (Baker, J.C. and
Mize, M.D., 1941). As the yeast produces carbon dioxide gas the latter goes into solution in
the aqueous phase within the dough until saturation is achieved. Thereafter continued
fermentation causes dough expansion as the gas is retained within the dough structure. The
two other gases present in the dough after mixing are oxygen and nitrogen. The residence
time for oxygen is relatively short since it is quickly used up by the yeast cells within the
dough. Indeed so successful is yeast at scavenging oxygen that no oxygen remains in the
dough by the end of the mixing cycle. With the removal of oxygen the only gas which
remains entrapped is nitrogen and this plays a major role by providing bubble nuclei into
which the carbon dioxide gas can diffuse as the latter comes out of solution.
The numbers and sizes of gas bubbles in the dough at the end of mixing are strongly
influenced by the mechanism of dough formation and the mixing conditions in a particular
machine (Cauvain, S.P., 2001).
1.2.2 Fermentation
Yeast is a living organism that is inactive during storage. The inactivity is caused either by
drying, in the case of active dry yeast, or by low temperature, in the case of compressed or
crumbled yeast.
When yeast is incorporated into a dough, conditions are suitable for it to become active. Yeast
is a versatile organism; it can ferment under either aerobic or anaerobic conditions. The
production of yeast and the early stages of brewing are aerobic processes, whereas bread
fermentation is an anaerobic process. Thus, little growth of yeast occurs during dough
fermentation. The oxygen in a dough is rapidly consumed by the yeast and bacteria as
fermentation starts. Thereafter, the fermentation is anaerobic unless we add oxygen to the
system (i.e. by remixing). The major products of yeast fermentation are carbon dioxide and
ethanol. As carbon dioxide is produced, the pH decreases and the aqueous phase becomes
saturated with carbon dioxide. The initial lag that is found in a gas “production” curve for
bread dough is because the dough’s aqueous phase must become saturated with carbon
dioxide before the evolution or loss CO2 can be measured. Only after the aqueous phase has
become saturated is the carbon dioxide available to leave the system.
8
As fermentation proceeds, it is customary to punch or remix the dough, depending upon
which baking system is being used. Why is this done and what does it accomplish? The gas
cells in the dough become larger and larger as more gas is produced. Punching or remixing
subdivides the gas cells to produce many more smaller cells. To be sure, a large amount of
carbon dioxide is lost in the atmosphere, but the important aspect of the process is the creation
of the new gas cells.
Another important benefit of punching or remixing is the mixing of the dough ingredients.
Yeast cells do not have mobility in dough. Therefore, they depend upon the sugar diffusing to
them. As fermentation proceeds, the diffusion distances become large, so the concentration of
sugar diminishes, along with the rate of fermentation. Punching or remixing brings the yeast
cells and fermentables together again. In zero- or short-time baking systems, punching is not
practical, as the dough is not given sufficient time to expand. The net result is usually a
coarser grain (fewer cells) in the bread. A partial solution to this problem is to mix under
partial vacuum, which expands the dough and allows the gas cells to be subdivided without
the need for waiting for the dough to expand.
In addition to its gas-producing capabilities, yeast also affects dough rheology. The effects of
yeast on dough rheology can best be shown by a simple spread test. The logic of the test is
shown in Figure 1.1.
MIXED DOUGH Fermentation time MOLD Rest time MEASURE SPREAD = W/H
Figure 1.1 Experimental scheme for determining the “spread” of a wheat flour dough.
W, width; H, height.
One can consider a dough to have both viscous-flow properties and elastic properties. A
dough that has more viscous-flow properties has a large spread ratio (width divided by
height), whereas a dough that is more elastic has a smaller one.
9
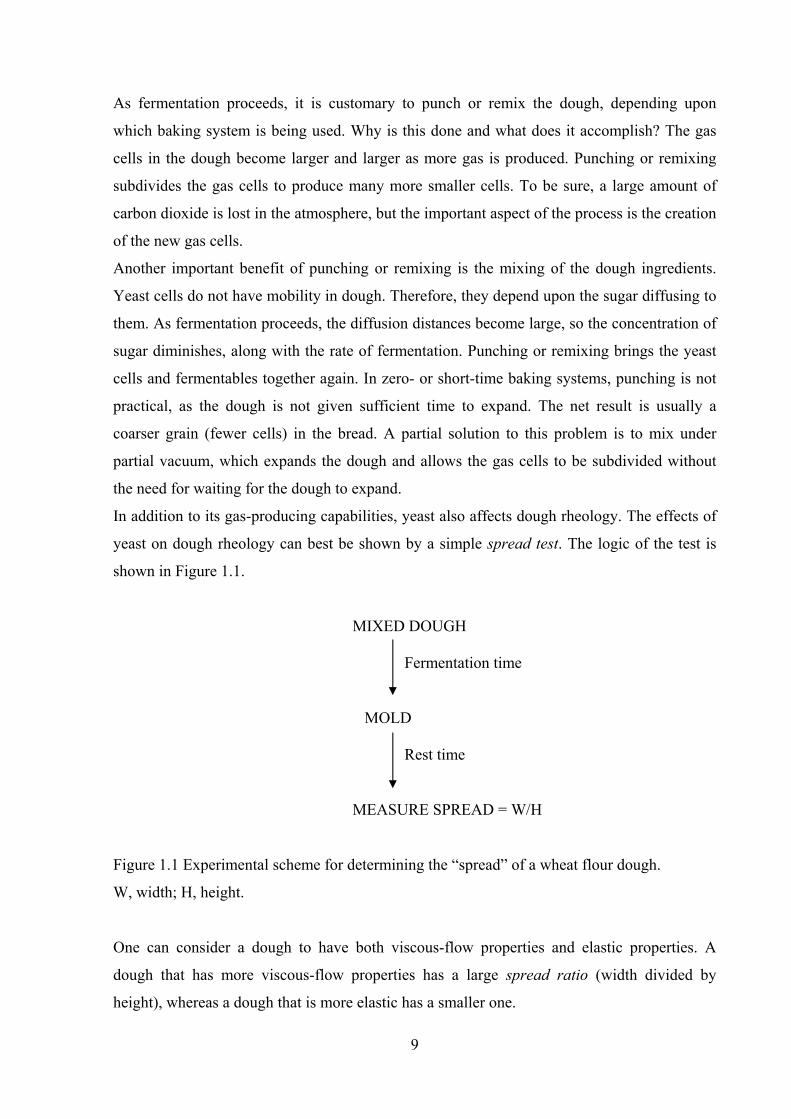
As can seen in Figure 1.2, a flour-water dough gives a large spread ratio after 3hours. This
indicates that the viscous-flow properties are large in a flour-water dough. When yeast is
added to such dough, the spread ratio is quite different. This shows that yeast influences the
rheological properties of dough. The addition of yeast to the formula causes a dough to go
from one with a large viscous-flow component to one that is elastic, as a result of 3hours of
fermentation.
Figure 1.2 Effect of yeast on the spread ratio of a fermenting dough. FL, flour (modified from
Hoseney, R.C., 1994).
The trend toward a dough with more elastic properties is the same trend that we find when we
add oxidants to a dough. Thus, yeast clearly has an oxidizing effect.
This raises an obvious question. Do the product of fermentation produce the rheological
change or is this a property of the yeast itself? The question can be easily answered by
running a preferment containing no flour and centrifuging the system to separate yeast cells
from the products of fermentation. When this is done and each is added to separate flour-
water doughs, it is clear that the products of fermentation do not change dough rheology. The
yeast itself appears to be the entity that changes dough rheology. How the yeast cell changes
dough rheology is not clear.
10
The chemical oxidants that are added to the bread formula also affect dough rheology. Certain
of the oxidants (potassium iodate and azodicarbonamide, for example) are fast-acting oxidants
that have their effect during mixing. Potassium bromate, on the other hand, has essentially no
effect during mixing but does effect dough rheology during fermentation. At least part of
potassium bromate’s time-dependent effect may be because of the change in dough pH during
fermentation; potassium bromate reacts faster at lower pH. Ascorbic acid has both a rapid and
a time-dependent reaction on dough rheology.
An optimally fermented and oxidized dough has no viscous-flow properties under the force of
gravity at the proof stage. Thus, the dough in the pan expands to fill the pan rather than flows
to fill the pan. After fermentation, presumably because of the mechanical punching, the gluten
fibrils appear to be aligned.
The change in pH associated with fermentation time is also important to the dough’s
rheological properties. Dough just out the mixer usually has a pH of about 6.0. During
fermentation, the pH drops to 5.0. A first rapid drop is caused at first by carbon dioxide
dissolving in water to produce carbonic acid. A second factor is the slow production of
organic acids by the bacteria in the dough. The flour itself and either milk or soy proteins in
the formula are good buffers and therefore help to control pH. The lower pH decreases the
mixing time of dough. This is at least in part, the reason for the shorter mixing time in a
sponge-and-dough or preferment system than in a straight-dough system. However, the
change in pH has a little effect on the dough’s spread ratio (Hoseney, R.C., 1994).
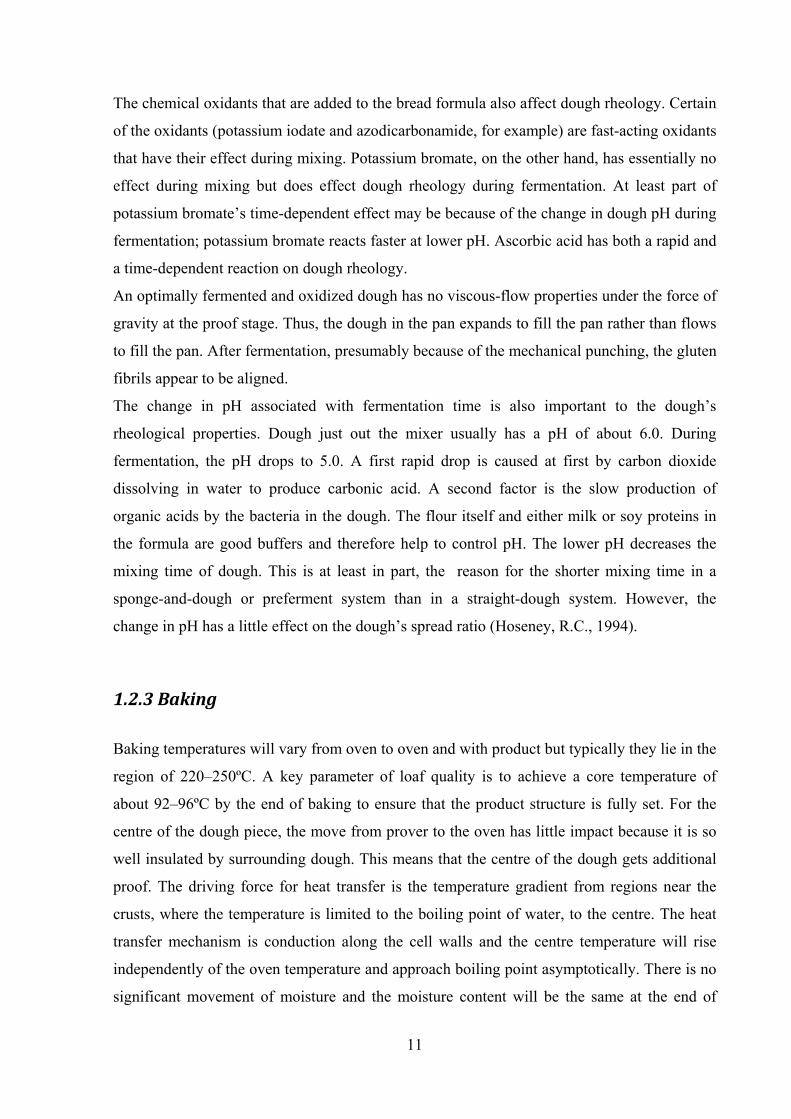
1.2.3 Baking
Baking temperatures will vary from oven to oven and with product but typically they lie in the
region of 220–250ºC. A key parameter of loaf quality is to achieve a core temperature of
about 92–96ºC by the end of baking to ensure that the product structure is fully set. For the
centre of the dough piece, the move from prover to the oven has little impact because it is so
well insulated by surrounding dough. This means that the centre of the dough gets additional
proof. The driving force for heat transfer is the temperature gradient from regions near the
crusts, where the temperature is limited to the boiling point of water, to the centre. The heat
transfer mechanism is conduction along the cell walls and the centre temperature will rise
independently of the oven temperature and approach boiling point asymptotically. There is no
significant movement of moisture and the moisture content will be the same at the end of
11

baking as at the beginning. As dough warms up it goes through a complex progression of
physical, chemical and biochemical changes. Yeast activity decreases from 43°C and ceases
by 55ºC. Structural stability is maintained by the expansion of the trapped gases.
Gelatinization of the starch starts at about 60ºC and initially the starch granules absorb any
free water in the dough. α-amylase activity converts the starch into dextrins and then sugars
and reaches its maximum activity between 60 and 70ºC. Too little amylase activity restricts
loaf volume, because the starch structure becomes rigid too soon, while too much may cause
the dough structure to become so fluid that the loaf collapses completely. The formation of a
crust provides much of the strength of the finished loaf and the greater part of the flavour.
Condensation on the surface of the loaf at the start of baking is essential for the formation of
gloss, but quite soon the temperature of the surface rises above the local dew point
temperature and evaporation starts. Soon after that the surface reaches the boiling point of the
free liquid and the rate of moisture loss accelerates. The heat transfer mechanisms at the
evaporation front are complex. There is conduction within the cell walls and water evaporates
at the hot end of the cell. Some is lost to the outside but the rest moves across the cell towards
the centre and condenses at the cold end of the cell. In doing so it transfers its latent heat
before diffusing along the cell wall to evaporate again at the hot end. The evaporation front
will develop at different rates depending on the bread types. The crust is outside the
evaporation front and here the temperature rises towards the air temperature in the oven. As
water is driven off and the crust acquires its characteristic crispness and colour, flavour and
aroma develop from the Maillard reactions, which start at temperatures above 150ºC. The
other contributor to crust formation is the continuing expansion of the inside of the dough
piece from the final burst of carbon dioxide production from yeast fermentation and the
thermal expansion of the gases trapped in the cellular structure of the dough. If the dough is
contained in a pan then it can only expand upwards. This effect is most obvious at the top
edges of the loaf, where the displacement is greatest and where a split develops as the top
crust lifts, exposing a band of elongated inner crust cells, called the ‘oven break’, ‘oven
spring’ or ‘shred’. Some types of bread are characterised by the crispness of their crust, e.g.
baguette. The first few moments in the oven are vital for the formation of a glossy crust. To
obtain gloss, it is essential that vapour condenses on the surface to form a starch paste that
will gelatinize, form dextrins and eventually caramelise to give both colour and shine. If there
is excess water, paste-type gelation takes place while with insufficient water crumb-type
gelation occurs. To deliver the necessary water steam is introduced into the oven (Cauvain,
S.P., 2001).
12
1.3 Types of doughmaking processes
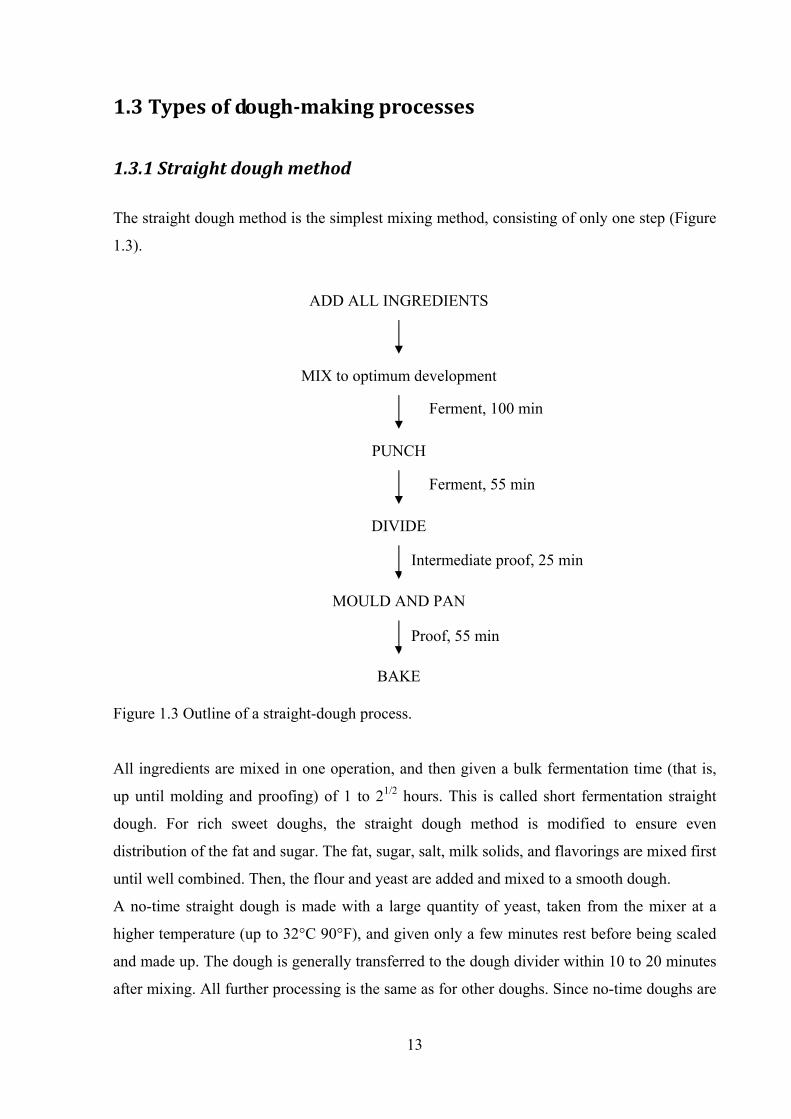
1.3.1 Straight dough method
The straight dough method is the simplest mixing method, consisting of only one step (Figure
1.3).
ADD ALL INGREDIENTS
MIX to optimum development
DIVIDE
PUNCH
Ferment, 100 min
Ferment, 55 min
Figure 1.3 Outline of a straight-dough process.
All ingredients are mixed in one operation, and then given a bulk fermentation time (that is,
up until molding and proofing) of 1 to 21/2 hours. This is called short fermentation straight
dough. For rich sweet doughs, the straight dough method is modified to ensure even
distribution of the fat and sugar. The fat, sugar, salt, milk solids, and flavorings are mixed first
until well combined. Then, the flour and yeast are added and mixed to a smooth dough.
A no-time straight dough is made with a large quantity of yeast, taken from the mixer at a
higher temperature (up to 32°C 90°F), and given only a few minutes rest before being scaled
and made up. The dough is generally transferred to the dough divider within 10 to 20 minutes
after mixing. All further processing is the same as for other doughs. Since no-time doughs are
BAKE
MOULD AND PAN
Intermediate proof, 25 min
Proof, 55 min
13
not subjected to bulk fermentation, they do not require degassing prior to dividing. However,
since the fermentation process does not condition no-time doughs, this must be done through
the addition of extra maturing (oxidizing) agents, such as 60–120 ppm ascorbic acid.
Although shortening the dough processing time by eliminating the bulk fermentation period is
a significant advantage to the baker, the lack of fermentation has an adverse effect on the
flavor and shelf-life of the baked product. This process is usually used only in emergencies.
Long-fermentation doughs are fermented for 5 or 6 hours or longer, sometimes overnight, at a
temperature of 24°C (75°F) or lower (retarded fermentation). Retarding means slowing down
the fermentation or proof of yeast doughs by refrigeration. This may be done in regular
refrigerators or in special retarders that maintain a high humidity. The amount of yeast should
be adjusted depending on the fermentation temperature and time for good control of
fermentation. The advantage of this method is that the long, slow fermentation greatly
enhances the flavour of the product. The major disadvantage of the straight dough method is
that the fermentation is hard to control because of fluctuations in temperature and other
factors. Doughs often become over-fermented. Therefore, the straight dough method is
usually used in small-scale productions (Hsi-Mei, L. and Tze-Ching, L., 2006).
In general, straight-dough bread is chewier than bread made by other techniques; it has a
coarser cell structure; and it is generally considered to have less flavour (Hoseney, R.C.,
1994).
14
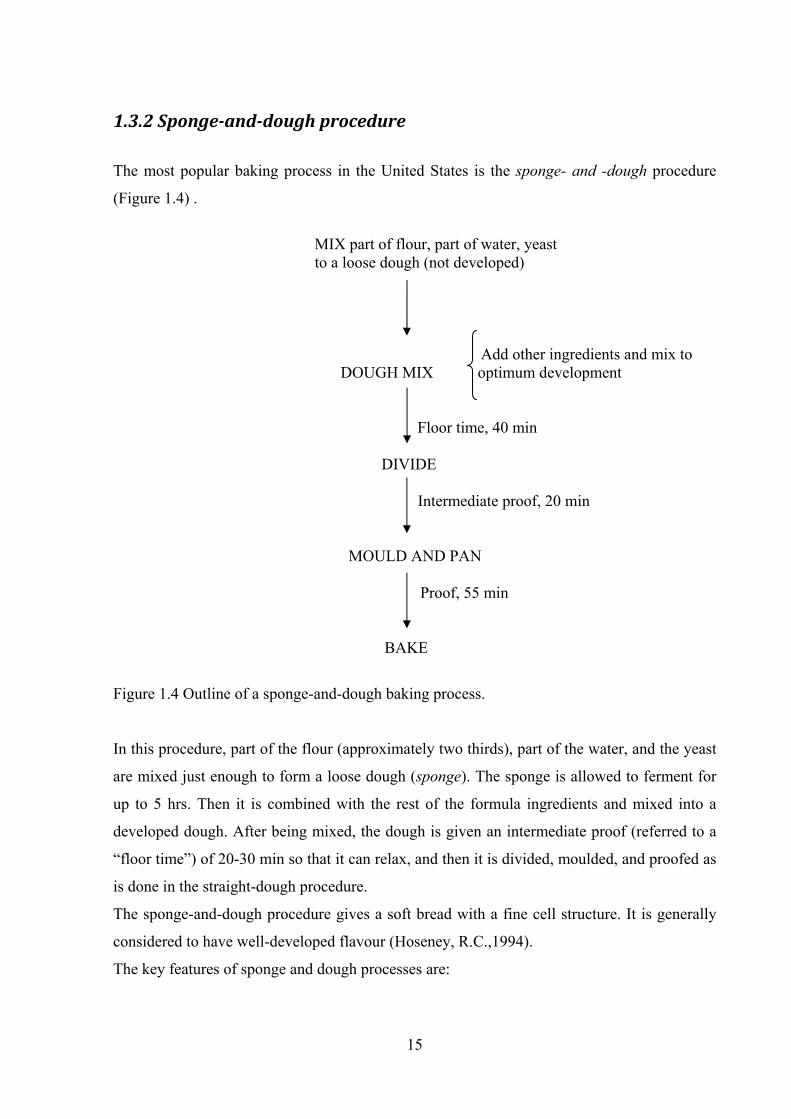
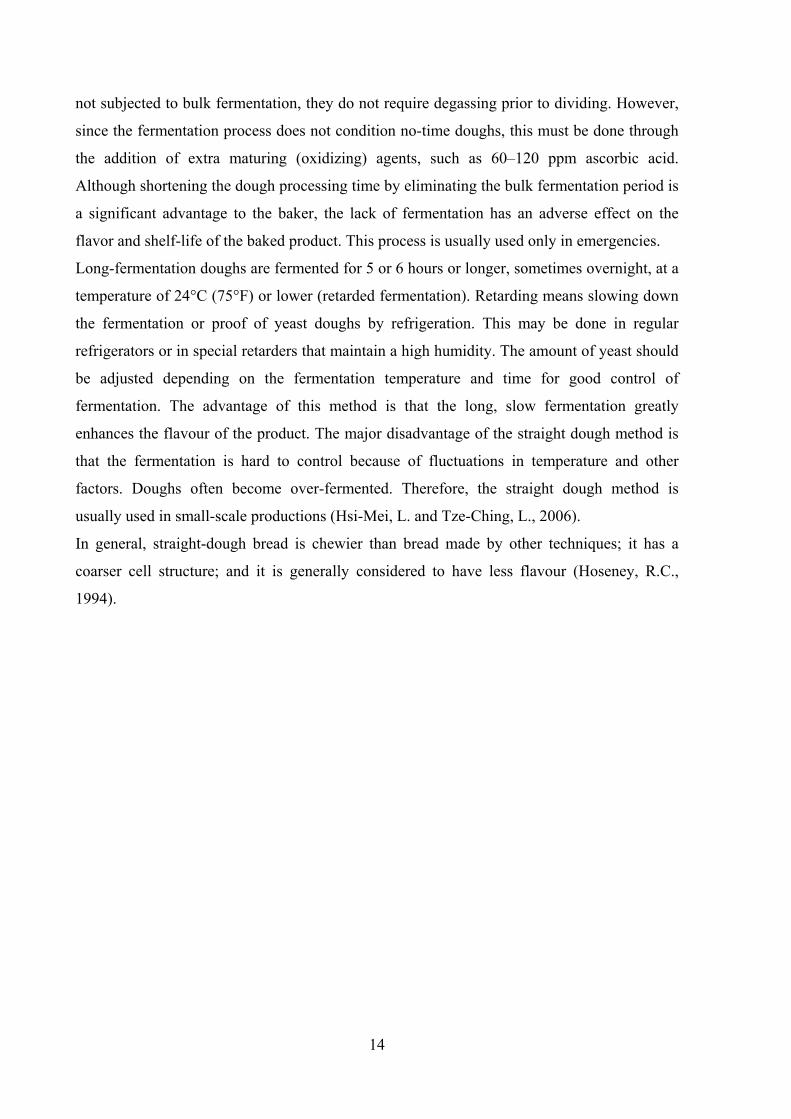
1.3.2 Spongeanddough procedure
The most popular baking process in the United States is the sponge- and -dough procedure
(Figure 1.4) .
MIX part of flour, part of water, yeast to a loose dough (not developed)
Add other ingredients and mix to DOUGH MIX optimum development
Floor time, 40 min DIVIDE
Intermediate proof, 20 min
MOULD AND PAN Proof, 55 min
BAKE
Figure 1.4 Outline of a sponge-and-dough baking process.
In this procedure, part of the flour (approximately two thirds), part of the water, and the yeast
are mixed just enough to form a loose dough (sponge). The sponge is allowed to ferment for
up to 5 hrs. Then it is combined with the rest of the formula ingredients and mixed into a
developed dough. After being mixed, the dough is given an intermediate proof (referred to a
“floor time”) of 20-30 min so that it can relax, and then it is divided, moulded, and proofed as
is done in the straight-dough procedure.
The sponge-and-dough procedure gives a soft bread with a fine cell structure. It is generally
considered to have well-developed flavour (Hoseney, R.C.,1994).
The key features of sponge and dough processes are:
15

• A two-stage process in which part of the total quantity of flour, water and other ingredients
from the formulation are mixed to form an homogeneous soft dough – the sponge.
• The resting of the sponge so formed, in bulk for a prescribed time (floortime), mainly
depending on flavour requirements.
• Mixing of the sponge with the remainder of the ingredients to form an homogeneous dough.
• Immediate processing of the final dough, although a short period of bulk fermentation may
be given.
The sponge contributes to flavour modification and the development of the final dough. The
process of flavour development in the sponge, though complex, is observed as an increase in
the acidic flavour notes arising from the fermentation by the added yeast and other
microorganisms naturally present in the flour. To maintain the right flavour profile in the
finished product the sponge fermentation conditions are closely controlled and care is taken to
avoid a build-up of unwanted flavours. During the sponge fermentation period there will be a
decrease in sponge pH with increasing fermentation. Under these conditions the rheological
character of the gluten formed during initial sponge mixing changes and the sponge becomes
soft and loses much of its elasticity. The low pH of the sponge and its unique rheological
characters are carried through to the dough where they have the effect of producing a softer
and more extensible gluten network after the second mixing. In many cases the addition of the
sponge changes the rheological character of the final dough sufficiently to warrant further
bulk resting time unnecessary so that dividing and moulding can proceed without further
delay. Improver additions are commonly made in the dough rather than the sponge. Flours
used in typical sponge and dough production will be at least as strong as those used in bulk
fermented doughs with protein contents not less than 12% and high Falling Numbers. High α-
amylase activity could be a problem in the sponge because of excessive softening but is less
likely to be a problem in the dough (Cauvain, S.P., 2001).
1.3.3 Sourdough method
Finally there is a sourdough (levain) method.
Utilization of sour dough is an old-time leavening method in bread making. During sour
dough fermentation a typical microflora develops that includes lactic acid bacteria
(lactobacilli) and yeasts. The yeasts are generally responsible for the leavening action via
carbon dioxide production and for flavor precursor formation. Lactic acid bacteria lower the
pH by producing lactic and acetic acid. A typical ratio is about 20% acetic and the remainder
16

lactic acid. The acidity protects against spoilage by inhibiting mold growth. The growth of
rope bacteria is increasingly inhibited as the pH drops below 6.0 and the acids formed
preserve the dough. The desired pH of the dough is in the range of 4.0 to 4.6. However, the
pH must not become too low, because below about pH 3.7, putrefaction bacteria take over,
developing bad odors. Generally this is not a problem, as flour is a relatively good buffer. In
addition, lactic acid bacteria produce enzymes (α-amylase, phytase and proteolytic enzymes)
that form low molecular mass carbohydrates, peptides, and amino acids that can act as flavor
precursors. For the production of rye bread an acidification is required. The acidity affects the
swelling properties of rye flour constituents (proteins, arabinoxylans), controls the enzyme
activity in the dough and improves the bread making performance (i.e., improved crumb
grain, elasticity, slicing properties, flavor and taste perception, crumb/crust color, and shelf
life). Compared to wheat bread rye bread prepared with sour dough has a denser loaf with
lower volume, sour-aromatic taste and prolonged shelf life. The sour dough process is a very
complex biological system. Factors affecting this system include process variables such as
fermentation temperature and time, and ingredient parameters such as flour type, flour ash
content, media sources (availability of carbon, nitrogensources, vitamins), pH, water
concentration and the presence of antimicrobial compounds. These parameters affect the
multiplication of lactobacilli and yeast, the amounts of acids formed, gas (CO2, O2) and
ethanol concentrations, the proteolytic activity of lactobacilli, and thereby, the organoleptic
properties of the baked product such as taste, flavor, texture, and crumb color. Sour dough
production traditionally includes three stages of fermentation: a fresh sour, a basic sour and a
full sour (final dough for breadbaking). To initiate sour dough fermentation and to prepare the
fresh sour, a spontaneous sour (spontaneously fermented flour-water mixture), a portion of an
already developed, old sour dough or a commercial starter culture derived from natural sour
dough fermentations can be used. As dough becomes old, the yeast is inactivted, as the pH is
low. At the lower pH, bacteria are still quite active. With time, the food available for the
organisms becomes limited; however, as new flour is added and the “starter” is fed or rebuilt,
the bacteria become more predominant. In general, the gas-producing ability of sour-dough
organisms is lower than that of commercial yeast. Consequently proof time of sour dough
bread is often long, of the order of several hours. Various sour dough processes (multi-, two,
single stage varying from 2 h up to 24 h) were designed to increase the growth of yeast and
lactic acid bacteria to give the final sour dough (full sour) proper acidity (especially the lactic
acid/acetic acid ratio) and dough consistency. Often, baker’s yeast (Saccharomyces
cerevisiae) is added to accelerate the leavening process. The use of organic acids (dough
17

acidifiers) including lactic, acetic, tartaric, and citric acids alone or in combination with other
additives such as sour dough concentrates can replace sour dough in single-stage processes or
partly replace it in multistage processes. Apart from the usual batch process, technologies for
continuous preparation of sour doughs have been developed (Sievert, D., 2007).
1.3.4 Mechanical dough development
The common attribute of all mechanical dough development methods is that there is no
fermentation period, when dough is largely, if not entirely developed in the mixing machine.
The physico-chemical changes, which normally occur during bulk fermentation periods, are
achieved in the mixer through the addition of improvers, extra water, and a specifically
planned level of mechanical energy. Several systems have been developed and some of the
most popular are: the continuous system in the U.S., the Chorleywood process in the U.K.,
and the Brimec process in Australia (Giannou,V. et al., 2006).
Continuous breadmaking procedure
The continuous bread-making procedure that became popular (and was used for > 40% of
production) in the United States a few years ago was, in part, such as a procedure. It used a
preferment, after which the dough was mixed into a developed dough and extruded into the
pan, proofed and baked. The procedure was economical; fewer personnel and less time were
required to produce the same amount of bread. However, the bread produced was different
from sponge- and dough bread and not well accepted by consumers. The procedure is
essentially no longer used (Hoseney, R.C.,1994).
Chorleywood bread process
The CBP may be broadly described as “a no-time dough-making process which uses
mechanical development” (Figure 1.5). The basic principles involved in the production of
bread and fermented goods by the CBP remain the same as those first published by the
Chorleywood team in 1961 (Chamberlain, N. et al., 1961) although the practices have
changed slightly with developments in ingredients and mixing equipment.
18
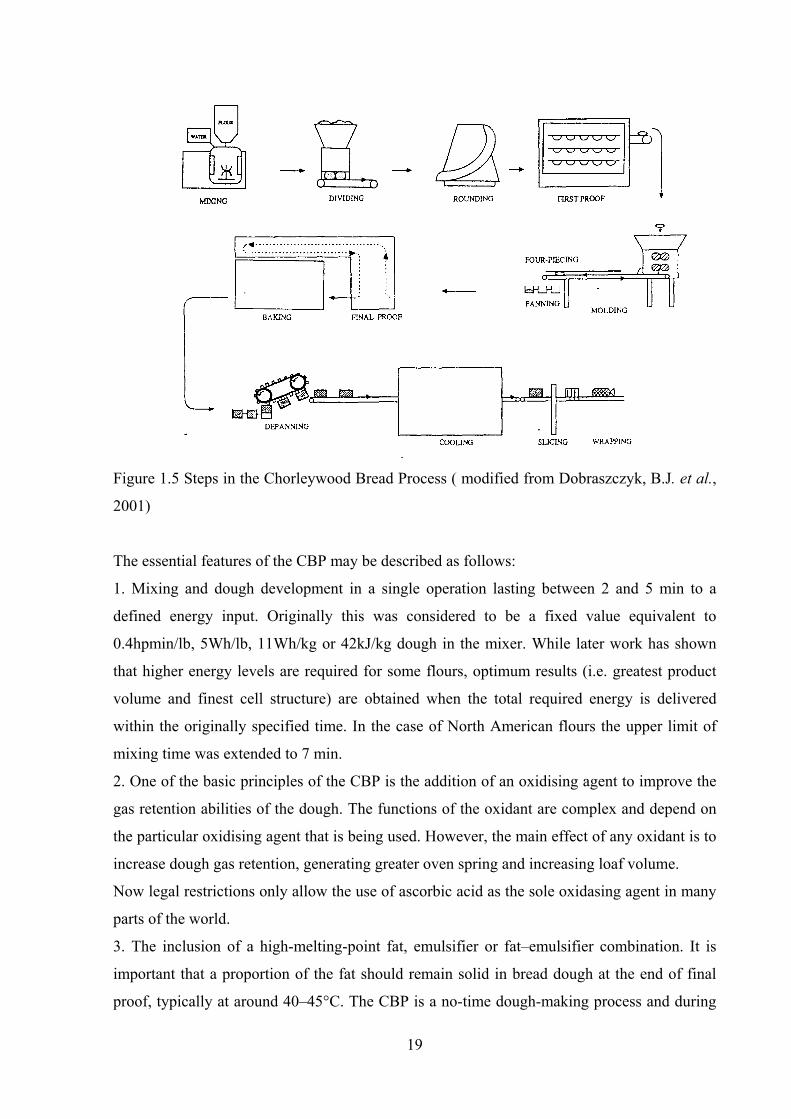
Figure 1.5 Steps in the Chorleywood Bread Process ( modified from Dobraszczyk, B.J. et al.,
2001)
The essential features of the CBP may be described as follows:
1. Mixing and dough development in a single operation lasting between 2 and 5 min to a
defined energy input. Originally this was considered to be a fixed value equivalent to
0.4hpmin/lb, 5Wh/lb, 11Wh/kg or 42kJ/kg dough in the mixer. While later work has shown
that higher energy levels are required for some flours, optimum results (i.e. greatest product
volume and finest cell structure) are obtained when the total required energy is delivered
within the originally specified time. In the case of North American flours the upper limit of
mixing time was extended to 7 min.
2. One of the basic principles of the CBP is the addition of an oxidising agent to improve the
gas retention abilities of the dough. The functions of the oxidant are complex and depend on
the particular oxidising agent that is being used. However, the main effect of any oxidant is to
increase dough gas retention, generating greater oven spring and increasing loaf volume.
Now legal restrictions only allow the use of ascorbic acid as the sole oxidasing agent in many
parts of the world.
3. The inclusion of a high-melting-point fat, emulsifier or fat–emulsifier combination. It is
important that a proportion of the fat should remain solid in bread dough at the end of final
proof, typically at around 40–45°C. The CBP is a no-time dough-making process and during
19

its development it was recognised that the addition of fat improved the gas retention of the
dough and thereby increased bread volume and softness. The level will vary according to the
type of flour being used and so it is common to recommend a “blanket” level in order to
ensure that sufficient solid fat is always present. With white flours this is usually 0.7% flour
weight or higher. Wholemeal (wholewheat) flours commonly require higher levels of fat
addition, often twice to three times that of white flour to achieve maximum bread volume .
4 The addition of extra water to adjust dough consistency to be comparable with that obtained
with doughs produced by bulk fermentation. This extra water yields doughs with similar
machinabilities which can be processed on the same plant as bulk fermented doughs. While
some aspects of plant design have changed since the CBP was introduced, the same principle
related to dough consistency remains true.
5. The addition of extra yeast to maintain final proof times comparable with those seen with
bulk fermentation doughs. The extra yeast is needed in CBP doughs because of the lower gas
levels in the dough compared with bulk fermented doughs when they reach the start of proof.
6. The control of mixer headspace atmosphere to achieve given bread cell structures.When the
CBP was first introduced, this was restricted to the application of partial vacuum for the
whole or part of the mixing cycle but more recently this has been extended to include
pressures greater than atmospheric and sequential changes during the mixing cycle. The main
difference between the CBP and bulk fermentation processes lies in the rapid development
(“maturing”) of the dough in the mixer rather than through a prolonged resting period.
The advantages gained by changing from a bulk fermentation system to the CBP include the
following:
1. A reduction in total processing time by at least the fermentation time of the dough in bulk.
2. Space savings from the elimination of the need to keep bowls of dough at different stages
of bulk fermentation. These savings have been estimated as being a reduction in the mixing
room area of 75% (Chamberlain, N. et al., 1961).
3. A reduction in the need for temperature-controlled areas for the bulk doughs with
consequent energy savings. Although CBP doughs typically have a higher dough temperature
than bulk fermented doughs, the shorter processing times and poor heat conductivity of dough
mean that variations in ambient bakery temperature will have less impact on the dough
temperature before reaching the prover.
4. Improved process control and reduced wastage in the event of plant breakdowns because
there will be less dough at an intermediate processing stage, e.g. in bulk fermentation.
20
5. More consistent dough and final product quality through the elimination of the potential
variability of dealing with doughs at different stages of fermentation.
6. More consistent dough and final product quality arising from the reduced variability in
dough piece weights coming from the divider. This arises because CBP doughs have less gas
in them at this stage than those made by bulk fermentation and the yeast is less active.
7. Financial savings from higher dough yield through the addition of extra water and retention
of flour solids normally fermented away.
The disadvantages include the following:
1. The need to process the dough at a faster rate because of the higher dough temperatures
used compared with those used with bulk fermentation.
2. A need for larger quantities of refrigerated water to control final dough temperature during
mixing.
3. A second mixing is required for the incorporation of fruit into fruited breads and buns.
4. A possible reduction in breadcrumb (but not crust) flavour because of the shorter
fermentation times involved in processing the dough to bread (Cauvain, S.P. and Young, L.S.,
2006).
Brimec process
Mechanical dough development in Australia was first seen as the Brimec process developed
by the then Bread Reseach Institute (BRI) of Australia and launched in 1962. This process
featured dough development in the mixer with some crumb cell structure control by varying
the position of a ram which restricted the free space in the mixing chamber and exerted some
pressure on the dough. The dough could be shaped and placed directly in a pan.
A no-time dough process using extra mixing on low-speed mixers was launched in 1964
(Collins, T.H. et al., 1968). In 1965 an extended proof version of mechanical dough
development was launched by the BRI with low yeast level and long proof times (typically
16–18 h).
Today mechanical dough development in Australian bakeries is very similar to the CBP, other
than the tendency to use higher work levels in the dough because of the generally stronger
wheat varieties which are available in Australia and New Zealand (Cauvain, S.P. and Young,
L.S., 2006).
21

1.4 Textural changes in bread during storage
“All bread fresh from the oven is good bread”. There is a lot of truth in that saying. Bread
loses its desirability progressively with the time it is out of the oven. Those undesirable
changes that occur with time are collectively called “staling”. They include toughening of the
crust, firming of the crumb, a loss of flavour, an increase in the opaqueness of the crumb, and
a decrease in soluble starch (Hoseney, R.C., 1994).
Freshly baked bread has very different characteristics to that which has been stored for short
periods of time. The nature and magnitude of the changes depends on the conditions under
which the product has been kept. If held unwrapped then the products in most cases will dry
out as moisture evaporates from the product to the surrounding atmosphere. The rate at which
moisture is lost from the product depends in part on the differential in moisture content
between product and atmosphere, and it proceeds faster when the moisture content of the
atmosphere is lower.
A further factor controlling moisture loss from baked products is the water activity (aw); the
lower the aw the lower the rate at which the product will lose moisture.
Wrapping bread will cause it to lose moisture more slowly; however, in this case the shelf life
of the product will be limited by the occurrence of mould growth. The appearance of mould
on the surface of the bread product is possible because the aw is high enough to permit its
growth, typically 0.90–0.98. At the end of baking the moisture content and aw of bread crust is
usually too low to permit mould growth. During storage, moisture moves from the moist
crumb zone to the drier crust. In unwrapped bread the moisture evaporates to the atmosphere,
but for wrapped bread an equilibrium is reached between the crumb, crust and atmosphere in
the wrapper surrounding the bread. Collectively the changes result in a reduction of the crumb
moisture content and an increase in that of the crust. In addition to creating the potential for
mould growth, the absorption of moisture by the bread crust causes it to lose its crispness and
go “soft”. This change reduces the sensory pleasure experienced by the consumer, especially
if the expectation is that the crust should be hard (e.g. as with baguette), and the product is
seen as being “stale”. It is common practice to reduce the loss of crispness of bread crust by
wrapping the product in a perforated film. The small holes in the wrapper allow some of the
moisture that migrates from the moist crumb to evaporate from the crust which allows the
latter to remain hard and crisp. However, the overall effect of the moisture loss is for the
22

crumb to quickly dry out and become hard. In composite products there is considerable
potential for moisture migration to and from the bread crumb and the other materials which
may be used. Bread staling may be described as the loss of “oven-freshness”. It encompasses
a number of different changes:
• loss of crumb and crust moisture, especially if the product is unwrapped;
• loss of crust crispness, more likely to occur if the product is wrapped;
• increases in product crumbliness, commonly related to moisture content; increases in crumb
firmness;
• changes in taste, usually a loss of;
• changes in aroma, usually a loss of.
Even when bread products are wrapped to prevent moisture losses during storage there is
progressive increase in the firmness of the crumb with increasing storage time. This intrinsic
firming is the change most commonly referred to as “staling” in the scientific literature and
arises because of changes in the crystalline structures of the starch component of the product
(Cauvain, S.P., 2004).
The changes that occur in the crumb appear to be much more complex. It was shown, almost
150 years ago, that the firming of bread crumb is not a drying phenomenon. Firming occurs
even though no moisture is lost. Occurring over the same general time span as the firming the
recrystallization of the starch. This is referred to as “retrogradation”. Over the last 20 years
ago or so, there has been a general consensus that firming and retrogradation are the same
phenomenonon. However, no firm proof that the two are causatively linked has been offered.
Recently, a number of reports have shown that the rate of firming and rate of retrogradation
are not the same.
The firming of bread crumb can be reversed by heating. This is one of the advantages to
toasting bread; it is said to be “refreshened”. The amylopectin crystal melts at about 60°C, but
bread crumb continues to lose firmness as it is heated above 60°C to about 100°C. This
strongly argues that firming is not related to retrogradation of amylopectin.
A number of factors are known to alter the rate of staling and to produce a bread that retains
its softness over time. First, surfactants that complex with amylose are known for their ability
to produce bread, presumably because starch, in the presence of surfactants, does not swell as
much as starch alone. Second, inclusion of shortening in the bread formula alters the staling
rate. Finally, the use of relatively heat-stable α-amylase in the bread formula retards staling.
The temperature at which bread is stored also appears to be important, with higher
23

temperatures retarding staling and cooler temperatures (above freezing) increasing the rate of
firming (Hoseney, R.C., 1994).
1.5 Frozen bakery products
During the last decades, breadmaking has been slowly but significantly captured by the
industry. The use of refrigeration or freezing in the food industry, which started in the late
19th century, is becoming increasingly popular to the breadmaking industry as it provides
bakery products with extended shelf-life, postpones the proofing-baking phase, and allows the
benefits of producing freshly baked products while saving on equipment and labor costs.
The first kind of product developed in the 1970s was the frozen fully baked bread. Earlier in
the 1960s, the frozen part baked bread called “brown and serve” was already proposed. This
product was the main frozen bakery product in France. Frozen fully baked products had a
limited success due to crust-flaking problems. At that time, yeasted frozen dough was
introduced, which has now become the leading product in terms of the market share of frozen
bakery products. This technology consists of preparing a dough and freezing it before
fermentation starts or after limited fermentation prior to freezing. The final transformation of
frozen dough is a three-step process requiring thawing, fermentation, and finally baking.
Approximately a decade later, frozen partially baked bread (or frozen part baked bread)
developed significantly in the industry. At industrial level, this technology consists of
preparing bread with partial baking usually done at moderate temperature and bread being
thereafter chilled and frozen. This frozen product can be placed directly into the oven and
perform thawing–baking in a single unit operation. One could mention a French patent related
to this type of product (LeDuff, L., 1985). In the end of the 1990s, the idea of producing
fermented frozen products came up and this technology, which was considered as a rather
ascending technique until few years ago, seems to attract more the breadmaking industry.
These products are also called “frozen ready to bake.”
Nowadays, frozen bakery products occupy an important share of the market. Researchers
believe that in 2006, 17% of “fresh bread” will be done from frozen products (13% in 2001).
In Europe, the overall consumption of bread and viennoiserie increases by 1% per year; at the
same time, the production of frozen bread and viennoiseries should increase by 7% by 2006.
This expansion of the frozen bakery products in Europe is driven by two patterns:
• The research for convenient products that can be quickly prepared and proposed “as
fresh” to the consumer.
24
• The consumers demand for a large variety of bakery products that is unprofitable to be
prepared by retailers.
The market of frozen bakery products is therefore expected to increase in the coming years.
1.5.1 Refrigeration applied to bread dough
Frozen bakery products can be mainly divided into two categories: frozen yeasted dough and
part baked products. These are two complementary products although they produce two
different qualities of bread. Frozen bread dough products are especially formulated to survive
freezing and thawing. They present quality similar to conventional bread but require a
minimum preparation of 2–3 hours. They are normally allowed to thaw and rise (proof) at
temperatures slightly above ambient to provide an expanded open grain dough structure and
then baked to produce a suitable finished product. The time required for thawed dough
proofing is usually determined as “slack time” in the baking industry.
On the contrary, frozen partially baked or part-baked products exhibit shorter preparation
time, as they can be ready in less than 20 min, but give a bread with slightly lower sensorial
quality. The freshly made dough is allowed to rise and then is partially baked, usually at
milder temperature than in the case of conventional breadmaking (i.e., 180°C vs. around
230°C for a French baguette).
Baking must be interrupted before Maillard reactions take place; a sufficient baking is
required to achieve a rigid product center at the end of the post baking chilling. Afterward, the
product is frozen and then distributed. Thawing is sometimes recommended before final
baking, which mainly consists of reheating the product for a short baking time; it is
recommended to bake products for up to two thirds of the time required for full baking, until
the color change of the crust due to Maillard reactions is achieved.
Retailers using refrigerated bakery products are very often combining the use of frozen dough
to cover customary needs and part-baked products to deal with increased consumer demand
during peak periods.
Frozen part-baked bread is dragging the innovation and its market share is continuously
growing in Europe due to its convenience and the reduced requirements in equipment and
labor as it requires a very limited know-how for the final transformation before retailing.
It also allows the production of more elaborated products at industrial level, whereas frozen
dough is usually applied for the mass production of conventional products. In 2002, the
25

industrial production of frozen bakery products in France was 65% for yeasted frozen dough
and 35% for frozen part-baked, whereas 40% of the frozen part-baked breads is exported
abroad.
Figure 1.6 and Figure 1.7 illustrate the process flow diagrams for the production of frozen
dough and part baked products as well as the modifications from conventional breadmaking
for yeasted and fermented bakery products, respectively.
Figure 1.6 Flowsheet for the application of freezing in breadmaking: frozen yeasted dough
and part baked bread (modified from Giannou, V. et al., 2006).
Figure 1.7 Flowsheet for the application of freezing in breadmaking: frozen fermented and
baked bread (modified from Giannou, V. et al., 2006).
26

1.5.2 Technological problems, solutions, and requirements
Problems associated with frozen dough products freezing
During food freezing, a number of serious physical changes occur such as the uneven growth
of ice crystals within products or moisture migration due to water vapor pressure variance.
This results in the accumulation of moisture particularly at the surface of the products and can
be detrimental to their textural or sensory characteristics.
The quality of the bread made out of frozen dough in specific is influenced by dough
formulation as well as by processing parameters such as dough mixing time, freezing rate,
frozen storage temperature, storage duration, and thawing rate.
It appears that these factors may act either independently or synergistically to reduce yeast
activity, which results in reduced CO2 production or weakening or damage to the gluten
network and entails in poor retention of CO2 and poor baking performance.
The main consequences of these phenomena include longer proof or fermentation times,
increased extensibility, decreased loaf volume, textural characteristics deterioration, and
variable performance.
The rheological characteristics of frozen dough bread have been studied extensively. The
presence of dead yeast cells in the dough has been implicated in poor bread quality but some
researchers (Autio, K. and Sinda, E., 1992) did not observe significant modification in the
rheology of the dough with or without yeast. Others (Varriano-Marston, E.K. et al., 1980)
showed that the gluten structure in frozen dough could be damaged by the formation of ice
crystals. Researchers (Ribotta, P.D. et al., 2001; Varriano-Marston, E.K. et al., 1980) who
worked with extensigraph observed the strengthening of dough (increase of extensigraph
resistance and decrease of extensibility) submitted to freeze–thaw cycles because of the
reducing substances leached out from yeast cells (mainly glutathione), which cause
depolymerization by cleaving disulfide bonds and subsequently weaken the gluten matrix, or
the redistribution of water caused by a change in water-binding capacity of flour constituents.
The opposite effect was observed by others (Inoue, Y. and Bushuk, W., 1991). The use of
different oxidants may explain this result (potassium bromate for Ribotta, P.D. et al., 2001 vs.
ascorbic acid for Inoue, Y. and Bushuk, W., 1991).
27

Problems associated with partially baked products
There is a quite limited amount of literature concerning this product. One of the main
problems concerning the quality of the crust is that the undergoing intense heating and
cooling phases result in a risk of excessive surface dehydration. In some extreme cases, crust
flaking might occur. Crust is the result of successive dehydration of the surface area of the
dough during proofing and baking. Even though most of the literature recommends the use of
moist air during proofing, there is no clear evidence about this allegation. Neither the effect of
post-baking chilling nor the effect of the freezing conditions has been studied. One evidence
is that crust flaking is visible at the end of the freezing process. Poor storage conditions may
magnify the problem but cannot be considered as solely responsible for the flaking
phenomena.
Solutions proposed for confrontation of problems
Different ways to minimize the effect of freezing on doughs and prevent loss of dough quality
are suggested in the literature: maintaining yeast viability during freezing and thawing,
improving parts of the breadmaking process, or using suitable ingredients, additives, and
cryoprotectants for frozen doughs. All these parameters are individually developed and
discussed subsequently.
28

Freezing Effect on Yeast Performance — Requirements and Suggestions
Yeast cells in bulk are regarded cryoresistant and their ability to produce CO2 is not affected
considerably by successive freeze–thaw cycles. However, when the cells are dispersed in a
dough, and especially when unfavorable processes such as freezing intervene, this resistance
is seriously restricted. The loss of cell viability in the dough during freezing has been
attributed to intracellular freezing and increased internal solute concentrations, which may
result in pH lowering, dehydration, ionic toxicity, damage to essential membrane processes,
impairment of cytoskeletal elements, and decreased glycolytic enzymes activity.
Yeast survival and gassing power are strongly affected by freezing rate, frozen storage
temperatures, and duration of frozen storage. From previous studies, it appears that a slow
freezing rate is preferable to preserve yeast activity (Bhattacharya, M. et al., 2003). Yeast
strain, age of cells, protein content, as well as nature and concentration of cryoprotectants
(e.g., trehalose) also influence the yeast activity. In addition, processing conditions such as
fermentation prior to freezing may reduce yeast cryoresistance.
To minimize the freezing effect on product stability, several suggestions have been proposed.
Some researchers support that dry yeast may be superior to compressed yeast in preserving
the shelf-life of frozen dough as it presents longer lag period and consequently more
restrained fermentation before freezing, providing a more stable dough. However, reports also
show that doughs made with dried yeast exhibit slightly longer proof times and could contain
more broken cells that might release glutathion, which is known to affect the gluten network
(Ribotta P.D. et al., 2001 ). Another approach for the maintenance of yeast viability is the
commercial production of new yeast strains that are more resistant to freeze damage. Finally,
it is suggested that yeast content in the dough formula should normally be higher than in
conventional breadmaking to overcome the prospective loss of activity during freezing and
storage and any inadequacy in proofing conditions.
29
Processing Parameters — Requirements and Suggestions
The poor baking performance of frozen dough can be overcome to a great extent through the
use of appropriate processing conditions, which aim at the restraint of yeast damage and the
enhancement of gluten network ability to retain gas. Mixing duration, dough temperature, and
resting after mixing are very important parameters. If dough is undermixed, starch and
proteins are unevenly distributed, and when it is overmixed gluten proteins become stressed
and partially depolymerised. To minimize yeast activity before freezing, dough temperature
after mixing should be slightly lower than conventional (usually between 24 and 26°C)
breadmaking, and range between 19 and 22°C. Several researchers suggest that in frozen
bakery products, dough resting after mixing should be completely avoided to minimize
fermentation before freezing, whereas others consider short rest times (8–10 min) to be
beneficial (Kulp, K. et al.,1995).
The influence of sheeting and molding conditions on the stability of frozen dough was not
found to be very significant. However, as far as dough shape is concerned, it is believed that
round-shaped dough pieces produce less satisfactory bread than slabs and cylinders.
Packaging is also very important as it performs a number of functions: it contains, protects,
identifies, and merchandizes food products. It should provide an effective barrier to
contamination and variable moisture conditions, compressive strength to withstand stresses,
and perform satisfactorily during storage and transport. The packaging materials and their
shapes may vary according to product specifications but the most popular materials applied to
frozen bakery product are plastic (films, membranes, etc.) and aluminium. Films used for
frozen dough products should present good oxygen and moisture barrier characteristics,
physical strength against brittleness and breakage at low temperature, stiffness to work on
automatic machinery, and good heat sealability.
As far as freezing is concerned, reports show that slow rates (<2°C/min) provide higher yeast
survival levels and bread scores (Gélinas, P. et al., 1995). It has also been shown that slow
freezing at -20°C is better than freezing at -40°C (Inoue, Y. and Bushuk, W., 1991). At
relatively slow freezing rates, ice is formed outside the yeast cell and can lead to a relative
increase in external solute concentration and hence hyperosmotic conditions that cause efflux
of intracellular water and relative dehydration. On the contrary, high freezing rates result in
the formation of small ice crystals inside yeast cells. This can eventually lead to the rupture of
30
cell membranes if recrystallization into larger crystals occurs especially during prolonged
frozen storage and slow thawing at low temperatures.
However, studies on the influence of both freezing rate and dough geometry show that a high
freezing rate and a low yeast activity were observed at the core of cylindrical dough pieces
whereas lower freezing rate and a higher yeast activity were noticed at the surface of these
samples (Le Bail, A. et al., 1998; Havet, H. and Le Bail, A., 1999). These observations on the
freezing rate are in agreement with the heat transfer theory in cylindrical geometry, which
demonstrates that the velocity of the freezing front is the lowest at the surface and in the bulk
zone and tends to become infinite at the center.
Another factor that should be considered is the influence of storage time and conditions on the
gluten structure, which appears to be disrupted during extended storage resulting in dough
weakening, loss of gas retention ability, and deterioration of product quality. Temperature
fluctuations during storage were shown to be as important as the storage duration.
Thawing should preferably be performed under stepwise temperature increase to avoid the
formation of an excessive temperature differential between dough surface and surrounding
air, which can cause condensation in the crust and generate crust spotting and blistering.
Rapid thawing also results in temperature rising only to the outer surface of the dough, which
becomes ready for proofing, whereas the center of the dough still remains frozen. This can
lead to unconformable gas cell structure and significantly affects frozen storage stability
because when dough comprises a large number of small bubbles with narrow size distribution
and thick walls, it appears to be more stable than a dough that contains bubbles with less
uniform size distribution (Giannou, V. et al., 2006).
Raw Material — Requirements and Suggestions
The ability of dough to withstand harsh freezing and thawing conditions significantly depends
on flour type and protein quality, which are important variables for the stability of frozen
dough. A medium to strong flour is recommended for frozen doughs to maintain their
ovenspring potential even after losing some intrinsic strength over storage period. Doughs
made from strong flours are generally more resistant to freeze damage, and hard red spring
(HRS) wheat is preferred for frozen dough because of its superior gluten strength. However,
flour protein content is found to be less important than flour protein strength for optimum
frozen dough performance. Dough rheology and consequently dough machinability are
strongly affected by water content. It is recommended to incorporate less water in the formula
31

of frozen bakery products to minimize free water in the dough. This is important because free
water is responsible for water migration and ice crystal formation, which can be detrimental
for yeast cells and gluten proteins and may result in reduced gas retention. The use of chilled
water is also preferable as it retards yeast activity and accelerates freezing of dough pieces.
Reports indicate that higher levels of sugars should be used as well because due to their
hydroscopic properties they can reduce the amount of free water in frozen dough products and
therefore constrain its undesirable effects on dough stability. Besides, sugars are responsible
for the osmotic stress of yeast cells during freezing and therefore, specific yeast strains with
increased “osmotolerance” are proposed by yeast companies. Salt addition is also important,
as it has been found to retard the production of carbon dioxide by the yeast thus delaying
dough fermentation. Finally, shortening is considered to improve dough processing and
freezing tolerance. More preferably, saturated or partially saturated shortening should be used
in frozen bakery products (Giannou, V. et al., 2006).
Additives — Requirements and Suggestions
Additives are used in breadmaking to facilitate processing, confront raw material variations,
ensure stability in quality characteristics, and sustain freshness . Especially when incorporated
in the frozen dough formula, they are able to counteract with several of the changes occurring
during freezing, frozen storage, and thawing. More specifically, they can decrease final proof
time, improve dough rheological properties, and increase loaf volume and bread softness. The
most frequently used additives in frozen dough products are: oxidative substances (L-ascorbic
acid, azidocarbonamide, and potassium bromate), emulsifiers (monoglyceride, sodium or
calcium stearoyl-2-lactylate, diacetyl tartaric acid esters of monoglycerides, etc.), enzymes
and hydrocolloids (xanthan gum, guar gum, hydroxypropylmethylcellulose (HPMC), k-
Carrageenan, etc.).
The use of optimum levels of oxidant ingredients, whether from natural or chemical origin,
exerts an improving effect on dough rheology and handling and on the overall quality of the
finished product. During mixing, oxidizing agents convert sulfhydryl (SH) groups of the
gluten protein to disulfide (SS) linkages between adjacent molecules, building up the gluten
matrix and providing a stronger dough. An oxidant also exhibits its improving effect by
increasing the loaf volume during the first few minutes of the baking process.
Ascorbic acid is probably the most popular oxidizing agent used in frozen bakery products. It
is reported to significantly reduce dough stickiness, decrease extensibility, and increase its
32
elasticity by inducing intermolecular interactions between dough protein molecules, and
consequently increase ovenrise and bread score. The use of potassium bromate is prohibited
in most countries even though it shows better performance than ascorbic acid.
Emulsifiers may also be used in the formulation of yeasted frozen dough products. They are
commonly added to commercial bread products to improve bread quality and dough handling
characteristics and usually result in a foamy crumb with fine and uniformly dispersed cells.
Such a foamy crumb is easy to recognize and is more or less accepted by the consumer. The
effect of emulsifiers has been extensively studied and numerous references can be found in
the literature on this aspect. They are reported to improve mixing tolerance, gas retention, and
dough resistance, to increase the loaf volume of the final product and to endow it with
resilient texture, fine grain as well as slicing properties.
Monoglyceride (MG) was the first industrial emulsifier; since then other emulsifiers has been
developed, some of them requiring the combined presence of “conventional” emulsifiers such
as MG. For example propylene glycol monostearate (PGMS), which is an additive typically
used in the United States and enhances the efficiency of MG. Polyglycerol esters of fatty
acids (PGEs, HLB 3-13) has been patented by “PURATOS” and must be used with MG as
well. Diacetyl tartaric acid esters of monoglycerides (DATEMs), acetic acid esters of
monoglycerides (AMGs), and lactic acid esters of monoglycerides (LMGs) can be used alone
or with other emulsifiers. These emulsifiers can be used as crumb softeners or antistaling
agents as they interact with amylose by forming complexes that are known to delay the
retrogradation, resulting in the staling of bread. They also interact with lipids and shortening,
resulting in a foamy structure with refined cells (i.e., sandwich bread). Sodium stearoyl
lactylate (SSL) has also been shown to be effective in maintaining both volume and crumb
softness and provide longer shelf-life stability in fresh and frozen dough products subjected to
extended storage.
Enzymes such as amylases, proteases, hemicellulases, lipases, and oxidases can be naturally
present in foods such as wheat and soy products (as long as they are not removed or
inactivated) or incorporated in them as additives. They have been shown to influence the
entire breadmaking process by decolorizing (bleaching) dough, improving dough volume and
texture, and maintaining shelf-life by extending product freshness during storage. Their
effects on frozen dough products can be seriously enhanced when used in combination with
selected oxidants such as ascorbic acid. Transglutaminase is also reported to significantly
improve the cohesion of the gluten network and seems to be well adapted in the puffing
pastry.
33

The supplementation of vital gluten to relatively weak doughs improves the mixing tolerance
and stability of dough, resulting in increased loaf volume, improved crumb texture and
softness, and prolonged shelf-life of bakery products. As gluten is a protein, it also enhances
nutritional value of the products. The embedment of pentosans is particularly important as
well in breadmaking because of their physical properties. They improve dough machinability,
increase bread volume, and decrease the rate of starch recrystallization, and therefore reduce
staling rate of baked bread.
The incorporation of cryoprotective materials in frozen bakery products is increasingly
becoming appealing. Cryoprotectants are substances, which have the ability to protect protein
cells from chemical changes and loss of functionality during freezing or thawing and
consequently improve quality and extend the shelf-life of frozen foods. Cryoprotective agents
may include sugars, amino acids, polyols, methyl amines, carbohydrates, some proteins, and
inorganic salts such as potassium phosphate and ammonium sulfate (Giannou, V. et al.,
2006).
One group of the most extensively used additives in the food industry is the hydrocolloids.
These compounds are capable of controlling both the rheology and texture of aqueous systems
through stabilization of emulsions, suspensions and foams. In the baking industry,
hydrocolloids are of increasing importance as bread improvers as they can induce structural
changes in the main components of wheat flour systems along the breadmaking steps and
bread storage.
Such structural changes modify the selectivity of some enzymes and change the technological
quality of dough and bread. Hydrocolloids affect the baking performance of dough and also
the shelf-life of stored bread. The presence of hydrocolloids influences melting,
gelatinization, fragmentation and retrogradation processes of starch. These effects were
shown to affect the pasting properties and rheological behaviour of dough. The synergism
between hydrocolloids and starch may be due to the formation of complexes between the
starch polymers, i.e. amylose and/or amylopectin, and the hydrocolloids during pasting.
When used in small quantities (< 1% w/w in flour) in dough, hydrocolloids are expected to
increase water retention and loaf volume, as well as to decrease firmness and starch
retrogradation. The addition of hydrocolloids into frozen products can provide stability during
freeze–thaw cycles and help to minimize the negative effects of freezing and frozen storage
on starch-based products .
It also decreases water activity due to the competition for water by the hydrocolloids with the
bread polymers like protein and starch. The overall effects on the functional performance of
34

dough and the subsequent bread quality, however, depend on the nature, origin and particle
size of the principal components, dosage of the hydrocolloids incorporated into dough, as well
as the formulation, processing condition and other ingredients (Selemulyo, V.O. and Zhou,
W., 2007).
35

Quality and safety control
The most common quality defects, which appear in frozen bakery products, the cause of their
existence are presented in Table 1.1 (Giannou, V. et al., 2006).
Cause Defect Raw materials Flour Very weak Coarse crumb Small volume Inadequate shape Unsatisfactory crumb color Very strong Small volume Inadequate shape Unsatisfactory crumb color Lechy crumb Yeast Smaller amount Small volume Excessively dark crust color Lechy crumb Larger amount Small volume Unsatisfactory crust/crumb color Inadequate shape Excessive crumb brittleness Skinning Fissures on crust White spots or blisters Salt Smaller amount Poor crust/crumb color Excessive crumb brittleness Excessive volume Larger amount Lechy crumb Excessively dark crust color Small volume Water Smaller amount Small volume Inadequate shape Crust-crumb separation Excessive crumb brittleness Lechy crumb Unsatisfactory crumb color Larger amount Coarse crumb Unsatisfactory crumb color Small volume Inadequate shape Sugar (larger amount) Dark crust color
36

Table 1.1 Quality defects in frozen bakery products (modified from Giannou, V. et al., 2006).
Continued Processing
Mixing Restricted Crumb fissures Lechy crumb Unsatisfactory crumb color Excessive Lechy crumb Excessive crumb brittleness Molding (inadequate) Lechy crumb
Large blisters either on the surface causing shape distorsion or under the top crust
Freezing (very slow) Crust fissures Uneven or open cell structure Storage (very long) White spots and blisters
Patches of uneven color on the side and bottom crusts of breads
Proofing/thawing Very slow White spots and blisters Small volume Inadequate shape At higher temperatures Areas of dense crumb Excessive volume Ragged crust breaks Overlapping top Thick and hard crust Baking At lower temperatures Coarse/Lechy crumb Unsatisfactory crumb/crust color Excessive dough volume At higher temperature Coarse/Lechy crumb Small volume Excessively dark crust color Inadequate shape
37

2. RHEOLOGICAL TESTS
Rheology is the study of how materials deform, flow, or fail when force is applied (Hoseney,
R.C., 1994).
The name is derivated from Greek: rheos- the river, flowing, streaming, e.g. the Greek
philosopher Heraklit of Ephesos (about 540 to 480 BC) thaught: “phanta rei”- everything is
flowing.
Therefore rheology means “flow science” rheological investigations not only include flow
behaviour of liquids, but also deformation behaviour of solids.
The first Rheological Society was founded in 1929 in the USA by Eugen C. Bingham (1878
to 1945) and M. Reiner.
Therefore only since the 20 century rheology has been an independent science, but earlier
already many scientist worked more or less scientifically on the behaviour of liquids and
solids. The targets of rheologists are measurement, characterization and interpretation of the
flow and deformation behaviour of materials.
A controlled, well-defined deformation or strain is applied to a material over a given time and
the resulting force response is measured (or vice versa) to give an indication of material
parameters such as stiffness, modulus, viscosity, hardness, strength or toughness of the
material (Dobraszczyk, B.J., 2003).
The rheological properties of some materials can be described by a single value. For example,
the flow of water is defined by its viscosity. The deformability of a steel spring is defined by
Hooke’s constant (a modulus of elasticity). However, most materials, and certainly doughs
and butters, are not that simple in their properties or behaviours but show a more complex
rheological behaviour.
If a material’s viscosity is constant regardless of shear rate (the rate of stirring or flowing
through the pipe), the material is said to show Newtonian or ideal viscosity. Its behaviour then
can be defined by a single viscosity value. However, in many systems, including most flour-
water systems, the viscosity changes (decrease) as the shear rate is increased. Thus, the
system shows more complicated non- Newtonian behaviour, and we cannot define the system
by a single viscosity value but must give a viscosity at each shear rate. In addition, viscosity
can also be affected by the time involved in making the measurement.
38
There are many different kinds of moduli. In general, modulus refers to the stiffness of the
material and is a proportionality constant relating stress or strain. In lay terms, it tells how
much force is required to produce a specific deformation of the material under test.
In the cereal chemistry literature, we often see measurements taken with a farinograph or
mixograph referred to as rheological measurements. Certainly, these instruments measure
how doughs deform and flow. The problem with the use of these instrument for rheological
studies is that we cannot define the stress on the sample at any moment of time during the
test. For example, in a mixograph bowl, only a small part of the dough is in contact with a pin
at any given time, and the shape of the sample (dough) changes in a very complicated and
unpredictable ways. Thus, it is impossible to determine the stress on the dough, as we do not
know the geometry of our test piece. As a result, the measurement made using a mixograph
are valid only for the mixograph, and measurements made using the farinograph are relevant
only to the farinograph.
This is not to say that the above instruments are not useful. They have stood the test of time
and can give much useful information. They are particulary useful when used to characterise
or “fingerprint” a flour. We often want to know whether the mixing properties of the flour we
are using today are similar to or different from those of the flour we used yesterday. The
mixograph or farinograph can easily and rapidly answer that question for us.
Instead from fundamental measurements we can learn more about our dough or batter. We
can see the effect of various interactions and how the properties of the dough or batter change
as a function of time or temperature. In addition, the measurement can often be made on the
complete dough or butter system so the results are relatively easy to interpret. Another reason
is that, with the advent of minicomputers and their related equipment, it has now become
much easier to obtain good rheological data (Hoseney, R.C., 1994).
Besides the rheological properties should be independent of size, shape and how they are
measured; in other words, they are universal, rather like the speed of light or density of water,
which do not depend on how much light or water is being measured or how it is being
measured. It would be comforting to know that the stiffness of bread or viscosity of dough
measured in a laboratory in Reading will be the same measured in any laboratory in the world,
even if they are measured using different tests, sample sizes or shapes. The whole point of the
rheological approach is that the properties that are measured are reproducible and can be
compared between different samples, test sizes and shapes, and test methods (Dobraszczyk,
B.J., 2003).
39

2.1 Rheological test methods
There are many test methods used to measure rheological properties. It is not possible to
describe all the available testing geometries here, and the reader is referred to general reviews
of rheology (Ferry, J.D.,1980; Barnes, H.A. et al., 1989; Whorlow, R.W., 1992), rheological
testing of foods (Sherman, P., 1970; Carter, R.E., 1990; Rao, M.A. and Steffe, J.F., 1992;
Dobraszczyk, B.J. and Vincent, J.F.V., 1999; Van Vliet, T., 1999) and cereal products
(Bloksma, A.H. and Bushuk, W., 1988; Faridi, H. and Faubion, J.M., 1986, 1990; Muller,
H.G., 1975). It is common to categorise rheological techniques according to the type of strain
imposed: e.g. compression, extension, shear, torsion, and also the relative magnitude of the
imposed deformation, e.g. small or large deformation.
The main techniques used for measuring cereal properties have traditionally been divided into
descriptive empirical techniques and fundamental measurements (Dobraszczyk, B.J., 2003).
2.1.1 Descriptive empirical measurements
Within the cereals industry there has been a long history of using descriptive empirical
measurements of rheological properties, with an impressive array of ingenious devices such as
the Penetrometer, Texturometer, Consistometer, Amylograph, Farinograph, Mixograph,
Extensigraph, Alveograph, various flow viscometers and fermentation recording devices,
reviewed by Muller (1975) and Shuey (1975) (Table 2.1).
40

Method Products Property measured Empirical Methods Mixers: Dough Mixing time/torque Farinograph Apparent Viscosity Mixograph Reomixer Extensigraph Dough Extensibility TAXT2/Kieffer rig Dough/gluten Extensibility Alveograph Dough/gluten Biaxial extensibility Amylograph RVA Pastes, suspensions Apparent Viscosity, Gelatinisation temperatureConsistometer Sauces, fillings Apparent Viscosity Flow cup Fluids, sauces, batters Apparent Viscosity Falling ball Fluids Apparent Viscosity Flow viscosimeters Fluids, pastes Apparent Viscosity Fermentometers Dough Height, volume Penetrometers Semi-solid foods, gels Firmness, hardness Texturometer, TPA Texture, firmness Fundamental methods Dynamic oscillation Concentric cylinders Fluids, pastes, batters Dynamic shear moduli Parallel plates Doughs dynamic viscosity Tube viscometers: Capillary Fluids Viscosity Pressure, extrusion Sauces, pastes, dough Viscosity Pipe flow In-line viscosity Transient flow: Concentric cylinders Semi-solid viscoelastic Creep relaxation Parallel plates material moduli and time Extrusion: Uniaxial, biaxial Extensional viscosity TAXT2 dough Inflation system
strain hardening
Lubricated compression RVA= Rapid Visco-Analyser, Newport Scientific Pty., Australia.
TPA= Texture Profile Analysis.
Table 2.1 Rheological methods used for cereal products (modified from Dobraszczyk, B.J.,
2003).
41

Empirical tests are easy to perform and are often used in practical factory situations, providing
data that are useful in evaluating performance during processing and for quality control. The
instruments are often robust and capable of withstanding demanding factory environments,
and do not require highly skilled or technically trained personnel. Simply because they do not
provide data in fundamental units does not mean that these tests are worthless: indeed, they
have provided a great deal of information on the quality and performance of cereal products
such as consistency, hardness, texture, viscosity, etc. However, these measurements are not
strictly “rheological” tests since:
the sample geometry is variable and not well defined;
the stress and strain states are uncontrolled, complex and non-uniform and
it is not possible to define any rheological parameters such as stress, strain, strain rate,
modulus or viscosity.
Therefore, these tests are purely descriptive and dependent on the type of instrument, size and
geometry of the test sample and the specific conditions under which the test was performed.
For example, empirical tests have been used to characterise the behaviour of bread doughs
during processing, such as the Farinograph and Mixograph. Many of these are used as “single
point” tests, where a single parameter is often arbitrarily selected from a whole range of data
acquired during the test as, for example, in selecting the peak torque from a mixing trace and
then using this to correlate with performance. This neglects a large part of the recorded data,
and is appropriate only to the set of conditions under which that test was performed and is
generally not applicable to any other deformation conditions. Since dough experiences a wide
range of conditions of stress states and strain rates during processing and baking, and the
rheological properties of dough are dependent both on time and strain, there is often a
discrepancy between such single point type tests and actual performance on the plant, where
conditions of strain and strain rate may be poorly defined and very different from those in the
laboratory test. While this may give the illusion of a “scientific” test by being performed on a
machine (frequently with a computer attached), and may give satisfactory correlations with a
textural or processing parameter, it is impossible to compare results between different testing
machines, or to extrapolate the results to other deformation conditions.
Most food materials are viscoelastic and therefore their properties depend on how quickly the
test is performed (the strain rate or frequency). This is important in many aspects of dough
processing: if the dough is deformed quickly, such as in mixing or sheeting, then the
rheological properties of the dough will be very different if measured at the typically slower
rates of deformation found in conventional testing machines. Alternatively, during processing
42

dough will experience strains very different in magnitude and nature than those generally
available in a rheological test. Many food processes operate under extensional flow, while
most rheological tests on foods are performed in shear. Tests under only one particular set of
conditions of rate, temperature and strain will almost certainly not be applicable to another set
of deformation conditions. What is necessary is to define the set of deformation conditions
that the food endures in practice and perform tests under similar conditions (Dobraszczyk,
B.J., 2003).
Texture Profile Analysis (TPA test)
Instrumental Texture Profile Analysis (TPA) was developed about 30 years ago, constituting
an interesting way of analyzing a series of textural parameters in only one test.
Together with texture, appearance and flavour are the principal sensory factors that determine
food acceptability for consumers (Bourne, M.C., 1978). Thus, the development of objective,
precise experimental methods that allow the study of mechanical properties of foods related to
texture has been an important target for food technology in recent decades.
In recent decades, much work has been done on the development of mechanical tests that tried
to imitate the sensory evaluation of food texture (Peleg, M., 1983).
Among these one must mention instrumental Texture Profile Analysis (TPA), which has been
applied as a useful method for a wide range of foods. However, it is often applied without
knowing the correct definition of its parameters or selecting suitable experimental conditions.
Historical background
The origin of TPA was Szczesniak’s classification of textural characteristics (Szczesniak,
A.S., 1963) the key principle of which was to serve as a bridge between the instrumental and
sensory evaluation of texture. The use of the General Foods (GF) Texturometer by
Szczesniak’s research team was the major breakthrough in instrumental Texture Profile
Analysis. This equipment, which was a modification of the original MIT Denture
Tenderometer (Proctor, B.E. et al., 1956a,b) was designed to simulate the masticating action
of the human mouth and can be described as a unit composed of a plate supported by a
flexible arm attached to a strain gauge, and a plunger which acted upon the food sample,
usually a bite-size piece, compressing it twice in a reciprocating motion that imitated the
43
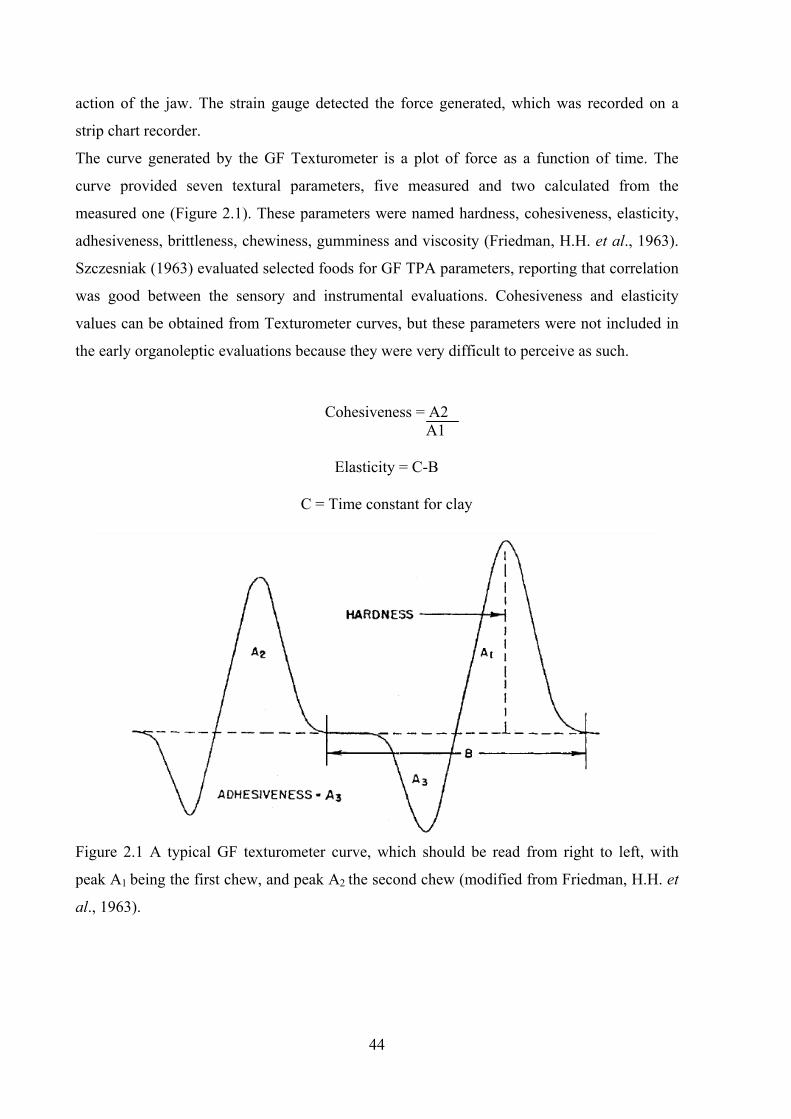
action of the jaw. The strain gauge detected the force generated, which was recorded on a
strip chart recorder.
The curve generated by the GF Texturometer is a plot of force as a function of time. The
curve provided seven textural parameters, five measured and two calculated from the
measured one (Figure 2.1). These parameters were named hardness, cohesiveness, elasticity,
adhesiveness, brittleness, chewiness, gumminess and viscosity (Friedman, H.H. et al., 1963).
Szczesniak (1963) evaluated selected foods for GF TPA parameters, reporting that correlation
was good between the sensory and instrumental evaluations. Cohesiveness and elasticity
values can be obtained from Texturometer curves, but these parameters were not included in
the early organoleptic evaluations because they were very difficult to perceive as such.
Cohesiveness = A2 A1
Elasticity = C-B
C = Time constant for clay
Figure 2.1 A typical GF texturometer curve, which should be read from right to left, with
peak A1 being the first chew, and peak A2 the second chew (modified from Friedman, H.H. et
al., 1963).
44

A very important milestone was the adaptation of the Instron Universal Testing Machine to
food studies described by Bourne (1966). In a later paper (Bourne, M.C., 1968), this author
demonstrated the first application of the Instron to objective Texture Profile Analysis of a
food (ripening pears). He argued that the Instron was a better tool for determining TPA
parameters than the GF Texturometer for several main reasons:
(1) The speed of Instron compression is constant at all times during the downstroke. This and
the immediate reversal of the compression stroke at the end of the first bite result in sharp
peaks in the curves.
(2) The plunger moves in a strictly rectilinear manner, so the plunger area in contact with the
food is constant throughout the compression, assuming sample surface is flat and there is no
slippage at the interface.
(3) The Instron chart also gives a force-time curve but, in contrast to the Texturometer, it is
also a force-distance curve. Therefore, the Instron curve areas are force-time and also force-
distance integrals, so that these areas are true measurements of work.
Bourne followed the individual parameters of Friedman (1963) fairly closely, except in the
definition of cohesiveness. Drake (1966), who worked with the Masticometer instrument,
established that the area recorded when the plunger moves upwards represents work delivered
by the sample. From a physical point of view it should be taken with a negative sign, i.e., it
should be subtracted from the area recorded during the downward movernent of the plunger.
Bourne (1968) also noticed that there was no distinction for work done by the sample to the
instrument during decompression, so he proposed that this work should be separated from the
work performed on the sample by the instrument, ignoring this part of the area for the
calculation of cohesiveness. Olkku and Rha (1975) and Peleg (1976) followed Drake’s
suggestion, subtracting the decompression area from the compression area to give the net
work done in the two compression cycles. Some years later, Bourne (1978) again listed the
seven textural parameters, with the modifications introduced since they were first published
(Szczesniak, A.S., 1975a), as follows (Figure 2.2):
45

Figure 2.2 A generalized TPA curve from the instron universal testing machine (modified
from Bourne, M.C., 1978).
(1) Fracturability (originally called brittleness) is defined as “the force at the first significant
break in the curve”. As a break is a visible phenomenon related to the macrostructure of the
sample, it must be identified as a change in the inflection of the curve whose magnitude must
be defined.
(2) Hardness is defined as “the peak force during the first compression cycle” (“first bite”).
(3) Cohesiveness is defined as “the ratio of the positive force area during the second
compression portion to that during the first compression (Area2/Areal), excluding the areas
under the decompression portion in each cycle”.
(4) Adhesiveness is defined as “the negative force area for the first bite, representing the work
necessary to pull the plunger away from the food sample”.
(5) Springiness (originally called elasticity) is defined as “the height that the food recovers
during the time that elapses between the end of the first bite and the start of the second bite”.
(6) Gumminess is defined as “the product of hardness × cohesiveness”.
(7) Chewiness is defined as “the product of gumminess × springiness” (which is equivalent to
hardness × cohesiveness × springiness).
46

Table 2.2 shows the units of the seven texture profile parameters.
Mechanical parametr
Measured variable
Units
Hardness Force m.l.t-2
Cohesiveness Ratio dimensionless
Springiness Distance l
Adhesiveness Work m.l.2t-2
Fracturability Force m.l.t-2
Gumminess Force m.l.t-2
Chewiness Work m.l.2t-2
Table 2.2 Parameter units of instrumental Textural Profile Analysis (modified from Pons, M.
and Fiszman, S.M., 1996).
Bourne’s procedure has been the basis for practically all subsequent instrumental TPA studies
using the Instron, which has been one of the most popular choices of instrumentation for
objective Texture Profile Analysis in further studies, Nowadays, in TPA records fully
automated computer readout of data from force-distance point pairs is used, allowing
selection of predetermined forces, distances, and areas to be used by the computer in
subsequent calculations of TPA parameters.
In modern computer-assisted texturometers which provide great versatility, e.g. the TA-XT2
Texture Analyser (SMS), it is possible to perform TPA tests and directly obtain all TPA
parameters by means of its software, without any previous selection of curve values for
calculations. However, depending on the type of sample, such a degree of automation is not
always advisable. In all cases, a profound knowledge of the physical basis of each parameter
will avoid misleading results.
47

Testing conditions
In most cases, the conditions reported for obtaining TPA parameters are very different for
different workers, making a comparison of results impossible. The differences are due to
experimental conditions such as sample size and shape, ratio of compressing probe size versus
sample, extent of deformation, crosshead speed, number of bites, and replicates per mean
value.
Sample Size and Shape.
In general, the samples were sampled by cutting standard-sized cubes or cylinders, or by
allowing the samples to set into moulds of standard diameter and height.
Size of Compressing Unit Versus Sample.
The size of the compressing unit (sometimes called “punch,” “plunger” or “probe”) is also
very important, especially in relation to sample size. This ratio certainly determines the
magnitude of the results. Thus, when the probe is larger than the sample, the forces registered
are largely due to uniaxial compression. However, when the opposite is true, the forces derive
largely from puncture, a combination of compression and shear. Bourne (1968) was the first
to adopt true uniaxial compression to perform TPA with an Instron. This experimental
condition was subsequently used by other authors working with the same instrument.
Generally speaking, most recent work done on TPA normally uses compression devices larger
than the sample size, so that the forces registered in TPA tests are largely due to uniaxial
compression forces.
Extent of Deformation (Percent deformation)
The General Foods team used up to 88% deformation in TPA tests on strawberries
(Szczesniak, A.S. and Smith, B.J., 1969), precooked freeze-dried beef (Szczesniak, A.S.,
1971), cheese and dessert gel systems (Szczesniak, A.S. and Hall, B.J., 1975). In general, 75-
80% deformation has been the choice of most authors who have worked on fruits, vegetables
and meats. This may be because they had to compress to a larger degree in order to obtain the
brittle fracture peak. The choice of extent of deformation will depend upon the purpose of the
48

test. If it is to imitate the highly destructive process of mastication in the mouth, as in the
TPA’s origins, deformation values to break the gel system must be reached. Usually, for
example in gel type systems, compressions greater than 70-80% completely break the gel
sample. The second compression cycle does not usually find a weakened sample with just the
first internal cracks (like natural turgent vegetables), but portions or small pieces of the initial
sample. Deformation levels between 20-50% have commonly been applied in recent works on
gel food systems. At these levels, samples do not break (a brittleness peak does not appear in
the curve) but it is still possible to obtain valuable information on important parameters such
as hardness (force at a given deformation), springiness, cohesiveness and their derivates
gumminess or chewiness.
Cross-head Speed
Shama and Sherman (1973) were the first to show that, as the cross-head speed increases, the
force required to achieve a particular compression also increases. They stated that since
humans use different forces and chewing rates depending on the textural characteristics of the
food evaluated, both the magnitude of the force applied and the rate at which it is applied
must be taken into account when testing conditions are established in a texturometer, aiming
to reproduce those associated with the sensory evaluation of the specific type of food, as also
stated by Szczesniak and Hall (1975).
Time Elapsed Between Bites
Little information is available on this topic. Current machines such as the TA.XT2 (Stable
Micro Systems-SMS) give the option of selecting a variable time period to elapse between
bites. In any case, if a time period is selected, it should be specified in the testing conditions,
since the amount of time between bites clearly determines TPA parameters such as
springiness, cohesiveness, gumminess and chewiness, mainly in those systems with a high
viscous component.
49

Effect of Lubrication
To obtain real information on the mechanical properties of foods, the results should be
reproducible, and the parameters describing the materials, as determined experimentally,
should be independent of testing conditions or sample dimensions. However, use of
unlubrificated plates in compression tests, can produce frictional phenomena at the sample-
plate interface, resulting in non reproducible data. Also, compression data with unlubrificated
plates will yield parameters that depend both on material bulk properties and on the frictional
characteristics of the sample-plate interface. This means that the force-deformation curves
will depend on sample geometry and, in particular, on the area of contact between sample and
plates.
TPA terminology
As has been said, the pioneering work of Szczesniak (1963) named the TPA parameters as
hardness, cohesiveness, elasticity, adhesiveness, brittleness, chewiness and gumminess
(Figure 2.1). Nevertheless, several authors have examined them critically and proposed
several modifications to their names or definitions.
Hardness
This parameter was originally defined by Szczesniak (1963) as “the force needed to attain a
given deformation”. Sherman (1969) criticized the use of the term “hardness” and proposed
“firmness” in relation to a given deformation. This new term was adopted by a few authors
performing instrumental TPA (Henry, W.F. et al., 1971; Shama, F. and Sherman, P., 1973). It
should be mentioned that the term firmness was already part of the soft ↔hard scale in
Szczesniak’s sensorial classification.
Springiness
This parameter was originally named “elasticity” by Szczesniak (1963) and defined as “the
rate at which a deformed material goes back to its undeformed condition after the deforming
force is removed”. Due to sharp edges and relative insensitivity of the teeth, difficulties in the
sensory evaluation of this parameter were found and no standard scale was constructed
50

(Szczesniak, A.S. et al., 1963). This definition was adapted in the GF Texturometer as ‘‘the
difference between the distance B, measured from the initial sample contact to the contact on
the second chew, and the distance C, the same measurement made on a completely inelastic
standard material such as clay” (Figure 2.1).
Afterwards, Szczesniak replaced the term “elasticity” with “springiness.” This substitution
was made to avoid confusion with the well defined rheological term “modulus of elasticity,”
and in fact this new term is widely accepted today (Szczesniak, A.S., 1975a). Springiness is
measured several ways, but most typically, by the distance of the detected height of the
product on the second compression (length 2 ), as divided by the original compression
distance (length 1). The original definition of springiness used the length 2 only and the units
were in mm or other units of distance.
Cohesiveness
Szczesniak (1963) defined this parameter as “the strength of the internal bonds making up the
body of the product”. In the TPA curve, it is measured as “the ratio of the area under the
second peak and the area under the first peak (A2/A1)” (Figure 2.1) (Friedman, H.H. et al.,
1963). It is worth noting that these authors had also indicated that if the food sample exhibits
adhesiveness, it is necessary to coat the material with talcum powder before recording the
cohesiveness profile, because of the distortion created by the negative adhesiveness peak on
the start of the second curve. As already stated, the first paper in which Bourne (1968)
adapted the TPA methodology to an Instron suggested the use in both compression cycles of
the areas corresponding to the downstroke for calculating cohesiveness. This modification has
since been adopted by most authors. Some authors subtracted the decompression area from
the compression area to give net work done in the two compression cycles (Drake, B., 1966;
Olkku, J. and Rha, C.K., 1975; Peleg, M., 1976) (Figure 2.3 II).
It is interesting to note that cohesiveness was originally found difficult to perceive and
evaluate as such by a sensory panel (Szczesniak, A.S. et al., 1963). This is probably because
this parameter does not correspond to a single sensation such as hardness, brittleness, etc., but
to a complex one.
Fracturability
Szczesniak (1963) originally named this parameter brittleness and defined it as “the force with
which the material fractures,” related to the primary parameters hardness and cohesiveness. In
51

brittle materials, cohesiveness is low whereas hardness can vary. This parameter was
measured in instrumental TPA as “the height of the first significant break in the first peak”
(Friedman, H.H. et al., 1963), which implies multipeak recording. Later, the term
“brittleness” was changed by Szczesniak (1975a) to “fracturability,” which is now accepted
almost universally. This parameter is principally obtained in turgid vegetable tissues, such as
fruits and vegetables, and also in low moisture farinaceous products (e.g., raw noodles, crisp
breads, toast).
Adhesiveness
Szczesniak (1963) defined this term as “the work necessary to overcome the attractive forces
between the surface of the food and the surface of other materials with which the food comes
in contact (e.g., tongue, teeth, palate, etc.), so, adhesiveness is related to surface properties.
Analyses of some results indicated that the presence of saliva during human mastication could
be a decisive factor, which obviously modifies the magnitudes of the mechanical parameter.
Bourne (1968) noted that adhesiveness could be considered as zero in pears, as in most fresh
fruits and vegetables, and in low moisture farinaceous products
Gumminess and Chewiness
Szczesniak (1963) stated that gumminess is “the energy required to disintegrate a semisolid
food product to a state ready for swallowing, and it is related to the primary parameters of
hardness and cohesiveness”. As can be seen, this secondary parameter only refers to semisolid
materials in which hardness is low. Szczesniak (1963) stated that chewiness is “the energy
required to masticate a solid food product to a state ready for swallowing, and it is related to
the primary parameters of hardness, cohesiveness, and elasticity”. In the TPA curve produced
by the GF Texturometer, this parameter was expressed mathematically as “the product of
hardness, cohesiveness and elasticity” (Friedman, H.H. et al., 1963). This research group at
General Foods also found a high level of correlation for this parameter between instrumental
and sensory evaluation.
Chewiness was judged sensorially as the length of time in seconds required to masticate a
sample, at the rate of one chew per second, in order to reduce it to a satisfactory consistency
for swallowing (Szczesniak, A.S. et al., 1963). In his key paper describing instrumental TPA,
Bourne (1978) failed to make clear that gumminess and chewiness are mutually exclusive and
should not both be reported for the same product.
52
Modulus of Deformability
Even though no modulus was defined by Szczesniak’s research team for TPA, in some of the
papers reviewed a parameter called “modulus” is measured, being defined as the initial slope
of the force-deformation curve before failure point in the first bite. This is a measure of how
the sample behaves when it is compressed to a small degree of deformation (Breene, W.M.,
1975). In food texture evaluation, instrumental methods such as TPA subject food samples to
large deformations (10-80%), so that the parameters obtained are not in conformity with well-
defined fundamental rheological parameters, such as the “modulus of elasticity” (also known
as Young’s modulus), a fundamental rheological parameter which is the ratio of stress to
strain within the elastic range of the material.
Since this fundamental parameter is concerned with the elastic range of the material,
Mohsenin and Mittal (l977) suggested that the term “modulus of deformability” should be
used instead of modulus of elasticity, avoiding the confusion of taking it as an indication of
the degree of elasticity of the food material. Thus, the modulus of deformability is actually an
indication of the rigidity or stiffness of the material, where total deformation at selected points
on the stress-strain curve is taken into account for its calculation.
Recent papers on TPA indicate that it is better to derive the true stress-strain data from the
force-deformation curve during the initial compression cycle to calculate this “modulus of
deformability” (Konstance, R.P., 1993; Tang, Q. et al., 1995), employing the following
equations:
True strain = εT = ln(h0/h0 - Δh)
and
True stress = σT = Ft/A0 * h0 - Δh/h0
where h0 = original height of the sample, Δh = change in height during compression (e.g.
deformation), Ft = compressive force at time t, and A0 = original cross-sectional area of the
sample.
The use of true strain (also called Hencky’s strain) for large deformations is appropriate for
most food applications, since the cross-sectional area is considerably expanded during
compression and therefore cannot even be approximated by the original area (Peleg, M.,
1987). True stress represents an adjustment of engineering stress (Ft/A0) to account for the
53

expansion of the deformed specimen cross-sectional area. The ratio of true stress to true strain
gives the “modulus of deformability” for compression, Ed = σT/εT. In this context, Tang et al.
(1995) studied the effects of pH on the properties of gels prepared with whey protein
concentrate by compression (TPA) in an Instron. They evaluated hardness, cohesiveness and
springiness from the double compression curves obtained, and also the parameter which the
authors called the “modulus of elasticity,” using the true compressive stress and strain at 10%
compression during the first compression cycle. They concluded that the obtained “modulus
of elasticity” correlated quite well with G’, the storage modulus obtained from oscillatory
shear testing with a Bohlin Rheometer. Reinforcing what was stated by Calzada and Peleg
(1978), the present paper emphasizes that true stress-strain curves will provide a better
indication of the true nature of the food’s mechanical properties than apparent curves (force-
deformation).
In this way it has been shown that different solid foods can have characteristic “rheological
fingerprints”, which are expressed in the form of the true stress-strain relationship. These
forms, although affected to a certain degree by the test conditions, are mainly determined by
the deformation mechanism of the food material. It will be an interesting topic for future
research to associate sensory parameters with these types of fundamental mechanical
properties (e.g. compressibility), as a result of which correct interpretation of the true stress-
strain relationships would become an essential step in food texture evaluation (Pons M. and
Fiszman, S.M., 1996).
54

Dough stickiness
The measurement of adhesiveness in foods is a matter that remains unresolved. This situation
is partly due to the fact that both the manifestation of this characteristic and its sensory
perception vary according to the food in question, with the consequence that there is no
universally accepted standard system for measuring stickiness within the food industry. In
some cases the adhesiveness of foods presents a problem; for example, in relation to a
disagreeable sensation in the mouth when they are consumed, or the equipment with which
they are handled, or the materials in which they are packaged. Remarkably few of the works
published study adhesiveness to packaging materials. In some foods, a certain degree of
adhesiveness is desirable and is what the consumer expects of them, depending on cultural
factors and different forms of presentation and consumption, for example, in products such as
cooked rice, pasta, certain cheeses, or sweets. Kilcast and Roberts (1998) published an
interesting paper in which they reviewed numerous questions, such as: (1) definitions of the
texture terms adhesiveness, stickiness, and tack, including information drawn from the field of
adhesives and international regulatory organizations, (2) how consumers perceive stickiness,
in terms of tactile as well as oral sensation, and (3) physical aspects of stickiness, including
surface energetics, sample rheology and failure mechanisms. Of the two most important
instrumental methods for measuring stickiness in foods, these authors found that probe tests
are used more frequently, while peel tests have not been widely used. Hoseney and Smewing
(1999) recognized that in most food systems, the adhesion force is a combination of an
adhesive force and a cohesive force. A food material is perceived as being sticky when the
adhesive force is high and the cohesive force is low. The authors emphasized that in order to
measure adhesive properties it is imperative to have a procedure that forces a clean separation
at the probe-material interface. Many authors measure adhesiveness in foods by applying
probe tests and calculating the negative area of a force-time curve, either in Texture Profile
Analysis (TPA) tests, with a double cycle, or in single-cycle trials. A certain concern about
differences in results when different experimental conditions are used in the application of
TPA was expressed by Walstra and Peleg (1991) in a paper on the texture of cheeses. The
authors declared that this method can detect the existence of textural differences between
samples, particularly when these differences are large; this, however, does not mean that the
magnitude of the observed differences is of any significance, or that identical or similar
readings are an indication that the corresponding samples have the same or similar texture.
55

With the increasing precision and versatility of modem instrumentation, TPA is a very useful
tool for determining instrumental texture parameters. Naturally, attention must be paid to
proper selection of testing and sampling conditions in order to obtain reliable data; a
knowledge of the philosophy of the method, its terminology, and how the parameters are
calculated permit good interpretation of results. It is clear that not all foods possess
adhesiveness, hence it is not worth measuring adhesiveness in all cases. The foods in which
this property is important and in which it has been studied most can be classified into four
main groups: bakery and cereal-derived products, cheese, gelled system, and meat protein
products (Fiszman S.M. and Damasio, M.H., 2000).
Before the problems associated with measuring stickiness can be discussed it is necessary to
first define what stickiness means. Stickiness is the force of adhesion that results when two
surfaces are contacted with each other. Given that simple definition the measurement of
stickiness would appear straight forward. Only the area of contact would have to be
controlled. Unfortunately, it is often not that simple. An example of one problem is the case
of two polished surfaces: there is no adhesion if the surfaces are dry but the force is large if
the surfaces are wet. To experience this phenomenon try to pull apart two microscope slides
after a drop of water has been added to the surfaces. The surface tension of the water is
responsible for the adhesive force. Thus, it appears obvious that factors that affect surface
tension of water will have a large effect on the stickiness of aqueous systems. It is also
obvious that if the test material is an aqueous system it is necessary to guard against drying of
the surface prior to or during the test for stickiness (Hoseney, R.C. and Smewing, JO., 1999).
Food stickiness is particularly important during food processing. The high speed mechanized
processing of food requires that the material does not stick to machine surfaces. A small
amount of adhesion can lead to major problems that can result in the line being stopped. The
second important item in food stickiness is in consumer acceptance of the product. Finger
foods that are sticky and that stick to the fingers are, in general, not acceptable. On the other
hand, some confectioneries, salad dressings, and barbecue sauces should be sticky or at least
possess cling or adhesion to surfaces. Some foods should be sticky or nonsticky depending
upon the culture of the intended consumer. An example of this is rice. Ideally in the Western
world rice is dry, fluffy, and nonsticky while in the Orient sticky rice is preferred. In the
United States 3 types of rice are grown; long, medium, and short grain. In general, the long
grain types give dry, flaky grains when cooked, while the short and medium grains tend to
give a sticky product. As with all cereal grains, rice undergoes an after-ripening phenomena
after it is harvested. As a result of this after-ripening, the stickiness of rice decreases with
56

storage time. Whether this is good or bad depends upon your preference in the stickiness of
rice. Mossman et al. (1983) developed an Instron test to measure the stickiness of cooked rice.
The test was sufficient to easily determine the difference between sticky and dry rice. The
stickiness of rice has been negatively correlated with amylose content of the rice starch
(Juliano, B.O. et al., 1981). Deshpande and Bhattacharya (1982) have shown that stickiness
was not affected by the water-to-rice ratio used in cooking but was markedly reduced by
storage of cooked rice. The General Foods Texturometer was used (Szczesniak, A.S. and
Hall, B.J., 1975) to detect adhesiveness in cooked rice. Okabe (1979) related this technique to
eating quality of rice in Japan. He concluded that hardness was most important but high
hardness was acceptable if stickiness was also high. In her classic work on Texture Profile
Analysis, Szczesniak (1963) used the term adhesiveness in relation to the stickiness of food.
The term was defined as “the work necessary to overcome the attractive forces between the
surface of the food and the surface of the other materials with which the food comes in
contact (e.g., tongue, teeth, palate, etc.)”. Food stickiness is also important in the mouth. In
fact, a definition of stickiness given by Jowitt (1974) is “possessing the textural property
manifested by a tendency to adhere to contacting surfaces, especially the palate, teeth, and
tongue during mastication”. The importance of stickiness in the mouth not only relates to
consumer acceptance where, for instance, excessive stickiness in e.g. cookie or caramel
products, may receive an extremely negative consumer response but also to adhering of food
to teeth. Consequently this textural property accounts for a great deal of work on dental
research.
Another undesirable example of stickiness is when the food sticks to the packaging material.
This results in distortion and disfigurement of the product and generally adverse consumer
reaction.
Instrumental Measurement of Food Stickiness
In the first of a series of papers Claassens (1958) studied the stickiness of butters. He coined
the term hesion (analogous to sorption) in preference to stickiness because he felt in
measuring stickiness the components of force due to adhesion and cohesion were inseparably
linked. He developed a balance type apparatus to measure the force with which butter adheres
to solid material. Claassens (1959a) using the balance developed above found that the hesion
force was dependent of the contact time, load and temperature of the butter and the material
contacting the butter. The highest forces were found with metals (stainless, steel, brass,
57

aluminum) and glass, with intermediate forces with plastics and the lowest with beech wood.
In related work, Claassens (1959b, c) developed a method to measure the apparent static
friction of butter. Using this procedure, he found a reasonable correlation (r = 0.76) between
hesion values and the apparent static friction. As pointed out above, the force required to
separate a probe from a surface depends on the material from which the probe is made. This
occurs because low-energy materials absorb strongly to high-energy surfaces. As a result the
surface energy of the system is decreased. In general, inorganic materials have high surface
energies while polymer materials have low surface energies. Thus, probes made from metal or
glass will give higher tack readings than similar probes made from plastics. The phenomena is
illustrated in the data given in Table 2.3.
Material Force(g)
Polytetrafloroethylene 180
Polyethlene 450
Nylon 650
Polystrene 850
Stainless Steel 1000
Table 2.3 Influence of probe composition on tack measurement (modified from Hammond,
JR, F.R., 1989).
The problem of dough stickiness was neatly summed up by the rheologist Scott Blair (1936)
over 60 years ago when he stated that “stickiness appears to be the property of dough to which
the baker’s hand is most sensitive”. Today, when dough is handled more by machine and less
by the baker’s hand the importance of sticky doughs is even greater (Hoseney, R.C. and
Smewing, JO., 1999). The dough with high adhesiveness can create serious problems in
modern mechanized factories by causing production stoppages, product losses or
contamination (Fiszman S.M. and Damasio, M.H., 2000).
Doughs made with wheat flour (for bread or biscuits), corn flour (for arepa or tortilla), or
legumes (for papad) are products for which the measurements of adhesiveness is of vital
importance, and there is an extensive literature on the subject (Table 2.4).
58

Reference Food system Method Paramters Measured Armero and Collar (1997) white and whole TA-XT2 named "apparent ahesiveness" flour bread dough TPA (as negative area).
Chen and Hoseney cell three stickness related parameters
Chen and Hoseney (1995a) bread dough TA-XT2
Chen and Hoseney cell three stickness related parameters
Dhaliwal et al. (1990) bread dough Digital Gram Gauge three parameters from the tensile curve
Single compression Dobraszczyk (1997) bread dough Instron stickiness (average peel force) Peel test
Haridas-Rao et al. (1989) whole wheat chapati dough GF texturometer adhesiveness ( negative area)
TPA
Heddleson et al. (1993) flour water dough Instron with Wetzel modified
Heddleson et al.(1994) probe probe tack and tack energy Single compression
Noguchi et al. (1976) bread dough GF texturometer stickiness measured as the change
TPA of slope of the negative area. Padua and Padua-Maroun (1984) arepas corn dough Instron Single compression adhesiveness ( negative area) Ram and Nigam (1983) bread dough GF texturometer TPA adhesiveness ( negative area) Ramirez-Wong et al. (1993) tortilla corn masa Stickiness Device Test adhesiveness ( special index) Special "cling"test: Instron maximum tensile force Single compression tensile work Ramirez-Wong et al (1994) tortilla corn masa Instron adhesiveness ( negative area) Single compression
Sai-Manohar biscuit dough Instron dough adhesion (negative area) and
and Haridas-Rao (1997) TPA stickiness (slope of negative area)
Sila-Battacharya blackgram papad GF texturometer stickiness measured as the change
and Narasimha (1997) TPA of slope of the negative curve Wang et al (1996) bread dough Lloyd with specially 24 texture parameters obtained designed cell Double many of which highly correlated cycle compression with sensorial stickiness scores Table 2.4. Determination of adhesiveness of dough methods, parameters and references
(modified from Fiszman S.M. and Damasio, M.H., 2000).
59

In about half the works consulted the term “stickiness” is used, while the remainder speak of
“adhesiveness.” In the bakery world the term “stickiness” recalls the negative property
associated with the stages of manipulation during manufacture rather than a sensory quality
characteristic perceived by the consumer in the final cooked product. There are works in
which the two terms are used as synonyms without distinction (Ramìrez-Wong, B. et al.,
1994) while some authors distinguish the terms as different concepts.
Noguchi et al. (1976) noted that doughs made by the continuous process tended to stick to the
handling machines much more than conventionally made doughs. They studied various flour
streams in an attempt to determine the cause of stickiness in doughs. A texturometer that
inserted a cylindrical plunger into dough and measured the forces of insertion and withdrawal
was used to evaluate stickiness. The slope of the force-displacement curve on withdrawal
correlated well with subjective estimates of dough stickiness. Their conclusions were that low
grade flours gave doughs that were more sticky than did higher grade flours. In addition, they
found that ash content, SH content, and proteolytic activity were most useful in predicting
stickiness. Of course, those three factors may be a reflection of lower grade flours. Many
other attempts to measure dough stickiness have been reported. Hoseney et al. (1990)
measured dough stickiness by compressing a dough ball using a flat probe and measuring the
force needed to pull away the probe. Nonsticky doughs separated cleanly from the probe,
whilst a sticky dough stuck to the probe and stretched into a long filament, usually breaking in
the center after a large amount of extension. Dhaliwal et al. (1988) measured stickiness by
bringing a flat probe into contact with a thin layer of dough spread over a perforated metal
plate under standardized conditions of compression force, contact time, and temperature, and
measuring the force required to remove the probe. They reported that the area under the
resulting force-distance curve produced the best indicator of stickiness. Strong correlations
between the viscoelastic properties of doughs measured in compression, relaxation, and
tension and sensory stickiness scores were reported by Wang et al. (1996). Studies have
linked a number of factors to enhanced dough stickiness. These include flour extraction
(Gore, P.J., 1991); amount of water soluble pentosans (Zeller, F.J. et al., 1982); differences in
protein composition (Dhaliwal, A.S. et al., 1988); α-amylase activity (Ranhotra, G.S. et al.,
1977; Ibrahim, Y. and D'Appolonia, B.L., 1979); and proteolytic activity (Hwang, P. and
Bushuk, W., 1973). However, those studies of factors affecting dough stickiness were all
hampered by lack of an objective test to measure stickiness. The baker's classic dough
stickiness test is to touch the dough with his or her hand. If the dough sticks to the hand, the
60

dough is sticky. Whether the dough sticks to the hand depends on both the adhesive and
cohesive properties of the dough. In this regard dough is no different than any other
viscoelastic material. Heddleson et al. (1993, 1994) studied wheat flour dough as a pressure
sensitive adhesive. They measured the relationship between the adhesive behavior of doughs
using a probe tack test and dynamic rheological properties. They found a maximum in loss
tangent corresponded with a maximum in tack energy, suggesting that tack is primarily
controlled by a rheological mechanism. There is a large volume of literature dealing with the
rheological properties of dough. It appears obvious that anything that affects dough rheology
could potentially affect dough stickiness. Given a constant adhesive force between the dough
and probe, anything that gives a weaker dough (more viscous and less elastic) will be
measured as a sticky dough. The dough will adhere to the probe and it will neck (Figure 2.3).
Figure 2.3 Necking of a dough piece (modified from Hoseney, R.C. and Smewing, JO., 1999).
The force measured is a function of the dough rheology and not truly related to the stickiness
of dough. All that can be concluded is that the adhesive force is greater than the cohesive
force. With the same adhesive force, if the dough is strengthened (made more elastic and less
viscous) at some point the cohesive force will exceed the adhesive force and the dough will
separate at the probe interface. Heddleson et al. (1994) showed the great effect of
temperature, separation rate, and moisture content on that adhesive-cohesive failure transition
point. To study dough stickiness it appears imperative to separate the adhesive and cohesive
properties. To measure the adhesive properties it is necessary that there is a clean separation
at the probe-dough interface. To accomplish this Chen and Hoseney (1995a) selected a probe
61

material with low surface energy (Plexiglas), and developed a cell to produce a flat dough
surface and maximize the dough strength. They used a texture analyzer (TA.XT2) and chose
the maximum reverse speed of the probe to minimize the measurement of viscous flow. This
leads to a clean separation at the probe-dough interface (Hoseney R.C. and Chen, W.Z.,
1994).
The cell is designed to extrude a thin layer of dough through a fine screen before compressing
it, and the prepared dough surface is then allowed to rest 30s to release the stress produced by
extrusion. Compression is effected with a 25 mm probe up to a compression force of 40g
applied at a constant velocity and then the probe is raised at a very high velocity in order to
encourage separation of the probe from the dough surface.
This cell is commercially available from Stable Micro Systems Ltd. (Godalming,
U.K.)/Texture Technologies (Scarsdale, NY) (Fiszman S.M. and Damasio, M.H., 2000).
Using this objective method to measure the adhesive properties they found that many things
can affect the results. These include the surface tension of the water solubles from flour,
added α-amylase or protease, amount of water added to the dough, and the degree to which
the dough is mixed. While these were shown to affect adhesive properties it is also true that
many of the same factors can, and do, affect the dough rheology (cohesive properties).
However, none of the above appeared to explain the difference between flours that gave
sticky and nonsticky doughs. In subsequent work Chen and Hoseney (1995b) used the above
procedure together with fractionation and reconstitution techniques to show that the entity that
caused the dough to be sticky (adhesive) was water soluble and of relatively small size. The
compound was identified as ferulic acid esterified to a hexose chain (Figure 2.4).
62

Figure 2.4 Proposed structure of the compound causing dough stickiness . The glucose
polymer is a 1-3,1-4 beta glucan with n=70 (modified from Hoseney, R.C. and Smewing, JO.,
1999).
Recently Huang and Hoseney (1998) have shown the hexose chain to be a (1-3,1-4) mixed
linkage β-glucan with a DP of about 70. It was also shown that saponification of the ester
bond destroyed the entities ability to cause a sticky dough (Hoseney, R.C. and Smewing, JO.,
1999).
63
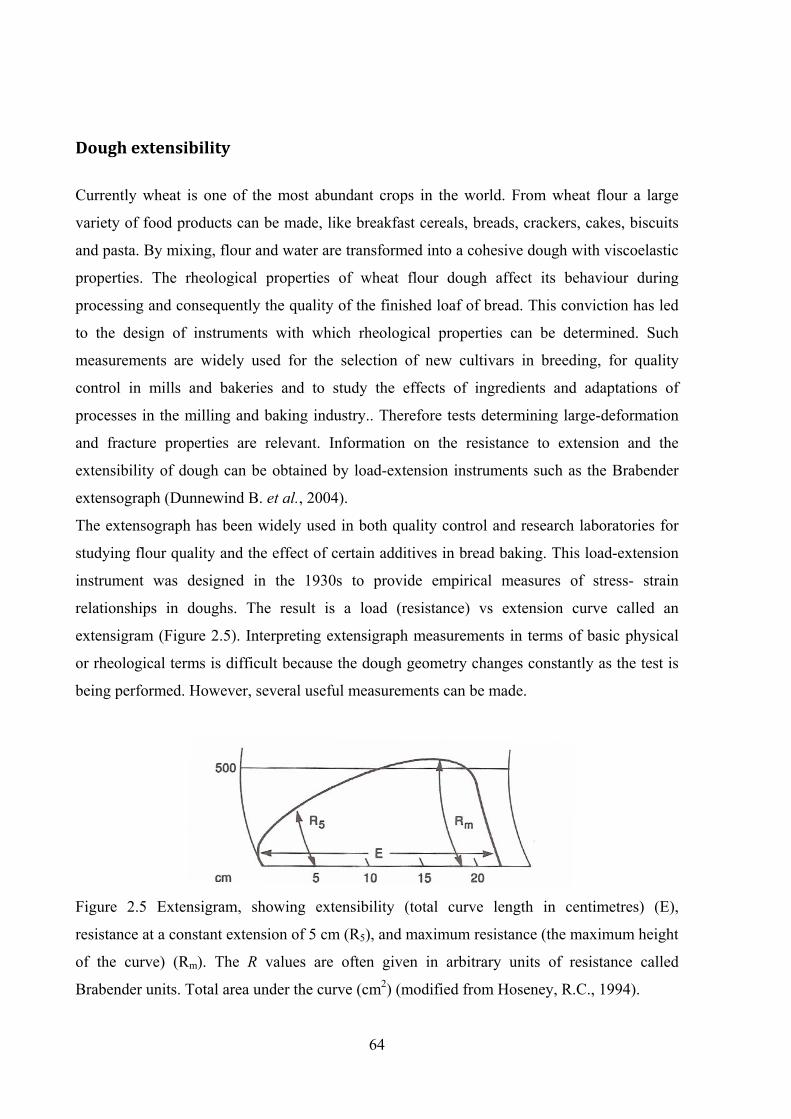
Dough extensibility
Currently wheat is one of the most abundant crops in the world. From wheat flour a large
variety of food products can be made, like breakfast cereals, breads, crackers, cakes, biscuits
and pasta. By mixing, flour and water are transformed into a cohesive dough with viscoelastic
properties. The rheological properties of wheat flour dough affect its behaviour during
processing and consequently the quality of the finished loaf of bread. This conviction has led
to the design of instruments with which rheological properties can be determined. Such
measurements are widely used for the selection of new cultivars in breeding, for quality
control in mills and bakeries and to study the effects of ingredients and adaptations of
processes in the milling and baking industry.. Therefore tests determining large-deformation
and fracture properties are relevant. Information on the resistance to extension and the
extensibility of dough can be obtained by load-extension instruments such as the Brabender
extensograph (Dunnewind B. et al., 2004).
The extensograph has been widely used in both quality control and research laboratories for
studying flour quality and the effect of certain additives in bread baking. This load-extension
instrument was designed in the 1930s to provide empirical measures of stress- strain
relationships in doughs. The result is a load (resistance) vs extension curve called an
extensigram (Figure 2.5). Interpreting extensigraph measurements in terms of basic physical
or rheological terms is difficult because the dough geometry changes constantly as the test is
being performed. However, several useful measurements can be made.
Figure 2.5 Extensigram, showing extensibility (total curve length in centimetres) (E),
resistance at a constant extension of 5 cm (R5), and maximum resistance (the maximum height
of the curve) (Rm). The R values are often given in arbitrary units of resistance called
Brabender units. Total area under the curve (cm2) (modified from Hoseney, R.C., 1994).
64
For most practical applications, the curve height and area under the curve are taken as
measures of the flour’s strength, with larger values indicating greater strength. The overall
shape of the curve, or the ratio of curve height (h) to extensibility (E), gives an estimation of
dough’s viscoelastic balance. Obviously, long, low curves produce low h/E ratios and a
predominance of viscosity over elasticity.
By using these simple relationships, extensigrams can classify flours according to their
strength: weak, medium, strong and very strong. The instrument is also quite useful in
studying anything that alters the strength of the dough. Examples of this are proteolytic
enzymes and various oxidizing or reducing agents (Hoseney, R.C., 1994).
Although Bloksma (1962) has related the data obtained by this test to more fundamental
parameters, the test still remains very empirical. The force and extension are not expressed in
Newtons and strain, respectively. Major practical disadvantages of this test are that the
position of the cradle (the clamp) depends on the force and that the amount of dough
deformed increases with extension (Bloksma, A.H. and Bushuk, W., 1988). The conversion of
extensograph load-extension curves into stress-strain curves is therefore seriously hampered.
Under fermentation conditions, the rate of deformation of dough is three orders of magnitude
smaller than the maximum rate of deformation of the test-piece in load-extension instruments
like the Brabender extensograph (Bloksma, A.H., 1990). Moreover, the dominant type of
deformation during fermentation and oven rise is biaxial extension and not uniaxial. Finally, a
large amount of flour (300g) is needed to perform the test.
An apparatus similar to the Brabender extensograph was developed by Kieffer: the “Kieffer
dough and gluten extensibility rig”, also called a microextensograph (Kieffer, R. et al., 1981a,
b). This rig has been developed by Stable Micro Systems (SMS) for use exclusively with the
TA.XT2 texture analyser. Based on research at the German Food Chemistry Research
Institute (Deutsche Forschungsanstalt fur Lebensmittelchemie, Garching) and named after its
inventor dr. Rolf Kieffer, offers a simple, efficient and cost-effective alternative to traditional
dough and gluten extensibility measurement techniques. It can produce accurate and
reproducible results from very small samples, as little as 10g flour or 1-2g gluten respectively.
Such micro methods are of great benefit to manageability, cost and time savings and are of
particular value to wheat breeders, in determining the processing qualities of new wheat
strains at an early stage, when only limited grain quantities may be available.
Using the SMS/Kieffer rig it is possible to compare gluten and dough extensibility
scientifically for the first time. Previously the common method of measuring the extension
65

behaviour of gluten was to extent the gluten between the fingers. Using the SMS/Kieffer rig,
the direct comparison is the objective and accurate and provides results in a graphical format.
The parallel dough and gluten tests can hence be useful for selecting suitable dough additives,
such as salts, emulsifiers, oxidants or enzymes, according to different wheat qualities to
control optimum dough processing (Dunnewind, B. et al., 2004).
In this apparatus a test can be performed with only about 0.4 g of dough and the apparatus can
be fitted on any materials testing machine, which gives us the possibility to measure the force
in Newtons, to adjust the test speed and temperature and to store the data in computer files for
further calculations. Recently, Grausgruber (2002) comparing both instruments, concluded
that the micro-extensograph method is valuable in early generation selection for wheat
quality where the amount of available sample does not allow testing by the standard
extensograph. The test method itself, however, has not been described extensively and
formulas to calculate the stress and relative deformation rate are not given. Also only very
little has been reported about the reproducibility of the test. Hence, to test this uniaxial
extension instrument the rheological properties of a weak and a strong dough were evaluated
with special attention to the correct determination of the type of deformation, the starting
point of the actual extension and the reproducibility of the test (Dunnewind B. et al., 2004).
66
2.1.2 Fundamental rheological tests
Fundamental rheological tests measure well-defined physical properties independent of size,
shape and how they are measured and can be used for process design calculations and to
model complex processing situations not amenable to direct measurement. Problems
encountered with such fundamental tests are: complex instrumentation which is expensive,
time consuming, difficult to maintain in an industrial environment and requires high levels of
technical skill; often inappropriate deformation conditions, difficulty in interpretation of
results and slip and edge effects during testing.
The main types of fundamental rheological tests used in cereal testing are: (i) dynamic
oscillation, (ii) creep and stress relaxation, (iii) extensional measurements and (iv) flow
viscometry (Dobraszczyk, B.J., 2003).
Dynamic oscillation measurements
Adapted from techniques developed for measuring viscoelastic properties of polymer melts
and concentrated solutions (Ferry, J.D., 1980), this is one of the most popular and widely used
fundamental rheological techniques for measuring cereal doughs and batters. It has the
advantage of a well-developed theoretical background, readily available instrumentation and
simultaneous measurement of elastic and viscous moduli, while the non-destructive nature of
the test enables multiple measurements to be performed as temperature, strain or frequency
are varied (Dobraszczyk, B.J., 2003).
In these measurements, a sample is placed between two parallel plates or between a plate and
a cone of very small angle and is subjected to sinusoidal displacement. The force generated by
the motion of one plate is transmitted through the sample to the other plate and recorded. If
the material between the plates is perfectly elastic material, Hook’s law governs the stress-
strain relationship and consequently stress and strain wave functions will have a 0° lag (in
phase). Conversely, if the material is a viscous liquid, Newton’s law applies, and the lag
between stress and strain waves will be 90°C (out of phase). A viscoelastic material will have
a lag angle, δ, between 0° and 90° (Masi., P. et al., 2001).
Disadvantages of the dynamic oscillation method are that the deformation conditions are often
inappropriate to practical processing situations, because they are carried out at rates and
67

conditions very different from those experienced by the dough during processing or baking
expansion. For example, rates of expansion during proof and oven rise in bread doughs have
been calculated between 5x10⁻³ s-1 to 5x10⁻⁴ s-1, compared with measuring rates in
rheological tests several orders of magnitude greater (Dobraszczyk, B.J., 2003).
Dynamic testing instruments may be divided into two general categories: controlled rate
instruments where the deformation (strain) is fixed and stress is measured, and controlled
stress instruments where the stress amplitude is fixed and the deformation is measured. Both
produce similar results (Steffe, J,F., 1996).
Stress is defined as a force acting over a unit area, often in the units called Pascals (N/m2). It
is usually referred to by the symbol σ . When sufficient force is applied to the dough, the
dough deforms and the deformation produces a strain in the dough. Here the strain is the
amount of deformation divided by the height or thickness of the dough. Strain is usually
referred to by the symbol γ and is measured as a percentage. For example, if the deformation
is 1% of the thickness of the dough, the dough is under a 1% strain.
The top plate, which is in contact with the sample (it must not slip), is caused to oscillate
sinusoidally at some frequency (ω, in radians per second) and with an amplitude (d) measured
in millimetres. The bottom plate remains stationary and is attached to a force transducer, if not
slippage occurs at either plate, a deformation gradient is created across the thickness of the
sample (h). The force transducer thus measure the force (f) transmitted through the sample in
Newtons. The force is distributed over the sample area (l*w) and is uniform over the sample
thickness. The output of such a dynamic rheometer is given in Figure 2.6. A deviation from
sinusoidal behaviour would indicate the slippage occouring.
Figure 2.6 Sinusoidal signal output from the force and deformation transducers. τ0 = shear
stress amplitude; γ0 = shear strain amplitude, Φ = phase angle, ωt = radians/sec (modified
from Hoseney, R.C., 1994).
68

The τ curve is output of the force transducer and represents the shear stress. The γ curve is
from the moveable plate and is a measure of the amplitude or the shear strain. If the sample
were completely elastic, the two curve would peak together, and if the sample were
completely viscous, the two curves would be out of phase by 90°. The phase angle phi (Φ) in
radians, gives a measure of how much the system is out of phase. The complex modulus (G*)
is equal to τ0/γ0.As the name implies, the complex modulus is made up of the storage modulus
(G’) and the loss modulus (G’’). The storage modulus and the loss modulus are given by the
following equations:
G’ = (τ0/γ0) x cos Φ
G’’ = (τ0/γ0) x sin Φ
In lay terms, G’ is the part of the energy that is stored during a cycle, and G’’ is the part that is
lost. Another term that is often used is tanδ or tan Φ, which is the ratio G’’/G’. This is a
simple index of the relative elastic or viscous nature of the material under test (Hoseney, R.C.,
1994).
Typical Operating Modes of an Oscillatory Testing instrument.
Commercialy available oscillatory instruments will operate in numerous modes. A strain or
stress sweep, conducted by varying the amplitude of the input signal at a constant frequency
(Figure 2.7) , is used to determine the limits of linear viscoelastic behaviour by identifying a
critical value of the sweep parameter.
γ
t
Figure 2.7 Strain or stress sweep mode in oscillatory testing.
69

In the linear region, rheological properties are not strain and stress dependent. Storage and
loss moduli versus the sweep parameter are plotted in Figure 2.8. Some experimenters prefer
to plot combined material functions such as the complex modulus or the complex viscosity.
Figure 2.8 Typical response to a strain or stress sweep showing the linear viscoelastic region
defined by the critical value of the sweep parameter (modified from Steffe, J.F., 1996).
Stress and strain sweeps are conducted on controlled rate and controlled stress instruments,
respectively. It has been suggested that stress sweeps produce superior results (Holland, D.,
1994); however, both strain and stress sweeps are known to provide an excellent basis for
comparing the viscoelastic nature food products. In addition to establishing the linear
viscoelastic range of the sweep parameter, strain and stress sweeps have been used to
differentiate weak and strong gels: strong gels may remain in the linear viscoelatsic region
over greater strains than weak gels.
70

The frequency sweep is probably the most common mode of oscillatory testing because it
shows how the viscous and elastic behaviour of the material changes with the rate of
application of strain and stress. In this test the frequency is increased while the amplitude of
the input signal (stress or strain) is held constant (Figure 2.9).
γ
t
Figure 2.9 Frequency sweep mode in oscillatory testing.
Frequency sweeps are very useful in comparing, sometimes called “finger printing”, different
food products or in comparing the effects of various ingredients and processing treatments on
viscoelasticity. Materials usually exhibit more solid like characteristics at higher frequencies
(Steffe, J.F., 1996).
71

3. MATERIALS AND METHODS
3.1 Formulation and samples preparation
3.1.1 Frozen dough without yeast
The materials used for this experimentation were commercial strong bread-making (sample
A) and weak biscuit-making (sample B) wheat flours, supplied by Molino Naldoni (RA-Italy).
Flour analysis (moisture 44-19, ash 08-01, proteins 46-10, gluten content 38-12, Zeleny index
56-61A and Falling Number 56-81B), Alveograph 45-30A and Farinograph 45-21
characteristics were determined by using AACC (1995) methods. The physicochemical
characteristics of the used flours are reported in Table 3.1.
Flour A Flour B
Proteina (%) 14.50 ± 0.14 13.31 ±0.21
Gluten (%) 13.40± 0.13 10±0.09
Asha (%) 0.60 ±0.03 0.57± 0.09
Moisture (%) 15.50± 0.21 14.50± 0.13
Falling Number(s) > 300 > 300
Zeleny (cc)b 64± 1.14 44±1.22
Water absorption (%) 59.20± 0.13 52.8± 0.11
W (x 10-4 J) 345± 11 119± 13
P/L 0.40 ±0.12 0.26± 0.14
a Corrected to 14% moisture content
b Values expressed and derived from 5g flour.
Values represent mean of three replicates±standard deviation
Table 3.1 Flour analytical properties (modified from Angioloni, A. et al., 2008).
Optimal water absorptions obtained by using Farinograph of 59.20 and 52.80 (based on 14%
moisture in the flour) were used to prepare A and B samples, respectively. Mixing was carried
out by using a spiral mixer (Kenwood Major, Hampshire – UK) for 10 and 5 min for samples
A and B, respectively. As soon as doughs were formed, they were separated in samples of 50
g and than placed in plastic pots where they rested for 30 min at room temperature. After this
72

step the samples were frozen at -18 °C for 60 days. A thermocouple, GG-30-KK (Tersid,
Milano, Italy) and a digital multimeter (Keithley, Cleveland, OH) were used to measure the
temperature changes during freezing at the centre of the sample (Figure 3.1).
-20,0
-15,0
-10,0
-5,0
0,0
5,0
10,0
15,0
20,0
0 20 40 60 80 100 120 140 160
Time (min)
Tem
pera
ture
(°C
)
Figure 3.1 Evolution of dough temperature during freezing (modified from Angioloni, A. et
al., 2008).
After 15, 30, 45, 60 days of storage and before rheological analysis, thawing was carried out
at room temperature for 90 min. Dough viscoelastic properties of fresh and freeze-thaw
samples were evaluated by using empirical and fundamental rheological measurements
(Figure 3.2).
73

Sample A (mixing time 10’) Sample B (mixing time 5’)
Sample of 50g rested at room temperature for 30min
Fresh sample
Rheological measurements
Samples thawed at room temperature for 90min
After 15, 30, 45 and 60 days of storage
Samples frozen at -18°C
Figure 3.2 Process flow diagram for the production of dough samples.
74

3.1.2 Frozen dough and bread made with frozen dough
Bread dough recipe included flour (moisture 14,5%; alveograph characteristics: W=394,
P/L=0.67; G=25.57), mineral water, salt, bakery yeast, malt and a technological additive
“Fine Frozen” supplied by Pan Tecnology (Table 3.2).
Flour (g) Water (%) Bakery Yeast (%) Technological
additive (%) Salt (%) Malt (%)
Sponge 1000 45 1
Dough 1000* 70 2.77 2.5 2 1
*Total flour = sponge’s flour + dough’s flour. Table 3.2 Formulation of experimental doughs.
The sponge was prepared the day before by using a spiral mixer at the first speed for 7 min.
The final dough was obtained by using a mixer at the first speed for 3 min and at the second
speed for 18 min.
After a rest of 30 min at 30°C and relative humidity of 75% , portion of dough (250g) were
put in wicker basket and allow to ferment for 30 min at 30°C and 80% relative humidity. The
use of these rigid boxes during the fermentation allows to obtain a more regular sample’s
shape.
After the fermentation period two samples were baked for 28 min at 235°C without being
subjected to any frozen treatment and analysed after 1 hour of cooling at room temperature
(fresh sample).
Some samples were frozen at -20C° for 6 hour (Figure 3.3) and some were deep-frozen for 3
hour.
75

Figure 3.3 Samples inside the freezer.
After this period the samples were removed and were put into a paper bag and stored at -
18/20°C for 1, 7 and 14 days.
A thermocouple, Testo 445 (Vac measuring instrument, Milano, Italy) were used to measure
the temperature changes every 5 min at the centre of the sample during freezing and deep-
freezing (Figure 3.4).
Figure 3.4 Evolution of dough temperature during freezing and deep-freezing.
76

As we can see from the Figure 3.4 the two different method allow the doughs to reach the
temperature of -12.5°C at the centre of the sample (the optimal temperature at which there is a
stabilisation of the dough, according to the information of the company that supplied the
technological additive). In order to reach the optimal temperature at the centre of the samples,
230 min were necessary when freezing process was adopted, while when deep-freezing
process was chosen 100 min were enough.
Besides we can see that during the freezing process there was a longer period of time (65 min)
where the temperature remain at around 4.5°C than in the deep-freezing process (20 min).
After the storage period (1, 7 or 14 days), thawing were carried out at room temperature for
two hours before carrying out dough analysis.
The analysis were performed on thawed dough samples and on the final products obtained
after the baking process at 235°C for 28 min.
77
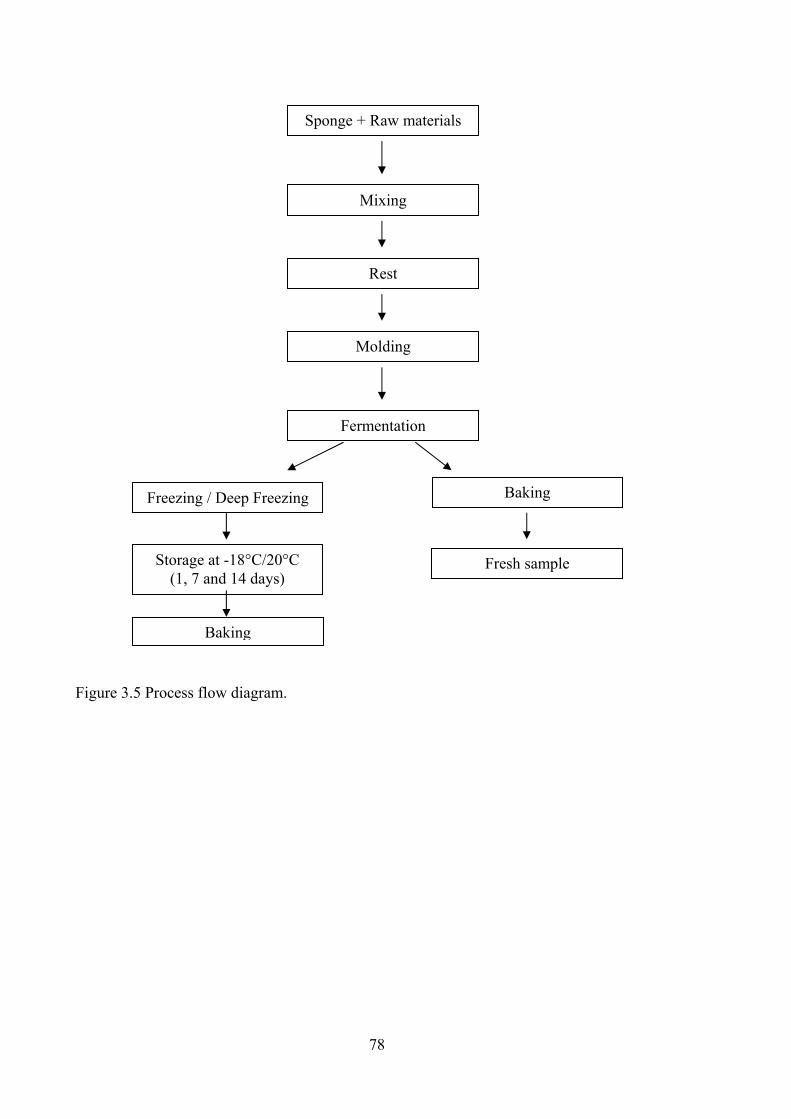
Sponge + Raw materials
Mixing
Baking
Fermentation
Rest
Molding
Fresh sample
Freezing / Deep Freezing
Storage at -18°C/20°C (1, 7 and 14 days)
Baking
Figure 3.5 Process flow diagram.
78

3.1.3 Doughs obtained by using different fermentation methods
Doughs were realized by using three different fermentation methods:
- Straight-dough system;
- Sponge and dough procedure;
- Poolish and dough method.
Flour
(g)
Water
(%)
Bakery yeast
(%)
Salt
(%)
Sourdough
(g)
Sponge
(%)
Poolish
(g)
Straight-dough system 2000 60 2.5 1
Sponge and dough
Sponge 1000 50 1
Dough 2000 60 1 1 20
Poolish and dough
Poolish 500 660g 500
Dough 2000 60 2 1 525
Ingredients added in % on flour basis
Table 3.3 Formulation of experimental doughs.
The physicochemical characteristics of the flours used to realize the doughs were:
Moisture (%) : 14.5; Ash (%): 0.53; Falling Number (s) : 298; Alveograph characteristics :
W(x10-4 J): 183, P : 73, P/L : 0.6.
The physicochemical characteristics of the flours used for the sponge and the sourdough were:
Moisture (%) : 14.3; Ash (%) : 0.50; Falling Number (s) : 295; Alveograph characteristics :
W(x10-4 J) : 20, P : 78, P/L : 0.56.
In the straight-dough system all the formula ingredients are mixed into a developed dough
that is then allowed to ferment.
All the ingredients were mixed in a spiral mixer (Sigma, Brescia, Italy) for 11 min and after
10 min of rest at 25°C the samples were moulded and then allowed to ferment for 1 hour at
30°C.
79

In the sponge and dough procedure, part of the flour, part of the water and the yeast were
mixed for 4 min just enough to form a loose dough (sponge). The sponge was allowed to
ferment 24 hour at 18°C. Then it was combined with the rest of the formula ingredients and
mixed into a developed dough. After being mixed, an intermediate proof (referred to a “floor
time”) of 10 min at 25°C was given to the dough so that it could relax. Then it was divided,
moulded, and proofed for 1 hour at 30°C.
In the fermentation method called poolish and dough method a pre-ferment with sourdough,
water and flour was realized (Figure 3.6).
80

a b
dc
e f
Figure 3.6 Poolish’s preparation flow diagram.
a: sourdough; b: slice’s sourdough; c and d: slices’ s sourdough in a bowl with water and flour; e:
poolish was prepared by mixing the flour, water and yeast together until the mixture had the
consistency of a smooth, thick batter; f: final poolish before fermentation.
81
The poolish was allowed to ferment 4 hours at 24°C. Then it was combined with the rest of
the formula ingredients and mixed into a developed dough. After being mixed, the dough was
given an intermediate proof (referred to a “floor time”) of 10 min at 25°C so that it could
relax, and then it was divided, moulded, and proofed for 1 hour at 30°C.
The rheological measurements were carried out on the doughs immediately after mixing (after
10 min of rest), and after 1 hour of fermentation; image analysis was performed also after 30
min of fermentation.
The different types of dough were realised in triplicate.
82

3.1.4 Doughs made by Kamut® flour
Kamut® flour was characterised by moisture of 14.60%, ash 1.20%, protein contents 13% on
dry matter, gluten 14.87%, W(x10-4 J) 138 and P/L 1.78. The ingredients used in this study to
prepare the different dough formulations were: mineral water, salt, bakery yeast, extra-virgin
olive oil and a liposomic lecithin emulsifier (Lipos B 20 Activ ; TNA, Cava Manara, Italy).
In order to study rheological properties three different doughs were prepared: dough CTR was
the control dough, while formulation OIL and EMU contained emulsifier (30g, corresponding
to 2% on flour basis) and extra-virgin olive oil (54g corresponding to 3.6% on flour basis)
respectively (Table 3.4).
Dough Flour Water Extra-Virgin
Emulsifier (Liposomic lecithin) Salt Bakery yeast
(g) (ml) Olive Oil (g) (g) (g)
(g)
CTR 1500 825 — — 37.5 3
EMU 1500 825 — 30 37.5 3
OIL 1500 825 54 — 37.5 3
Table 3.4 Formulation of experimental doughs.
After oxygenating the flour for 1 min at speed “min” using a mixer mod. Major mixer
(Kenwood, Treviso, Italy) all the ingredients were mixed with the same mixer at the first
speed for 6 min. Water was added at the temperature of 4°C to initially inhibit yeast activity.
Different types of dough were realised in triplicate.
Each dough was submitted to:
1) a standard fermentation process of 4 hours at 25°C;
2) a storage period of 24 and 48 hours at 4°C.
Rheological analyses were carried out immediately after mixing (T0), at the end of
fermentation process time (L4) and after 24 and 48 hours of storage at 4°C (S24 and S48
respectively), after 2 hours of resting at room temperature (Figure 3.7).
83

48 h at 4°C
(S48)
24 h at 4°C
(S24)
STORAGE
LEAVENING 4h at 25°C
(L4)
IMMEDIATELY AFTER MIXING
(L0; S0)
Dough CTR Dough EMU Dough OIL
Figure 3.7 Process flow diagram.
84

3.1.5 Dough and bread with ginger powder
Basic dough formula consisted of fermented sponge, flour, water, salt, bakery yeast, additive
and ginger powder. A control dough, without ginger powder, and samples with different
amount of ginger powder were realized: 3%, 4.5% and 6% on flour basis.
Sponge (sponge dough process) was prepared by mixing flour, water and bakery yeast in a
mixer for 8 min and was left to ferment 24 hour at 13°C before addition into bread doughs
(Table 3.5).
Sponge* Flour
(W 190) Water Bakery yeast Salt Additive
Ginger powder
(g) (g) (g) (g) (g) (g) (g) Control 1136 773 510 39 37 5
3% of ginger powder 1136 726,62 510 39 37 5 46,38
4.5% of ginger powder 1136 703,43 510 39 37 5 69,57
6% of ginger powder 1136 680,24 510 39 37 5 92,76
*Sponge: Flour (W=240) 2000g; Water 910g; Bakery yeast 20g.
Table 3.5 Formulation of experimental doughs.
Mixing was carried out by using a Kenwood Major mixer (Kenwood, Treviso, Italy) for 11
min and the analysis were carried out, in triple, on the doughs after 10 min of rest.
After 20 min of rest at room temperature the samples were shaped (Figure 3.8).
Figure 3.8: Shaping of dough.
85

The samples were then allowed to ferment for 1 hour at a temperature of 32°C and relative
humidity of about 70%. Fermented dough were then baked at 210°C for 23 min (Figure 3.9).
After baking, bread samples were allowed to cool down for about 2 hour at room temperature
before the analyses.
ControlControl
3% 3%
4.5% 4.5%
6% 6%
Figure 3.9 Samples of bread made with different amount of ginger powder.
86

3.1.6 Final products coming from different bakeries
Different samples of different regional bread coming from different bakeries were analysed
and compared.
The samples were:
a. “Coppia Ferrarese”, a typical regional bread of Ferrara;
b. “Pane Comune Romagnolo”, a typical regional bread of Cesena area and
c. “Filone Terra di San Marino”, a typical regional bread of San Marino.
9 different samples of “Coppia Ferrarese” were analysed about 2 hours after baking (fresh
sample) and after 1 day of storage at room temperature (Figure 3.10).
Figure 3.10 Samples of “Coppia Ferrarese”.
87

11 different samples of “Pane Comune Romagnolo” were analysed at the same sampling time
of Coppia Ferrarese (the fresh sample and the sample after 1 day of storage at room
temperature) (Figure 3.11).
Figure 3.11 Samples of “Pane Comune Romagnolo”.
88

3 different samples of “Filone Terra di San Marino” were analysed. Analyses were performed
on the fresh sample (2hours after the baking) and the samples after 1, 2, 3, 4 days of storage at
room temperature to evaluate the effects of the stailing process (Figure 3.12).
Figure 3.12 Samples of “Filone Terra di San Marino”.
89

3.2 Analyses
3.2.1 Dough and bread Texture Profile Analysis (TPA)
TPA is based on the recognition of texture as a multi-parameter attribute. The test consists of
compressing a bite-size piece of food two times in a reciprocating motion that imitates the
action of the jaw and extracting from the resulting force-time curve a number of textural
parameters.
Texture measurements can be very valuable for the quality control and process optimization
as well as for the development of new products with desirable properties and characteristics.
Especially crumb firmness is a common quality characteristics for bakery products since it is
strongly correlated with consumer’s perception of bread freshness.
This test was applied on dough and on final products prepared by using different procedures.
The TPA setting changed in function of the different samples analysed.
Doughs:
a. Frozen;
b. Frozen, with yeast;
c. 100% based on Kamut® flour .
Final products (bread):
a. Obtained by using frozen dough;
b. Coming from different bakeries:
I. “Coppia Ferrarese”;
II. “Pane Comune Romagnolo”;
III. “Filone Terra di San Marino”.
c. Obtained with different amount of ginger powder;
90

TPA on dough
a. TPA was carried out on fresh dough and on frozen samples after a thawing process
of 90 min at room temperature.
b. After the storage period of 1, 7 and 14 days at -18/-20°C 6 slices of 2 cm thickness
for each samples were thawed for two hours at room temperature before carrying
out the TPA test (Figure 3.13).
Figure 3.13 Sample for TPA test.
c. The TPA test was carried out on sample during different times of control (see Figure
3.7).
91

The TPA test on dough was conducted on about 100g sample with a Texture Analyser
mod.TA.HDi 500 (Stable Micro Systems, Surrey, UK) by using a 50mm diameter aluminium
cylinder probe (a and c) and a 20mm diameter aluminium cylinder probe (b) and with the
following setting:
Pre-test Speed 10,00 mm/s;
Test Speed 0,50 mm/s;
Post-test Speed 10,00 mm/s;
Strain 60,0%;
Time 75 s;
Load Cell 50 Kg;
Trigger Force auto-50 g
as described previously (Armero, E. and Collar, C., 1997).
TPA parameters varied widely with the strain and some of them also dependend on the period
which elapsed between the two compressions.
Springiness increased with an increasing period between compressions until 75s, at which
time the dough had completely recovered from the first compression. An extended period
between compressions would also lead to increments in dough volume due to the
fermentation process.
The shape of first peak was clearly asymmetrical, with low resilience values, corresponding to
a plastic flowable material. Springiness indicates the percentage recovery and resilience
shows the speed of the recovery. Resilience was only dependent upon strain. At higher
strains, doughs showed the same elasticity rate (springiness) but at a lower speed (resilience).
Cohesiveness was only dependent upon strain; the higher the strain the lower the
cohesiveness. As the strain was increased the structural elements of the dough were
permanently broken. Specific TPA parameters are only meaningful when measured at certain
intervals of deformation. When measuring cohesiveness, it is important that the sample is
only partially deformed.
As a first point, adhesiveness increased rapidly as the strain increased.
Secondly, when strain was increased, the dough required more time to recover its shape and a
negative force was measured by the probe for a longer period.
Gumminess and chewiness are secondary parameters.
Comparisons with hardness showed that gumminess and chewiness dependend mostly on
hardness rather than on cohesiveness or springiness.
92
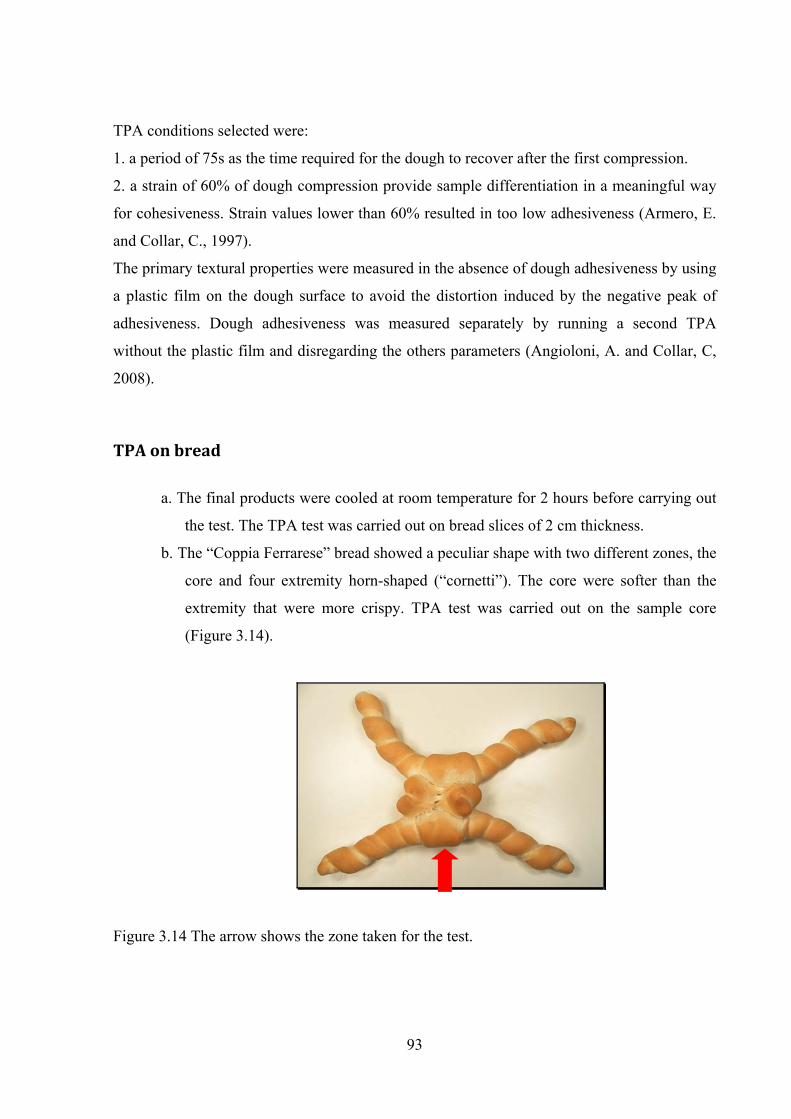
TPA conditions selected were:
1. a period of 75s as the time required for the dough to recover after the first compression.
2. a strain of 60% of dough compression provide sample differentiation in a meaningful way
for cohesiveness. Strain values lower than 60% resulted in too low adhesiveness (Armero, E.
and Collar, C., 1997).
The primary textural properties were measured in the absence of dough adhesiveness by using
a plastic film on the dough surface to avoid the distortion induced by the negative peak of
adhesiveness. Dough adhesiveness was measured separately by running a second TPA
without the plastic film and disregarding the others parameters (Angioloni, A. and Collar, C,
2008).
TPA on bread
a. The final products were cooled at room temperature for 2 hours before carrying out
the test. The TPA test was carried out on bread slices of 2 cm thickness.
b. The “Coppia Ferrarese” bread showed a peculiar shape with two different zones, the
core and four extremity horn-shaped (“cornetti”). The core were softer than the
extremity that were more crispy. TPA test was carried out on the sample core
(Figure 3.14).
Figure 3.14 The arrow shows the zone taken for the test.
93

From “Pane Comune Romagnolo” and “Filone Terra di San Marino” bread slices of 2cm
thickness were taken and the test was carried out on the centre of the slices (Figure 3.15).
Area for the TPA
test
Figure 3.15 Slice of “Pane Comune Romagnolo”.
c. From each final product were taken 4 slices of 2 cm thickness and from the centre
of the slices were taken sample of 2x2cm (Figure 3.16).
Figure 3.16 Operations to prepare the sample to analyse.
94
When the probe is larger than the sample (c), the forces registered are largely due to uniaxial
compression. However, when the opposite is true (a and b), the forces derive largely from
puncture, a combination of compression and shear.
It is interesting to note that in the first paper on TPA, Friedman (1963) reported that “all
samples are made up with an area at least that of the plunger base,” so that their tests
combined compression and shear forces. Bourne (1968) was the first to adopt true uniaxial
compression to perform TPA with an Instron. This experimental condition was subsequently
used by other authors working with the same instrument.
Generally speaking, most recent work done on TPA normally uses compression devices larger
than the sample size, so that the forces registered in TPA tests are largely due to uniaxial
compression forces.
For this reason in the last work (c) was chosen a sample smaller than the probe.
After placing the samples on the instrument base, they were squeezed twice with an
aluminium cylinder-shaped probe with a diameter of 20mm (a and b I.(“Coppia Ferrarese”))
and 50 mm (b II. and III.(“Pane Comune Romagnolo” and “Filone Terra di San Marino”) and
c).
The test was conducted on samples a and b (I, II and III) with the following setting:
Mode TPA;
Pre-test Speed 10.0 mm/s;
Test Speed 0.5 mm/s;
Post-test Speed 10.0 mm/s;
Strain 50,0%;
Time 30 s;
Load Cell 50 Kg;
Trigger Force auto-10 g.
95

For the last experiment (c) the setting was changed according to Gàmbaro A. et al ( 2002):
Mode TPA;
Pre-test Speed 2.0 mm/s;
Test Speed 3.0 mm/s;
Post-test Speed 3.0 mm/s;
Strain 40,0%;
Time 5 s;
Load Cell 50 Kg;
Trigger Force auto-10 g.
96

3.2.2 Dough uniaxial extensibility (Kieffer method) Dough Relaxation
After kneading, the dough (15-20g) was removed thoroughly from the equipment and rolled
gently into a ball. This was placed in a small plastic pot and placed in a container or other
place, in which there was as constant relative humidity as possible, to relax for about 20 min.
The dough form was taken and brush both the grooved base and the top form with paraffin
oil, to avoid sample adhesion. If the dough to be tested appears to be very soft it may be
necessary to place lametta strips along the length of the grooved regions, to aid removal of the
samples after relaxation.
The sample was then rolled into a dough ball and then into sausage shape, both with as little
manual manipulation as possible and then the sausage shaped sample was placed on the
grooved base with its length perpendicular to the groove direction and finally the top form
was placed over the bottom form from above.
It is very important to place the dough in this same direction on the form for comparative
results.
The top form was pressed down until the two forms contact each other and excess dough was
removed, which has extruded from the sides, with a spatula. This form cuts the sample into
strips and allows the dough to relax, whilst preventing loss of moisture.
This form was placed in the clamp and screw down. Any excess dough which may have
extruded further on clamping should be removed either with a spatula to ensure that each
sample is separated. Any contact dough strips will be damaged by separation of the sample
after they have undergone relaxation.
The dough clamp (with forms) was placed into a container, or other place, in which there is
as constant a relative humidity and temperature as possible (optimally at around 24°C), and,
following the official method, the dough has to relax for 40 min.
Different resting times were chosen for the samples containing yeast compared to the samples
without yeast. It’ s not advantageous to leave dough with yeast to rest for 40 min (according
to the official method) because the fermentation goes ahead and during this phenomenon the
rheological properties of the dough change and it would be difficult to manage the sample and
carry out the analysis and the results wouldn’t be consistent.
97

Dough sample loading
After the relaxation time the tension in the clamp is released and the dough form slid out
slightly. The top form should be slid backwards gently over the grooved base, revealing each
dough strip one at time, when required.
Before removing each strip the edges was cleared and separated from other neighbouring
samples by running the spatula end down the length of each strip’s side. The spatula end was
then dipped in paraffin oil and carefully run under the length of a sample, pushing against the
groove bottom, for accurate removal (taking care not to penetrate, stretch or deform the dough
sample). The strip was placed across the grooved region of the same plate and the lametta
strip removed gently.
Before testing one should ensure that the hook probe is lowered to just above the upper
surface of the spring loaded clamp. Holding down the spring-loaded clamp lever, insert the
plate (with sample in position) into the rig. Once the handle is released slowly the tensile test
can begin.
Once trigger force of 5g has been attained, the hook will proceed to extend the dough sample
centrally until its elastic limit (at the peak force) is exceeded and the dough separates (Figure
3.17).
Figure 3.17 Kieffer rig.
98
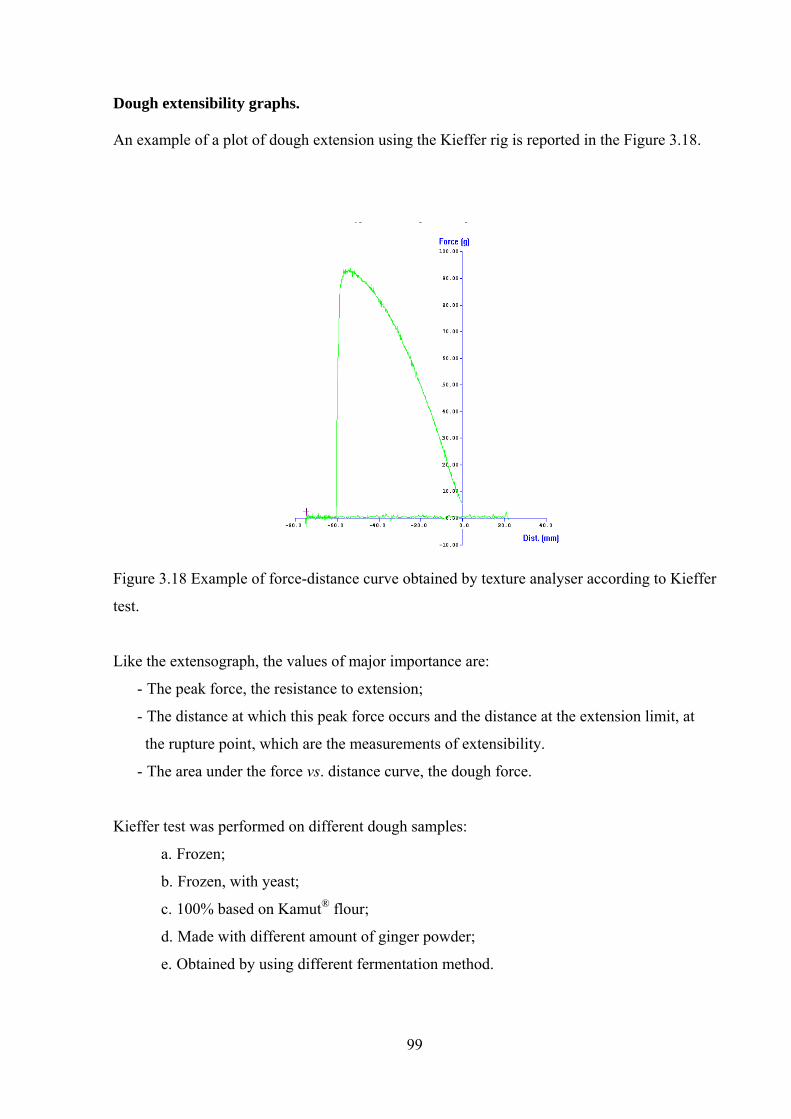
Dough extensibility graphs.
An example of a plot of dough extension using the Kieffer rig is reported in the Figure 3.18.
Figure 3.18 Example of force-distance curve obtained by texture analyser according to Kieffer
test.
Like the extensograph, the values of major importance are:
- The peak force, the resistance to extension;
- The distance at which this peak force occurs and the distance at the extension limit, at
the rupture point, which are the measurements of extensibility.
- The area under the force vs. distance curve, the dough force.
Kieffer test was performed on different dough samples:
a. Frozen;
b. Frozen, with yeast;
c. 100% based on Kamut® flour;
d. Made with different amount of ginger powder;
e. Obtained by using different fermentation method.
99

Different rest time at different temperatures have been applied:
a. For the samples without yeast was followed the standard method (40 min at 30°C);
b. The samples were thawed at room temperature for 2 hours, then were prepared and
were analysed immediately after the preparation to prevent an excessive
fermentation in order to avoid samples difficult to manage.
c. Immediately after mixing, in order to avoid dough dehydration, doughs were put in
plastic boxes for 10 min to lose mechanical energy stored up during mixing and
handling. After resting phase, dough samples were pressed into a Teflon mould
and cut into dough stripes using the appropriate mould and kept for a further 10
min at 30°C under saturated atmosphere and then measured.
d. Immediately after mixing, in order to avoid dough dehydration, doughs were put in
plastic boxes for 10 min to lose mechanical energy stored up during mixing and
handling. After resting phase, the doughs samples were prepared and kept for 15
min at 20°C and then measured.
e. Immediately after mixing, in order to avoid dough dehydration, doughs were put in
plastic boxes for 10 min at 25 °C to lose mechanical energy stored up during
mixing and handling. After resting phase the doughs were prepared and kept 10
min at 25°C and then measured.
The Kieffer test on dough was conducted with a Texture Analyser mod. TA.HDi 500 (Stable
Micro Systems, Surrey, UK) with the following setting:
Mode Measure Force in Tension
Option Return To Start
Pre-start Speed 4.00 mm/s
Test Speed 3.30 mm/s
Post-test Speed 10.00 mm/s
Distance 100,0 mm
Load Cell 5 Kg
Trigger Force Auto-5g
100
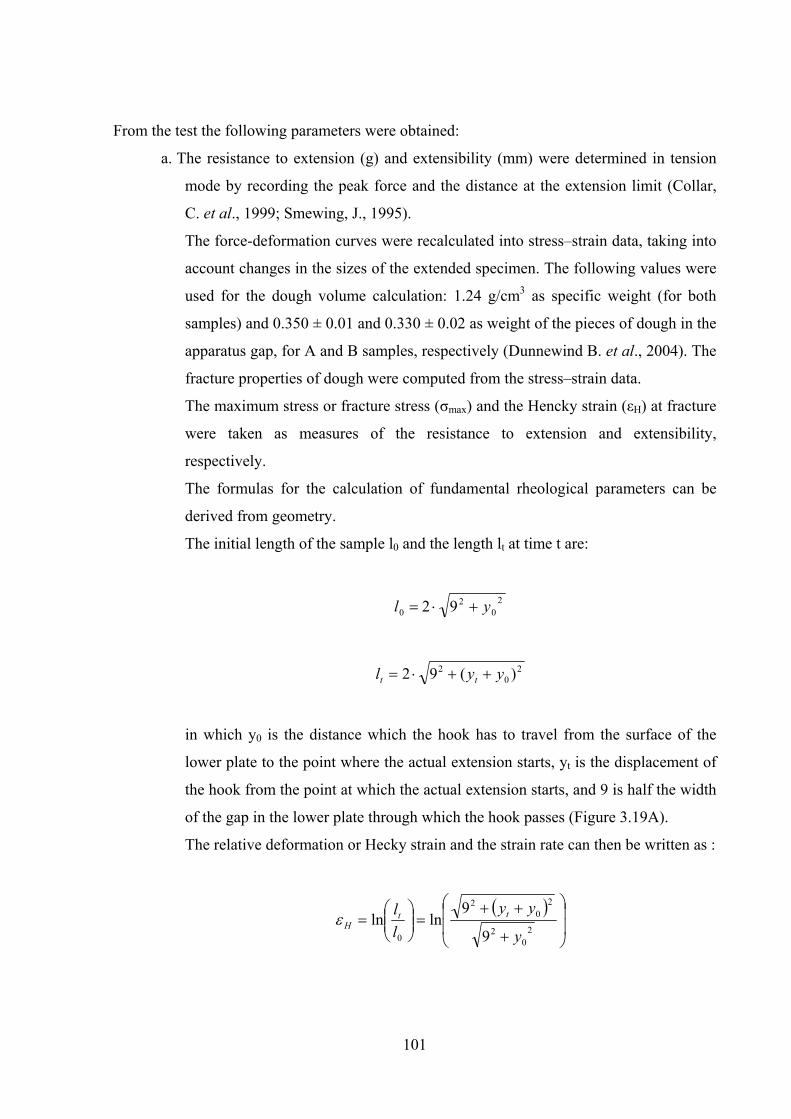
From the test the following parameters were obtained:
a. The resistance to extension (g) and extensibility (mm) were determined in tension
mode by recording the peak force and the distance at the extension limit (Collar,
C. et al., 1999; Smewing, J., 1995).
The force-deformation curves were recalculated into stress–strain data, taking into
account changes in the sizes of the extended specimen. The following values were
used for the dough volume calculation: 1.24 g/cm3 as specific weight (for both
samples) and 0.350 ± 0.01 and 0.330 ± 0.02 as weight of the pieces of dough in the
apparatus gap, for A and B samples, respectively (Dunnewind B. et al., 2004). The
fracture properties of dough were computed from the stress–strain data.
The maximum stress or fracture stress (σmax) and the Hencky strain (εH) at fracture
were taken as measures of the resistance to extension and extensibility,
respectively.
The formulas for the calculation of fundamental rheological parameters can be
derived from geometry.
The initial length of the sample l0 and the length lt at time t are:
20
20 92 yl +⋅=
20
2 )(92 yyl tt ++⋅=
in which y0 is the distance which the hook has to travel from the surface of the
lower plate to the point where the actual extension starts, yt is the displacement of
the hook from the point at which the actual extension starts, and 9 is half the width
of the gap in the lower plate through which the hook passes (Figure 3.19A).
The relative deformation or Hecky strain and the strain rate can then be written as :
( )⎟⎟
⎠
⎞
⎜⎜
⎝
⎛
+
++=⎟⎟
⎠
⎞⎜⎜⎝
⎛=
20
2
20
2
0 9
9lnln
y
yyll tt
Hε
101

The measured force Fm is not the force acting on the dough Fd. Assuming that the
hook passes exactly through the centre of the gap, Fm is divided equally over both
stretches of dough at each side of the hook. Sinα can therefore be expressed in
forces as well as in lengths (Figure 3.19B):
2/2/sin 0
t
t
d
m
lyy
FF +
==α
( )04 yylFF
t
tmd +⋅=
Assuming that the dough piece has the same cross-section over its whole length,
the surface over which the force is acting is V/lt, V being the volume of the dough
piece that is extended. The stress σ can then be calculated according to:
t
d
lVF/
=σ
102

Figure 3.19A Schematic drawing of the Kieffer Extensibility Rig with its Teflon mould.
Figure 3.19B Schematic drawing of the forces acting on the dough piece (EQ.5) (modified
from Dunnewind B. et al., 2004).
103

b. Parameteres determined:
• The peak force, the resistance to extension;
• The distance at which this peak force occurs which are the measurement of
extensibility.
• The area under the force vs distance curve, the dough force.
c. and d. The resistance to extension (force), extensibility (distance) and dough force
(area) were determined by recording the peak force, the maximum distance limit
before break and the area under the force vs. distance curve (Angioloni, A., 2005).
e. Parameters determined:
• The peak force, the resistance to extension;
• The distance at which this peak force occurs and the distance at the extension
limit, at the rupture point, which are the measurements of extensibility.
• The area under the force vs distance curve, the dough force.
104

3.2.3 Dough stickiness
Before using the Chen and Hoseney cell, rotate the internal screw to move the piston and
increase the sample chamber to its maximum capacity. Place a small quantity of prepared
dough (5g) into the chamber and remove the excess dough with a spatula so that it is flush
with the top of the chamber.
Screw on the extruder lid. Rotate the internal screw a little way to extrude a small amount of
dough through the holes and remove this first extrusion from the lid surface using a spatula.
Rotate the screw once again to extrude a 1mm high dough sample. Place the perspex cap over
the exposed sample surface to minimise moisture loss, whilst allowing the prepared dough
surface to rest for 30 seconds to release the stress produced by extrusion. After this time
remove the cover and place the cell directly under the 25mm cylinder probe attached to the
load cell. Commence the adhesive test.
The dough can then be removed from the lid surface and extruded again to repeat the test,
using the above procedure.
An example of a plot using the dough stickiness method is as shown below:
The negative region of the plot when the test commences is a result of 40g of force being
applied for 0.1s to compress the sample slightly.
The positive region of the plot however is of overall importance. The maximum force reading,
i.e. highest positive peak, the positive area and the distance between the anchors set (‘travel’),
are all indicators of the stickiness or rheological properties of the dough.
105

The test was carried on:
a. Doughs with different percentage of ginger powder.
b. Doughs obtained by using different fermentation method.
The dough stickiness test on dough was conducted with a Texture Analyser TA.HDi 500
(Stable Micro Systems, Surrey, UK) applying the following setting:
Option Adhesive Test
Pre-start Speed 0.50 mm/s
Test Speed 0.50 mm/s
Post-test Speed 10.00 mm/s
Distance 4,0 mm
Force 40 g
Time 0.10 s
Load Cell 5 Kg
Trigger Type: Auto 5 g
106
3.2.4 Fundamental rheological tests
Small deformation rheological measurements, by oscillation tests, were performed on a
controlled stress–strain rheometer mod MCR 300 ( Physica/Anton Paar; Ostfildern Germany),
using parallel-plate geometry (25 mm plate diameter and 2 mm plate gap). The upper serrated
25 mm plate was lowered until the thickness of sample was adjusted to 2 mm and the excess
was trimmed off. The exposed surface was covered with a thin layer of mineral oil to prevent
moisture loss during testing. The plates were coated with sandpaper. There is good evidence
to suggest that use of sandpaper, as plate roughening, eliminates slip between the dough and
the plate. In the case of many systems, it has been demonstrated that plate roughening does
reduce, if not eliminate, slip between the sample and the plate (Keentok, M. et al., 2002).
For dynamic oscillatory measurements to be of real value, they should be performed in the
linear viscoelastic region (LVE-range: linear viscoelastic). This implies that the dynamic
moduli (G’ and G’’) and loss tangent (tanδ) should be independent of the applied stress or
strain. Also, the stress-strain relationship should be linear. In a stress controlled rheometer the
region of linearity is normally determined by performing a stress/strain amplitude sweep; the
sample under investigation is subjected to a range of stress values and dynamic moduli are
measured. Working with deformations of small amplitude is a necessary condition to ensure
the non destructive nature of the test this, in turn, allows us to express the results in terms of
linear viscoelastic properties, typical of an equilibrium state system.
A strain sweep test was used in this thesis to identify the linear viscoelastic region; on the
basis of this data, a target strain of 0.01%, which was within this linear region, was chosen for
measurement. A frequency sweep test, ranging from 0.1 to 10 Hz, was used to study the
dough rheological characteritics. The storage modulus (G’), loss modulus (G’’) and tanδ
(G’’/G’) were determined. G’ is a measure of the solid or elastic character of the material and
G’’ a measure of its liquid or viscous character, while tanδ indicates the relative contributions
of the viscous (G’’) and elastic (G’) characteristics of the material. When the material behaves
more like a solid, ie when the deformation within the linear range is essentially elastic and
recoverable, the elastic character, G’, exceeds the viscous character, G’’, and tanδ<1. On the
other hand, when the material behaves more like liquid or viscous system, then the viscous
character, G’’, predominates and tanδ>1. These parameters were evaluated at frequency of 1
Hz.
107

The test was carried out on:
a. Frozen dough;
b. Doughs with different amount of ginger powder;
c. Doughs obtained by using different fermentation method.
Although cereal rheology is a recent addition to the field of breadmaking, it is one of the
oldest branches of rheological study, the world’s first rheological instruments was developed
in 1836 to study the rheology of dough. However while yeast plays a crucial role in
breadmaking, almost all empirical and fundamental rheological testing and studies are
conducted on doughs formulated without yeast. The standard rheological testing instruments
in use today by the milling and baking industries (farinographs, mixographs, alveographs,
extensigraphs) test non-yeasted doughs. These instruments were originally developed to
overcome the inconsistent results obtained from test baking. Furthermore, omitting yeast has
the advantage of speeding up and making rheological testing simples. Yeasted doughs have
also been avoided in dough rheology research, often with non-yeasted dough rheological
findings being compared with baking data to provide a link between non-yeasted rheology
and baking performance. The need for rapid testing and the general success of non-yeasted
rheological measurements in predicting flour performance in breadmaking has seen the
continued avoidance of yeast in dough rheology. However, this approach does not provide
direct information on the rheological changes occurring within bread doughs during
fermentation and the stages between mixing and baking of the dough.
Only a handful of studies into the rheological properties of yeasted bread dough have been
made. Fundamental rheological studies of yeasted doughs have been made on wheat flour
sourdough (Wehrle, K. and Arendt, E.K., 1998) and on cracker sponge and dough (Oliver, G.
and Brock, C.J., 1997). All these studies of yeasted doughs have allowed the yeast to remain
active during the measurements. Such an approach can be problematic in gathering accurate
rheological information, particularly when conducting fundamental rheological measurements
where the test are extremely sensitive and may take a long time.
Allowing fermentation to continue during rheological measurements would confound these
measurements because it is impossible to ascertain what properties result from prior
fermentation, the parameter of interest, or from fermentation during the measurement
(Newberry, M.P. et al., 2002).
To try to avoid or at least to minimize this problem was decided to apply a shorter test on the
samples with yeast (b and c) compared with the test carried on the samples without yeast (a).
108

3.2.5 Image analysis
Introduction
Quality is a key factor for modern food industry because the high-quality of product is the
basis for success in today’s highly competitive market. In the food industry, the quality
evaluation still heavily depends on manual inspection, which is tedious, laborious, and costly,
and is easily influenced by physiological factors, inducing subjective and inconsistent
evaluation results. To satisfy the increased awareness, sophistication and greater expectation
of consumers, it is necessary to improve quality evaluation of food products. If quality
evaluation is achieved automatically, production speed and efficiency can be improved in
addition to the increased evaluation accuracy, with an accompanying reduction in production
costs. As a rapid, economic, consistent and even more accurate and objective inspection tool,
computer vision systems have been used increasingly in the food industry for quality
evaluation purposes. The application potential of computer vision to the food industry has
long been recognised. The food industry ranks among the top 10 industries using computer
vision technology, which has been proven successful for the objective and non-destructive
quality evaluation of several food products. Being an objective, rapid and non-contact quality
evaluation tool, computer vision has been attracting much R&D attention from the food
industry and rapid development has been increasingly taking place on quality inspection of a
wide range of food products (Du, C-J. and Sun, D-W., 2006).
Recent advances in hardware and software have aided in this expansion by providing low cost
powerful solutions, leading to more studies on the development of computer vision systems in
the food industry. As a result automated visual inspection is under going substantial growth in
the food industry because of its cost effectiveness, consistency, superior speed and accuracy.
Traditional visual quality inspection performed by human inspectors has the potential to be
replaced by computer vision systems for many tasks. There is increasing evidence that
machine vision is being adopted at commercial level (Brosnana, T. and Sun, D-W., 2004).
Fundamentals of computer vision
Following its origin in the 1960s, computer vision has experienced growth with its
applications expanding in diverse fields: medical diagnostic imaging; factory automation;
remote sensing; forensics; autonomous vehicle and robot guidance. Computer vision is the
construction of explicit and meaningful descriptions of physical objects from images. The
109

term which is synonymous with machine vision embodies several processes. Images are
acquired with a physical image sensor and dedicated computing hardware and software are
used to analyse the images with the objective of performing a predefined visual task. Machine
vision is also recognised as the integrated use of devices for non-contact optical sensing and
computing and decision processes to receive and interpret an image of a real scene
automatically. The technology aims to duplicate the effect of human vision by electronically
perceiving and understanding an image.
Basically, the system consists of two parts: hardware (illumination system, image acquisition
device, computer) for image acquisition, and software for image processing and analysis
(Figure 3.20).
Figure 3.20 Components of a computer vision system (modified from Wang, H-H. and Sun,
D-W., 2002a).
As with the human eye, vision systems are affected by the level and quality of illumination.
Sarkar (1991) found that by adjustment of the lighting, the appearance of an object can be
radically changed with the feature of interest clarified or blurred. Therefore the performance
of the illumination system can greatly influence the quality of image and plays an important
role in the overall efficiency and accuracy of the system. In agreement Gunasekaran (1996)
noted that a well-designed illumination system can help to improve the success of the image
analysis by enhancing image contrast. Good lighting can reduce reflection, shadow and some
noise giving decreased processing time. Various aspects of illumination including location,
lamp type and colour quality, need to be considered when designing an illumination system
for applications in the food industry .
There are many image acquisition devices based on different sensors that can be used to
generate an image, such as ultrasound, X-ray and near infrared spectroscopy. Images can also
be obtained by using displacement devices and document scanners. Usually in a machine
110
vision system, images for analysis are gathered by using a video camera or digital camera
(Brosnana, T. and Sun, D-W., 2004).
Array or area type cameras that consist of a matrix of minute photosensitive elements
(photosites) from which the complete image of the object is obtained based on output
proportional to the amount of incident light. Alternatively line scan cameras use a single line
of photosites which are repeatedly scanned up to 2000 times per minute to provide an accurate
image of the object as it moves under the sensor. Monochrome and colour cameras have been
used throughout the food industry for a variety of applications (Leemans, V. et al., 1998;
Pearson, T.C. and Slaughter, D.C.,1996; Yang, Q., 1996).
However, flatbed scanners can be used for image acquisition. A flatbed scanner is an image
gathering devices that incorporate a fixed relations between the illuminant source (lamp) and
the solid state sensors of the scanning head and it was used for the image acquisition of dough
for experiment on dough obtained by using different fermentation methods.
Image processing and image analysis are recognised as being the core of computer vision
(Krutz, G.W. et al., 2000). Image processing involves a series of image operations that
enhance the quality of an image in order to remove defects such as geometric distortion,
improper focus, repetitive noise, non-uniform lighting and camera motion. Image analysis is
the process of distinguishing the objects (regions of interest) from the background and
producing quantitative information, which is used in the subsequent control systems for
decision making.
The appearance of baked products is an important quality attribute, correlating with product
flavour and influencing the visual perceptions of consumers and hence potential purchases of
the product. Features such as the internal and external appearance contribute to the overall
impression of the products quality. Consequently such characteristics have been evaluated by
computer vision (Brosnana, T. and Sun, D-W., 2004).
The image analysis was carried out on final products:
a. Different breads coming from different bakeries:
i. “Coppia Ferrarese”;
ii. “Pane Malatestiano”;
b. Bread realized with different amount of ginger powder;
And also on doughs obtained by using different fermentation methods.
111

Image Analysis on bread
For image analysis the final products in the experimental work a, b were sliced in regular slice
of 20mm thickness. The inner slice was considered for crumb grain features measurements
(Figure 3.21).
1
1
1 2 3 4
5 8 6
9
7
10
Figure 3.21 Portion of slice’s “Pane Comune romagnolo”.
The images were captured using an image acquisition system for color digital camera similar
to that developed by Mendoza and Aguilera (2004) namely:
- samples were illuminated using four florescent lamps (60-cm length) with a colour
temperature of 6500 K (Philips, Natural Day-light, 18W) and a colour rendering index (Ra)
close to 95%. The four lamps were arranged as a square 35 cm above the sample and at an
angle of 45° with the sample plane to give a uniform light intensity over the food sample.
- A colour digital camera (CDC) Power Shot A70 (Canon, Tokyo, Japan) was located
vertically at a distance of 12.5 cm from the sample. The angle between the camera lens axis
and the lighting sources was approximately 45°. Sample illuminators and CDC were inside a
wood box with internal walls that are painted black to avoid the light reflection from the
room.
112

- Images were captured with the mentioned CDC at its maximum resolution (2048x1536
pixels) and stored by connecting the CDC to the USB port of a PC. Canon Remote Capture
Software (version 2.7.0) was used for acquiring the images directly in the computer.
A portion of each image was considered and digital images were processed by an advanced
Image Analysis software (Image Pro-Plus ® version 6.2 Media Cybernetics, USA) (Figure
3.22).
Crumb morphological analysis was performed. Crumb morphological features included: max
area, mean cell area, number of cells and cell density (number of cells/cm2) (a); the number of
cells, the percentage and the mean area of cells belonging to four class of varying area (b).
Figure 3.22 Elaboration of a slice of bread with ginger powder.
113

Image Analysis on dough
A particular sample preparation procedure was set up in order to evaluate the changes in gas
cell size and distribution during proofing and to avoid structural deformation (Figure 3.23). At
the end of mixing, after 10 min rest, a petri dishes was put on top of the sample and after fixed
proofing time (immediately after mixing, after 30 min and 60 min of fermentation) the images
were acquired using a colour plane scanner mod. SnapScan40 (AGFA, Belgium, Europe). All
images obtained under the same conditions (true color-24 bit, resolution of 300bit x pixel
(BPP)), were taken by positioning the doughs on a scanner held on a black box, in order to
exclude the surrounding light (Rocculi P. et al., 2005). The images were then processed by
Image Analysis software (Image Pro-Plus ® version .6.2 Media Cybernetics, USA).
Dough morphological features included: total number of objects; objects classes: the objects
were then divided in 4 different classes of varying area (cm2) (Class 1:0-0.001; Class 2:
0.001-0.01; Class 3: 0.01-0.1; Class 4: 0.1-1) and for each class were evaluated the number
and the percentage of objects; the total area and the percentage.
Figure 3.23 Sample’s preparation.
114
3.3 Statistical analysis
Analysis of variance (ANOVA) and the test of mean comparisons according to Fisher’s least
significant difference (LSD) were applied, with a level of significance of 0.05.
Data were also evaluated using Pearson’s correlation analysis between large and small dough
rheological properties.
The statistical package STSG Statistica for Windows, version 6.0 (“Statsoft” Inc., Tulsa, OK)
was used.
115
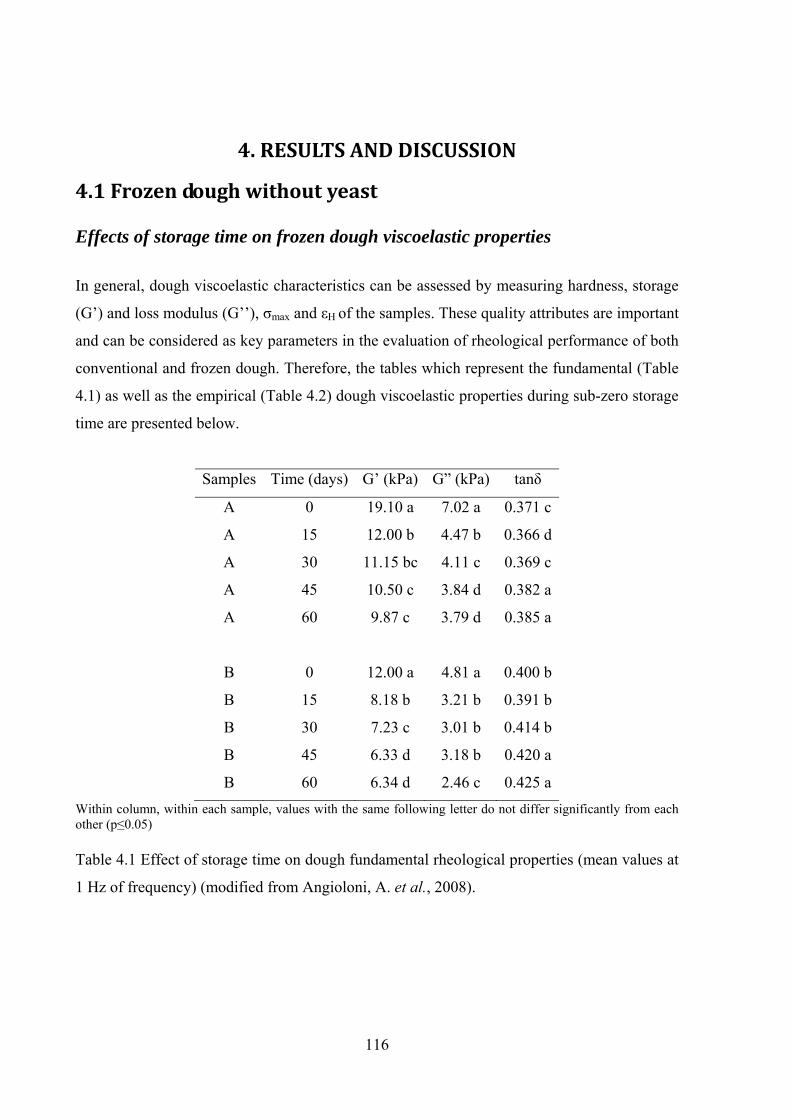
4. RESULTS AND DISCUSSION
4.1 Frozen dough without yeast Effects of storage time on frozen dough viscoelastic properties
In general, dough viscoelastic characteristics can be assessed by measuring hardness, storage
(G’) and loss modulus (G’’), σmax and εH of the samples. These quality attributes are important
and can be considered as key parameters in the evaluation of rheological performance of both
conventional and frozen dough. Therefore, the tables which represent the fundamental (Table
4.1) as well as the empirical (Table 4.2) dough viscoelastic properties during sub-zero storage
time are presented below.
Samples Time (days) G’ (kPa) G” (kPa) tanδ
A 0 19.10 a 7.02 a 0.371 c
A 15 12.00 b 4.47 b 0.366 d
A 30 11.15 bc 4.11 c 0.369 c
A 45 10.50 c 3.84 d 0.382 a
A 60 9.87 c 3.79 d 0.385 a
B 0 12.00 a 4.81 a 0.400 b
B 15 8.18 b 3.21 b 0.391 b
B 30 7.23 c 3.01 b 0.414 b
B 45 6.33 d 3.18 b 0.420 a
B 60 6.34 d 2.46 c 0.425 aWithin column, within each sample, values with the same following letter do not differ significantly from each other (p≤0.05) Table 4.1 Effect of storage time on dough fundamental rheological properties (mean values at
1 Hz of frequency) (modified from Angioloni, A. et al., 2008).
116

Within column, within each sample, values with the same following letter do not differ significantly from each
other (p≤0.05).
Texture Profile Analysis Kieffer
Samples Time
(days)
Hardness
(N)
Springiness
Adhesiveness
(N·s)
εH
σmax
(kPa)
A 0 62a 0.95a 25.20b 2.36a 15.55a
A 15 53b 0.83b 25.25b 2.33a 12.76b
A 30 53b 0.78b 25.39b 2.25b 10.12c
A 45 51b 0.74c 25.95b 2.19c 10.08c
A 60 50b 0.73c 31.09a 2.16c 9.81c
B 0 52a 0.93a 39.71b 2.15a 4.11a
B 15 40b 0.91a 39.99b 2.11a 3.82a
B 30 39b 0.84b 40.86b 2.10a 3.20b
B 45 33c 0.75c 50.90a 2.01bc 2.94b
B 60 33c 0.75c 52.32a 1.97c 2.78b
Table 4.2 Effect of storage time on dough empirical rheological properties (modified from
Angioloni, A. et al., 2008).
Although many studies have considered the rheological properties of frozen dough, it is
actually difficult to have a completely clear picture about the state-of-the-art because
contradictory results have been found. Different experiments showed, a decrease in the
extensibility of frozen dough (Varriano, M. et al., 1980; Wolt, M.J. and D’Appolonia B.L.,
1984; Havet, M. et al., 2000; Giannou, V. et al., 2003) but in other researches the opposite
effect was also identify (Inoue, Y. and Bushuk, W., 1991). This might be due to the fact that
when yeast or additives are included in dough formulations this can mask the effect of
freezing on the dough viscoelastic structure. Kline and Sugihara (1968) and Hsu (1979)
suggested that dough weakening can be attributed to the release of reducing substances, such
as glutathione from yeast during freezing. Glutathione weakens the dough by cleaving
disulphide bonds in the gluten proteins, an important factor in determining the rheology of
gluten. ANOVA analyses were used in order to study the influence of storage time (at -18 °C)
on dough rheology. Significant differences between the means at the 95% confidence level
were found. The results about the small viscoelastic properties, reported in Table 4.1, show
117

that the longer the storage time the lower the storage (G’) and loss modulus (G’’). On the
other hand, different behaviour was measured for tanδ. Since a more substantial decrease of
the elastic component was found in comparison with the viscous part, we can observe an
increase of tanδ with the increase of storage time. These results can be interpreted as a
reduction in dough elasticity with the increase of sub-zero storage period. Similar patterns
were observed also for the dough large rheological properties (Table 4.2). The longer the
storage time the lower the Kieffer and TPA parameter values. Adhesiveness was the only
characteristic for which an opposite behaviour was measured. Moreover, all the measured
viscoelastic attributes showed that the effect of freezing is particularly strong in the first 15
days of storage. This result might be explained by the reduction of gluten cross-linking caused
by ice crystallization and water redistribution provoked by a modification in the water binding
capacity of dough constituents. The mechanical action of ice crystals may have resulted in the
disruption of the gluten matrix resulting in a network that was less continuous, more ruptured
and separated from starch granules. This hypothesis is in accordance with the results obtained
from other authors (Havet, M. et al., 2000; Giannou, V. et al., 2003), even if the studies were
conducted on samples where yeast or additives have been used.
Relationship between large and small dough rheological properties
Using Pearson’s correlation analysis, a range of correlation coefficients (r) from 0.64 to 0.94
was obtained for the relationships between Texture Profile Analysis, Kieffer and rheometer
parameters. Table 4.3 shows that εH, σmax, G’ and G’’ were positively correlated vs. hardness
(r = 0.88; r = 0.94; r = 0.93; r = 0.88) and that G’ and G’’ were positively correlated vs. εH,
σmax (r = 0.83: r = 0.77; r = 0.88; r = 0.83). On the other hand, springiness, G’ and G’’ were
negatively correlated vs. storage time (r = 0.94; r = 0.65; r = 0.69). The obtained results,
shown in Table 4.3, are in accordance with the fact that all the parameters that are considered
as indicators of a coherent and elastic dough (G’, hardness, σmax) are positively correlated
among themselves. On the other hand only storage modulus and springiness are negatively
correlated vs. storage time. All these results indicate that large and small viscoelastic
parameters have a significant role in the evaluation of frozen dough viscoelastic performance.
118

(* p<0.05; ** p<0.01).
Time
(days)
Hardness
(N)
Adhesiveness
(N·s)
G’
(kPa)
G”
(kPa)
Springiness -0.94**
Adhesiveness -0.90**
G’ (kPa) -0.65* 0.93** -0.73*
G’’ (kPa) -0.69* 0.88** -0.64*
tan δ -0.88** 0.96** -0.73**
εH 0.88** -0.90** 0.83* 0.77*
σmax (kPa) 0.94** -0.93** 0.88** 0.83*
Table 4.3 Relationship within empirical and fundamental dough rheological properties
(modified from Angioloni, A. et al., 2008).
CONCLUSIONS
Small deformation (in fundamental units) and large deformation methods can be used in order
to evaluate the influence of sub-zero storage time on non-fermented dough viscoelastic
performance. The frozen storage period had a significant effect on the dough’s hardness,
springiness, adhesiveness, σmax, εH, storage and loss modulus. In general, the longer the sub-
zero storage time the lower the positive viscoelastic attributes. As the changes in dough
rheology are might be due to the formation and the mechanical action of ice crystals, the
effect of freezing was particularly concentrated in the first 15 days of storage. It is clear that
the use of frozen dough allows easier and more profitable baking, reducing labour and
production cost while facilitating transportation. However, the quality of the final product
prepared from frozen dough is often inferior to the freshly one. Nevertheless, the obtained
results are useful in order to understand what really occur when dough, without any
preservatives, is stored at freezing temperature for two months. Further researches and
analyses should be conducted to better understand the issues mechanism involved and to
improve the overall knowledge about the use of freezing in bakery technology.
119

4.2 Frozen dough and bread made with frozen dough
Effect of storage time on rheological properties of frozen and deep-frozen
dough
Although research on dough rheology has been performed for several years, some of the most
important problems concerning frozen dough such as decreased yeast viability and gas
production ability or diminished gluten network ability to retain C02 and progressive loss of
dough cohesiveness and stability, have not been fully resolved yet.
It still remains difficult to thoroughly understand dough behaviour and use its textural
properties in order to predict bread characteristics. Especially in frozen dough preparation,
where freezing and sometimes prolonged frozen storage intervene between dough formation
and bread making and several factors still have not fully investigated, this becomes even
harder (Giannou, V. and Tzia C., 2007).
Two main problems arise in the case of yeasted bread dough freezing: yeast viability and the
rheology of the dough which are both affected by freezing (Le Bail, A. et al., 1999).
TPA test on doughs
Table 4.4 shows the effect of the storage time on frozen and deep-frozen dough empirical
rheological properties.
Characteristics Dough type and storage time (days)
Frozen dough Deep-frozen dough
1 7 14 1 7 14
Hardness (N) 0.87 b 0.79 b 7.99 a 0.75 a 0.70 a 0.78a
Resilience 0.09 b 0.08 b 0.15a 0.15 a 0.21 a 0.15 a
Springiness 0.96 a 0.97 a 0.97 a 0.98 a 1.00 a 1.00 a
Cohesiveness 0.44 b 0.43 b 0.50a 0.56 a 0.52 a 0.54 a
Gumminess (N) 0.39 b 0.34 b 4.01 a 0.42 a 0.37 a 0.42 a
Adhesiveness (N·s) 1.55 b 1.21 b 2.73 a 1.29 a 0.68 b 1.03 abMean values for each characteristics within each dough type annotated by the same letter are not significantly different (p≤0.05). Table 4.4 Effect of storage time on frozen and deep-frozen dough empirical rheological
properties (Tpa test).
120

We can observe the most remarkable change on frozen dough after 14 days of storage;
hardness, resilience, gumminess and adhesiveness increase at the last day of control.
Instead there were not significant differences among the deep-frozen samples.
This should be attributable to the minor time necessary to the deep-frozen doughs compared
to the frozen doughs to reach the temperature of -12.5°C, that allows to maintain good
rheological properties ( Cauvain, S.P., 1996; Peressini, D. and Sensidoni, A., 2004).
Dough Uni-axial Extensibility (Kieffer Method) Characteristics Dough type and storage time (days)
Frozen dough Deep-frozen dough
1 7 14 1 7 14
Resistance to extension (g) 33.58a 25.31b 17.68c 35.40b 46.62a 42.76a
Extensibility at max (mm) 37.38b 38.60b 51.68a 36.70a 37.95a 39.07a
Area (g·mm) 253.75a 183.19b 200.54b 255.34b 318.42a 314.55aMean values for each characteristics within each dough type annotated by the same letter are not significantly
different (p≤0.05).
Table 4.5 Effect of storage time on frozen and deep-frozen dough empirical rheological
properties (Kieffer test).
Dough extension properties are very important when evaluating frozen doughs because they
influence oven spring and loaf volume of the final baked product (Bhattacharyaa, M. et al.,
2003).
The Table above shows a difference in the behaviour of frozen dough compared to the deep-
frozen dough as resulted from Kieffer test.
The frozen doughs showed a modification of resistance to extension and extensibility during
storage time while the deep-frozen doughs were more stable during the same period of time.
This data was in agreement with the literature (Cauvain, S.P., 1996; Perissini, D. and
Sensidoni, A., 2004; Giannou, V. et al., 2007).
121

From different experiments a decrease in the extensibility of the dough subjected to freezing
could be observed, and also the opposite effect (Havet, M. et al., 2000).
Wolt and D’ Appolonia (1984) found a decrease in extensibility with an increase in frozen
storage time, which was attributed to overall gluten network deterioration. Inoue and Bushuk
(1991) observed no significant changes in rheological properties during short-term storage
(Bhattacharyaa, M. et al., 2003).
In our experimentation was observed an increase in the extensibility on the frozen dough
suggesting dough weakening, while extensibility of deep-frozen dough did not change
significantly as the storage time increased from day 1 to day 14.
The resistance to extension of deep-frozen dough increased as the storage time increased from
day 1 to day 14, possibly due to the stiffening of the dough during frozen storage.
The resulting loss of dough strength observed in frozen sample (Table 4.5) can be attributed
firstly, to the release of disulphide reducing substances from dead yeast cells, and secondly, to
the disruption of the gluten network by ice crystals (Giannou, V. et al., 2003).
In the deep-frozen sample the loss of dough strength is less marked probably due to the higher
freezing rate (0.40°C/min) compared to that of frozen samples (0.15 °C/min). In fact the rapid
freezing allows the formation of ice micro-crystals, which do not affect the integrity of the
gluten network. This is without doubt one of the most important factors to minimize the
damage caused by cold (Angioloni, A. et al., 2008).
Nevertheless, excessively rapid lowering of the temperature might seriously compromise the
yeast vitality. This implies that there is an optimum freezing speed which both allow intense
nucleation of the crystals and reduces shock on yeast cells (Angioloni, A. et al., 2008).
Even though the freezing rate is known to influence yeast viability and the rheology of the
dough, the duration of the storage is also an important parameters.
However the temperature history during storage has a large influence on the structure of ice
crystals which might recombine due to the temperature fluctuations (Le Bail, A. et al., 1999).
It is therefore very important to use storage equipment capable of maintaining the temperature
as constant as possible. For that reason, excessively long storage periods should be avoided.
In general storage time should be not more than 45-60 days (Angioloni, A. et al.,2008).
122
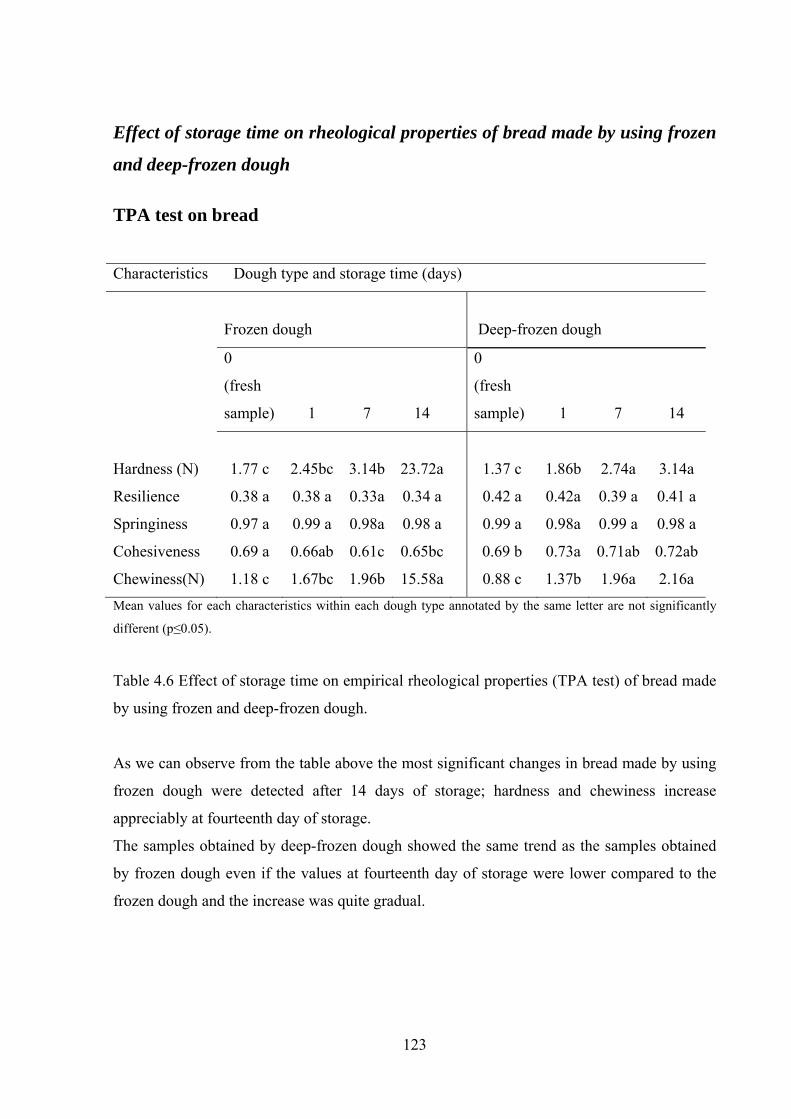
Effect of storage time on rheological properties of bread made by using frozen
and deep-frozen dough TPA test on bread
Characteristics Dough type and storage time (days)
Frozen dough Deep-frozen dough
0
(fresh
sample) 1 7 14
0
(fresh
sample) 1 7 14
Hardness (N) 1.77 c 2.45bc 3.14b 23.72a 1.37 c 1.86b 2.74a 3.14a
Resilience 0.38 a 0.38 a 0.33a 0.34 a 0.42 a 0.42a 0.39 a 0.41 a
Springiness 0.97 a 0.99 a 0.98a 0.98 a 0.99 a 0.98a 0.99 a 0.98 a
Cohesiveness 0.69 a 0.66ab 0.61c 0.65bc 0.69 b 0.73a 0.71ab 0.72ab
Chewiness(N) 1.18 c 1.67bc 1.96b 15.58a 0.88 c 1.37b 1.96a 2.16a Mean values for each characteristics within each dough type annotated by the same letter are not significantly
different (p≤0.05).
Table 4.6 Effect of storage time on empirical rheological properties (TPA test) of bread made
by using frozen and deep-frozen dough.
As we can observe from the table above the most significant changes in bread made by using
frozen dough were detected after 14 days of storage; hardness and chewiness increase
appreciably at fourteenth day of storage.
The samples obtained by deep-frozen dough showed the same trend as the samples obtained
by frozen dough even if the values at fourteenth day of storage were lower compared to the
frozen dough and the increase was quite gradual.
123

CONCLUSIONS
Dough rheology characteristics were evaluated using two different rheological methods: TPA
test (performed on bread as well) and Kieffer test.
Obtained results confirmed that the freezing rate influences the dough rheological properties.
Actually TPA results showed a different behaviour between frozen dough and deep-frozen
dough. Frozen dough showed a remarkable change of rheological characteristics (increase of
hardness, resilience, gumminess and adhesiveness) after 14 days of storage whilst the deep-
frozen dough preserved unchanged its rheological characteristics over the storage time. This
behaviour was confirmed by results of Kieffer test.
These differences were not detected between bread obtained by using frozen or deep-frozen
dough.
Bread obtained by using frozen dough showed the most significant changes after 14 days of
storage, in this case the bread obtained by using a deep-frozen dough showed the same trend
even if the values at fourteenth days of storage were lower compared to the frozen dough and
the increase was more gradual.
124

4.3 Doughs obtained by using different fermentation methods
Fermentation is an important stage in the manufacturing of various bakery products, bread
included. During fermentation, the expansion of previously incorporated air bubbles provides
the characteristic of the aerated structure of bread. As a result of fermentation, the light,
aerated, and spongy structure of fermented dough product is developed (Mert, B., 2008).
The rheological characteristics of fermented dough are determined by many factors. At the
beginning of the mixing process, physical actions such as hydratation take place, the gluten
network is formed when proteins and starch granules absorb water.
Enzyme activity of amylases, proteases and hemicellulases causes the breakdown of several
flour components. Microbial growth and metabolic activity begin after a lag phase, depending
on the activity of starter cultures. Changes in pH caused by the production of lactic acid also
alter the rheological behaviour of dough.
Even small chemical and physical changes in the gluten network can lead to significant
changes in rheological characteristics. The increasing amount of CO2 in the dough leads to the
formation of bubbles. In bread dough, the gas-holding capacity is one of the most important
factors affecting the volume of the final product. Dough additives, such as emulsifiers and fat,
are used to improve gas-holding capacity. In sourdough, the formation, of gas bubbles leads
to an increased volume and decreased density (Wehrle, K. and Arendt, E.K., 1998).
The impact of such changes in dough rheology must be considered in order to choose an
appropriate proof time and to obtain good quality bread. The dough must contain a large
volume of gas and also gas retention in reserve for oven rise. The proofing is really important
in the bread making process in providing a link between the bubble structure created in the
mixer and in the final baked loaf (Angioloni, A. et al., 2006).
Although the rheology of the fermenting dough has a direct influence on the final
acceptability of baked products, it is not generally included in the experimental studies. The
common practice is to relate the rheological properties of non-yeasted dough with the baking
performance of the yeasted products. One of the main reasons for this common practice is the
lack of a suitable instrument that can conduct fast rheological measurements during
fermentation. The fermenting dough is a complex and continuously evolving dynamic system
requiring quick measurement techniques (Mert, B., 2008).
125
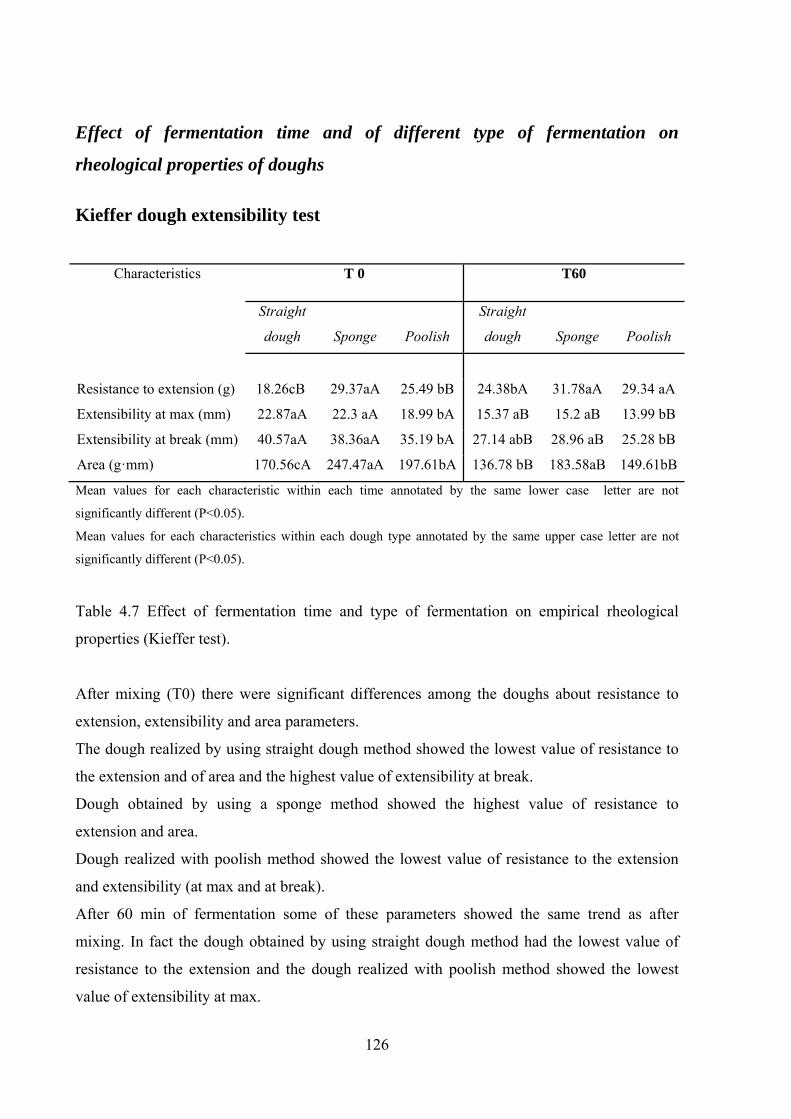
Effect of fermentation time and of different type of fermentation on
rheological properties of doughs Kieffer dough extensibility test
Characteristics T 0 T60
Straight
dough Sponge Poolish
Straight
dough Sponge Poolish
Resistance to extension (g) 18.26cB 29.37aA 25.49 bB 24.38bA 31.78aA 29.34 aA
Extensibility at max (mm) 22.87aA 22.3 aA 18.99 bA 15.37 aB 15.2 aB 13.99 bB
Extensibility at break (mm) 40.57aA 38.36aA 35.19 bA 27.14 abB 28.96 aB 25.28 bB
Area (g·mm) 170.56cA 247.47aA 197.61bA 136.78 bB 183.58aB 149.61bB
Mean values for each characteristic within each time annotated by the same lower case letter are not
significantly different (P<0.05).
Mean values for each characteristics within each dough type annotated by the same upper case letter are not
significantly different (P<0.05).
Table 4.7 Effect of fermentation time and type of fermentation on empirical rheological
properties (Kieffer test).
After mixing (T0) there were significant differences among the doughs about resistance to
extension, extensibility and area parameters.
The dough realized by using straight dough method showed the lowest value of resistance to
the extension and of area and the highest value of extensibility at break.
Dough obtained by using a sponge method showed the highest value of resistance to
extension and area.
Dough realized with poolish method showed the lowest value of resistance to the extension
and extensibility (at max and at break).
After 60 min of fermentation some of these parameters showed the same trend as after
mixing. In fact the dough obtained by using straight dough method had the lowest value of
resistance to the extension and the dough realized with poolish method showed the lowest
value of extensibility at max.
126

The dough realized by using sponge method showed the highest value of resistance to
extension and area both after mixing and after 60 min of fermentation.
The low pH of the sponge and its unique rheological characters are carried through to the
dough where they have effect of producing a more extensible gluten network after second
mixing, infact the dough realized by using sponge method showed, after 60 min of
fermentation, the highest value of extensibility at break (Cauvain, S.P., 2001).
The dough development continues during fermentation. An hypothesis supported by Halton is
that the resistance of fermenting doughs in stretching tests increased during fermentation,
whereas that of non-fermenting doughs decreased with time (Bloksma, A.H., 1990).
Our results are in agreement with this finding; in fact the doughs analysed immediately after
mixing showed a lower value of resistance to extension compared to the doughs after the
fermentation process. Thus, fermentation appeared to increase the resistance to extension of
the doughs.
Besides the fermentation allows the dough to become less extensible after 60 min, considering
that the samples showed a significant decrease of extensibility at max and at rupture point.
Moreover the doughs became less strong, as confirmed by a significant decrease of area.
The effects of sponge-dough fermentation on rheological properties of dough were examined
by a number of investigators (Landis, Q. and Freilich, J., 1934; Freilich, J. and Frey, C.N.,
1939; Ikezoe, K. and Tipples, K.H., 1968; Barber, B. et al., 1980). Preston and Kilborn
(1982), Kilborn and Preston (1982), and Casutt et al. (1984) used the extensigram to measure
dough rheological properties during fermentation. They showed that fermentation decreases
extensigram length, maximum height and area.
Similarly, Pizzinatto and Hoseney (1980) reported that fermentation of cracker sponges
changes the extensibility. Most of these reports are concerned with the effects of fermentation
on rheological or physical properties, but only a few studied the mechanism of change in
rheological properties (Shiiba, K. et al., 1990).
Our results of extensibility and area, obtained by using Kieffer test, are in agreement with
these previous works.
127
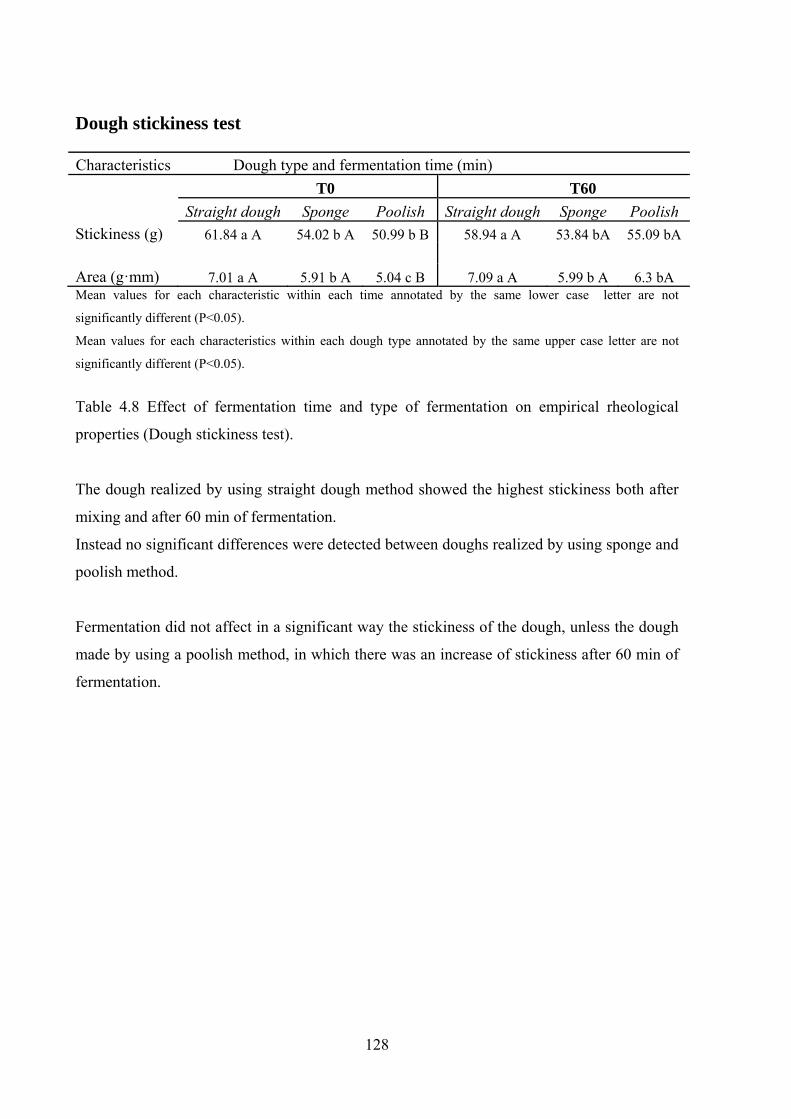
Dough stickiness test Characteristics Dough type and fermentation time (min) T0 T60 Straight dough Sponge Poolish Straight dough Sponge Poolish Stickiness (g) 61.84 a A 54.02 b A 50.99 b B 58.94 a A 53.84 bA 55.09 bA
Area (g·mm) 7.01 a A 5.91 b A 5.04 c B 7.09 a A 5.99 b A 6.3 bA Mean values for each characteristic within each time annotated by the same lower case letter are not
significantly different (P<0.05).
Mean values for each characteristics within each dough type annotated by the same upper case letter are not
significantly different (P<0.05).
Table 4.8 Effect of fermentation time and type of fermentation on empirical rheological
properties (Dough stickiness test).
The dough realized by using straight dough method showed the highest stickiness both after
mixing and after 60 min of fermentation.
Instead no significant differences were detected between doughs realized by using sponge and
poolish method.
Fermentation did not affect in a significant way the stickiness of the dough, unless the dough
made by using a poolish method, in which there was an increase of stickiness after 60 min of
fermentation.
128

Fundamental rheological properties Characteristics Dough type and fermentation time (min)
T0 T60
Straight
dough Sponge Poolish
Straight
dough Sponge Poolish
δ (°) 23.05aA 21.64aA 21.64aA 23.67abA 22.8bA 24.37aA
G’ (Pa) 8903bA 11818aA 8574bB 8267cA 10966aB 9864bA
G” (Pa) 3797bA 4685aA 3414bB 3622bA 4608aB 4469aA
tan δ 0.43aA 0.4aB 0.4aA 0.44abA 0.42bA 0.45aA
G* (Pa) 12700bA 16503aA 119989bB 11888cA 15574aB 11989bA
η* (Pa·s) 1540bA 2023aA 1473bB 1437cA 1893aB 1472bA
Mean values for each characteristic within each time annotated by the same lower case letter are not
significantly different (P<0.05).
Mean values for each characteristics within each dough type annotated by the same upper case letter are not
significantly different (P<0.05).
Table 4.9 Effect of fermentation time and type of fermentation on fundamental rheological
properties (mean values at 1 Hz of frequency).
Immediately after mixing, the dough obtained with sponge showed significant differences for
almost all the parameters unless δ (°) and tanδ compared to the doughs obtained by using
straight and poolish method.
The lower storage modulus found in dough realized by using poolish at T0 showed that the
addition of sourdough reduce the dough elastic component. Similar results were found from
Angioloni (2006).
After 60 min of fermentation doughs realized by using poolish method showed higher phase
angle (δ) than the samples proofed with straight and sponge method, in agreement with a
previous work (Angioloni, A. et al., 2006).
All doughs showed the same behaviour for storage modulus (G’) and loss modulus (G’’) over
the range of frequencies measured (from 0.1 to 10 Hz). In fact all doughs showed an elastic
modulus (G’) higher than the viscous modulus (G’’), indicating that the doughs had a solid,
elastic-like behaviour.
129

The phase angle ranges from 0° (ideally elastic material, Hookean solid) to 90° (ideally
viscous material, Newtonian liquid). For all viscoelastic materials, the phase angle is between
0° and 90°; the lower the values, the more elastic the material.
During the fermentation process there was an increase of phase angle and a decrease of
storage modulus (G’) of straight-dough and sponge-dough, indicating a decrease of elasticity
of the dough that became less stiff and less elastic (Lee, S. et al., 2004) as a result of a
fermentation and therefore it will be more easy to laminate.
In fact the decrease of pH over fermentation time (data not shown) induces an increase in tanδ
accompanied with a decrease in G’ (Song, Y. and Zheng, Q., 2007).
The storage modulus values started to decrease after a lag period required for CO2 to diffuse
through the dough matrix and saturate it. The decrease is due to the accumulation of CO2
bubbles (leavening) and change in the structure of the dough matrix (Mert, B., 2008).
A general decrease of extensibility evaluated by Kieffer test was instead registered in all the
samples.
This finding is probably the result of the lower efficiency of empirical methods in
appreciating microscopic structural changes (Angioloni, A. and Collar, C., 2009).
Similar to the elastic modulus, the loss modulus of dough samples also decreased during
fermentation. This decrease of the loss or viscous modulus could be also attributed to the
increased volume of the gas phase upon fermentation (Mert, B., 2008).
After 60 min of fermentation, the complex modulus (G*) decreased, indicating decreased
resistance to deformation. This result is in agreement with the decrease of the area value,
index of dough’s force, obtained from the Kieffer test.
Instead doughs realized by using a poolish method showed a different trend. There was an
increase of the elastic, loss and complex modulus over the fermentation time.
The increase of G’ indicate that the sample stiffness increased after 60 min of fermentation
probably it would be necessary more time for this method of fermentation realized by using a
sourdough to reach similar rheological characteristics of straight dough and sponge dough
The use of sourdough in the poolish method increased the phase angle values even if not
significant difference were found between T0 and T60; in agreement with Angioloni (2006).
130

131
Image Analysis
If breadmaking can be characterized as a series of aeration stages, then the mechanisms by
which gas cells in the dough create the cellular structure of the bread crumb need to be
studied. Understanding how air bubbles nucleate in the bread dough during mixing is a
fundamental first step because it was shown conclusively over 60 years ago that these air
bubbles are the only nuclei available for subsequent gas cell growth (Baker, J.C. and Mize,
M.D., 1941). A further reason for studying bubbles in dough is that dough exhibits extremely
complex rheological properties and bubble numbers and sizes will affect dough rheology
(Bellido, G.G. et al., 2006).
Measuring bubble growth during proving is a difficult challenge that has not yet been fully
achieved. Whitworth and Alava (1999) measured the bubble size distribution ex-mixer and
after intermediate proof, and also produced computed tomographic images of proving doughs,
but resolution limits precluded the measurement of the bubble size distribution and its change
with time (Dobraszczyk B.J. et al., 2001).
It is unclear what happens to the gas cells during fermentation and baking. It is generally
believed that the loss of gas is due to the rupture of the walls of the gas cell.
Some authors suggested that the integrity of the gas cells is maintained by the existence of a
liquid film of surface-active materials at the gas-liquid interface, and that the gas cells are
stabilized by the liquid film. In their view, this liquid film plays an important role in gas
retention. The gas cells remain discrete during the first stage, until discontinuities develop in
the starch-protein matrix, and the degree to which such discontinuities occur is largely
dependent on the gluten proteins. The rheological properties of the bulk phase determine the
extensibility at this stage. With increasing fermentation time, the surface area of the liquid
film will increase. The stability of the liquid film determines the behaviour of the dough at
this stage. Surface-active materials probably stabilize the film so that it can expand across a
larger area without rupturing (Gan, Z. et al., 1995).
Fermentation may also cause changes in cell-wall components, through the activities of
endogenous or added enzymes (Autio, K. and Laurikainen, T., 1997).

Characteristics Dough type and fermentation time (min)
T 0 T30 T60 Straight dough Sponge Poolish Straight dough Sponge Poolish Straight dough Sponge Poolish
TOTAL OBJECTS 949aB 671bC 1129aB 1444aA 1033bB 1494aA 1390abA 1223bA 1466aA
CLA
SSE
1
Objects N° 283abB 242bC 310aB 436aA 335bB 389aA 399aA 394.78aA 385.38aA % 29.65bA 36.00aA 27.93bA 30.06bA 32.61aB 26.04cA 28.79bA 32.31aB 26.27cA
Area TOT 0.23abB 0.20bC 0.26aB 0.36aA 0.28bB 0.32aA 0.33aA 0.33aA 0.32aA
% 4.98bA 7.89aA 4.77bA 5.85bA 7.19aA 4.54cA 5.02bA 7.09aA 4.57bA
CLA
SSE
2
Objects N° 576aB 389bC 702aB 888aA 631bB 954aA 860abA 748bA 930aA % 60.84aA 57.68bB 62.10aB 61.39bA 60.84bA 63.86aA 61.58bA 61.03bA 63.33aAB
Area TOT 1.67aB 1.01bC 2.04aB 2.50bA 1.65cB 2.80aA 2.46aA 2.00bA 2.78aA
% 35.59aA 39.54aA 36.35aA 40.23aA 42.34aA 39.36aA 37.23aA 42.96aA 39.06aA
CLA
SSE
3
Objects N° 86aB 39bC 113aA 116bA 65cB 148aA 127aA 78bA 148aA % 9.08aA 6.03bA 9.60aA 8.20bA 6.35cA 9.91aA 9.24aA 6.43bA 10.17aA
Area TOT 2.17abB 1.00bC 2.92aA 2.79bA 1.64cB 3.68aA 3.15aA 1.95bA 3.75aA
% 46.08abA 38.96bA 47.17aA 43.74bA 42.15bA 50.42aA 47.25abA 41.68bA 50.38aA
CLA
SSE
4
Objects N° 4.00aA 1.88bA 4.00aA 4.56aA 2.00aA 2.78aA 4.78aA 2.89aA 3.38aA % 0.43aA 0.29aA 0.37aA 0.35aA 0.20aA 0.19aB 0.38aA 0.23aA 0.24aAB
Area TOT 0.63abA 0.34bA 0.64aA 0.69aA 0.34aA 0.40aA 0.70aA 0.40aA 0.46aA
% 13.35aA 13.61aA 11.71aA 10.18aA 8.31aA 5.68aB 10.50aA 8.28aA 5.99aB Mean values for each characteristic within each time annotated by the same lower case letter are not significantly different (P<0.05).
Mean values for each characteristics within each dough type annotated by the same upper case letter are not significantly different (P<0.05).
Table 4.10 Dough morphological features.
132

By using image analysis the structure of the different doughs realized by using different
fermentation method and the changes over the fermentation time was observed.
The sample realized by using sponge method showed the smaller amount of objects of the
four different classes over the fermentation time. Even the area occupied by the objects was
smaller compared to the doughs realized by using the others fermentation method (straight
method and the poolish method).
The smaller area occupied by the objects means that the dough showed a more compact
structure, this was in agreement with the lower value of δ(°) obtained from rheological
measurements.
During proof and baking the growth of gas bubbles determines the expansion of the dough
and therefore the ultimate volume and texture of the baked product (He, H. and Hoseney,
R.C., 1991). The limit of expansion of these bubbles is related directly to their stability, due
to coalescence and the eventual loss of gas when the bubbles fail. The rheological properties
of the bubble walls will therefore be important in maintaining stability against premature
failure during baking, and also in relation to gas cell stabilization and gas retention during
proof, and thus to the final structure and volume of baked product (Dobraszczyk, B.J. and
Morgenstern, M.P., 2003).
While an increase of total objects in the different doughs was detected after 30 min of
fermentation, a further increase at T60 was measured only for the dough obtained with the
sponge dough method.
Over the fermentation time the different classes showed a different trend.
For the dough realized by using straight-dough method the number of the objects belonging to
class 1 increased after 30 min of fermentation and after 60 min decreased, but not in a
significant way, while the number of the objects belonging to the class 3 and 4 increased over
the fermentation time. This is probably due to the effect of coalescence that involves the
fusion of gas bubbles through the rupture of the thin film between them.
The same trend was detected also for the dough realized by using poolish method.
Instead the dough realized by using a sponge method showed a different trend: the number of
the objects of the four different classes increased over the fermentation time.
133
CONCLUSIONS
The rheological properties of fermenting dough were investigated using empirical and
fundamental analysis and image analysis was used to integrate this information throughout the
evaluation of the structure of the different doughs over the fermentation time.
Dough viscoelastic properties changed over fermentation time; in general the elastic
behaviour of dough obtained with straight and sponge method decreased during fermentation.
Actually doughs showed an increase of resistance to extension and a decrease of extensibility,
obtained from Kieffer test, after 60min of fermentation. Different types of fermentation had a
clear effect on final rheological characteristics. The results of fundamental rheological test
showed that the incorporation of sourdough (poolish method) provoked changes that were
different from those seen in the others type of fermentation. Actually dough realized by using
poolish method showed the lower storage modulus (G’) after mixing (T0) and the higher
phase angle (δ) after 60 min of fermentation. Such changes may be attributed to a number of
intrinsically related factors, including variations in the rate or amount of acid produced
(Angioloni, A. et al., 2006).
There is evidence from the literature that the image analysis for quantitative assessment of
bread crumb attributes is effective, but unfortunately there is a lack of information about
application of image analysis to evaluate the dough structure. In this experimentation the
image analysis was applied to evaluate dough structure and the changes over the fermentation
time. In particular some relationship between the values obtained by using image analysis
(area of objects) and fundamental rheological measurements (δ) were found.
134

4.4 Doughs made by Kamut® flour Effect of different ingredients on rheological properties of dough Kieffer dough extensibility test
The resistance to extension and extensibility were determined in uniaxial extension mode
using the Kieffer Extensibility Rig in order to evaluate the effect of the addition of oil and
emulsifier on the rheological properties of the doughs.
The three doughs showed significant differences on resistance to extension and extensibility
parameters immediately after mixing (Table 4.11). Control dough (CTR T0) showed higher
value of resistance to extension respect to the doughs supplemented by emulsifier and olive
oil (EMU T0 and OIL T0 respectively). Thus, addition of oil or emulsifier appeared to
decrease the strength of the doughs. Similar observations on wheat flour dough samples were
made by Indrani and Venkkateswara (2007).
The resistance to extension was modified by lecithin addition which decreased this parameter
values in comparison to control dough. This result confirmed the weakening effect described
for lecithins (Gómez, M. et al., 2004; Stampfli, L. et al., 1996).
Moreover incorporation of these ingredients resulted in a more extensible dough as indicated
by the higher values of extensibility at max (EMU T0 = 40.09 mm and OIL T0 = 42.24 mm)
when compared to the control value (CTR T0 = 37.55 mm).
Texture profile analysis
According to TPA results reported in Table 4.11 there is a clear effect of emulsifier on dough
rheological properties.
Dough cohesiveness of the doughs decreased with oil (0.78) and emulsifier (0.69) addition
when compared to the control value (0.80). However the decrease was greater for the dough
containing emulsifier. Similar observations were made by Indrani (2007) on wheat flour
dough samples with the addition of oil.
135

136
Effect of fermentation process and cold storage on rheological properties Fermentation process
Fermentation process induced a significant fall of resistance to extension only in the sample
prepared with oil (Table 4.11). All the samples showed a decrease of extensibility indicating
that the samples after 4 hours of leavening became less extensible.
The sample with oil showed the highest value of extensibility. In fact, although the
differences among the samples were not significant, this dough was the most extensible not
only immediately after mixing (OIL T0 = 42.24 mm) but also after the fermentation process
(OIL L4 = 22.92mm).
Furthermore the sample CTR showed the highest value of resistance to extension (force)
(CTR T0 = 32.65g and CTR L4 = 38.78g ).
TPA results showed certain textural changes that took place over the fermentation time in the
dough differently formulated (Table 4.11). In particular the hardness of the samples prepared
with oil and emulsifier fell with fermentation time. The decrease in hardness values was
greater for the dough containing emulsifier than for the others samples; after 4 hours the
sample prepared with oil was the less hard (OIL L4 = 41.86 N).
These results are in agreement with those found for the parameter resistance to extension
obtained by the Kieffer test, in which sample prepared with oil was the less resistant to the
extension.
The resilience accounted for an increase of its value over the fermentation time. Furthermore
in the dough with oil resilience showed the lowest value both after mixing (OIL T0) and after
4 hours of fermentation (OIL L4).
Adhesiveness values decreased significantly for all the samples over the leavening time
indicating easier machinability. Finally there were no differences among the samples after 4
hours of leavening.

Characteristic Dough type and leavening time (hours) CTR EMU OIL T0 L4 T0 L4 T0 L4 Kieffer test RESISTANCE TO EXTENSION (g) 32.65bA 38.78aA 28.57bB 34.69aB 28.57aB 26.53bC EXTENSIBILITY AT BREAK (mm) 37.55aB 21.47bA 40.09aAB 22.08bA 42.24aA 22.92bA AREA (g·mm) 958.16aA 562.24bA 928.57aA 527.55bA 989.79aA 417.35bB Texture Profile Analysis HARDNESS (N) 51aB 51aA 79aA 46bAB 54aB 42bB
COHESIVENESS (adimensional) 0.80aA 0.68bB 0.69aB 0.72aAB 0.78aA 0.75aA
RESILIENCE (adimensional) 0.05bA 0.07aAB 0.05bA 0.07aA 0.04bB 0.07aB
GUMMINESS (N) 41aB 34bA 54aA 33bA 42aB 31bA
ADHESIVENESS (N·s) 194aB 163bA 234aA 174bA 208aB 165bA
CTR=control dough; EMU=dough with emulsifier; OIL=dough with extra virgin olive oil. Mean values for each characteristics within each dough type annotated by the same lower case letter are not significantly different (P<0.05). Mean values for each characteristics within each time annotated by the same upper case letter are not significantly different (P<0.05).
Table 4.11 Effect of different ingredients and of fermentation time on empirical rheological properties of dough.
137
Cold storage
In order to study the changes in dough extensibility induced by the cold storage, the Kamut®
doughs were prepared adopting the same recipe described above and successively they were
subjected to refrigeration at 4°C for 24 and 48 hours. Results, showed in Table 4.12,
evidenced significant differences for all the parameters for fresh sample (CTR T0, EMU T0,
OIL T0) compared to the samples analysed after 24 and 48 hours of storage. Between 24 and
48 hours of storage there were not significant differences with the exception of resistance to
extension for the sample with emulsifier. The resistance to extension increase, after 24 hours
of cold storage, is probably due to the development of gluten network. Sample with emulsifier
was less resistant to extension (after 48 hours) than the other doughs, while the extensibility
decreased for all the stored samples (S24 and S48) compared to the samples analysed
immediately after mixing (T0).
After 48 hours of storage, dough containing oil (OIL S48) and emulsifier (EMU S48) were
more extensible and less resistant to extension than control dough (CTR S48). These results
proved the importance of oil or emulsifier addition in order to obtain a dough with better
rheological properties after 48 hours of storage at 4°C.
Moreover we can observe that the positive effect of emulsifiers on dough rheological
properties is maximum after 48 hours of storage at 4°C. In fact after 48 hours samples with
emulsifier and with oil showed lower values of hardness compared with the control dough.
Although immediately after mixing the hardness and gumminess parameters of dough with
emulsifier (EMU T0) accounted for the highest values (Table 4.12), after 48 hours of cold
storage they fell significantly, showing that this dough was softer than control. This result
might be explained by the delayed action of emulsifier.
138

Characteristics Dough type and storage time (hours)
CTR EMU OIL T0 S24 S48 T0 S24 S48 T0 S24 S48 Kieffer test
RESISTANCE TO EXTENSION (g) 32.65bA 55.10aA 54.08aA 28.57cB 56.12aA 43.88bB 28.57bB 48.98aA 45.92aB EXTENSIBILITY AT BREAK (mm) 37.55aB 20.51bB 20.16bB 40.09aAB 21.64bAB 22.05bA 42.24aA 22.86bA 23.14bA AREA (g·mm) 958.16aA 760.20bA 722.45bA 928.57aA 807.14bA 643.88cB 989.80aA 772.45bA 723.47bA Texture Profile Analysis HARDNESS (N) 51cB 63aA 57bA 79aA 52bB 47bB 54aB 48bB 51abB COHESIVENESS (adimensional) 0.80aA 0.68bB 0.70bB 0.69bB 0.73abAB 0.74aAB 0.78aA 0.74aA 0.76aA RESILIENCE(adimensional) 0.05bA 0.07aA 0.08aA 0.05bA 0.07aA 0.07aAB 0.04cB 0.06bB 0.07aB GUMMINESS (N) 41aB 42aA 40aA 54aA 38bB 35bB 42aB 35bB 38abAB
CTR= control dough; EMU= dough with em vulsifier; OIL=dough with extra virgin oli e oil.
ADHESIVENESS (N·s) 194aB 186aA 178aA 234aA 185bA 170bA 208aB 192abA 180bA
Mean values for each characteristics within each dough type annotated by the same lower case letter are not significantly different (P<0.05). Mean values for each characteristics within each time annotated by the same upper case letter are not significantly different (P<0.05). Table 4.12 Effect of cold storage on empirical rheological properties of dough.
139

Microstructure
The objective of the microstructure analysis, performed by SEM, was to elucidate the
eventual relationships between rheological properties and dough microstructure.
The microstructure of control dough (without additives) appeared compacted and
homogeneous (Figure 4.1a) with starch granules closely embedded by gluten matrix. The
microstructure of dough added by the emulsifier appeared quite different (Figure 4.1b). In
fact, after mixing, the starch granules appeared “submerged” in a well compacted matrix and,
differently from Ribotta (2004), with any void amount among granules and gluten network.
Furthermore the addition of olive oil (3%) gave rise to big changes in dough microstructure
(Figure 4.1 c). In particular, starch granules looked embedded in a lax gluten matrix which in
some zones formed flat strands similar to gluten sheets. In general this microstructure is
scarcely uniform.
After the first 24 hours of cold storage, gluten matrix of control dough appeared open and its
strands were thin but still quite uniform (Figure 4.1d). On the other hand gluten matrix of
dough with emulsifier lost its initial packed structure and appeared quite open (Figure 4.1e).
The addition of the olive oil (OIL) induced on cold stored dough a more uniform and porous
microstructure respect to the dough immediately after mixing (Figure 4.1f). In general the
differences among the three doughs observed after mixing step were not so evident after 24
hours of refrigeration.
After 48 hours of cold storage the strands forming gluten network of control dough lost its
uniformity (data not shown). On the other hand the dough EMU and OIL appeared
characterised by flat and short strands maintaining a quite structured matrix
The changes of dough microstructure induced by the fermentation process can be seen in
Figure 4.1 (micrographs g. h. and j).
In particular, after 4 hours of fermentation, the microstructure of control dough (Figure 4.1g)
appeared more expanded and the gluten matrix more extended due to the gas production. On
the other hand, the addition of emulsifier or olive oil (Figure 4.1h and 4.1j respectively)
caused especially in dough added by oil an increase of void fraction (more clear in dough
OIL) due to the CO2 production during leavening process.
Different relationships between textural properties and dough microstructure may be
evidenced. In particular dough microstructure after mixing seemed related to the values
obtained from TPA test. In fact the sample with emulsifier showed a well compacted matrix
probably responsible of the higher value of hardness (78.98 N). Furthermore the decrease in
140

hardness values after the fermentation step evidenced in dough containing emulsifier or oil,
may be associated to the increase of void fraction observed by SEM analysis. Finally in cold
stored samples added by emulsifier, the falling of hardness after 24 hours at 4°C, can be
consistent to the opening of microstructure.
a b c
d e f
g h j
Figure 4.1: SEM micrographs of control dough, dough added by emulsifier and by olive oil:
immediately after mixing (a, b and c for the three doughs respectively); after a 24 hour cold
storage at 4°C (g, h and j for the three doughs respectively); after a 4 hour fermentation
process (d, e and f for the three doughs respectively).
141

CONCLUSIONS
The present study demonstrated that some ingredients are helpful to improve rheological
characteristics of Kamut® dough also when subjected to low temperatures. In particular the
addition of some ingredients may improve the efficiency of dough mixing step (and
consequently the texture of baked product).
The rheological properties of dough were positively influenced by the presence of emulsifiers.
Over the fermentation time the addition of emulsifiers allowed to obtain a more extensible
and less resistant dough. The decrease in hardness values (TPA test) was greater for the dough
containing emulsifier than for the others samples; after 4 hours the sample prepared with oil
showed the lowest hardness value (OIL L4 = 41.86 N).
After 48 hours at 4°C dough containing oil and emulsifier were more extensible and less
resistant to extension than control dough. These results showed the importance of emulsifiers
addition in order to obtain dough with good rheological properties.
This benefit could be particularly useful to small bakeries that usually adopt cold storage to
reduce costs of personnel and, at the same time, they need, after refrigeration, a dough
sufficiently “machinable”.
142

4.5 Dough and bread with ginger powder
In general, literature reported variable detrimental effects on dough handling and bread
quality when fibres or different ingredients are added to wheat flour in sufficient high amount
to ensure human physiological benefits. This because of the significant dilution of the main
endogenous biopolymers – gluten and starch – that govern dough unique viscoelasticity. As a
direct consequence, either rheological measurements or pasting profile are required in order to
properly assess dough viscoelastic and viscometric behaviour. Hardness, cohesiveness,
adhesiveness, storage and loss moduli are widely used for dough macroscopic and molecular
viscoelastic assessment. All mentioned analyses measure those properties that are principally
related to the gluten network (Angioloni, A. and Collar, C., 2008).
Results of rheological measurements on dough Fundamental rheological properties
Doughs δ G’ G” tan δ η* G*
(°) (Pa) (Pa) (Pa·s) (Pa)
Control 28.39a 9267c 5004b 0.54a 1677c 14271c
With 3% of ginger powder 27.78ab 10289bc 5402b 0.53ab 1849bc 15691bc
With 4.5% of ginger powder 27.36ab 10728b 5547b 0.52ab 1922b 16274b
With 6% of ginger powder 26.98b 12878a 6526a 0.51b 2298a 19403a Within column values with the same following letter do not differ significantly from each other (p≤0.05).
Table 4.13 Influence of ginger powder on dough fundamental rheological properties
(frequency sweep) (mean value at 1Hz of frequency).
The results of the frequency sweep test are shown in Table 4.13.
All doughs showed that the elastic modulus (G’) was higher than the viscous modulus (G’’),
indicating that the doughs had a solid, elastic-like behaviour.
Addition of ginger powder decreased the phase angle and increased the elastic modulus,
indicating increased degree of elasticity of the dough that become more elastic and therefore it
143

will be more difficult to laminate. Dough realized with 6% of ginger powder showed
significant differences in terms of G’ and G’’, compared to the others doughs.
Addition of ginger powder increased the complex modulus (G*), indicating increased
resistance to deformation and significant differences were found between control dough and
sample with 6% of ginger powder.
Sample with ginger powder showed an higher value of complex viscosity (η*) compared to
the control dough.
Similar results were found by Daramola and Osanyinlusi (2006) that studied ginger and starch
interactions by using Rapid Visco Analyser (RVA). High peak viscosities of ginger modified
cassava starches in comparisons to the native starch suggest cross linkage of starch molecules
by active components of the ginger root. Cross-linked starch is more resistant to the loss of
viscosity at low pH values than other kinds of starch.
The nature of modification effected by active components of ginger is cross-linking. This
could be due to the bi-functional entities containing an activated double bond as well as
hydroxyl/methoxy phenyl residues present in active ginger components such as gingerol,
dehydroginger-dione and shogaol (Daramola, B. and Osanyinlusi, S.A., 2006).
All the parameters obtained by using a rheometer and an RVA directly or indirectly assess
dough stiffness/thickness characteristics. Storage modulus and phase angle are mainly focused
on gluten related properties while peak viscosity is instead linked to starch features
(Angioloni, A. and Collar, C., 2008).
Viscoelastic properties are closely linked to gluten performance while pasting/gelling profiles
are strongly associated to starch (Dobraszczyk, B.J. and Morgenstern, M.P., 2003). The
observation can be explained on the basis that both fundamental microscopic measurements
and mimetic macroscopic tests take into account not only the performance of the two
individual biopolymers involved in dough structure, but also the functionality derived from
interactions between them (Angioloni, A. and Collar, C., 2008).
144

Empirical rheological properties Kieffer dough extensibility test
Dough Resistance to
extension (g)
Extensibility at break
(mm)
Area
(g·mm)
Control 12.35c 44.35a 132.42b
With 3% of ginger powder 17.88b 34.95c 146.76b
With 4.5% of ginger powder 13.45c 37.97bc 113.53c
With 6% of ginger powder 21.86a 39.27b 192.72a Within column values with the same following letter do not differ significantly from each other (p≤0.05). Table 4.14 Influence of ginger powder on dough empirical rheological properties (Kieffer
test).
Addition of ginger powder strengthened the gluten network as shown by the decrease of the
extensibility suggesting that cross-linking was taking place in the dough. Ginger’s addition, at
the microstructural level, gives rise to a network with a higher density of cross-links. As a
result, a more highly cross-linked network becomes shorter range and therefore sample with
6% of ginger powder shows lower values of extensibility compared to the control dough.
Moreover the sample obtained with the higher level of ginger powder showed the higher
value of resistance to extension and area indicating a sample more resistant to the extension.
These results are in agreement with the increase of G*.
Fibre replacement or new ingredients, such as ginger powder, of flour encompasses a gluten
diluting effect, a disruption of the starch–gluten matrix that force gas cells to expand in a
particular dimension and an increased concentration of insoluble and soluble dietary fibres
leading to a significant changes in dough functional properties as observed by uniaxial
extensional measurements (Angioloni, A. and Collar, C., 2008).
145

Dough stickiness test
Dough Force (g) Area (g·mm)
Control 93.54a 13.27a
With 3% of ginger powder 101.36a 10.08b
With 4.5% of ginger powder 78.47b 9.97b
With 6% of ginger powder 74.16b 6.79c Within column values with the same following letter do not differ significantly from each other (p≤0.05).
Table 4.15 Influence of ginger powder on dough empirical rheological measurements (dough
stickiness).
The addition of ginger powder allows to obtain a dough less sticky. Actually the force value
decreased with the increase of the amount of ginger powder. Consequently the area, index o
work of adhesion, decreased.
This is very important in order to obtain a dough easier to handle.
Anything that gives a weaker dough (less elastic with lower G’ and lower δ) will be measured
as a sticky dough (higher area), suggesting that tack is primarily controlled by a rheological
mechanism (Hoseney, R.C. and Smewing, JO., 1999).
146

Results of measurements on bread Image Analysis
Bread Class 1 Total objects Class 2 Class 3 Class 4
% objects % objects % objects % objects Control 182.04c 62.69a 27.96a 6.65a 2.70ab With 3% of ginger powder 199.14b 62.49a 26.41ab 8.91a 2.18b With 4.5% of ginger powder 199.87b 61.85a 25.50bc 9.13a 3.53a With 6% of ginger powder 217.61a 64.26a 26.21ac 7.38a 2.15b Within column values with the same following letter do not differ significantly from each other (p≤0.05). Table 4.16 Crumb morphological features of different breads with different amount of ginger
powder.
As we can see from the Table 4.16 the majority of pores were small and belonging to the class
1, index of crumb structure fine and uniform.
The increase of ginger powder does not influence the percentage of objects belonging to the
different classes.
Texture Profile Analysis (TPA)
Control
3% of ginger 4.5% of ginger
powder
6% of ginger
powder powder
Hardness (N) 1.39b 1.51b 1.46b 1.89a
Cohesiveness 0.86a 0.87a 0.84b 0.83b
Resilience 0.53b 0.56a 0.53b 0.52b
Springiness 0.996ac 0.998a 0.996bc 0.997ab
Gumminess (N) 1.20b 1.31b 1.23b 1.56a
Chewiness (N) 1.20b 1.30b 1.22b 1.55a
Within row values with the same following letter do not differ significantly from each other (p≤0.05).
Table 4.17 Influence of ginger powder on bread empirical rheological properties (TPA test). The TPA results showed certain textural changes that took place in the dough differently
formulate (Table 4.17). In particular the hardness, gumminess and chewiness of the samples
prepared with higher amount of ginger powder increased, indicating that the sample became
147

more hard. This is in agreement with the lower value of δ and the higher value of G’ obtained
from rheological measurements.
Significant differences were found just on sample with 6% of ginger bread; the same trend
was observed on fundamental rheological measurements on dough.
Therefore we can suppose that the highest amount of ginger powder (6%) changes the textural
characteristics of the samples.
CONCLUSIONS
Small deformation oscillatory measurements and large deformation mechanical tests provided
useful information on the rheological properties of different samples analysed.
The dough with the highest amount of ginger powder (6%) showed the highest value of
elastic modulus (G’) (fundamental rheological measurements) and it was the most resistant to
the extension showing the highest value of force (g) (empirical rheological measurements:
Kieffer test). This sample, after baking, showed the highest values of hardness and gumminess.
Therefore is important to choose an advantageous amount of ginger powder to employ in
formulation in order to obtain an healthy baked goods with good rheological properties as
well. In our experimentation this purpose was reached by the sample with the 4.5% of ginger
powder.
148

4.6 Final products coming from different bakeries Analysis on fresh sample of “Coppia Ferrarese” and “Pane Comune
Romagnolo”
Moisture content and specific volume
Table 4.18 and Table 4.19 show the moisture content and the specific volume of the fresh
sample of “Coppia Ferrarese” and “Pane Comune Romagnolo”.
Sample Moisture content (%) Specific volume
(m3/g)
Crust Crumb
Extremity
Horn-shaped
("cornetti")
A 11.96±0.68 24.09±0.58 7.26±0.57 3.58±0.40
B 10.3±0.58 20.81±0.51 7.98±0.12 4.42±0.19
C 11.93±0.87 21.51±0.23 8.95±0.78 4.01±0.17
D 13.07±0.43 25.9±0.7 6.02±0.76 2.8±0.18
E 11.28±0.8 20.16±0.41 9.87±0.74 4.96±0.73
F 11.6±0.64 23.63±0.71 7.2±0.75 3.44±0.49
G 12.64±0.68 25.32±0.37 9.87±0.81 3.57±0.40
H 11.41±0.63 23.32±0.68 8.66±0.71 3.27±0.98
I 11.36±0.87 19.4±0.3 8.48±0.43 4.79±0.96
Values represent mean of three replicates ± standard deviation.
Table 4.18 Moisture content and specific volume of fresh “Coppia Ferrarese”.
149

Specific volume Sample Moisture content (%)
(m3/g)
Crust Crumb
1 14.3ab 35.6bc 4.23 b
2 12.4c 32.4c 3.86 c
3 12.2c 34.8bc 4.23 b
4 11.2c 34.6bc 5.04 a
5 13.1b 34.5bc 4.08 b
6 13.5b 39.2a 4.29 b
7 15.0b 37.3b 2.62 d
8 13.2c 36.3b 3.83 c
9 13.4bc 37.2b 3.92 c
10 13.6b 32.5c 4.25 b
11 12.7bc 34.4bc 4.92 a
Within column values with the same following letter do not differ significantly from each other (p≤0.05).
Table 4.19 Moisture content and specific volume of fresh “Pane Comune Romagnolo”.
150

Texture Profile Analysis (TPA)
Sample Hardness Cohesiveness Resilience Springiness Gumminnes Chewiness
(N) (N) (N)
A 6.37±0.05 0.50±0.01 0.15±0.01 0.87±0.01 3.14±0.03 2.74±0.02
B 4.61±0.03 0.45±0.02 0.14±0.04 0.90±0.03 2.06±0.04 1.86±0.04
C 6.86±0.04 0.48±0.05 0.14±0.03 0.82±0.06 3.33±0.05 2.74±0.08
D 5.59±0.04 0.44±0.03 0.11±0.07 0.80±0.06 2.16±0.11 1.67±0.09
E 5.59±0.02 0.46±0.07 0.11±0.05 0.83±0.05 2.25±0.08 1.86±0.07
F 5.49±0.03 0.48±0.05 0.15±0.03 0.84±0.04 2.35±0.08 1.96±0.07
G 5.89±0.05 0.54±0.08 0.17±0.09 0.89±0.05 3.14±0.04 2.84±0.03
H 5.68±0.02 0.43±0.02 0.18±0.07 0.94±0.06 2.45±0.09 2.25±0.08
I 5.68±0.02 0.52±0.07 0.16±0.03 0.86±0.03 2.94±0.09 2.55±0.08
Values represent mean of three replicates ± standard deviation.
Table 4.20 Empirical rheological properties obtained from TPA test on “Coppia Ferrarese”
bread.
Sample B showed the lowest value of hardness (4.61 N) and a highest value of springiness
(0.90), while sample C showed the higher value of hardness (6.86 N).
151

Sample Hardness
(N)
Resilience Cohesiveness Springiness Gumminess
(N)
Chewiness
(N) 1 6.82b 0.35c 0.74b 0.93a 4.62c 4.31b 2 21.98a 0.63a 0.68c 0.84c 16.10a 13.70a
3 6.80b 0.53b 0.67c 0.80c 4.34c 3.47c
4 3.33d 0.36c 0.71b 0.88b 1.93e 1.69d
5 4.92c 0.28d 0.61d 0.94a 3.30d 3.09c
6 5.11c 0.43c 0.87a 0.94a 4.92b 4.52b
7 5.97b 0.33d 0.68c 0.91b 3.60d 3.30c
8 6.02b 0.36c 0.68c 0.93a 4.55c 4.24b
9 5.62bc 0.36c 0.67c 0.94a 3.51d 3.30c
10 4.38c 0.23e 0.68c 0.89b 3.60d 3.22c
11 3.36d 0.28d 0.62d 0.94a 2.05e Within column values with the same following letter do not differ significantly from each other (p≤0.05).
1.92d
Table 4.21 Empirical rheological properties obtained by TPA test on “Pane Comune
Romagnolo”.
Specific volume of bread samples is a characteristic quality parameter as it indicates dough
inflating ability and ovenspring (Giannou, V. and Tzia, C, 2007).
In general the greater the product volume the lower will be the hardness value (i.e. it will be
softer).
Sample 4 had the highest value of specific volume (Table 4.19) and as a consequence the
lowest value of hardness (Table 4.21).
All the samples analysed showed similar value of hardness, gumminess and chewiness except
sample 2 that had the highest values of hardness, gumminess and chewiness and one of the
lowest value of the springiness.
These values are in agreement with the lowest moisture content of the sample (Table 4.19), in
fact the increase in firmness is related to the decrease in moisture. Moisture content has been
shown to be inversely proportional to the rate of firming. Bread firmness is caused mainly by
the formation of cross-links between partially solubilised starch and gluten proteins. In bread,
water acts as a plasticizer. When moisture decreases, it accelerates the formation of cross-
links between starch and protein and, thus, the bread firms faster. Therefore, crumb moisture
and firmness are closely related (He, H. and Hoseney, R.C. 1990)
152

However, over one century ago, Boussingault (1852) showed that bread firming occurred
without a loss of water.
The samples were realized in craft bakery and as a consequence were handmade by using
different ingredients in formulation and following different bread making processes. For this
reason, although all the samples analysed belong to the same typology of bread, it is not an
unusual outcome that a sample, sample 2 in this experimentation, showed textural
characteristics clearly different compared to the other samples.
153

Image Analysis
Figure 4.2 Portion of “Coppia Ferraese”’s slices.
CB A
D E F
G H I
Samples Max Area (mm2) Mean Area (mm2) Number of cells Number of cells/cm2
A 7.63 ±2.31 0.35±0.07 202.3±16.05 51
B 14.37±3.86 0.57±0.03 208.5±11.15 52
C 22.33±3.36 0.57±0.10 173.8±17.13 43
D 5.53±1.12 0.39±0.03 292±14.44 73
E 12.59±2.87 0.83±0.04 117.8±11.24 29
F 5.99±1.66 0.27±0.04 251.2±9.43 63
G 3.59±1.40 0.24±0.08 258.5±13.60 65
H 5.12±1.40 0.27±0.04 209.2±9.31 52
I 9.26±2.71 0.61±0.04 148±14.77 37
Values represent mean of three replicates ± standard deviation.
Table 4.22 Crumb morphological features of different sample of “Coppia Ferrarese”. Among the samples, significant differences were found about crumb morphological structure.
Samples D, F and G showed the highest number of cells, the highest cell density (number of
cells/cm2) and the lowest mean area (mm2) indicating a more fine and homogeneous crumb
structure.
154

Figure 4.3 Portion of “Pane Comune Romagnolo”’s slices.
Samples
4 3 21
9
5 8 6 7
10
11
Max Area
(mm2)
Mean Area
(mm2)
Cells number Number of cells
/cm2
1 24.71a 0.51b 133.7c 45c 2 26.40a 1.02a 151.3bc 50b 3 4.29c 0.27c 200.2a 67ab 4 10.94b 0.44bc 179.5b 60b 5 3.80c 0.29c 163.5b 55b 6 29.86a 0.58b 136.2c 45c 7 14.27b 0.56b 147.0bc 49bc 8 7.30bc 0.38c 242.7a 81a 9 5.97bc 0.33c 238.8a 80a
10 12.29b 0.66b 135.0c 46c 11 12.82b 0.80ab 164.0b 55b
Within column values with the same following letter do not differ significantly from each other (p≤0.05).
Table 4.23 Crumb morphological features of different sample of “Pane Comune Romagnolo”. In general significant differences were found among the samples. Samples 3, 8 and 9 showed
a significant higher value of number of cells and number of cells/cm2 compared to the other
samples, indicating a fine crumb structure.
155

Analysis on sample of “Coppia Ferrarese” and “Pane Comune Romagnolo”
after 1 day of storage
Moisture content
Crumb
0
2
4
6
8
10
12
14
16
18
20
22
24
26
28
30
a b c d e f g h i
Samples
Moi
stur
e co
nten
t (%
)
T0 T1
Figure 4.4 Crumb moisture content variation of “Coppia Ferrarese” samples during storage.
Crust
0
2
4
6
8
10
12
14
16
18
20
a b c d e f g h i
Samples
Moi
stur
e co
nten
t (%
)
T0 T1
Figure 4.5 Crust moisture content variation of “Coppia Ferrarese” samples during storage.
156

Crumb
0
5
10
15
20
25
30
35
40
1 2 3 4 5 6 7 8 9 10 11
Samples
Moi
stur
e co
nten
t (%
)
T0 T1
Figure 4.6 Crumb moisture content variation of “Pane Comune Romagnolo” samples during
storage.
Crust
0
2
4
6
8
10
12
14
16
18
20
1 2 3 4 5 6 7 8 9 10 11
Sample
Moi
stur
e c
onte
nt (%
)
T0 T1
Figure 4.7 Crust moisture content variation of “Pane Comune Romagnolo” samples during
storage.
157
Bread staling falls into 2 categories: crust staling and crumb staling. Crust staling is generally
caused by moisture transfer from the crumb to the crust, resulting in a soft, leathery texture
and is generally less objectionable than is crumb staling. Crumb staling is more complex,
more important, and less understood. The firmness of bread varies with position within a loaf,
with maximum firmness occurring in the central portion of the crumb (Gray, J.A. and
Bemiller, J.N. 2003).
Many investigations have examined the phenomenon of crumb-firming, and many theories
have been proposed and discussed in previous reviews (Herz, K.O., 1965; Willhoft, E.M.A.,
1973; Zobel, H.F., 1973; Maga, J.A., 1975; Knightly, W.H., 1977; Kulp, K. and Ponte,
J.G.Jr., 1981; Zobel, H.F. and Kulp, K., 1996).
Water is involved in the following changes in the bread system: drying out, moisture
equilibration between crumb and crust, and moisture redistribution between and among bread
components. Drying out of the bread, as demonstrated by Boussingault (1852), does not
explain staling, but may accelerate reactions leading to staling. Thus, moisture relationships
within the crumb are important considerations when studying bread staling.
As baked bread begins to cool, a moisture gradient forms in the loaf. Differences in vapor
pressures between the crust and the internal region of the loaf result in moisture migration
from the crumb to the crust. Over time, the moisture content in the center of the loaf
decreases, while that in the external region increases (Gray, J.A. and Bemiller, J.N. 2003).
In the Figures 4.4, 4.5, 4.6, 4.7 is possible to see this phenomenon.
Axford (1968) studied the effect of loaf volume on the rate of staling and found that lower
specific volume increased the staling rate and higher specif volume lowered it (Maleki, M. et
al, 1980).
Texture Profile Analysis (TPA)
The TPA test was employed to evaluate the influence of the stailing process on the bread’s
crumb structure.
The analyses was carried out on fresh sample (T0) and on the sample after 1 day of storage at
room temperature (T1). Since this type of bread is for daily consumption, the changes in
textural characteristics were followed during the first 24 hours of storage.
The hardness of the sample analysed increase over the storage time, due to the decrease on the
crumb moisture content (Figure 4.4 and Figure 4.6).
158
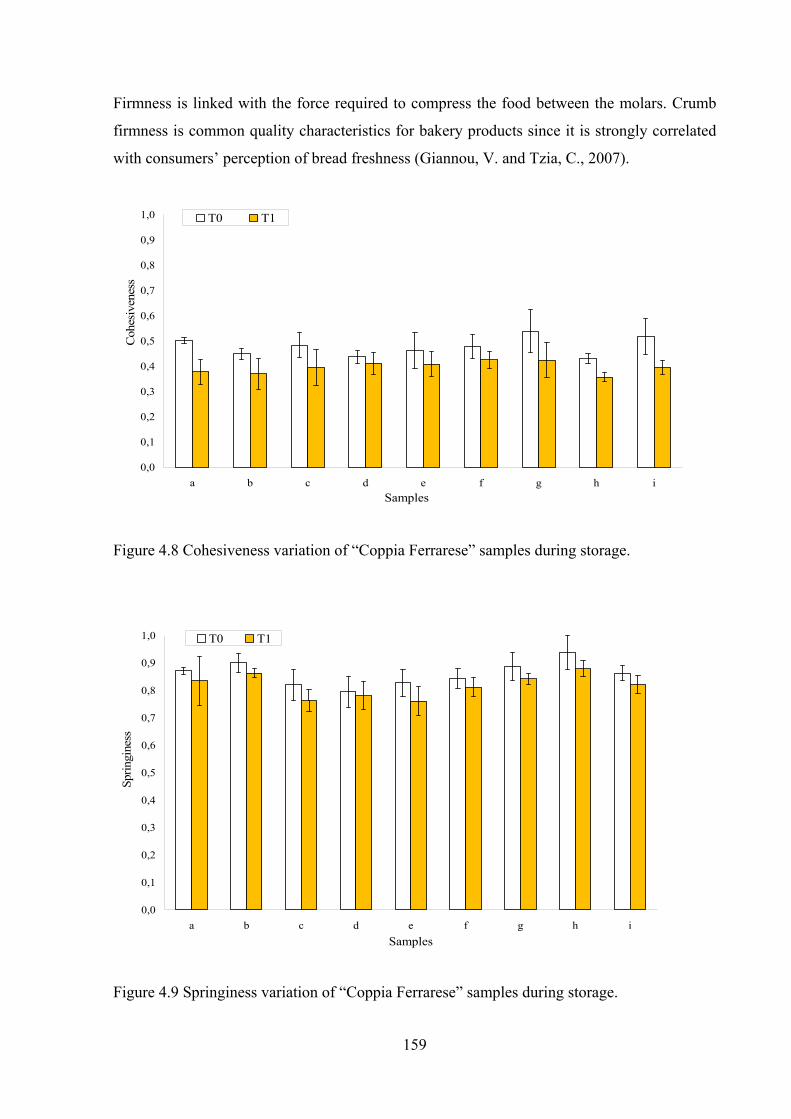
Firmness is linked with the force required to compress the food between the molars. Crumb
firmness is common quality characteristics for bakery products since it is strongly correlated
with consumers’ perception of bread freshness (Giannou, V. and Tzia, C., 2007).
0,0
0,1
0,2
0,3
0,4
0,5
0,6
0,7
0,8
0,9
1,0
a b c d e f g h iSamples
Coh
esiv
enes
s
T0 T1
Figure 4.8 Cohesiveness variation of “Coppia Ferrarese” samples during storage.
0,0
0,1
0,2
0,3
0,4
0,5
0,6
0,7
0,8
0,9
1,0
a b c d e f g h iSamples
Sprin
gine
ss
T0 T1
Figure 4.9 Springiness variation of “Coppia Ferrarese” samples during storage.
159

0,0
0,2
0,4
0,6
0,8
1,0
1 2 3 4 5 6 7 8 9 10 11
Samples
Coh
esiv
enes
s
T0 T1
Figure 4.10 Cohesiveness variation of “Pane Comune Romagnolo” samples during storage.
0,0
0,2
0,4
0,6
0,8
1,0
1 2 3 4 5 6 7 8 9 10 11
Samples
Sprin
gine
ss
T0 T1
Figure 4.11 Springiness variation of “Pane Comune Romagnolo” samples during storage. Parameters such as cohesiveness and springiness, indicator of quality in fresh bread, decrease
during the storage.
As we can see from the figure above in our experiment the values are not always significantly
different and this is probably due to the short period of storage, only 1 day. Similar results
were obtained from Bollain (2005).
160

FILONE TERRA DI SAN MARINO Moisture content and specific volume Time (days) 0 1 2 3 4
Sample 1 37.95 b 36.00 a 35.34 b 32.59 a 30.16 a
Sample 2 39.44 a 38.18 a 36.45 ab 34.31 a 28.99 ab
Sample 3 40.37 a 37.38 a 37.66 a 31.66 a 26.12 b Within column values with the same following letter do not differ significantly from each other (p≤0.05).
Table 4.24 Effect of storage time on crumb moisture content of different samples
Time (days) 0 1 2 3 4
Sample 1 14.90 a 15.98 a 15.94 a 15.20 a 15.01 a
Sample 2 15.90 a 16.72 a 16.69 a 15.58 a 14.69 a
Sample 3 15.91 a 16.65 a 16.52 a
Within column values with the same following letter do not differ significantly from each other (p≤0.05).
Table 4.25. Effect of storage time on crust moisture content of different samples
15.38 a 14.08 a
Time (days) 0 1 2 3 4
Sample 1 4.31 b 4.19 b 4.18 a 4.30 a 3.86 a
Sample 2 4.49 ab 4.47b 4.45 a 4.47 a 4.46 a
Sample 3 5.28 a 5.20a 4.94a 4.91 a 4.45 a
Within column values with the same following letter do not differ significantly from each other (p≤0.05).
Table 4.26 Effect of storage time on specific volume of different samples
161
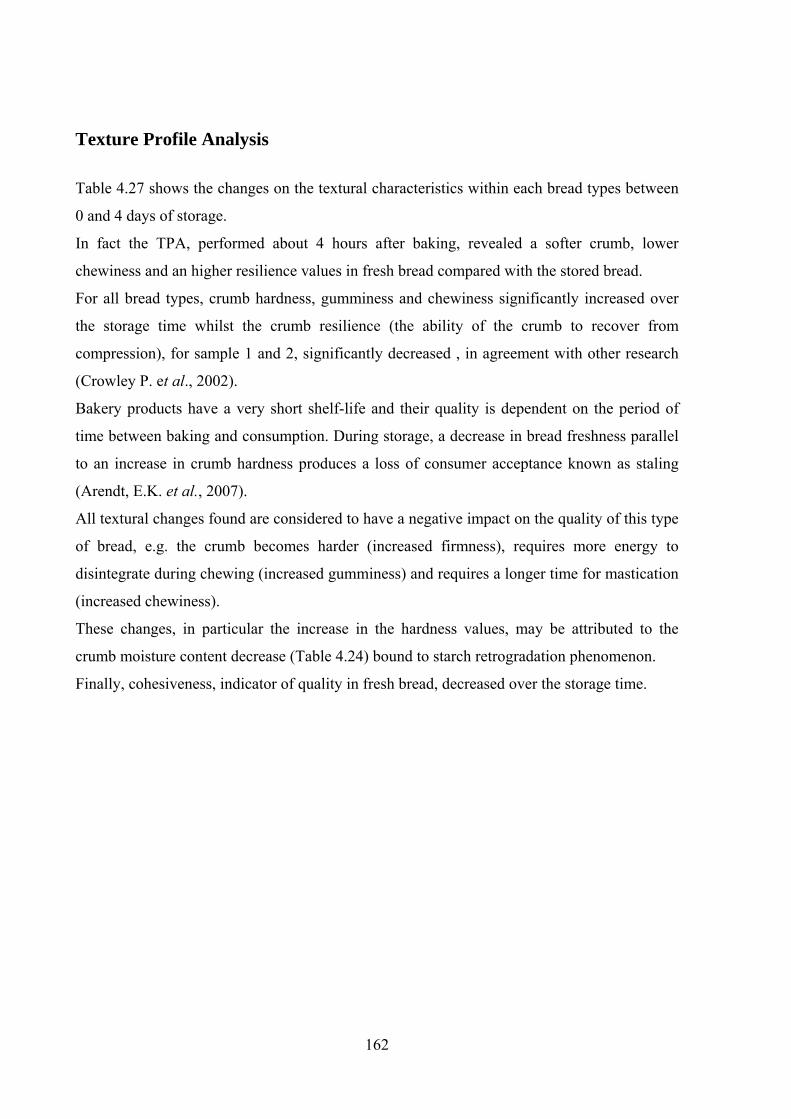
162
Texture Profile Analysis
Table 4.27 shows the changes on the textural characteristics within each bread types between
0 and 4 days of storage.
In fact the TPA, performed about 4 hours after baking, revealed a softer crumb, lower
chewiness and an higher resilience values in fresh bread compared with the stored bread.
For all bread types, crumb hardness, gumminess and chewiness significantly increased over
the storage time whilst the crumb resilience (the ability of the crumb to recover from
compression), for sample 1 and 2, significantly decreased , in agreement with other research
(Crowley P. et al., 2002).
Bakery products have a very short shelf-life and their quality is dependent on the period of
time between baking and consumption. During storage, a decrease in bread freshness parallel
to an increase in crumb hardness produces a loss of consumer acceptance known as staling
(Arendt, E.K. et al., 2007).
All textural changes found are considered to have a negative impact on the quality of this type
of bread, e.g. the crumb becomes harder (increased firmness), requires more energy to
disintegrate during chewing (increased gumminess) and requires a longer time for mastication
(increased chewiness).
These changes, in particular the increase in the hardness values, may be attributed to the
crumb moisture content decrease (Table 4.24) bound to starch retrogradation phenomenon.
Finally, cohesiveness, indicator of quality in fresh bread, decreased over the storage time.

Parameters Samples and time of storage (days)
Sample 1 Sample 2 Sample 3
0 1 2 3 4 0 1 2 3 4 0 1 2 3 4
Hardness (N) 16.1c 33.0b 42.5b 62.5a 72.7a 12.8c 19.9c 39.4b 46.7b 66.3a 13.3c 25.8bc 32.7b 76.5a 78.0a
Resilience 0.24a 0.14b 0.11c 0.11c 0.09c 0.27a 0.17ab 0.11b 0.23ab 0.09b 0.23a 0.16a 0.15a 0.11a 0.22a
Cohesiveness 0.53a 0.38b 0.31cd 0.33bc 0.29d 0.51a 0.40b 0.33c 0.32c 0.29c 0.50a 0.44b 0.36c 0.32d 0.32cd
Gumminess(N) 8.43c 12.45b 12.94b 20.00a 20.97a 6.57c 7.84c 12.74b 15.0b
18.82a 6.47c 10.98bc 11.96b 24.79° 25.3a
Chewiness (N) 8.43c 12.45b 12.94b 20.00a 20.97a 6.86c 8.04c 12.84b 15.39ab 18.82a 6.67c 10.98c 12.05b 24.01a 25.09a
Mean values for each parameter within each sample annotated by the same letter are not significantly different (P<0.05)
Table 4.27 Changes in texture within each bread type between 0 and 4 days storage.
163
The Table 4.28 shows the differences in texture among bread types within each storage time.
It is commonly know that the addition of sourdough had a significant impact on the textural
characteristics of the bread. Application of sourdough in bread production has several
documented effects including leavening, acidification, improvement of aroma, anti-stailing,
delayed firmness and staling and microbiology stability (Crowley, P. et al., 2002).
Bread made with sourdough keep the crumb softer over a longer time than a sample made
without sourdough; unfortunately this was not supported with our results.
In fact samples 1 and 3, realized with sourdough, showed at the last day of control an higher
value of hardness, even if the differences are not significant, compared to the sample 2
realized with sponge-dough process.
This result may be attributed to a not optimally management of the sourdough ( storage at not
optimal temperature, etc.).
164

Parameters Storage time (days) and bread type
0 1 2 3 4
1 2 3 1 2 3 1 2 3 1 2 3 1 2 3
Hardness (N) 16.4a 13.1b 13.6ab 33.7a 20.3b 26.3b 43.4a 40.2ab 33.4b 63.8ab 47.7b 78.1a 74.2a 67.7a 79.6a
Resilience 0.24a 0.27a 0.23a 0.14a 0.17a 0.16a 0.11b 0.11b 0.15a 0.11a 0.23a 0.11a 0.09a 0.09a 0.22a
Cohesiveness 0.53a 0.51a 0.50a 0.38b 0.40b 0.44a 0.31b 0.33b 0.36a 0.33a 0.32a 0.32a 0.29b 0.29b 0.32a
Gumminess (N) 8.6a 6.7b 6.6b 12.7a 8.0b 11.2a 13.3a 13.1a 12.2a 20.4ab 15.3b 24.6a 21.4a 19.2a 25.3a
Chewiness (N) 8.6a 7.0ab 6.8b 12.07 8.2a 11.2b 13.2ab 13.1a 12.3a 20.4ab 15.8b 24.5a 21.4ab 19.2b 25.6a Mean values for each characteristics within each time annotated by the same letter are not significantly different (P<0.05).
Table 4.28 Differences in texture among bread types within each storage time.
165

CONCLUSIONS
Moisture content, specific volume, texture and crumb grain characteristics are the major
quality attributes of bread products. Instrumental methods for measuring textural properties
are widely used as tools for the objective measurement of texture properties. Digital image
analysis is a relatively new, non-destructive technique that can be used for the evaluation of
crumb grain structure given integrative information to rheological measurements.
The TPA test was useful to characterize and differentiate different bread samples.
Bread rapidly loses freshness, it is subjected to mould spoilage and its limited shelf-life has an
important economical impact on the baking industry and consumers. Changes in flavour and
texture taking place during storage are common called staling. This phenomenon which
makes the product dry and hard is frequently attributed to starch retrogradation, which is
considered as the main factor responsible for the observed increase in crumb firmness during
storage.
Numerous compressibility methods have been developed to quantify the firming of bread,
which has been shown to correlate with bread staling as measured by consumer acceptability.
Hence, compressibility measurements are most commonly used to determine the degree of
bread staleness (Gray, J.A. and Bemiller, J.N., 2003).
Hardness, for example, which has been determined successfully by using a texture analyser by
using a TPA test, is often used as a measure of bread staling.
The different sample analyzed, “Coppia Ferrarese”, “Pane Comune Romagnolo” and “Filone
Terra di San Marino”, showed a decrease of crumb moisture and increase in hardness over the
storage time.
Parameters such as cohesiveness and springiness, evaluated by TPA, indicator of quality in
fresh bread, decreased during the storage.
In our test the cohesiveness decreased over the storage time for all the samples analyzed.
By using empirical rheological test we found several differences among the samples, due to
the different ingredients used in formulation and the different process used to prepare the
sample, but since these products are handmade, the differences could be account as a surplus
value.
166
CONCLUSIONS
Empirical tests are easy to perform and often used in practical factory situations, providing
data that are useful in evaluating performance during processing and for quality control.
These measurements are not strictly “rheological” tests since: the sample geometry is variable
and not well defined; the stress and strain states are uncontrolled, complex and non-uniform
and it is not possible to define any rheological parameters such as stress, strain, strain rate,
modulus or viscosity. Instead with fundamental rheological approach the properties that are
measured are reproducible and can be compared between different samples, test sizes and
shapes, and test methods, while the empirical measurements are purely descriptive and
dependent on the type of instrument, size and geometry of the test sample and the specific
conditions under which the test was performed. In order to study the structural aspects of food
products, image analysis techniques are largely used for the integration of the information
coming from empirical and fundamental rheological measurements.
During the Ph.D. activity, these techniques have been applied to dough and breads differently
formulated and processed. The main results obtained of the different aspects investigated are
following reported:
Small deformation (in fundamental units) and large deformation methods were used in order
to evaluate the influence of sub-zero storage time on non fermented and on fermented dough
viscoelastic performances. The frozen storage period had a significant effect on dough
hardness, springiness, adhesiveness (evaluated by TPA); extensibility and resistance to
extension (obtained by Kieffer test) and on storage and loss modulus. In terms of fundamental
and empirical rheological properties, the longer the sub-zero storage time the lower the
positive viscoelastic attributes.
Different types of fermentation (straight dough, sponge and poolish method) had a clear effect
on the final rheological characteristics of dough. The fermenting dough is a complex and
continuously evolving dynamic system requiring quick measurement techniques and for this
reason, even if yeast plays a crucial role in breadmaking, almost all empirical and
fundamental rheological testing and studies are conducted on doughs formulated without
yeast. In this part of the research fundamental measurements were applied on yeasted dough;
to try to avoid or at least to minimize the influence of the fermentation process, a shorter test
was applied on the samples with yeast compared to the test carried out on samples without
167
yeast. Fundamental rheological measurements evidenced that the incorporation of sourdough
(poolish method) provoked remarkable dough changes. Actually dough obtained with poolish
method showed the lowest storage modulus (G’) after mixing and the highest phase angle (δ)
after 60 min of fermentation, compared with doughs obtained with straight dough and sponge
methods.
The experimentation on dough made by Kamut® flour demonstrated that some ingredients are
helpful to improve rheological characteristics of the dough also when subjected to low
temperatures. In particular the addition of some ingredients may improve the efficiency of
dough mixing step (and consequently the texture of baked product). The rheological
properties of dough were positively influenced by the presence of emulsifiers; after 48 hours
at 4°C dough containing oil and emulsifier were more extensible and less resistant to
extension than control dough. Interesting relationships were found between textural properties
obtained by using TPA test and dough microstructure evaluated by using SEM.
Detrimental effects on dough handling and bread quality when fibres or different ingredients
are added to wheat flour in sufficient high amount to ensure human physiological benefits,
were found in the literature. This because of the significant dilution of the main endogenous
biopolymers – gluten and starch – that govern dough unique viscoelasticity. Rheological
measurements were applied in order to properly assess dough viscoelastic behaviour as a
function of different ginger powder concentrations. The rheological measurements on dough
showed that the samples realized with the highest amount of ginger powder (6%) was the
most elastic (highest value of G’), and the most resistant to the extension (highest value of
force from Kieffer test). This sample, after baking, showed the highest values of hardness and
gumminess evaluated by using TPA test; test conditions were chosen in order to measure
mainly uniaxial compression forces.
The study of commercial handmade products (realized in small bakaries) evidenced that
empirical rheological tests are really useful to study structural modifications bound to the
different ingredients used in formulation and processing conditions.
More in general the knowledge of formulation, processing and storage conditions together
with the evaluation of structural and rheological characteristics is fundamental for the study of
complex matrices like bakery products, where numerous variable can influence their final
quality (e.g. raw material, bread-making procedure, time and temperature of the fermentation
and baking).
168

REFERENCES
Angioloni, A. and Collar, C., 2008. “Functional response of diluited dough matrixes in high-
fibre systems:A viscosimetric and rheological approach”. Food Reserch International 41, 803-
812.
Angioloni, A. and Collar, C., 2009.“Small and large deformation viscoelastic behaviour of
selected fibre blends with gelling properties” Food Hydrocollids 23, 742-748.
Angioloni, A., 2005. “Proprietà reologiche degli impasti ottenuti con Triticum dicoccum
Schübler e Triticum Spelta L. Valutazione con il microestensografo Kieffer. Tecnica
Molitoria 6, 605-610.
Angioloni, A., Balestra, F., Pinnavaia, G.G. and Dalla Rosa, M., 2008. “Small and large
deformation tests for the evaluation of frozen dough viscoelastic behaviour”. Journal of Food
Engineering, 87, 527-531.
Angioloni, A., Romani, S., Pinnavaia, G.G. and Dalla Rosa, M., 2006. “Characteristics of
bread making doughs: influence of sourdough fermentation on the fundamental rheological
properties”. European Food Research and Technology, 222, 54-57.
Arendt, E.K., Liam A.M. Ryan and Dal Bello, F., 2007. “Impact of sourdough on the texture
of bread. food microbiology”. Food Microbiology, 24, 165-174).
Armero E. and Collar C., 1997. “Texture properties of formulated wheat doughs. Relationship
with dough and bread technological quality”. Z Lebensm unters Forsch A 204, 136-145
Autio, K. and Laurikainen, T., 1997. “Relationships between flour/dough microstructure and
dough handling and baking properties- Review”. Trends in food research & technology, 8,
181-185.
169

Autio, K. and Sinda, E., 1992. “Frozen doughs: rheological changes and yeast viability”.
Cereal Chemistry 69 (4): 409–413.
Axford D.W.E., Colwell, K.H., Cornford, S.J. and Elton, G.A.H., 1968. “Effect of loaf
specific volume on the rate and extent of staling in bread” Journal of the science of food and
agriculture, 19, pp 95-101.
Baker, J.C. and Mize, M.D., 1941.”The origin of the gas cell in bread dough”. Cereal
Chemistry, 18, January., 19–34.
Baker, J.C. and Mize, M.D., 1941.”The origin of the gas cell in bread dough”. Cereal
Chemistry, 18, January., 19–34.
Barber, B., Benedito de Barber, C. and Planells, V., 1980. “ The sponge for breadmaking. Its
influence on the rheological and fermentative characteristics of wheat flour doughs”. Rev.
Agroquim. Technol. Aliment., 20, 403.
Barnes, H.A., Hutton, J.F. and Walters, K., 1989. “An Introduction to Rheology”, Elsevier.
Bellido, G.G., Scanlon M.G., Page, J.H., Benedikt Hallgrimsson, 2006. “The bubble size
distribution in wheat flour dough” Food Research International 39, 1058-1066.
Bhattacharyaa, M., Langstaffa Tami, M. and Berzonskyb, W.A., 2003. “Effect of frozen
storage and freeze–thaw cycles on the rheological and baking properties of frozen doughs”.
Food Research International, 36, 365-372.
Bloksma, A.H. and Bushuk, W., 1988. “Rheology and chemistry of dough”. In Wheat:
Chemistry and Technology, 3rd Ed., Volume 11, (Y. Pomeranz, ed.) pp. 131-217, American
Association of Cereal Chemists, St. Paul, Minnesota.
Bloksma, A.H., 1962. “Slow creep of wheat flour doughs”. Rheologica Acta 2,217-230.
Bloksma, A.H., 1990. “Rheology of the bread making process”. Cereal Foods World 35(2),
228-236, 959-960.
170
Bollaìn, C., Angioloni, A. and Concepciòn, C., 2005. “Bread staling assessment of enzyme-
supplemented pan breads by dynamic and static deformation measurements”. European Food
Reserch Technology, 220, 83-89.
Bourne, M.C., 1968. “Texture Profile of ripening pears”. Journal of Food Science. 33, 223-
226
Bourne, M.C., 1978. “Texture Profile Analysis”. Food Technology. 32 (7), 62-66, 72.
Bourne, M.C., Moyer, J.C. and Hand., D.B., 1966. “Measurement of food texture by a
Universal Testing Machine”. Food Technology 20(4), 522-526.
Boussingault J.B., 1852. “De la transformation du pain tender en pain rassis” Ann Chem.
Phys. 3 Ser. 36, p.490
Breene, W.M., 1975. “Application of texture profile analysis to instrumental food texture
evaluation”. Journal Texture Studies 6, 53-82.
Brosnana, T. and Sun, D-W., 2004.”Improving quality inspection of food products by
computer vision – a review. Journal of Food Engineering 61, 3-16.
Calzada, J.F. and Peleg, M., 1978. “Mechanical interpretation of compressive stress-strain
relationships of solid foods”. Journal Food Science 43, 1087-1092
Carter, R.E., 1990. “Rheology of Food, Pharmaceutical and Biological Materials with General
Rheology”, Elsevier Applied Science, London.
Casutt, V., Preston, K.R. and Kilborn, R.H., 1984. “Effects of fermentation time, inherent
flour strength and salt level on extensigraph properties of full-formula remix-to-peak
processed doughs. Cereal Chemistry, 61, 454.
Cauvain, S.P. and Young, L.S., 2006. “The Chorleywood Bread Process” Eds. Cauvain, S.P.
and Young, L.S, CRC Press Boca Raton Boston New York Washington DC. pp. 17-23; pp.
24-39.
171

Cauvain, S.P., 1996. “The freezing and Retarding of Fermented Dough”. CCFRA Review No.
3; March
Cauvain, S.P., 2001. “Breadmaking”. In (Eds. Gavin Owens), Cereals processing technology
CRC press Boca Raton Boston New York Washington, DC.
Cauvain, S.P., 2003. “Breadmaking-an overview”. In (Eds. S.P. Cauvain), Bread making-
Improving quality. CRC press Boca Raton Boston New York Washington, DC.
Cauvain, S.P., 2004. “Improving the texture of bread”. In (Eds. David Kilcast) Texture in
food- Volume2: Solid Foods CRC press Boca Raton Boston New York Washington, DC.
Chamberlain, N., Collins, T.H. and Elton, G.A.H., 1961. “The Chorleywood Bread Process“.
BBIRA Report 59, CCFRA, Chipping Campden, Gloucestershire.
Chen, W.Z. and Hoseney, R.C., 1995a. “Development of an objective method for dough
stickiness”. Lebensm.-Wiss. U.-Technol. 28, 467-473.
Chen, W.Z. and Hoseney, R.C., 1995b. “Wheat flour compound that produces sticky dough:
isolation and identification”. Journal Food Science. 60, 434-437.
Claassens, S.W., 1958. “The adhesion-cohesion, static friction and macrostructure of certain
butters. 1.A method of measuring the adhesion-cohesion of butter”. S. Afr. J. Agric. Sci. I,
457-463.
Claassens, S.W., 1959a. “The adhesion-cohesion, static friction and macrostructure of certain
butters. 11. Factors affecting the values recorded with the hesion balance”. S. Afr. J. Agric.
Sci. 2. 89-1 18.
Claassens, S.W., 1959b. “The adhesion-cohesion, static friction and macro structure of certain
butters. 111. An apparatus for measuring the apparent coefficient of static friction of butter”.
S. Aff. J. Agric. Sci. 2, 247-254.
172

Claassens, S.W., 1959c. “The adhesion-cohesion, static friction and macrostructure of certain
butters. IV. Factors affecting static friction rneasurements of butter”. S. Afr. J. Agric. Sci. 2,
387-408.
Collar, C., Andreu, P., Martinex, J.C. and Armero, E., 1999. “Optimization of hydrocolloid
addition to improve wheat bread dough functionality: a response surface methodology study.
Food Hydrocolloids 13 (6), 467-475.
Collins, T.H., Overton, M.J., Redman, B.I., Roberts, J.A. and Smith, M.J., 1968. “A summary
of breadmaking processes”. FMBRA Report 13, CCFRA, Chipping Campden,
Gloucestershire.
Crowley, P., Schober, T.J., Clarke, C.I. and Arendt, E.K., 2002. “The effect of storage time on
textural and crumb grain characteristics of sourdough wheat bread”. European Food Reserch
Technology, 214, 489-496.
Daramola, B. and Osanyinlusi, S.A., 2006. “Investigation on modification of cassava starch
using active components of ginger roots (Zingiber officinale Roscoe). Africa Journal of
Biotechnology, Vol. 5 (10), 917-920.
Deshpande, S.S. and Bhattacharya, K.R., 1982. “The texture of cooked rice”. Journal Texture
Studies 13, 31-42.
Dhaliwal, A.S., Mares, D.J. and Marshall, D.R. 1990. “Measurement of dough surface
associated with the lB/lR chromosome translocation in bread wheats”. Journal of Cereal
Science. 12, 165-175.
Dhaliwal, A.S., Mares, D.J., Marshall, D.R. and Skerritt, J.H., 1988. “Protein composition and
pentosan content in relation to dough stickiness of lB/lR translocation wheats”. Cereal
Chemistry. 65, 143-149.
Dobraszczyk, B.J. and Morgenstern, M.P., 2003. “Rheology and breadmaking process”.
Journal of Cereal Science 38, 229-245.
173

Dobraszczyk, B.J. and Vincent, J.F.V., 1999. “Measurement of mechanical properties of food
materials in relation to texture: the materials approach”. In Food Texture: measurement and
perception (A.J. Rosenthal, ed.), Aspen Publishers, MD, USA.
Dobraszczyk, B.J., 1997. “The rheological basis of dough stickiness”. Journal Texture Studies
28, 139-162.
Dobraszczyk, B.J., 2003. “Measuring the rheological properties of dough”. In (Eds. S.P.
Cauvain), Bread making-Improving quality. CRC press Boca Raton Boston New York
Washington, DC.
Dobraszczyk, B.J., Campbell, G.M. and Gan, Z., 2001. “Bread: a unique food”. In: Cereal
and cereal products. Chemistry and technology, (edited by A.V. Dendy & B. Dobraszczyk)
Drake, B., 1966. “Advances in the determination of texture and consistency of foodstuffs”.
pp. 277-287, Proc. 2nd. Int. Congress Food Sci. Technol., Warsaw, Poland.
Du, C-J. and Sun, D-W., 2006. “Learning techniques used in computer vision for food quality
evaluation: a review. Journal of Food Engineering, 72, 39-55.
Dunnewind, B., Sliwinski, E.L., Grolle, K. and Van Vliet, T., 2004. “The kieffer dough and
gluten extensibility rig- an experimental evaluation”. Journal Texture Studies 34, 537-560.
Faridi, H. and Faubion, J.M., 1986. “Fundamentals of Dough Rheology”, American
Association of Cereal Chemists, St. Paul, MN, USA.
Faridi, H. and Faubion, J.M., 1990. “Dough Rheology and Baked Product Texture”, AVI Van
Nostrand Reinhold, New York.
Ferry, J.D., 1980. “Viscoelastic Properties of Polymers”, John Wiley and Sons.
Fiszman, S.M. and Damasio, M.H., 2000. “Instrumental measurement of adhesiveness in
solid and semi-solid foods. a survey”. Journal of Texture Studies 31, 69-91.
Freilich, J. and Frey, C.N., 1939. “ Dough oxidation and mixing studies. II Effects of
remixing after fermentation. Cereal Chemistry, 16, 495.
174
Friedman, H.H., Whitney, J.E. and Szczesniak, AS., 1963. “The Texturometer: a new
instrument for objective texture measurement”. Journal of Food Science 28, 390-396.
Gàmbaro, A., Varela, V. and Gimenèz, A., 2002. “ Textural quality of white pan bread by
sensory and instrumental measurements”. Journal of Texture studies 33, 401-413.
Gan, Z., Ellis, P.R. and Schofield, J.D., 1995. “Gas cell stabilisation and gas retention in
wheat bread dough”. Journal of Cereal Science 21, 215-230.
Gélinas, P., Deaudelin, I. and Grenier, M., 1995. “Frozen dough: effects of dough shape,
water content, and sheetingmolding conditions”. Cereal Foods World 40 (3):124–126, 1995.
Giannou, V. and Tzia, C., 2007. “Frozen dough bread: quality and textural behaviour during
prolonged storage – prediction of final product characteristics”. Journal of Food Engineering
79 (3), 929–934.
Giannou, V., Kessoglou and V., Tzia, C., 2003. “Quality and safety characteristics of bread
made from frozen dough”. Trends in Food Science and Technology 14, 99–108.
Giannou,V., Tzia and C., Le Bail, A., 2006. “ Quality and safety of frozen Bakery Products”.
In (Eds. Da-Wen Sun) Handbook of frozen food processing and packaging. CRC
Taylor&Francis Group Boca Raton London New York.
Gómez, M., Del Real, S., Rosell, C.M., Ronda, F., Carlos, A.B. and Caballero, P.A., 2004.
“Functionality of different emulsifiers on the performance of breadmaking and wheat bread
quality”. Europen Food Research and Technology 219, 145-150.
Gore, P.J., 1991. “An update on sticky doughs”. In Cereals International Proceedings, Sept. 9-
13, (D.J. Martin and C.W. Wrigley, eds.) pp. 228-230, Brisbane, Australia.
Grausgruber, H., Schoggl, G. and Ruckenbauer, P., 2002. “Investigations on the validity of
the micro-extensigraph method to measure rheological properties of wheat doughs”.
European. Food Reserch Technology, 214,79-82
175

Gray, J.A. and Bemiller, J.N., 2003. “Bread staling.molecular basis” and control”.
Comprenshive reviews in food science and food safety, Vol.2, 1-21.
Gunasekaran, S., 1996. “Computer vision technology for food quality assurance”. Trends in
Food Science and Technology, 7(8), 245–256.
Hammond JR., F.R., 1989. Tack. In Handbook of Pressure Sensitive Adhesives Technology,
(D. Satas, ed.) Van Nostrand Reinhold, New York.
Haridas-Rao, P.H., Leelavathi, K. and Shurpalekar, S.R. 1989. “Effect of damaged starch on
the chapati-making quality of whole wheat flour„ Cereal Chemistry. 66, 329-333.
Havet, M. and LeBail, A. “Frozen bread dough: impact of the freezing rate and the storage
duration on gassing power”. In: Proceedings of the Workshop on Process Engineering of
Cereals. France: Montpellier, October 8, 1999.
Havet, M., Mankai, M. and Le Bail, A., 2000. “Influence of the freezing condition on the
baking performances of French frozen dough”. Journal of Food Engineering 45, 139–145.
He, H. and Hoseney, R.C. 1990. “ Changes in bread firmness and moisture during long term
storage” Cereal Chemistry 67 (6), 603-605.
He, H. and Hoseney, R.C., 1991. “Gas retention of different cereal flours”. Cereal Chemistry,
68, 334-336.
Heddleson, S.S., Hamann, D.D. and Lineback, D.R., 1993. “The Dahlquist criterion:
applicability of a rheological criterion to the loss of pressure-sensitive tack in flour-water
dough”. Cereal Chemistry. 70, 744-748.
Heddleson, S.S., Hamann, D.D., Lineback, D.R. and Slade, L., 1994. “Pressure-sensitive
adhesive properties of wheat flour dough and the influence of temperature, separation rate and
moisture content”. Cereal Chemistry. 71, 564-570.
Henry, W.F., Katz, M.H., Pilgrim, F.J. and May, A.T., 1971. “Texture of semi-solid foods:
sensory and physical correlates”. Journal Food Science 36, 155-161.
176

Herz, K.O., 1965. “Staling of bread: A review“. Food Technology 19, 1828.
Holland, D., 1994. Letter to the editor: which is more critical-the stress or the strain. Journal
Rheol. 38, 1941-1943.
Hoseney, R.C. and Chen, W.Z., 1994. “Adhesion testing apparatus and method for flowable
materials such as wheat dough”. U.S. Patent 5,280.
Hoseney, R.C. and Smewing, JO., 1999. “Instrumental measurement of stickiness of doughs
and other foods”. Journal of Texture Studies 30, 123-136.
Hoseney, R.C., 1994. “Principles of Cereal Science and Technology”. Second Edition.
Published by the American Association of Cereal Chemists, Inc. St. Paul, Minnesota, USA.
Hoseney, R.C., Rogers, P.F., Krishnarau, L. and Chen, W.Z., 1990. “Factors affecting the
stickiness of wheat flour doughs”. pp. 338-343, Fifth International Symposium on PreHarvest
Sprouting in Cereals. Westview Press. Boulder.
Hsi-Mei, L. and Tze-Ching, L., 2006. “Bakery products”. In (Eds.Y. H. Hui), Handbook of
food science, technology, and engineering. CRC press Taylor and Francis Group, Boca Raton
London New York.
Hsu, K., Hoseney, R. and Seib, S., 1979. “Frozen dough. I. Factor affecting the stability of
yeasted doughs”. Cereal Chemistry 54, 419–424.
Huang, W.N. and Hoseney, R.C., 1998. “Isolation and identification of a wheat flour
compound causing sticky dough”. Cereal Chemistry. 76,276-28 1.
Hwang, P. and Bushuk, W., 1973. “Some changes in the endosperm proteins during sprouting
of wheat”. Cereal Chemistry. 50, 147-160.
Ibrahim, Y. and D’appolonia, B.L., 1979. “Sprouting in hard red spring wheat”. Baker’s
Digest 53(5), 17-19.
Ikezoe, K. and Tipples, K.H., 1968. “Farinograph studies on the effect of various oxidizing
agents in the sponge-and-dough system. Cereal Science Today, 13, 327.
177

Indrani, D. and Venkkateswara Rao, G., 2007. “Rheological characteristicsof wheat flour
dough as influenced by ingredients of parotta”.Journal of Food Engineering 79, 100-105.
Inoue, Y. and Bushuk, W., 1991. “Studies on frozen doughs. I. Effects of frozen storage and
freeze-thaw cycles on baking and rheological properties”. Cereal Chemistry 68 (6), 627–631
Jowitt, R., 1974. “The terminology of food texture”. Journal Texture Studies 5, 351-358.
Juliano, B.O., Perez, C.M., Barber, S., Blakeney, A.B., Iwasaki, T., Shibiuya, N., Keneaster,
K.K., Ching, S.O., Laignelet, B., Launay, B., Del Mundo, A.M., Tokoyama, J., Tatsumi, K.
and Webb, B.D., 1981. “International cooperative comparison of instrument methods for
cooked rice texture”. Journal Texture Studies 12, 17-38.
Keentok, M., Newberry, M.P., Gras, P., Bekes, F. and Tanner, R.I., 2002. “The rheology of
bread dough made from four commercial flours”. Rheologica Acta 41, 173-179.
Kieffer, R., Garnreiter, F. and Belitz, H-D., 1981b. “Beurteilung von Teigeigenschaften durch
Zugversuche im Mikromapstab. 2 „. Lebensm. Unters. Forsch. 172, 193-194.
Kieffer, R., Kim, J.-J. and Belitz, H.-D., 1981a. Zugversuche mit Weizenkleber im
Mikromapstab. Z. Lebensm. Unters. Forsch. 172,190-192
Kilborn, R.H. and Preston, K.R., 1982. “ A modified extensigraph procedure for measuring
the stretching properties of fermented doughs”. Cereal Chemistry, 59, 381.
Kilcast, D. and Roberts, C., 1998. “Perception and measurement of stickiness in sugar-rich
foods”. Journal Texture Studies 29, 81-100.
Kline, L. and Sugihara, T., 1968. “Factors affecting the stability of the frozen bread dough. I.
Prepared by straight dough method”. Beakers Digest 42, 44–50.
Knightly, W.H., 1977. “The staling of bread: A review“. Bakers Digest 51(5), 52.
Konstance, R.P., 1993. “Axial compression properties of calcium caseinate gels”. Journal
Dairy Science 76, 3317-3326.
178

Krutz, G. W., Gibson, H. G., Cassens, D. L. and Zhang, M., 2000. “Colour vision in forest
and wood engineering”. Landwards, 55, 2–9.
Kulp, K and Ponte, J.G. Jr. 1981. “Staling of white pan bread: fundamental causes“. CRC
Critical Rev Food Sci Nutr 15:1.
Kulp, K., Lorenz, K. and Brümmer, J., 1995. ”Frozen and Refrigerated Doughs and Batters”.
Minnesota: American Association of Cereal Chemists, pp. 1–3, 93, 148.
Landis, Q. and Freilich, J., 1934. “Fermentation response and fermentation tolerance”. Cereal
Chemistry, 11, 396.
Le Bail, A., Grinand, C., Le Cleach, S., Martinez, S. and Quilin, E., 1999. “Influence of
storage conditions on frozen French bread dough”. Journal of Food Engineering 39, 289-291.
Le Bail, A., Havet, M. and Pasco, M., 1998. “Influence of the freezing rate and of storage
duration on the gassing power of frozen bread dough”. In: Proceedings of the Symposium of
the International Institute of Refrigeration. Nantes, France: International Institute of
Refrigeration.
LeDuff, L., 1985. “Pain Francais précuit congelé et son procédé de fabrication“. French
Patent. Patent number FR 2 589 044-A1.
Lee, S., Pyrak-Nolte, L.J. and Campanella, O., 2004.“Determination of ultrasonic-based
rheological properties of dough during fermentation”. Journal of Texture Studies 35, 33-51.
�Leemans, V., Magein, H. and Destain, M.F., 1998. “Defects segmentation on Golden
Delicious apples by using colour machine vision”. Computers and Electronics in Agriculture,
20, 117–130.
Maga, J.A. 1975. “Bread staling“. CRC Critical Reviews Food Technology 5,443.
Maleki, M., Hoseney, R.C. and Mattern, P.J., 1980. “Effects of loaf volume, moisture content
and protein quality on the softness and staling rate of bread“. Cereal Chemistry, 57(2), pp
138-140.
179

Masi, P., Cavella, S. and Piazza, L., 2001. “An interpretation of the rheological behavior of
wheat flour dough based on fundamental tests”. In Bread staling (Eds. Chinachoti P., and
Vodovotz Y.) CRC press Boca Raton Boston New York Washington, DC.
Mendoza, F. and Aguilera, J.M., 2004. “Application of image analysis for classification of
ripening bananas”. Journal Food Science 69, 471–477.
Mert, B., 2008. “A new instrumental setup for determination of small amplitude viscoelastici
properties of dough during fermentation”. European Food Research Technology, 227, 151-
157.
Mohsenin, N.N. and Mittal, J.P., 1977. “Use of rheological terms and correlation of
compatible measurements in food texture research”. Journal Texture Studies 8, 395-408
Mossmam, A.P., Fellers, D.A. and Suzuki, H., 1983. “Rice stickiness. I. Determination of rice
stickiness with an Instron Tester”. Cereal Chemistry. 60, 286-292.
Muller, H.G., 1975. “ Rheology and the conventional bread and biscuit making process”,
Cereal Chemistry, 52, 89r-105r.
Newberry, M.P., Phan-Thien, N., Larroque, O.R., Tanner, R.I. and Larsen, N.G., 2002.
“Dynamic and elongation rheology of yeasted bread doughs”. Cereal Chemistry 79 (6), 874-
879.
Noguchi, G., Shinya, M.. Tanaka, K. and Yoneyama, T., 1976. “Correlation of dough
stickiness with texturometer reading and with various quality parameters”. Cereal Chemistry.
53, 72-77.
Okabe, M., 1979. “Texture measurement of cooked rice and its relationship to the eating
quality”. Journal Texture Studies 10, 131-152.
Oliver, G. and Brock, C.J., 1997. “A rheological study of mechanical dough development and
long fermentation processes for cream-cracker dough production. Journal Science Food
Agriculture, 74, 294-300.
180

Olkku, J. and Rha, C.K., 1975. “Textural parameters of candy licorice”. Journal Food
Science, 40, 1050-1054.
Padua, M.R. de, and Padua-Maroun, H. 1984. “Rheological behaviour of Venezuelan arepa
dough precooked corn flour”. Cereal Chemistry. 61, 37-41.
Pearson, T.C. and Slaughter, D. C., 1996. “Machine vision detection of early split pistachio
nuts”. Transactions of the ASAE, 39(3), 1203–1207.
Peleg, M., 1976. “Texture Profile Analysis parameters obtained by an Instron Universal
testing machine”. Journal Food Science, 41, 72 1-722.
Peleg, M., 1983. “The semantics of rheology and texture”. Food Technology. 37 (11), 54-61.
Peleg, M., 1987. “The basics of food rheology”. In Food Texture, Instrumental and Sensory
Measurement (H.R. Moskowitz, ed.) pp. 3-33, Marcel Dekker, New York.
Peressini, D. and Sensidoni, A., 2004. Frozen Dough Conference Proceedings. Parma, Italy.
Pizzinatto, A. and Hoseney, R.C., 1980. “ Rheological changes in cracker sponges during
fermentation. Cereal Chemistry, 57, 185.
Pons M., and Fiszman, S.M., 1996. “Instrumental texture profile analysis with particular
reference to gelled systems.” Review Paper Journal of Texture Studies (27) 597-624.
Preston, K.R. and Kilborn, R.H., 1982. “Sponge-and-dough bread: Effects of fermentation,
bromated and sponge salt upon the baking and physical dough properties of a Canadian red
spring wheat. Journal Food Science, 47, 1143.
Proctor, B.E., Davison, S. and Brody, A.L., 1956a. A recording straingage denture
tenderometer for foods. 11. Studies on the masticatory force and motion, and the force-
penetration relationship. Food Technol. 10(7), 327-33 1,
Proctor, B.E., Davison, S. and Brody, A.L., 1956b. A recording straingage denture
tenderometer for foods. III. Correlation with subjective tests and the Canco Tenderometer.
Food Technol. 10(8), 344-346.
181

Ram, B.P. and Nigam, S.N. 1983. “Texturometer as a tool for studying varietal differences in
wheat flour doughs and gluten proteins”. Journal of Texture Studies 14, 245-249.
Ramìrez-Wong, B., Sweat, V.E., Torres, P.I. and Rooney, L.W. 1993. “Development of two
instrumental methods for corn masa texture evaluation”. Cereal Chemistry, 70, 286-290.
Ramìrez-Wong, B., Sweat, V.E., Torres, P.I. and Rooney, L.W., 1994. “Cooking time,
grinding, and moisture content effect on fresh corn masa texture”. Cereal Chemistry. 71, 337-
343.
Ranhotra, G.S., Loewe, R.J. and Lehmann, T.A., 1977. “Breadmaking quality and nutritive
value of sprouted wheat”. Journal Food Science. 42, 1373-1375.
Rao, M.A. and Steffe, J.F., 1992. “Viscoelastic Properties of Foods”, Elsevier Applied
Science, New York.
Ribotta, P.D., Leon, A.E. and Anon, M.C., 2001. “Effect of freezing and frozen storage of
doughs on bread quality”. Journal of Agricultural and Food Chemistry 49 (2):913–918.
Ribotta, P.D., Pèrez, G.T., Leòn, A.E. and Añon, M.C., 2004. “Effect of emulsifier and guar
gum on micro structural, rheological and baking performance of frozen bread dough. Food
Hydrocolloids 18, 305-313.
Rocculi, P., Romani, S. and Dalla Rosa, M., 2005. “Effect of MAP with argon and nitrous
oxide on quality maintenance of minimally processed kiwifruit”. Postharvest Biology and
Technology 35 319-328..
Ross., K.A., Pyrak-Nolte, L.J. and Campanella, O.H., 2004. “The use of ultrasound and shear
oscillatory test sto characterize the effect of mixing time on the rheological properties of
dough”. Food Reserch International 37, 567-577.
Sai-Manohar, R.S. and Haridas-Rao, P.H. 1997. “Effect of mixing period and additives on the
rheological characteristics of dough and quality of biscuits" Journal Cereal Science, 25, 197-
206.
182
Sarkar, N.R., 1991. “Machine vision for quality control in the food industry”. In I. Fung, & E.
Matthews (Eds.), Instrumental methods for quality assurance in foods (pp. 167–187). New
York: Marcel Decker.
Scott Blair, G.W., 1936. Ph.D. Thesis: Viscous and elastic properties of plastic bodies.
(original not seen) Fac. Sci., Univ. London.
Selemulyo, V.O. and Zhou, W., 2007. “Frozen bread dough: Effects of freezing storage and
dough improvers”. Journal of Cereal Science 45 (1): 1-17.
Shama, F. and Sherman, P., 1973. “Evaluation of some textural properties of foods with the
Instron Universal Testing Machine”. Journal Texture Studies 4, 344-353.
Sherman, P., 1969. “A texture profile of foodstuffs based upon well-defined rheological
properties”. Journal of Food Science. 34, 458-462.
Sherman, P., 1970. “Industrial Rheology: with particular reference to foods, pharmaceuticals,
and cosmetics”, Academic Press, London.
Shiiba, K., Negishi, Y., Okada. K. and Nagao, S., 1990. “Chemical changes during sponge-
dough fermentation”. Cereal Chemistry, 67 (4), 350-355.
Shuey, W.C., 1975. “Practical instruments for rheological measurements on wheat products”.
Cereal Chemistry, 52, 42r-81r.
Sievert, D., Hoseney, R.C., Delcour, J.A., 2007. “Bread and other baked Products“. Standard
Article. Wiley- VCH Verlag GmbH & Co. KGaA, Weinheim.
Sila-Bhattacharya, S. and Narasimha, H.V., 1997. “Puncture and stress relaxation behavior of
blackgram (Phaseolus mungo) flour-based papad dough”. Journal of Food Process
Engineering 20, 301-316.
Smewing, J., 1995. “The Measurement of Dough and Gluten Extensibility Using the
SMS/Kieffer Rig and the TA.XT2 Texture Analyser”. Stable Micro Systems Ltd., Surrey,
UK.
183

Song, Y. and Zheng, Q., 2007. “Dynamic rheological properties of wheat flour dough and
properties”. Trends in food science and technology 18, 132-138.
Stampfli, L., Nersten, B. and Molteberg, E.L., 1996. “Effects of emulsifiers on farinograph
and extensograph measurements“. Food Chemistry, 57 (4), 523-530.
Steffe, J.F., 1996. “Rheological methods in food process engineering”. Second Edition.
Freeman Press, USA.
Szczesniak, A.S. and Hall, B.J., 1975. “Application of the General Foods Texturometer to
specific food products”. Journal Texture Studies 6, 117-138.
Szczesniak, A.S. and Smith, B.J., 1969. “Observations on strawberry texture: a three-pronged
approach”. Journal Texture Studies I , 65-89.
Szczesniak, A.S., 1963. “Classification of textural characteristics”. Journal Food. Science 28,
385-389.
Szczesniak, A.S., 1971. “Effect of mode ~Frehydration on textural parameters of precooked
freeze-dried sliced beef”. Journal Texture Studies 2, 18-30.
Szczesniak, A.S., 1975a. General Foods Texture Profile revisited - Ten years perspective.
Journal Texture Studies 6, 5-17.
Szczesniak, A.S., Brandt, M.A. and Friedman, H.H., 1963. “Development of standard rating
scales for mechanical parameters of texture and correlation between the objective and the
sensory methods of texture evaluation”. Journal Food Science 28, 397-403.
Tang, Q., Mccarthy, O.J. and Munro, P.A., 1995. “Effects of pH on whey protein concentrate
gel properties: comparisons between small deformation (dynamic) and large deformation
(failure) testing”. Journal Texture Studies 26.
Van Vliet, T., 1999. “Rheological classification of foods and instrumental techniques for their
study”, in: Food Texture: measurement and perception, (A.J. Rosenthal, ed.), Aspen
Publishers, MN, USA.
184

Varriano-Marston, E.K., Hsu, K.H. and Mahdi, J., 1980. “Rheological and structural changes
in frozen dough”. The Bakers Digest 54 (1): 32–41,
Walstra, P. and Peleg, M., 1991. “Rheological and fracture properties of cheese. General
considerations”. Bulletin of the IDS 268, 3-4.
Wang, H-H. and Sun, D-W., 2002a. “Correlation between cheese meltability determined with
a computer vision method and with Arnott and Schreiber”. Journal of Food Science, 67 (2),
745-749.
Wang, S.M., Watts, B.M., Lukow, O.M., Schilichting, L. and Bushuk, W. 1996. “Dough
profiling: an instrumental method for dough stickiness measurement”. Cereal Chemistry . 73,
445-451.
Wang, S.M., Watts, B.M., Lukow, O.M., Schlichting. L. and Bushuk, W., 1996. “Dough
profiling: an instrumental method for dough stickiness measurement”. Cereal Chemistry. 73,
445-451.
Wehrle, K. and Arendt, E.K., 1998. “Rheological changes in wheat sourdough during
controlled and spontaneous fermentation”. Cereal Chemistry, 75, 882-886.
Whitworth, M.B. and Alava, J.M., 1999. “The imaging and measurement of bubbles in bread
doughs”. In G.M. Campbell, C. Webb, S.S. Pandiella, & K. Niranjan (Eds.), Bubbles in food
(pp. 221-232). St. Paul, MN: American Association of Cereal Chemists.
Whorlow, R.W., 1992. “Rheological Techniques”, 2nd edn, Ellis Horwood, Chichester, UK.
Willhoft, E.M.A., 1973. “Mechanism and theory of staling of bread and baked goods, and
associated changes in textural properties“. Journal of Texture Studies 4, 292.
Wolt, M.J. and D’Appolonia, B.L., 1984. “Factors involved in the stability of frozen dough. I.
The influence of yeast-reducing compounds on frozen dough stability”. Cereal Chemistry 61,
209–212.
185

186
Yang, Q., 1996. “Apple stem and calyx identification with machine vision”. Journal of
Agricultural Engineering Research, 63, 229–236.
Zeller, F.J., Gunzel, G., Fischbeck, G., Gerstenkorn, P. and Weipert, D., 1982.
“Veranderungen der Backeigenschaften des Weizens dmh die WeizenRoggen-
Chromosomentranslokation lB/lR”. Getreide Mehl Brot 36, 141-143.
Zobel, H.F. 1973. “A review of bread staling“. Bakers Digest 47(5), 53.
Zobel, H.F. and Kulp, K., 1996. “The staling mechanism“. In: Baked Goods Freshness.
Hebeda RE, Zobel H, editors. Marcel Dekker, New York. p 1-64.


