Emissions Testing Report 2013-14
273
NATA ACCREDITATION No. 2778 (14391) Accredited for compliance with ISO/IEC 17025 This document is issued in accordance with NATA’s accreditation requirements. This document may not be reproduced except in full. National Ceramic Industries Australia 05-May-2014 60305580 Commercial-in-Confidence Emissions Testing Report 2013-14 National Ceramic Industries Australia
Transcript of Emissions Testing Report 2013-14

NATA ACCREDITATION No. 2778 (14391)Accredited for compliance with ISO/IEC 17025This document is issued in accordance with NATA’s accreditation requirements.This document may not be reproduced except in full.
National Ceramic Industries Australia05-May-201460305580
Commercial-in-Confidence
Emissions Testing Report2013-14National Ceramic Industries Australia

AECOM Emissions Testing Report 2013-14 – National Ceramic Industries AustraliaCommercial-in-Confidence
http://vpo.au.aecomnet.com/projects/21134_NSWB1320961/6DraftDocs/6.1 Reports/1.9 Stack Testing 2013/NCIA Emissions Testing Report2013_2014.docxRevision 1.0 – 05-May-2014Prepared for – National Ceramic Industries Australia – ABN: 83100467267
Emissions Testing Report 2013-14National Ceramic Industries Australia
Client: National Ceramic Industries Australia
ABN: 83100467267
Prepared byAECOM Australia Pty Ltd17 Warabrook Boulevard, Warabrook NSW 2304, PO Box 73, Hunter Region MC NSW 2310, AustraliaT +61 2 4911 4900 F +61 2 4911 4999 www.aecom.comABN 20 093 846 925
05-May-2014
Job No.: 60305580
AECOM in Australia and New Zealand is certified to the latest version of ISO9001, ISO14001, AS/NZS4801 and OHSAS18001.
© AECOM Australia Pty Ltd (AECOM). All rights reserved.
AECOM has prepared this document for the sole use of the Client and for a specific purpose, each as expressly stated in the document. No otherparty should rely on this document without the prior written consent of AECOM. AECOM undertakes no duty, nor accepts any responsibility, to anythird party who may rely upon or use this document. This document has been prepared based on the Client’s description of its requirements andAECOM’s experience, having regard to assumptions that AECOM can reasonably be expected to make in accordance with sound professionalprinciples. AECOM may also have relied upon information provided by the Client and other third parties to prepare this document, some of whichmay not have been verified. Subject to the above conditions, this document may be transmitted, reproduced or disseminated only in its entirety.

AECOM Emissions Testing Report 2013-14 – National Ceramic Industries AustraliaCommercial-in-Confidence
http://vpo.au.aecomnet.com/projects/21134_NSWB1320961/6DraftDocs/6.1 Reports/1.9 Stack Testing 2013/NCIA Emissions Testing Report2013_2014.docxRevision 1.0 – 05-May-2014Prepared for – National Ceramic Industries Australia – ABN: 83100467267
This page has been left blank intentionally.
AECOM Emissions Testing Report 2013-14 – National Ceramic Industries AustraliaCommercial-in-Confidence
http://vpo.au.aecomnet.com/projects/21134_NSWB1320961/6DraftDocs/6.1 Reports/1.9 Stack Testing 2013/NCIA Emissions Testing Report2013_2014.docxRevision 1.0 – 05-May-2014Prepared for – National Ceramic Industries Australia – ABN: 83100467267
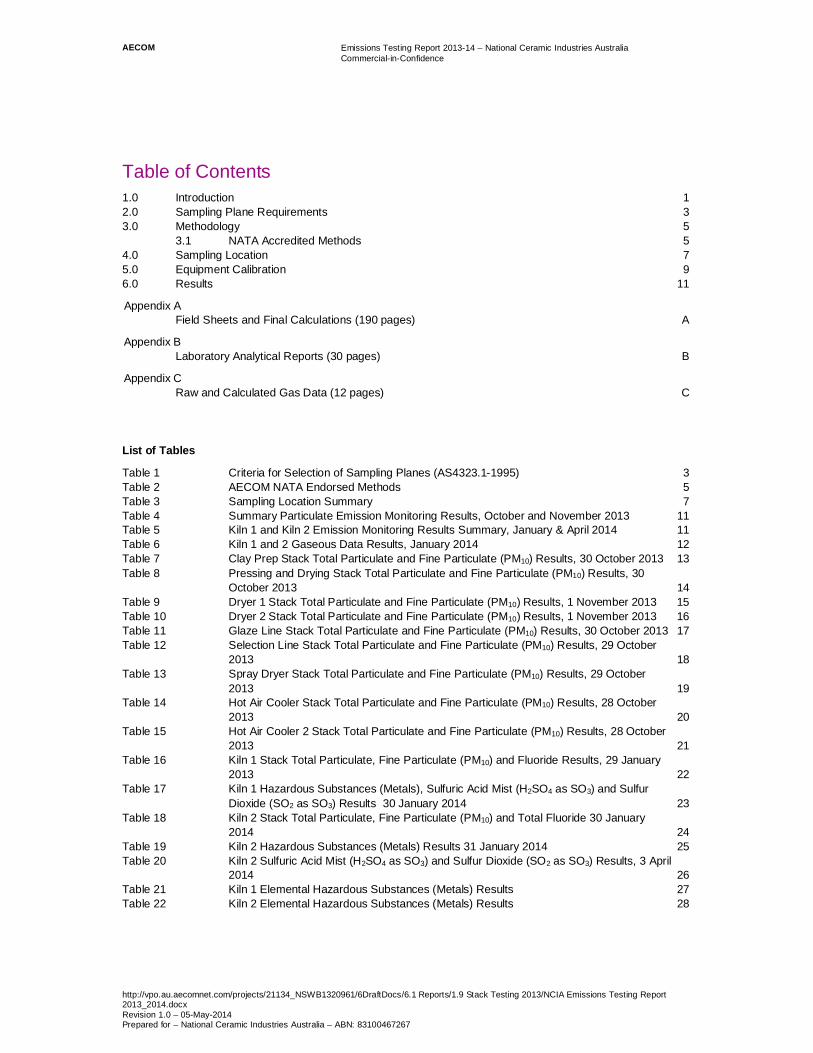
Table of Contents1.0 Introduction 12.0 Sampling Plane Requirements 33.0 Methodology 5
3.1 NATA Accredited Methods 54.0 Sampling Location 75.0 Equipment Calibration 96.0 Results 11
Appendix AField Sheets and Final Calculations (190 pages) A
Appendix BLaboratory Analytical Reports (30 pages) B
Appendix CRaw and Calculated Gas Data (12 pages) C
List of Tables
Table 1 Criteria for Selection of Sampling Planes (AS4323.1-1995) 3Table 2 AECOM NATA Endorsed Methods 5Table 3 Sampling Location Summary 7Table 4 Summary Particulate Emission Monitoring Results, October and November 2013 11Table 5 Kiln 1 and Kiln 2 Emission Monitoring Results Summary, January & April 2014 11Table 6 Kiln 1 and 2 Gaseous Data Results, January 2014 12Table 7 Clay Prep Stack Total Particulate and Fine Particulate (PM10) Results, 30 October 2013 13Table 8 Pressing and Drying Stack Total Particulate and Fine Particulate (PM10) Results, 30
October 2013 14Table 9 Dryer 1 Stack Total Particulate and Fine Particulate (PM10) Results, 1 November 2013 15Table 10 Dryer 2 Stack Total Particulate and Fine Particulate (PM10) Results, 1 November 2013 16Table 11 Glaze Line Stack Total Particulate and Fine Particulate (PM10) Results, 30 October 2013 17Table 12 Selection Line Stack Total Particulate and Fine Particulate (PM10) Results, 29 October
2013 18Table 13 Spray Dryer Stack Total Particulate and Fine Particulate (PM10) Results, 29 October
2013 19Table 14 Hot Air Cooler Stack Total Particulate and Fine Particulate (PM10) Results, 28 October
2013 20Table 15 Hot Air Cooler 2 Stack Total Particulate and Fine Particulate (PM10) Results, 28 October
2013 21Table 16 Kiln 1 Stack Total Particulate, Fine Particulate (PM10) and Fluoride Results, 29 January
2013 22Table 17 Kiln 1 Hazardous Substances (Metals), Sulfuric Acid Mist (H2SO4 as SO3) and Sulfur
Dioxide (SO2 as SO3) Results 30 January 2014 23Table 18 Kiln 2 Stack Total Particulate, Fine Particulate (PM10) and Total Fluoride 30 January
2014 24Table 19 Kiln 2 Hazardous Substances (Metals) Results 31 January 2014 25Table 20 Kiln 2 Sulfuric Acid Mist (H2SO4 as SO3) and Sulfur Dioxide (SO2 as SO3) Results, 3 April
2014 26Table 21 Kiln 1 Elemental Hazardous Substances (Metals) Results 27Table 22 Kiln 2 Elemental Hazardous Substances (Metals) Results 28

AECOM Emissions Testing Report 2013-14 – National Ceramic Industries AustraliaCommercial-in-Confidence
http://vpo.au.aecomnet.com/projects/21134_NSWB1320961/6DraftDocs/6.1 Reports/1.9 Stack Testing 2013/NCIA Emissions Testing Report2013_2014.docxRevision 1.0 – 05-May-2014Prepared for – National Ceramic Industries Australia – ABN: 83100467267
This page has been left blank intentionally.

AECOM Emissions Testing Report 2013-14 – National Ceramic Industries AustraliaCommercial-in-Confidence
http://vpo.au.aecomnet.com/projects/21134_NSWB1320961/6DraftDocs/6.1 Reports/1.9 Stack Testing 2013/NCIA Emissions Testing Report2013_2014.docxRevision 1.0 – 05-May-2014Prepared for – National Ceramic Industries Australia – ABN: 83100467267
1
1.0 IntroductionAECOM was appointed by National Ceramic Industries Australia Pty Limited (NCIA) to conduct annual airemission measurements at their facility located at Racecourse Road, Rutherford NSW. Emission testing wasperformed for the assessment of compliance with requirements of the facility’s Environment Protection Licence(EPL 11956). Emission sources assessed during the testing period where EPL points 1 (Clay Prep), 2 (Pressingand Drying), 5 (Dryer 1), 6 (Dryer 2), 9 (Glaze Line), 10 (Selection Line), 12 (Spray Dryer), 14 (Kiln 1), 15 (Kiln 2)18 (Hot Air Cooler 1) and 19 (Hot Air Cooler 2).
Assessment of the following emission parameters associated with each source was performed during October -November 2013 and January - April 2014:
- Velocity;
- Volumetric Flow rate;
- Moisture Content;
- Carbon Monoxide, Carbon Dioxide and Oxygen (for determination of Dry Gas Density);
- Total Particulate Matter; and
- Fine Particulate (PM10).
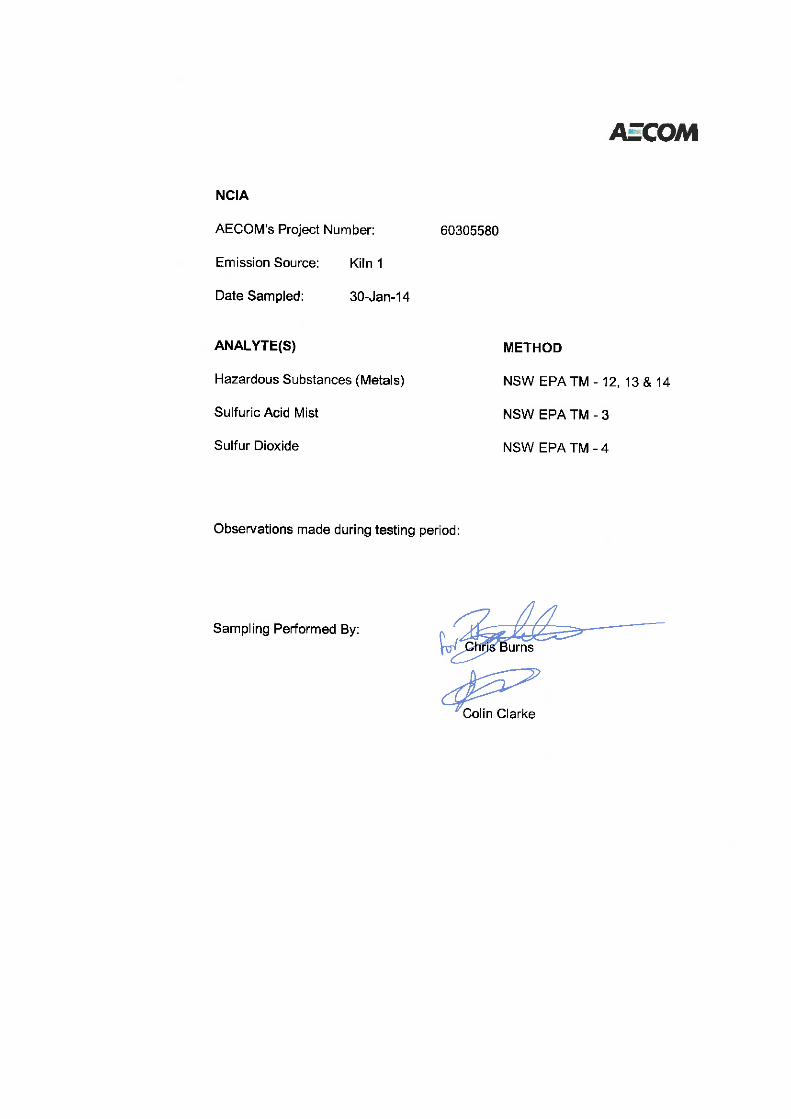
Concentrations of the following air contaminants were also assessed on Kiln 1 & Kiln 2 stack emissions:
- Total Fluoride;
- Sulfur Dioxide (SO2 as SO3) and Sulfuric Acid Mist (H2SO4 as SO3);
- Hazardous Substances; and
- Oxides of Nitrogen (NO, NO2, NOx and Equivalent NO2).
Laboratory analysis was conducted by the following laboratories, which hold NATA accreditation for the specifiedtests:
- Steel River Testing Pty. Ltd., NATA accreditation number 18079, performed the following analysis detailed inreport number 5399-0-P, 5399-0-M, 5930-0-P, 5930-0-M & 6326-0-M:
Total Particulate;
Fine Particulate (PM10); and
Moisture
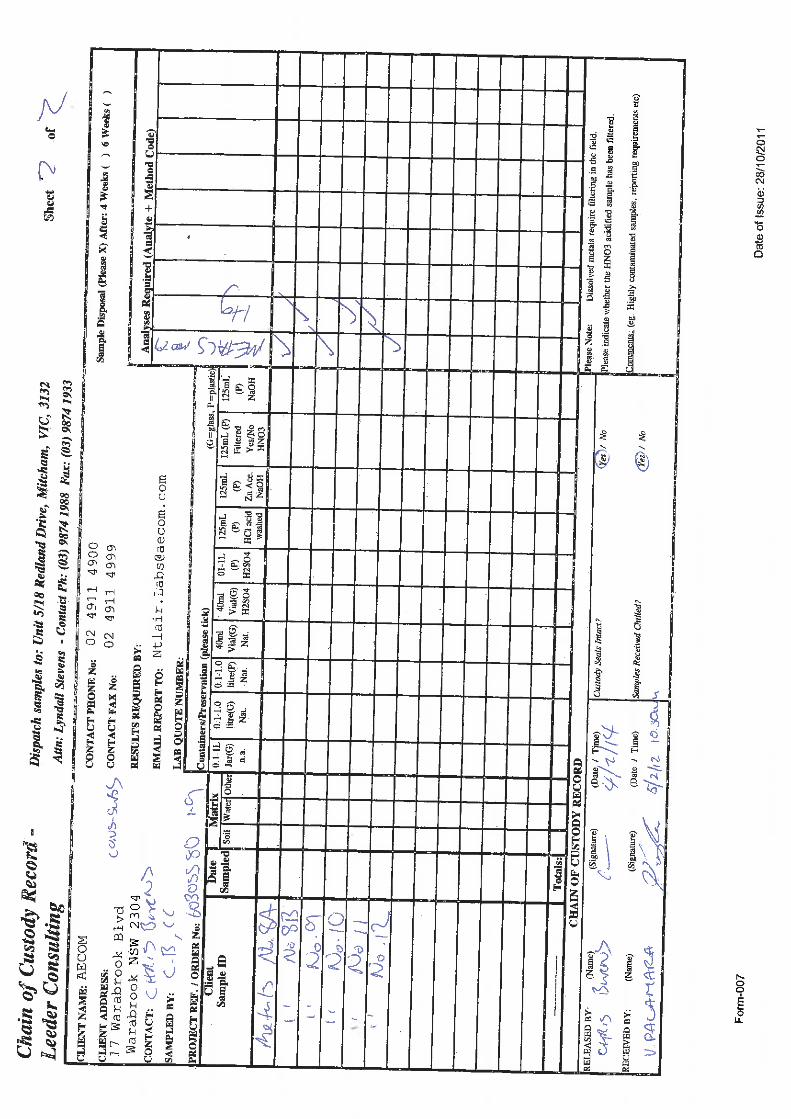
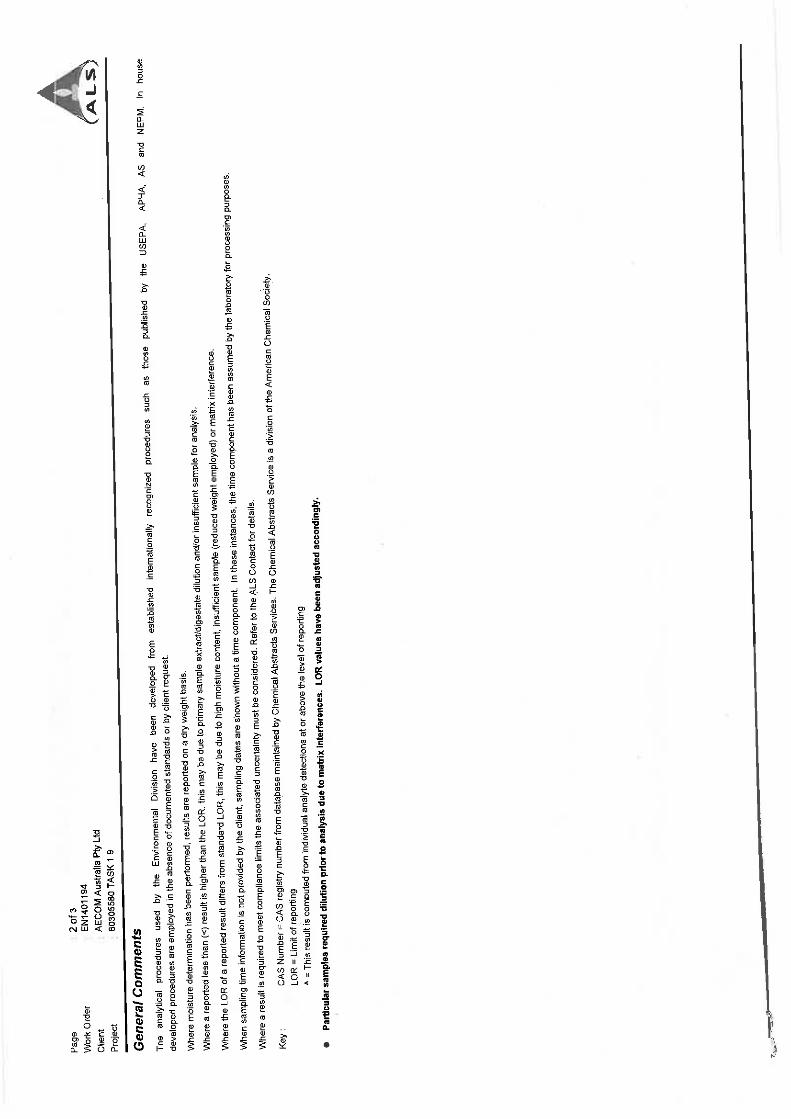
- Australian Laboratory Services (ALS), laboratory NATA accreditation number 825, performed the followinganalysis detailed in reports numbered EN1400365 & EN1401194:
Total Fluoride;
Sulfuric Acid Mist (H2SO4 as SO3); and
Sulfur Dioxide (SO2 as SO3).
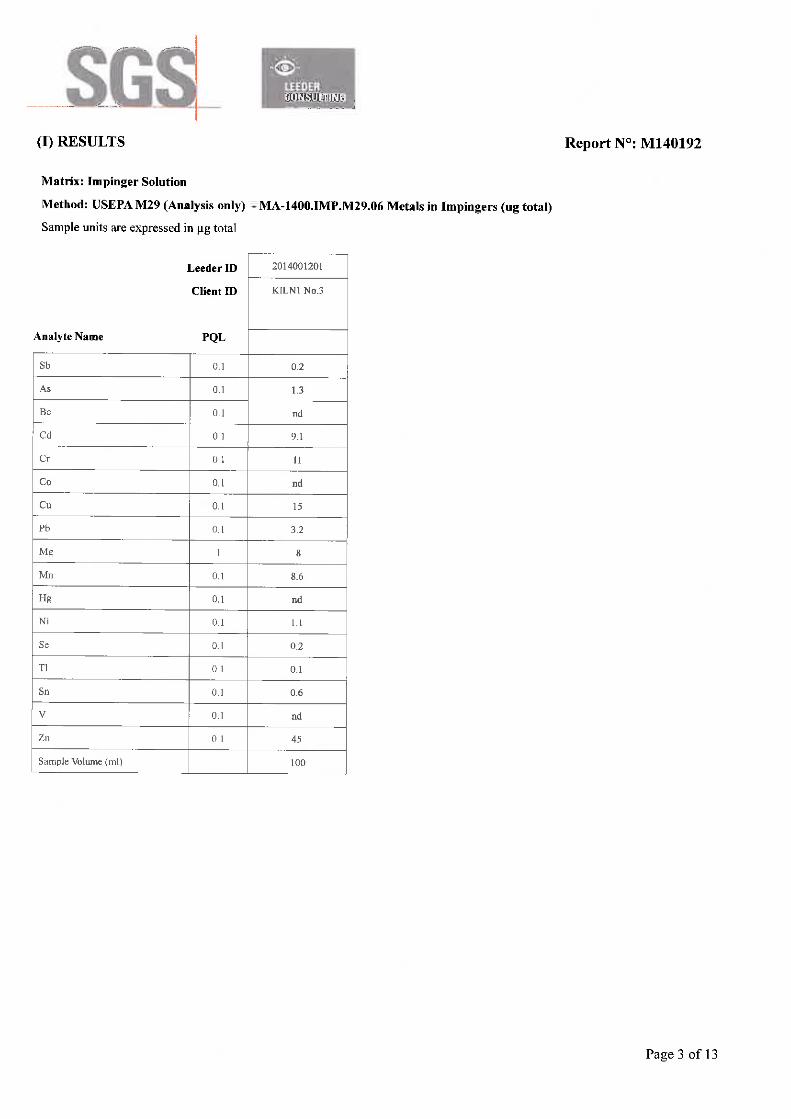
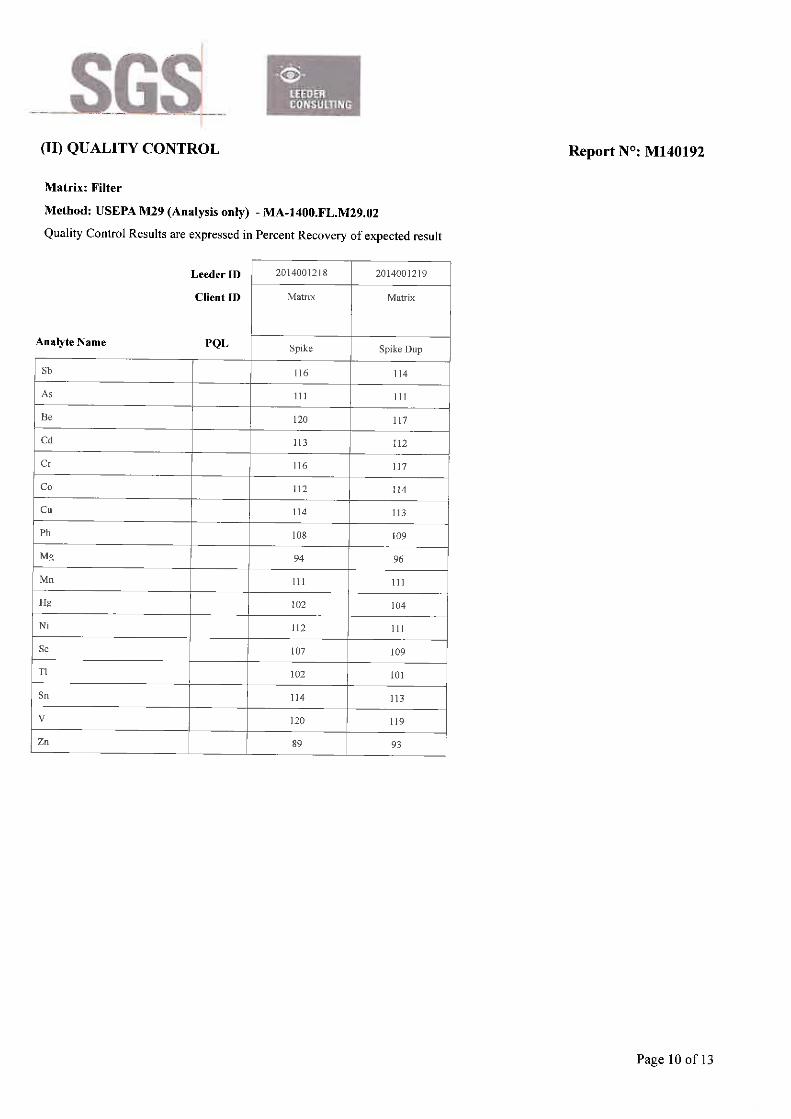
- Leeder Consulting, NATA accreditation number 14429, performed the following analysis detailed in reportnumbers M140192:
Hazardous Substances (Metals).

AECOM Emissions Testing Report 2013-14 – National Ceramic Industries AustraliaCommercial-in-Confidence
http://vpo.au.aecomnet.com/projects/21134_NSWB1320961/6DraftDocs/6.1 Reports/1.9 Stack Testing 2013/NCIA Emissions Testing Report2013_2014.docxRevision 1.0 – 05-May-2014Prepared for – National Ceramic Industries Australia – ABN: 83100467267
2
This page has been left blank intentionally.

AECOM Emissions Testing Report 2013-14 – National Ceramic Industries AustraliaCommercial-in-Confidence
http://vpo.au.aecomnet.com/projects/21134_NSWB1320961/6DraftDocs/6.1 Reports/1.9 Stack Testing 2013/NCIA Emissions Testing Report2013_2014.docxRevision 1.0 – 05-May-2014Prepared for – National Ceramic Industries Australia – ABN: 83100467267
3
2.0 Sampling Plane RequirementsThe criteria for sampling planes are specified in AS 4323.1-1995.Table 1 Criteria for Selection of Sampling Planes (AS4323.1-1995)
Type of flow disturbanceMinimum distance upstreamfrom disturbance, diameters
(D)
Minimum distance downstreamfrom disturbance, diameters
(D)Bend, connection, junction,direction change >2D >6D
Louvre, butterfly damper (partiallyclosed or closed) >3D >6D
Axial fan >3D >8D (see Note)
Centrifugal fan >3D >6D
NOTE: The plane should be selected as far as practicable from a fan. Flow straighteners may be required to ensure the positionchosen meets the check criteria listed in Items (a) to (f) below.
a) The gas flow is basically in the same direction at all points along each sampling traverse;
b) The gas velocity at all sampling points is greater than 3 m/s;
c) The gas flow profile at the sampling plane shall be steady, evenly distributed and not have a cycloniccomponent which exceeds an angle of 15o to the duct axis, when measured near the periphery of a circularsampling plane;
d) The temperature difference between adjacent points of the survey along each sampling traverse is less than10% of the absolute temperature, and the temperature at any point differs by less than 10% from the mean;
e) The ratio of the highest to lowest pitot pressure difference shall not exceed 9:1 and the ratio of highest tolowest gas velocities shall not exceed 3:1. For isokinetic testing with the use of impingers, the gas velocityratio across the sampling plane should not exceed 1.6:1; and
f) The gas temperature at the sampling plane should preferably be above the dewpoint.
The following stacks did not meet the above criteria in regards to distances from disturbances; as a result extrasampling points were added in accordance with AS 4323.1 – 1995 section 4.2:
- Kiln 1 & 2;
- Pressing and Drying;
- Glaze Line;
- Selection Line;
- Spray Dryer; and
- Hot Air Coolers 1 & 2.
All other points sampled comply with the above criteria.

AECOM Emissions Testing Report 2013-14 – National Ceramic Industries AustraliaCommercial-in-Confidence
http://vpo.au.aecomnet.com/projects/21134_NSWB1320961/6DraftDocs/6.1 Reports/1.9 Stack Testing 2013/NCIA Emissions Testing Report2013_2014.docxRevision 1.0 – 05-May-2014Prepared for – National Ceramic Industries Australia – ABN: 83100467267
4
This page has been left blank intentionally.

AECOM Emissions Testing Report 2013-14 – National Ceramic Industries AustraliaCommercial-in-Confidence
http://vpo.au.aecomnet.com/projects/21134_NSWB1320961/6DraftDocs/6.1 Reports/1.9 Stack Testing 2013/NCIA Emissions Testing Report2013_2014.docxRevision 1.0 – 05-May-2014Prepared for – National Ceramic Industries Australia – ABN: 83100467267
5
3.0 Methodology
3.1 NATA Accredited MethodsThe following methods are within the scope of our National Association of Testing Authorities (NATA)accreditation. Accreditation Number 2778 (14391) and are approved for the sampling and analysis of gases.Specific details of the methods are available on request.
All sampling and analysis is conducted according to the methods in Table 2.Table 2 AECOM NATA Endorsed Methods
NSW EPA ApprovedMethods USEPA Methods Method Title
AS4323.1(NSW EPA TM-1) USEPA (2000) Method 1 Selection of sampling positions
AS4323.2(NSW EPA TM-15)
USEPA (2000) Method 5 under approvedcircumstances
Determination of total particulate matter –isokinetic manual sampling – gravimetricmethod
NSW EPA TM-2USEPA (2000) Method 2 or 2C or USEPA(1999) Method 2F or 2G or 2H (asappropriate)
Determination of stack gas velocity andvolumetric flow rate (type s pitot tube)
NSW EPA TM-3
USEPA (2000) Method 8 (for sampling andanalysis only if interference from fluorides,free ammonia and/or dimethyl aniline hasbeen demonstrated to the satisfaction ofthe chief Scientist, EPA) (as appropriate)
Determination of sulfuric acid mistemissions from stationary sources
NSW EPA TM-4
USEPA (2000) Method 6 or 6A or 6B orUSEPA (1996) Method 6C or ISO (1989)Method 7934 or ISO (1992) Method 7935or ISO (1993) Method 10396 or ISO(1998) Method 11632 (as appropriate)
Determination of Sulfur Dioxide (SO2)emissions from stationary sources
NSW EPA TM-9 USEPA (2000) Method 13A or 13B (asappropriate)
Determination of total fluoride emissionsfrom stationary sources
NSW EPA TM-11
USEPA (2000) Method 7 or 7A or 7B or7C or 7D or USEPA (1990) Method 7E orUSEPA (1996) Method 20 or ISO (1993)Method 10396 (as appropriate). NOx
analysers may be substituted in Method7E provided the performanceSpecifications of the method are met. BothNO and NOx must be directly measured.
Nitrogen dioxide (NO2) or nitricoxide (NO)
NSW EPA TM-12USEPA (2000) Method 29 or USEPA(2000) Method 102 (for mercury only inhydrogen rich streams) (as appropriate)
Type 1 substances (elements antimony(Sb), arsenic (As), cadmium (Cd), lead(Pb) or mercury (Hg) or any compoundcontaining one or more of those elements)

AECOM Emissions Testing Report 2013-14 – National Ceramic Industries AustraliaCommercial-in-Confidence
http://vpo.au.aecomnet.com/projects/21134_NSWB1320961/6DraftDocs/6.1 Reports/1.9 Stack Testing 2013/NCIA Emissions Testing Report2013_2014.docxRevision 1.0 – 05-May-2014Prepared for – National Ceramic Industries Australia – ABN: 83100467267
6
Table 2 Continued AECOM NATA Endorsed Methods
NSW EPA ApprovedMethods USEPA Methods Method Title
NSW EPA TM-13
USEPA (2000) Method 29 (Analysis for tinand vanadium to be done by InductivelyCoupled Argon Plasma EmissionSpectroscopy (ICAP) as defined in USEPAMethod 29) or USEPA (1986) Method7910 (for vanadium only) or USEPA(1986) Method 7911 (for vanadium only)(as appropriate)
Type 2 substances (elements beryllium(Be), chromium (Cr), cobalt (Co),manganese (Mn), nickel (Ni), selenium(Se), tin (Sn) or vanadium (V) or anycompound containing one or more of thoseelements)
NSW EPA TM-14 USEPA (2000) Method 29Cadmium (Cd) or mercury (Hg) or anycompound containing one or more of thoseelements
NSW EPA TM-22 USEPA (2000) Method 4 Determination of moisture content in stackgases
NSW EPA TM-23 USEPA (2000) Method 3 Gas analysis for the determination of drymolecular weight
NSW EPA OM-5 USEPA (1997) Method 201 or 201A (asappropriate)
Determination of PM10 emissions

AECOM Emissions Testing Report 2013-14 – National Ceramic Industries AustraliaCommercial-in-Confidence
http://vpo.au.aecomnet.com/projects/21134_NSWB1320961/6DraftDocs/6.1 Reports/1.9 Stack Testing 2013/NCIA Emissions Testing Report2013_2014.docxRevision 1.0 – 05-May-2014Prepared for – National Ceramic Industries Australia – ABN: 83100467267
7
4.0 Sampling LocationTable 3 provides a summary of the locations sampled by AECOM at the National Ceramic Industries AustraliaRutherford Site during October - November 2013 and January - April 2014.
Table 3 Sampling Location Summary
DischargeDescription
ClayPreparation
(CP1) (EPL 1)
Pressing andDrying (PD1)
(EPL2)
Dryer (D1)(EPL5)
Dryer (D2)(EPL6)
Glaze Line(EPL9)
Duct Shape Circular Circular Circular Circular Circular
Construction Material Metal Metal Metal Metal Metal
Duct Dimensions (mm) 995 1000 490 490 1000
Minimum No. SamplingPoints 12 12 8 8 12
Sampling Ports 2 2 2 2 2
Min. Points/Traverse 6 6 4 4 6
Disturbance No Yes No No Yes
Distance fromUpstream Disturbance1 6 4 10 8 4
Type of Disturbance Junction Junction Fan Fan Junction
Distance fromDownstreamDisturbance1
15 15 8 20 15
Type of Disturbance Stack Exit Stack Exit Stack Exit Stack Exit Stack Exit
Ideal Sampling Location Yes No Yes Yes No
Correction FactorsApplied No Yes No No Yes
Total No. PointsSampled 12 16 8 8 16
Points/Traverse 6 8 4 4 8
Sampling Performed toStandard 2 Yes3 Yes4 Yes3 Yes3 Yes4
Notes 1 Expressed in equivalent stack diameters2 AS 4323.1 (1995) Stationary source emissions Method 1 – Selection of sampling positions3 AS 4323.1 (1995) Section 4.14 AS 4323.1 (1995) Section 4.2
AECOM Emissions Testing Report 2013-14 – National Ceramic Industries AustraliaCommercial-in-Confidence
http://vpo.au.aecomnet.com/projects/21134_NSWB1320961/6DraftDocs/6.1 Reports/1.9 Stack Testing 2013/NCIA Emissions Testing Report2013_2014.docxRevision 1.0 – 05-May-2014Prepared for – National Ceramic Industries Australia – ABN: 83100467267
8
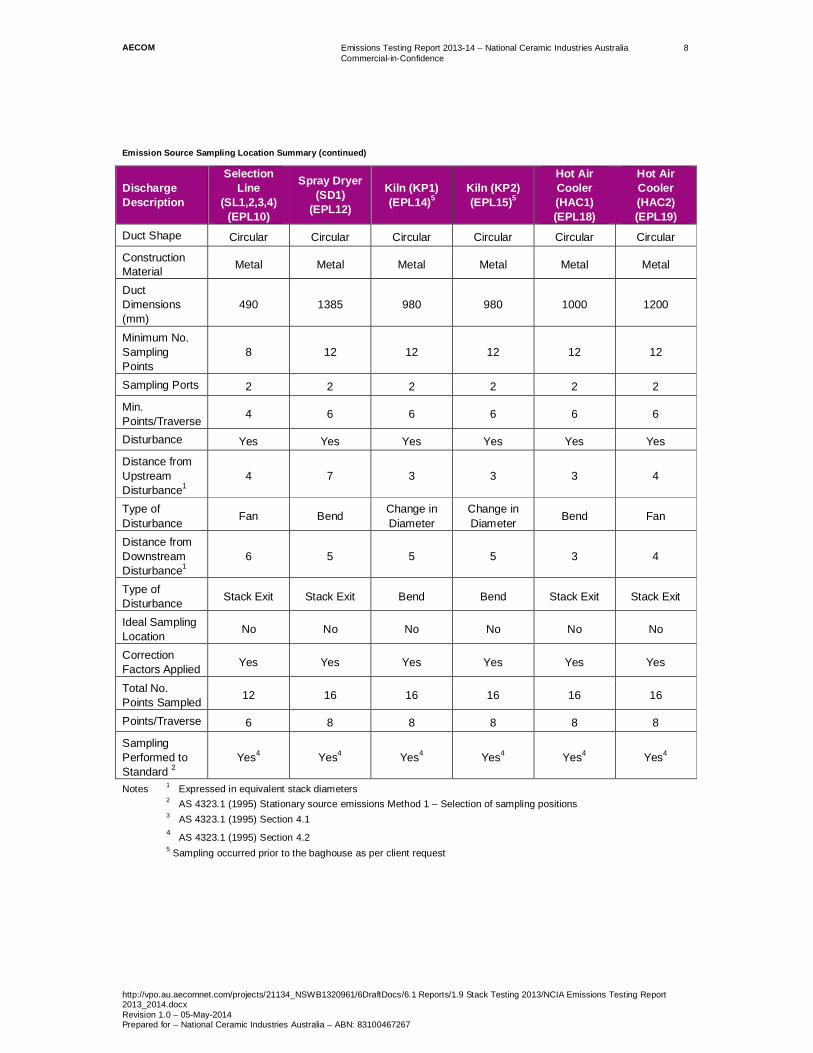
Emission Source Sampling Location Summary (continued)
DischargeDescription
SelectionLine
(SL1,2,3,4)(EPL10)
Spray Dryer(SD1)
(EPL12)
Kiln (KP1)(EPL14)5
Kiln (KP2)(EPL15)5
Hot AirCooler(HAC1)(EPL18)
Hot AirCooler(HAC2)(EPL19)
Duct Shape Circular Circular Circular Circular Circular Circular
ConstructionMaterial Metal Metal Metal Metal Metal Metal
DuctDimensions(mm)
490 1385 980 980 1000 1200
Minimum No.SamplingPoints
8 12 12 12 12 12
Sampling Ports 2 2 2 2 2 2
Min.Points/Traverse 4 6 6 6 6 6
Disturbance Yes Yes Yes Yes Yes Yes
Distance fromUpstreamDisturbance1
4 7 3 3 3 4
Type ofDisturbance Fan Bend Change in
DiameterChange inDiameter Bend Fan
Distance fromDownstreamDisturbance1
6 5 5 5 3 4
Type ofDisturbance Stack Exit Stack Exit Bend Bend Stack Exit Stack Exit
Ideal SamplingLocation No No No No No No
CorrectionFactors Applied Yes Yes Yes Yes Yes Yes
Total No.Points Sampled 12 16 16 16 16 16
Points/Traverse 6 8 8 8 8 8
SamplingPerformed toStandard 2
Yes4 Yes4 Yes4 Yes4 Yes4 Yes4
Notes 1 Expressed in equivalent stack diameters2 AS 4323.1 (1995) Stationary source emissions Method 1 – Selection of sampling positions3 AS 4323.1 (1995) Section 4.14 AS 4323.1 (1995) Section 4.25 Sampling occurred prior to the baghouse as per client request

AECOM Emissions Testing Report 2013-14 – National Ceramic Industries AustraliaCommercial-in-Confidence
http://vpo.au.aecomnet.com/projects/21134_NSWB1320961/6DraftDocs/6.1 Reports/1.9 Stack Testing 2013/NCIA Emissions Testing Report2013_2014.docxRevision 1.0 – 05-May-2014Prepared for – National Ceramic Industries Australia – ABN: 83100467267
9
5.0 Equipment CalibrationAECOM has a calibration schedule to ensure the emission testing equipment is maintained in good order and withknown calibration. Equipment used in this project was calibrated according to the procedures and frequencyidentified in the AECOM Calibration Schedule. Details of the schedule and the calibration calculations areavailable on request.

AECOM Emissions Testing Report 2013-14 – National Ceramic Industries AustraliaCommercial-in-Confidence
http://vpo.au.aecomnet.com/projects/21134_NSWB1320961/6DraftDocs/6.1 Reports/1.9 Stack Testing 2013/NCIA Emissions Testing Report2013_2014.docxRevision 1.0 – 05-May-2014Prepared for – National Ceramic Industries Australia – ABN: 83100467267
10
This page has been left blank intentionally.

AECOM Emissions Testing Report 2013-14 – National Ceramic Industries AustraliaCommercial-in-Confidence
http://vpo.au.aecomnet.com/projects/21134_NSWB1320961/6DraftDocs/6.1 Reports/1.9 Stack Testing 2013/NCIA Emissions Testing Report2013_2014.docxRevision 1.0 – 05-May-2014Prepared for – National Ceramic Industries Australia – ABN: 83100467267
11
6.0 ResultsA summary of results obtained from stack emissions testing performed during October - November 2013 andJanuary – April 2014, are provided in Tables 4 - 6.
Emission data particular to each emission source investigated is presented in Tables 8 - 21. Element HazardousSubstances (metals) results are presented in Table 22 and 23. All emission concentrations are converted tostandard conditions of 0oC, dry gas and 1 atmosphere pressure for comparison with appropriate regulatory limits.
For comparison with EPL requirements Oxides of Nitrogen, Total Particulate and Fine Particulate (PM10) emissionconcentrations determined within the Kiln stacks exhausts have been corrected to 18% O2 based on themeasured oxygen content within the sampling plane during the testing period.
AECOM has a calculated limit of uncertainty in regards to results. The estimation of measurement uncertainty insource testing is conducted to provide an indication of the precision of the measurement result and a degree ofconfidence in the range of values the reported result may represent. The measurement of uncertainty has beencalculated at ±13.6%.
Field sheets and final calculations can be referred to in Appendix A. Raw and Calculated Oxides of Nitrogen datais attached in Appendix B. Analytical laboratory result certificates are provided in Appendix C.
Table 4 Summary Particulate Emission Monitoring Results, October and November 2013
Stack Fine Particulate(PM10) (mg/m3)
Total Particulate(mg/m3)
Regulatory Limit(mg/m3)*
Clay Preparation (CP1) (EPL 1) 0.55 1.2 20
Pressing and Drying (PD1) (EPL 2) 2.8 12 20
Dryer (D1) (EPL 5) 0.97 2.3 20
Dryer (D2) (EPL 6) 0.9 2.2 20
Glaze Line (EPL 9) <0.22 0.52 20
Selection Line (SL 1,2,3,4) (EPL 10) 0.69 1.1 20
Spray Dryer (SD1) (EPL 10) 6.3 13 20
Hot Air Cooler (HAC 1) (EPL 18) 0.35 0.6 5
Hot Air Cooler (HAC 2) (EPL 19) 0.25 0.5 5*Note:- Regulatory limit only applies to Total Particulate.
Table 5 Kiln 1 and Kiln 2 Emission Monitoring Results Summary, January & April 2014
Pollutant Kiln 1 (EPL 14) Kiln 2 (EPL 15) Regulatory Limit
Fine Particulate (at 18% O2) (PM10)(mg/m3) 2 13 N/A
Total Particulate (at 18% O2) (mg/m3) 8 18 20
Total Fluoride (as HF) (mg/m3) 4.4 1.3 5
Sulfuric Acid Mist (H2SO4 as SO3)(mg/m3) <2.1 29 100
Sulfur Dioxide (SO2 as SO3) (mg/m3) 16 230 NA
Total Hazardous Substances (Metals)(mg/m3) 0.12 0.17 1
Cadmium (mg/m3) 0.017 0.026 0.1
Mercury (mg/m3) <0.000022 0.0026 0.1

AECOM Emissions Testing Report 2013-14 – National Ceramic Industries AustraliaCommercial-in-Confidence
http://vpo.au.aecomnet.com/projects/21134_NSWB1320961/6DraftDocs/6.1 Reports/1.9 Stack Testing 2013/NCIA Emissions Testing Report2013_2014.docxRevision 1.0 – 05-May-2014Prepared for – National Ceramic Industries Australia – ABN: 83100467267
12
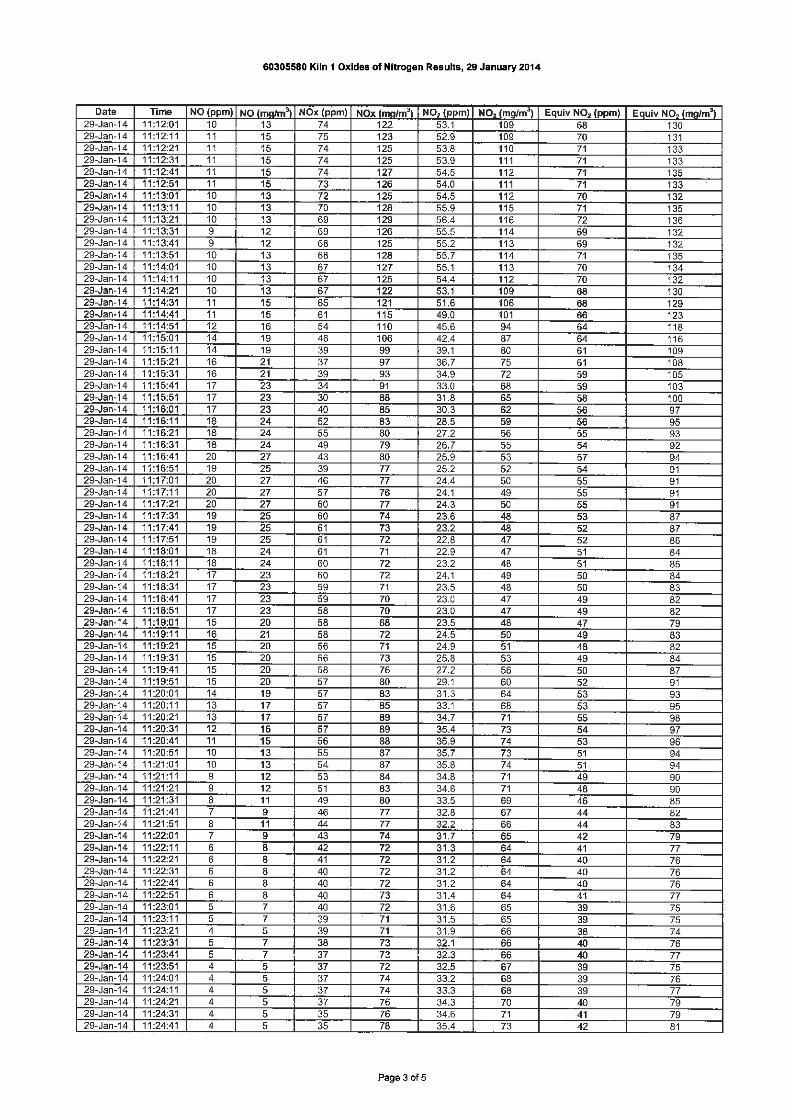
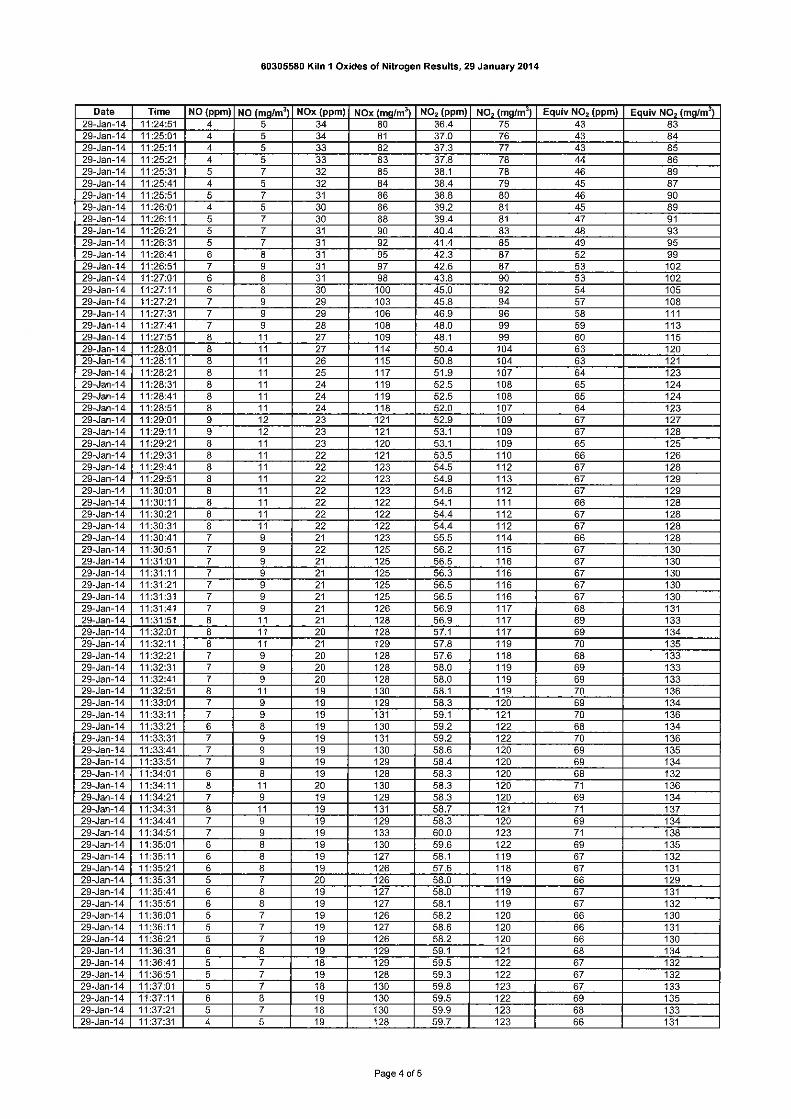
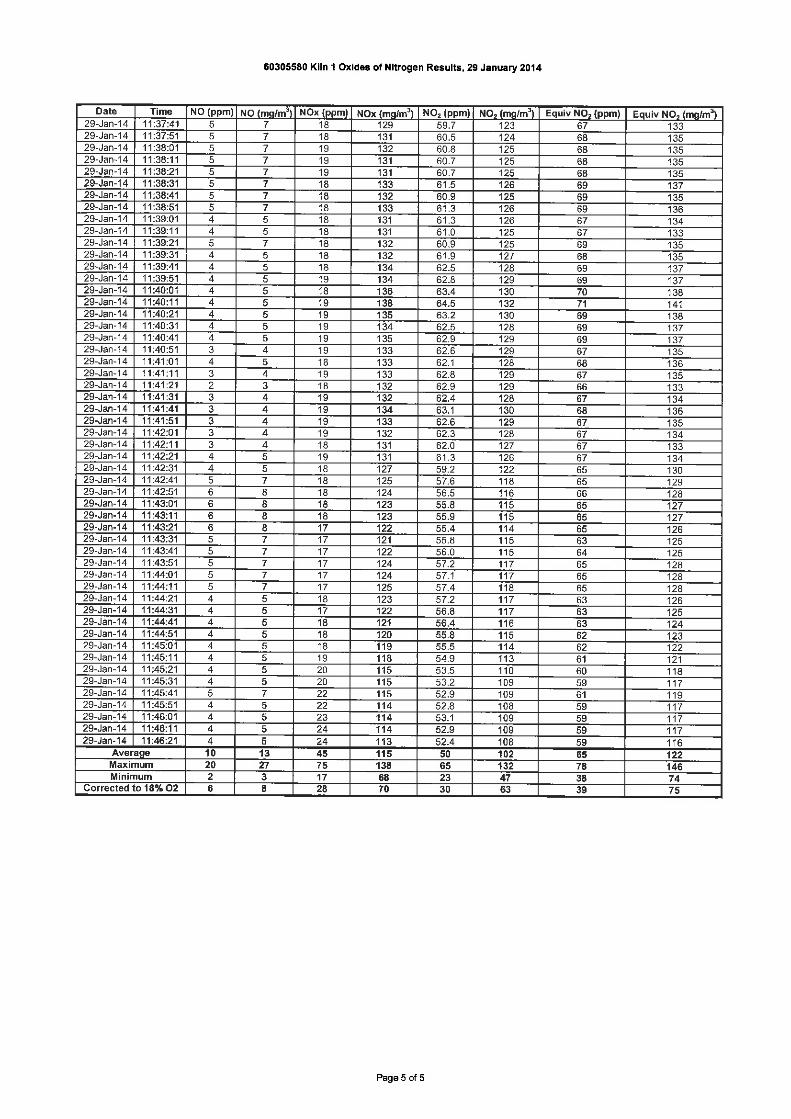
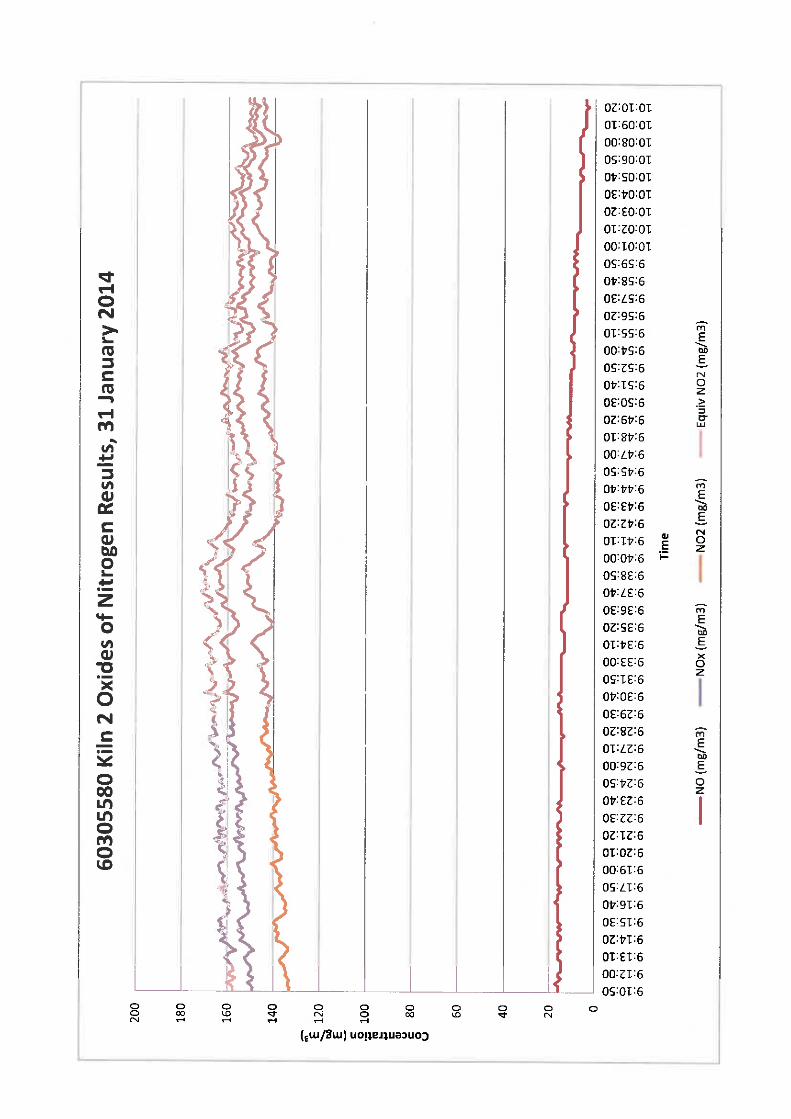
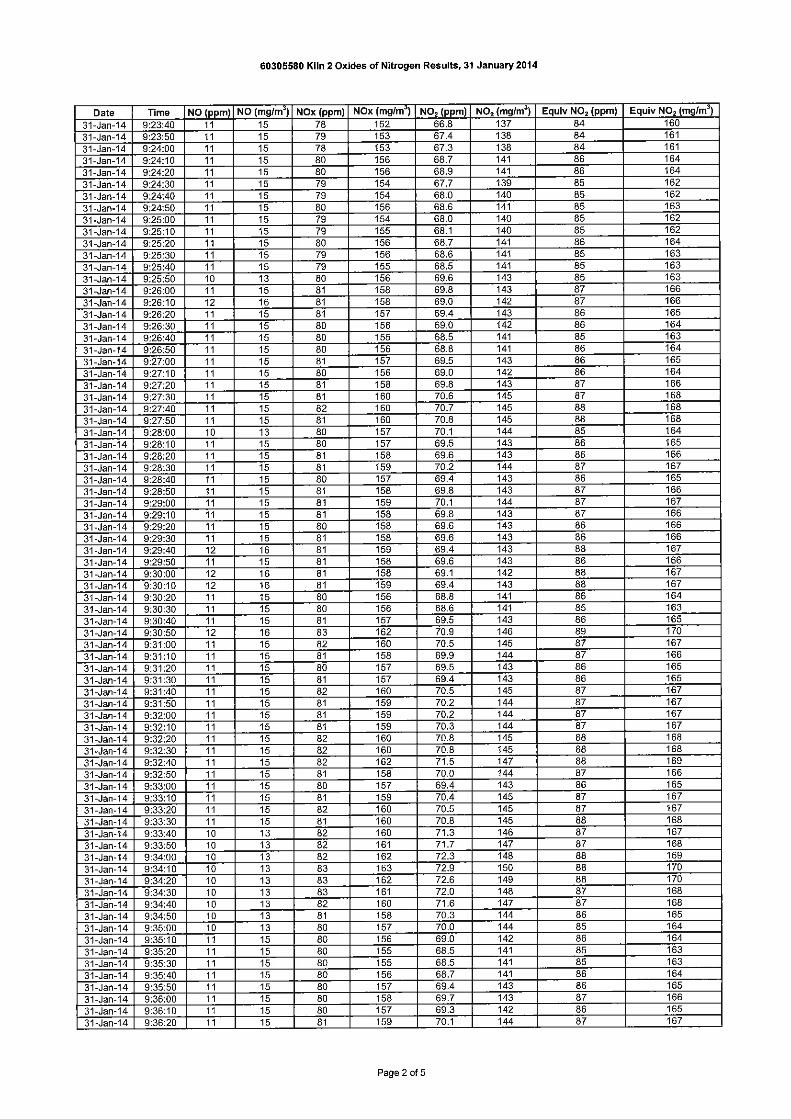
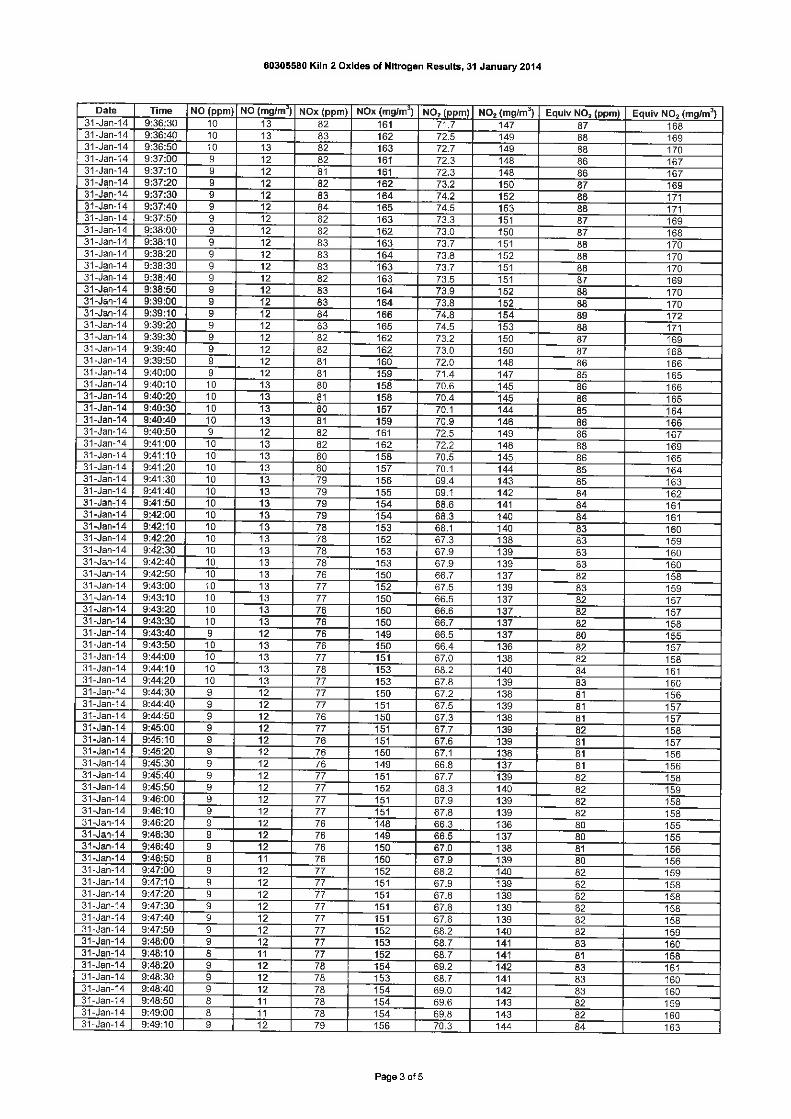
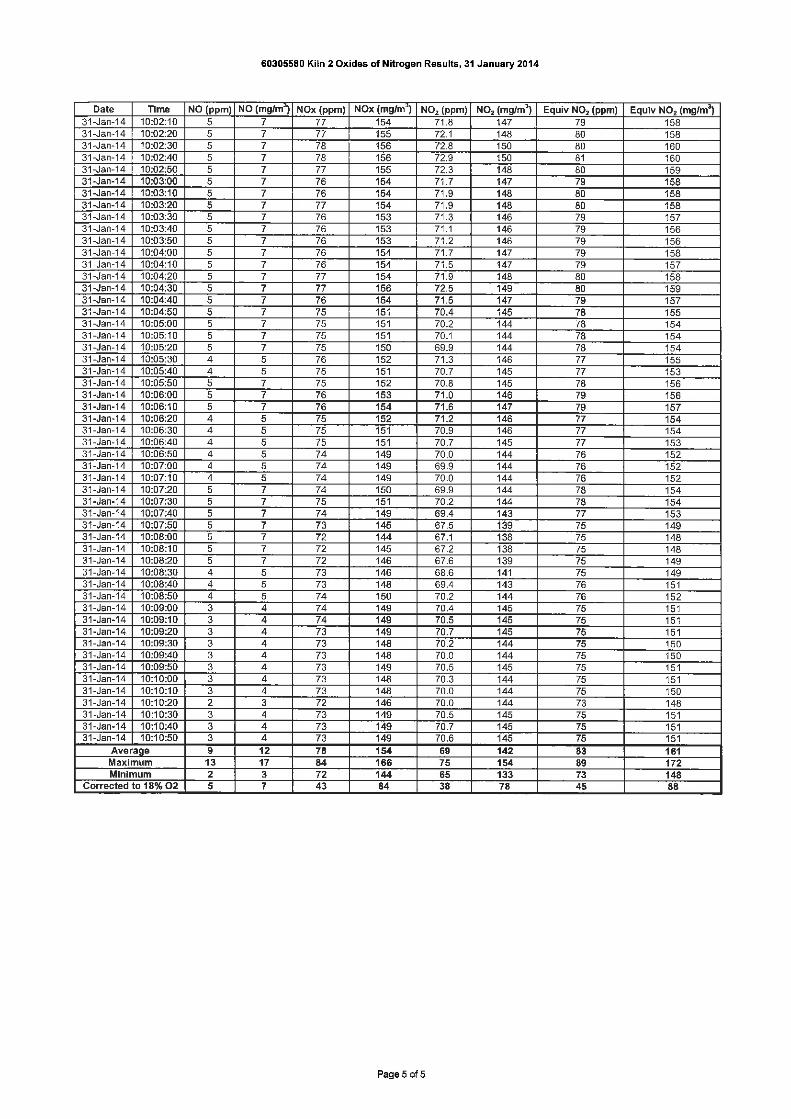
Table 6 Kiln 1 and 2 Gaseous Data Results, January 2014
Pollutant Kiln 1 (EPL 14) Kiln 2 (EPL 15) Regulatory Limit
Date Sampled 29/01/2014 31/01/2014 -
Time Sampled 10:46:21 – 11:46:21 9:10:50 – 10:10:50 -
Stack Gas Flowrate (m3/s) (00C, dry gas,1atm pressure) 5.5 5.3 -
Total Oxides of Nitrogen (as EquivalentNO2) (mg/m3) at 18% O2
75 88 100
Total Oxides of Nitrogen (as EquivalentNO2) (mg/s) at 18% O2
412.5 466.4 NA
Nitrogen Oxide (NO) (mg/m3) at 18% O2 8 7 NA
Nitrogen Oxide (NO) (mg/s) at 18% O2 44 37.1 NA
Nitrogen Dioxide (NO2) (mg/m3) at 18%O2
63 78 NA
Nitrogen Dioxide (NO2) (mg/s) at 18% O2 346.5 413.4 NA
Total Oxides of Nitrogen (NOx) (mg/m3)at 18% O2
70 84 NA
Total Oxides of Nitrogen (NOx) (mg/s) at18% O2
385 445.2 NA
Oxygen (O2) % 16.15 15.60 NA

AECOM Emissions Testing Report 2013-14 – National Ceramic Industries AustraliaCommercial-in-Confidence
http://vpo.au.aecomnet.com/projects/21134_NSWB1320961/6DraftDocs/6.1 Reports/1.9 Stack Testing 2013/NCIA Emissions Testing Report2013_2014.docxRevision 1.0 – 05-May-2014Prepared for – National Ceramic Industries Australia – ABN: 83100467267
13
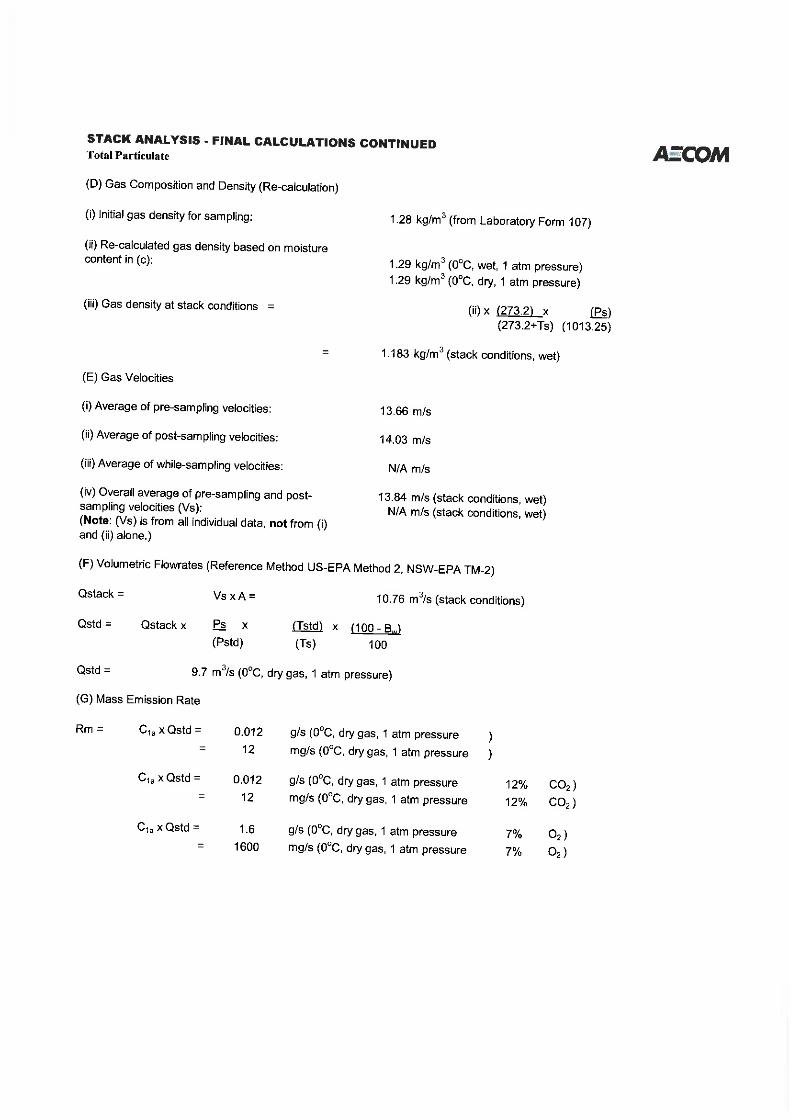
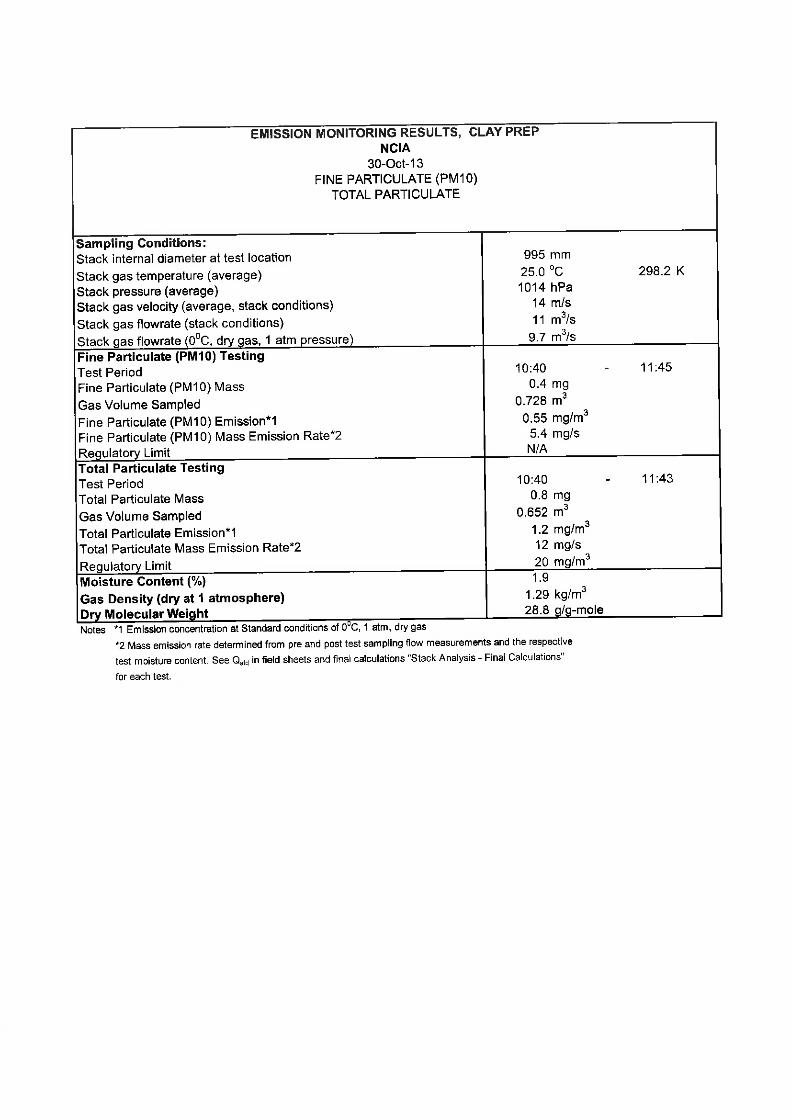
Table 7 Clay Prep Stack Total Particulate and Fine Particulate (PM10) Results, 30 October 2013
Sampling Conditions:
Stack internal diameter at test location 995 mm
Stack gas temperature (average) 25.0 oC 298.2 K
Stack pressure (average) 1014 hPa
Stack gas velocity (average, stack conditions) 14 m/s
Stack gas flowrate (stack conditions) 11 m3/s
Stack gas flowrate (00C, dry gas, 1 atm pressure) 9.7 m3/sFine Particulate (PM10) Testing
Test Period 10:40 - 11:45
Fine Particulate (PM10) Mass 0.4 mg
Gas Volume Sampled 0.728 m3
Fine Particulate (PM10) Emission*1 0.55 mg/m3
Fine Particulate (PM10) Mass Emission Rate*2 5.4 mg/s
Regulatory Limit N/ATotal Particulate Testing
Test Period 10:40 - 11:43
Total Particulate Mass 0.8 mg
Gas Volume Sampled 0.652 m3
Total Particulate Emission*1 1.2 mg/m3
Total Particulate Mass Emission Rate*2 12 mg/s
Regulatory Limit 20 mg/m3
Moisture Content (%) 1.9
Gas Density (dry at 1 atmosphere) 1.29 kg/m3
Dry Molecular Weight 28.8 g/g-mole
Notes *1 Emission concentration at Standard conditions of 00C, 1 atm, dry gas*2 Mass emission rate determined from pre and post-test sampling flow measurements and the respectivetest moisture content. See Qstd in field sheets and final calculations "Stack Analysis - Final Calculations"for each test.

AECOM Emissions Testing Report 2013-14 – National Ceramic Industries AustraliaCommercial-in-Confidence
http://vpo.au.aecomnet.com/projects/21134_NSWB1320961/6DraftDocs/6.1 Reports/1.9 Stack Testing 2013/NCIA Emissions Testing Report2013_2014.docxRevision 1.0 – 05-May-2014Prepared for – National Ceramic Industries Australia – ABN: 83100467267
14
Table 8 Pressing and Drying Stack Total Particulate and Fine Particulate (PM10) Results, 30 October 2013
Sampling Conditions:
Stack internal diameter at test location 1000 mm
Stack gas temperature (average) 37.5 oC 310.7 K
Stack pressure (average) 1013 hPa
Stack gas velocity (average, stack conditions) 13 m/s
Stack gas flowrate (stack conditions) 10 m3/s
Stack gas flowrate (00C, dry gas, 1 atm pressure) 8.8 m3/sFine Particulate (PM10) Testing
Test Period 10:08 - 11:30
Fine Particulate (PM10) Mass 2.7 mg
Gas Volume Sampled 0.964 m3
Fine Particulate (PM10) Emission*1 2.8 mg/m3
Fine Particulate (PM10) Mass Emission Rate*2 25 mg/s
Regulatory Limit N/ATotal Particulate Testing
Test Period 10:08 - 11:30
Total Particulate Mass 8.5 mg
Gas Volume Sampled 0.71 m3
Total Particulate Emission*1 12 mg/m3
Total Particulate Mass Emission Rate*2 100 mg/s
Regulatory Limit 20 mg/m3
Moisture Content (%) 1.7
Gas Density (dry at 1 atmosphere) 1.29 kg/m3
Dry Molecular Weight 28.8 g/g-mole
Notes *1 Emission concentration at Standard conditions of 00C, 1 atm, dry gas*2 Mass emission rate determined from pre and post-test sampling flow measurements and the respectivetest moisture content. See Qstd in field sheets and final calculations "Stack Analysis - Final Calculations"for each test.

AECOM Emissions Testing Report 2013-14 – National Ceramic Industries AustraliaCommercial-in-Confidence
http://vpo.au.aecomnet.com/projects/21134_NSWB1320961/6DraftDocs/6.1 Reports/1.9 Stack Testing 2013/NCIA Emissions Testing Report2013_2014.docxRevision 1.0 – 05-May-2014Prepared for – National Ceramic Industries Australia – ABN: 83100467267
15
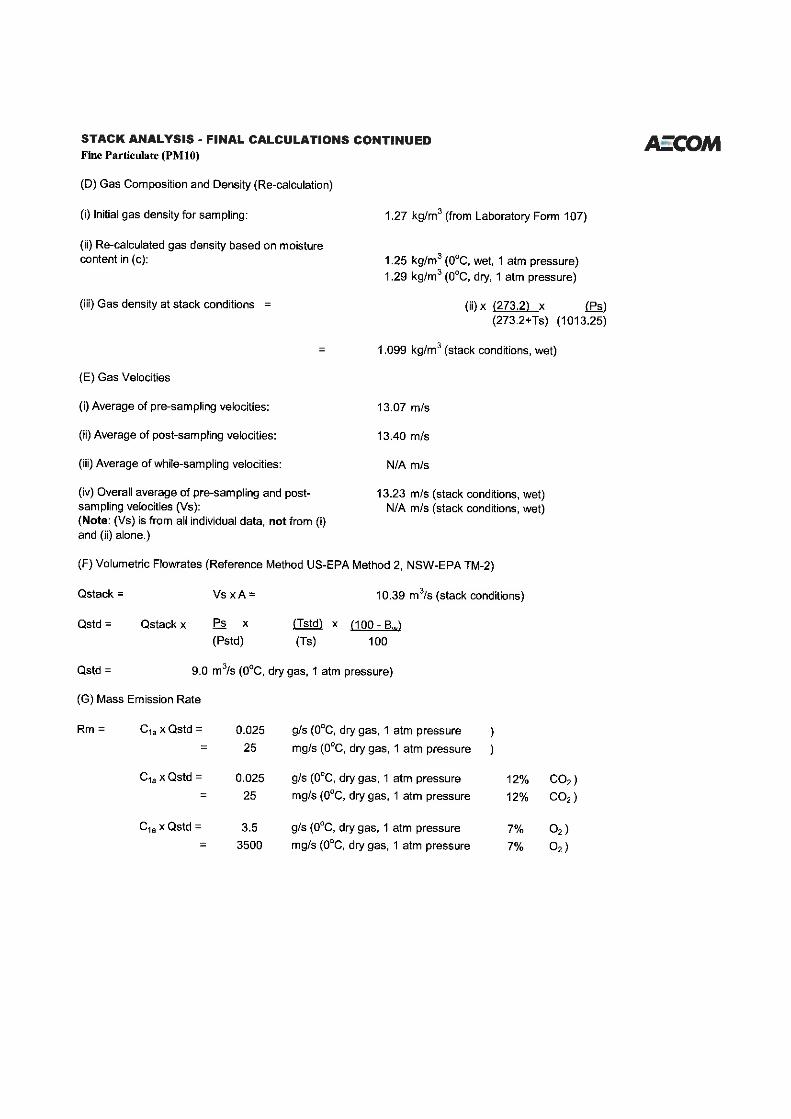
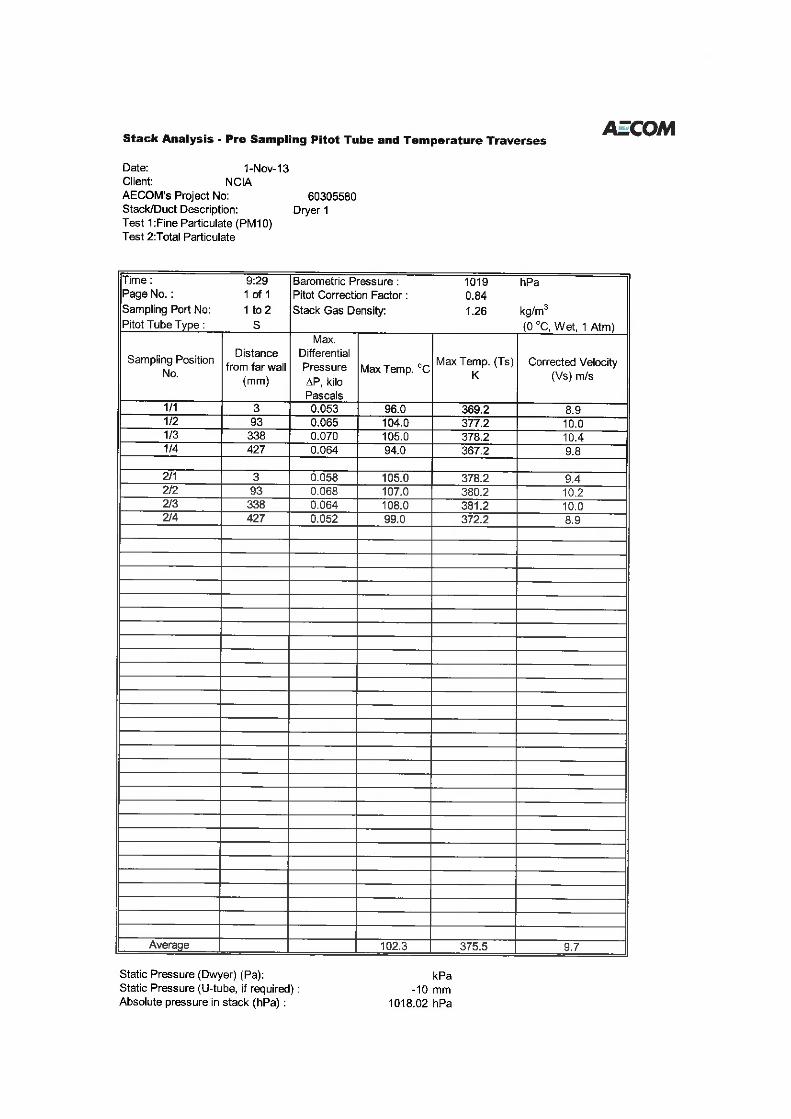
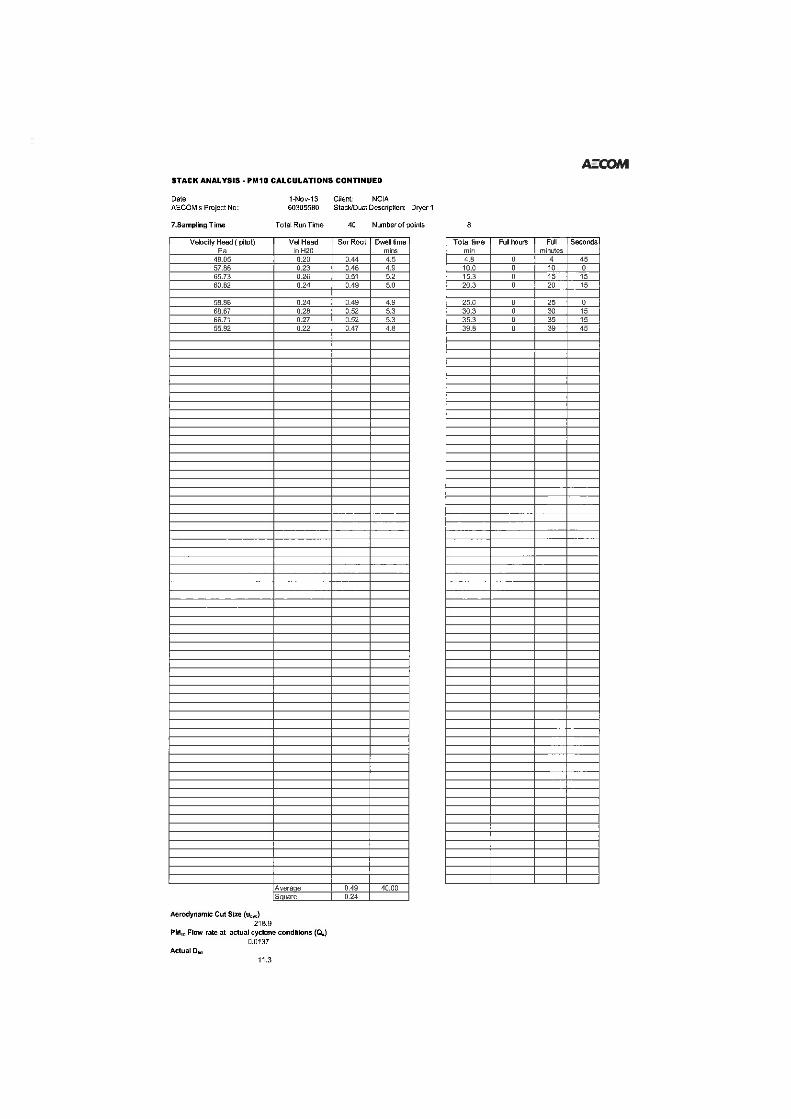
Table 9 Dryer 1 Stack Total Particulate and Fine Particulate (PM10) Results, 1 November 2013
Sampling Conditions:
Stack internal diameter at test location 490 mm
Stack gas temperature (average) 102.3 oC 375.5 K
Stack pressure (average) 1018 hPa
Stack gas velocity (average, stack conditions) 9.6 m/s
Stack gas flowrate (stack conditions) 1.8 m3/s
Stack gas flowrate (00C, dry gas, 1 atm pressure) 1.3 m3/sFine Particulate (PM10) Testing
Test Period 9:52 - 10:32
Fine Particulate (PM10) Mass 0.4 mg
Gas Volume Sampled 0.413 m3
Fine Particulate (PM10) Emission*1 0.97 mg/m3
Fine Particulate (PM10) Mass Emission Rate*2 1.2 mg/s
Regulatory Limit N/ATotal Particulate Testing
Test Period 9:52 - 10:32
Total Particulate Mass 1 mg
Gas Volume Sampled 0.437 m3
Total Particulate Emission*1 2.3 mg/m3
Total Particulate Mass Emission Rate*2 2.9 mg/s
Regulatory Limit 20 mg/m3
Moisture Content (%) 3.9
Gas Density (dry at 1 atmosphere) 1.29 kg/m3
Dry Molecular Weight 28.9 g/g-mole
Notes *1 Emission concentration at Standard conditions of 00C, 1 atm, dry gas *2 Mass emission rate determined from pre and post-test sampling flow measurements and the respective
test moisture content. See Qstd in field sheets and final calculations "Stack Analysis - Final Calculations"for each test.

AECOM Emissions Testing Report 2013-14 – National Ceramic Industries AustraliaCommercial-in-Confidence
http://vpo.au.aecomnet.com/projects/21134_NSWB1320961/6DraftDocs/6.1 Reports/1.9 Stack Testing 2013/NCIA Emissions Testing Report2013_2014.docxRevision 1.0 – 05-May-2014Prepared for – National Ceramic Industries Australia – ABN: 83100467267
16
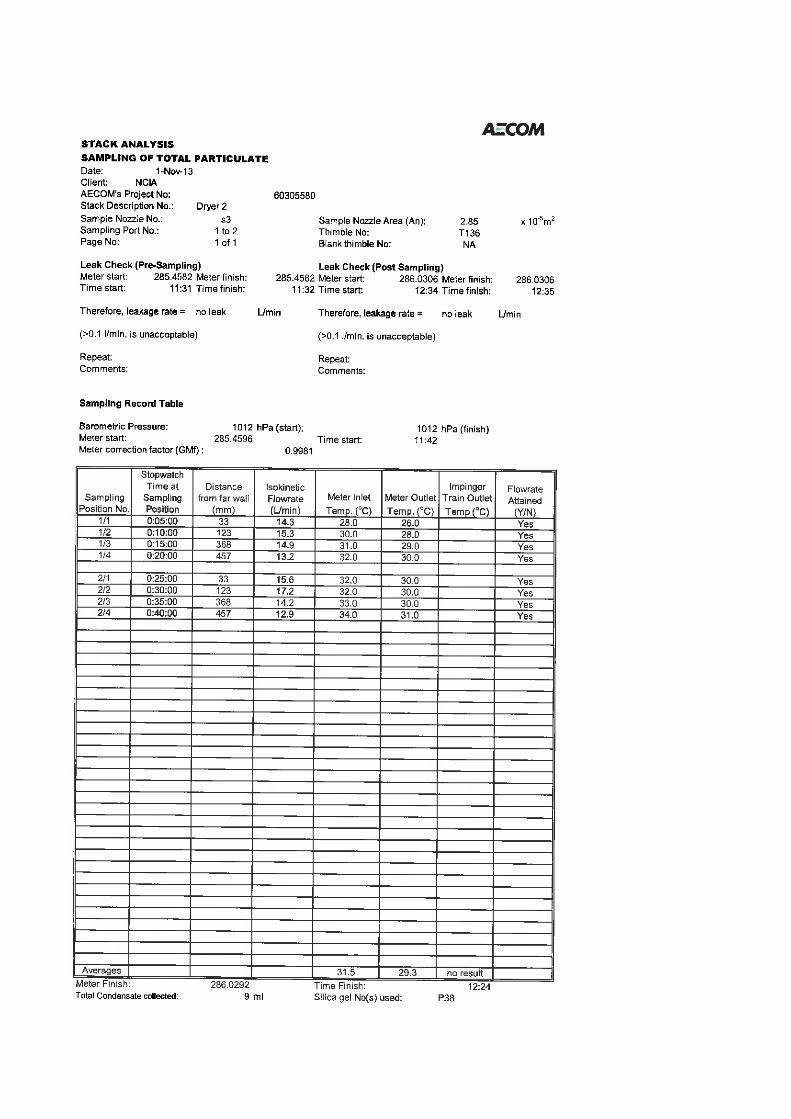
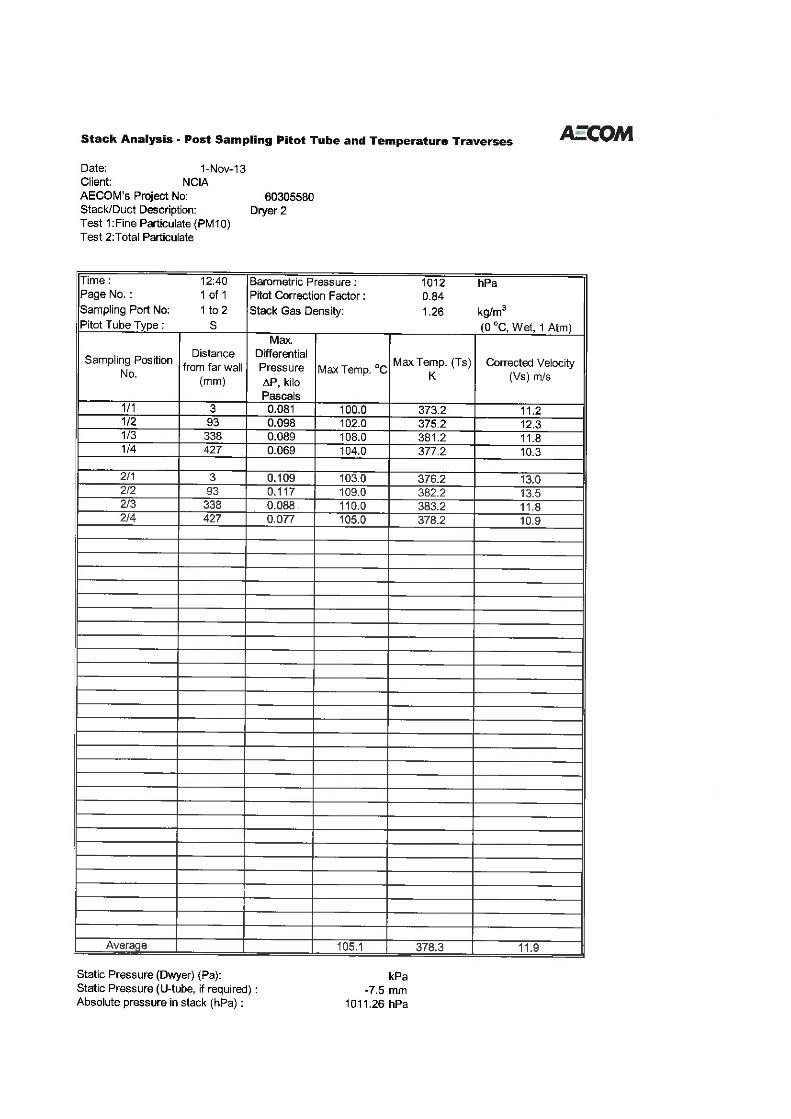
Table 10 Dryer 2 Stack Total Particulate and Fine Particulate (PM10) Results, 1 November 2013
Sampling Conditions:
Stack internal diameter at test location 490 mm
Stack gas temperature (average) 105.8 oC 379.0 K
Stack pressure (average) 1011 hPa
Stack gas velocity (average, stack conditions) 12 m/s
Stack gas flowrate (stack conditions) 2.2 m3/s
Stack gas flowrate (00C, dry gas, 1 atm pressure) 1.5 m3/sFine Particulate (PM10) Testing
Test Period 11:42 - 12:24
Fine Particulate (PM10) Mass 0.4 mg
Gas Volume Sampled 0.444 m3
Fine Particulate (PM10) Emission*1 0.9 mg/m3
Fine Particulate (PM10) Mass Emission Rate*2 1.4 mg/s
Regulatory Limit NATotal Particulate Testing
Test Period 11:42 - 12:24
Total Particulate Mass 1.1 mg
Gas Volume Sampled 0.511 m3
Total Particulate Emission*1 2.2 mg/m3
Total Particulate Mass Emission Rate*2 3.3 mg/s
Regulatory Limit 20 mg/m3
Moisture Content (%) 5.1
Gas Density (dry at 1 atmosphere) 1.29 kg/m3
Dry Molecular Weight 28.8 g/g-mole
Notes *1 Emission concentration at Standard conditions of 00C, 1 atm, dry gas *2 Mass emission rate determined from pre and post-test sampling flow measurements and the respective test moisture content. See Qstd in field sheets and final calculations "Stack Analysis - Final calculations" for each test.

AECOM Emissions Testing Report 2013-14 – National Ceramic Industries AustraliaCommercial-in-Confidence
http://vpo.au.aecomnet.com/projects/21134_NSWB1320961/6DraftDocs/6.1 Reports/1.9 Stack Testing 2013/NCIA Emissions Testing Report2013_2014.docxRevision 1.0 – 05-May-2014Prepared for – National Ceramic Industries Australia – ABN: 83100467267
17
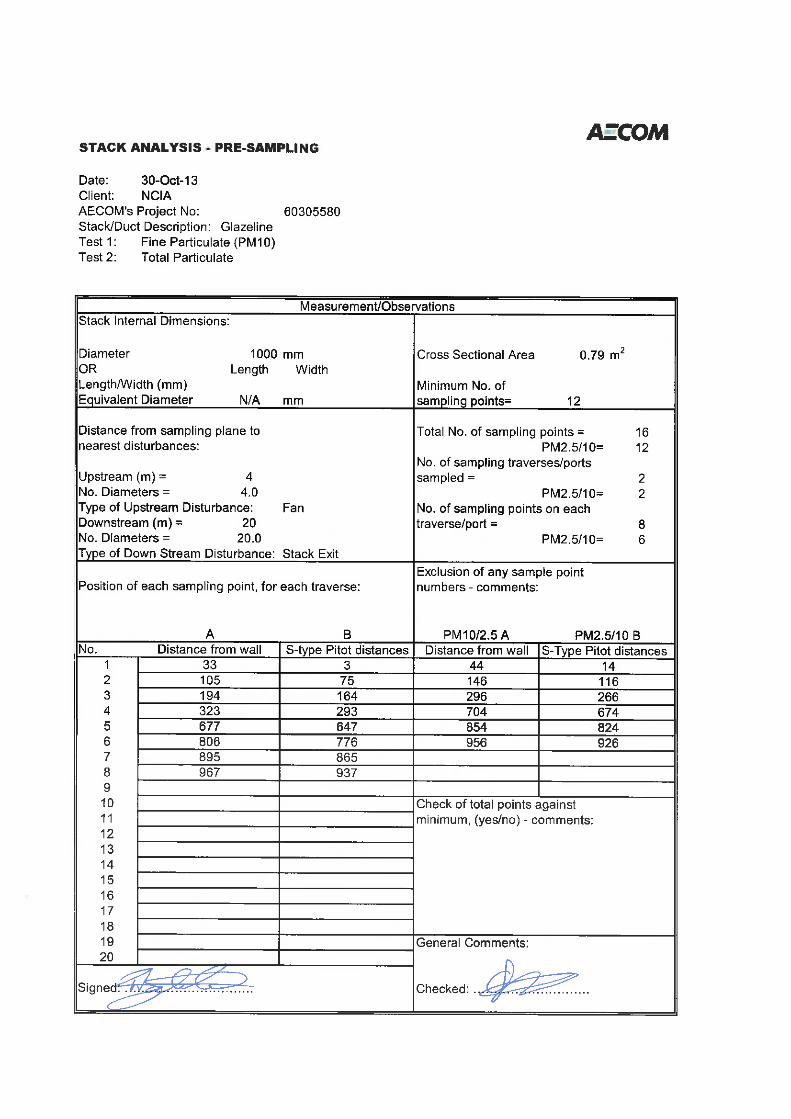
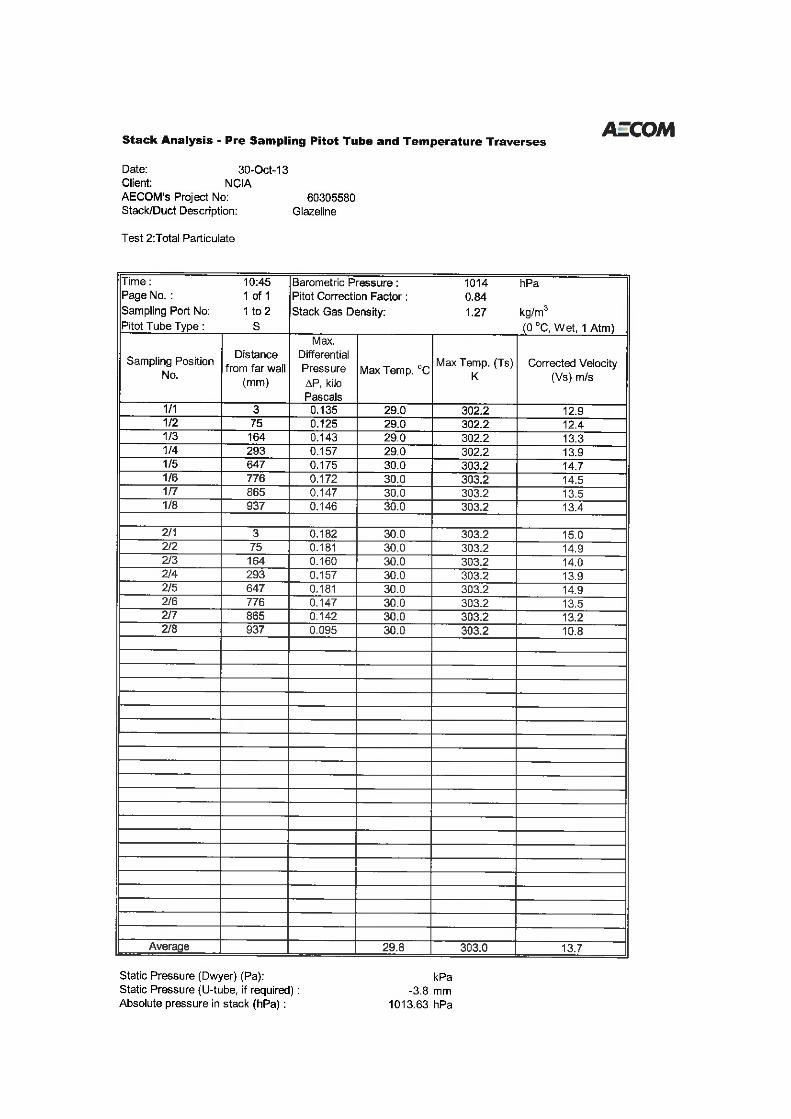
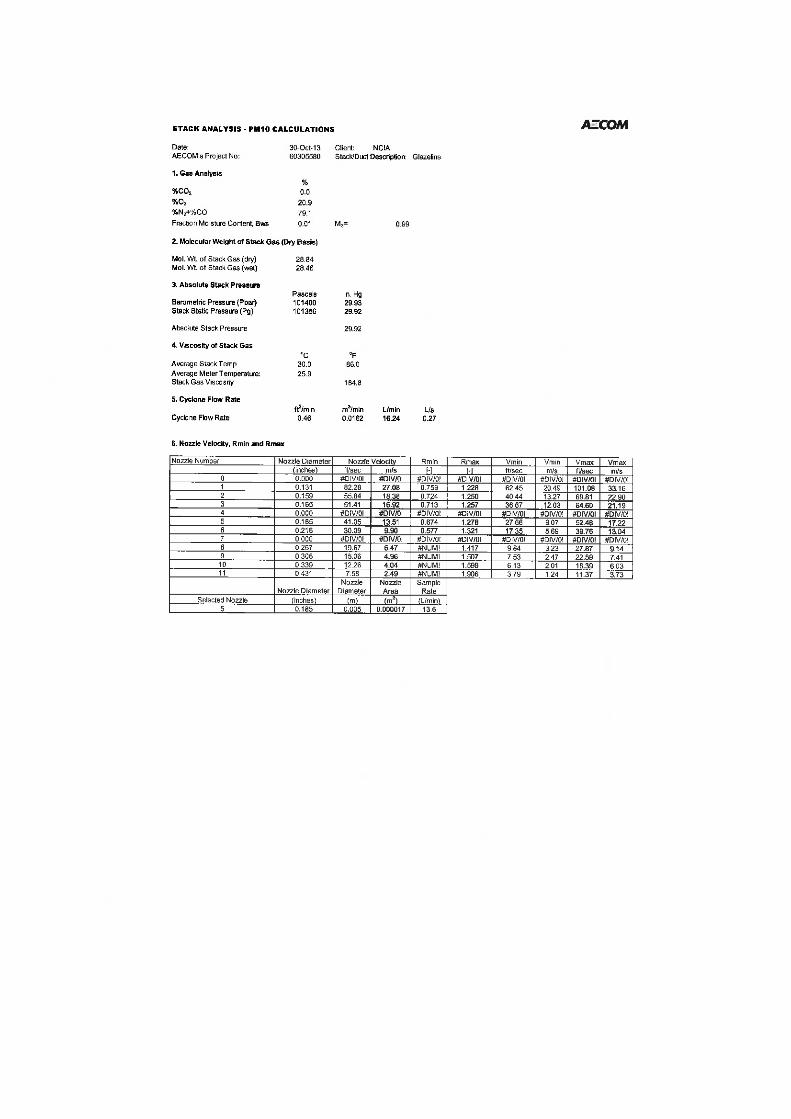
Table 11 Glaze Line Stack Total Particulate and Fine Particulate (PM10) Results, 30 October 2013
Sampling Conditions:
Stack internal diameter at test location 1000 mm
Stack gas temperature (average) 29.9 oC 303.1 K
Stack pressure (average) 1014 hPa
Stack gas velocity (average, stack conditions) 14 m/s
Stack gas flowrate (stack conditions) 11 m3/s
Stack gas flowrate (00C, dry gas, 1 atm pressure) 9.7 m3/sFine Particulate (PM10) Testing
Test Period 11:37 - 13:00
Fine Particulate (PM10) Mass <0.2 mg
Gas Volume Sampled 0.915 m3
Fine Particulate (PM10) Emission*1 <0.22 mg/m3
Fine Particulate (PM10) Mass Emission Rate*2 <2.2 mg/s
Regulatory Limit N/ATotal Particulate Testing
Test Period 11:37 - 13:00
Total Particulate Mass 0.4 mg
Gas Volume Sampled 0.765 m3
Total Particulate Emission*1 0.52 mg/m3
Total Particulate Mass Emission Rate*2 5 mg/s
Regulatory Limit 20 mg/m3
Moisture Content (%) 1.2
Gas Density (dry at 1 atmosphere) 1.29 kg/m3
Dry Molecular Weight 28.8 g/g-mole
Notes *1 Emission concentration at Standard conditions of 00C, 1 atm, dry gas*2 Mass emission rate determined from pre and post-test sampling flow measurements and the respective
test moisture content. See Qstd in field sheets and final calculations "Stack Analysis - Final Calculations" for each test.
AECOM Emissions Testing Report 2013-14 – National Ceramic Industries AustraliaCommercial-in-Confidence
http://vpo.au.aecomnet.com/projects/21134_NSWB1320961/6DraftDocs/6.1 Reports/1.9 Stack Testing 2013/NCIA Emissions Testing Report2013_2014.docxRevision 1.0 – 05-May-2014Prepared for – National Ceramic Industries Australia – ABN: 83100467267
18
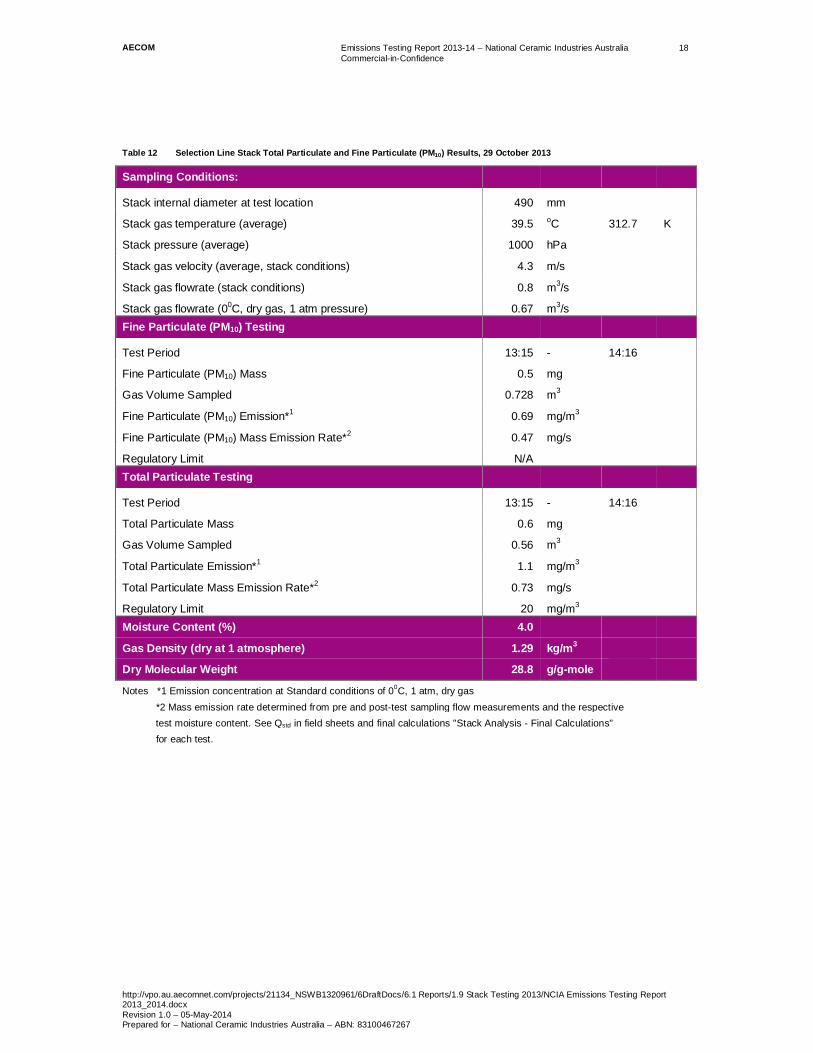
Table 12 Selection Line Stack Total Particulate and Fine Particulate (PM10) Results, 29 October 2013
Sampling Conditions:
Stack internal diameter at test location 490 mm
Stack gas temperature (average) 39.5 oC 312.7 K
Stack pressure (average) 1000 hPa
Stack gas velocity (average, stack conditions) 4.3 m/s
Stack gas flowrate (stack conditions) 0.8 m3/s
Stack gas flowrate (00C, dry gas, 1 atm pressure) 0.67 m3/sFine Particulate (PM10) Testing
Test Period 13:15 - 14:16
Fine Particulate (PM10) Mass 0.5 mg
Gas Volume Sampled 0.728 m3
Fine Particulate (PM10) Emission*1 0.69 mg/m3
Fine Particulate (PM10) Mass Emission Rate*2 0.47 mg/s
Regulatory Limit N/ATotal Particulate Testing
Test Period 13:15 - 14:16
Total Particulate Mass 0.6 mg
Gas Volume Sampled 0.56 m3
Total Particulate Emission*1 1.1 mg/m3
Total Particulate Mass Emission Rate*2 0.73 mg/s
Regulatory Limit 20 mg/m3
Moisture Content (%) 4.0
Gas Density (dry at 1 atmosphere) 1.29 kg/m3
Dry Molecular Weight 28.8 g/g-mole
Notes *1 Emission concentration at Standard conditions of 00C, 1 atm, dry gas*2 Mass emission rate determined from pre and post-test sampling flow measurements and the respectivetest moisture content. See Qstd in field sheets and final calculations "Stack Analysis - Final Calculations"for each test.

AECOM Emissions Testing Report 2013-14 – National Ceramic Industries AustraliaCommercial-in-Confidence
http://vpo.au.aecomnet.com/projects/21134_NSWB1320961/6DraftDocs/6.1 Reports/1.9 Stack Testing 2013/NCIA Emissions Testing Report2013_2014.docxRevision 1.0 – 05-May-2014Prepared for – National Ceramic Industries Australia – ABN: 83100467267
19
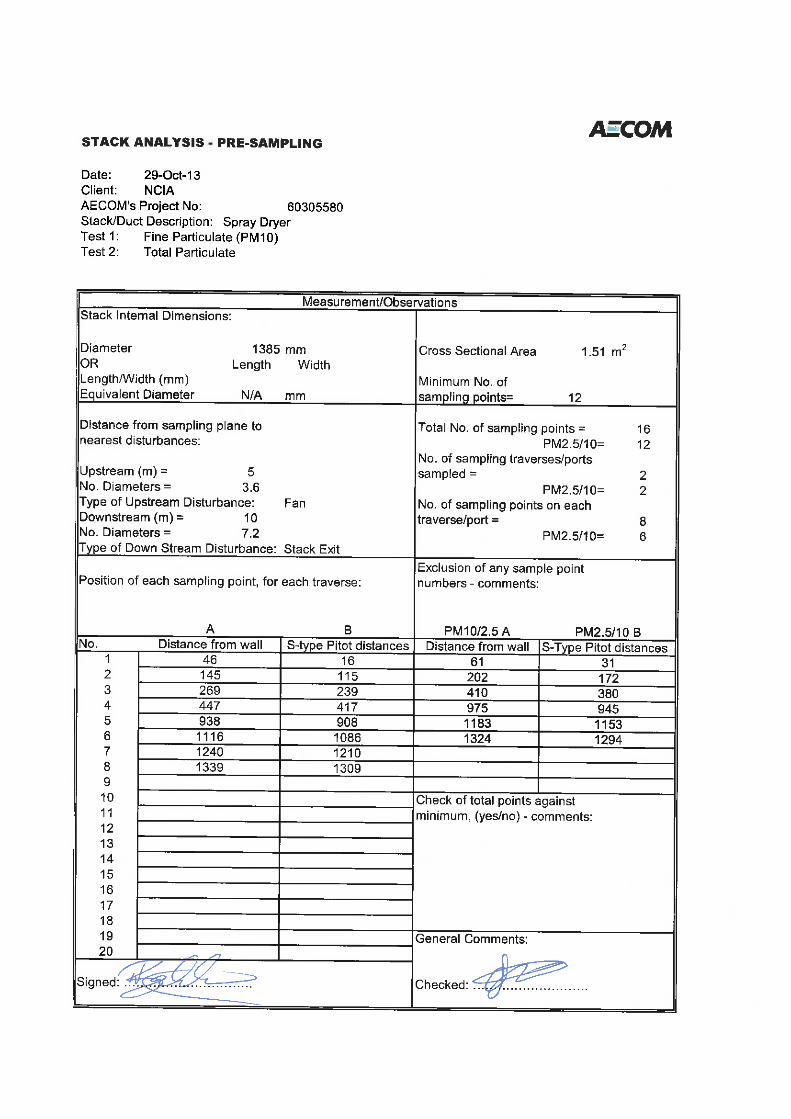
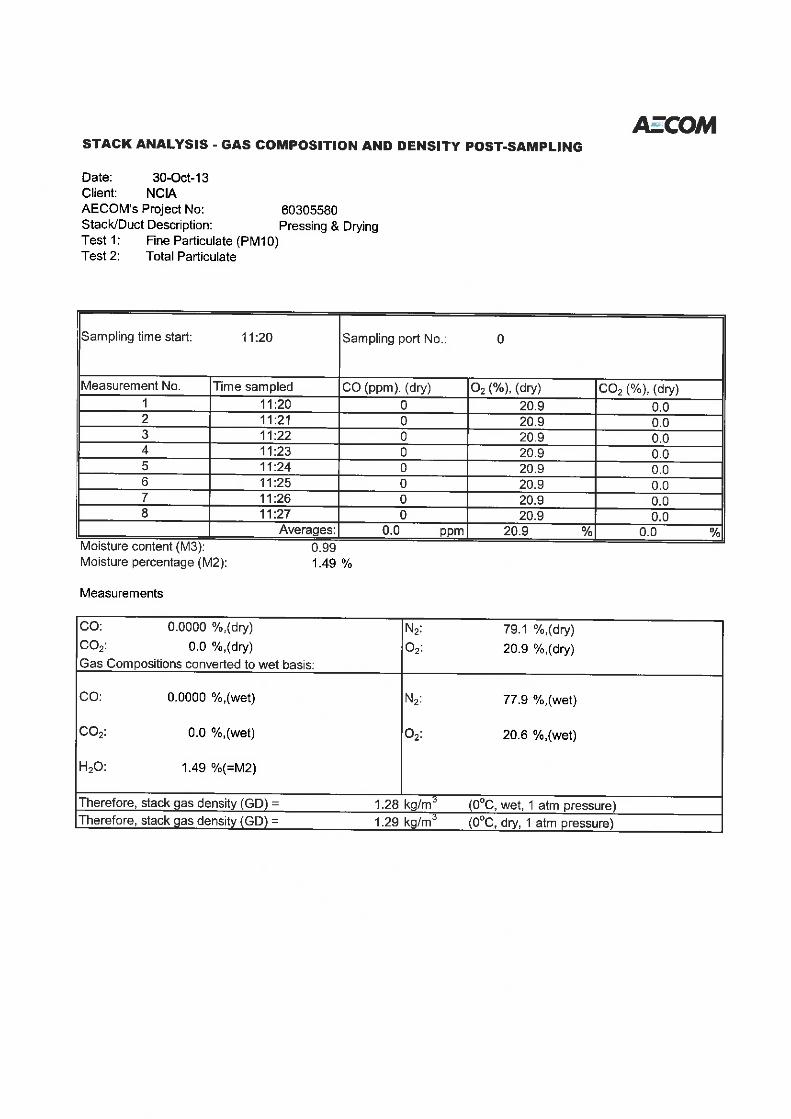
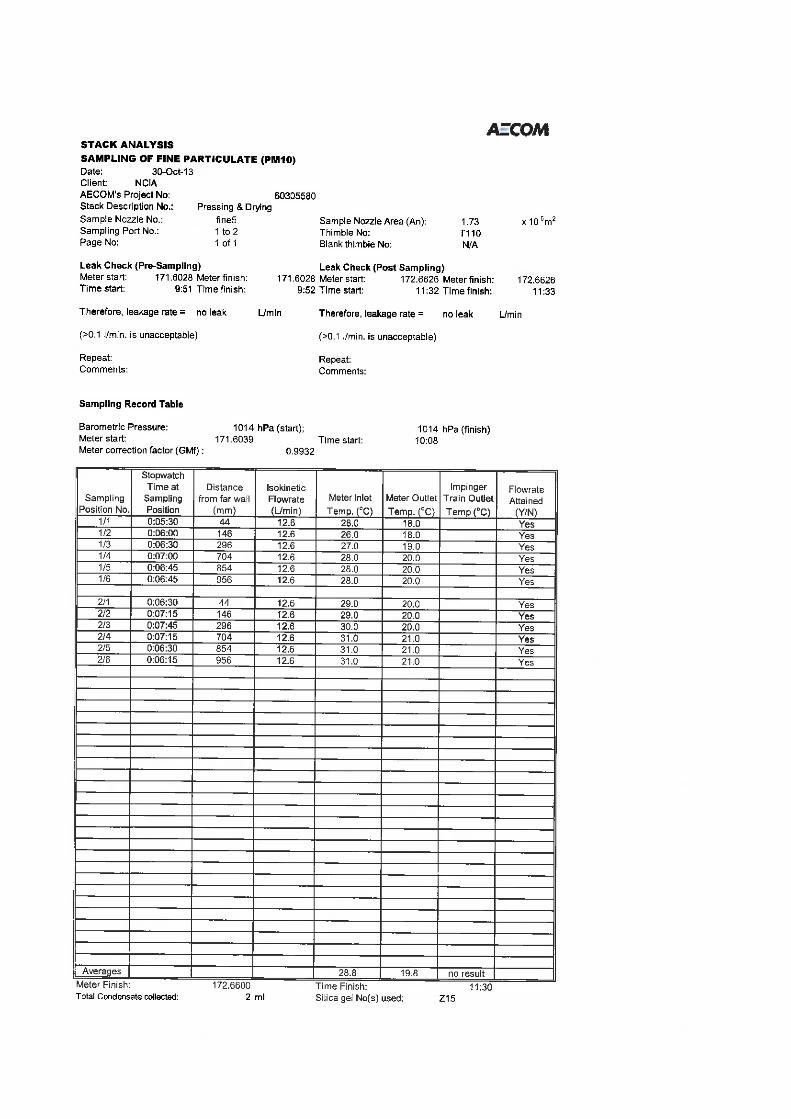
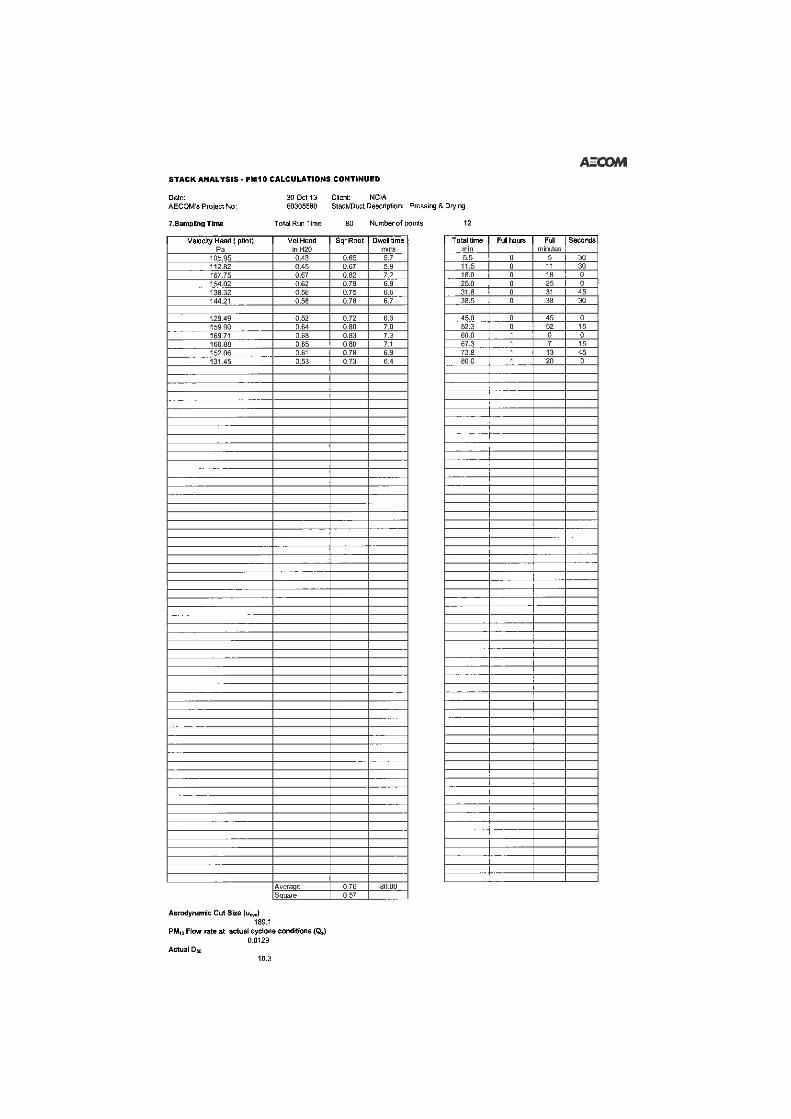
Table 13 Spray Dryer Stack Total Particulate and Fine Particulate (PM10) Results, 29 October 2013
Sampling Conditions:
Stack internal diameter at test location 1385 mm
Stack gas temperature (average) 89.1 oC 362.3 K
Stack pressure (average) 1000 hPa
Stack gas velocity (average, stack conditions) 20 m/s
Stack gas flowrate (stack conditions) 31 m3/s
Stack gas flowrate (00C, dry gas, 1 atm pressure) 21 m3/sFine Particulate (PM10) Testing
Test Period 10:43 - 12:03
Fine Particulate (PM10) Mass 4.3 mg
Gas Volume Sampled 0.685 m3
Fine Particulate (PM10) Emission*1 6.3 mg/m3
Fine Particulate (PM10) Mass Emission Rate*2 130 mg/s
Regulatory Limit N/ATotal Particulate Testing
Test Period 10:43 - 12:03
Total Particulate Mass 8.3 mg
Gas Volume Sampled 0.663 m3
Total Particulate Emission*1 13 mg/m3
Total Particulate Mass Emission Rate*2 260 mg/s
Regulatory Limit 20 mg/m3
Moisture Content (%) 9.9
Gas Density (dry at 1 atmosphere) 1.29 kg/m3
Dry Molecular Weight 28.9 g/g-mole
Notes *1 Emission concentration at Standard conditions of 00C, 1 atm, dry gas*2 Mass emission rate determined from pre and post-test sampling flow measurements and the respectivetest moisture content. See Qstd in field sheets and final calculations "Stack Analysis - Final Calculations"for each test.

AECOM Emissions Testing Report 2013-14 – National Ceramic Industries AustraliaCommercial-in-Confidence
http://vpo.au.aecomnet.com/projects/21134_NSWB1320961/6DraftDocs/6.1 Reports/1.9 Stack Testing 2013/NCIA Emissions Testing Report2013_2014.docxRevision 1.0 – 05-May-2014Prepared for – National Ceramic Industries Australia – ABN: 83100467267
20
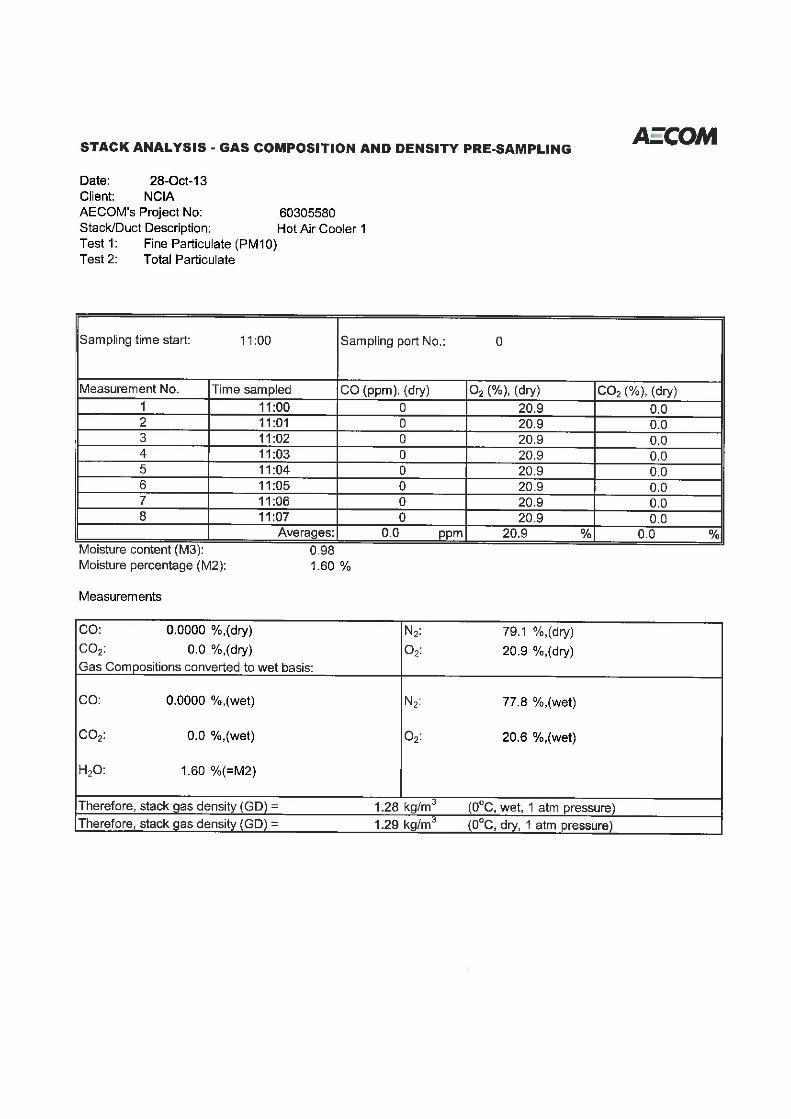
Table 14 Hot Air Cooler Stack Total Particulate and Fine Particulate (PM10) Results, 28 October 2013
Sampling Conditions:
Stack internal diameter at test location 1000 mm
Stack gas temperature (average) 87.7 oC 360.9 K
Stack pressure (average) 1011 hPa
Stack gas velocity (average, stack conditions) 24 m/s
Stack gas flowrate (stack conditions) 19 m3/s
Stack gas flowrate (00C, dry gas, 1 atm pressure) 14 m3/sFine Particulate (PM10) Testing
Test Period 11:25 - 12:46
Fine Particulate (PM10) Mass 0.4 mg
Gas Volume Sampled 1.14 m3
Fine Particulate (PM10) Emission*1 0.35 mg/m3
Fine Particulate (PM10) Mass Emission Rate*2 4.9 mg/s
Regulatory Limit N/ATotal Particulate Testing
Test Period 11:25 - 12:46
Total Particulate Mass 0.7 mg
Gas Volume Sampled 1.16 m3
Total Particulate Emission*1 0.6 mg/m3
Total Particulate Mass Emission Rate*2 8.3 mg/s
Regulatory Limit 5 mg/m3
Moisture Content (%) 1.6
Gas Density (dry at 1 atmosphere) 1.29 kg/m3
Dry Molecular Weight 28.8 g/g-mole
Notes *1 Emission concentration at Standard conditions of 00C, 1 atm, dry gas*2 Mass emission rate determined from pre and post-test sampling flow measurements and the respective
test moisture content. See Qstd in field sheets and final calculations "Stack Analysis - Final Calculations" for each test.

AECOM Emissions Testing Report 2013-14 – National Ceramic Industries AustraliaCommercial-in-Confidence
http://vpo.au.aecomnet.com/projects/21134_NSWB1320961/6DraftDocs/6.1 Reports/1.9 Stack Testing 2013/NCIA Emissions Testing Report2013_2014.docxRevision 1.0 – 05-May-2014Prepared for – National Ceramic Industries Australia – ABN: 83100467267
21
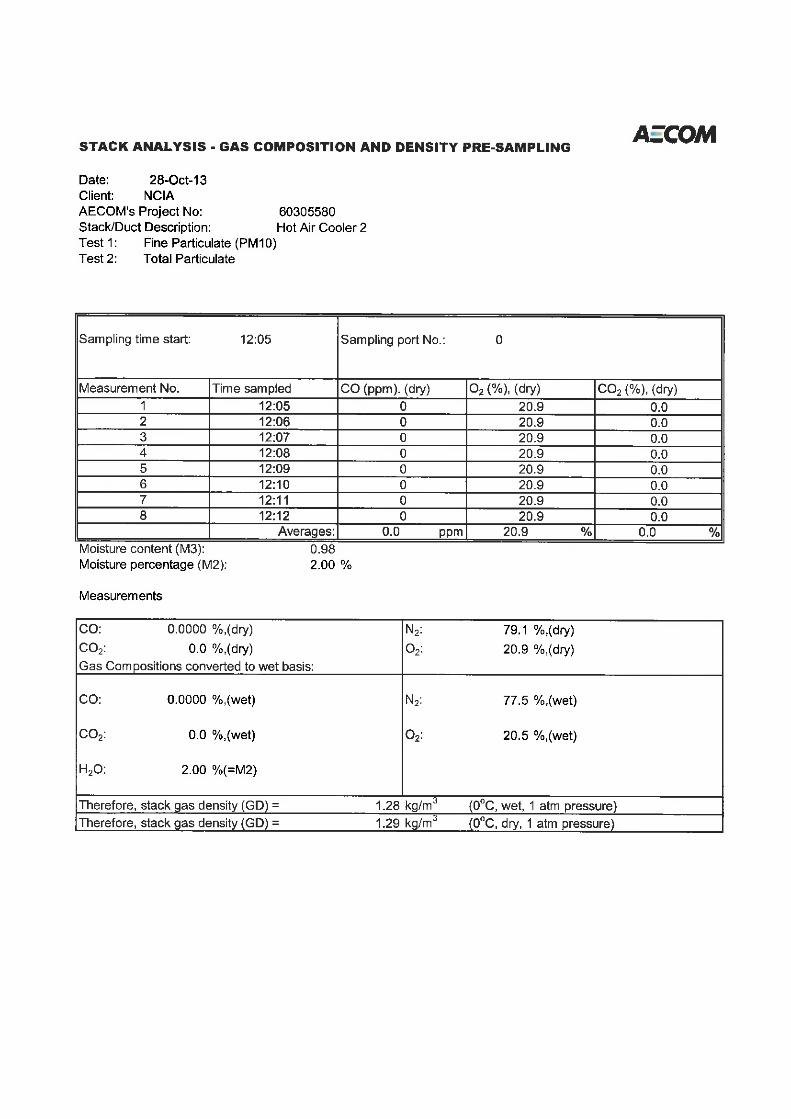
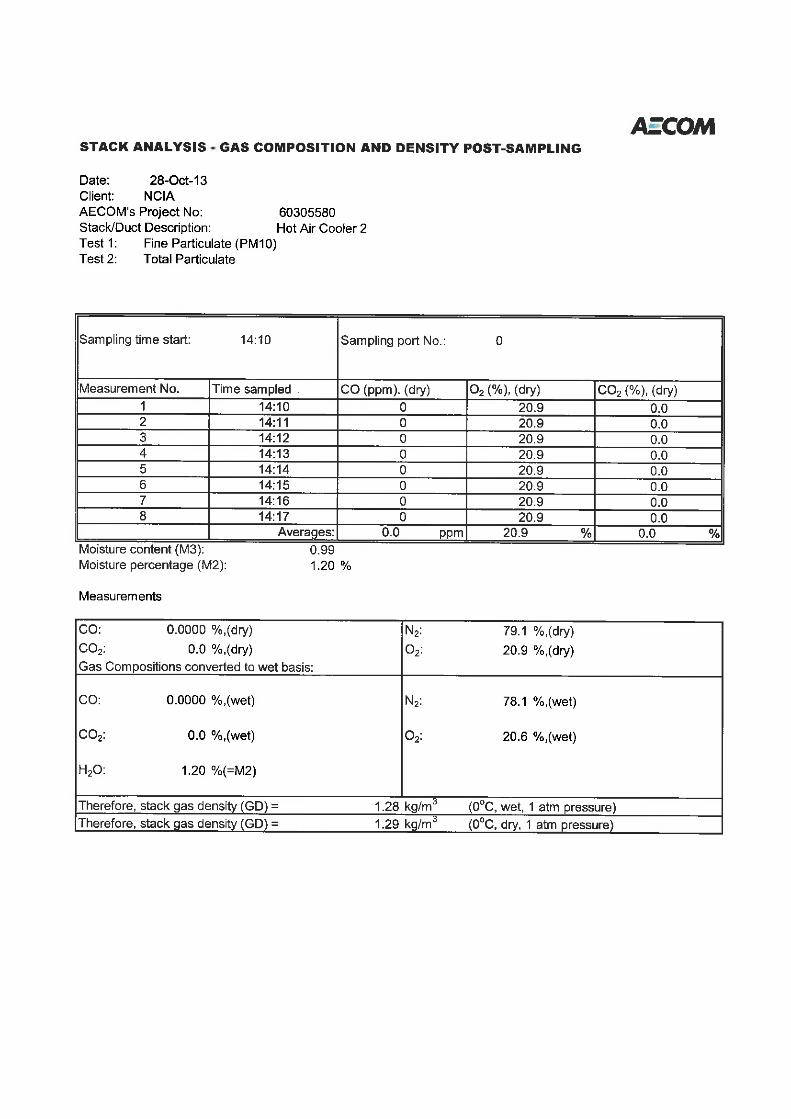
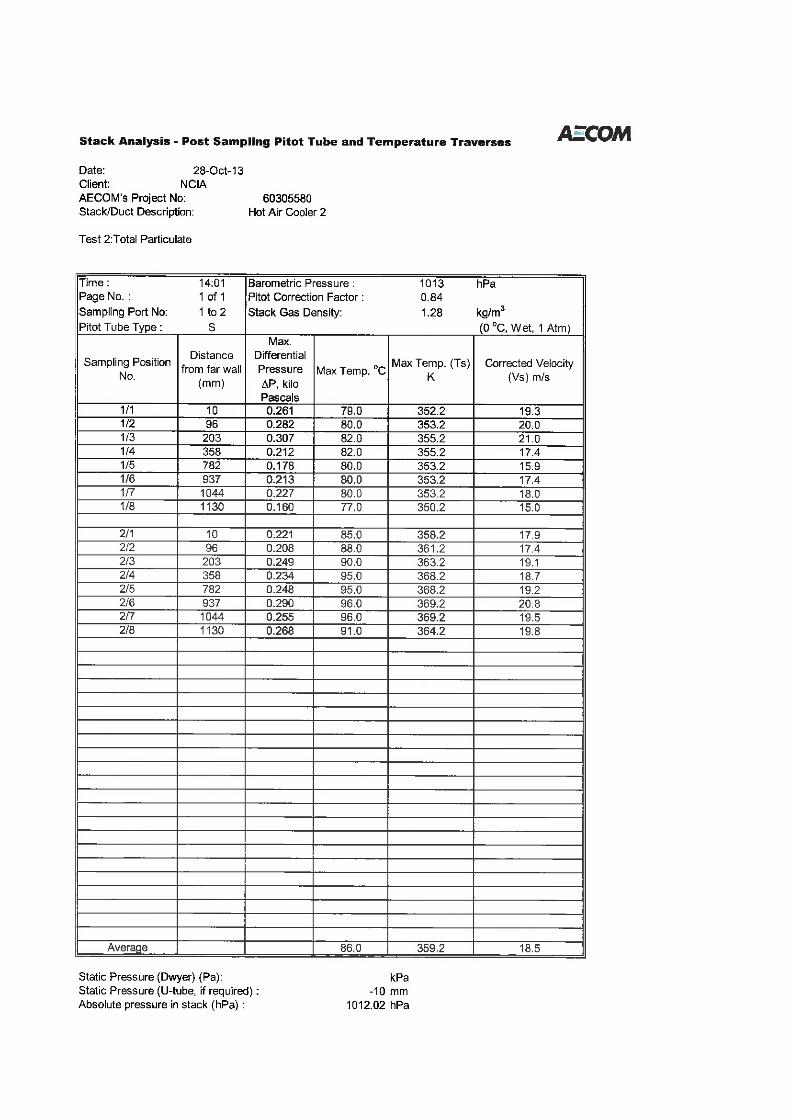
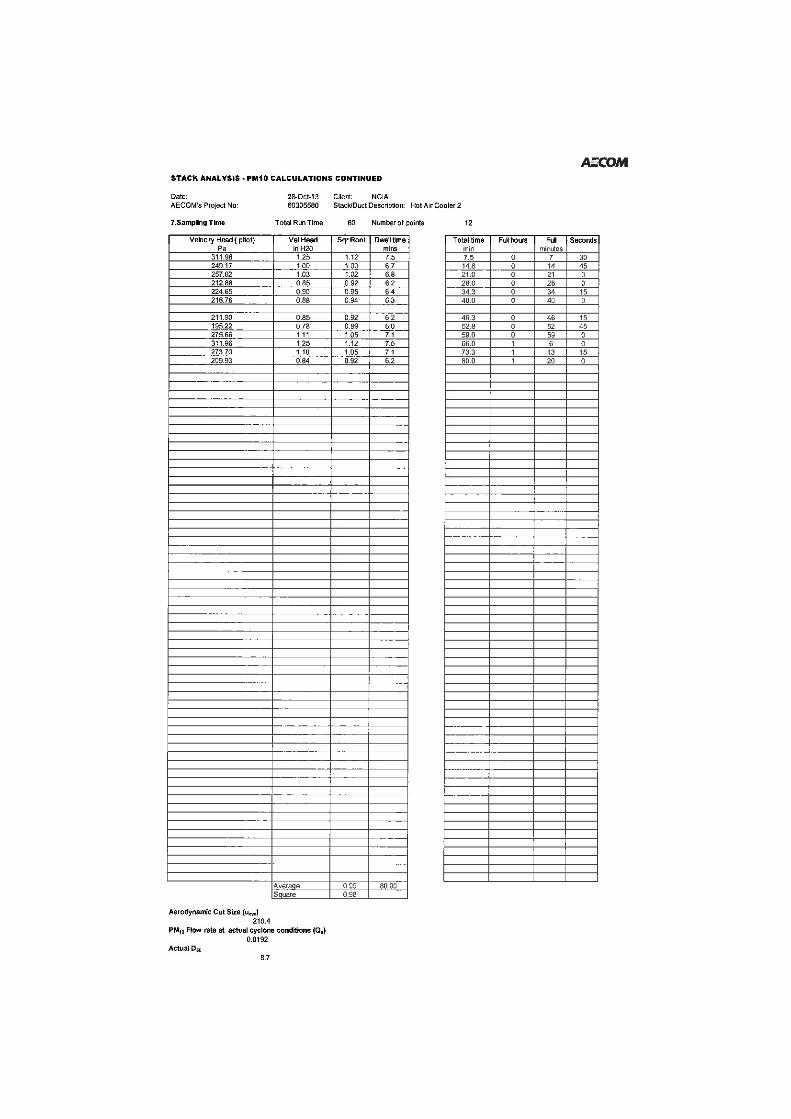
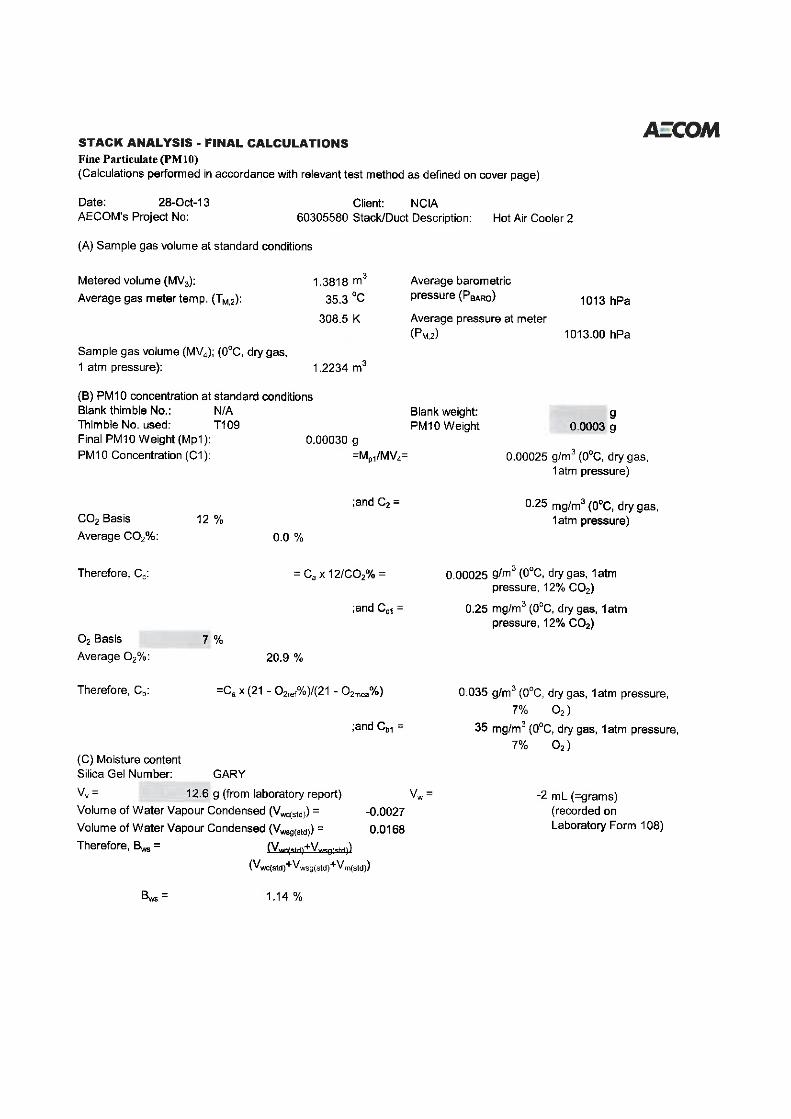
Table 15 Hot Air Cooler 2 Stack Total Particulate and Fine Particulate (PM10) Results, 28 October 2013
Sampling Conditions:
Stack internal diameter at test location 1200 mm
Stack gas temperature (average) 90.0 oC 363.2 K
Stack pressure (average) 1012 hPa
Stack gas velocity (average, stack conditions) 19 m/s
Stack gas flowrate (stack conditions) 21 m3/s
Stack gas flowrate (00C, dry gas, 1 atm pressure) 16 m3/sFine Particulate (PM10) Testing
Test Period 13:00 - 14:22
Fine Particulate (PM10) Mass 0.3 mg
Gas Volume Sampled 1.22 m3
Fine Particulate (PM10) Emission*1 0.25 mg/m3
Fine Particulate (PM10) Mass Emission Rate*2 4 mg/s
Regulatory Limit N/ATotal Particulate Testing
Test Period 13:00 - 14:22
Total Particulate Mass 0.4 mg
Gas Volume Sampled 0.807 m3
Total Particulate Emission*1 0.5 mg/m3
Total Particulate Mass Emission Rate*2 7.8 mg/s
Regulatory Limit 5 mg/m3
Moisture Content (%) 1.3
Gas Density (dry at 1 atmosphere) 1.29 kg/m3
Dry Molecular Weight 28.8 g/g-mole
Notes *1 Emission concentration at Standard conditions of 00C, 1 atm, dry gas*2 Mass emission rate determined from pre and post-test sampling flow measurements and the respectivetest moisture content. See Qstd in field sheets and final calculations "Stack Analysis - Final Calculations"for each test.

AECOM Emissions Testing Report 2013-14 – National Ceramic Industries AustraliaCommercial-in-Confidence
http://vpo.au.aecomnet.com/projects/21134_NSWB1320961/6DraftDocs/6.1 Reports/1.9 Stack Testing 2013/NCIA Emissions Testing Report2013_2014.docxRevision 1.0 – 05-May-2014Prepared for – National Ceramic Industries Australia – ABN: 83100467267
22
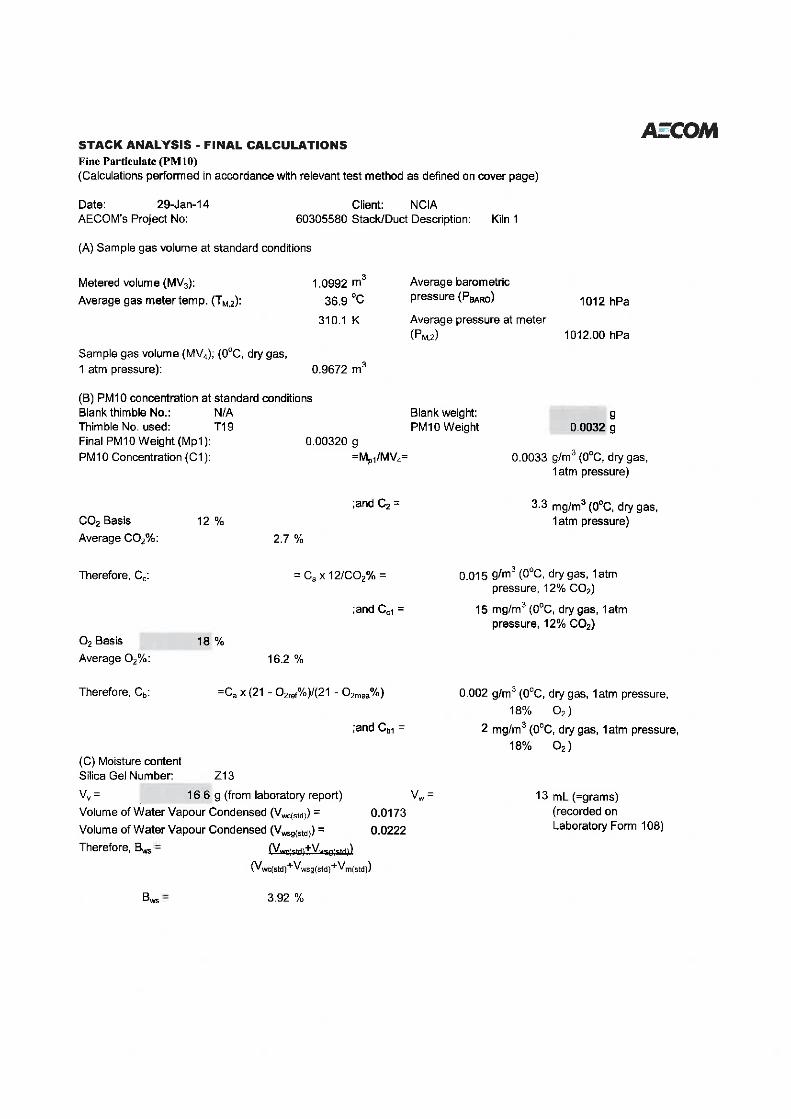
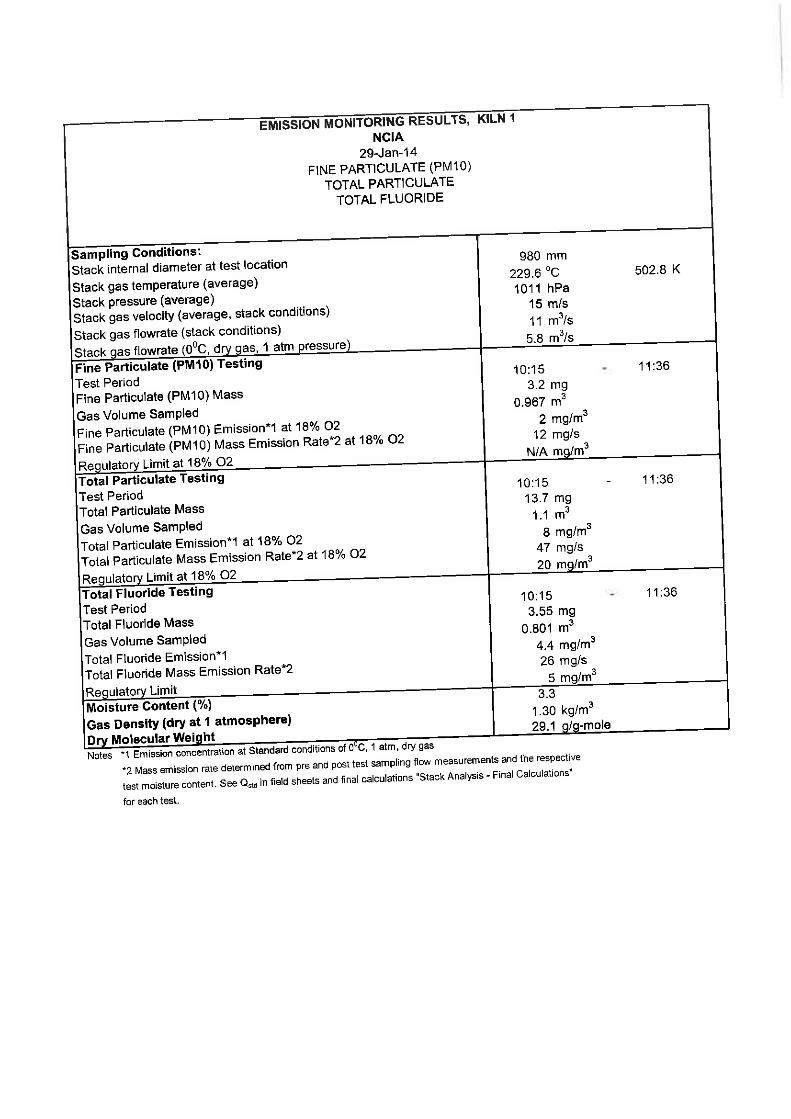
Table 16 Kiln 1 Stack Total Particulate, Fine Particulate (PM10) and Fluoride Results, 29 January 2013
Sampling Conditions:
Stack internal diameter at test location 980 mm
Stack gas temperature (average) 229.6 oC 502.8 K
Stack pressure (average) 1011 hPa
Stack gas velocity (average, stack conditions) 15 m/s
Stack gas flowrate (stack conditions) 11 m3/s
Stack gas flowrate (00C, dry gas, 1 atm pressure) 5.8 m3/sFine Particulate (PM10) Testing
Test Period 10:15 - 11:36
Fine Particulate (PM10) Mass 3.2 mg
Gas Volume Sampled 0.967 m3
Fine Particulate (PM10) Emission*1 at 18% O2 2 mg/m3
Fine Particulate (PM10) Mass Emission Rate*2 at 18% O2 12 mg/s
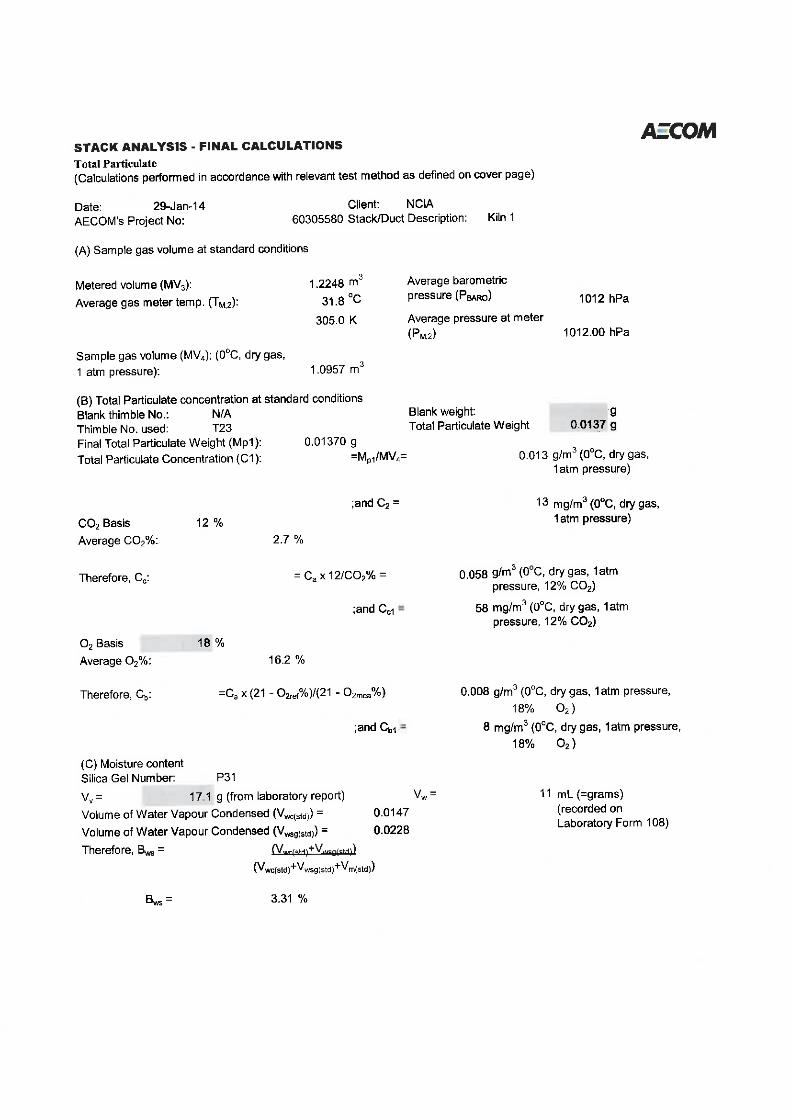
Regulatory Limit at 18% O2 N/ATotal Particulate Testing
Test Period 10:15 - 11:36
Total Particulate Mass 13.7 mg
Gas Volume Sampled 1.1 m3
Total Particulate Emission*1 at 18% O2 8 mg/m3
Total Particulate Mass Emission Rate*2 at 18% O2 47 mg/s
Regulatory Limit at 18% O2 20 mg/m3
Total Fluoride Testing
Test Period 10:15 - 11:36
Total Fluoride Mass 3.55 mg
Gas Volume Sampled 0.801 m3
Total Fluoride Emission*1 4.4 mg/m3
Total Fluoride Mass Emission Rate*2 26 mg/s
Regulatory Limit 5 mg/m3
Moisture Content (%) 3.3
Gas Density (dry at 1 atmosphere) 1.30 kg/m3
Dry Molecular Weight 29.1 g/g-mole
Notes *1 Emission concentration at Standard conditions of 00C, 1 atm, dry gas*2 Mass emission rate determined from pre and post-test sampling flow measurements and the respective
test moisture content. See Qstd in field sheets and final calculations "Stack Analysis - Final Calculations" for each test.

AECOM Emissions Testing Report 2013-14 – National Ceramic Industries AustraliaCommercial-in-Confidence
http://vpo.au.aecomnet.com/projects/21134_NSWB1320961/6DraftDocs/6.1 Reports/1.9 Stack Testing 2013/NCIA Emissions Testing Report2013_2014.docxRevision 1.0 – 05-May-2014Prepared for – National Ceramic Industries Australia – ABN: 83100467267
23
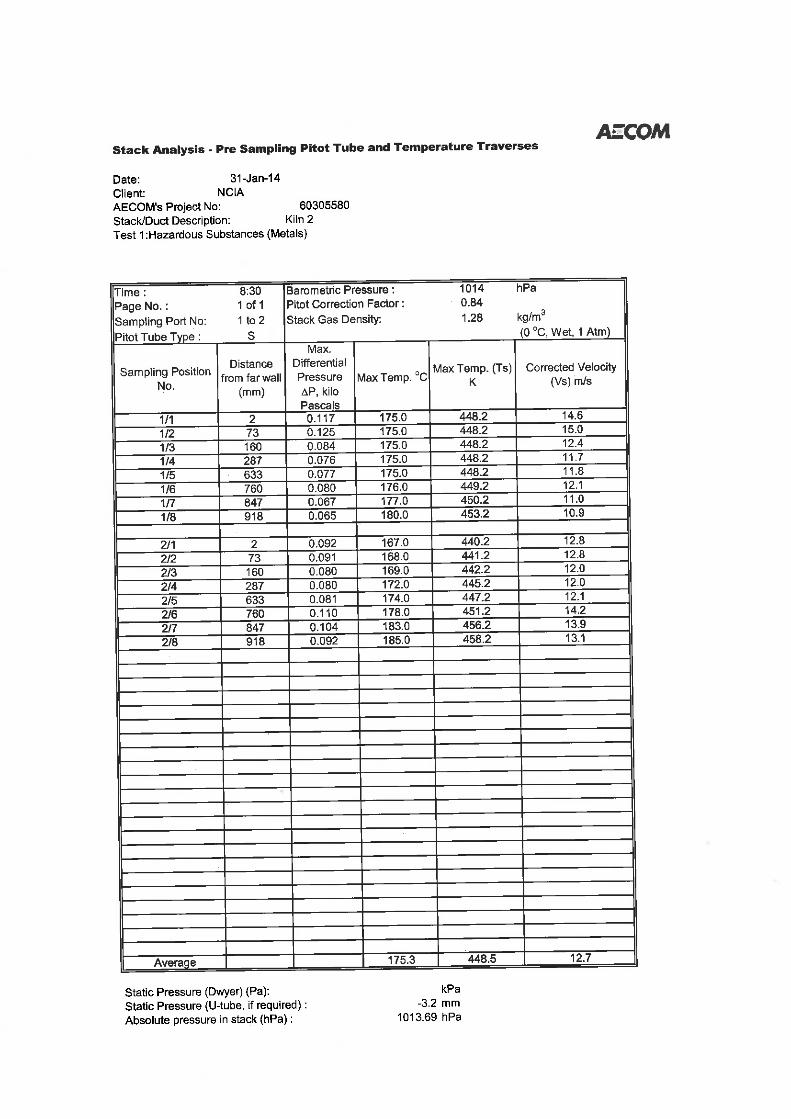
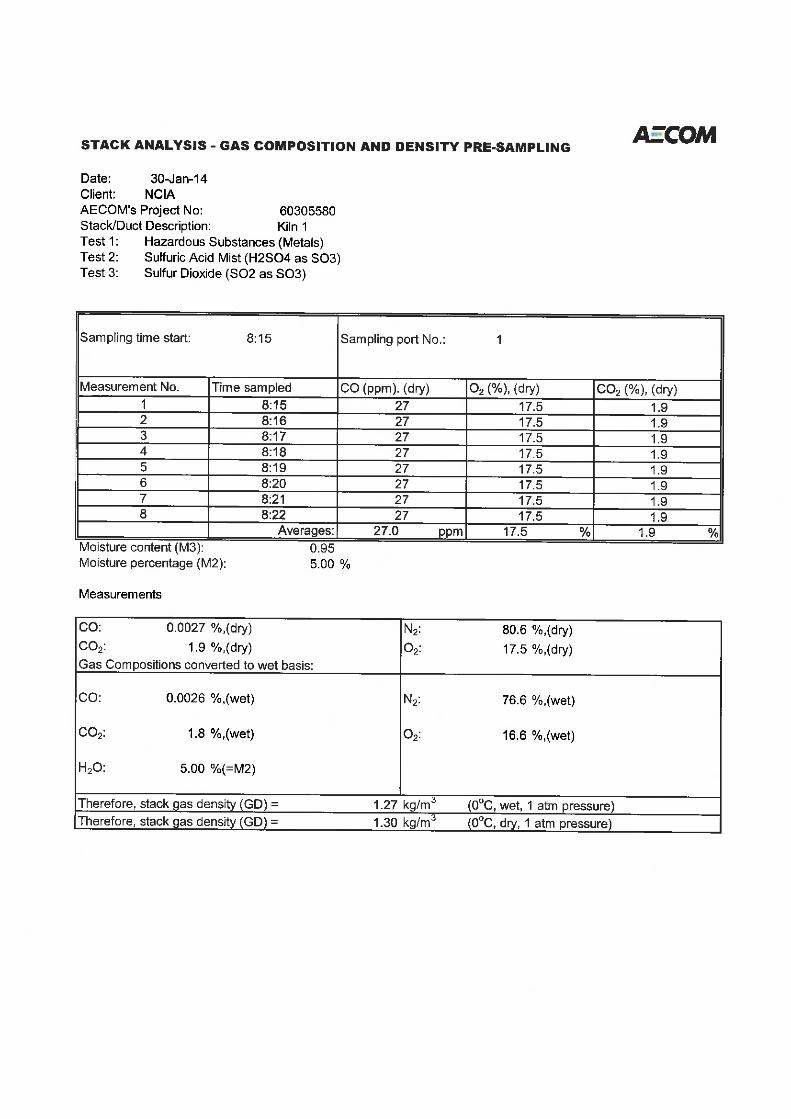
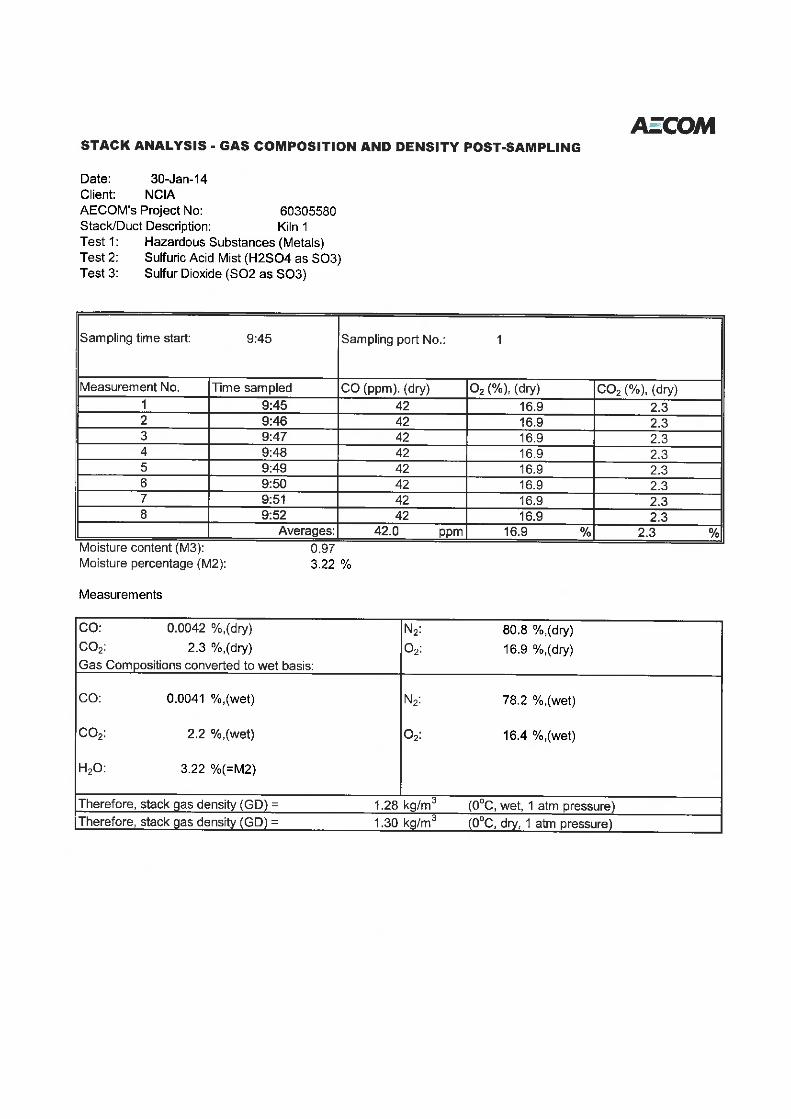
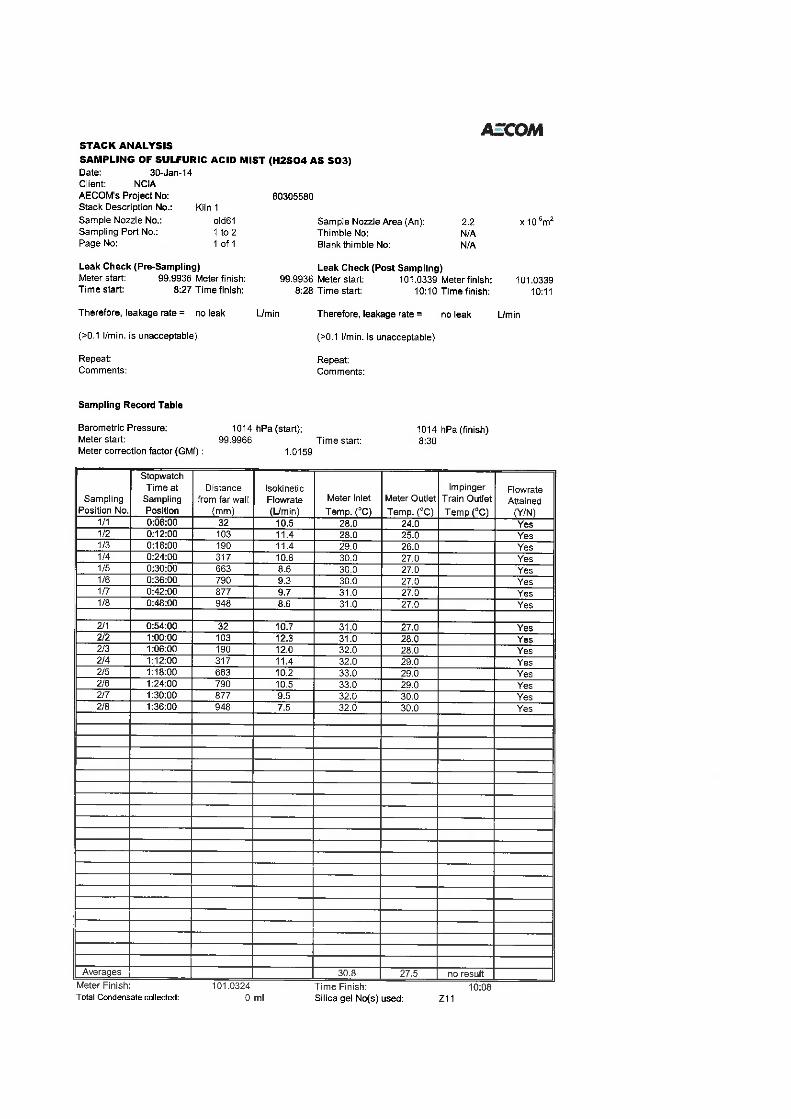
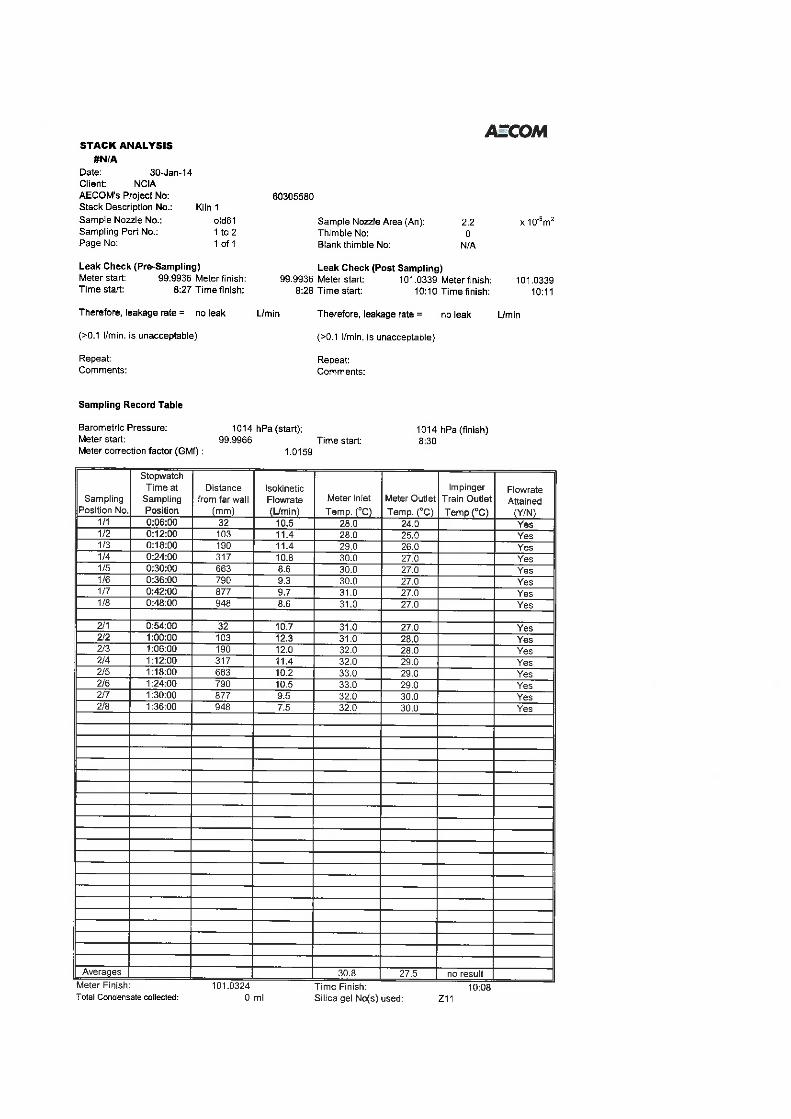
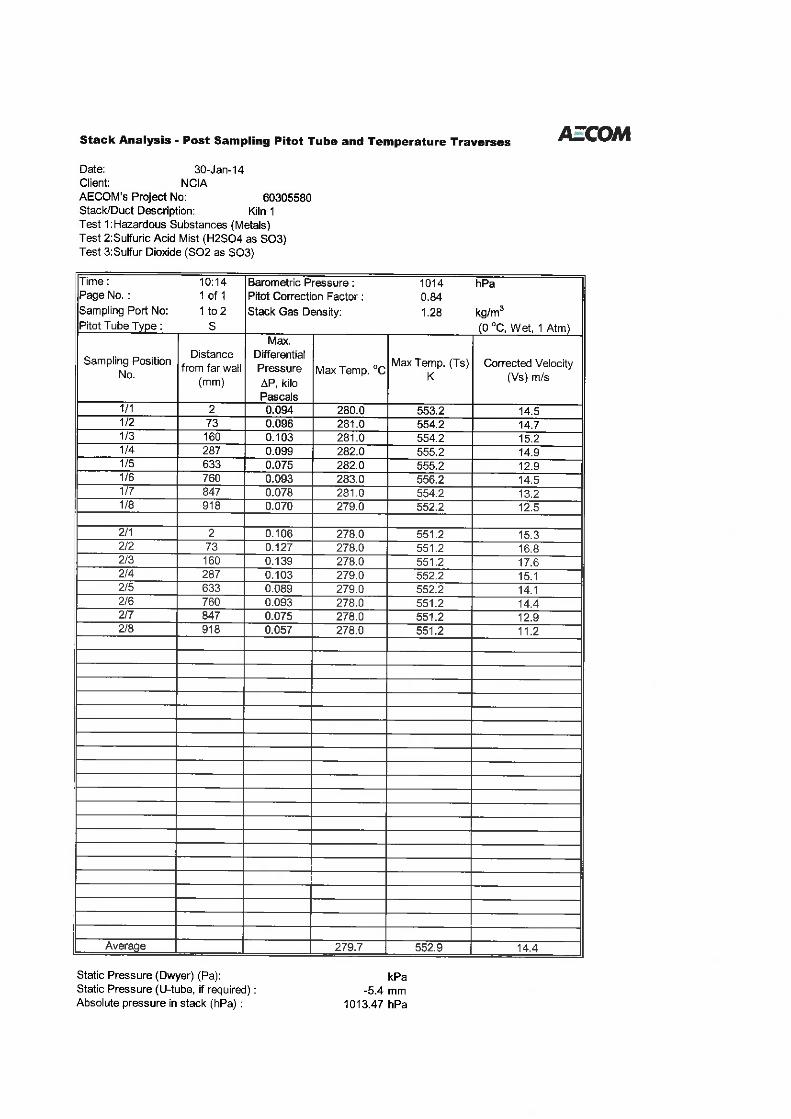
Table 17 Kiln 1 Hazardous Substances (Metals), Sulfuric Acid Mist (H2SO4 as SO3) and Sulfur Dioxide (SO2 as SO3) Results30 January 2014
Sampling Conditions:
Stack internal diameter at test location 980 mm
Stack gas temperature (average) 272.7 oC 545.9 K
Stack pressure (average) 1014 hPa
Stack gas velocity (average, stack conditions) 14 m/s
Stack gas flowrate (stack conditions) 11 m3/s
Stack gas flowrate (00C, dry gas, 1 atm pressure) 5.2 m3/sHazardous Substances (Metals) Testing
Test Period 8:30 - 10:08
Hazardous Substances (Metals) Mass 0.14 mg
Gas Volume Sampled 1.15 m3
Hazardous Substances (Metals) Emission*1 0.12 mg/m3
Hazardous Substances (Metals) Mass Emission Rate*2 0.62 mg/s
Regulatory Limit 1 mg/m3
Sulfuric Acid Mist (H2SO4 as SO3) Testing
Test Period 8:30 - 10:08
Sulfuric Acid Mist (H2SO4 as SO3) Mass <2 mg
Gas Volume Sampled 0.951 m3
Sulfuric Acid Mist (H2SO4 as SO3) Emission*1 <2.1 mg/m3
Sulfuric Acid Mist (H2SO4 as SO3) Mass Emission Rate*2 <11 mg/s
Regulatory Limit 100 mg/m3
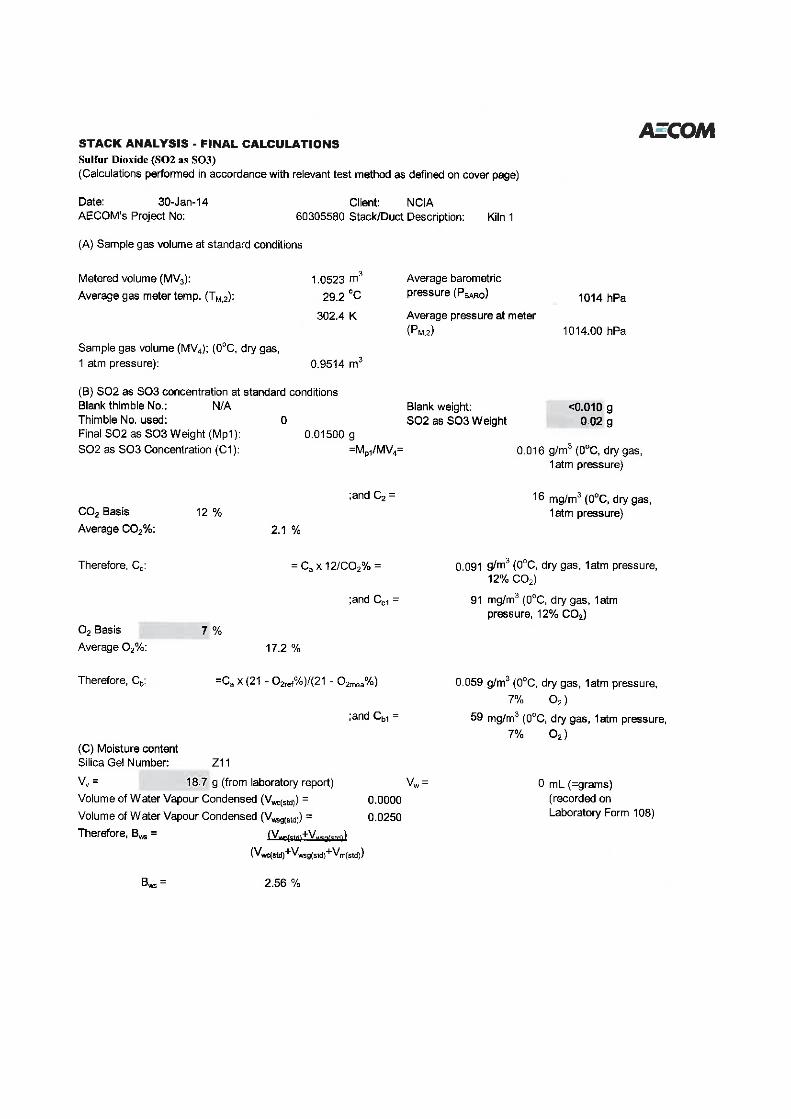
Sulfur Dioxide (SO2 as SO3) Testing
Test Period 8:30 - 10:08
Sulfur Dioxide (SO2 as SO3) Mass 15 mg
Gas Volume Sampled 0.951 m3
Sulfur Dioxide (SO2 as SO3) Emission*1 16 mg/m3
Sulfur Dioxide (SO2 as SO3) Mass Emission Rate*2 84 mg/s
Regulatory Limit N/AMoisture Content (%) 4.6
Gas Density (dry at 1 atmosphere) 1.30 kg/m3
Dry Molecular Weight 29 g/g-mole
Notes *1 Emission concentration at Standard conditions of 00C, 1 atm, dry gas *2 Mass emission rate determined from pre and post-test sampling flow measurements and the respective test moisture content. See Qstd in field sheets and final calculations "Stack Analysis - Final Calculations" for each test.

AECOM Emissions Testing Report 2013-14 – National Ceramic Industries AustraliaCommercial-in-Confidence
http://vpo.au.aecomnet.com/projects/21134_NSWB1320961/6DraftDocs/6.1 Reports/1.9 Stack Testing 2013/NCIA Emissions Testing Report2013_2014.docxRevision 1.0 – 05-May-2014Prepared for – National Ceramic Industries Australia – ABN: 83100467267
24
Table 18 Kiln 2 Stack Total Particulate, Fine Particulate (PM10) and Total Fluoride 30 January 2014
Sampling Conditions:
Stack internal diameter at test location 980 mm
Stack gas temperature (average) 196.4 oC 469.6 K
Stack pressure (average) 1013 hPa
Stack gas velocity (average, stack conditions) 13 m/s
Stack gas flowrate (stack conditions) 9.8 m3/s
Stack gas flowrate (00C, dry gas, 1 atm pressure) 5.4 m3/sFine Particulate (PM10) Testing
Test Period 10:16 - 11:36
Fine Particulate (PM10) Mass 8.7 mg
Gas Volume Sampled 0.949 m3
Fine Particulate (PM10) Emission*1 at 18% O2 13 mg/m3
Fine Particulate (PM10) Mass Emission Rate*2 at 18% O2 67 mg/s
Regulatory Limit at 18% O2 N/A mg/m3
Total Particulate Testing
Test Period 10:16 - 11:36
Total Particulate Mass 13.1 mg
Gas Volume Sampled 0.971 m3
Total Particulate Emission*1 at 18% O2 18 mg/m3
Total Particulate Mass Emission Rate*2 at 18% O2 94 mg/s
Regulatory Limit at 18% O2 20 mg/m3
Total Fluoride Testing
Test Period 10:16 - 11:36
Total Fluoride Mass 0.55 mg
Gas Volume Sampled 0.416 m3
Total Fluoride Emission*1 1.3 mg/m3
Total Fluoride Mass Emission Rate*2 7.1 mg/s
Regulatory Limit 5 mg/m3
Moisture Content (%) 5.1
Gas Density (dry at 1 atmosphere) 1.29 kg/m3
Dry Molecular Weight 28.9 g/g-mole
Notes *1 Emission concentration at Standard conditions of 00C, 1 atm, dry gas*2 Mass emission rate determined from pre and post-test sampling flow measurements and the respective
test moisture content. See Qstd in field sheets and final calculations "Stack Analysis - Final Calculations" for each test.

AECOM Emissions Testing Report 2013-14 – National Ceramic Industries AustraliaCommercial-in-Confidence
http://vpo.au.aecomnet.com/projects/21134_NSWB1320961/6DraftDocs/6.1 Reports/1.9 Stack Testing 2013/NCIA Emissions Testing Report2013_2014.docxRevision 1.0 – 05-May-2014Prepared for – National Ceramic Industries Australia – ABN: 83100467267
25
Table 19 Kiln 2 Hazardous Substances (Metals) Results 31 January 2014
Sampling Conditions:
Stack internal diameter at test location 980 mm
Stack gas temperature (average) 179.5 oC 452.7 K
Stack pressure (average) 1014 hPa
Stack gas velocity (average, stack conditions) 12 m/s
Stack gas flowrate (stack conditions) 9.2 m3/s
Stack gas flowrate (00C, dry gas, 1 atm pressure) 5.2 m3/sHazardous Substances (Metals) Testing
Test Period 8:47 - 10:17
Hazardous Substances (Metals) Mass 0.2 mg
Gas Volume Sampled 1.16 m3
Hazardous Substances (Metals) Emission*1 0.17 mg/m3
Hazardous Substances (Metals) Mass Emission Rate*2 0.87 mg/s
Regulatory Limit 1 mg/m3
Moisture Content (%) 7.8
Gas Density (dry at 1 atmosphere) 1.30 kg/m3
Dry Molecular Weight 29.1 g/g-mole
Notes *1 Emission concentration at Standard conditions of 00C, 1 atm, dry gas*2 Mass emission rate determined from pre and post-test sampling flow measurements and the respective
test moisture content. See Qstd in field sheets and final calculations "Stack Analysis - Final Calculations" for each test.
AECOM Emissions Testing Report 2013-14 – National Ceramic Industries AustraliaCommercial-in-Confidence
http://vpo.au.aecomnet.com/projects/21134_NSWB1320961/6DraftDocs/6.1 Reports/1.9 Stack Testing 2013/NCIA Emissions Testing Report2013_2014.docxRevision 1.0 – 05-May-2014Prepared for – National Ceramic Industries Australia – ABN: 83100467267
26
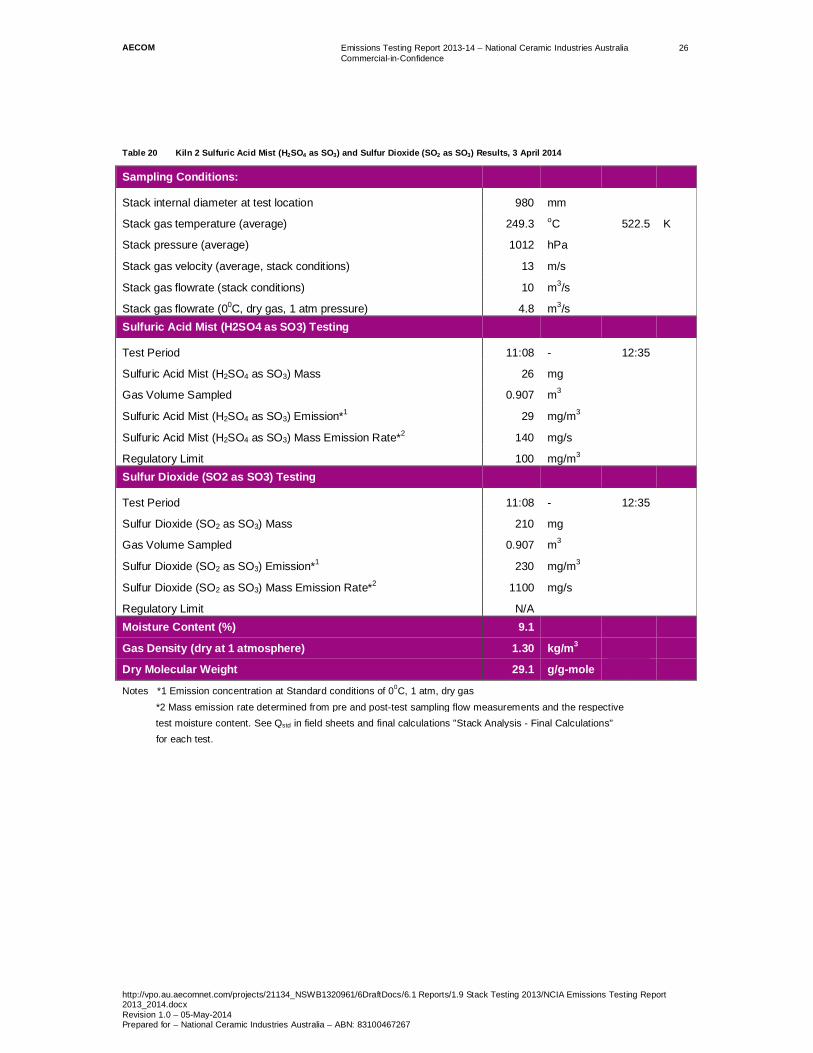
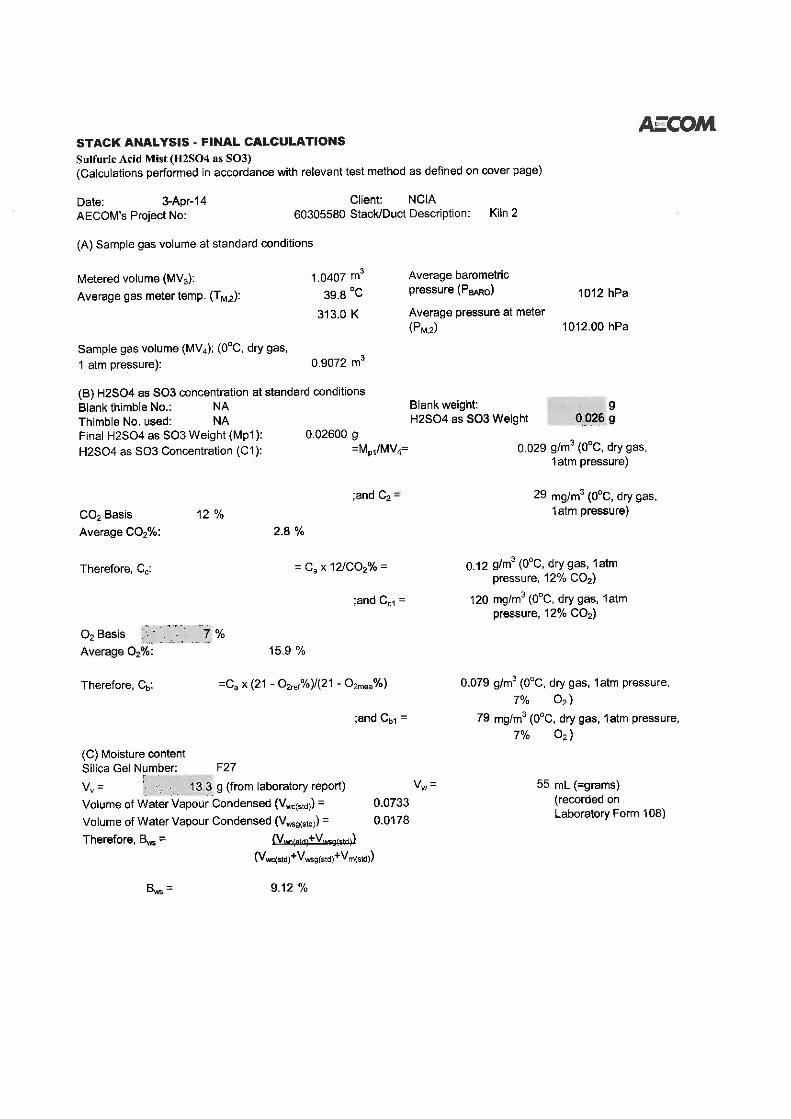
Table 20 Kiln 2 Sulfuric Acid Mist (H2SO4 as SO3) and Sulfur Dioxide (SO2 as SO3) Results, 3 April 2014
Sampling Conditions:
Stack internal diameter at test location 980 mm
Stack gas temperature (average) 249.3 oC 522.5 K
Stack pressure (average) 1012 hPa
Stack gas velocity (average, stack conditions) 13 m/s
Stack gas flowrate (stack conditions) 10 m3/s
Stack gas flowrate (00C, dry gas, 1 atm pressure) 4.8 m3/sSulfuric Acid Mist (H2SO4 as SO3) Testing
Test Period 11:08 - 12:35
Sulfuric Acid Mist (H2SO4 as SO3) Mass 26 mg
Gas Volume Sampled 0.907 m3
Sulfuric Acid Mist (H2SO4 as SO3) Emission*1 29 mg/m3
Sulfuric Acid Mist (H2SO4 as SO3) Mass Emission Rate*2 140 mg/s
Regulatory Limit 100 mg/m3
Sulfur Dioxide (SO2 as SO3) Testing
Test Period 11:08 - 12:35
Sulfur Dioxide (SO2 as SO3) Mass 210 mg
Gas Volume Sampled 0.907 m3
Sulfur Dioxide (SO2 as SO3) Emission*1 230 mg/m3
Sulfur Dioxide (SO2 as SO3) Mass Emission Rate*2 1100 mg/s
Regulatory Limit N/AMoisture Content (%) 9.1
Gas Density (dry at 1 atmosphere) 1.30 kg/m3
Dry Molecular Weight 29.1 g/g-mole
Notes *1 Emission concentration at Standard conditions of 00C, 1 atm, dry gas*2 Mass emission rate determined from pre and post-test sampling flow measurements and the respectivetest moisture content. See Qstd in field sheets and final calculations "Stack Analysis - Final Calculations"for each test.

AECOM Emissions Testing Report 2013-14 – National Ceramic Industries AustraliaCommercial-in-Confidence
http://vpo.au.aecomnet.com/projects/21134_NSWB1320961/6DraftDocs/6.1 Reports/1.9 Stack Testing 2013/NCIA Emissions Testing Report 2013_2014.docxRevision 1.0 – 05-May-2014Prepared for – National Ceramic Industries Australia – ABN: 83100467267
27
Table 21 Kiln 1 Elemental Hazardous Substances (Metals) Results
SampleTotalParticulateMetals (mg)
TotalParticulateMetals(mg/m3)
TotalGaseousMetals (mg)
TotalGaseousMetals(mg/m3)
TotalOxidisableMercury (mg)
TotalOxidisableMercury(mg/m3)
Total (mg) Total (mg/m3)MassEmission Rate(mg/s)
Antimony 0.00015 0.00013 0.0023 0.002 0.002 0.0017 0.0088
Arsenic 0.0038 0.0033 0.00085 0.00074 0.005 0.0043 0.022
Beryllium <0.0001 <0.000087 <0.0001 <0.000087 <0.000015 <0.000013 <0.000067
Cadmium 0.014 0.012 0.0097 0.0084 0.02 0.017 0.088
Chromium 0.019 0.017 0.00035 0.0003 0.02 0.017 0.088
Cobalt <0.0001 <0.000087 <0.0001 <0.000087 <0.00015 <0.00013 <0.00067
Copper 0.015 0.013 <0.0006 <0.00052 0.015 0.013 0.067
Lead 0.045 0.039 0.00035 0.0003 0.05 0.043 0.22
Magnesium 0.055 0.048 0.00053 0.00046 0.06 0.052 0.27
Manganese 0.007 0.0061 <0.0071 <0.0062 0.007 0.0061 0.031
Mercury <0.0001 <0.000087 <0.0001 <0.000087 <0.0005 <0.00043 <0.000025 <0.000022 <0.00011
Nickel 0.0018 0.0016 0.00035 0.0003 0.002 0.0017 0.0088
Selenium 0.0012 0.001 0.015 0.013 0.02 0.017 0.088
Thallium 0.0024 0.0021 <0.0001 <0.000087 0.0024 0.0021 0.011
Tin 0.0062 0.0054 0.0022 0.0019 0.008 0.007 0.036
Vanadium 0.0004 0.00035 <0.0001 <0.000087 0.0004 0.00035 0.0018
Zinc 1.4 1.2 0.0027 0.0023 1 0.87 4.5TotalHazardousMetals*
0.095 0.083 0.029 0.025 <0.0005 <0.00043 0.14 0.12 0.61
Total Metals 1.6 1.3 0.034 0.03 1.2 1.1 5.4* Total does not include Copper, Magnesium and Zinc as they are classed non-hazardous

AECOM Emissions Testing Report 2013-14 – National Ceramic Industries AustraliaCommercial-in-Confidence
http://vpo.au.aecomnet.com/projects/21134_NSWB1320961/6DraftDocs/6.1 Reports/1.9 Stack Testing 2013/NCIA Emissions Testing Report 2013_2014.docxRevision 1.0 – 05-May-2014Prepared for – National Ceramic Industries Australia – ABN: 83100467267
28
Table 22 Kiln 2 Elemental Hazardous Substances (Metals) Results
SampleTotalParticulateMetals (mg)
TotalParticulateMetals(mg/m3)
TotalGaseousMetals (mg)
TotalGaseousMetals(mg/m3)
TotalOxidisableMercury (mg)
TotalOxidisableMercury(mg/m3)
Total (mg) Total (mg/m3)MassEmission Rate(mg/s)
Antimony 0.00045 0.00039 0.00054 0.00047 0.001 0.00086 0.0044
Arsenic 0.014 0.012 0.0014 0.0012 0.02 0.017 0.087
Beryllium <0.0001 <0.000086 <0.0001 <0.000086 <0.000015 <0.000013 <0.000067
Cadmium 0.021 0.018 0.006 0.0052 0.03 0.026 0.13
Chromium 0.022 0.019 0.0048 0.0041 0.03 0.026 0.13
Cobalt <0.0001 <0.000086 <0.0001 <0.000086 <0.00015 <0.00013 <0.00067
Copper 0.0034 0.0029 0.00014 0.00012 0.004 0.0034 0.017
Lead 0.06 0.052 0.016 0.014 0.08 0.069 0.35
Magnesium 0.068 0.059 0.0023 0.002 0.07 0.06 0.31
Manganese 0.0094 0.0081 <0.0071 <0.0061 0.0094 0.0081 0.041
Mercury 0.00095 0.00082 0.0022 0.0019 0.0047 0.004 0.003 0.0026 0.013
Nickel 0.0024 0.0021 <0.0001 <0.000086 0.0024 0.0021 0.011
Selenium 0.0083 0.0071 0.0023 0.002 0.01 0.0086 0.044
Thallium 0.004 0.0034 0.0016 0.0014 0.006 0.0052 0.027
Tin 0.0065 0.0056 0.00055 0.00047 0.007 0.006 0.031
Vanadium 0.0004 0.00034 <0.0001 <0.000086 0.0004 0.00034 0.0017
Zinc 1.7 1.5 0.27 0.23 2 1.7 8.7TotalHazardousMetals*
0.14 0.12 0.035 0.03 0.0047 0.004 0.2 0.17 0.88
Total Metals 1.9 1.7 0.31 0.26 2.3 2 10* Total does not include Copper, Magnesium and Zinc as they are classed non-hazardous

AECOM Emissions Testing Report 2013-14 – National Ceramic Industries AustraliaCommercial-in-Confidence
http://vpo.au.aecomnet.com/projects/21134_NSWB1320961/6DraftDocs/6.1 Reports/1.9 Stack Testing 2013/NCIA Emissions Testing Report2013_2014.docxRevision 1.0 – 05-May-2014Prepared for – National Ceramic Industries Australia – ABN: 83100467267
Appendix A
Field Sheets and FinalCalculations (190 pages)

AECOM Emissions Testing Report 2013-14 – National Ceramic Industries AustraliaCommercial-in-Confidence
http://vpo.au.aecomnet.com/projects/21134_NSWB1320961/6DraftDocs/6.1 Reports/1.9 Stack Testing 2013/NCIA Emissions Testing Report2013_2014.docxRevision 1.0 – 05-May-2014Prepared for – National Ceramic Industries Australia – ABN: 83100467267
a-1
Appendix A Field Sheets and Final Calculations (190 pages)


AECOM Emissions Testing Report 2013-14 – National Ceramic Industries AustraliaCommercial-in-Confidence
http://vpo.au.aecomnet.com/projects/21134_NSWB1320961/6DraftDocs/6.1 Reports/1.9 Stack Testing 2013/NCIA Emissions Testing Report2013_2014.docxRevision 1.0 – 05-May-2014Prepared for – National Ceramic Industries Australia – ABN: 83100467267
Appendix B
Laboratory AnalyticalReports (30 pages)

AECOM Emissions Testing Report 2013-14 – National Ceramic Industries AustraliaCommercial-in-Confidence
http://vpo.au.aecomnet.com/projects/21134_NSWB1320961/6DraftDocs/6.1 Reports/1.9 Stack Testing 2013/NCIA Emissions Testing Report2013_2014.docxRevision 1.0 – 05-May-2014Prepared for – National Ceramic Industries Australia – ABN: 83100467267
b-1
Appendix B Laboratory Analytical Reports (30 pages)


AECOM Emissions Testing Report 2013-14 – National Ceramic Industries AustraliaCommercial-in-Confidence
http://vpo.au.aecomnet.com/projects/21134_NSWB1320961/6DraftDocs/6.1 Reports/1.9 Stack Testing 2013/NCIA Emissions Testing Report2013_2014.docxRevision 1.0 – 05-May-2014Prepared for – National Ceramic Industries Australia – ABN: 83100467267
Appendix C
Raw and Calculated GasData (12 pages)

AECOM Emissions Testing Report 2013-14 – National Ceramic Industries AustraliaCommercial-in-Confidence
http://vpo.au.aecomnet.com/projects/21134_NSWB1320961/6DraftDocs/6.1 Reports/1.9 Stack Testing 2013/NCIA Emissions Testing Report2013_2014.docxRevision 1.0 – 05-May-2014Prepared for – National Ceramic Industries Australia – ABN: 83100467267
c-1
Appendix C Raw and Calculated Gas Data (12 pages)


AECOM Emissions Testing Report 2013-14 – National Ceramic Industries AustraliaCommercial-in-Confidence
http://vpo.au.aecomnet.com/projects/21134_NSWB1320961/6DraftDocs/6.1 Reports/1.9 Stack Testing 2013/NCIA Emissions Testing Report2013_2014.docxRevision 1.0 – 05-May-2014Prepared for – National Ceramic Industries Australia – ABN: 83100467267
E
This is the end of the Report