Emission of Refrigerant R-134a from Mobile Air … Study conducted for the German Federal...
57
1 Study conducted for the German Federal Environment Office Sponsorship Reference 360 09 006 Emission of Refrigerant R-134a from Mobile Air-Conditioning Systems Annual Rate of Emission from Passenger-Car Air-Conditioning Systems up to Seven Years Old by Dr. Winfried Schwarz Öko-Recherche Büro für Umweltforschung und -beratung GmbH Environmental Research and Consultancy Office Frankfurt am Main September 2001
Transcript of Emission of Refrigerant R-134a from Mobile Air … Study conducted for the German Federal...

1
Study conducted for the German Federal Environment Office
Sponsorship Reference 360 09 006
Emission of Refrigerant R-134a from Mobile Air-ConditioningSystems
Annual Rate of Emission from Passenger-Car Air-Conditioning Systemsup to Seven Years Old
by
Dr. Winfried Schwarz
Öko-RechercheBüro für Umweltforschung und -beratung GmbHEnvironmental Research and Consultancy Office
Frankfurt am Main
September 2001

I
Contents
Rate of Emission from Car Air-Conditioning Systems up to Seven Years Old.Introduction and Summary. III
Purpose of Empirically Based Study IIIHigh Refrigerant Loss attributable to System Design IIISummary of Chapters A to G IVI. Refrigerant Record Sheets and Supplementary Information from the selected Garages 1
1. Refrigerant Records voluntarily completed by garages 12. Time-span and quality of garage Record Sheets on R-134a 13. Concentration of vehicles: Rhine-Maine Region 24. Three German brands of passenger car 25. Recovery/recharging stations employed 26. First stage of quantity correction - the 1,004 documented cases 27. Second stage of quantity correction - the 841 analysable cases 48. Other information from the garages and the car manufacturers 59. Workshop visits for opening of air-conditioning system distributed over individual months 5
B. Reliability of Records and Accuracy of Recovery/Recharging Stations 7I. Recovery and Charging by Recovery/Recharging Station (see drawing) 7
1. Recovery (2 to 5 minutes) 72. Evacuation (20 to 30 minutes) 93. Recharging (1 to 3 minutes) 94. Emptying the recharging hose 9
II. Errors in determining Quantity; their Significance and Correction 101. Rounding off when measuring by sight, also where weighing electronically 102. The residue in the hose as source of error in determining the charge quantity 113. Temperature differences between recovery/recharging station and air-conditioning system whenrecovering 124. Recovery of after-evaporation forgotten 135. Omitted entries 13
III. Refrigerant Loss caused by the Servicing Operation itself 141. Loss when charging 142. Refrigerant loss when locating leaks with contrast medium 14
C. Reasons for Opening an Air-Conditioning System and Causes of DetectedRefrigerant Loss 16
I. Elimination of Leaks, the Main Reason for Opening on Total Loss of Refrigerant 171. Empty air-conditioning system after accident involving body damage 182. Total loss due to stone impact or irregular component defect 183. Total loss followed simply by recharging without repair work 19
II. Opening a System where Refrigerant Loss is less than 40% 201. Component defects not themselves responsible for release of refrigerant 212. Air-conditioning system as obstacle to engine or radiator repairs 223. Establishment of accident damage and preparation for bodywork repairs 224. Leak tests at customer's or workshop's initiative 23
III. Consequences for Method of Estimating the Rate of Emission 23D. The Annual Rate of Normal Emission 25
I. Regular Loss of Refrigerant from Intact Air-Conditioning Systems 25

II
II. All 282 Emission Rates of < 40% as a Function of Vehicle Age 25III. Statistical Correction of Normal Emission Rates 27
1. Recognisable as 'irregular' from the Record Sheets: seven cases 272. Eliminating anomalies above and below the line: 59 cases 28
IV. The corrected 6.3% Annual Rate of Normal Emission 30V. Differences in Normal Emission between the Three Car Brands 31VI. Car Manufacturer Specifications concerning Normal Leakage 33
E. The Annual Rate of 'Irregular' Emission 35I. Inspections as Reference Quantity for Cases of Irregular Emission 35II. Confinement of Inspections to Vehicles with Air-Conditioning System 36
1. Model of Age Patterns in Annual Inspections 372. Air-conditioning quotas in inspection periods 1999, 2000 and 2001 383. 'Workshop Rate' of air-conditioned vehicles 39
III. The Annual Rate of 'Irregular' Emission 39F. The Annual Total Rate of Emission for Air-Conditioning Systems at most SevenYears old 41
I. The Calculated 8.2% Rate of Emission 41II. Margins of Error in determined Quantities 42
1. Errors in recording recovery and recharging operations 422. Differences between the three brands of car 42
III. The Annual Rates of Emission with Margins of Error 43IV. Emission on Disposal raises the Annual Rate by 10% 43
G. The Question of Reducing Emission by Regular System Inspection 45I. Maintaining an Air-Conditioning System increases Operational Reliability 45II. Regular Maintenance generally does not reduce Emission 45III. Partial Prevention of Irregular Emission - Minimal 46
1. Two examples showing how emission may be reduced by maintenance 462. Internal corrosion by acid refrigerant is unlikely 463. Detection of slowly growing small leaks 474. Emissions prevented or caused by maintenance are approximately equal in magnitude. 48
Acknowledgements, Reference Material 49Note on unnamed sources 49References 49

III
Rate of Emission from Car Air-Conditioning Systems up to SevenYears Old. Introduction and Summary.
The Kyoto Protocol on Climate Protection extends not only to the greenhouse-gases CO2, methane andnitrous oxide, but also to the fluorinated gases (f-gases) HFC, PFC and SF6. By far the most importantof the fluorinated greenhouse gases is HFC, used mainly as a substitute for CFCs, while the mostsignificant of the HFCs themselves is HFC 134a, accounting for about three-quarters of worldproduction. Since HFC 134a is mainly used as a refrigerant, it is also called R-134a, 'R' standing for'refrigerant'.
Purpose of Empirically Based Study
The greater part of R-134a use in Germany is associated with mobile air-conditioning systems. Ratherthan going by laboratory measurements and the estimations of experts, the present study has employedempirical and statistical methods in its attempt to determine the annual rate of R-134a emission frommobile air-conditioning systems. The study should also help in assessing the extent to which preventivemaintenance and inspection might contribute to a reduction in emissions.
Our analysis concentrates mainly on passenger-car air-conditioning systems ('Öko-Recherche -Ecological Survey - 1999, 17) because they account for about 95% of refrigerant emission andconsumption in the "mobile air-conditioning systems" sector. The survey is based on the records kept bygarages on the quantities of refrigerant recovered and recharged when opening the refrigerant circuit ofan air-conditioning system.
High Refrigerant Loss attributable to System Design
Unlike a stationary air-conditioning system, the refrigerant circuit of a car's air-conditioning system isunstable in state because its compressor is driven by the crankshaft. The compressor is necessarilyopen in design, and, being attached to the engine block, the need arises to avoid vibration as coolingcapacity is transferred to the remaining parts of the refrigerant circuit connected to the chassis. As aresult, only a limited proportion of metallic piping may be used in place of flexible hosing. Hoses, O-ringsat component joints, and the rotary shaft seal of the compressor are weak points in the sealing system(Air-Conditioning Systems Conference - 2001), constituting the principal points of normal refrigerantleakage from systems which have not suffered "irregular" damage.
It is generally recognised that the emission of R-134a from car air-conditioning systems is not as high asthat of CFC R-12 (still being newly installed up to as late as 1994 in some cases), where losses hadamounted to nearly three charges per life cycle. Greater care is now taken in the handling of refrigerant,and although the HFC-134a molecule is smaller than the CFC-12's, the additional lining of hose interiorswith polyamide film prevents any greater permeation.
At present, however, we have nothing more to go by than a series of estimates of the annual loss ofrefrigerant from car air-conditioning systems, with figures ranging from less than 5% to over 20% basedon expert assessment or, rather more rarely, on laboratory measurement (see Clodic 2000; AFCE 1998;Baker 1999; Preisegger 1999, Öko-Recherche 1999; UNEP 1998; Fischer 1997, Pettersen/Hafner 1996,among others). To date, no estimate has yet been put forward on the basis of empirical measurementsmade on actual road-going vehicles.

IV
Summary of Chapters A to G
Chapter A presents the study database, comprising approximately a thousand recorded recovery andrecharging operations carried out by nine authorised dealers of three German car manufacturers duringthe period 1999 to May 2001.
Chapter B discusses recovery/recycling/recharging stations, duly examining the accuracy with whichvolumes recovered and charged are measured, reducing margins of error, and introducing correctivefactors.
Chapter C analyses the reasons for the detected loss of refrigerant on opening an air-conditioningsystem. It emerges that the causes of 'total' loss (occurring in approximately 40% of cases and mainlyattributable to outside influence) are different from the reasons for the equally high number of casesproducing losses of less than 40%. A deficit of 40% refrigerant in relation to the normal charge isregarded here as the limit below which an air-conditioning system is still marginally intact (still nogaseous refrigerant or "flash gas", and still entirely liquid upstream of the expansion valve) and generallyprovides the same cooling action as a fully charged system. Provided they do not already occur duringthe initial phase of a system's use, refrigerant losses of less than 40% are generally the result of normalleakage rather than an 'irregular' event (accident, stone impact, etc.) which almost always producesgreater loss. The study therefore sets out to examine two fundamentally different kinds of emission -normal and irregular. Refrigerant loss under 40% is the result of gradual, normal leakage, especiallythrough seals, while the causes of any higher losses than that are 'irregular'. While it is true to say thatcontinuous normal leakage of refrigerant can sometimes reach levels of over 40%, vehicles aged lessthan six or seven years (representing the majority of our chosen population) should not generally havearrived at that stage so early in their life. For the present, detected refrigerant loss less than 40% isdeemed to be normal leakage.
Chapter D examines air-conditioning systems opened for various reasons other than lack of refrigerantand found to have lost less than 40%, interpreting them as (unintentional) "random sample" of normalemission, and relates the losses to the age of the vehicle in months since first registration. Initially, thereis no relationship to be seen between the level of refrigerant loss and the age of the vehicle, due in themain to numerous unexpectedly high instances of refrigerant loss during the first eighteen months ofoperation. Since such instances can be assumed to have 'irregular' rather than normal causes, theywere eliminated from the remaining study of normal emission. Having "removed" these instances ofemission from the series of refrigerant losses less than 40%, the remaining 216 air-conditioning systemsin the survey indicated a mean annual coolant loss of 6.3% (52 grams) as annual rate of normalemission over the first seven years in use. This rate varies by about ten percentage points up or downaccording to make of car, ranging from 5.8 to 7.0%. The mean 52-gram normal leakage figure comeswithin the scope of the car manufacturers' permitted tolerance of 34 to 83 gram per air-conditioningsystem.
Chapter E: The study determined 'normal' emission indirectly from garage records, relating the emissionbehaviour of the few air-conditioning systems opened in the garage to the entirety of passenger-car air-conditioning systems in use for less than seven years. However, 'irregular' emission was determineddirectly from those records, relating the sum of irregular refrigerant loss in kilograms which a garagedetected in one year to the number of air-conditioned cars inspected by the same garage in the sameyear. Passing through several intermediate stages, the examination disclosed an annual loss of about1.9% of the refrigerant carried in vehicles regularly serviced by the nine authorised dealers within theperiod 1999 to May 2001. The percentage varies from 1.5 to 2.2 % according to make of car.
Chapter F adds the two rates of emission to arrive at an annual rate of 8.2% total emission, which variesfrom 7.7 to 9.2% according to make of car. To allow for this fluctuation between car brands and to caterfor the inherent inaccuracy of recovery/recharging stations, the margin of error is extended by 25%

V
above and below the 8.2% figure to produce an annual total rate of emission varying between 6.2 and10.3%. This defines the magnitude rather than the exact level of the rate of emission. It should beremembered that these figures relate only to air-conditioning systems less than seven years old, and asyet make no allowance for emission at time of disposal. Regular total emission of R-134a from car air-conditioning systems in the year 2000 has been estimated as between 685 and 1,140 tonnes. Thevariation depends on whether an emission rate of 6.2% (the minimum) or 10.3% (the maximum) isassumed for the 11,500 tonnes of refrigerant circulating in passenger cars in Germany. In turn, this11,500 tonnes is an assumed figure based on 13 million air-conditioned cars (30% of the total carpopulation being thus equipped) having an average R-134a charge of 850 grams.
Annual Rate of Emission increased to 10% on account of Loss at Time of Disposal
To guard against any misunderstanding, it should be said that an annual rate of emission over the firstseven years in service will generally be lower than an annual rate of emission calculated over the entirelife of a system. This is not simply due to the acceleration in normal system leakage (not quantified inthis paper) which some experts expect to observe as a vehicle ages, it is mainly attributable to emissionat time of scrapping an old car. Even with the improvements expected in the recovery of refrigerant byGerman old-car recyclers over the coming years, recovery related to a given originally German year ofregistration will still be limited on account of the 50% quota of used cars exported in that year to non-EUcountries (Arge Altauto 2000 - Arge old cars, 2000). Disposal loss per annum is estimated here at about25% until further information becomes available. This 25% distributed over a life of twelve to thirteenyears increases the annual total rate of emission by a further 2%, so in the medium term the ratefluctuates around about 10%.
Chapter G finally examines the likelihood of reducing emission of refrigerant into the environment byregularly maintaining the air-conditioning system. In principle, preventive inspection does increase thereliability of a system's operation and can also contribute to a saving in energy, but it does not reducethe emission of refrigerant associated with either disposal, 'irregular' leakage, or normal leakage.Accordingly, it is not deemed appropriate to introduce compulsory maintenance alone with a view toreducing the emission of R-134a.
Annual Rate of Normal, Irregular, Disposal and Overall Emissions from Passenger Car AC Units up to Seven Years old
(25 % margin of error - including disposal emissions)
6.3
1.9 2.0
10.2
0
2
4
6
8
10
12
Normal ER Irregul. ER Disposal ER Overall ER
perc
enta
ge

1
A. Database - Nine Motor-Vehicle GaragesThe actual level of refrigerant in an R-134a air-conditioning system can only be ascertained by openingthe refrigerant circuit in a suction-based recovery operation. While the checking of pressures incombination with temperature measurements may indicate whether or not the system still containssufficient refrigerant for it to operate, this process cannot in fact determine the actual level of refrigerant.Unlike R-12 systems, the collector employed does not have an inspection glass for fast diagnosis.Accordingly, to establish the level of refrigerant and with that the difference in charge, the refrigerantmust be recovered entirely from the system by means of a recovery/recharging station.
I. Refrigerant Record Sheets and Supplementary Information from the selectedGarages
1. Refrigerant Records voluntarily completed by garages
Following on their records of consumption of CFC-refrigerant R-12, some garages in Germany continueto keep "Record Sheets on Quantities of CFC-containing Refrigerant consumed in the Maintenance ofAir-Conditioning Systems" for the R-134a refrigerant introduced between 1991 and 1993. From theauthor's experience, this is done by about every one in ten manufacturer-tied ('authorised') workshops ordealership outlets. Half of these garages systematically enter the recovery and charge quantities readoff the recovery/recharging station for every single air-conditioning system duly opened, and file the listboth as record of their own work on the vehicle (for product-liability purposes) and as statisticalinstrument for internal management of resources.
The law does not require any such detailed recording of refrigerant consumption. The German FederalLaw on Environmental Statistics (Umweltstatistikgesetz) simply rules that, on request, garages shouldreport their total consumption of refrigerant (R-134a) in the previous year to their designated FederalState Statistics Office. However, garages were in fact recommended to report vehicle-specificconsumption of refrigerant in the standard "Fundamentals of Technical Expertise in Vehicle Air-Conditioning Systems" leaflet issued by the VDA, ZDIK and ZDK (German automobile industryassociations) in the winter of 1996.
2. Time-span and quality of garage Record Sheets on R-134a
Between April and July 2001, usable "Record Sheets on Consumption of Refrigerant" were collectedfrom nine manufacturer-tied garages (authorised dealer garages/outlets) associated with three differentGerman car brands, and were duly entered in our computer. The records were deemed 'usable' wherethey documented at least one full year (calendar-year 2000, or the period May 2000 to May 2001) andgenerally contained the following data:
1. Date of workshop visit,2. Registration number of vehicle (or a Job Number),3. Quantity of refrigerant recovered,4. Quantity of refrigerant charged,5. Charge difference,6. Notes (brief) on reason for operation, and7. Type of recovery/recharging station employed.
The line indicating reason for recovery and recharging was left uncompleted or was insufficientlyinformative ("leaking") in half of the cases examined, but was adequately specific in the other half("accident, condenser replaced").

2
Five of the nine garages had records on year 1999 as well, three of these also having details on theperiod May 1998 to end of 1998, and one had even kept information on the whole period March 1997 toMay 2001. We also examined any full 'year 1999s'. Incomplete 'year 1999s' and the parts of years 1998and 1997 were entered in the computer for control purposes.
Refrigerant R-134 records going back any further than 1997 were inaccessible to the author (except forone very patchily documented 'year 1996').
Where an air-conditioning system undergoes recovery and recharging, garages generally write the typeof refrigerant on the customer's invoice and (during the warranty period) on the invoice sent to themanufacturer. However, the record on the invoice notes a full system charge rather than the quantityrecovered, which is reasonable enough in view of the refrigerant-cleansing carried out in the course ofopening an air-conditioning system. It is for this reason that customer invoices have not been used asdatabase for the present study.
3. Concentration of vehicles: Rhine-Maine Region
Seven of the reporting garages were in the Rhine-Maine Region, and two were in the Nuremberg area.This means that about 80% of the documented vehicles with duly maintained air-conditioning systemswere reported in the Rhine-Main Region (concentrated mainly on Frankfurt am Main), 15% inNuremberg and its environs, and about 5% had registration plates from outside those two regions.
4. Three German brands of passenger car
In the year 2000, the three German car brands serviced by our nine garages together enjoyed a marketshare of about 40% of German new passenger-car registrations (KBA 2001 - German Federal Office ofMotor Transport). Their share in the registration of new vehicles fitted ex-works with an air-conditioningsystem was somewhat higher, being just under 50% by my own estimation. The reason for this is thetraditionally higher rate of air-conditioning system installation in German cars as compared with importedbrands, which make up a third of new registrations.
5. Recovery/recharging stations employed
All of the recovery/recharging stations employed for recovery and charging purposes had beenmanufactured during the period 1991 to 1996, so none of them were of the very latest design. The fourdifferent types used were
the SECUmat 134 by Behr: five units in five garages;the FAST 2000 by Fischer: four units in two garages;the RHS 850 by Waeco-A Gramkow: one unit in one garage, andthe Robinair Vacumaster by Robinair: one unit in one garage.
One garage has been using a Beissbarth MAC 26 instead of the SECUmat 134a since May 2001, butthis unit had not yet been entered on the Record Sheets.
6. First stage of quantity correction - the 1,004 documented cases
Total number of entries from 1999 to 2001: 1,004

3
The number of entries in the Record Sheets for full years 1999, 2000 and 2000/2001 amounted to 1,004in total. There were a further 209 entries from the previous period, which served as control indicatingwhether a vehicle may already have had its air-conditioning system opened, and if so, under whatconditions.1
The 1,004 generally analysable entries on the opening of air-conditioning systems in the years 1999 to2001 were distributed more or less uniformly over the three different car brands - Brand 1: 253, Brand 2:317, Brand 3: 434.
Different air-conditioning systems having deducted duplicated entries: 932
Of the 1,004 entries, registration numbers duly identified vehicle air-conditioning systems that had beenopened several times in the course of one or two years.2 There were 72 duplicated entries in total, sothe number of different air-conditioning systems effectively opened in 1999 to 2001 reduces to 932.
Ex-works R-134a systems - excluding R-12 conversions: 875
As a rule, mechanics expressly entered as such any conversions they made from R-12 to R-134a. (Thelist of old vehicles, which is to say vehicles not having an original ex-works R-134a air-conditioningsystem, was completed at a later stage with reference to the date of first registration and the type ofvehicle). Reduced by the total of 57 system-openings effected for conversion or sometimes forretrofitting purposes during the period early 1999 to mid 2001, the number of different vehicles havingex-works R-134a air-conditioning systems and documented in the Record Sheets for 1999 to 2001amounts to 875 (Brand 1: 216, Brand 2: 284, Brand 3: 375).
Ex-works R-134a systems excluding commercial vehicles: 841
One garage also opened and recorded the air-conditioning systems of commercial vehicles. The 34cases in question having been duly identified and left out of the equation, the total number of genuinelypassenger-car air-conditioning systems comes to 841.
Average charge quantities and losses - 841 passenger-car air-conditioning systems
The average charge quantity for all (841) air-conditioning systems was 856 grams. Differences of up to30% were to be found between the individual brands - Brand 1: 734 g, Brand 2: 857 g, and Brand 3: 932g.
The average loss of refrigerant determined per air-conditioning system opened was 546 grams, or 64%of the charge quantity. Here again, there were differences between the brands - Brand 1: 54%, Brand 2:70%, Brand 3: 64%.
The total volume of refrigerant lost from the 841 systems amounted to 459.2 kilograms.
1 Only very limited use could be made of another 337 entries documenting all of year 2000 at one furthergarage (a tenth) associated with a fourth German manufacturer, because a figure of "1000 g" refrigerant(recovery/recharge) had been entered without exception for every vehicle serviced.2 Such cases often involved accidents, where the refrigerant was just recovered before bodyworkrepairs, and then just charged again after the repair work (several days later). The two entries relatedhere to one and the same instance of damage. Occasionally, when first coming into the workshop, asystem was charged with addition of contrast medium but the leak was not eliminated. Then on asecond visit, the leak was finally rectified thanks to the contrast medium. Here again, the two entriesrelate to one and the same case.

4
7. Second stage of quantity correction - the 841 analysable cases
The age of a vehicle on its visit to the workshop is of decisive importance to certain aspects of thepresent study's investigations, especially the determination of so-called 'normal' emission, but this age isnot entered in the Record Sheets.
In a second stage of our work, the nine garages were asked, through their service managers or throughtheir environmental protection officers, to examine their duly retained workshop records and provide thefollowing three extra items of data on each vehicle identifiable by workshop date and car registrationnumber:
1. type of vehicle,2. date of first registration, and3. kilometre reading at time of workshop visit.
At this point I would like to thank all nine garages for completing this time-consuming task, someextending it to one year, but some again covering three. In addition to which I must say that the air-conditioning mechanic and/or electrical foreman in each garage showed great patience in answering myqueries and providing me with technical information.
"Fully identified" vehicles out of the 841: 678
Of the 841 disparate passenger-cars having ex-works R-134a air-conditioning systems, 102 could notbe identified mainly because they had been deleted from the garage records. Deletions are generallyeffected in connection with transfers of ownership, in other words after a vehicle has been sold by thecustomer and has had its registration plate changed accordingly. The quota of deletions associated withdismantling is not very significant to date.
I decided not to seek further identification of another 61 vehicles (all from record-year 1999 and allrecording 'total' loss of refrigerant) by the garage concerned, because the additional knowledge therebyobtained for the purposes of the present study would have been disproportionate to the major work ofresearch otherwise imposed.
In the final outcome, the study disposed of 678 fully identifiable vehicles whose air-conditioning systemhad been opened between 1999 and 2001: 188 from Brand 1, 252 from Brand 2 and 238 from Brand 3(along with another 50 vehicles from the year 1998).
At 62.5%, the rate of emission for the 678 "fully identified" passenger-cars was slightly lower than the64% for the 841 vehicles listed above. The charge quantities in their 678 systems were also somewhatlower, being on average 848 grams instead of 856 grams.
Average age of vehicle on first opening of air-conditioning system: 34 months
The average age of a vehicle on first visiting a workshop to have its air-conditioning system opened was34 months, where the relevant information was available. This figure varies, being 32 months for Brand1, 31 months for Brand 2, and 38 months for Brand 3. The greater age for Brand 3 is quite conspicuous.That brand was distinctly higher than the others in kilometre reading too.
Average kilometre reading on first opening of air-conditioning system: 74,400 km
The average kilometre reading at time of first visit to workshop to have the air-conditioning systemopened was 74,400 km. Brand 1 clocked in at just under 71,000 km, Brand 2 coming clearly below thatwith 60,200 km. Brand 3, on the other hand, was well above, with a reading of 92,300 km.

5
8. Other information from the garages and the car manufacturers
The garages provided further data for some of our investigations (those into the "irregular", damage-induced proportion of the refrigerant emission rate), for instance their annual number of vehiclethroughputs and inspections. Apart from lists of the standard charge quantities for air-conditioningsystems in specific vehicles, the German car manufacturers also sent me the rate of installation of air-conditioning systems in specific types of passenger-cars sold annually on the German market since1992. This extra data is expressly referred to in Chapter E of the present study - where it is duly applied- so there is no call to examine it any further at this point.
9. Workshop visits for opening of air-conditioning system distributed over individualmonths
One important aspect affecting accuracy in measuring the rate of refrigerant emission that ought to beintroduced in this initial chapter (especially since it already arises out of the garage Record Sheetsbefore they were 'corrected' - where they extend to cover a full twelve-month period, that is) is the likelydistribution of air-conditioning-system openings over time (by the month) within a calendar year, asidentified by the date entered for workshop visit.
Diagram 1: Workshop visits to open air-conditioning system, distributed by month over calendar year.Based on 1,212 entries from ten garages. The diagram shows a significant accumulation in the warmermonths of the year (May to August) and a distinct under-representation during the colder months fromOctober to April. (We were also able to use the data from the tenth garage - fourth brand of car - for thisgraph).
Diagram 1 shows a significant concentration over the hot months of the year (May to August), and aclear under-representation in the colder months from October to April. Almost 25% of all air-conditioning-system openings are effected in May, this after only 6% in April.
Workshop Visits to open Air-Conditioning System by Month in Year (1,212 vehicles = 100%)
3%4%
5% 6%
16%
12% 12%
8%
5%4%
2%
23%
0%
5%
10%
15%
20%
25%
Jan Feb Mar Apr Mai Jun Jul Aug Sep Okt Nov DezMonth
Wor
ksho
p Vi
sits

6
Rather than reflecting any correspondingly more frequent occurrence of defects in air-conditioningsystems in May, this lack of uniformity in distribution is far more likely to represent the more frequentperception of defects during the warmer time of year. Even where a defect might in fact be noticed in thecolder months of the year, it apparently fails to constitute a disturbance until cooling is called for in thehotter months.
In the context of determining the rate of emission, this finding demonstrates that the time at whichemission occurs does not coincide with the time at which it is examined and eliminated in the workshop,in fact several months may pass by between an actual loss of refrigerant and its entry in a RecordSheet. Since, in the following, a vehicle's age is defined as the period elapsing from its first registrationto its recorded visit to a workshop (the date entered in the Record Sheet), our figures are systematicallyoverstated; not just because of the time it takes to arrange a workshop visit, which would be a normalfactor to take account of, but because the time between occurrence of a refrigerant loss and itsdetection in the workshop is probably a great deal longer still. Clearly, I have been unable to correct thisoverstatement of age in any single instance.
Accordingly, it should be duly borne in mind in examining this study that the recorded age of vehicleshas been systematically overstated - by about two or three months in my own estimation.

7
B. Reliability of Records and Accuracy of Recovery/RechargingStations
The quantities of refrigerant which mechanics enter in their Record Sheets as duly recovered andrecharged by the recovery/recharging station are of decisive importance to this study. It is even moreimportant to know how accurate these records are, which is to say how close a mechanic's entry may, orcan, come to the actual quantities in question. In this connection, it is often impossible to distinguishbetween objective factors such as the technical characteristics of the recovery/recharging station, andsubjective factors like the mechanic's accuracy in operating and reading off the unit. Consequently, ourstudy sets out below to
• explain the recovery and charging process of a typical recovery/recharging station (taking theSECUmat 134 by Behr as example) by describing its four main phases with reference to adrawing;
• discuss errors in determination of quantity, their significance, and their possible correction, andfinally
• estimate refrigerant losses in so far as caused by the servicing operation itself.
I. Recovery and Charging by Recovery/Recharging Station (see drawing)
The reader is recommended to refer to the drawing overleaf to assist with understanding the individualstages of the recovery and charging process.
1. Recovery (2 to 5 minutes)
The service connections of an air-conditioning system (see detail at bottom right) in a vehicle arearranged upstream of the compressor (grey 1) on the low-pressure side and upstream of the expansionvalve - often on the dryer - on the high-pressure side (grey 2). The low-pressure hose (1) and the high-pressure hose (2) of the recovery station are joined to these service connections. The valves areopened by manually turning the cock on the quick-fitting pipe union duly attached. The air-conditioningsystem's low pressure (suction pressure) and high pressure (liquefying pressure) readings are displayedon the pressure gauges (5) provided. Both operating points (or just the high-pressure point where acontrolled-output compressor is installed - because low pressure remains unaltered in that case at 2bar) provide the first indication of a system's condition.
The two hoses are joined together by valve taps (3 and 4), so the refrigerant passes over a single mainline leading inside the recovery/recharging station (the set of pressure gauges and the main line areusually inside the station, just the service hoses being connected on the outside). The refrigerant isdrawn in by the compressor (K) and flows over the separator (6) which holds back any entrainedrefrigerant oil. All of the refrigerant is rendered gaseous by absorption of heat by this stage at the latest,to prevent the compressor from being damaged by liquid. The concentrated gaseous refrigerant iscooled in the condenser (7) and then liquefied again, after which it flows through the filter dryer (8) intothe collecting tank (9).
In the region of 10 to 20 grams of refrigerant may still be left to evaporate inside the air-conditioningsystem after the first recovery (taking about 2 minutes), for instance refrigerant dissolved in oil or otherliquid refrigerant which could come from the dryer, for example. This subsequent evaporation increasespressure in the system to over 0.6 bar, which causes renewed recovery from the compressor when

8
operating automatically. Operating manually, the mechanic should wait briefly and must then himselfswitch on to recover the subsequently evaporated material.
The air-conditioning system is opened for repair work. As alternative, the internal refrigerant-cleaningprogram can be run beforehand, in a cycle driven by the compressor through collecting tank (9),separator (6), condenser (7), filter dryer (8) and back to the collecting tank (9) again.
Fig. 1: Typical recovery/recharging station for evacuating and filling passenger-car air-conditioningsystems - (1) low-pressure hose connection; (2) high-pressure hose connection; (3) and (4) valve cocks;(5) pressure gauge dials; (6) oil separator or trap; (7) condenser; (8) filter dryer; (9) reservoir tank; (10)(11) (12) solenoid valves; (P) vacuum pump; (K) compressor. Bottom right: compressor, condenser andfilter-dryer of car air-conditioning system. Grey (1) and (2): low-pressure and high-pressure air-conditioning-system service connections. (Source: DaimlerChrysler 2001 - modified).

9
2. Evacuation (20 to 30 minutes)
The hoses of the recovery/recharging station are connected to the air-conditioning system. The line tothe vacuum pump (P) is cleared by closing solenoid-valve (10) and opening solenoid valve (11) insidethe recovery/recharging station. The pump sucks in the air and other non-condensable gases from thesystem, and the vacuum gradually produced in the process boils and draws out any moisture which maybe present. Waste air is blown into the atmosphere, while low pressure develops in the system at thesame as required condition for charging.
The leak test by vacuum ('vacuum check') is passed where the pressure-gauge dials (5) fail to displayany readable rise in system pressure for at least five minutes after the vacuum pump has been turnedoff.
3. Recharging (1 to 3 minutes)
The low-pressure side (1) and high-pressure side (2) of the air-conditioning system are connected to therecharging station. The valve cock (3) on the low-pressure side is closed before charging, becauseliquid refrigerant must not be allowed to flow in upstream of the compressor. The valve cock (4) on thehigh-pressure side remains open. To make sure the refrigerant circuit is sufficiently well charged, therefrigerant in the reservoir tank of the recharging station is warmed by a heater to between 25 and 30°C,which increases the pressure in the tank to about 7 bar.
Liquid refrigerant flows into the system on the high-pressure side while the charging valve (12) remainsopen. The fill level on the transparent reservoir tank (9) falls as the tank contents flow out, so theamount of refrigerant discharged can be visually checked while recharging proceeds by reading off themeasuring lines encompassing the tank at 50-gram intervals (show volume converted to weight andallow for temperature-induced expansion).
Instead of employing the pressure method, some stations use an additional electrical charging pump forcharging purposes (this is actually essential when charging large quantities). Some old and all morerecent stations permit charge quantities to be read off precisely to within one gram, being equipped withan electronic scale for the reservoir cylinder rather than a visual control system.
4. Emptying the recharging hose
Pressure in the air-conditioning system rises as the charging operation proceeds, which stops the hoseand pressure-gauge fittings from being entirely emptied of refrigerant. The hose's quick-fitting pipe unioncloses when the service connection is taken off, to prevent loss of refrigerant from the incompletelyemptied hose and to stop air or damp from getting in to it (an estimated quantity of just 1 to 3 grams ofrefrigerant evaporates with a hiss between service valve and the interior of the hose's quick-fitting pipeunion.)
The hose is emptied by suction by turning on the compressor again. Up to 50 grams of refrigerant maystill remain in the hose depending on its length and on the internal temperature of the air-conditioningsystem. This residue is emptied for labour safety reasons among others, because even the safest ofclosure systems would be unable to rule out the possibility of a minor flash of refrigerant (engenderingthe risk of localised frostbite) when manually attaching a full hose during the next recovery operation.

10
II. Errors in determining Quantity; their Significance and Correction
1. Rounding off when measuring by sight, also where weighing electronically
All modern and some older stations (made between 1990 and 1995) have an electronic scale for thereservoir tank which determines quantities duly recovered and recharged. The scale displays changes inthe tank's weight digitally and therefore precisely to within a gram. Three of our nine garages hadstations of this kind, two of them using the FAST 2000 (manufactured between 1990 and 1994) and onehaving the Robinair Vacumaster (made in 1996). With the FAST 2000, the mechanic has to calculatethe recovery volume himself by reckoning the difference in reservoir-tank (cylinder) weight before andafter the operation (about 5,329 related to 4,803 grams). The Robinair station displays the recoveryvolume as an absolute figure related to zero. When charging - regarded as the more important operation- the mechanic can enter the desired dosage to within exactly one gram in all three stations, usuallyabout 1,000 grams, this dosage then being let precisely out of the reservoir tank (cylinder) along with theaddition of a compensatory excess quantity.
The reservoir tank simultaneously serves as (transparent) measuring cylinder in the other most widelyused types of station (SECUmat 134 or Waeco RHS 850). When recovering and recharging, themechanic watches the measuring lines encompassing the cylinder at 50-gram intervals. The chargequantity cannot be read off from zero, but, like the recovery volume, as difference in level before andafter the operation, so not only does the mechanic have to do mental arithmetic, he must also have agood eye. In practice, he usually marks the starting level on the outside of the measuring cylinder (usinga felt pen) and thus reduces the risk of read-out errors.
The Record Sheets furnish no proof that stations with scales and electronic display might be in any waysuperior to those simply provided with visual control means, all hand-written entries (also those enteredmanually into a computer, as done at one garage) being made in 50-gram increments.
This is not particularly surprising in respect of charging. Almost all air-conditioning systems in Germancars work with standard quantities stated within 50 or 100 gram limits, with 25 or indeed 10 gram limitsrarely to be found. This is also the case with foreign makes (see Autodata 2000; Waeco 4/2000). So ifthe mechanic knows the standard charge quantity, why should he do otherwise than simply enter italong with the extra allowance for the hose?3
However, the 50-gram increment which both types of station use for entries seems astonishing at firstglance in respect of the recovery quantity, because (but for a few exceptions) the recorded quantitiesmust necessarily be based on figures duly rounded up or down - although it is easy to see why thismethod is used for measurement cylinders having 50-gram increments. With even the very best ofvisual inspection, a deviation of up to 25 grams from the effective quantity would be normal. As opposedto this, the electronic scale provides data precise to within one gram. Where not measured in relation tozero, the displayed weight of the reservoir tank should be noted down beforehand (on paper or pocketcalculator) - if the weight is 4,803 grams before recovery, and then 5,329 afterwards, producing adifference of 526 grams, the mechanic will enter either 500 grams or 550 grams. However, he wouldalso enter 500 grams for a figure of just 478. The inaccuracy of
measurement amounts to about 50 grams (25 grams up or 25 grams down). Where 200 grams ofrefrigerant is lost, this deviation makes up more than ten percent. Greater precision would take themechanic more time and is not required of him. The same procedure is followed even in the garage
3 A station's accuracy of measurement when charging is not all that important to the present study in anycase, the factory standard figure duly being taken as basis for a full air-conditioning system.

11
operating a Robinair station (recovery displayed to a precision of one gram), where the Record Sheetsalso document none other than 50-gram increments.
In all 841 cases covered by this study, the loss of refrigerant is determined as difference between theex-works standard charge and the recovery quantity entered by the mechanic. From practicalexperience, there is no significant difference in the accuracy of entering recovered quantities measuredby eye or by electronic display, both measurements, as we have said, being duly rounded off to 50grams.4 Given the mechanic's routine, there is little reason to think of the entries based on electronicmeasurement as being any more reliable than those made with the naked eye.
The foregoing has the consequence for the present study that the entries it records may generallyincorporate a deviation of about 25 grams up or down from the effective quantity recovered. The onlyexception would be the 323 entries of 'total' loss of refrigerant (representing a recovery of zero grams),where rounding-off is less likely. Taken together, however, 'total' losses do make up almost forty percentof all 841 entries.
2. The residue in the hose as source of error in determining the charge quantity
As mentioned at the end of the description of the charging operation, the charging hose never emptiesentirely into the air-conditioning system. Were the mechanic simply to read off the exact standardcharge from the charging cylinder, he would be systematically under-charging the systems he works on.As a result, some car manufacturers specify an 'over-dosage' of from 25 to 50 grams by way ofcompensation. This recommended extra quantity is also advised by the suppliers of recovery/rechargingstations, into some of which the extra quantity can be permanently programmed as a function of thelength of the recovery and recharging hoses. The advantage here is that the mechanic can still stay withthe exact standard system charge.
2.1 Quantity recovered occasionally exaggerated because hose not emptied.
After charging, the mechanic must always make sure to have any residue sucked back out of the hose.If he forgets to do so, then when he connects up the unemptied hose to perform the next recovery, herisks frost-bitten hands from a flash of refrigerant gas even if only a little emerges from the closure. Theimportant aspect in the present context is that the quantity of refrigerant recovered with an unemptiedhose of this kind would then be greater than the actual content of the air-conditioning system - resultingin an "upward" error in measuring the quantity recovered. This measurement error was mentioned in thecourse of interviews with air-conditioning mechanics during the present study, its "occasional"occurrence being justified on the grounds of pressure of work associated with payment of an incentivewage.
2.2 Charge quantities entered in Record Sheets often deviate from standard charge
Whether or not the excess quantity is 'sucked back', the calculated extra quantity charged is actuallymore important to the exercise of determining quantities than occasional exaggerations attributable torecovery using an unemptied high-pressure hose. Where a car manufacturer indicates "plus 50 grams"
4 The latest stations with data interface to the workshop computer and/or integrated printers (forinstance, the Beissbarth MAC 26 or Waeco RHS 800 in use with one garage since May 2001) save ordirectly provide recovered and charged quantities of refrigerant in 5-gram increments. As these typesbecome more widespread, the accuracy of the data obtained should improve.

12
along with his type-specific charge quantity, mechanics tend always to let this greater quantity out of thereservoir tank and to enter it as 'charge quantity' in their Refrigerant Record Sheet. Understandably, thequantity 'sucked back' after charging is not measured, so it is not subtracted again from the quantitydelivered. For this reason, the charge entered is in very many cases not the same as the standardcharge of the air-conditioning system, it is in fact greater than same.
The Record Sheets clearly indicate that workshops with stations compelling the mechanic to enter theadditional quantity himself on every occasion (this being the case with six out of the nine) enter highercharge quantities - and therefore greater charge differences - than workshops where the extra quantityis permanently pre-set. The latter workshops can work directly with the lower charge quantity. In ourown study's case, in fact, the air-conditioning systems of vehicle makes whose charge quantities arespecified precisely to within a gram for every model, therefore without compensatory addition, arerecovered and charged exclusively with stations in which excess quantity of refrigerant is permanentlypre-programmed.
The consequence for the present study is that the differences between recovery and recharging that areduly entered in the Record Sheets cannot always be taken as actual refrigerant loss from the vehicles inquestion. Corrections may sometimes be necessary. Refrigerant loss in the present case generallycomprises the difference between entered recovery and the manufacturer's specified standard charge,whether or not the latter is actually entered as charge in the Record Sheet.
The varying data specific to particular vehicles and also to years of manufacture is gleaned from listsprovided by the three car manufacturers and from the literature on the subject (Autodata 2000; Waeco4/2000), an approach which I think should reduce the incidence of measurement errors. At any rate, thepresent study is concerned with refrigerant loss determined on the occasion of an air-conditioningsystem's first visit to the workshop since first registration. For this reason too, the 'ex-works charge' is abetter measure to go by than the 'workshop charge' - after all, it can readily be assumed that no carmanufacturer is likely to fill his systems with any more refrigerant than absolutely necessary.
3. Temperature differences between recovery/recharging station and air-conditioningsystem when recovering
Another possible source of error relating not to the charge quantity, but to the recovery quantity - onethat may arise in connection with all designs of recovery/recharging station - is discussed in thefollowing for the sake of completeness.
The only propelling force transporting the refrigerant throughout the recovery and charging operation isthe compressor in the recovery/recharging station. Not only does the compressor suck the refrigerantout of the air-conditioning system and force it into the condenser, it is also the only agent causing therefrigerant already disposed in the liquids pipeline downstream of the condenser to flow on into thereservoir tank, in that liquid continues flowing out of the condenser thanks to the workings of thecompressor. As soon as this flow peters out (once the system is sucked empty), the refrigerant remainsstationary in the final stretch between
condenser (7) and collecting vessel (9). Measurement errors do not generally arise in this connection,since when recovering the next air-conditioning system, this residue originating from the precedingsystem, downstream of the condenser in the recovery/recharging station, is in fact the first materialcarried into the reservoir tank. Not until that operation is completed does refrigerant begin to flow in fromthe system currently under recovery, once again minus the residue downstream of the condenser, andso on and so forth.

13
In principle, the incomplete throughput of the one recovery is continuously compensated in this mannerby the likewise incomplete throughput of the next recovery. Distortions only occur in connection withtemperature differences and therefore differences in expansion between in-flowing new refrigerant andold refrigerant - which distortions, not having been examined in the present study, have not been takeninto account.
4. Recovery of after-evaporation forgotten
We explained when describing the basic operation of recovery that, after the first recovery taking abouttwo minutes, approximately 10 to 20 grams of refrigerant (which may have been dissolved in oil, or wasnot immediately withdrawn from the lower parts of the refrigerant circuit) may still evaporate within asystem which is not yet completely empty. In automatic operation, which is a facility of all of therecovery/recharging stations in the present population, the recovery process is set up to extend for atleast an extra three minutes, so that, after the station is turned off for the first time, it will start again onany renewed rise in pressure in the air-conditioning system and then continue with the recovery ofresidues.
In manual operation, the mechanic must wait for any possible rise in pressure after the first recovery(observing the pressure gauges), and then turn on the station again where necessary.
Clearly, this after-evaporation may well be neglected from time to time under general pressure of work.Any subsequently evaporating refrigerant of this kind is noticeable as emerging cloud by no later thanthe stage of opening the air-conditioning system. In such cases, the recovery quantity read off therecovery/recharging station understates the content of the system by from 10 to 20 grams.
This study has not attempted to quantify the differences in measurement attributable to this neglect ofafter-evaporation (and thus the emission of refrigerant due to improper servicing). I also felt unable togive any estimates, in fact all I would say is that six of the nine stations did provide the option ofmanually terminating the recovery period.
5. Omitted entries
In concluding our discussion of sources of error in determining refrigerant quantities when servicing anair-conditioning system, we should mention the mistake that actually occurs most frequently:unintentional neglect to enter the recovery and charging operation in the Record Sheet.
Although the Refrigerant Record Sheet is usually kept in the workshop, in a folder directly attached tothe recovery/recycling station, it is inevitable that hand-written records of this or that operation cansometimes be forgotten in the general hustle and bustle of everyday garage routine. Then looking at theRecord Sheets themselves, there is no need to be a handwriting expert to see quite clearly thesometimes unusually careful and identical writing of one and the same mechanic, using one and thesame ball point, as he attempts to catch up
on the entries that should have been made for a number of vehicles over the past three or four days.Then again, it should be said, this 'catching up' is not always done.
Air-conditioning mechanics interviewed in the course of our study gave estimates of forgotten entriesranging from "none at all" in smaller garages, to "at least ten percent" in the larger firms. Although I thinkmyself that the mean of 5% is too low, it has been taken as the maximum in this study. Which meansthat refrigerant losses in the region of 477.2 kilograms should be regarded as 5% or 24 kilograms higher

14
than that in reality, amounting, in other words, to about 500 kilograms (501 kg). The loss per vehicledoes not alter as a result, because this allowance also increases the number of air-conditioning systemsby 5%, from 841 to 883.
This correcting factor produces a slight increase in determination of the so-called 'irregular' rate ofemission (see Chapters E and F), while the 'regular' rate of emission (see Chapter D) remainsunaffected.
III. Refrigerant Loss caused by the Servicing Operation itself
Apart from neglected after-evaporation, two other sources of refrigerant emission associated withservicing would be loss while locating leaks, and loss when detaching the charging hose.
1. Loss when charging
The maximum loss on detaching the charging hose from the service connection (see description ofbasic process) is estimated at between one and three grams. The hose end closes of itself as it iswithdrawn from the service valve (the coupling cannot be removed unless the cut-off valve is closed byhand), this being a major technical improvement over the period before 1991, when refrigerant R-12 wasgenerally released entirely into the atmosphere on opening an air-conditioning system. According to thesuppliers of recovery/recharging stations, the reliability of this closure system has to a large extent beentechnically perfected by now, so the mean loss estimated at two grams would be regarded asunavoidable at the present time (Recovery/Recycling/Recharging Stations Conference - 2001).
Since, when we subtract 31 renewed charges not effected (including vehicles sent for dismantling) andthen add the 72 multiple charges in the same or the succeeding year (in so far as recorded in bothsituations), the 841 different air-conditioning systems in our survey population would in fact have beencharged 882 times in total, 882 times two grams or in total just under two kilograms of refrigerant beingreleased into the ambient air in the process.
To put it another way, loss during charging adds two grams or 0.4% to the mean loss of 546 grams(64% in relation to the mean charge quantity of 856 grams) recorded for all opened air-conditioningsystems in the study population, so we end up with a total of 548 grams.
2. Refrigerant loss when locating leaks with contrast medium
The 'total' losses we referred to above extend not only to air-conditioning systems 'irregularly' harmed byoutside influences (the main category being 'accident damage') and usually producing 100% emission,but also include vehicles having losses of over 100%. These are cars which, due to the one leak, havelost refrigerant in the course of more than one charging
operation, because instead of being repaired during the first visit to the workshop, the leaking systemwas simply filled up. 29 of the 323 recorded 'total' losses come under this heading.
Where the mechanic fails to find a fault in an empty system on visual inspection or on performing thevacuum check after recovery, he continues by filling the system with liquid nitrogen or with refrigerant tolocalise the leak, observing the pressure-producing gas that duly emerges. To find the leak, he uses anelectronic leak indicator unit which reacts to refrigerant escaping from the system either in pure form or(where flushing with liquid nitrogen) as entrained residue. Although not yet generally approved by

15
compressor manufacturers as a method of locating leaks5, it is normal practice in many garages to adda contrast medium or 'tracer' when charging the refrigerant. The tracer comprises a few drops ofrefrigerator oil mixed and dyed with a fluorescent substance and incorporated with the in-flowing chargeof refrigerant. This method is used in eight of the nine garages in our population.6
Having allowed the air-conditioning system to run for a few minutes, an ultraviolet lamp will usuallylocate the tracer as luminous coloured stain around the leak (since a case of this kind involves renewedemergence of refrigerant, loss from the vehicle in question rises to more than 100%). The stain isgenerally cleaned off after the leak has been repaired, to prevent any misunderstanding the next timethe car is maintained (any residue left behind might otherwise be interpreted as a new leak).
If, even where using a tracer, the mechanic still fails to find a suspected leak on the same day, the leakmay be regarded as active but minute, only allowing the associated volume of refrigerant to escape overa prolonged period under real driving conditions, so its location by staining may take days or weeks offurther operation. The fault will not then be found and rectified until the next time the car visits theworkshop. This method of leak detection is associated with emission rates of 200% - apart from the fewvehicles (only two in the present population) that had different leaks in the one year.
Refrigerant loss occurring over and above 'total' loss where a leak is first found on emergence of tracer-containing refrigerant (whether this happens on the first visit or during a subsequent visit to theworkshop) is regarded in this study as 'service-induced' emission associated with leak location. The 29affected vehicles in the study population suffered an extra loss of 20.5 kilograms in addition to their(first) 'total' loss of 27.5 kilograms. These 20.5 extra kilograms are 'service' emissions in the narrowersense of the word.
Accordingly, of the total recorded refrigerant loss of 459.2 kilograms from the 841 vehicles in the study,20.5 kilograms (or 4.5%) is attributable to loss during leak detection.
Other, rather more 'unusual' losses of refrigerant in the workshop should also be mentioned at this point.For example, one 1997 Record Sheet from one garage documents total leakage
from the tank of the recovery/recharging station ("charge 25 kg, recovery/recharging station leaking").The refrigerant released over night in this case more or less equalled the above 29 cases of 'service'emission in the course of leak detection (20.5 kg in eight garages).
5 The principal reason for their reluctance is concern that the tracer might damage the compressor. Onething that can definitely be said, however, is that the tracer dissolves in oil, not in refrigerant. Therefrigerant sucked in by the recovery/recharging station's compressor is colourless when it reaches thereservoir tank.6 Obviously, pressure-based leak testing with nitrogen is a more environmentally friendly method oflocating leaks than charging with refrigerant and contrast medium. One of the nine garages does notuse tracer to locate leaks, with successful results according to the Record Sheets, in that none of theminclude any entry of multiple visits because of one and the same leak.

16
C. Reasons for Opening an Air-Conditioning System and Causes ofDetected Refrigerant Loss
Picture: DaimlerChrysler 2001 (modified)
Fig. 2: Potentially defective components of a passenger-car air-conditioning system*
1. Compressor,2. High-pressure line (gaseous) to condenser,3. Condenser,4. High-pressure line (liquid) to dryer,5. Dryer/collector (with high-pressure and low-pressure switches),6. High-pressure line (liquid) to expansion valve,7. Evaporator,8. Expansion valve for evaporator,9. Intake line (gaseous) to compressor,
A. Service connection on high-pressure side,B. Service connection on low-pressure side.
* Evaporator injection through expansion valve, not choke. If using choke, the collector would bedownstream rather than upstream of the evaporator.

17
The Record Sheets document the refrigerant which a mechanic recovers from each vehicle (havingopened its air-conditioning system) and measures with varying degrees of accuracy. Any shortage ofrefrigerant discovered on opening is therefore recorded at the same time, as difference between thequantity recovered and the standard level of charge. The rates of loss determined in this manner coverthe whole spectrum from 0% to 100% (and sometimes above). While the explanation provided by theair-conditioning mechanic is not always that informative, the proportion of precisely recorded cases issufficient in size to provide a picture of the principal reasons for opening an air-conditioning system.
In Table 1, all recorded rates of refrigerant loss are separated into small, medium and large volumes.The percentages of these losses out of all opened air-conditioning systems is shown in Column 2, theirpercentage of total refrigerant loss in Column 3.
Table 1: Percentage of small, medium and large refrigerant losswithin total loss of 459.2 kg (841 systems)
Refrigerant loss Percentage of allopened systems
Percentage of totalrefrigerant loss
small - less than 40% 39% 9%medium - 40% to < 100% 23% 24%large - 100% and over* 38% 67%* Losses > 100% are attributable to multiple losses from the one system in the same year
Small losses (less than 40%) were found in about 40% of air-conditioning systems opened. This group'spercentage of total refrigerant loss is just 9%. 'Total' losses of 100% and above represent the otherextreme, also found in nearly 40% of opened air-conditioning systems but making up two thirds of totalrecorded refrigerant loss (see bottom line of Table 1).
I. Elimination of Leaks, the Main Reason for Opening on Total Loss ofRefrigerant
Total loss of refrigerant results in failure of the air-conditioning system. Even before 'total' loss actuallyoccurs, however, the system will already have come to a standstill when there is only about 100 to 200grams left in its circuit. This is because extreme lack of refrigerant drops the system's high-pressurebelow about 2 bar (the setpoint value), on which the compressor is automatically switched off either by aspecial low-pressure switch, or by an internal control system. If there is too little pressure, the refrigerantwill even begin to evaporate below zero degrees centigrade, causing the system to ice up. Thecompressor itself needs to be protected against running hot or clogging up, because lubricant alsoceases to circulate once the refrigerant runs out. The driver himself will usually notice and report his air-conditioning system's lack of performance, nor can any such lack escape routine workshop-inspectionusing an electronic fault readout unit, which will register the fact that the compressor is switched off. Forthe mechanic, lack of refrigerant is the obvious diagnosis inducing him to start recovery with therecovery/recharging station so as to find and repair a leak in the system.
Air-conditioning systems suffering total loss of refrigerant are generally opened for one single reason,namely to remedy the cause of this particular kind of loss. That is the main reason. Which seems anobvious and trivial thing to say, but it isn't in fact, because the same does not apply to air-conditioningsystems experiencing losses of less than 40%.
The cause of a total loss is mainly external, but can also be internal.
The cause is external where mechanical action from outside produces leaks in components of therefrigerant circuit. Such action would be an accident damaging the front panelling, or the impact of

18
thrown stones. The condenser is by far the most likely component to be found leaking where loss istotal, being placed well forward on the vehicle, right in front of the radiator.
The cause of a total loss is internal where a component, without being exposed to forceful outsideinfluence, suffers an 'irregular' defect which creates an effective point of emergence for the refrigerant.This would not include normal wear and tear, to which every component is physically prone, but someunusual instance such as a burst or corroded compressor, a burst dryer, perforations in the pipeline,cracks in the evaporator, etc. What accidents or stone impact on the one hand and irregular componentdefects on the other share in common is an emissive pattern of damage.
The three recorded causes of total refrigerant loss were
1. accidents involving body damage (40%),2. minor collisions, stone impact or internal emissive component defects (40 to 50%), and3. unknown causes where the vehicle was simply recharged (10 to 15%).
1. Empty air-conditioning system after accident involving body damage
Accidents involving severe panel damage in the front region of the vehicle account for around 40% ofrecorded total losses. In the process, frontally positioned components of the air-conditioning system arepushed in and caused to leak - generally abruptly. The condenser is damaged in 90% of cases,sometimes the high-pressure lines connected to it too, and the adjacently fitted dryer.
Where an accident damages the body rather than the bumper, the vehicle is given to the body shopwhich, in addition to repairing the damaged panels, also replaces the defective components of the air-conditioning system. In such cases, the air-conditioning mechanic checks the system beforehand tomake sure it is empty, then afterwards he checks it for leaks and recharges it with refrigerant.
The mechanic, completing his Record Sheet, may enter the whole operation in two stages:"Recovery: 0 g, recharge: 0 g" and then some days later - "Recovery: 0 g, recharge: 1000 g", adding thenote "accident" each time. Or, alternatively, he may combine the whole operation into one entry:"Recovery: 0 g, recharge: 1000 g; Note: accident". Normally, he does not name the defective part,because he is not the person replacing it7.
2. Total loss due to stone impact or irregular component defect
Another 40 or 50% of total losses are attributable to leaks caused by a minor collision, an unnoticedknock from a stone, or an unusual component defect. The repair work is not given to the body shop insuch instances, but is done by the air-conditioning mechanic himself, who then also makes a record ofthe replacement of components. Here again, the condenser
is a typical source of leakage, albeit that its leaks are mainly caused by stones. A thrown stone destroysthe surface of one of the flat refrigerant-conducting tubes, which then corrodes (by pitting) at the point ofimpact. It takes at most a week for an emissive leak to develop, the process in fact being accelerated bydamp or salty air passing through the condenser.
The Record Sheets would indicate that, at a rate of 40 to 50%, the condenser is the most frequent singlecause of total refrigerant loss in the absence of panel damage, so it is also the component mostfrequently replaced by the air-conditioning mechanic himself; but by no means the only one, of course.
7 The absence of a second entry after the "Recovery: 0 g, recharge: 0 g, Note: accident" entry in theRecord Sheet indicates total failure and dismantling of the vehicle - apart from occasions where thesecond entry may simply be forgotten.

19
Table 2 reproduces the order of frequency with which components are replaced, in so far as expresslydocumented in the Record Sheets (70 instances).
Table 2: Defective components causing total refrigerant loss and replaced by the air-conditioning mechanic himself (70 recorded instances - excluding accidents damaging
body)Component Percentile share of components replaced by
air-conditioning mechanicCondenser 42%Pipelines 17%Evaporator 17%Expansion valve 9%Compressor 8%Dryer 3%Seals 4%
A replaced component is only listed here where it has been the prime cause of total loss. It is importantto mention this, since some components may be replaced because of secondary defects. For instance,the dryer, which generally becomes inoperative once the air-conditioning system has been runningempty for a while. The expansion valve, too, must often be replaced in consequence of some othercomponent defect, in this case a defective compressor, whose chips can clog the valve. Piping oftenneeds to be replaced as well, when the component (say the condenser, evaporator, or expansion valve)to which it is connected suffers damage.
While stone impact and accidents involving a minor collision bear the main responsibility for leaks incondensers (42%), and similarly affect the high-pressure refrigerant lines connected to the condenser(17%), leaks in the few other exposed components (41%) are far more rarely caused by outsideinfluences. Where a defective compressor, expansion valve, dryer, connection or pipeline abruptly letsso much refrigerant through that total loss occurs, the reason is often 'irregular' internal damage, due,for example, to corrosion (including the electrochemical type), overload (excess pressure), or defectiveworkmanship on the part of the manufacturer. It can also happen that components will be so severelydamaged by a preceding lack of refrigerant (insufficient lubrication of the compressor, etc.) that theybegin to leak of themselves, letting the very last of the refrigerant finally escape.
3. Total loss followed simply by recharging without repair work
Components of the refrigerant circuit are not always actually replaced when they leak, even where thework would be technically feasible or had even been begun (by adding tracer, for instance). In fact,about 10 to 15% of systems with total loss are simply recharged, the main reasons being
• customer failure to have the necessary work done, or to bring their vehicle in on the due date forinspection, hoping they will get by with just a recharge especially where a leak is thought just toallow a very slow escape of refrigerant;
• risk of renewed total loss after a simple recharge being taken, by customers who have to pay for therepair work themselves where out of warranty or not covered by goodwill, given that a rechargecosts up to ten times less than a repair;
• customer reluctance to undergo time-consuming repairs, for instance because they are travelling onbusiness and just want their air-conditioning system "quickly patched up" and running again;

20
• cases in which the mechanic simply cannot find a leak and therefore has no option but to rechargethe system.
The characteristic shared in common by all "simple recharge" cases is that it proves impossible toidentify a mechanical leak and associate it with a particular component, as a result of which the RecordSheet shows no record of a component being replaced.
II. Opening a System where Refrigerant Loss is less than 40%
Every car air-conditioning system (even when switched off) is subject to a certain degree of slowleakage of its permanently pressurised refrigerant through hose unions, compressor seals andconnection seals, especially where such parts - like the functional components of the refrigerant circuitthemselves - are subject to the irregular movements of engine and vehicle. This "normal" loss has nodeleterious effect on operation of the air-conditioning system over time, especially in view of therelatively generous margin that exists for continued operation of the system despite some reduction inthe original charge of refrigerant.
"Normal" refrigerant leakage has no real long-term influence on cooling capacity, at least for as long asexclusively liquid refrigerant continues to leave the collector where, normally, gaseous refrigerant fromthe condenser is finally separated out, and injected by the expansion valve into the evaporator. As isknown, the cooling performance of the evaporator relies on the change in phase between liquid and gas.As soon as the refrigerant in the system falls below a certain level, the collector obtains too little liquidfrom the condenser and then loses its ability to separate saturated gas from the condenser to produceliquid refrigerant.8 From this point on, gaseous refrigerant ("flash gas") extends up to the expansionvalve, as evidenced by the formation of small gas bubbles in the liquid line between collector andexpansion valve.9 The expansion valve is not designed to conduct gaseous refrigerant and ceases toprovide the evaporator with a steady supply. The evaporator, for want of liquid refrigerant, can no longerproduce its cooling effect. The process proceeds fairly swiftly once begun, continuing until the systemvirtually stops delivering cooled air (Haussmann, 2001).
The level of refrigerant loss below which an air-conditioning system will cease to work is not a fixedquantity. After all, 'cooling' is in the first place a matter of subjective feeling, and in the second place, asystem's capacity to continue operating on a given volume of refrigerant will depend objectively on itstechnical design, viz. the capacity of the collector, the length of the liquid pipeline between condenserand expansion valve, etc. Nonetheless, a rough order of magnitude of "around 40%" can be presumed,which means that in the individual situation, one system might work just as well with a 45% loss asanother one would at 35%.
The "40% mark" standing for low loss of refrigerant is based on the experience of mechanics10
interviewed in the course of our study, who reported that a level of 60% is the bottom limit above whicha passenger-car air-conditioning system will still be marginally able to operate sufficiently well unless itcontains some other defect (see Chapter D).
8 The process of undercooling the refrigerant to prevent undesirable evaporation also fails in thiscontext, because it can only occur in the liquid phase. Temperature then begins to rise.9 In systems having a choke (orifice tube), where the collector is arranged upstream of the condenser(and after the evaporator), flash gas forms in similar fashion on shortage of refrigerant.10 The mechanics generally considered that an air-conditioning system will no longer work normally onceit reaches "half its level of refrigerant", but that its performance already begins to fall off so muchbeforehand that the driver readily notices it is failing.

21
As we saw above, air-conditioning systems suffering total loss of refrigerant are opened to find andrectify an 'irregular' cause of emission (a leak, so to speak). In contrast, refrigerant losses of less than40% do not generally give occasion to open the system. It is not the goal of vehicle inspection toarrange for "a system to be as full as possible". Routine measurements are omitted11, especially sincethe whole volume of refrigerant has to be recovered and recharged for the purpose (there are as yet noother methods of conducting this measurement). As a result, refrigerant loss less than 40% goesunnoticed in the majority of the vehicles passing through a workshop (unlike the case of 'total' loss).
Despite this, the Refrigerant Record Sheets reported 40% of vehicles with opened air-conditioningsystem as having a rate of loss of less than 40% (see Table 1). The reasons for opening these particularsystems are substantially different from those associated with 'total loss', however, being four in number:
1. replacement of components not causing refrigerant loss (32%),2. air-conditioning system hindering repairs to engine and cooling system (22%),3. location of damage and preparatory work in advance of body repairs (24%), and4. leak tests on customer's or workshop's initiative (30%).
It should be clearly emphasised that these were simply reasons for opening the air-conditioning system,and not causes of refrigerant loss already perceived - as would in fact be the case on 'total loss'.Although refrigerant loss is always made up when recharging, seeking the cause is not the primaryconcern when the loss is only slight.
1. Component defects not themselves responsible for release of refrigerant
Component defects adversely affecting operation, unusual behaviour of the air-conditioning systemaccounted for 32% of recorded recoveries from systems which still contained sufficient refrigerant tooperate properly (loss being less than 40%). Total failure of the system was exceptional. Fault diagnosiswas based here, for instance, on unusual noises (rattling compressor, whistling expansion valve),unpleasant odours (condensed water encouraging development of bacteria on the evaporator), erraticoperation due to constant restarting of the compressor (because of insufficient supply of refrigerant andoil through a clogged refrigerant circuit) or the fan (continuously re-activated by the high-pressure switchdue to reduced heat-exchanging capacity of a dirty or clogged condenser), etc. Unlike the 'total loss'defects, component faults of this kind are only indirectly associated with the tightness of the refrigerantcircuit, if at all. Such "non-emissive" defects in components replaced by an air-conditioning mechanicare manifestly different from the "emissive" component defects causing total loss.12
Table 3: Percentages of components replaced because defective in systems whererefrigerant loss is < 40% - 48 mentions (compared with 'total loss' percentages*)
Replaced component Refrigerant loss < 40% Total loss of refrigerant*Compressor 63% 8%Expansion valve 16% 9%Evaporator 5% 17%Condenser 5% 42%Seals 5% 4%Dryer 3% 3%Pipelines 2% 17%* excluding 'total losses' with body damage, where the condenser is replaced in 90% of cases. 11 Except for diagnosis of electronic faults, the air-conditioning system test on inspection is mostlylimited to a brief manual examination of the flow of cold air from the evaporator during a test drive withair-conditioning system switched on. Some mechanics briefly press down the valve of the high-pressureservice connection to check the outlet pressure of the refrigerant.12 See Waeco 3/2000b for summary of most frequent air-conditioning-system defects, their causes andtheir possible remedies.

22
The centre and right-hand column of Table 3 below show how significantly the list of componentsreplaced where loss of refrigerant is slight differs in order of priority from the series of componentdefects producing total loss without damage to the bodywork.
The compressor is by far the most frequently replaced of components (64%) where refrigerant loss islow, unlike the 'total loss' situation where the same unit makes up only 8% of replacements. Theopposite can be said of the condenser, which only accounts for 5% of component defects associatedwith less than 40% loss, while it constitutes 42% of defective parts where loss is total (in cases notinvolving panel damage). Evidently, damage to the compressor (defective magnetic coupling, faultycontrol valve, seizing piston, penetrating humidity) is less likely to result in emissive leaks - and tendsmore to be contained within the component itself - than faults in the condenser, which almost alwaysresult in abrupt emergence of refrigerant.13 This bears out the assumption that component defects fallingwithin the low-loss category are different by nature from defects that lead to high or even total loss.
2. Air-conditioning system as obstacle to engine or radiator repairs
About 22% of all recoveries from an air-conditioning system that had not yet lost 40% of its refrigerantwere performed not because of the system itself, but because it left other components inaccessible. In17% of these cases, the air-conditioning system was in the way when dismantling and re-installing theengine, while on 5% of occasions, it created a problem
when dismantling and fitting the radiator. Condensers and high-pressure lines were the main itemsrequiring temporary removal. In such instances, an air-conditioning system is not actually openedbecause it is losing refrigerant, even if such loss may well be found in the process and duly rectified.
3. Establishment of accident damage and preparation for bodywork repairs
About 24% of recoveries in which less than 40% refrigerant was found to have been lost wereperformed on vehicles that had been in an accident.
Just as there are 'emissive' and 'non-emissive' component defects, accidents can also be 'emissive' or'non-emissive.14 Accidents affecting the front of a vehicle can damage the air-conditioning systemseverely, this being the main cause of 'total' loss of refrigerant. However, even an accident involvingserious damage to panelling can also leave the air-conditioning system undamaged, or simply buckle itsmore exposed components.
Accordingly, there are two reasons for recovery from an accident vehicle. Firstly, the process serves tolocate possible damage (loss of refrigerant) to the air-conditioning system, and secondly, the refrigerantmust in any case be removed from the system before the vehicle is handed over to the body shop. Anair-conditioning system cannot be welded or soldered when full, nor can welding or soldering work bedone on the vehicle - or oven-drying after repairs to paintwork - because of the risk that portions of thesystem might heat up, the heat then producing excess pressure that could destroy its components.Furthermore, the refrigerant might produce decomposition products which are not only toxic, but can
13 The condenser may suffer a 'non-emissive' defect when it is merely bent or dented in the course of aminor collision, without actually developing a leak. This component may also have to be replaced whereheat exchange is inhibited by severe soiling, if the mechanic is concerned that steam-jet cleaning mightdamage its fine blades.14 Fischer (1997) had already distinguished between accidents destroying the air-conditioning system,and those leaving it undamaged.

23
also corrode piping and other parts of the system. The principal culprit here would be hydrogen fluoride(HF).
4. Leak tests at customer's or workshop's initiative
The level of refrigerant in a system had only been measured as a 'side-effect' in all of the recoveriesmentioned so far, whereas recovery in about 30% of cases was directly aimed at (preventive)measurement of the refrigerant level.
Two thirds of these 'direct measurements' were carried out at the request or on the complaint of thecustomer, the principal motive being dissatisfaction with the cooling effect ("not cooling properly").15 Theinteresting point is that these measurements revealed only about 10 to 15% loss of refrigerant onaverage, with just a few exceptional figures of up to 30%. In other words, it is unlikely that coolingcapacity would have noticeably improved after recharging. I suspect, myself, that customers complainso often about deficient working of intact air-conditioning systems because they expect far more of thesesystems than they can actually provide.
One third of these measurements were made at the initiative of the mechanic, often because of the(unconfirmed) suspicion that a system fault whose cause was not otherwise to be found could in fact bedue to lack of refrigerant.
III. Consequences for Method of Estimating the Rate of Emission
Even leaving out the 'middle' group of refrigerant losses between 40 and 99% (where specific reasonsfor opening the air-conditioning system overlap and are more difficult to distinguish), our analysis ofsystem openings in connection with total loss and losses of less than 40% provide an importantfoundation for the principal goal of this study, namely the estimate of the annual rate of emission frompassenger-car air-conditioning systems based on empirical findings.
The two results of our ideally typical16 comparison of air-conditioning-system openings are
firstly: high ('total' in this instance) loss of refrigerant is attributable to 'irregular' defects in the refrigerantcircuit. The resultant leak causes the air-conditioning system to fail. The system has to be opened, thisbeing arranged and done right away in the direct aim of remedying the source of loss; and
secondly: limited loss (assumed as up to 40% of the standard charge) does not in itself cause failure ofthe air-conditioning system. Loss of this kind is merely detected indirectly, when opening a system forreasons other than remedying the source of loss - for instance the replacement of internally defectivecomponents, provision of access to the engine, emptying the system for work on the body, andpreventive checking of the charge level.
15 One exception would be the vehicle owner wanting to know if his air-conditioning system was stillrefrigerant-tight after rubber components had been nibbled by martens (incidentally, the system had notlost a single gram of refrigerant). Another was the driver wishing to be reassured of a full system beforeholidaying in a southern climate - an unusual case.16 It should be clearly borne in mind that this comparison is 'ideally typical' because in reality, there is nosharp, distinguishing line to separate 'high' loss from 'low'. 'Total' loss may also be due to a 'regular' andnot very emissive defect persisting over a sufficiently long period of time. Likewise, refrigerant loss lessthan 40% may be attributable to 'irregular', emissive damage which simply did not have sufficient time topermit any higher emergence of refrigerant.

24
In connection with the first of these two results we found that in principle, workshop records - providedthey have been kept continuously for one year - document all instances of repairs to irregular leaks.Accordingly, they cover the sum of 'irregular' emissions produced by all of the air-conditioned vehiclesserviced by the workshop in question. An annual rate of irregular emission can therefore be determinedfrom these records (see Chapter E).
The second result shows us that refrigerant loss of less than 40% is not generally attributable to'irregular' damage, but, in principle, to regular leakage consequent on the design and mode of operationof mobile air-conditioning systems. Since these losses do not interfere with the system's operation, theyare not usually measured directly. Some, however, are measured indirectly in the process of recovery,representing an unintentional but thoroughly usable random sample of 'normal' emission. An annual rateof regular emission can be determined from these measurements (see Chapter D).
Together, the annual rates of 'irregular' and 'regular' emission go to form the total annual rate ofemission.

25
D. The Annual Rate of Normal Emission
I. Regular Loss of Refrigerant from Intact Air-Conditioning Systems
'Regular' refrigerant loss does not mean that emission will take an identical course in every single air-conditioning system. For instance, the period of time for which individual systems remain switched onscatters widely about a mean of 150 hours per annum (Taxis-Reischl 2000). Then the life of a vehicle'sengine (as it undergoes vibration and the development of heat), actually a more important aspect in thecontext of normal leakage, also varies widely about an average of 450 hours (in the same year, 1997) -and this is not allowing for mileage or for traffic conditions. Another factor would be the driver's personalstyle at the wheel, which will have a varyingly stressful effect. Again, the way the air-conditioning systemis handled and used has a part to play17, and the ambient temperature co-determining a system'spressure is not the same for every system (car garaged or parked in the open). Moreover, the quality ofworkmanship in one air-conditioning system is very rarely quite the same as in the next.
As starting point for the statistical analysis provided below, it has been taken that, while 'regularly'emitting car air-conditioning systems - originally charged ex-works with refrigerant R-134a (from 1993on) - may have lost varying quantities of refrigerant up to the measurement period 'mid 1999 to mid2001', as a general rule they still contain enough to permit normal operation - provided they are free ofany 'irregular' defect.
In a first approximation, air-conditioning systems found to have lost less than 40% refrigerant were dulyselected from the study population and deemed to be 'normally' or 'regularly' emitting systems, becauseto go by the experience of interviewed air-conditioning mechanics, 60% of the original refrigerant chargeis the mean limit at which a system is still marginally intact - see Chapter C, Section II.
Bearing in mind its technical imprecision, the '40% Mark' should be applied with a margin of errorextending above and below, as necessary statistical aid for want of more suitable criteria governing thequantity of refrigerant deemed "sufficient" or "no longer sufficient" for a system's continued operation.Another factor to be taken into account is the general imprecision, discussed in Chapter B, in themeasurement of recovery volumes (deviation by up to 50 grams is usual) and therefore inherent in allempirically determined rates of loss. The present study deals only with general orders of magnitude, notwith absolutely exact quantities.
The average refrigerant charge in air-conditioning systems having losses of less than 40% is 825 grams,consequently being somewhat lower than in all 678 fully identified vehicles (where the average is 848grams). See Chapter A. 7. The charge for Brand 1 is 738 grams, for Brand 2 it is 831 grams, and forBrand 3, 898 grams.
II. All 282 Emission Rates of < 40% as a Function of Vehicle Age
Plotting the rate of loss recorded (as difference between recovered quantity and standard ex-workscharge) at the time of opening all air-conditioning systems whose age could be determined and whichhad lost < 40% refrigerant (282 units) against the period elapsing since the vehicle's first registration, thescatter diagram (Diagram 2) shows hardly any relation between the two quantities.
17 Only a minority of drivers occasionally run their air-conditioning system for brief periods during thecold part of the year. This is an important way of caring for hoses and seals, allowing oil and refrigerantto pass through them and protect them from drying out, becoming brittle, and therefore ageing morerapidly.

26
Diagram 2: Emission rates (rates of loss) of all 282 systems losing < 40% refrigerant (uncorrected) inmonths since first registration. The data points of the 282 individual emission rates are broadly scatteredbelow the 40% Line without taking any clear direction. The only significant factor is their anticipatedaccumulation on the left of the x-axis, workshop visits being concentrated on the first 48 months dulycovered by warranty or goodwill provisions. ER = emission rate.
Diagram 2 reveals a diffusely scattered point cloud below the 40% Line. The only significant factor is theexpected accumulation to the left of the x-axis, 82% of workshop visits being concentrated within thefirst 48 months, which are still covered by warranty or goodwill arrangements.
There is still no clear trend to be discerned on calculating the average figure per year (mean value formonths 0 to 12, 13 to 24, etc.) of the widely scattered individual loss rates
The annual averages do generally continue to rise up as far as the seventh year, from 13% to 24%, butthen they fall back again to the initial figure in the following two years - see Diagram 3.
The 'annual averages' curve making its way through the point cloud of 282 "monthly emission rate"combinations fails to reveal any dependence of emission rate on vehicle age.
Emission Rate in Months since First Registration - all 282Systems losing < 40% Refrigerant (uncorrected)
40% Line
0
10
20
30
40
50
0 12 24 36 48 60 72 84 96 108
months since first registration
ER <
40
% ER < 40%

27
Diagram 3: Trend by month of emission rates under 40% (uncorrected). The path of the curve leadingthrough the point cloud of Diagram 2 (q.v.) reveals nothing specific to indicate a dependence ofemission rate on vehicle age. The rise observed up to the seventh year (between months 54 and 66)stops, and then the curve drops back down again.
Diagrams 2 and 3 demonstrate that while concentration on air-conditioning systems losing less than40% refrigerant may be a necessary or unavoidable means of identifying exclusively 'regular' or'normal' emission, it is not in itself sufficient. The sources of emission in our 282 air-conditioningsystems losing less than 40% refrigerant are clearly not all of a 'regular' nature, so the next stage in thestudy was to make a correction, attempting to eliminate systems with 'irregular' refrigerant losses fromthe total figure.
III. Statistical Correction of Normal Emission Rates
Of the 282 air-conditioning systems losing less than 40% refrigerant, 216 (77%) still remained afterstatistical correction aimed at restricting the number of cases to genuinely 'regular' emissions. For me,this selection represents our unintentionally made random sampling of car air-conditioning systems (a)sufficiently charged with refrigerant and (b) solely producing 'normal' emission. Seven of the 66eliminations were based on the explanation given in the Record Sheet, and then there were 59anomalies either above or below the line.
1. Recognisable as 'irregular' from the Record Sheets: seven cases
In three of these cases, the mechanics' notes in the Record Sheets made it possible to categoriserefrigerant loss < 40% as 'irregular'. Twice the notes expressly indicated leaks in the compressor, andonce they recorded an accident as cause of 20% emission (a year and half after first registration). In afurther four cases, the Record Sheets indicate previous losses
Average Loss Figures in individual Years of Life of all282 Air-Conditioning Systems losing < 40% Refrigerant (uncorrected)
0
10
20
30
40
0 12 24 36 48 60 72 84 96
months since vehicle first registered
perc
entil
e lo
ss

28
in preceding years, which, when added to the loss in the current year (2000, 2001), produce more than40% leakage of refrigerant and can therefore be taken out of the equation.
2. Eliminating anomalies above and below the line: 59 cases
Most of the 'irregular' cases of emission were identified as anomalous peaks or troughs when weapplied a plausible criterion.
Diagram 4: Restriction to 216 cases of 'regular' emission < 40%. The diagram shows the same 282cases of emission as in Diagram 2, but, following statistical correction, 66 of them are now outside theboundary (outside left and bottom right) and 216 are left inside. Basically, cases of emission areconditionally eliminated as 'irregular' where they are either four times higher or four times lower(measurements of that order first occurring after 42 months) than the average.Losses amounting to four times the average (before correction) are classified here as abnormal peaks.This factor is not based on any general statistical rule - indeed, in the final analysis, it is somewhatarbitrary. Importantly for me, though, I feel it is high enough to prevent any emissions that might in factbe 'normal' from being ruled out as being 'irregular'. To my mind, emissions of over four times theaverage would seem to be so excessive that they are highly likely to have their source in an 'irregular'defect.18
The average loss per month is 0.55% - which is 5.5% after ten months. Constellations like "10 months /22% loss" can therefore be eliminated (22% being 4 x 5.5%). 38 cases met this criterion for anomalouspeaks. 33 indicated losses of over four times the average in the first year, six more reaching this level
18 Reducing the factor 4 to 3 for anomalies above the line and, correspondingly, from ¼ to 1/3 for thosebelow would only just about exclude no more than six further cases (three up and three down), so I didnot think there was any particular benefit to be gained from this kind of preliminary restriction of therange of emissions.
Restriction to 216 Cases of 'Regular' Emission < 40% (Statistical Correction)
0
10
20
30
40
50
0 12 24 36 48 60 72 84 96 108
months since vehicle first registered
perc
entil
e em
issi
on ra
te
ER < 40%boundary

29
after at most 17 months. By definition, anomalous peaks are to be found only during the first 18 monthsof vehicle age, the 40% emission limit being exceeded after 19 months and air-conditioning systemsabove that limit no longer being taken into consideration.
Emissions amounting to no more than a quarter of the average rate of loss (before correction) weredeemed to be anomalous troughs. Such low emissions as these are regarded as unrealistic, since itwould have to be assumed that air-conditioning systems falling under that heading would have sufferedsome previous loss. However, this criterion only applies to emissions from vehicles older than 3.5 yearsor 42 months. All lower losses up to that time are regarded as 'regular', including the numerous 'zero'emissions.
Diagram 5: Average refrigerant loss in individual years of life of 216 air-conditioning systems losing <40% refrigerant, after correction. The curve now shows a clearly rising trend, passing from about 4%(the mean for the first 12 months) to just under 29% (the mean for months 60 to 72), even if the rise isbriefly interrupted between the 48th and 60th month. Our correction leaves us with no meaningfulaverage for the period after seven years, because there is only one instance of loss left in that period.Compared with Diagram 3 (uncorrected trend), the scattered annual averages for the 'corrected' casesnow follow a distinct principal direction going from bottom left to top right. The curve is neither moved upby overly high emission rates to the left, nor forced down by understated rates to the right.
After 42 months, zero losses are in the first place unlikely, and in the second place, 42 months was themaximum period for which I had an unbroken record of the opening of air-conditioning systems. Theeliminating criterion 'less than a quarter the average loss of 0.55% per month' first began to take effectin the 43rd month, duly identifying 20 anomalous troughs (14 zero losses and 5 losses of less than10%). Only one of these cases exceeded 10% (actually 12%), being found after 106 months. That casewas eliminated like the others because, although nothing can be proven in the absence of relevant data,it is highly likely to be associated with a previous loss.
Average Refrigerant Loss in individual Years of Life of 216 Air-Conditioning Systems losing < 40% Refrigerant - after
Correction
0
10
20
30
40
0 12 24 36 48 60 72 84months since first registration
perc
entil
e lo
ss

30
The corrected cases of emission are to be found inside the boundary in Diagram 4. The location of theanomalies above and below the line is graphically obvious, the excessive emissions of the first year anda half being left outside to the left, and the understated emissions after the first three and a half yearsappearing at bottom right. Diagram 5 shows at first glance that, where combined to produce annualaverages, the emission rates left after eliminating the 59 anomalies (and the other seven 'irregular'cases) follow a definite upward trend in pace with the life of the vehicle - unlike the situation in Diagram3. It is my opinion that the corrected cases furnish suitable foundation material for the attempt made inSection IV to arrive at a quantitative determination of the annual rate of normal emission.
IV. The corrected 6.3% Annual Rate of Normal Emission
The annual rate of normal emission is calculated from the 0.523% monthly average of all 216 correctedemission rates during the period 0 to 85 months, being twelve times the monthly average, viz. 6.3%.Specifically, this rate of emission applies solely to air-conditioning systems in vehicles up to seven yearsold, and is subject to some degree of uncertainty on account of the rather arbitrary choice of correctionfactor. The rate comprises the emission of all three car brands taken together, distinctions betweenthem being examined in Section V below.
Diagram 6: The annual rate of normal emission from all 216 systems losing < 40% refrigerant(corrected). The amount by which these normal emissions increase each year is the 'annual averagerefrigerant loss' from all corrected cases, so it appears as a straight line in the graph. The rate is 6.3%.The straight-line average extends from intersection-point zero to intersect with the 40% Line after 76months. Incidentally, because of this 40% barrier, data points after the 76th month are always below thestraight-line average, never above it, which lowers the average mathematically.
Corrected Annual Rate of Normal Emission for Air-Conditioning Systemsup to Seven Years old (216 Cases losing < 40%
Refrigerant)
40 % Line
0
10
20
30
40
50
0 12 24 36 48 60 72 84 96
months since first registration
perc
entil
e ra
te o
f em
issi
on
ER < 40%average

31
Plotting the monthly 0.52% or annual 6.3% along the x-axis (months since first registration of vehicle), astraight line is produced which intersects the 40% Mark (still just enough refrigerant) after 76 months(76.4), i.e. after six years and five months.
Since the 6.3% figure is an average calculated from widely scattered individual cases, dulycompensating for major variations upwards and downwards, it would not of course be true to say that inpractice, all car air-conditioning systems will come to a standstill after 76 months. Drivers' experiencewould indicate to the contrary, one having visited the workshop as often as two times in seven years onaccount of his air-conditioning system, another never having been there at all. (A third driver had his air-conditioning system charged elsewhere, this case not being examined any further in our study).However, the figure does mean that - leaving aside any of the other empirical inaccuracies of thepresent study - on average 6.3% of the original refrigerant charge is lost by other than 'irregular' meanswhen we take the first seven years as our base line.
V. Differences in Normal Emission between the Three Car Brands
The following three diagrams (7 to 9) show the normal annual emission rates for each of the study'sthree brands of car. It should be emphasised that the cases are not sufficient in number to let us drawany direct conclusions from them (or from their average) with regard to the situation in reality. However,the indicated differences are none the less important for all that, allowing us as they do to see how theannual rates of normal emission range upwards and downwards.
Diagram 7: Annual rate of normal emission and corrected cases of emission among the 77 vehicles ofBrand 1. Conditions for Brand 1 are almost the same as in the overall selection - monthly rate: 0.52%;annual rate: 6.2%; 40% Line intersected after 77.3 months.
Annual Rate of Normal Emission and Corrected Cases of Emissionamong the 77 Vehicles of Brand 1
0
10
20
30
40
50
0 12 24 36 48 60 72 84 96months since first registration
perc
entil
e ra
te o
f em
issi
on
ER < 40%average

32
Diagram 8: Annual rate of normal emission and corrected cases of emission among the 60 vehicles ofBrand 2. Brand 2 indicates the highest emission rates - 0.59% per month and 7.0% per year. The 40%Line is intersected by as early as 68.2 months.
Diagram 9: Annual rate of normal emission and corrected cases of emission among the 79 vehicles ofBrand 3. Brand 3 has the lowest emission rates of the whole population, being just 0.49% per monthand 5.8% per year. The 40% Line is intersected by as late as 82.1 months.
The annual normal rates of emission differ by more than 1% (ranging from 5.8 to 7.0) between the threebrands of car. The 40% Line is intersected after 68 months by Brand 2, but not until after 82 by Brand 3.
Annual Rate of Normal Emission and Corrected Cases of Emission among the 79 Vehicles of Brand 3
0
10
20
30
40
50
0 12 24 36 48 60 72 84 96months since first registration
perc
entil
e ra
te o
f em
issi
on
ER < 40average
Annual Rate of Normal Emission and Corrected Cases of Emissionamong the 60 Vehicles of Brand 2
0
10
20
30
40
50
0 12 24 36 48 60 72 84 96
months since first registration
perc
entil
e ra
te o
f em
issi
on
ER < 40average

33
VI. Car Manufacturer Specifications concerning Normal Leakage
Placed in relation to the average 825 gram charge of air-conditioning systems losing less than 40%refrigerant (see introduction to the present Chapter D), the annual average of 6.3% represents a normal(not total) refrigerant leakage level of 52 grams per year.
Fig. 3: Car air-conditioning system showing the principal points of R-134a emergence under theconditions of normal refrigerant leakage stipulated by the car manufacturers. An annual leakage of atmost 10 to 30 grams is admissible from the shaft seal of the compressor (4 exclamation marks),altogether 10 to 20 grams (two exclamation marks each) from the hose system (the illustration showsfour hoses), and 2 to 3 grams from each O ring (there are eleven such sealing rings in the illustration).Adding up the figures, annual losses of from 42 to 83 grams are considered "normal" in the systemillustrated. The number of exclamation marks (!) stand for the relative importance of the particularsource of leakage. Refrigerant circuit: 1 = evaporator; 2 = compressor; 3 = condenser; 4 =collector/dryer; 5 = expansion valve.
Source: WAECO (modified).
According to the suppliers of complete car air-conditioning systems (Air-Conditioning Conference -2001), car manufacturers specify margins - for the leakage of refrigerant through seals and hoses -within which a car air-conditioning system will be accepted as "refrigerant-tight". Under thesespecifications, the annual loss of refrigerant must be kept within the following bounds:

34
• compressor shaft-seal: 10 to 30 grams,• flexible hose lines: 10 to 20 grams, and• each O ring at connections to components: 2 to 3 grams.
The number of connections to the components 'compressor', 'evaporator', 'condenser', 'dryer' and'expansion' valve' (all of which can be dismantled), and therefore the number of O-ring seals, varies fromseven to eleven according to system design. Accordingly, normal leakage through the O rings is allowedto vary between 14 and 33 grams.19
The annual loss of refrigerant accepted by the car manufacturers amounts to between 34 and 83 gramswhen all three sources are added together.
The average 52 grams the present study has defined as normal emission per year per air-conditioningsystem over a period of seven years in use comes about midway in relation to the manufacturers' overallallowance. Far from contradicting the car makers' stipulations, the study figure confirms how closely theyapproach reality.
Looking at matters in reverse, the allowances confirm how close to reality is the result arrived at fromthe selected workshops' Record Sheets, ranging as it does from 46 grams (Brand 1) to 58 grams (Brand2) among the three car brands. The normal annual loss recorded for Brand 3 coincides with the averageloss figure of 52 grams.
19 Integration of the dryer with the condenser, an approach already to be found at the present time,saves on two connections and therefore on sources of loss amounting to about 5 grams. The same canbe said of integrating the expansion valve with the evaporator. Then the widely introduced reduction inthe proportion of elastomer connection lines between components in favour of aluminium piping hasalso reduced normal leakage. However, there are limits to the replacement of hoses with pipes, in partbecause of the better heat and sound insulation provided by flexible elastomer lines. In fact, the singleline most severely exposed to high pressure (up to 20 bar) and high temperature (the gas being"superheated" to above 100 °C), the pressure line from compressor to condenser, lends itself least tobeing replaced with a metal tube, because not only does it need to be very large in diameter and highlyflexible, it must also be capable of compensating for the vibrations of the engine to which it is connected.
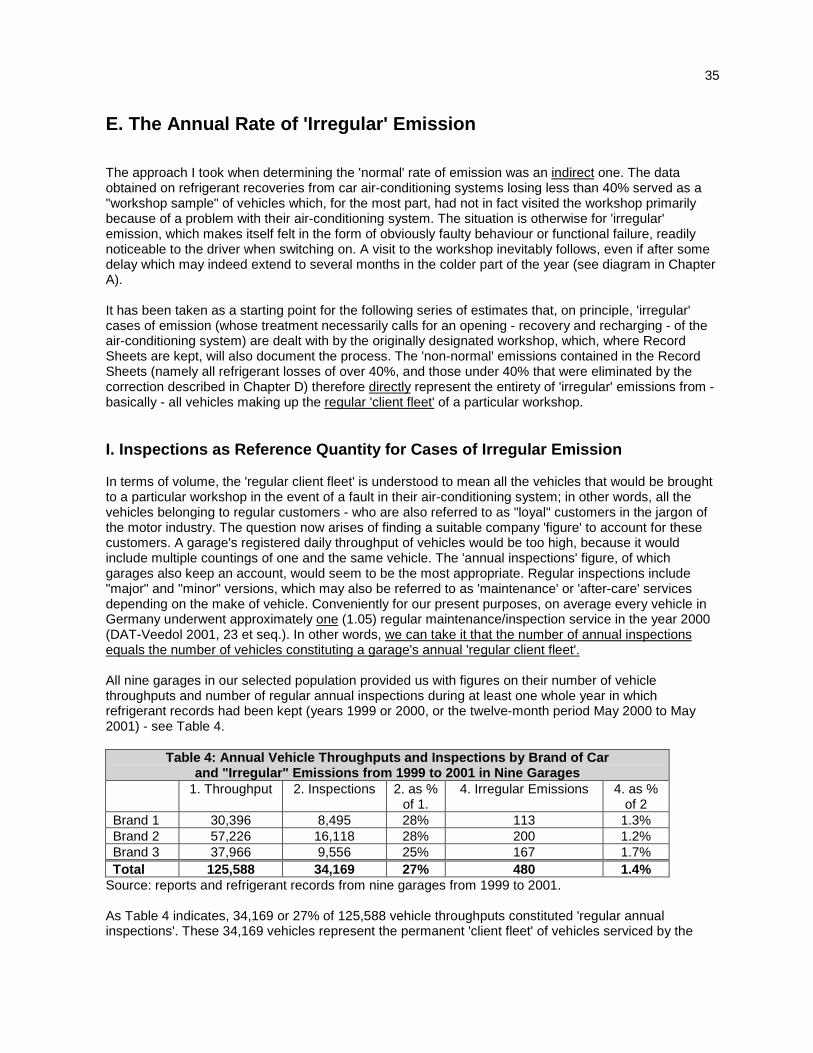
35
E. The Annual Rate of 'Irregular' Emission
The approach I took when determining the 'normal' rate of emission was an indirect one. The dataobtained on refrigerant recoveries from car air-conditioning systems losing less than 40% served as a"workshop sample" of vehicles which, for the most part, had not in fact visited the workshop primarilybecause of a problem with their air-conditioning system. The situation is otherwise for 'irregular'emission, which makes itself felt in the form of obviously faulty behaviour or functional failure, readilynoticeable to the driver when switching on. A visit to the workshop inevitably follows, even if after somedelay which may indeed extend to several months in the colder part of the year (see diagram in ChapterA).
It has been taken as a starting point for the following series of estimates that, on principle, 'irregular'cases of emission (whose treatment necessarily calls for an opening - recovery and recharging - of theair-conditioning system) are dealt with by the originally designated workshop, which, where RecordSheets are kept, will also document the process. The 'non-normal' emissions contained in the RecordSheets (namely all refrigerant losses of over 40%, and those under 40% that were eliminated by thecorrection described in Chapter D) therefore directly represent the entirety of 'irregular' emissions from -basically - all vehicles making up the regular 'client fleet' of a particular workshop.
I. Inspections as Reference Quantity for Cases of Irregular Emission
In terms of volume, the 'regular client fleet' is understood to mean all the vehicles that would be broughtto a particular workshop in the event of a fault in their air-conditioning system; in other words, all thevehicles belonging to regular customers - who are also referred to as "loyal" customers in the jargon ofthe motor industry. The question now arises of finding a suitable company 'figure' to account for thesecustomers. A garage's registered daily throughput of vehicles would be too high, because it wouldinclude multiple countings of one and the same vehicle. The 'annual inspections' figure, of whichgarages also keep an account, would seem to be the most appropriate. Regular inspections include"major" and "minor" versions, which may also be referred to as 'maintenance' or 'after-care' servicesdepending on the make of vehicle. Conveniently for our present purposes, on average every vehicle inGermany underwent approximately one (1.05) regular maintenance/inspection service in the year 2000(DAT-Veedol 2001, 23 et seq.). In other words, we can take it that the number of annual inspectionsequals the number of vehicles constituting a garage's annual 'regular client fleet'.
All nine garages in our selected population provided us with figures on their number of vehiclethroughputs and number of regular annual inspections during at least one whole year in whichrefrigerant records had been kept (years 1999 or 2000, or the twelve-month period May 2000 to May2001) - see Table 4.
Table 4: Annual Vehicle Throughputs and Inspections by Brand of Carand "Irregular" Emissions from 1999 to 2001 in Nine Garages
1. Throughput 2. Inspections 2. as %of 1.
4. Irregular Emissions 4. as %of 2
Brand 1 30,396 8,495 28% 113 1.3%Brand 2 57,226 16,118 28% 200 1.2%Brand 3 37,966 9,556 25% 167 1.7%Total 125,588 34,169 27% 480 1.4%
Source: reports and refrigerant records from nine garages from 1999 to 2001.
As Table 4 indicates, 34,169 or 27% of 125,588 vehicle throughputs constituted 'regular annualinspections'. These 34,169 vehicles represent the permanent 'client fleet' of vehicles serviced by the

36
study's nine 'authorised dealers'. Out of this 'client fleet', 480 air-conditioning systems producing'irregular' emissions were opened during the period of one year, representing an average 1.4% of allthree brands of car, all of whose individual percentages are in any case very alike. (Adding the 175systems opened in connection with 'normal' emission, 655 systems were duly emptied and recharged,representing 1.9% of "regular customer cars".)
The cases of emission used in this chapter (480 in number) have been chosen as a function of whetheror not the date of their detection (and entry in the records) falls within an 'inspection year' (referenceperiod) at my disposal. For instance, where the 'inspection year' is the year 2000, I have eliminatedemissions subsequent to January 2001 that I did in fact use in another connection - in the previouschapter for example. This confinement is in fact matched by a corresponding broadening of our scope:since our sole interest at this point is in the level of an emission and in the brand of vehicle producingsame, we can also take account of cases in which the age of the vehicle or even its type provedimpossible to determine.
The garages did often raise an obvious objection to the idea of using 'inspections' as a basis for ourstudy of air-conditioning systems, claiming that the air-conditioning system does not belong to thenormal work of routine maintenance and that most faults are actually reported by the customer himself,outside the ambit of an 'inspection'. This objection is not really relevant to our present purposes, sincethe 'inspections' serve solely as quantitative reference point for recorded emissions of refrigerant,concentrating in fact on their upper limit.
II. Confinement of Inspections to Vehicles with Air-Conditioning System
It should go without saying that refrigerant emission would not be examined in relation to all inspectedvehicles, but just to those of them duly equipped with an air-conditioning system.
Several intermediate steps were required in the process of confining the registered 'inspections' to thoseconducted on air-conditioned vehicles (and specifically those with an original R-134a system), none ofthe garages having classified their inspections under the headings of vehicles with and without air-conditioning system.
Every year since 1993, the percentage of new cars equipped with air-conditioning system has beengrowing at a very substantial rate, and the point of saturation is not yet in sight. Consequently, thepercentage of vehicles equipped with air-conditioning is different not only for each brand of car, but alsofor each 'year of registration' of each car, quite apart from further differences existing between thenumerous types of a particular brand.
The two main steps to be taken in determining a brand-tied garage's quota of air-conditioning systems ina given 'inspection year' (the year 2000, for instance) are
• firstly, arrangement of the garage's total number of vehicle inspections into their individual 'years ofregistration' (obtaining the 'age pattern'), and
• secondly, determination of the specific quota of air-conditioning systems (MAC Quota) in each of aparticular car brand's 'years of registration'.
The MAC quota for an 'inspection year' is first arrived at by relating the MAC Quotas of specific years tothe proportion (in terms of quantity) of cars from those years that call to agarage in the current 'inspection year'. In making this calculation, we do have to take on board ameasurement error attributable to the fact that MAC Quotas for specific years are only obtainable for

37
Germany as a whole, so they may differ to a greater or lesser degree from the 'quotas' of the vehiclesserviced by a particular garage.
1. Model of Age Patterns in Annual Inspections
What interests a garage most in respect of a 'year of registration' is the percentage of vehicles from thatyear that actually come into the garage for inspection (thereby demonstrating loyalty to the company).Apart from garage records, there is also a more general body of data available on these visits, as wellas on the declining tendency to avail of an 'authorised dealer' workshop as a vehicle becomes older - forinstance, the DAT-Veedol 2001 survey. The number of annual inspections categorised by age of vehicleis another question, one not normally investigated by the garages even though associated with their firstinterest.
Working together with a number of service managers and the regional sales department of one Germanmanufacturer, we developed a model of the age pattern emerging in annual inspections, which, at leastfor the year 2000, probably comes very close to the reality of the situation in authorised-dealerworkshops. This is because expert estimations for the year 2000 were supported, in three of thegarages (covering two car brands), by the company computer which ran a program selecting inspectedvehicles by the year of their first registration. Our model is reproduced in Diagram 10.
Diagram 10: Annual inspections compiled by age of vehicle. Model for 2000, authorised dealerworkshops/outlets. More than two thirds of all inspections are concentrated within the first few years of avehicle's age, older vehicles accounting for less than a third of the total.
Annual Inspections compiled by Age of VehicleModel for 2000 - German Authorised Dealer Workshops / Outlets
20%18%
16%14%
8%7%
5%4%
10%
0%
5%
10%
15%
20%
25%
1 2 3 4 5 6 7 8 8 to 15et seq.
years since first registration
Perc
entil
e sh
are
of a
ll in
spec
tions
in y
ear
all inspections = 100 %

38
The diagram clearly shows the preponderance of inspections in the earliest years (68% in total), whichis hardly surprising given the four-year loyalty-maintaining attraction of warranty and goodwillarrangements. Vehicles more than four years old (the time when changes of ownership begin to occur)together make up only one third of the inspections total. The two bars on the far right of the diagramdeserve particular attention - in the year 2000, 14% of inspected vehicles were eight and more yearsold, meaning that this 14% of vehicles are very likely not to have been fitted ex-works with an R-134aair-conditioning system, which first really came into general use in 1993 or 1994.
The 'age pattern model' is based on the inspections carried out in all three of the reference periods inquestion, namely years 1999 and 2000, and the twelve months from May 2000 to May 2001.
2. Air-conditioning quotas in inspection periods 1999, 2000 and 2001
All six German mass-producers of passenger cars reported the number of each of their passenger-cartypes (ranging from five by BMW and Audi, to fifteen by Ford) equipped ex-works with an air-conditioning system and sold in Germany in 1999 and 2000. They also provided specific information ontypes during the complex changeover phase from R-12 to R-134a, that lasted from mid 1991 to the endof 1993. Drawing as well on the data held in ÖKO-Recherche archives for the years 1994 to 1998, wethen duly worked out the brand-specific quota of air-conditioning systems (the MAC Quota), in eachcalendar year, from the type-specific data in our possession.
Table 5: Percentage Air-Conditioned of New Cars sold in Germany(German brands only, from 1995 to 2000)
Brand 2000 1999 1998 1997 1996 1995A 97% 93% 84% 84% 75% 71%B 97% 93% 91% 81% 75% 57%C 94% 90% 87% 75% 67% 58%D 80% 74% 63% 46% 24% 20%E 82% 78% 64% 55% 40% 19%F 82% 75% 66% 55% 17% 11%
Table 5 reproduces these quotas without giving the names of the car brands, so that the identify of thethree brands of car actually chosen for our study cannot be inferred from the brand-specific air-conditioning quota for the inspection periods - which itself is based on the quotas of 1992 to 2000 etseq. (see below).
The final step was to weight the MAC Quota for each year with the percentile share each 'year ofregistration' enjoyed in the annual inspection total, as illustrated in Diagram 10.
A total of nine MAC Quotas were arrived at in this way, three for each of the three chosen car brands:one for Inspection Year 1999, one for 2000 and one for May 2000 to May 2001.
Table 6: Air-Conditioning Quotas (MAC Quotas) in the three Inspection Periods1999 to 2001 by Brand of Car
Period Brand 1 Brand 2 Brand 3Inspections in 1999 64% 37% 68%Inspections in 2000 73% 47% 75%Inspections from 5/2000 to 5/2001 78% 53% 80%
As a result of the general increase in MAC Quotas over time, the MAC Quota for inspections in theperiod May 2000 to May 2001 is distinctly higher than that in the year 1999. These quotas are likely tocontinue growing for the foreseeable future.

39
Brand 3's MAC Quota of 75% for "Inspections in 2000" (Table 6, last column, second last line) indicatesthat of the vehicles undergoing annual inspection in the year 2000, 75% were equipped ex-works withan R-134a air-conditioning system.
3. 'Workshop Rate' of air-conditioned vehicles
Eighteen times in total we were able to relate whole-year 'irregular' emissions from the three car brandsto the respective 'inspection periods' in which they had been detected - four times for the full calendaryear 1999, ten times for full calendar year 2000, and four times for the period May 2000 to May 2001.On summing up our individual calculations and arranging our figures by brand of car, we obtain thepercentage of 'irregular' emissions encountered in workshop inspections of vehicles having an air-conditioning system. I have called this percentage the 'Workshop Rate' (Table 7).
Table 7: The 'Workshop Rate' ('Irregular' Emissions) of Air-Conditioned Vehiclesof the Three Brands in 1999 to 2001 (Nine Garages)
Allinspections
AverageMAC Quota
Inspections ofMAC cars
Irregularemissions
WorkshopRate
Brand 1 8,495 73% 6,202 113 1.8%Brand 2 16,118 48% 7,772 200 2.6%Brand 3 9,556 77% 7,370 167 2.3%Total 34,169 62% 21,344 480 2.2%
During the same period in which the nine garages detected and recorded 480 'irregular' cases ofemission, they inspected a total of 21,344 air-conditioned vehicles (not their air-conditioning systems!).The number of inspections of vehicles having an air-conditioning system ('MAC cars') has beencalculated here through multiplying the total number of inspections by the MAC Quota for the specificbrand. This MAC Quota adds up to an average of 62% for the three brands of car, being at its lowest forBrand 2 (48%) and its highest for Brand 3 (77%). The (mathematical) percentage of 'irregular' emissionsfound when inspecting 'MAC cars' - or the 'Workshop Rate of MAC Cars' - averages out at 2.2% for allthree brands.
III. The Annual Rate of 'Irregular' Emission
The rate of 'irregular' emission is arrived at by weighting the 'workshop rate of MAC cars' with the rate ofrefrigerant loss discovered on opening air-conditioning systems. These loss rates, obtained from theRecord Sheets, were available as percentages and as absolute figures for all 480 vehicles in question,and are entered in Table 8 along with the resultant brand-specific annual rates of irregular emission.
Table 8: The Annual Rate of Irregular Emission from Air-Conditioning Systemsof the three Brands of Car in 1999 to 2001 (Nine Garages)
Irregularemissions
WorkshopRate
Refrigerantloss in kg
Rate ofloss*
Annual rateof irregularemission
Brand 1 113 1.8% 67.0 82% 1.5%Brand 2 200 2.6% 147.3 85% 2.2%Brand 3 167 2.3% 133.1 84% 1.9%Total 480 2.2% 347.4 84% 1.9%
* percentile relationship of "refrigerant loss in kg" to the sum of standard charge quantities of 81.4 kg(Brand 1), 173 kg (Brand 2) and 158.5 kg (Brand 3), adding up to 412.9 kg.

40
The annual rate of irregular emission is lower than the 'workshop rate' (averaging 2.2%), being only1.9% because of the loss-rate of less than 100%, namely 84%.
Among the three car brands, this annual rate varies from 1.5% (Brand 1) to 2.2% (Brand 3)., beingabout one third as high as the rate of 'normal' emission (6.3% according to our study).
The measurement error referred to in Chapter B - "omitted entry" of the recovery operation - is seen toproduce only a very slight 'absolute' increase in the emission rate. Assuming 5% forgotten entries and acorrespondingly 5% higher irregular loss of refrigerant, the annual rate of irregular emission would risefrom 1.9 to barely 2.0 %, in other words, by just 0.1% in absolute terms.

41
F. The Annual Total Rate of Emission for Air-Conditioning Systemsat most Seven Years old
I. The Calculated 8.2% Rate of Emission
The average annual rate of emission is arrived at by adding the rate of 'normal' emission to the rate of'irregular' emission.
The annual rate of normal emission is 6.3% on average, while the annual rate of irregular emission is1.9% on average, so the annual total rate of emission runs out at 8.2%.
This means that passenger cars having an ex-works R-134a air-conditioning system lose over eightpercent of their refrigerant charge every year. Placed in relationship with the average charge quantity of856 g, that percentage represents 70 grams per annum. Which is not to say that all of thecorresponding refrigerant is topped up again, this hitherto only being done for a portion of the air-conditioning systems found to have irregular losses and defects. Most air-conditioned vehicles simplyproduce 'normal' emission and have not yet reached the critical charge-limit (around 60%) because theyare still too young to have done so.
An important reservation should be mentioned at this point, to the effect that our emission rates applyonly to vehicles in operation for at most seven years from the date of their first registration. Oldervehicles (more than 84 months) are not included in our determination of the rate of normal emission. R-134a air-conditioning systems have only been on the market to any large extent since 1993. It isimpossible to predict at this stage whether the rate of loss will continue to rise linearly as the ageingprocess proceeds, or if - as some experts fear (Holdack-Janssen, 2000) - the rate of normal emissionmight in fact accelerate.
Finally, with regard to our total rate of emission, it should also be borne in mind that (for the very reasonthat the study vehicles are not yet sufficiently old) neither the 6.3% figure (normal rate) nor the 8.2%figure (total rate) as yet makes any allowance for possible emission on the occasion of disposing of anold car.
Despite the limited amount of information obtainable due to the small number of cases involved, ourstudy still provides us with a picture of the way in which emission rates vary from one to the other of thethree different brands of vehicle. What for me is the most important finding out of Table 9 is not so muchthe fact that Brand 2 has the highest figures for both the 'normal' and the 'irregular' rate of emission(indeed it also comes highest under the heading of loss in grams per vehicle), as the actual existence ofa difference of any kind between the brands that is not to be seen when they are viewed as a whole -because this difference suggests the need to leave a little latitude above and below our duly determinedaverage annual rate of emission of 8.2%.
Table 9: Annual Rates of Emission and Loss in Grams per Vehiclefor the Three Brands of Car
Vehicle NormalEmission
IrregularEmission
TotalEmission
Grams perYear*
Brand 1 6.2 1.5 7.7 57Brand 2 7.0 2.2 9.2 79Brand 3 5.8 1.9 7.7 72All brands 6.3 1.9 8.2 70
* The respective refrigerant charges are 734 g (Brand 1), 857 g (Brand 2) and 932 g (Brand 3).

42
II. Margins of Error in determined Quantities
Our study could be criticised on fundamental statistical grounds for not being sufficiently representativeand its limited informative value. It is fair to say that our selection of examined air-conditioning systemsis too small, and that it does not represent a systematically collected random sample - a fact which isobvious from the outset given our concentration on 'authorised dealer' workshops, which only servicesome out of the total stock of air-conditioned vehicles, and furthermore only the 'younger' of them (notethe preponderance of vehicles less than four years old).
Acknowledging these shortcomings, in my defence I would say that any more representative a surveycould not have been completed within the terms of reference provided.
That having been said, however, the study does contain some inherent sources of error, to allow forwhich certain correcting factors and margins of error did need to be introduced.
While completing the study, one important source of error emerged in Chapter D in connection withdetermining the 'normal' rate of emission. Right from the first diagram (Diagram 2), putting "regular"refrigerant loss on a par with "less than 40% refrigerant loss" proved to give an unduly 'black-and-white'picture of the situation, given that a substantial portion of refrigerant losses under 40% are not actuallyattributable - as initially thought - to 'regular' , but to 'irregular' events. The 'irregular' events wereeliminated by a criterion ('more than four times the average') the author felt to be plausible at the time,but which proved in the end to be rather arbitrary and could not guarantee that the selection 'corrected'in this manner would then really only include systems experiencing 'normal' leakage of refrigerant. Thissource of error is necessarily associated with the adopted procedure of evaluating Refrigerant RecordSheets 'after the event', and in the author's opinion, its influence on the result of the study is impossibleto quantify. The error would be avoidable by employing another, in fact far more complex and moretime-consuming, empirical approach involving the surveyor's own controlled measurement and analysisof the refrigerant charges in intact vehicle air-conditioning systems.
1. Errors in recording recovery and recharging operations
The general readout-error probability of plus or minus 25 grams works in both directions - upward anddownward - by up to 15%.
As discussed in Chapter B, the 50-gram rounding practised when writing Record Sheets can give a falseimpression of emission by an amount of 25 grams above or below reality. Without exception, refrigerantloss of less than 40% is deemed to be 'normal' emission. That 40% is at most 340 grams of the average850 gram charge quantity. Then, when it is put in relationship with the mid-point between 0 and 40%(therefore with 170 grams), the '25 gram allowance' is in fact 15%.
Rounding errors have some part to play in the rate of 'irregular' emission too, even if to a very muchlesser degree because we are dealing here with 'total' loss. On top of this come the omitted entries ofrefrigerant loss, which I estimated to account for at least 5% (Chapter B, Section II, Paragraph 5).
2. Differences between the three brands of car
Comparing the three brands of car, both the 'normal' and the 'irregular' rates of emission vary eitherupward or downward by more than 15% from the average.

43
III. The Annual Rates of Emission with Margins of Error
The emission rates duly determined include 'fault tolerances' of at least 25% above and below to allowfor inaccuracies of measurement and to account for the different figures from the three different carbrands in our study. These margins are illustrated graphically in Diagram 11.
Diagram 11: Annual rates of 'normal', 'irregular' and 'total' emission from car air-conditioning systems atmost seven years old - with 25% margin of error and excluding an approximately 2% annual rate ofemission on disposal. The total rate of 8.2% is made up of the 'normal' rate (6.3%) and the 'irregular'rate of emission (1.9%) added together. Our examination proved the need to allow a 25% margin oferror above and below, so the 'total' rate fluctuates within the region of 6.2 to 10.3%.
Allowing for the necessary 25% margin of error above and below the line, the 'total' rate for air-conditioning systems up to seven years old varies (without including loss on disposal) between 6.2%and 10.3%. Current total emission of R-134a from car air-conditioning systems in the year 2000 can beconfined within the limits of 685 and 1,140 tonnes, these different figures depending on whether anemission rate of 6.2% (the minimum) or 10.3% (the maximum) is assumed for the 11,500 tonnes ofrefrigerant in circulation in passenger cars in Germany. These 11,500 tonnes are based, in turn, on theassumption of 13 million air-conditioned passenger cars (30% of the total population being thusequipped) having an average R-134a charge of 850 g.
IV. Emission on Disposal raises the Annual Rate by 10%
It is worth remembering at this point that an annual rate of emission extending over the first seven yearsof a system's use will be quite different (lower, in fact) from an annual emission rate calculated over thewhole life of a system. Factors to be mentioned in this connection would first of all include the age-related acceleration of normal system leakage feared by some experts (Holdack-Janssen - 2000, and
Annual Normal, Irregular and Total Rates of Emission of R-134a from Car Air-Conditioning Systems up to Seven Years old (25%
margin of error - not including 2% emission on disposal)
6,3
1,9
8,2
0
2
4
6
8
10
12
Normal-ER Irregul. ER Overall-ER
per
cent

44
others), an aspect neither examined nor quantified within the confines of the present study in which therate of normal emission remains at 6.3%.
A more important aspect is the loss associated with the scrapping of old cars. Weaknesses in thisrespect do not lie with German recyclers of old cars, who by this stage are very largely equipped withproper refrigerant recovery stations. Indeed, the situation is likely to improve even further over thecoming years, thanks to national and EU regulation. The weak point is the fact that the approximately1,400 recyclers in Germany receive not even the half of the 1.3 to 1.5 million old cars taken out ofcirculation (Arge Altauto 2000, 34). About half of the cars from any original German 'year of registration'are first exported as used cars to countries outside of the EU (Arge Altauto 2000, 48). I know nothingabout refrigerant recovery in the importing countries, but it probably does not carry any great weight inpractice, an assertion which would admittedly need to be examined. An investigation of this kind iscalled for, in that evidently "all western European states" (ibid.) are faced with this export problem.
If we were to say that an air-conditioned old car still contains 50% of its standard charge of refrigerant,and if we were then to assume, crudely speaking, a figure of 100% recovery of refrigerant underGerman recycling conditions and none at all for exported vehicles, then 25% of the refrigerantassociated with a whole 'year of registration' would remain un-recovered.
Interestingly, Pettersen/Hafner published 75% as a maximum level of recovery from R-134a air-conditioning systems as early as 1996, a figure that has not been refuted to date. Tujibayashi arrived atsomething in the same order of magnitude (70%) for the island state of Japan in 1999, as a goal to beaspired to by the year 2010.
Distributed over a car air-conditioning system life of twelve to thirteen years, loss at disposal producesan increase of 2% in the annual total rate of emission. That rate therefore fluctuates within the region of10% unless the situation should change substantially within the medium term.
The risk of an incorrect estimate increases very considerably once the 'first seven years' period haselapsed.
In any case, precise figures are not the goal of the present study, and never were, the prime purposehaving been to arrive at the order of magnitude of emission from ex-works R-134a air-conditioningsystems which are seven years old at the most.
I feel the study has duly achieved its aim by localising this order of magnitude within the region of 6 to11%, or, including emission on disposal, 8 to 13%.

45
G. The Question of Reducing Emission by Regular SystemInspection
All manufacturers of air-conditioning systems recommend regular maintenance (Air-ConditioningConference - 2001). However, these systems are not included in the scope of the vehicle inspectionsspecified by the car manufacturers. Preventive maintenance is carried out on a voluntary basis andtherefore rarely, although many garages do offer the service of checking an intact air-conditioningsystem along the lines of the description in the box below.
Air-Conditioning System Check (as recommended by WAECO)
Every twelve months
Function check: high and low pressure readings, condenser fan, temperature of airblown into passenger compartment.Visual inspections: soiling of or damage to the condenser, fault location on air-conditioning system using leak indicator unit.
Every twenty-four months
Replace dryerRecover and clean refrigerant, dehumidify system at same time.Recharge up to standard level.
I. Maintaining an Air-Conditioning System increases Operational Reliability
Checks in which the refrigerant circuit is not opened can provide clues to faults and may improve theefficiency of a system where a contaminated condenser is cleaned in the process, for example.Attention of this kind to the condenser may reduce fuel consumption, thus contributing to climateprotection. Severe loss of refrigerant may well be suspected if pressure levels are too low or if thetemperature of the air leaving the evaporator is too high, but the problem cannot be rectified for as longas the system remains unopened. There is little sense in looking for leaks in a closed, intact system,because normal emergence of refrigerant through hoses and seals will neither be detected noreliminated in the process. In turn, a check of this kind is unnecessary in respect of irregular leaks,because lack of refrigerant will already have brought the system to a standstill.
Checks in which the refrigerant circuit is opened in an intact system make more sense from thetechnical point of view. The refrigerant is duly cleaned (dehumidified, that is) in the recovery/rechargingstation, and the emptied system is dehumidified by vacuum at the same time. The dryer may bechanged to ensure continued absorption of diffusing humidity once the system is closed up again.Finally, recharging prevents operational faults attributable to loss of refrigerant. Provided no irregulardamage occurs, the cleaning and recharging of refrigerant does help to improve functional reliability.
However, the possibility that measures of this kind might prevent effective emission of refrigerant is quiteanother question.
II. Regular Maintenance generally does not reduce Emission
This question needs to be examined individually with regard to the different forms of emission.

46
Emission on disposal can only be avoided where the refrigerant is properly removed when a car isscrapped - the question of reduction by means of regular maintenance with a top-up of refrigerant doesnot apply to this class of emission (rather more the reverse, in fact, since an air-conditioning systemwhich is not properly pumped dry during the scrapping process will emit more if it had been topped upand remains full, than it would if it were half empty).
The same applies to irregular emission caused by an accident or by stone impact, since regularmaintenance will not prevent external damage to the air-conditioning system accompanied by abruptemergence of refrigerant.
Normal emission consists mainly in leakage of refrigerant through seals, a factor inextricably linkedwith the present-day design of air-conditioning systems whose compressor is driven by the vehicle'sengine (see Chapter D, Section 6). Regular refrigerant top-ups (calling for the system to be opened)may recurringly put off the day on which refrigerant shortage begins to cause operational problems, butthey do not help to reduce emission.
III. Partial Prevention of Irregular Emission - Minimal
Nonetheless, suppliers of recovery/recharging stations have put forward two examples demonstratinghow they think that emission could be reduced by maintaining a system regularly and checking it forleaks (Recovery/Recharging Station Conference - 2001). Both of these examples relate to 'irregular'emission.
1. Two examples showing how emission may be reduced by maintenance
Example 1: where the refrigerant is not regularly cleaned, penetrating moisture may overcome theabsorbent capacity of the dryer and mix with fluorinated refrigerant to produce corrosive acids (HF)which cause internal corrosion and leaks in metal components.
Example 2: a leak, whether attributable to internal or external causes, may initially be so small that theamount of refrigerant escaping is still too slight to be noticeable as a fault. Over time, however, the leakgrows and grows in size and may eventually become sufficiently large to let through the whole charge ofrefrigerant. This emergence of refrigerant would be confined by checking for leaks in good time.
2. Internal corrosion by acid refrigerant is unlikely
The experts have dismissed the first example (Air-Conditioning Systems Conference - 2001), statingfirstly that the capacity of the dryer is designed so that, for the whole life of the system, it will absorb themoisture that penetrates under normal operation, and secondly, that any irregular admission of moistureto the refrigerant circuit to produce a non-evaporating liquid
would so severely damage the compressor by 'liquid shock' that this component would fail well beforeacid could form. Rather than a release of refrigerant, the outcome would be a visit to the workshop tohave the refrigerant circuit opened with a view to replacing the compressor.
So with regard to Example 1, while regular dehumidification (and recharging) of the refrigerant isundoubtedly a good way of enhancing a system's reliability, regular inspection does not prevent'irregular' penetration of moisture. Where moisture does penetrate 'irregularly', the occurrence makesitself felt not through loss of refrigerant, but as (non-emissive) component defect, interfering with the air-conditioning system's operation and therefore causing it to be opened in the workshop in any case.

47
3. Detection of slowly growing small leaks
The second example gives rise to the fundamental question of how large a leak has to be before it canbe found in the course of a regular examination.
The principal form of emission - normal emergence of refrigerant through intact seals - is too slight to befound by manually operated leak detector on an unopened system. The detector will only respond tolarger-scale leaks, by which stage the operation is generally too late. The only reliable way of looking forleaks is to open the system first. There are two methods of location when this is done.
The first method is to charge the emptied system with liquid nitrogen, metered by pressure reducer froma gas cylinder (kept under 200 bar pressure) into the system, where it develops pressure of up to 20 barand higher in order to simulate extreme conditions. The leak detector then has a chance of locatingleaks which otherwise, under normal workshop conditions, would let out too little refrigerant to beperceptible.
The second method - more frequently used because less complex - is to add a contrast medium or'tracer' when recharging the system with refrigerant (see Chapter B, Section III, Paragraph 2). Thepressure in the system does not rise as high as when adding nitrogen, so if the leak is not immediatelyrevealed by a coloured stain (visible under ultraviolet illumination), the driver is asked to call again at anappointed date, when his air-conditioning system is run under practical conditions and the source ofemission becomes clear to see.
To return to Example 2, neither the nitrogen method nor the tracer method20 are suitable means offinding 'normal' leakage through intact seals. There would also be little sense in replacing intact seals,new ones would not necessarily reduce the pace of refrigerant emergence. However, both methods lendthemselves to the detection of "irregular" sources of emission.
Irregular leaks, responsible for just under 2% of annual emission from air-conditioning systems (at mostseven years old), are generally associated with abrupt rather than 'creeping' emergence of refrigerant.Within less than a month of being damaged on the outside by a thrown stone, a condenser will havebegun to leak so badly because of pitting that hardly anyrefrigerant will be left in the system (Haussmann, 2001). Refrigerant emerges abruptly in any case aftera frontal collision involving body damage. Accidents and stone impact are by far the most frequentcauses of 'irregular' loss of refrigerant (see Chapter C, Section I). Generally, too, where othercomponents develop leaks for irregular reasons (compressors, evaporators, dryers), the pattern ofdamage will be fast-acting to precipitate by nature, for instance when a compressor breaks or a dryercracks.
It can indeed arise that a hole will enlarge continuously but so slowly that it fails to interfere with thesystem's operation by the time of the next regular inspection, which may be six months away or as faras two years into the future. However, such a situation is the exception to the rule among cases of'irregular' damage, which for the most part cause refrigerant loss in such a short space of time thatestablished maintenance intervals of two or four years will intervene either too early or too late in time.The vehicle has to be brought into the workshop without delay.
20 Since the tracer dye bonds to the refrigerant oil, not the refrigerant itself, no stain will form where aleak is so small that only gas can pass through, not oil.

48
4. Emissions prevented or caused by maintenance are approximately equal inmagnitude.
It may be broadly assumed that 15% of cases of 'irregular' emission comprise leaks of a slowlydeveloping nature which do not interfere with system operation before an inspection, but which arenonetheless found during the inspection. Under this assumption, the emission prevented in the processcomes to about 0.2% of the total annual loss of refrigerant. That percentage, related to the 11,050tonnes of refrigerant in circulation in the year 2000 (13 million R-134a air-conditioning systems eachcontaining 850 grams of refrigerant), corresponds to at most 22 tonnes of emission prevented perannum.
Against that there is the enormous effort and expenditure of opening 6.5 million air-conditioning systemsper year where regular maintenance is arranged once every two years (the interval cannot afford to beany longer if leaks of this kind are to be located in good time).
It should be duly noted that the 2 grams of recharging loss normally accompanying each maintenanceservice (see Chapter B, Section III, Paragraph 1) adds up to 13 tonnes per annum, on top of whichservice-related losses in the order of 0.1%21 or 10.4 tonnes may arise where a leak is not found duringthe first visit to the workshop.
Consequently, the level of emission which maintenance prevents is almost exactly the same as the levelit produces.
As overall outcome, regular maintenance generally does not prevent direct emission of refrigerant,although it may enhance a system's operational reliability and save on fuel consumption. At a moredetailed level, our study describes two particular, conceivable cases demonstrating that regularmaintenance either does not prevent refrigerant loss, or does so only at the price of emissions of just thesame magnitude attributable to the maintenance operation itself.
21 This percentage rate is derived from the present study, based on the figure of 20.5 kg (from 29 cars)in relation to 21,300 inspections of air-conditioned cars by the nine garages.

49
Acknowledgements, Reference Material
Throughout the course of this study, the author exchanged opinions with Jochen Harnisch of theECOFYS, whose ideas and suggested alterations have been duly taken on board almost withoutexception. Before all else, a special debt of gratitude is due to Mr Harnisch for his most valuableassistance.
Note on unnamed sources
Unfortunately, the study's most important sources of information could not be named without revealingthe identity of the three selected brands of car. This is a pity, in so far as our study has really beenbased not only on the Record Sheets, but also - indeed above all - on the experience of the air-conditioning mechanics from our nine garages. Service managers, environmental and safety officers,trainers and sometimes managing directors were as much involved as the apprentices who transferredthe necessary data from the garage computers. The assistance provided by the sales departments ofthe three car manufacturers was just as indispensable, as were the information and suggestionsoriginating from company head offices. While extending my heartfelt thanks to each and every one ofmy sources, I really must mention four particular contributors at this point, even if in abbreviated form:Mr F. and Mr S of Garage L, Mr P of Garage V, and Dr. M representing one of the three manufacturers.
The author himself must of course accept full responsibility for the actual content of this study.
References
AFCE (Alliance Froid Climatisation Environment - Refrigeration, Air-Conditioning andEnvironmental Alliance), Fifteen-Year Projection of HFC Emission, Report on study byL. Palandre, D. Clodic, A.M. Pougin, May 1998;
Arbeitsgemeinschaft Altauto -Working Group for Old Cars: First Monitoring Report underthe terms of Heading 3.6 of the Scheme for Voluntary Self-Regulation of theEnvironmentally Compatible Disposal of Old Vehicles (Passenger Cars) within thescope of the German Federal Government Commercial and Industrial WasteManagement Act, presented on 21 March 2000 and covering the Period under Report1 April 1998 to 31 March 2000;
Autodata: Air-Conditioning System Text Book No. 1 - Testing and Diagnosis of Componentsfor Vehicles introduced to the Market from 1991 to 1997, Maidenhead (UK) 2000 andEssen 2000;
Baker, James A. (Delphi Automotive Systems, Inc.): Mobile Air Conditioning: HFC-134aEmissions and Emission Reduction Strategies, in: Joint IPCC/TEAP Expert Meetingon Options for the Limitation of Emissions of HFCs and PFCs, Petten, 26-28 May1999;
Clodic, D., Ben Yahia, M. (Centre d'Energétique, Ecole des Mines de Paris - Energy Centre,Paris School of Mining): New Test Bench for Measuring Leak Flow Rate of Mobile AirConditioning Hoses and Fittings. Earth Technology Conference, Baltimore, 1997.
DaimlerChrysler AG: Global Training - Basic Training in Commercial Vehicle and PassengerCar Air-Conditioning Systems NKE 1 - PKE 1, Stuttgart, second edition, Feb 2001.
DAT-Veedol-Report 2001 (Period under Examination October to December 2000, Supplementin: kfz-betrieb - the motor car garage - No. 16 of 19 April 2001;
Air-Conditioning Systems Conference: discussions in person at the IAA 2001 with representa-tives of the air-conditioning system suppliers. Roland Haussmann (Valeo GmbH & Co.GmbH, Hockenheim), Mr Ludwig (Behr GmbH & Co, Stuttgart), Frank Heiermann

50
(Denso Automotive Deutschland GmbH, Eching) and Josef Lohmann (WAECOInternational GmbH, Emsdetten - for Delphi-Diavia retrofit air-conditioning systems),Frankfort on Main, 18 September 2001;
Recovery/Recharging Stations Conference: discussions in person, during my investigations,with Wolfgang Schmidt (Behr GmbH & Co, Stuttgart), Stephan Behring (WaecoInternational GmbH Emsdetten), Rolf Hägele, Marius Mollesack (Christof FischerGmbH, Stuttgart), Michael John (Techmess-Elektronik GmbH, Gunningen), DieterHolstein (Longus Paul Lange & Co, Stuttgart), Karl-Heinz Mettke/Karl-Heinz Baur(Beissbarth GmbH, Munich), Horst König (Robinair SPX Europe GmbH, Hainburg);
Fischer, Marcus: Climate-Affecting Emissions from Passenger-Car Air-Conditioning Systems.Thesis prepared at TU Berlin - Berlin Technical College, FB 10, ISS-Fahrzeugtechnik -ISS Motor Vehicle Engineering, 1997;
Haussmann, Roland (Valeo GmbH & Co GmbH), Hockenheim, personal submission of18 September 2001;
Holdack-Janssen, Hinrich: Future Refrigerants in Passenger-Car Air-Conditioning Systems -CO2 or Combustible Substances? in: Reichelt, Johannes (publisher): Motor VehicleAir-Conditioning using Natural Refrigerants, Heidelberg 1996, pages 13 to 26;
Holdack-Janssen, Hinrich: Development of Passenger-Car Air-Conditioning, in: Ki Luft- undKältetechnik - Ki Ventilation and Refrigeration Engineering, 1/1998, 8 et seq.;
Holdack-Janssen, Hinrich (FH Braunsscheig/Wolfenbüttel - Institute of Higher Learning,Motor Vehicle Construction Institute), personal submission of 5 October 2000;
IPCC 1999 = IPCC/OECD/IEA Programme for National Greenhouse Gas Inventories, GoodPractice in Inventory Preparation for Industrial Processes and the New Gases, DraftMeeting Report Washington DC, United States, 26 to 28 January 1999;
KBA Kraftfahrt-Bundes-Amt - German Federal Office of Motor Transport: PreliminaryInformation on New Registrations of Passenger Cars in Germany classified byManufacturer and Type Category, Flensburg, 25 January 2001;
Öko-Recherche (Schwarz, W./Leisewitz, A.): R12 Substitution in Old Systems from 1996 tomid 1998, commissioned by the Umweltbundesamt - German Federal EnvironmentOffice, Berlin, August 1998;
Öko-Recherche (Schwarz, W./Leisewitz, A.): HFC, PFC and SF6 Emission in Germany andthe Potential for its Reduction, commissioned by the Umweltbundesamt - GermanFederal Environment Office, Berlin, October 1999.
Pettersen, J./Hafner, A.: Energy Efficiency and Total Equivalent Warming Impact of CO2Vehicle Air-Conditioning Systems, in: Reichelt, Joannes (publisher): Vehicle Air-Conditioning using Natural Refrigerants, Heidelberg 1996, pages 64 to 77;
Preisegger, Ewald (Solvay Fluor und Derivate GmbH); Automotive Air Conditioning Impact ofRefrigerant on Global Warming, in: Joint IPCC/TEAP Expert Meeting on Options forthe Limitation of Emissions of HFCs an PFCs, Petten, 26 to 28 May 1999;
Schwarz, W.: Forecast Emission of R-134a from Vehicle Air-Conditioning Systems up to2010/20. Report of DKV - German Refrigeration and Air-Conditioning EngineeringAssociation Meeting at Bremen, 2000, year 27, vol. III, 61 to 73;
Taxis-Reischl, Brigitte (Behr GmbH & Co), Stuttgart, personal submission of 4 October 2000;Taxis-Reischl, Brigitte (Behr GmbH & Co): Energy Consumption of Air-Conditioning Systems
and Ways of Reducing Consumption, in: supplement on Engine Cooling and Air-Conditioning Technology: Technical Innovation '97, from ATZ AutomobiltechnischeZeitschrift - Automobile Engineering Magazine, year 99, issue 9/97, pages VII to X;
Tujibayashi, Yoshiyuki (Nissan Motor Co., Ltd.), Action Plan related to Emission Control ofHFC 134a Refrigerant for Automobile Air-Conditioning Systems, in: Joint IPCC/TEAPExpert Meeting on Options for the Limitation of Emissions of HFCs and PFCs, Petten,26 to 28 May 1999;
UNEP-RTOC 1998 = UNEP 1998 Report of the Refrigeration, Air Conditioning and HeatPumps Technical Options Committee, 1998 Assessment, Nairobi 1998;
VDA - German Automobile Industry Association (publisher): Fundamentals of Vehicle

51
Air-Conditioning System Engineering, Frankfort on Maine 1996;VDA Verband der Automobilindustrie - German Automobile Industry Association, Facts and
Figures from the Motor Traffic Industry, issues of 1992, 1996 and 2000, Frankfort onMaine;
WAECO International GmbH: Vehicle Air-Conditioning - Technical Principles, Emsdetten,3/2000a;
WAECO International GmbH: Vehicle Air-Conditioning - Diagnostic Handbook, Emsdetten,3/2000b;
WAECO International GmbH: Refrigerant Charge Handbook - Filling Capacities, Emsdetten,4/2000.