Emission Measurement Results for a Cellular and PCS Signal ...
90
NTIA Report TR-10-465 Emission Measurement Results for a Cellular and PCS Signal-Jamming Transmitter Frank H. Sanders Robert T. Johnk Mark A. McFarland J. Randall Hoffman
Transcript of Emission Measurement Results for a Cellular and PCS Signal ...

NTIA Report TR-10-465
Emission Measurement Results for a Cellular and PCS Signal-Jamming
Transmitter
Frank H. Sanders Robert T. Johnk
Mark A. McFarland J. Randall Hoffman


NTIA Report TR-10-465
Emission Measurement Results for a Cellular and PCS Signal-Jamming
Transmitter
Frank H. Sanders
Robert T. Johnk Mark A. McFarland J. Randall Hoffman
U.S. DEPARTMENT OF COMMERCE
Lawrence E. Strickling Assistant Secretary for Communications and Information
February 2010


iii
ACKNOWLEDGEMENT The authors wish to thank the National Institute of Standards and Technology (NIST), and particularly Mr. Dennis Camell of NIST, for providing timely access to the anechoic chamber on the Boulder campus for the radiated emission measurements that are presented in this report. Iris Tobias of the NTIA/ITS laboratory built the mountings for the jammer antennas; one of the authors (Frank Sanders) took the photographic image of Figure 1; and Ms. Kristen Davis of the NTIA/ITS laboratory drafted the technical drawing of Figure 2.
DISCLAIMER Some technical information regarding the cellular jammer that was measured may be considered intellectual property by the manufacturer of the device. The device descriptions that are given in this report, its operational parameters, and its emissions are provided solely for the purpose of evaluating what engineering impact, if any, the possible future operation of the device might have on other systems that use the radio spectrum. Please note that the device that is described herein is not FCC-certified, nor does there exist a certified standard design or operational configuration for it. Some test and measurement equipment are identified in this report for the purpose of comprehensively describing the methodology and results of the work that was performed. Such identification does not imply endorsement by the Department of Commerce of the equipment so identified, nor does such identification imply that the equipment was the only possible choice for adequate performance of such tests and measurements.


v
CONTENTS Page
FIGURES ......................................................................................................................... vi TABLES .......................................................................................................................... x ABBREVIATIONS/ACRONYMS ................................................................................... xi EXECUTIVE SUMMARY .............................................................................................. xiii 1 INTRODUCTION .................................................................................................... 1 1.1 Objective ........................................................................................................... 1 1.2 Approach ........................................................................................................... 2 2 MEASUREMENT SETUP ....................................................................................... 3 3 MEASUREMENT SYSTEM CALIBRATION, TECHNIQUES AND BANDWIDTH ................................................................................................ 4 4 DESCRIPTION OF THE JAMMER ........................................................................ 6 4.1 Power Output ..................................................................................................... 6 4.2 Antennas ........................................................................................................... 6 4.3 Frequency-Sweeping, or Chirp, Range ................................................................ 6 4.4 RF Output Filtering ............................................................................................ 6 4.5 Ancillary Equipment .......................................................................................... 7 5 COMBINATIONS OF JAMMER PARAMETERS USED FOR EMISSION
MEASUREMENTS ................................................................................................. 8 6 MEASUREMENT DATA ........................................................................................ 11 6.1 Time Domain Behavior ...................................................................................... 11 6.2 Effect of Measurement Bandwidth on Measured Emission Spectra ..................... 13 6.3 Diplexer Frequency Response Measurement Result ............................................ 13 6.4 Emission Spectrum Measurement Results ........................................................... 14 7 ANALYSIS .............................................................................................................. 64 8 SUMMARY ............................................................................................................. 64 9 ISSUES NOT ADDRESSED BY THIS STUDY ...................................................... 68 10 REFERENCES ........................................................................................................ 69

vi
FIGURES
Page Figure 1. A jammer transmitter antenna and two measurement antennas inside the NIST anechoic chamber in Boulder, CO. ................................................................................... 2 Figure 2. Block diagram schematic of the jammer transmitter measurement system. ........ 3 Figure 3. A measurement of the jammer’s tuned frequency vs. time in the targeted 869-894 MHz and 1930-1990 MHz bands. .............................................................................. 11 Figure 4. Time-domain behavior of the jammer signal inside a targeted band at 880 MHz, chirping across 865-895 MHz. ................................................................................ 12 Figure 5. Time domain behavior of the jammer signal inside a targeted band at 1962 MHz, chirping across 1930-1990 MHz. ............................................................................ 12 Figure 6. Example in-band emission spectra of the jammer in measurement bandwidths of 8 MHz, 2 MHz, and 300 kHz. ...................................................................................... 13 Figure 7. Power-rejection (filtering) characteristic of the diplexer as a function of frequency up to 6000 MHz. .............................................................................................. 14 Figure 8. Baseline (jammer turned off) environmental measurement in the anechoic chamber, 100 MHz-2000 MHz. ........................................................................................ 16 Figure 9. Baseline (jammer turned off) environmental measurement in the anechoic chamber, 2000 MHz-6000 MHz. ...................................................................................... 17 Figure 10. Measurement 1, 100 MHz to 2000 MHz. Full power, both bands, no output filter. ................................................................................................................................ 18 Figure 11. Measurement 1, 2000 MHz to 6000 MHz. Full power, both bands, no output filter. ................................................................................................................................ 19 Figure 12. Measurement 1, 825 MHz to 945 MHz. Full power, both bands, no output filter. ................................................................................................................................ 20 Figure 13. Measurement 1, 1600 MHz to 2000 MHz. Full power, both bands, no output filter. ................................................................................................................................ 21 Figure 14. Measurement 2, 20 MHz to 2000 MHz. Full power, 800 MHz band jamming only, no output filter. ........................................................................................................ 22

vii
Figure 15. Measurement 2, 2000 MHz to 6000 MHz. Full power, 800 MHz band jamming only, no output filter. ......................................................................................... 23 Figure 16. Measurement 2, 825 MHz to 945 MHz. Full power, 800 MHz band jamming only, no output filter. ........................................................................................................ 24 Figure 17. Measurement 2, 1600 MHz to 2000 MHz. Full power, 800 MHz band jamming only, no output filter. ......................................................................................... 25 Figure 18. Measurement 3, 100 MHz to 2000 MHz. Full power, 1900 MHz band jamming only, no output filter. ......................................................................................... 26 Figure 19. Measurement 3, 2000 MHz to 6000 MHz. Full power, 1900 MHz band jamming only, no output filter. ......................................................................................... 27 Figure 20. Measurement 3, 825 MHz to 945 MHz. Full power, 1900 MHz band jamming only, no output filter. ......................................................................................... 28 Figure 21. Measurement 3, 1600 MHz to 2000 MHz. Full power, 1900 MHz band jamming only, no output filter. ......................................................................................... 29 Figure 22. Measurement 4, 100 MHz to 2000 MHz. Low power, both bands jammed, no output filter. ................................................................................................................. 30 Figure 23. Measurement 4, 2000 MHz to 6000 MHz. Low power, both bands jammed, no output filter. ................................................................................................................. 31 Figure 24. Measurement 4, 820-960 MHz. Low power, both bands jammed, no output filter. ................................................................................................................................ 32 Figure 25. Measurement 4, 1600 MHz to 2000 MHz. Low power, both bands jammed, no output filter. ................................................................................................................. 33 Figure 26. Measurement 5, 100 MHz to 2000 MHz. Low power, both bands jammed, diplexer used as output filter. ............................................................................................ 34 Figure 27. Measurement 5, 2000 MHz to 6000 MHz. Low power, both bands jammed, diplexer used as output filter. ............................................................................................ 35 Figure 28. Measurement 5, 820-960 MHz. Low power, both bands jammed, diplexer used as output filter. ......................................................................................................... 36 Figure 29. Measurement 5, 1600 MHz to 2000 MHz. Low power, both bands jammed, diplexer used as output filter. ............................................................................................ 37

viii
Figure 30. Measurement 6, 100 MHz to 2000 MHz. Low power, both bands jammed, diplexer, omni antenna. .................................................................................................... 38 Figure 31. Measurement 6, 2000 MHz to 6000 MHz. Low power, both bands jammed, diplexer, omni antenna. .................................................................................................... 39 Figure 32. Measurement 6, 820-960 MHz. Low power, both bands jammed, diplexer, omni antenna. ................................................................................................................... 40 Figure 33. Measurement 6, 1600 MHz to 2000 MHz. Low power, both bands jammed, diplexer, omni antenna. .................................................................................................... 41 Figure 34. Measurement 7, 100 MHz to 2000 MHz. Low power, both bands jammed, diplexer, 2 MHz chirp. ..................................................................................................... 42 Figure 35. Measurement 7, 2000 MHz to 6000 MHz. Low power, both bands jammed, diplexer, 2 MHz chirp. ..................................................................................................... 43 Figure 36. Measurement 7, 820-960 MHz. Low power, both bands jammed, diplexer, 2 MHz chirp. ....................................................................................................................... 44 Figure 37. Measurement 7, 1600 MHz to 2000 MHz. Low power, both bands jammed, diplexer, 2 MHz chirp. ..................................................................................................... 45 Figure 38. Measurement 8, 162-174 MHz, high power, diplexer used as filter, hardline connection. ....................................................................................................................... 46 Figure 39. Measurement 8, 406-420 MHz, high power, diplexer used as filter, hardline connection. ....................................................................................................................... 47 Figure 40. Measurement 8, 450-460 MHz detail, high power, diplexer used as filter, hardline connection. ......................................................................................................... 48 Figure 41. Measurement 8, 851-869 MHz, high power, diplexer used as filter, hardline connection. ....................................................................................................................... 49 Figure 42. Measurement 8, 1710-1755 MHz, high power, diplexer used as filter, hardline connection. ......................................................................................................... 50 Figure 43. Measurement 8, 2110-2155 MHz, high power, diplexer used as filter, hardline connection. ......................................................................................................... 51 Figure 44. Measurement 8, 1171-1181 MHz detail, high power, diplexer used as filter, hardline connection. ......................................................................................................... 52

ix
Figure 45. Measurement 8, 1224-1232 MHz detail, high power, diplexer used as filter, hardline connection. ......................................................................................................... 53 Figure 46. Measurement 8, 1550-1600 MHz detail, high power, diplexer used as filter, hardline connection. ......................................................................................................... 54 Figure 47. Measurement 9, 100 MHz to 2000 MHz. Full power, both bands, diplexer installed as filter. .............................................................................................................. 55 Figure 48. Measurement 9, 2000 MHz to 6000 MHz. Full power, both bands, diplexer installed as filter. .............................................................................................................. 56 Figure 49. Measurement 9, 820-960 MHz. Full power, both bands, diplexer installed as filter. ................................................................................................................................ 57 Figure 50. Measurement 9, 1600 MHz to 2000 MHz. Full power, both bands, diplexer installed as filter. .............................................................................................................. 58 Figure 51. Measurement 10, 100 MHz to 2000 MHz. Full power, both bands, diplexer installed, both antennas used. ........................................................................................... 59 Figure 52. Measurement 10, 2000 MHz to 6000 MHz. Full power, both bands, diplexer installed, both antennas used. ........................................................................................... 60 Figure 53. Measurement 10, 820-960 MHz. Full power, both bands, diplexer installed, both antennas used. .......................................................................................................... 61 Figure 54. Measurement 10, 100 MHz to 2000 MHz. Full power, both bands, diplexer installed, both antennas used. ........................................................................................... 62 Figure 55. Measurement 11, 100 MHz to 2000 MHz. Full power, both bands, diplexer installed, 10 dB output attenuation. ................................................................................... 63
x
TABLES
Page Table 1. Jammer Configuration Parameters Used for Emission Measurements. ................ 8
xi
ABBREVIATIONS/ACRONYMS
APD amplitude probability distribution AWS Advanced Wireless Service CMRS Commercial Mobile Radio Service CW carrier wave EMC electromagnetic compatibility EIRP effective isotropic radiated power GPS Global Positioning System ITS Institute for Telecommunication Sciences, NTIA, U.S. Department of Commerce LMR land mobile radio NIST National Institute of Standards and Technology (of the U.S. Department of Commerce) NTIA National Telecommunications and Information Administration (of the U.S. Department of Commerce) OOB out-of-band spectrum emission, as defined in the NTIA Manual of Regulations and Procedures for Federal Radio Frequency Management OSM Office of Spectrum Management, NTIA, U.S. Department of Commerce PCS Personal Communication Service RF radiofrequency RMS root mean square (average power detection) YIG yttrium iron garnet (filter)

xii

xiii
EXECUTIVE SUMMARY This report describes the results of radiated emission measurements on a radio-service denial device (called a jammer). The manufacturer temporarily provided the device to the National Telecommunications and Information Administration (NTIA) Institute for Telecommunication Sciences (ITS) Boulder laboratory for the purpose of such measurements. The device is designed to jam communication services in the 869-894 MHz (cellular) and 1930-1990 MHz (PCS) radio bands. Please note that the device does not carry any Federal Communications Commission (FCC) certification and its design and parts are idiosyncratic to the manufacturer. NTIA performed the measurements mostly via radiated emissions in a National Institute of Standards and Technology (NIST) radio-anechoic chamber. NTIA measured the device’s emissions in both the frequency and time domains. NTIA performed spectrum measurements from 100 MHz to 6 GHz. This allowed the device’s emissions to be measured up to the sixth harmonic of its lower-band (cellular band) emissions and up to the third harmonic of its upper-band (PCS band) emissions. NTIA also performed especially detailed measurements in selected Federal and non-Federal frequency bands. The jammer transmitter operates by repetitively frequency-sweeping (called chirping) a carrier wave (CW) signal across the bands that are to be jammed. The transmitter essentially consists of a parallel pair of power supplies, amplifier controllers, high-power amplifiers, and outputs; the construction is parallel for the two jammer bands. An external radiofrequency (RF) signal combiner is normally installed at the output so that a single RF cable may be used to distribute signals in both bands via a single RF cable to the radiating jammer antenna or antennas. The amplifiers are rated at 100 W (+20 dBW) of output power in each band. A step attenuator inside the jammer box can adjust the output power to as little as about 30 W (+15 dBW) in each of the bands. External attenuation may be installed to further reduce the jammer output power. The manufacturer provided a standard cellular-PCS diplexer that was used as an RF filter; it was not part of the jammer transmitter. Being an external, non-integral component, such a filter may or may not be included in the design and final configuration of any given jammer installation. Alternatively, a filter with characteristics that are different than the diplexer could be used in any given field installation. The exact choice of RF filtering could depend on various factors, including the frequency range over which the signal might be chirped. If jamming were to be performed across the full width of the targeted bands, improved RF output filtering might be needed to reduce the device's out-of-band (OOB) emission levels in the adjacent bands. An alternative approach to reducing OOB emissions in the adjacent bands would be to reduce the device's in-band chirp width while using less-effective RF output filtering. All of these degrees of freedom (use of no RF output filter, use of a diplexer as a filter, use of filtering with faster OOB roll-off characteristics, and use of either a diplexer or some alternative filtering with a reduced in-band chirp width) are technically available options for the device that was evaluated in this study.

xiv
The jammer system provides four degrees of freedom to the user: output power, chirping range, RF filtering, and transmitter antenna design and spatial configuration. There is no standard design or installation configuration. Because these parameters would vary from one installation to the next, there is no standard jammer configuration that NTIA can measure. Therefore, the approach for the measurements in this report has been to demonstrate the ways in which the device’s emissions change in response to its output power level (100 W vs. 30 W); chirp range (full-band vs. 2 MHz chirping); RF filter installation (diplexer vs. no diplexer); and antenna choice (flat-panel directional antenna vs. omnidirectional antenna). NTIA did not consider possible use of special-purpose output filtering in these measurements, since such filtering would be one-of-a-kind, to be designed and used on an ad hoc basis for any given installation. The spectrum measurements achieved a dynamic range of 100 dB. That is, the measurement data show characteristics of the jammer’s emissions to 100 dB below the jammer’s fundamental-frequency power level. The emission spectrum, relative to the power at the fundamental frequencies, does not change when output power is changed, because the power is controlled with an attenuator at the output of the high-power amplification stage. The choice of transmitter antenna did not affect the spectrum. The device’s unwanted emissions are better contained within the cellular and PCS bands when the chirp range is limited to a 2 MHz band segment vs. a full band. The diplexer did improve the OOB roll-off in the spectrum immediately adjacent to the jammed bands, although measurable emissions did occur in those bands even with the diplexer installed. Beyond the OOB region of the adjacent bands, and with the exception of one emission near 3000 MHz, installation of the diplexer reduced unwanted spectrum emissions to levels that were below the 100 dB dynamic range of the measurement system across the range of 100 MHz to 6 GHz. Technical issues that the measurements in this report could not address include:
1) Jammer product effectiveness; 2) Jammer OOB and unwanted emission levels for alternative jammer designs and
modulations; and
3) The aggregate radiation level from a jammer installation, resulting from production of high-power emissions from one or more jammer transmitters, that is then split between a set of transmitter antennas, which radiate individually reduced power densities.

EMISSION MEASUREMENT RESULTS FOR A CELLULAR AND PCS SIGNAL-JAMMING TRANSMITTER
Frank H. Sanders, Robert T. Johnk, Mark A. McFarland, and J. Randall Hoffman1
This report describes emission measurements on a denial-of-service (jammer) transmitter operating in the 800 MHz and 1900 MHz cellular and PCS bands. The jammer operates at a power level of up to 100 watts in each band, repetitively sweeping a carrier-wave signal across the range of frequencies in which service is to be denied. Frequency domain emissions were measured from 100 MHz to 6 GHz with 100 dB of dynamic range. With the installation of a diplexer that is used as an RF filter, some measurable out-of-band (OOB) emissions occur in spectrum adjacent to the fundamental-frequency bands. Across the rest of the 100 MHz to 6 GHz spectrum range, unwanted emission levels are suppressed by 100 dB or more when the diplexer is installed. OOB emissions in adjacent bands may be reduced by sweeping across less than the full width of the targeted bands, or by installing custom-designed RF output filtering.
Key words: cellular communications jamming; denial-of-service jamming; emission bandwidth; out-of-band (OOB) emissions; personal communication service (PCS) communications jamming; radio jamming; unwanted emissions
1 INTRODUCTION For correctional facilities in the United States, parties have proposed to operate radio transmitters that produce intentional denial-of-service (jammer) emissions in the base station transmitter frequency bands of 869-894 MHz (cellular band) and 1930-1990 MHz (PCS band).2 This report describes the results of measurements that the National Telecommunications and Information Administration (NTIA) Institute for Telecommunication Sciences (ITS) laboratory performed in Boulder on radio spectrum emissions produced by one such jammer transmitter.
1.1 Objective The objective of this work has been to perform laboratory measurements to obtain a set of peak-detected and root mean square (RMS, or average) emission spectrum data, in the form of effective isotropic radiated power (EIRP), of a jammer transmitter that can be used to characterize the jammer’s radiated emissions. 1 The authors are with the Institute for Telecommunication Sciences, National Telecommunications and Information Administration (NTIA), U.S. Department of Commerce, Boulder, CO. 2 For brevity, this report refers to the 869-894 MHz and 1930-1990 MHz frequency bands as the 800 MHz and 1900 MHz bands, respectively.

2
1.2 Approach NTIA performed the measurements inside a National Institute of Standards and Technology (NIST) anechoic chamber (Figure 1) at the Department of Commerce facility in Boulder. NTIA performed the following tasks:
1) NTIA initially checked the spectrum and time-domain emissions of the jammer transmitter via conducted-line (non-radiated) measurements. This initial check allowed measurement personnel to assess the design of the jammer, the degrees of freedom available for adjustments of operational parameters, and the best set of measurement parameters and techniques to use for assessment of its emissions as a function of variations in its operational parameters.
2) NTIA collected emission spectrum and time-domain data, via radiated emissions, in the anechoic chamber between 100 MHz and 6 GHz. This frequency range included the transmitter’s emissions through the third harmonics of the two jammer bands.
3) NTIA analyzed measurement data, which are provided in this report. These data
show the detail of the spectral and time domain characteristics of the jammer emissions. These data may be used to perform future electromagnetic compatibility (EMC) analyses3 of the potential impacts, if any, on other spectrum users.
Figure 1. A jammer transmitter antenna and two measurement antennas inside the NIST anechoic chamber in Boulder, CO.
3 EMC analyses may be performed separately from the work described in this document.

3
2 MEASUREMENT SETUP NTIA configured the measurement hardware as shown in the block-diagram schematic of Figure 2. The jammer transmitter antenna was attached to a non-conductive mount within the anechoic chamber. Two calibrated, broadband antennas (a 0.1-2 GHz discone and a 2-6 GHz horn) were placed on non-conductive tripods three meters from the jammer antenna. Each antenna was connected to the measurement system via radio frequency (RF) cabling passing through a bulkhead in the chamber wall. The measurement system consisted of a pair of RF front-ends (0.1-2 GHz and 2-6 GHz) connected to a spectrum analyzer. Each RF front-end contained the following elements: a step attenuator (0-50 dB for the low-frequency front-end; 0-70 dB for the high-frequency front-end); tunable bandpass preselection using yttrium-iron-garnet (YIG) filter technology for automatic tracking of the spectrum analyzer frequency; and low-noise preamplification [1]. Computer software controlled the RF front-ends and the spectrum analyzer, and recorded the measurement data. At some frequencies, NTIA used supplemental fixed-tuned bandpass filters to augment the power-rejection characteristics of the YIG filter and thus ensure that no mixing products or harmonic products were generated within the RF front ends. NTIA used a high-speed oscilloscope to obtain additional data on the swept-frequency (chirped) behavior of the jammer. Those data were taken during the initial conducted-line measurements.
Figure 2. Block diagram schematic of the jammer transmitter measurement system.

4
3 MEASUREMENT SYSTEM CALIBRATION, TECHNIQUES AND BANDWIDTH
Measurement system calibrations were performed with a noise diode and a standard Y-factor method [2]. Measurement system antenna gain factors were taken from custom calibrations performed at an earlier date on an antenna range. The measurement technique used for all spectrum measurements consisted of a computer-controlled, stepped-frequency approach [1]. Using this approach, the tuned frequencies of the measurement system are not swept, but rather are stepped in discretely spaced increments. The increment, or step, size is the same as the IF (or resolution) bandwidth of the measurement system (effectively the measurement bandwidth). The advantage of the stepped-frequency approach is that the dynamic range of the measurement is extended by discretely adjusting attenuation at the RF front-end on a frequency-by-frequency basis as the measurement progresses. More attenuation is used at the fundamental frequency of the transmitter, and less attenuation, ranging eventually to zero, is used at other frequencies. This measurement approach also allows the time-domain characteristics of the measured signal to be observed and collected on a frequency-by-frequency basis. For the jammer measurements, the standard stepped-frequency measurement routine was augmented by the collection of 100,000 time-domain samples at each frequency. From these the amplitude-probability distribution (APD) of the signal was obtained at each measured frequency [3]. This data set, which shows the time statistics of the signal at each measured frequency, allowed for the maximum (peak-detected), mean (root-mean square, or RMS), median, and minimum signal levels to be displayed as separate data traces across the entire spectrum. Because the stepped-APD measurement technique is much slower than the stepped-frequency technique (which only collects the peak-detected data trace), not all spectrum measurements were performed with the stepped-APD technique. Instead, the entire emission spectrum was initially measured across 0.1-6 GHz with the stepped-APD technique, so that the offsets in amplitude between the peak, mean, median, and minimum data traces could be assessed for every measured feature in the spectrum. Using the observed offsets between these data traces as an anchor, the subsequent spectrum measurements were performed with the peak-detector only, since the relative levels of the mean, median, and minimum curves to the peak-detected curve were known from the APD measurements. The four types of spectrum data that were acquired (peak-detected; mean; median; and minimum) are briefly described as follows. Peak data show the highest power level that the transmitter produces in the measurement bandwidth during the sampling interval at each measured frequency. Mean data show the average power level for each measured frequency; median data show the power level that is exceeded half of the time; and minimum data show the lowest power levels recorded by the measurement system in any given time interval.

5
All four data types were recorded for the jammer transmitter signals at the beginning of the measurements. The resulting data curves show the offsets, at each measured frequency in the spectrum, between the peak, mean, median, and minimum power levels. However, these four statistical data sets are time-consuming to acquire; there was not enough time to acquire all four data curves for every spectrum measurement that needed to be performed. Therefore, subsequent measurements were mostly performed using peak detection only. The offsets between peak values and the other statistics having already been established by the initial data, the mean, median, and minimum levels of the jammer emissions may be inferred from the peak data for all data sets in this report. The measurement bandwidth was tailored to achieve optimal signal-to-noise ratio in the measurement results.4 For this jammer, the combination of its chirp bandwidth and its chirp rate gave an optimum measurement bandwidth of 2 MHz. This was also the step-size increment for the spectrum measurements.
4 For the FM-CW modulation of the jamming signal, the optimum measurement bandwidth, Bmeas, is Bmeas = (Bc/τ)1/2, where Bc = the FM (chirp) bandwidth, and τ = the time interval required to sweep across Bc [1].

6
4 DESCRIPTION OF THE JAMMER The jammer unit NTIA used for these measurements was constructed for this purpose. Please note that the device that was provided to NTIA did not carry any FCC identification or certification. It is not known to what extent this device may or may not resemble or not resemble any other models or types of radio-jamming devices or systems. The jammer design provides four degrees of freedom in its operational parameters: transmitter output power; antenna configuration; modulation frequency-sweeping range; and RF output filtering. The jammer design and construction do not constrain either the installer or the user to any fixed, standard configuration for these parameters. Because every installation could use a unique combination of these parameters, there is no standard jammer configuration that can be tested or measured. For this study, the degrees of freedom for these parameters were controlled as follows.
4.1 Power Output The jammer included a programmable option for output power levels between 100 W (+20 dBW) to 30 W (+15 dBW). The power was controlled by adjusting the value of an attenuator that was installed at the output of the high-power amplifiers inside the jammer unit, and that was controlled via a hardware cable connection to an external laptop computer.
4.2 Antennas
Two external dual-band antennas were provided, one being a directional flat-panel unit and the other being an omnidirectional, dual-band unit. The directional gain of the flat-panel unit is estimated to have been approximately 6 dBi; a measurement of its pattern was beyond the scope of this effort. The omni-antenna gain is estimated to have been approximately 2 dBi.
4.3 Frequency-Sweeping, or Chirp Range The frequency-sweeping range for each band could be programmed to be as narrow as 2 MHz to as much as the full width of the cellular and PCS bands. Intermediate amounts of frequency sweeping could be used, but for this study only the full-band and 2 MHz sweeping options were used during the measurements. In the 2 MHz mode, the signal was chirped across the central portion of each band. The chirp frequency range may be controlled independently in the two bands. The chirp rate (averaging approximately 5 MHz of frequency change per microsecond) stays roughly constant as chirp range is adjusted.
4.4 RF Output Filtering The jammer unit itself contained no RF output filter. Rather, the manufacturer provided a standard cellular-PCS band diplexer to be used as a filter. This diplexer was not integral

7
to the jammer; instead, it was connected manually to the output of the jammer transmitter. Because of this, it is not known to what extent such filtering would or would not be provided for any given jammer installation. Alternative technical options would be: use no filter; use an alternative filter with faster OOB roll-off characteristics; or, in concert with a reduced operational in-band chirp width, either use no filter, use a diplexer, or use an alternative filter. During the measurements, the jammer spectra were assessed both with and without the diplexer at the output.
4.5 Ancillary Equipment In addition to the equipment discussed above, it is NTIA's understanding that this type of jammer would normally be used with a combination of RF combiners, splitters, cables, and sometimes external attenuation to adjust the radiation power levels of individual radiating elements throughout a jamming zone. Typical installations could involve the installation of many antennas, and sometimes so-called lossy (radiating) cables, along with the required ancillary RF hardware for combining and splitting the jammer signals between cables and antennas. Within a facility, it is possible to distribute the jammer amplifiers’ total power spatially across an array of antennas (or, in some cases, lossy cables) in order to better-control and provide lower power-density around individual antennas than could be produced if a single antenna were used to radiate a high-power signal. Although such antenna arrays were not studied during these measurements, the effect on spectrum emission levels of using two antennas (the omni antenna and flat-panel antenna that were supplied with the jammer) simultaneously, rather than individually, was explored and measured.

8
5 COMBINATIONS OF JAMMER PARAMETERS USED FOR EMISSION MEASUREMENTS
Because there is no standard jammer configuration, the measurement parameters needed to span a range of likely selections for output power levels, antennas, frequency sweeping ranges, and RF output filters. Table 1 lists the measurements that were performed to assess the extent of the effects each parameter caused on the jammer’s emission spectrum.
Table 1. Jammer Configuration Parameters Used for Emission Measurements. Meas. Name
Figure Numbers
Transmit Bands
Chirp Range
Output Power
Transmit Antenna
Diplex Output Filter
Measurement Data Type
Baseline 8-9 None n/a 0 None None Stepped APD
Meas 1 10-13 Both Full Full (100 W)
Flat Panel No Stepped APD
Meas 2 14-17 800 only Full Full (100 W)
Flat Panel No
Stepped APD below 2 GHz; stepped +peak above 2 GHz
Meas 3 18-21 1900 only Full Full (100 W)
Flat Panel No
Stepped APD below 2 GHz; stepped +peak above 2 GHz
Meas 4 22-25 Both Full Min. (30 W)
Flat Panel No Stepped +peak
Meas 5 26-29 Both Full Min. (30 W) Flat Panel Yes Stepped +peak
Meas 6 30-33 Both Full Min. (30 W) Omni Yes Stepped +peak
Meas 7 34-37 Both 2 MHz Min. (30 W) Flat Panel Yes Stepped +peak
Meas 8 (LMR, CMRS, AWS, GPS)
38-46 Both 2 MHz Min (30 W)
Flat Panel Yes Stepped +peak Conducted-line measurement
Meas 9 47-50 Both Full Full
(100 W) Flat Panel Yes Stepped +peak
Meas 10 51-54 Both Full Full (100 W) Both Yes Stepped +peak
Meas 11 55 Both Full
100 W w. 10 dB
external atten.
Both Yes Stepped +peak 100-2000 MHz
only

9
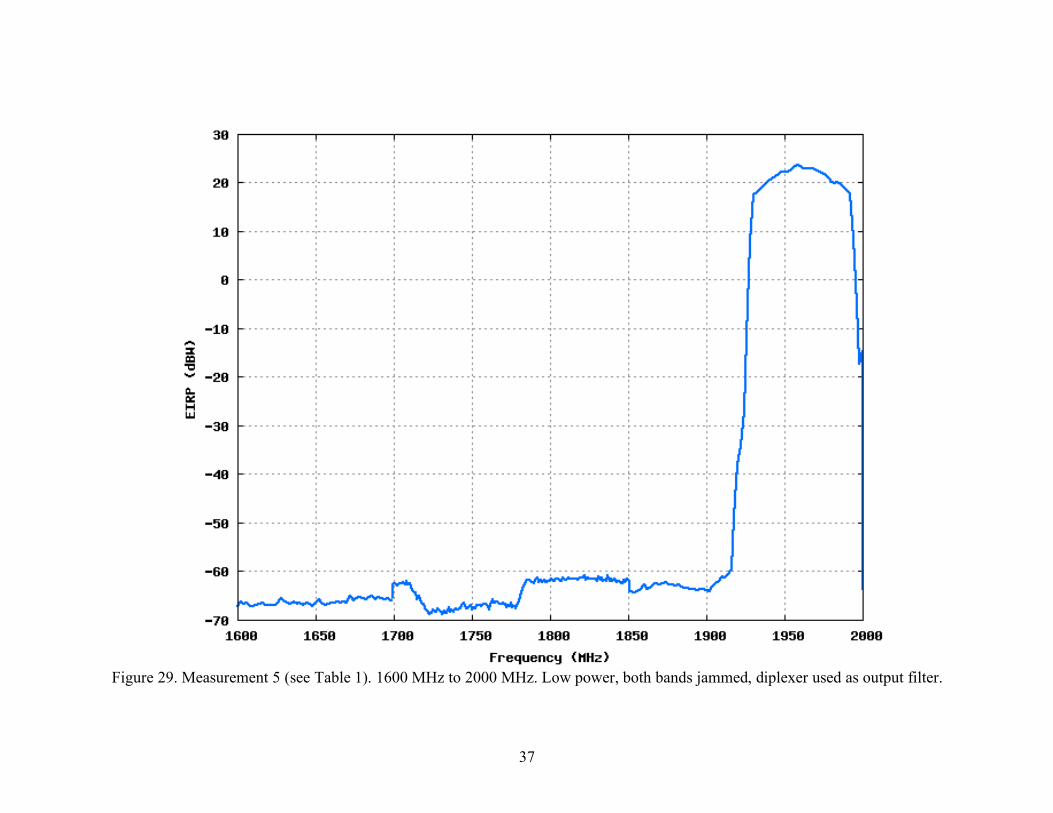
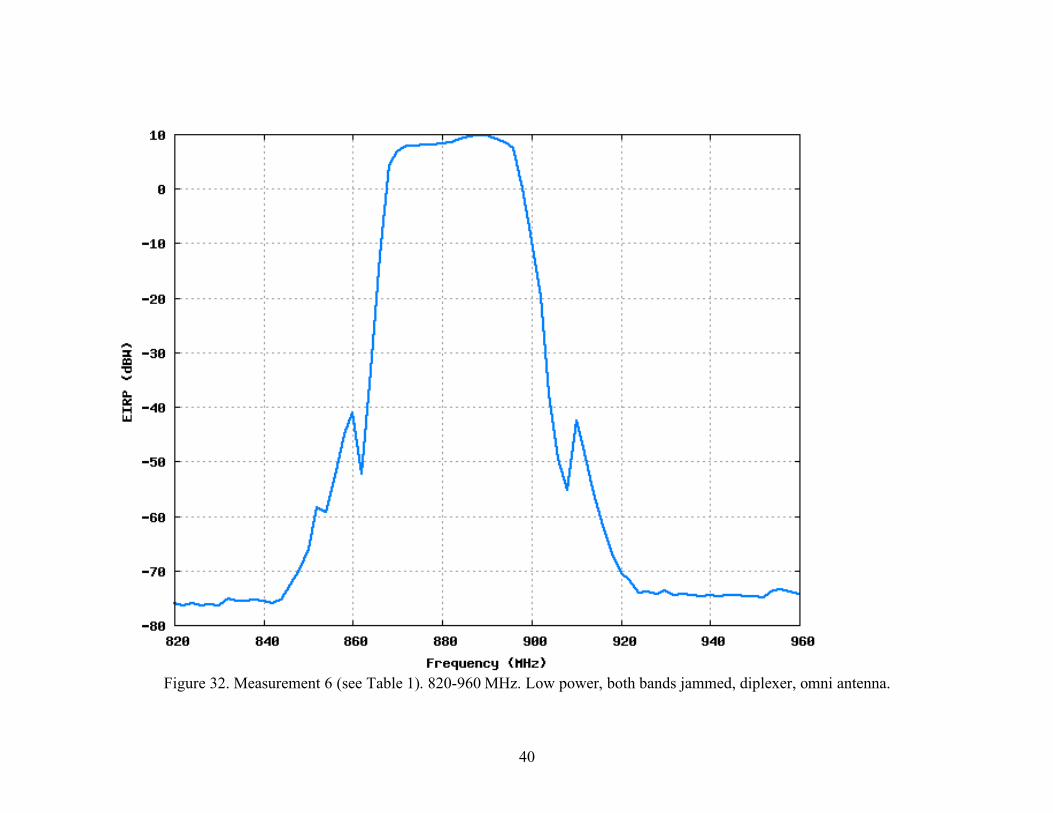
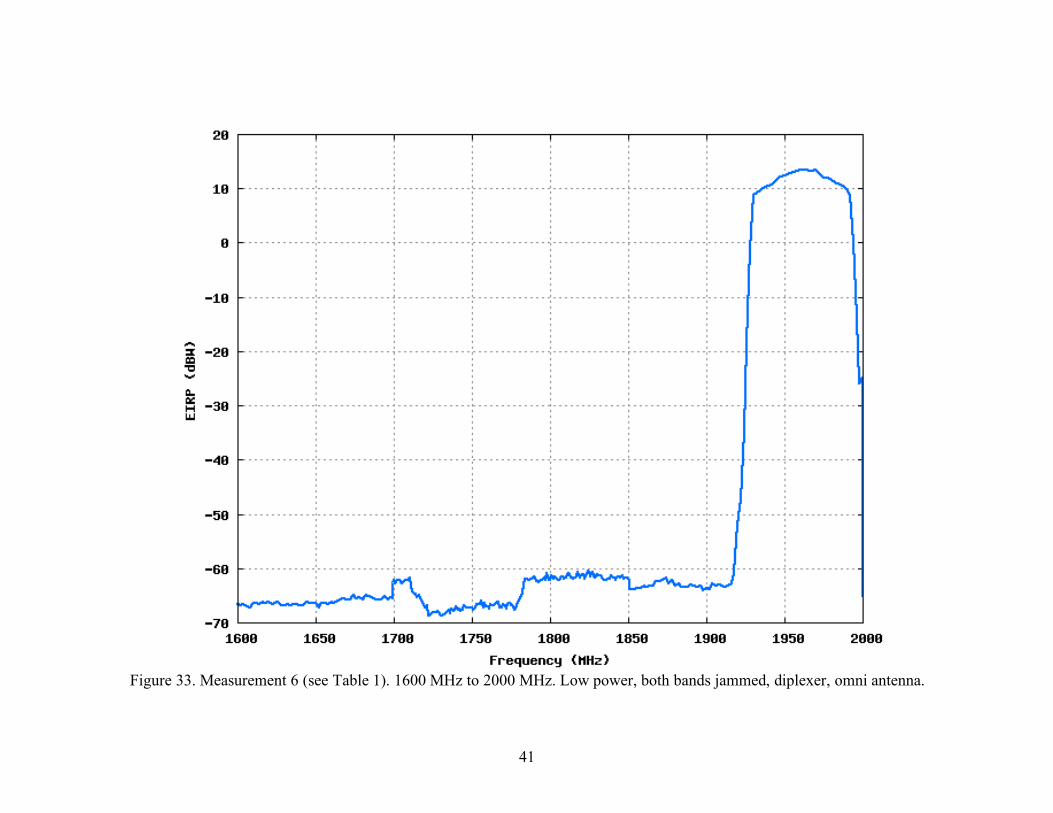
The methodology underlying the measurement matrix is as follows: Baseline: This measurement was performed across 0.1-6 GHz inside the anechoic chamber with the jammer turned off. If any background signals had been observed, they would have been subtracted from subsequent jammer emission spectra. Except for weakly received energy from microwave ovens near 2450 MHz, no background signals were observed with the jammer turned off. See Figures 8-9. Measurement 1: This measurement was performed with full jammer power, full-band chirping, and no external diplexer. The purpose was to observe the worst-case emission spectrum that could occur. This measurement was performed with the stepped-APD routine, so that the relative levels of the peak, mean, median, and minimum power levels generated by the jammer inside every observed spectral feature could be observed. This measurement served as an anchor for later measurements that used peak detection only. See Figures 10-13. Measurement 2: This measurement was performed with the 800 MHz jammer amplifier running and the 1900 MHz amplifier output terminated. This allowed the spectrum features produced by the 800 MHz amplifier to be isolated. See Figures 14-17. Measurement 3: This measurement was performed with the 1900 MHz jammer amplifier running and the 800 MHz amplifier output terminated. This allowed the spectrum features produced by the 1900 MHz amplifier to be isolated. See Figures 18-21. Measurement 4: This measurement was performed to demonstrate the effect of running the jammer transmitter at its minimum programmable power output level of 30 W (as compared to the full power level of 100 W). Jammer power was about +15 dBW in each band, as compared to the full power level of +20 dBW in each band. See Figures 22-25. Measurement 5: This was the first measurement in which the external diplexer, used as an RF output filter, was installed, thus demonstrating its effect on out-of-band (OOB) and unwanted jammer emissions. See Figures 26-29. Measurement 6: This measurement was performed with the omni transmitter antenna used in place of the flat-panel antenna, to show what effect (if any) the omni antenna had on the spectrum relative to the flat-panel antenna. See Figures 30-33. Measurement 7: This measurement was performed with the chirp range of the jammer adjusted to 2 MHz, to show the effect of a narrow frequency sweep compared to full-band frequency sweeping. See Figures 34-37. Measurement 8: This was a set of conducted-line, rather than radiated, measurements of two key Federal land mobile radio (LMR) bands (162-174 MHz and 406-420 MHz), two non-Federal Commercial Mobile Radio Service (CMRS) bands (450-460 MHz and 851-869 MHz), Advanced Wireless Service (AWS) bands (1710-1755 MHz and 2110-2155 MHz), and three of the Global Positioning System (GPS) bands (near 1176 MHz,

10
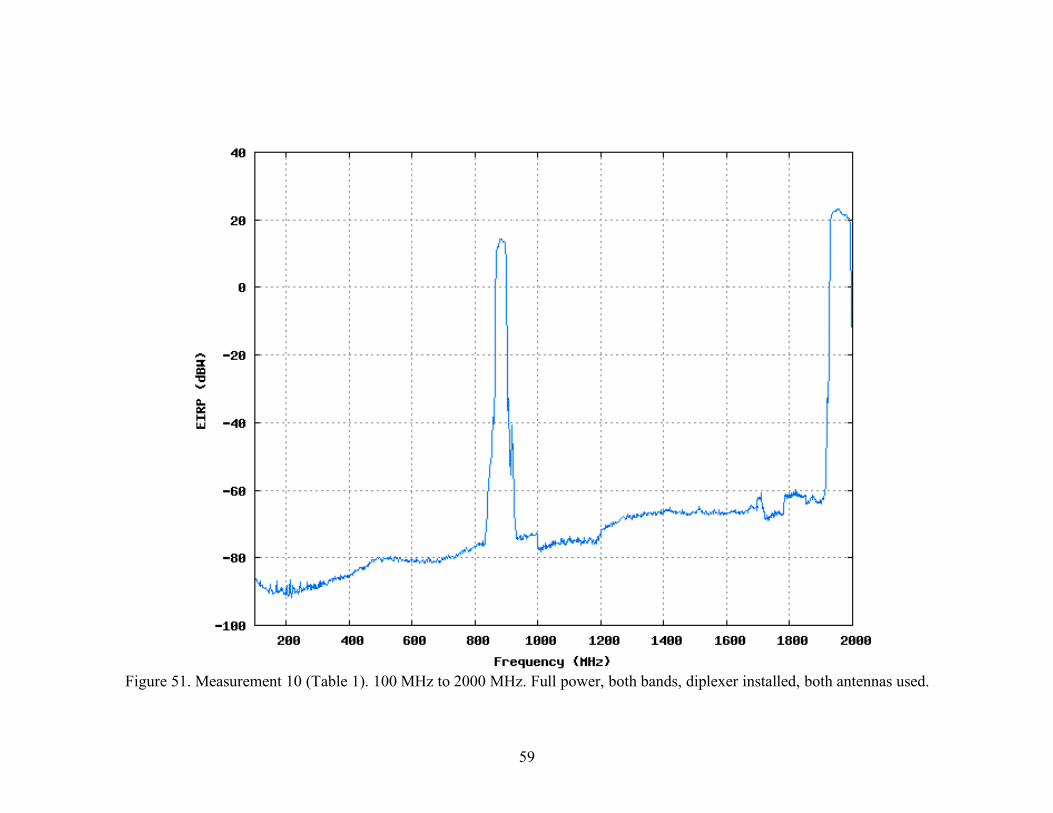
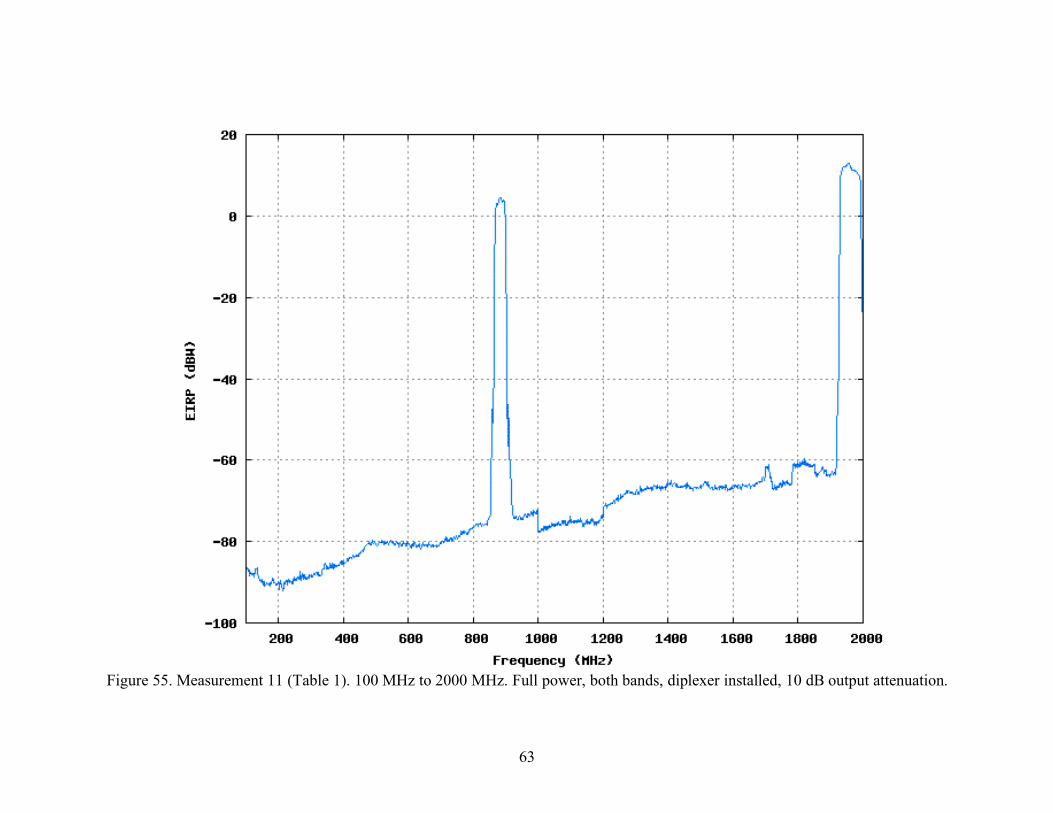
1227 MHz, and 1575 MHz). The LMR, CMRS, and AWS bands were measured using 10 kHz and 1 MHz measurement bandwidths, while the GPS bands were measured in 1 MHz only. The jammer was operated with the diplexer installed as a filter. See Figures 38-46. Measurement 9. This measurement was performed with the jammer at high power and the flat-panel, to establish the measurement system was still performing nominally. See Figures 47-50. Measurement 10: This measurement was performed with both the flat-panel antenna and the omni antenna radiating simultaneously via a two-way splitter supplied with the jammer. See Figures 51-54. Measurement 11: This measurement was performed with 10 dB of external attenuation to demonstrate that such attenuation reduces the amplitude of every feature in the emission spectrum by a uniform amount equal to the attenuation parameter. See Figure 55.

11
6 MEASUREMENT DATA
6.1 Time Domain Behavior Figure 3 shows the jammer frequency as a function of time (the modulation domain) in each of the service bands. The time-domain behavior of the jammer is shown in Figures 4 and 5. These figures show that the jammer signal looks like a pulsed transmitter, when observed on a single frequency in each of the service bands (cellular and PCS), as it sweeps the carrier through each band. For the measurements in Figures 3-5, the widest available bandwidth was used to achieve the highest possible resolution in the time domain. The bandwidth of the measurement in Figure 3 (conducted-line) was 2 GHz; the bandwidth of the measurements in Figures 4 and 5 (radiated) was 8 MHz. The data in Figures 4 and 5 were taken with a spectrum analyzer in a 0-Hz span mode with positive-peak detection.
Figure 3. A measurement of the jammer’s tuned frequency vs. time in the targeted 869-894 MHz and 1930-1990 MHz bands. The transmitter repetitively sweeps a carrier wave frequency (called FM or chirp modulation) across the frequency ranges that are jammed.

12
Figure 4. Time-domain behavior of the jammer signal inside a targeted band at 880 MHz, chirping across 861-894 MHz. The jammer signal tunes through the measurement frequency every 5.1 microsecond (µs), for a chirp rate of 4.9 MHz/µs. The short spikes are a frequency fly-back behavior of the transmitter between each chirp cycle.
Figure 5. Time domain behavior of the jammer signal inside a targeted band at 1962 MHz, chirping across 1930-1990 MHz. The jammer signal tunes through 60 MHz every 20.4 µs in this band, for a chirp rate of 2.9 MHz/µs. The short spikes are a frequency fly-back behavior of the transmitter between each chirp cycle.

13
6.2 Effect of Measurement Bandwidth on Measured Emission Spectra Figure 6 shows the effect of measurement bandwidth on the peak-detected spectrum. Specifically, this figure demonstrates that the full power of the transmitter is measured in a bandwidth of /
cB ! (which for this system is 2 MHz), in accordance with
measurement theory, by comparing the measured power in 2 MHz to the same power level that is measured in 8 MHz. This figure also demonstrates how the same shape of the emission is preserved for bandwidths less than /
cB ! , such as, in this case, 300 kHz.
This figure further demonstrates that the preferred bandwidth for the measurement is 2 MHz, because that choice provides maximum frequency-step increment size and thus yields the minimum required amount of total measurement time.
Figure 6. Example in-band emission spectra of the jammer in measurement bandwidths of 8 MHz, 2 MHz, and 300 kHz. The 2 MHz bandwidth curve of Figure 6 is thus demonstrated both theoretically (via the expression for optimum measurement bandwidth, Bmeas = /
cB ! ) and empirically (this
figure) to be the optimum bandwidth for spectrum measurements because it maximizes measured power, maximizes dynamic range, and yields the fastest possible measurement speed due to a maximal step size between spectrum data points. The offsets between the curves in Figure 6 demonstrate that, for receivers with bandwidths, Brx, that are narrower

14
than 2 MHz, the peak measured EIRP data (Pmeas, decibels) presented in this report need to be scaled as follows:
Pcoupled = Pmeas + 20 log10Brx
2MHz
!"#
$%&
,
where Pcoupled is the decibel power coupled into the receiver’s bandwidth. For example, a receiver with a 10 kHz bandwidth will couple 20log10((0.01)/2) = -46 dB (that is, 46 dB less) peak power than the levels shown in this report in a measurement bandwidth of 2 MHz.
6.3 Diplexer Frequency Response Measurement Result The frequency response of the diplexer was measured with a vector network analyzer. The result is shown in Figure 7.
Figure 7. Power-rejection (filtering) characteristic of the diplexer as a function of frequency up to 6000 MHz.
6.4 Emission Spectrum Measurement Results The results of the measurements that are outlined in Table 1 are shown in Figures 8-55. EIRP power levels were computed using a free-space relationship between the transmitter antennas and the measurement antennas [4]. The EIRP calculation took into account the measurement antenna gain, the free-space loss between the transmitter antenna and the

15
measurement antenna, and the internal gains and losses in the measurement system, as established initially with a noise diode calibration. After Figure 21, with a few exceptions (and unless otherwise noted), only peak data were measured. The relative levels of mean, median, and minimum power are related to the peak for all measurements in this report, however, by the offset amounts that are established in Figures 8-21. Mostly peak data were acquired after Figure 21 due to scheduling and time constraints on the completion of these measurements. Between 100-2000 MHz the measurement system noise figure ranged between 11 dB to 16 dB. Between 2000-6000 MHz the measurement system noise figure ranged between 8 dB to 18 dB. Although all of the spectrum graphs show EIRP as a function of frequency, it is important to understand that, strictly speaking, the EIRP label applies only to frequencies where jammer power is observed. Thus, in graphs that show only measurement system noise (such as, for example Figure 46 for the 1575 MHz GPS band), and where no jammer emissions are observed, the measurement system’s noise-power levels that are shown are effectively the upper possible limits on the jammer’s unwanted EIRP levels across these frequency ranges.

16
Figure 8. Baseline (jammer turned off) environmental measurement in the anechoic chamber, 100 MHz-2000 MHz. Only measurement system internal noise is seen. The gradual change in the baseline power is due to change in the measurement system noise figure.

17
Figure 9. Baseline (jammer turned off) environmental measurement in the anechoic chamber, 2000 MHz-6000 MHz. The gradual change in the baseline power is due to change in the measurement system’s noise figure. The spikes at 2450-2500 MHz are emissions from microwave ovens, and the spike at 5800 MHz is a cordless phone emission that penetrated the anechoic chamber shielding.

18
Figure 10. Measurement 1 (see Table 1). 100 MHz to 2000 MHz. Full power, both bands, no output filter.

19
Figure 11. Measurement 1 (see Table 1). 2000 MHz to 6000 MHz. Full power, both bands, no output filter.
20
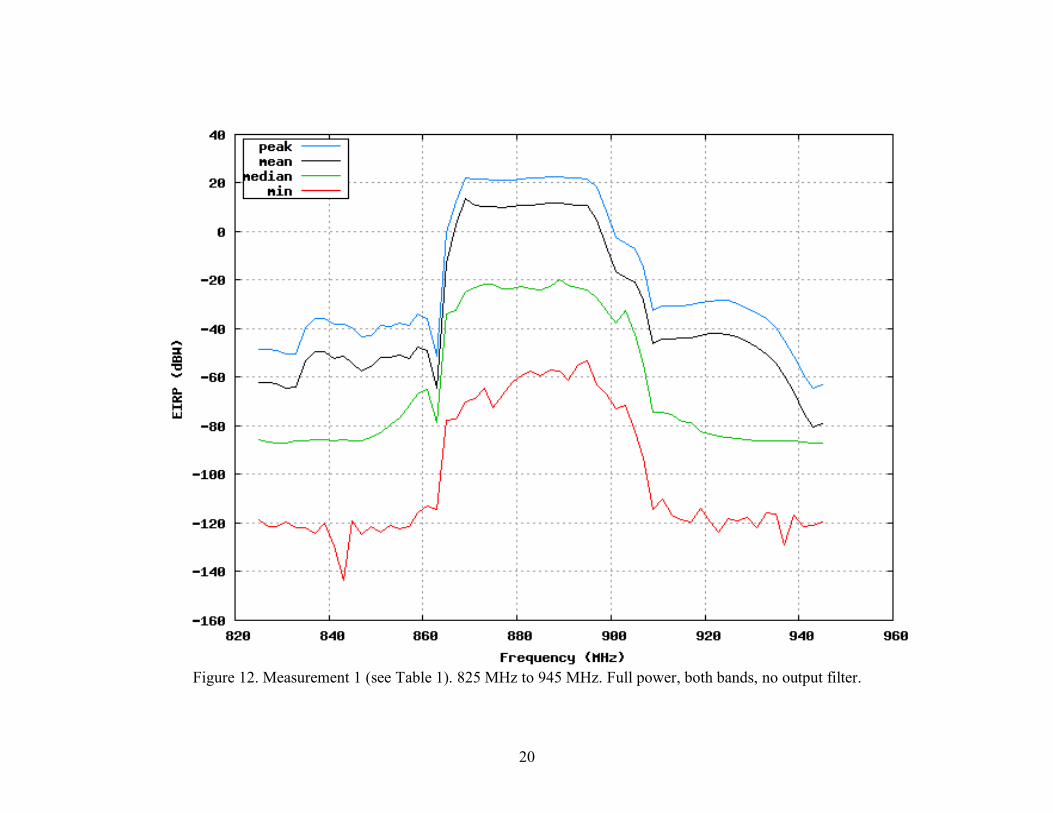
Figure 12. Measurement 1 (see Table 1). 825 MHz to 945 MHz. Full power, both bands, no output filter.
21
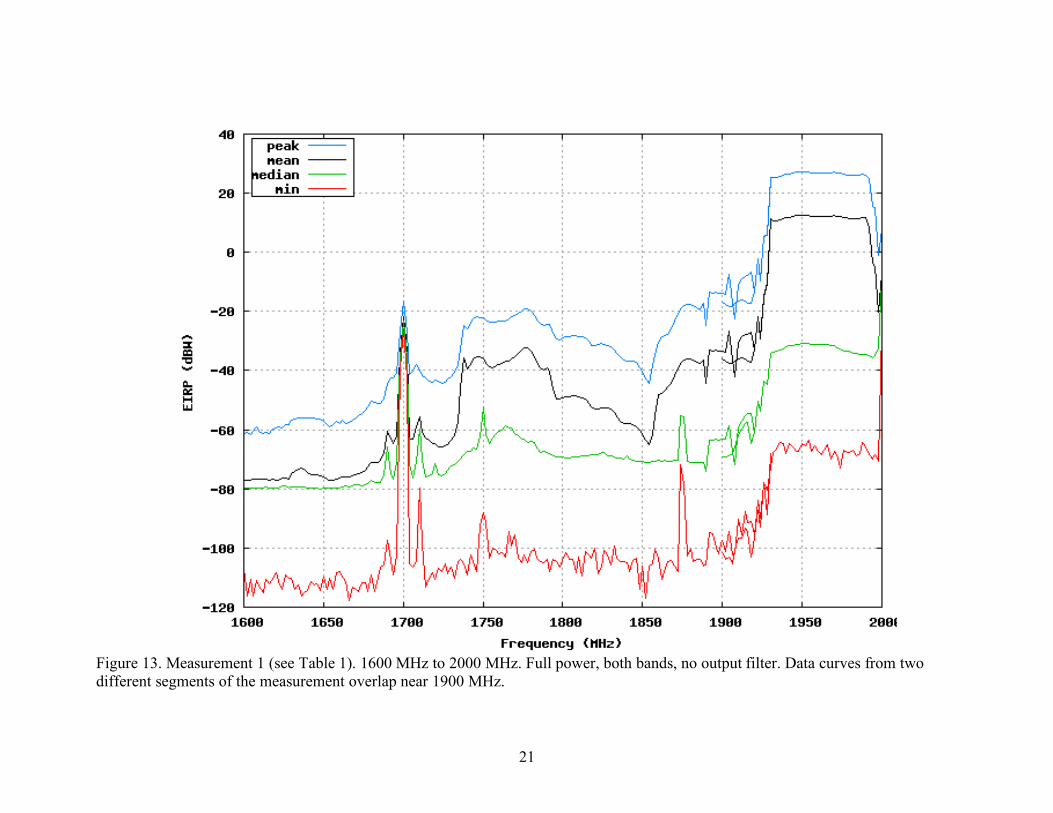
Figure 13. Measurement 1 (see Table 1). 1600 MHz to 2000 MHz. Full power, both bands, no output filter. Data curves from two different segments of the measurement overlap near 1900 MHz.

22
Figure 14. Measurement 2 (see Table 1). 20 MHz to 2000 MHz. Full power, 800 MHz band jamming only, no output filter.

23
Figure 15. Measurement 2 (see Table 1). 2000 MHz to 6000 MHz. Full power, 800 MHz band jamming only, no output filter.

24
Figure 16. Measurement 2 (see Table 1). 825 MHz to 945 MHz. Full power, 800 MHz band jamming only, no output filter.

25
Figure 17. Measurement 2 (see Table 1). 1600 MHz to 2000 MHz. Full power, 800 MHz band jamming only, no output filter. Data curves from two different segments of the measurement overlap near 1900 MHz.

26
Figure 18. Measurement 3 (see Table 1). 100 MHz to 2000 MHz. Full power, 1900 MHz band jamming only, no output filter.

27
Figure 19. Measurement 3 (see Table 1). 2000 MHz to 6000 MHz. Full power, 1900 MHz band jamming only, no output filter.

28
Figure 20. Measurement 3 (see Table 1). 825 MHz to 945 MHz. Full power, 1900 MHz band jamming only, no output filter.

29
Figure 21. Measurement 3 (see Table 1). 1600 MHz to 2000 MHz. Full power, 1900 MHz band jamming only, no output filter. Data curves from two different segments of the measurement overlap near 1900 MHz.

30
Figure 22. Measurement 4 (see Table 1). 100 MHz to 2000 MHz. Low power, both bands jammed, no output filter.
31
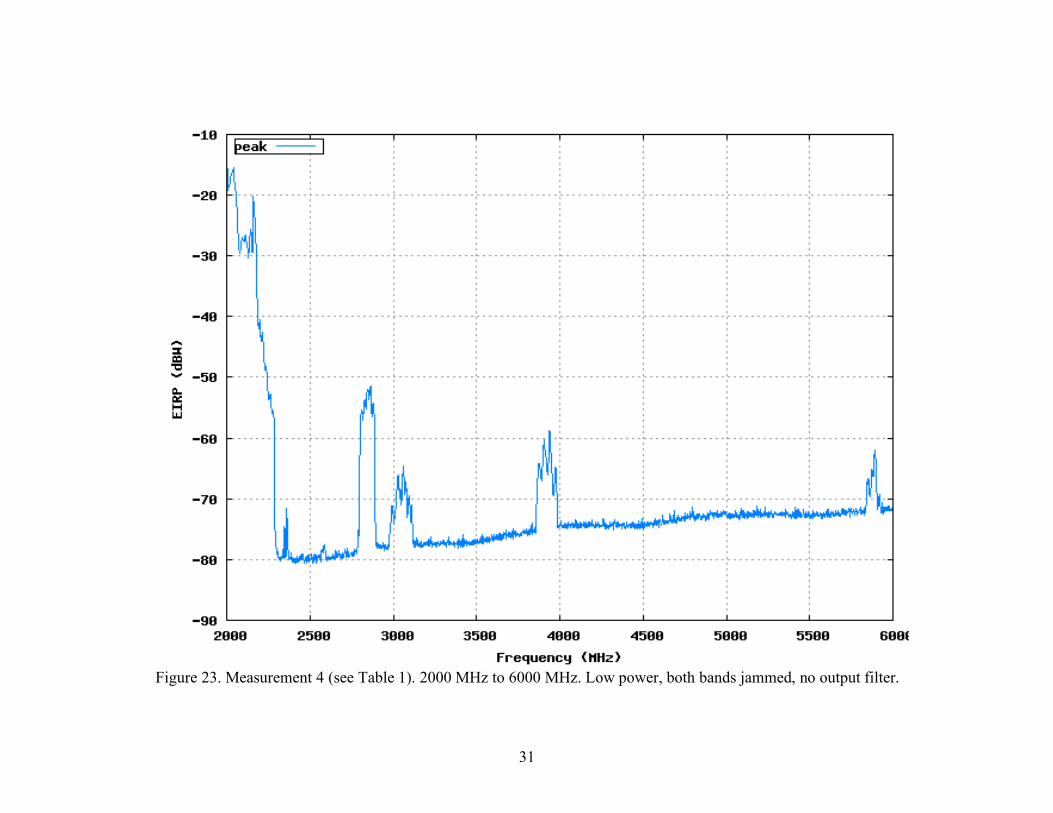
Figure 23. Measurement 4 (see Table 1). 2000 MHz to 6000 MHz. Low power, both bands jammed, no output filter.

32
Figure 24. Measurement 4 (see Table 1). 820-960 MHz. Low power, both bands jammed, no output filter.

33
Figure 25. Measurement 4 (see Table 1). 1600 MHz to 2000 MHz. Low power, both bands jammed, no output filter.

34
Figure 26. Measurement 5 (see Table 1). 100 MHz to 2000 MHz. Low power, both bands jammed, diplexer used as output filter.

35
Figure 27. Measurement 5 (see Table 1). 2000 MHz to 6000 MHz. Low power, both bands jammed, diplexer used as output filter.

36
Figure 28. Measurement 5 (see Table 1). 820-960 MHz. Low power, both bands jammed, diplexer used as output filter.
37
Figure 29. Measurement 5 (see Table 1). 1600 MHz to 2000 MHz. Low power, both bands jammed, diplexer used as output filter.

38
Figure 30. Measurement 6 (see Table 1). 100 MHz to 2000 MHz. Low power, both bands jammed, diplexer, omni antenna.

39
Figure 31. Measurement 6 (see Table 1). 2000 MHz to 6000 MHz. Low power, both bands jammed, diplexer, omni antenna. The feature between 2600-2700 MHz was a measurement anomaly of unknown origin.
40
Figure 32. Measurement 6 (see Table 1). 820-960 MHz. Low power, both bands jammed, diplexer, omni antenna.
41
Figure 33. Measurement 6 (see Table 1). 1600 MHz to 2000 MHz. Low power, both bands jammed, diplexer, omni antenna.

42
Figure 34. Measurement 7 (see Table 1). 100 MHz to 2000 MHz. Low power, both bands jammed, diplexer, 2 MHz chirp.

43
Figure 35. Measurement 7 (see Table 1). 2000 MHz to 6000 MHz. Low power, both bands jammed, diplexer, 2 MHz chirp.

44
Figure 36. Measurement 7 (see Table 1). 820-960 MHz. Low power, both bands jammed, diplexer, 2 MHz chirp.

45
Figure 37. Measurement 7 (see Table 1). 1600 MHz to 2000 MHz. Low power, both bands jammed, diplexer, 2 MHz chirp.

46
Figure 38. Measurement 8 (see Table 1). 162-174 MHz, high power, diplexer used as filter, hardline connection.

47
Figure 39. Measurement 8 (see Table 1). 406-420 MHz, high power, diplexer used as filter, hardline connection.

48
Figure 40. Measurement 8 (see Table 1). 450-460 MHz detail, high power, diplexer used as filter, hardline connection.

49
Figure 41. Measurement 8 (see Table 1). 851-869 MHz, high power, diplexer used as filter, hardline connection.

50
Figure 42. Measurement 8 (see Table 1). 1710-1755 MHz, high power, diplexer used as filter, hardline connection.

51
Figure 43. Measurement 8 (see Table 1). 2110-2155 MHz, high power, diplexer used as filter, hardline connection.

52
Figure 44. Measurement 8 (see Table 1). 1171-1181 MHz detail, high power, diplexer used as filter, hardline connection.

53
Figure 45. Measurement 8 (see Table 1). 1224-1232 MHz detail, high power, diplexer used as filter, hardline connection.

54
Figure 46. Measurement 8 (see Table 1). 1550-1600 MHz detail, high power, diplexer used as filter, hardline connection.

55
Figure 47. Measurement 9 (Table 1). 100 MHz to 2000 MHz. Full power, both bands, diplexer installed as filter.

56
Figure 48. Measurement 9 (Table 1). 2000 MHz to 6000 MHz. Full power, both bands, diplexer installed as filter.

57
Figure 49. Measurement 9 (Table 1). 820-960 MHz. Full power, both bands, diplexer installed as filter.

58
Figure 50. Measurement 9 (Table 1). 1600 MHz to 2000 MHz. Full power, both bands, diplexer installed as filter.
59
Figure 51. Measurement 10 (Table 1). 100 MHz to 2000 MHz. Full power, both bands, diplexer installed, both antennas used.

60
Figure 52. Measurement 10 (Table 1). 2000 MHz to 6000 MHz. Full power, both bands, diplexer installed, both antennas used.

61
Figure 53. Measurement 10 (Table 1). 820-960 MHz. Full power, both bands, diplexer installed, both antennas used.

62
Figure 54. Measurement 10 (Table 1). 100 MHz to 2000 MHz. Full power, both bands, diplexer installed, both antennas used.
63
Figure 55. Measurement 11 (Table 1). 100 MHz to 2000 MHz. Full power, both bands, diplexer installed, 10 dB output attenuation.

64
7 ANALYSIS The jammer performs frequency-sweeping (chirping) across the bands in which service is to be denied. The chirp rate is approximately 4.9MHz/µs and 2.9 MHz/µs, for 25 MHz and 60 MHz chirping across the cellular and PCS bands, respectively. The jammer’s chirped-frequency behavior makes its emissions look like a series of pulses to receivers in its jamming bands. Its effective emission bandwidth of /
cB ! is approximately
2 MHz, where Bc is the chirp range and τ is the time to chirp across Bc. When a diplexer is installed as an output filter, and when the transmitter chirps across the full widths of both targeted bands (800 MHz cellular and 1900 MHz PCS), some OOB emissions are observed in the adjacent bands, rolling off from the fundamental-frequency emissions in the targeted bands. These OOB emissions are reduced but not necessarily eliminated in the adjacent bands when the jammer only chirps across 2 MHz in the centers of the targeted bands. Another technical option to reduce OOB emissions would be to use specialized RF output filtering. Beyond the OOB region of the adjacent bands, unwanted emissions between 100 MHz to 6 GHz with the diplexer installed were below the measurement system’s noise-sensitivity limit at all frequencies.5,6 These levels were typically 100 dB lower than the fundamental-frequency power in the targeted bands.7 That is, the jammer’s unwanted emissions were typically suppressed by 100 dB or more, relative to its fundamental--frequency power across the 100 MHz to 6 GHz frequency range. This suppression level corresponded to an upper limit of -65 to -90 dBW (peak-detected) and -75 to -100 dBW (RMS average) for the EIRP emission level of the jammer transmitter when it was operated at its maximum transmission EIRP level of +20 dBW. The jammer emission spectrum does not change, relative to the power at its fundamental frequencies, when its output power is varied. This is because the transmitter power is varied by adjusting RF attenuation levels at the output of the high-power transmitter amplifiers, rather than by adjusting the input power to its high-power amplifiers. Using two transmitter antennas instead of a single transmitter antenna did not change the EIRP level measured from the transmitter. This observation supports the concept that
5 Variations that occur in the measurement system’s noise level in Figures 8-55 are due to variations in the measurement system’s noise figure between 100 MHz to 6 GHz, and are not due to any unwanted jammer emissions in that frequency range. 6 During Measurement 6, an anomaly occurred in one scan between 2500-2600 MHz. The anomaly consisted of a recording of energy at about -61 dBW EIRP across that range. The feature was not observed in any other jammer emission data, and is not believed to have been an emission from the jammer. The cause of the anomaly is unknown. 7 A very low-amplitude emission was observed at 3 GHz, 95 dB below the fundamental-frequency power level.

65
total radiated transmitter power will be conserved, regardless of whether the power is radiated from a single antenna versus being divided between multiple antennas.8 The power that the jammer emissions can couple into a receiver, Pcoupled (decibel units) varies as a function of the receiver bandwidth, Brx. If a receiver has a bandwidth of 2 MHz or wider, then the data that are presented in the graphs in this report (all taken in 2 MHz bandwidth unless otherwise noted) may be used directly to indicate the peak EIRP levels that may be coupled into a victim receiver. However, for receivers with bandwidths that are narrower than 2 MHz, the measured peak EIRP data (Pmeas) presented in this report need to be scaled as follows:
Pcoupled = Pmeas + 20 log10Brx
2MHz
!"#
$%&
,
under the condition that Brx is less than 2 MHz. For example, a receiver with a 10 kHz bandwidth will couple 20log10((0.01)/2) = -46 dB (that is, 46 dB less) power relative to the levels shown in this report in a measurement bandwidth of 2 MHz.
8 This allows for inevitable splitter and combiner losses that would occur concomitantly with an array of multiple transmission antennas.

66
8 SUMMARY 1) The system in this report carried no FCC identification or certification and was
supplied specially to NTIA by the manufacturer for the purpose of performing measurements of its emissions.
2) The jammer that has been measured for its emission characteristics in this study has
no standard operational configuration. Its emission characteristics are adjustable for the following parameters: power output level, swept-frequency (FM or chirp) range, radiating antenna designs and configurations, and RF output filtering. The jammer's design allows these parameters to be varied from one installation to the next.
3) The jammer works by repetitively sweeping a carrier wave across the bands in which
communication services are to be denied. The chirp rate was 4.9 MHz/µs and 2.9 MHz/µs, respectively, for 25-MHz chirping in the cellular band and 60-MHz chirping in the PCS band. The jammer’s effective emission bandwidth of /
cB ! is
approximately 2 MHz. The jammer’s swept-frequency emissions effectively look pulsed on individual frequencies within the bands that are jammed.
4) The maximum EIRP of the jammer is approximately +22 dBW in the 800 MHz cellular band and +24 dBW in the 1900 MHz PCS band when low-gain transmitting antennas are used. The EIRP will vary, of course, depending upon the choice of transmitter antenna.9
5) The emission power level is controlled by using variable RF attenuators at the output
of the power amplifiers, inside the jammer unit. Additional attenuation may be added externally to further reduce the jammer’s EIRP level. This method of controlling the transmitter output power causes the unwanted emission-spectrum levels relative to the power at the jammer fundamental frequencies not to be affected by the jammer’s transmitter output power level.
6) The choice of radiating antenna (omni versus low-gain, flat-panel antenna) made no
measurable difference in the relative levels of OOB and unwanted emissions to fundamental-frequency emissions.
7) While the use of multiple antennas reduces the power radiated per antenna, the total
power radiated from a combination of multiple antennas remains equal to the power output of the jammer transmitter, less unavoidable dissipative losses in ancillary equipment such as RF combiners, splitters, and cables.
8) When a diplexer is installed as an output filter, and when the transmitter chirps across
the full widths of both targeted bands (800 MHz cellular and 1900 MHz PCS), some 9 As antenna directionality (gain) increases, higher EIRP levels will occur in the main beams but concomitantly lower EIRP levels will occur in the sidelobes and backlobes; total transmitter power through 4π steradians of an antenna’s radiation pattern will always be conserved.

67
OOB emissions are observed in the adjacent bands, rolling off from the fundamental-frequency emissions. These OOB emissions are reduced but not necessarily eliminated in the adjacent bands when the jammer only chirps across 2 MHz in the centers of the targeted bands. Specialized filtering could further reduce OOB emissions in spectrum adjacent to the targeted bands.
9) Outside the OOB region of the adjacent bands, unwanted emissions between
100 MHz to 6 GHz with the diplexer installed were below the measurement system’s noise-sensitivity limit at all frequencies.10, 11, 12 The jammer’s unwanted emissions were typically suppressed by 100 dB or more relative to its fundamental-frequency power across the 100 MHz to 6 GHz frequency range. This suppression level corresponded to an upper limit of -65 to -90 dBW (peak-detected) and -75 to -100 dBW (RMS average) for the EIRP emission level of the jammer transmitter when it was operated at its maximum transmission level of +20 dBW.
10) With the diplexer installed, no measurable emissions were observed at levels on the
order of 100 dB below the fundamental frequencies when especially detailed measurements were performed in the following bands: 162-174 MHz; 405-420 MHz; 1176 MHz; 1227 MHz; 1575 MHz; 1710-1755 MHz; and 2110-2155 MHz. Some adjacent-band OOB emissions were observed in the 851-869 MHz band when the jammer was chirped across the full width of the 800 MHz cellular band. This may be mitigated by either chirping across a narrower frequency range or by installing specially designed RF output filtering.
11) The power that the jammer emissions can couple into a receiver, Pcoupled (decibel
units) varies as a function of the receiver bandwidth, Brx. If a receiver has a bandwidth of 2 MHz or wider, then the data that are presented in the graphs in this report (all taken in 2 MHz bandwidth unless otherwise noted) may be used directly to indicate the EIRP levels that may be coupled into victim receivers. For receivers with bandwidths that are narrower than 2 MHz, the measured EIRP data (Pmeas) presented in this report need to be scaled as follows:
Pcoupled = Pmeas + 20⋅log10(Brx/2 MHz),
under the condition that Brx is less than 2 MHz. For example, a receiver with a 10 kHz bandwidth will couple 20log10((0.01)/2) = -46 dB (that is, 46 dB less) peak power relative to the levels shown in this report in a measurement bandwidth of 2 MHz.
10 Variations that occur in the measurement system’s noise level in Figures 8-55 are due to variations in the measurement system’s noise figure between 100 MHz to 6 GHz, and are not due to any unwanted jammer emissions in that frequency range. 11 A very low-amplitude emission was observed at 3 GHz, 95 dB below the fundamental-frequency power level. 12 In one data scan, some power was measured about 80 dB below the fundamental, at -61 dBW peak EIRP, between 2500-2600 MHz. The feature was never observed in any other data, and is believed to have been a measurement anomaly. The cause of the anomaly is unknown.

68
9 ISSUES NOT ADDRESSED BY THIS STUDY The following issues, questions, and areas for possible further study were not addressed as part of this study:
1) Jammer product effectiveness; 2) Jammer OOB and unwanted emission levels for alternative jammer designs and
modulations; and
3) The aggregate radiation level from a jammer installation, resulting from production of high-power emissions from one or more jammer transmitters, that is split between a set of transmitter antennas which radiate at individually reduced power densities.

69
10 REFERENCES [1] F. H. Sanders, R. L. Hinkle, and B. J. Ramsey, “Measurement procedures for the NTIA radar spectrum engineering criteria (RSEC),” NTIA Technical Report TR-05-420, U.S. Department of Commerce, Mar. 2005. Available: http://www.its.bldrdoc.gov/pub/ntia-rpt/05-420/index.php. [2] F. H. Sanders, B. J. Ramsey and V. S. Lawrence, “Broadband spectrum survey at Los Angeles, California,” NTIA Report TR-97-336, U.S. Department of Commerce, May 1997. Available: http://www.its.bldrdoc.gov/pub/ntia-rpt/97-336/index.php. [3] R. J. Achatz,, “Tutorial on using amplitude probability distributions to characterize interference of ultrawideband transmitters to narrowband receivers”, Appendix A, In: W. Kissick (ed.), The temporal and spectral characteristics of ultrawideband signals. NTIA Report 01-383: U.S. Dept. of Commerce. Jan. 2001. Available: http://www.its.bldrdoc.gov/pub/ntia-rpt/01-383/index.php. [4] F. H. Sanders, “Conversion of power measured in a circuit to incident field strength and incident power density, and corrections to measured emission spectra for non-constant aperture measurement antennas”, Appendix C, In: W. Kissick (ed.), The temporal and spectral characteristics of ultrawideband signals. NTIA Report 01-383, U.S. Dept. of Commerce. Jan. 2001. Available: http://www.its.bldrdoc.gov/pub/ntia-rpt/01-383/index.php.


FORM NTIA-29 U.S. DEPARTMENT OF COMMERCE (4-80) NATIONAL. TELECOMMUNICATIONS AND INFORMATION ADMINISTRATION
BIBLIOGRAPHIC DATA SHEET 1. PUBLICATION NO. TR-10-465
2. Government Accession No.
3. Recipient’s Accession No. 5. Publication Date February 2010
4. TITLE AND SUBTITLE Emission Measurement Results for a Cellular and PCS Signal-Jamming Transmitter
6. Performing Organization Code
7. AUTHOR(S) Frank H. Sanders, Robert T. Johnk, Mark A. McFarland, J. Randall Hoffman
9. Project/Task/Work Unit No. 3102012-300 8. PERFORMING ORGANIZATION NAME AND ADDRESS
Institute for Telecommunication Sciences National Telecommunications & Information Administration U.S. Department of Commerce 325 Broadway Boulder, CO 80305
10. Contract/Grant No.
11. Sponsoring Organization Name and Address National Telecommunications & Information Administration Herbert C. Hoover Building, 14th & Constitution Ave., NW Washington, DC 20230
12. Type of Report and Period Covered Tech Report, FY10
14. SUPPLEMENTARY NOTES 15. ABSTRACT This report describes emission measurements on a denial-of-service (jammer) transmitter operating in the 800 MHz and 1900 MHz cellular and PCS bands. The jammer operates at a power level of up to 100 watts in each band, repetitively sweeping a carrier-wave signal across the range of frequencies in which service is to be denied. Frequency domain emissions were measured from 100 MHz to 6 GHz with 100 dB of dynamic range. With the installation of a diplexer that is used as an RF filter, some measurable out-of-band (OOB) emissions occur in spectrum adjacent to the fundamental-frequency bands. Across the rest of the 100 MHz to 6 GHz spectrum range, unwanted emission levels are suppressed by 100 dB or more when the diplexer is installed. OOB emissions in adjacent bands may be reduced by sweeping across less than the full width of the targeted bands, or by installing custom-designed RF output filtering.. 16. Key Words (Alphabetical order, separated by semicolons) cellular communications jamming; denial-of-service jamming; emission bandwidth; out-of-band (OOB) emissions; personal communication service (PCS) communications jamming; radio jamming; unwanted emissions
18. Security Class. (This report) Unclassified
20. Number of pages 69
17. AVAILABILITY STATEMENT UNLIMITED. 19. Security Class. (This page)
Unclassified
21. Price:


NTIA FORMAL PUBLICATION SERIES NTIA MONOGRAPH (MG)
A scholarly, professionally oriented publication dealing with state-of-the-art research or an authoritative treatment of a broad area. Expected to have long-lasting value.
NTIA SPECIAL PUBLICATION (SP)
Conference proceedings, bibliographies, selected speeches, course and instructional materials, directories, and major studies mandated by Congress.
NTIA REPORT (TR)
Important contributions to existing knowledge of less breadth than a monograph, such as results of completed projects and major activities. Subsets of this series include:
NTIA RESTRICTED REPORT (RR)
Contributions that are limited in distribution because of national security classification or Departmental constraints.
NTIA CONTRACTOR REPORT (CR)
Information generated under an NTIA contract or grant, written by the contractor, and considered an important contribution to existing knowledge.
JOINT NTIA/OTHER-AGENCY REPORT (JR)
This report receives both local NTIA and other agency review. Both agencies’ logos and report series numbering appear on the cover.
NTIA SOFTWARE & DATA PRODUCTS (SD)
Software such as programs, test data, and sound/video files. This series can be used to transfer technology to U.S. industry.
NTIA HANDBOOK (HB) Information pertaining to technical procedures, reference and data guides, and formal user's manuals that are expected to be pertinent for a long time.
NTIA TECHNICAL MEMORANDUM (TM)
Technical information typically of less breadth than an NTIA Report. The series includes data, preliminary project results, and information for a specific, limited audience.
For information about NTIA publications, contact the NTIA/ITS Technical Publications Office at 325 Broadway, Boulder, CO, 80305 Tel. (303) 497-3572 or e-mail [email protected]. This report is for sale by the National Technical Information Service, 5285 Port Royal Road, Springfield, VA 22161,Tel. (800) 553-6847.