
Emission Factors For Formaldehyde · PDF fileField Derived Emission Factors For Formaldehyde...
38
1 Field Derived Emission Factors For Formaldehyde and other Volatile Organic Compounds in FEMA Temporary Housing Units Srinandini Parthasarathy, Randy L. Maddalena, Marion L. Russell, Michael G. Apte Environmental Energy Technologies Division Indoor Environment Department Lawrence Berkeley National Laboratory Berkeley, CA 94720 October 2010 This work was supported by interagency agreement 08FED894632 by the National Center for Environmental Health (NCEH) of the Centers for Disease Control and Prevention (CDC) and the Assistant Secretary for Energy Efficiency and Renewable Energy, Office of Building Technology, State, and Community Programs of the U.S. Department of Energy (DOE) under Contract DE‐AC02‐05CH11231. LBNL‐4083E
Transcript of Emission Factors For Formaldehyde · PDF fileField Derived Emission Factors For Formaldehyde...

1
Field Derived Emission Factors For Formaldehyde and other Volatile Organic Compounds in FEMA Temporary Housing Units Srinandini Parthasarathy, Randy L. Maddalena, Marion L. Russell, Michael G. Apte Environmental Energy Technologies Division Indoor Environment Department Lawrence Berkeley National Laboratory Berkeley, CA 94720 October 2010
This work was supported by interagency agreement 08FED894632 by the National Center for Environmental Health (NCEH) of the Centers for Disease Control and Prevention (CDC) and the Assistant Secretary for Energy Efficiency and Renewable Energy, Office of Building Technology, State, and Community Programs of the U.S. Department of Energy (DOE) under Contract DE‐AC02‐05CH11231. LBNL‐4083E

i
ABSTRACT
Sixteen previously occupied temporary housing units (THUs) were studied to assess emissions of volatile organic compounds. The whole trailer emission factors were evaluated for 36 VOCs including formaldehyde. Indoor sampling was carried out in the THUs located in Purvis staging yard in Mississippi, USA. Indoor temperature and relative humidity (RH) were also measured in all the trailers during sampling. Indoor temperatures were varied (increased or decreased) in a selection of THUs using the heating, ventilation and air conditioning (HVAC) systems. Indoor temperatures during sampling ranged from 14º C to 33º C, and relative humidity (RH) varied between 35% and 74%. Ventilation rates were increased in some trailers using bathroom fans and vents during some of the sampling events. Ventilation rates measured during some a selection of sampling events varied from 0.14 to 4.3 h-1. Steady state indoor formaldehyde concentrations ranged from 10 µg-m-3 to 1000 µg-m-3. The formaldehyde concentrations in the trailers were of toxicological significance. The effects of temperature, humidity and ventilation rates were also studied. A linear regression model was built using log of percentage relative humidity, inverse of temperature (in K-1), and inverse log ACH as continuous independent variables, trailer manufacturer as a categorical independent variable, and log of the chemical emission factors as the dependent variable. The coefficients of inverse temperature, log relative humidity, log inverse ACH with log emission factor were found to be statistically significant for all the samples at the 95% confidence level. The regression model was found to explain about 84% of the variation in the dependent variable. Most VOC concentrations measured indoors in the Purvis THUs were mostly found to be below values reported in earlier studies by Maddalena et al.,1,2 Hodgson et al.,3 and Hippelein4. Emissions of TMPB-DIB (a plasticizer found in vinyl products) were found to be higher than values reported in comparable housing by Hodgson et al.,3. Emissions of phenol were also found to be slightly higher than values reported in earlier studies1,2,3. This study can assist in retrospective formaldehyde exposure assessments of THUs where estimates of the occupants indoor formaldehyde exposures are needed.
ii
TABLE OF CONTENTS
ABSTRACT......................................................................................................................... i TABLE OF CONTENTS.................................................................................................... ii LIST OF FIGURES ........................................................................................................... iii LIST OF TABLES............................................................................................................. iv INTRODUCTION .............................................................................................................. 1
Background ..................................................................................................................... 2 Materials emitting formaldehyde ................................................................................ 2 Factors influencing formaldehyde Emission Rates..................................................... 3 VOCs Emitted from Residences ................................................................................. 4
METHODS ......................................................................................................................... 4 Description of study units ............................................................................................... 4 Special Temperature Experiments .................................................................................. 5 Special Ventilation Rate Experiments ............................................................................ 5 Measurement of ventilation rates.................................................................................... 5 Air sampling and analysis............................................................................................... 6
Volatile organic compounds ....................................................................................... 6 Low Molecular Weight Aldehydes .............................................................................. 7 Acetic Acid .................................................................................................................. 7 Quality Assurance ....................................................................................................... 8
Measurement of Whole Trailer Concentrations.............................................................. 8 Data Analysis .................................................................................................................. 8
Multivariate Analysis .................................................................................................. 9 RESULTS AND DISCUSSION......................................................................................... 9
Formaldehyde emissions................................................................................................. 9 CONCLUSION................................................................................................................. 12 ACKNOWLEDGEMENTS.............................................................................................. 13 REFERENCES ................................................................................................................. 14 TABLES ........................................................................................................................... 17 FIGURES.......................................................................................................................... 25

iii
LIST OF FIGURES
Figure 1 - Example of tracer gas experiment determining ventilation rate in Forest River 1 showing initial stabilization period followed by the linear decay region. Figure 2a, 2b, 2c - Comparison of emission factor data for new site-built and manufactured homes (Hodgson et. al., 2000), German residences (Hippelein, 2004), four THUs (Maddalena et al., 2009) and sixteen FEMA THUs. Figure 3a, 3b, 3c - Comparison of measured indoor air concentration (ppb) data for new site-built and manufactured homes (Hodgson et. al., 2000), German residences (Hippelein, 2004), four THUs (Maddalena et al., 2009) and sixteen FEMA THUs. Figure 4a - Comparison of mean formaldehyde and acetic acid emission factors across THU manufacturer types Figure 4b - Comparison of mean formaldehyde and acetic acid concentrations across THU manufacturer types

iv
LIST OF TABLES
Table 1 - Trailer details Table 2 - Steady state concentrations and floor area normalized emission factors of formaldehyde, acetaldehyde and acetone Table 3 - Steady state concentrations and floor area normalized emission factors of acetic acid Table 4a - Steady state concentrations of other VOCs (Day in May 2009) Table 4b - Floor area normalized emission factors of other VOCs (Day in May 2009) Table 5 - Multivariate Regression Modeling Results

1
INTRODUCTION
The Federal Emergency Management Administration (FEMA) had supplied over 100,000 emergency THUs to families that lost their homes in Louisiana and Mississippi during the Hurricane Katrina and Rita disasters. FEMA owns approximately 160,000 of these THUs. Some are deployed to other parts of the U.S. as temporary housing for displaced homeowners or to house emergency workers. Many of the THUs are in storage in different parts of the country. Concerns about the indoor environmental quality in the THUs have arisen based on adverse health symptoms reported by occupants and documented by physicians who treated THU occupants. Indoor air quality measurements made in both occupied and unoccupied THUs (Sierra Club5 and by the Centers for Disease Control and Prevention, CDC6) and modeling assessments indicate that THU occupants are at higher risk for certain adverse health outcomes, particularly related to exposure to formaldehyde. The USEPA7 summarize several studies8,9,10 that have shown acute exposure to formaldehyde can cause irritation in the eyes, nose and throat. Human studies11,12 have reported increased levels of respiratory illnesses due to chronic formaldehyde exposure. Other studies13,14 show that chronic exposure to formaldehyde caused increased cancer incidence in rodents. Some human studies15,16 have also reported higher rates of respiratory site cancer occurrence among subjects regularly exposed to high formaldehyde levels. Formaldehyde is currently classified as a probable human carcinogen by USEPA16. Measurements of formaldehyde concentrations in THUs5,6 found levels in both occupied and unoccupied THUs exceeded the National Institute for Occupational Safety and Health (NIOSH) recommended exposure limit (REL) of 0.016 ppm17, often by a factor of 10 or greater. The NIOSH REL was based on the analytical limit of detection and not on health effects data18. Maddalena et al.1,2, measured the indoor concentration and whole trailer emission factor*of a suite of volatile organic compounds (VOCs), including aldehydes, in four new or refurbished unoccupied THUs. The study also determined the chemical specific emission factors for individual surface materials collected directly from the THUs. Although the emissions from individual materials were not significantly higher than regulatory values, it was observed that all THUs had a much higher portion of the internal surface area constructed with ⅛-inch plywood with a vinyl or PVC skin or simulated wood finish compared to typical homes. In addition to the high surface area of plywood paneling, all THUs had sheet vinyl flooring, while two of the four trailers also had carpeted areas. All countertops were particleboard surfaced with high-pressure laminate. A variety of wood products were used for the sub-floor and for the bench and bed platforms. Formaldehyde was observed to be the only aldehyde emitted from these materials at rates sufficient to be of health concern. VOCs like acetaldehyde and acetic acid, which are typically present when formaldehyde is observed, are also emitted from materials collected from the THUs. Like formaldehyde, which is a toxic air contaminant18, many of the other --------------------------------------------------------------------------------------------------------- * Whole trailer emission factors are the apparent or measured emission rate (µg/h) of a chemical normalized to the floor area (m2) of the space. The value has units of µg/ m2/h and it provides a useful metric for comparing different buildings because it integrates total emission rate from all materials in the space.

2
emitted VOCs are known to have low odor thresholds, high potency as respiratory irritants, and in some cases carcinogenicity. Emission factors of TMPD-DIB (2,2,4-Trimethyl-1,3-pentanediol diisobutyrate -a common plasticizer in vinyl products), phenol were higher than emission factors reported in earlier studies. A detailed assessment of the toxicology and risk associated with the identified indoor pollutants was not performed but of the compounds that were identified, the observed concentration of formaldehyde is thought to be of toxicological significance. Given the public health concerns associated with THUs, there is a need for a modeling tool to estimate or reconstruct exposures for occupants of the THUs. One of the key factors in an exposure assessment tool is the source term or emission factor for the chemical of interest. Emission factors from materials are dependent on a range of environmental parameters such as temperature, relative humidity and boundary layer diffusion characteristics, which are influenced by air flow across the surface. These parameters must be considered along with the effect of the changing factors when estimating VOC emissions from material within a THU. The primary objectives of this study on temporary housing units were to 1) determine the whole trailer emission factor for formaldehyde and, 2) assess the influence of temperature, relative humidity and ventilation rates on the formaldehyde emission factors. Measured VOC emission factors are provided as a point of information, but much greater focus is provided specifically on formaldehyde for use in a THU occupant exposure assessment modeling exercise to be detailed in a future report. Background
Materials emitting formaldehyde Since 1972 urea formaldehyde foam insulation (UFFI) caused health concerns that were reported by US Consumer Product Safety Commission (CPSC). Studies by Hileman et al.19
, showed that health effects were emerging in occupants of mobile homes. CPSC banned UFFI in 198220, although a court order in 1983 lifted the ban21. However, the use of UFFI as a building material was subsequently curtailed by the industry.
In 1984 the U.S. Department of Housing and Urban Development (HUD) established formaldehyde product standards for all plywood and particleboard materials using bonding, coating, or surface finishing systems containing formaldehyde when installed in manufactured homes (Turner et al.22). The standard is embodied in the HUD Standard 24 CFR Chapter XX Part 3280, Manufactured Home Construction and Safety Standards23. The standard is based upon the ASTM emission testing method E-1333 that continues to be used (ASTM 200224). The standard was intended to cap the mass of formaldehyde that emanated from fresh wood composite materials in terms of concentration in a test chamber using standardized surface loading ratios and area specific air flows or air exchange rates. The standard was developed for testing newly manufactured wood products prior to their use in construction. The HUD standards were adopted by the wood products industry in the U.S. during the 1980s. Subsequent surveys indicated that
3
because the reduction of the mass emission rate of formaldehyde from wood products and the discontinuation of the use of UFFI in residential construction, formaldehyde levels in residences dropped substantially (Azuma et al.25) through the 1980s and 1990s.
Factors influencing formaldehyde Emission Rates As detailed by Hawthorne et al.26, the mechanism of formaldehyde emissions depends on the production of formaldehyde in the bulk material, the transport through the bulk material, and the transfer of formaldehyde out of the bulk material into the atmosphere. According to the stagnant two-film model of mass transfer27, the overall transfer velocity of a chemical between a surface material and air is dependant on the diffusivity of the chemical in the surface and air, the diffusion path length or distance that the chemical must travel between the bulk or well mixed part of each compartment and the interface, and the equilibrium partition coefficient of the chemical in the two compartments. In general, for highly volatile chemicals like formaldehyde, the overall mass transfer rate across the interface is controlled by diffusion in the surface material and not in the air so changes in the depth of the stagnant boundary layer of air caused by changes in ventilation will likely have minimal effect on the overall emission rate. However, it is anticipated that high ventilation rates will remove contaminants from the space and as a result will increase the gradient between the bulk material and the surface leading to increased emission rates. A few key studies have been carried out to measure the effect of temperature and relative humidity on formaldehyde emissions. Zhang et al.28, conducted chamber experiments to understand the influence of temperature on the partition coefficient and diffusion coefficient and found that the partition coefficient decreases with increase in temperature, and the diffusion coefficient increased with increase in temperature. However, the equilibrium concentration of formaldehyde in air increased with increase in temperature. Andersen et al.29, conducted field and chamber experiments on formaldehyde emissions from particle board. These chamber experiments showed that the emissions had a strong positive correlation with the prevailing temperature and humidity conditions. Van Netten et al.30, conducted chamber experiments on various materials (ceiling tile, gypsum board, shiplap, plywood, terracotta brick) that release formaldehyde, and reported higher emissions were observed with increases in temperature, humidity or both. Based on the Maddalena et al., study1,2, Parthasarathy et al.31, selected the surface materials that dominated contributions to indoor formaldehyde to analyze the effects of temperature and humidity on the emission factors from materials collected from THUs. Parthasarathy et al.31, showed that, a 10° C increase in temperature increased the formaldehyde emissions 1.9 - 3.5 times, and a 35 % increase in relative humidity can increase the emissions by a factor of 1.8 – 2.6. An earlier review by Myers32 also emphasized that significant variations existed among various types of wood in their response to changing temperature and humidity conditions. The age of materials also affects the formaldehyde emissions. As materials age, the rate of VOC emissions drop over time, thus lowering the risk to occupants as time goes by33.

4
Scientific Equipment and Furniture Association (SEFA34) released a report stating that formaldehyde emissions can drop by 25% after a month of manufacture and by 50% after six months of manufacture. A study of emission characteristics of pressed-wood products conducted by Oak Ridge National Laboratory (ORNL) for the U.S. Consumer Product Safety Commission by Matthews et al.35, found that the time needed for emissions to drop to approximately 37% of initial rate was between 0.9 and 2.2 years depending on the material tested.
VOCs Emitted from Residences Amendments to the Clean Air Act in 1990, led to regulation of VOC emissions of about 188 VOCs. Although numerous studies reported VOC concentrations in indoor air, very limited literature is available on VOC emissions in THUs. Hodgson et al.3 measured VOC emissions in 4 new manufactured homes and 7 site-built homes, Maddalena et al.1,2 reported VOC concentrations in 4 FEMA THUs. They also reported emissions from individual surface materials present in these homes. The VOC concentrations and emission factors measured in the THUs were compared to concentrations and emission factors reported by Hodgson et al.3, Maddalena et al.1,2 and Hippelein 4.
METHODS
Indoor air sampling was carried out in sixteen THUs over five days in the Purvis staging yard located in the state of Mississippi. The sixteen units were manufactured by six different companies. Generally, acetic acid was sampled in the mornings and VOCs were sampled in the afternoons. Aldehyde samples were typically collected both in the mornings and the afternoons. An outdoor sample was collected daily (mid-day) to obtain background measurements. Generally, all windows and doors were closed, and fans were turned off during the indoor sampling, with a few noted exceptions which are described in special temperature experiments. The ventilation rate measured under these conditions was considered a baseline for the units. Description of study units A description of the physical characteristics of the units studied is provided in Table 1. The THUs were all travel trailer models that had been previously occupied and had not been reconditioned prior to testing. The units were moved to a staging area next to a large warehouse. All outside air intake ports such as windows and scuppers were closed and if necessary sealed with tape. All large cabinets and passage doors were opened to allow full mixing in the units. The trailers were left undisturbed after the initial set-up for at least 12 hours to allow indoor concentrations to stabilize. Window access for sampling lines were prepared from cardboard sheeting fastened with masking tape over the surface of a slightly open window in the middle of each trailer. For louver type windows, the cardboard was shaped into a shallow box to allow the window to swing out enough to provide access for the sampling tube(s). For slider type windows, a flat piece of cardboard was taped over the window and the slider window was opened enough to allow penetration of the sampling tubes.

5
Special Temperature Experiments After initial testing was completed on the Pilgrim 1 THU at 15:30 hours at the end of sampling on day 1, the HVAC system was set to maximum cooling resulting in a temperature of approximately 13º C. At 15:30 hours at the end of sampling on day 2 the HVAC system in Pilgrim 1 was raised to 27ºC, and temperatures in Gulfstream 1 and Gulfstream 2 were set to maximum cooling (~ 13ºC) for testing on the following day. Special Ventilation Rate Experiments Some additional measurements were carried out when altering the ventilation rate in Gulfstream 1, Gulfstream 2 and Forest River 1 by opening the scupper in the bathroom, and a window in the front of the unit. The changes were considered to yield medium ventilation rates in the units. At the end of Day 3 of sampling, the ventilation rates were altered in Forest River 1 by opening the scupper in the bathroom, three windows in the unit and by turning on the exhaust fan in the bathroom. These changes were assumed to represent high ventilation rates in the units. Measurement of ventilation rates Ventilation rates were determined using the tracer gas decay method. The ventilation rate was determined from the decay rate of CO2 introduced into the interior of the unit. The CO2 concentration was tracked and logged using QTrak IAQ monitors (QTrak) that were rented from Ashtead Technology Rentals, IL. Prior to determination of ventilation rates, the QTrak logging was initiated and the analyzer was placed on the entry step of the unit being tested to log the ambient CO2 concentration. After approximately 20 minutes, a 40-gallon garbage bag was filled with pure CO2 and carried into the trailer along with the QTrak. The QTrak was placed in the center of the unit and the trailer recirculation fan was turned on. The CO2 was released throughout the interior space by walking from back to front. Following release of the CO2, the THU was closed and the HVAC circulation fan continued to run for about 10 minutes at which time the power to the unit was turned off and all artificial mixing stopped. The trailer was left in this condition while the QTrak logged the decaying CO2 concentrations for several hours. Typically the QTrak was removed when the unit was entered to start an air sampling event or at the end of the day when sampling was completed. The ventilation rate is determined from the decay of the tracer gas concentration in the trailer. When using CO2 as a tracer gas, the background level can influence the decay rates. The equation for decay or clearance of the tracer gas from a trailer after elevating and mixing the CO2 tracer gas is (1)
where Ct (ppm) is the measured concentration in the unit at time t, C* is the maximum at the start of the stable decay period, Css
is the background or ambient concentration, and Q (h-1) is the rate constant for removal of the tracer from the system, which for a non-reactive chemical such as CO2 that does not significantly interact with surfaces, is the

6
ventilation rate in terms of air changes per hour, ACH (h-1). Equation 1 can be rearranged to the form
(2)
so the slope of the natural log of the difference between measured concentration and the ambient concentration against elapsed time is the –ACH as illustrated in Figure 1. Air sampling and analysis
Volatile organic compounds VOC samples were collected and analyzed following USEPA Method TO-17 (USEPA 199925). VOCs were collected onto multibed sorbent tubes (P/N 012347-005-00; Gerstel or equivalent) with primary bed of Tenax-TA® sorbent backed with a section of Carbosieve®. Prior to use, the sorbent tubes were conditioned by helium purge (>10 cc/min) at 275 ºC for 60 minutes and sealed in Teflon capped tubes. VOC samples were collected by connecting the sampling tube to a vacuum line inserted through a sample port in the trailer windows located in the center of the THU (typically in the dining or kitchen area) and elevated off the floor by about one meter. Outdoor samples were collected directly into the sorbent tube, which was shaded with an aluminum foil hood to reduce the possibility of photodegradation of sorbed chemicals. Calibrated personal sampler pumps (AirChek 52 Personal Sampling Pump, SKC, Eighty Four, PA) were used to pull air through the sorbent tubes. For most sampling events, approximately 6 liters were collected from the whole-trailers. Flows were verified using a separate calibrated flow meter prior to and following each sampling event. Sorbent tubes were sealed with Teflon lined caps after use and stored on artificial ice or in a freezer until analysis. Prior to analysis, each tube was spiked with a known amount of internal standard. The sorbent tubes were then thermally desorbed for analysis by gas chromatography/mass spectrometry (TD-GC/MS) using a thermodesorption auto-sampler (Model TDSA2; Gerstel), a thermodesorption oven (Model TDS3, Gerstel) and a cooled injection system (Model CIS4; Gerstel). The cooled injection system was fitted with a Tenax-packed glass liner (P/N 013247- 005-00; Gerstel). Desorption temperature was 25 ºC with a 0.5 minute delay followed by a 60 ºC ramp to 250 ºC and a 4 minute hold time. The cryogenic trap was held at -10 ºC and then heated within 0.2 minutes to 270 ºC at a rate of 12 ºC/s, followed by a 3-minute hold time. Compounds were resolved on a GC (Series 6890Plus; Agilent Technologies) equipped with a 30 meter HP-1701 14% Cyanopropyl Phenyl Methyl column (Model 19091U-233; Agilent Technologies) at an initial temperature of 1 ºC for 0.5 minutes then ramped to 40 ºC at 25 ºC/min, to 115 ºC at 3 ºC/min and finally to 250 ºC at 10 ºC/min holding for 10 minutes. The resolved analytes were detected using an electron impact MS system (5973; Agilent Technologies). The MS was operated in scan mode. One sample from each trailer was analyzed and all compounds over the detection limit (~ 1 to several ng) were identified by library search using the National Institute of Standards and Technology (NIST) spectral library followed by comparison to reference standards when available. Multipoint calibrations
7
were prepared from pure standards for 43 VOCs that were common indoor pollutants and/or elevated in one or more of the whole trailer samples. All pure standards and analytes were referenced to the internal standard (~120 ng 1-bromo-4-fluorobenzene).
Low Molecular Weight Aldehydes The target analytes in the aldehyde analysis included formaldehyde, acetaldehyde and acetone. Higher carbon-number aldehydes were quantified using the VOC method described above. Samples of these low molecular weight carbonyl compounds were collected and analyzed following ASTM Test Method D 5197-92 (ASTM, 1997). As with the VOCs, the air samples were drawn directly from the interior of the THU through the sample cartridge mounted on a vacuum line installed through sampling ports in the trailer windows. Samples were collected on commercially available silica gel cartridges coated with 2,4-dinitrophenyl-hydrazine (XPoSure Aldehyde Sampler; Waters corporation). An ozone scrubber (P/N WAT054420; Waters) was installed upstream of the silica cartridge in the field samples. Samples were collected from the trailers for 60 minutes using personal sampling pumps that were calibrated before use and checked before and after each use. Sample cartridges were capped and stored on blue ice or in the freezer until extraction. Cartridges were extracted with 2 mL of high-purity acetonitrile into 2 ml volumetric flasks and the eluent was brought to a final volume of 2 ml before analysis. Extracts were analyzed by high performance liquid chromatography (HPLC) (1200 Series; Agilent Technologies) using a C18 reverse phase column with 65:35 H2O:Acetonitrile mobile phase at 0.35 ml/minute and UV detection at 360 nm. Multipoint calibrations were prepared for the target aldehydes using commercially available hydrazone derivatives of formaldehyde, acetaldehyde and acetone.
Acetic Acid Acetic acid was collected in the same way as the carbonyl samples but collected on silica gel sorbent tubes (P/N 22655; SKC) and extracted using 5 mL of 18 mOhm deionized water, filtered through a 0.22 micron membrane. Samples were collected from the trailers for 60 minutes using personal sampling pumps that were calibrated before use and checked after use. Samples were stored in sealed plastic bags at -15°C until extraction and analysis. Extracts were analyzed by ion chromatography (IC) (ICS 2000; Dionex) equipped with an autosampler (AS40; Dionex), hydroxide ion generator (EluGen cartridge, P/N 058900; Dionex) and a conductivity detector. Samples were separated on an AS11 column (P/N 044076; Dionex) at a flow rate of 1.0 ml/min. The column was not heated. An injection loop of 25 µL was used to inject samples. A gradient of hydroxide ions was generated starting at 0.20 mM for 2.3 min. before increasing to 15.00 mM at 12.0 min, then to 35.00 mM at 15.0 min. A multipoint calibration ranging from 0.287 mg/L (of extract) to 52.363 mg/L was prepared from a 1.000g/L acetate ion chromatography standard (P/N 13669; Fluka) and was used to quantify the instrument response. The approximate instrumental limit of quantitation is 0.287 mg/L with a limit of detection of 0.05 mg/L. A typical calibration curve has a relative standard deviation of 4.53% and a coefficient of determination of 99.80%.

8
Quality Assurance All samples were quantified with multipoint calibration curves prepared from pure chemicals. For the VOCs that did not have pure standard available or that were a mixture of compounds (i.e., alkylbenzenes), the compounds were tentatively identified by National Institute of Standards and Testing (NIST) library spectrum search and quantified as toluene equivalent values. Analytical blanks were included in all analyses. Each sample pump was checked against a calibrated flow meter before and after the sampling event. Trip blanks were prepared, transported to the field site, stored and analyzed along with the whole trailer samples. Measurement of Whole Trailer Concentrations Air concentrations in the THUs were measured under pseudo steady-state conditions during the five days of sampling. The indoor conditions such as temperature and ventilation rates were varied in some trailer prior to sampling. The details are listed in Tables 2,3,4. Sampling was also carried out outside the THUs. The aldehyde samples were collected during mornings and afternoons, acetic acid samples were mostly collected in the mornings, and VOC samples were collected in the afternoons. Outdoor samples were collected mid-day at a location central to where the THUs were staged. Start and stop times of sampling were recorded for each sample along with flow rates. The temperature and relative humidity in the trailer during the sampling were logged using HOBO continuous data loggers. All samples, including two trip blanks for each sample type, were sealed and placed on ice for transport back to LBNL. Upon arrival at LBNL the samples were stored in a freezer until analysis. Concentrations were calculated as the ratio of the mass of analyte divided by the volume of the sample collected. Data Analysis The whole trailer emission rates normalized to floor area were calculated assuming that the THUs were at pseudo steady-state and interior of the space being measured was well mixed. The steady-state form of the mass balance equation for calculating area-specific emission rates under these conditions, ER, (µg m-2 h-1) is
(3)
where f (m3 h-1) is the ventilation flow rate, A (m2) is the floor area of the whole trailer, C (µg m-3) is the measured steady state concentration in the trailer and Coutdoors (µg m-3) is the outdoor concentration. Ventilation rate in terms of air-flow is not readily available for the whole trailer measurements so to estimate the floor area normalized emission rate we note that ACH is equal to the ventilation flow rate divided by the volume of the ventilated space (f V-1) and that V is the floor area multiplied by the height, h (m). We note also that the internal volume of the trailers, V, includes inaccessible volumes because of furniture and appliances. Based on careful assessment of one trailer, the effective internal volume was determined to be 13% lower than the internal volume calculated from the floor area and wall height. Combining this information with Eq.3, gives the floor area normalized emission rate in terms of the ACH as

9
/ 0.13 (4)
The formaldehyde emission rates were compared across trailers, the effect of temperature, relative humidity and air change rates were also characterized with the goal of estimating the relationship between changes in these environmental conditions and changes in the floor area normalized emission rates.
Multivariate Analysis A multivariate regression model was constructed on the log of the formaldehyde emission factors (logEFHCHO). The log of percent relative humidity, inverse of temperature (K-1), and the log of the inverse of the ACH were used as the independent variables. Based on the Arrhenius equation, an exponential relationship was assumed between temperature and emission factors in the regression model. A linear relationship was assumed between log of the relative humidity and log of emission factor. A classification variable was added for each different trailer manufacturer. The coefficients on inverse temperature, and log relative humidity and inverse air change rate with logEFHCHO were found to be statistically significant at the 95% confidence level (p<0.05), as shown in Table 5.
RESULTS AND DISCUSSION
Formaldehyde emissions Previously occupied THUs were used to study the influence of temperature, relative humidity, ventilation rates and trailer manufacturer, on the whole-trailer emission rates of formaldehyde under field conditions. Concentrations of VOCs, including formaldehyde, were measured in the tested THUs at different temperature, humidity and air change rates. A regression model was constructed on the log of the formaldehyde emission factors (logEFHCHO) using log of percent relative humidity, inverse of temperature (K-1), and the log of the inverse of the ACH as the independent variables. The inverse temperature coefficient calculated for the whole trailers under field conditions (-4050 K) is close to the range reported in an earlier study by Parthasarathy et al.31 using controlled emission chambers and formaldehyde emitting materials collected directly from other THUs. They also assumed an exponential relationship between emission factors and inverse temperature when testing the materials. They reported inverse temperature coefficients in the range of -6740 to -9940 (K) for the chamber derived material specific emission factors. Myers32 assumed an exponential relationship between formaldehyde concentration and inverse temperature, and reported that the inverse temperature coefficients fall in the range of -11120 to -5620 (K). Similar to findings by Myers32, the emission factors and concentration in the current study were found to be influenced by the variability of ventilation rates. Hence, an order of magnitude and sign comparison of the inverse temperature coefficient can be made between values reported by Myers32 and in the current regression analysis. The value

10
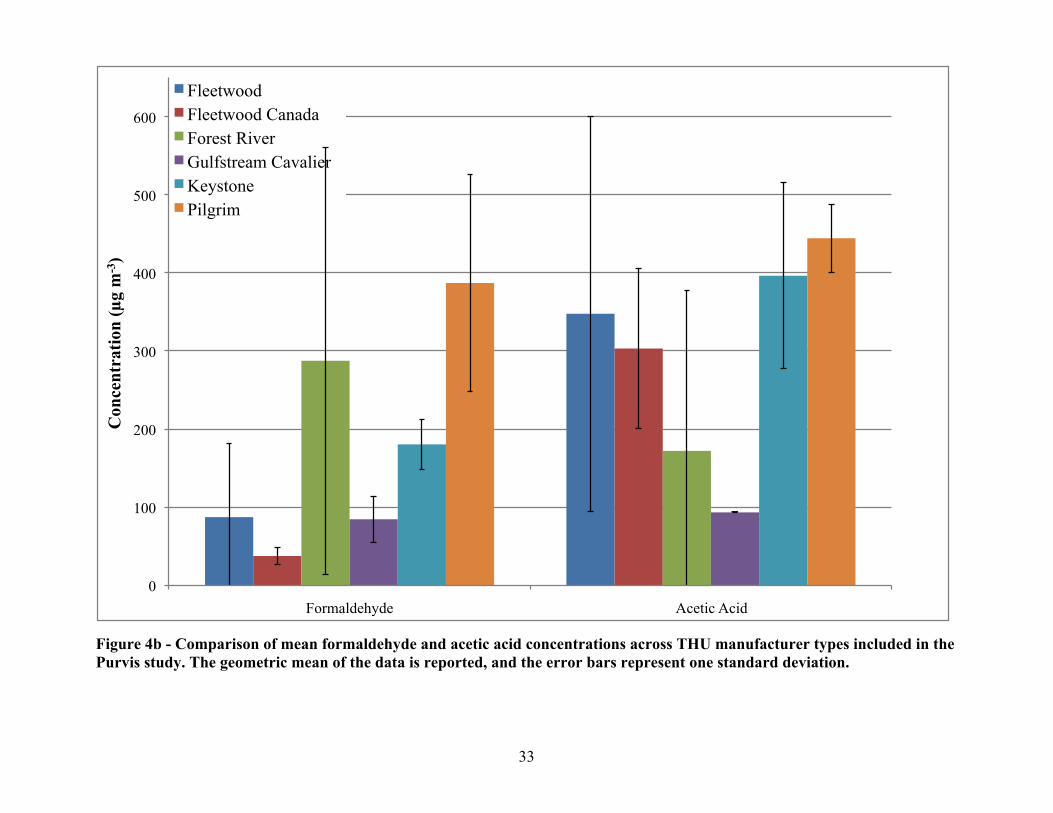
generated in the current regression analysis, was found to be slightly higher than the values reported by Myers32. Previous studies assumed a linear relationship, between concentration in an internal space with a formaldehyde source and β*RH, based on the Berge Equation, where β is the humidity coefficient, and RH is the relative humidity32. However, a direct comparison of the humidity coefficients generated in the current study with previous work that reported concentration is not possible. The experiments also provide much needed information on the wide variations in steady-state formaldehyde concentrations and emission factors across the six THU manufacturers. The average temperature during sampling in the trailers made by different manufacturers ranged from 21 – 23 ºC. The average relative humidity during sampling ranged from 57% - 67%, and the average ventilation rates during sampling ranged from 0.23 – 1.54 h-1. The highest formaldehyde concentration of 1000 µg-m-3 was sampled in a Forest River trailer, at 59% relative humidity, 30 ºC and a ventilation rate of 0.28 h-1. The lowest formaldehyde concentration of, 10 µg-m-3, was sampled in a Fleetwood Canada trailer, at 67% relative humidity, 16 ºC and a ventilation rate of 1.67 h-1. The mean concentration and emission factor of formaldehyde was found to be highest in trailers manufactured by Pilgrim, as seen in Figures 4a and 4b. In comparison, Maddalena et al.1,2 conducted sampling under similar conditions in new or newly renovated THUs made by four different manufacturers. The average temperature during sampling ranged from 24 – 27 ºC, and the average relative humidity ranged from 51% – 54%. The ventilation rates in the trailers were 0.15 - 0.39 h-1 and the units had been closed for at least a week prior to testing. The measured formaldehyde concentration in the THU manufactured by Pilgrim International was 220 µg-m-3 while the current study had an average concentration of 387 µg-m-3 for the same manufacturer. The Gulfstream Coach Cavalier trailer sampled by Maddalena et al.1,2 had an average concentration of 288 µg-m-3 and the average concentration in the Gulfstream Coach Cavalier trailers sampled in the current study is 84 µg-m-3. The earlier study also measured 310 µg-m-3 formaldehyde in a THU manufactured by Spirit of America Coachmen. The emissions factors measured in the current study in the Pilgrim International trailers (346 µg m-2 h-1) are comparable to those measured by Maddalena et al.1,2 previously. The average formaldehyde emission factor in the four trailers sampled by Maddalena et al.1,2 made by different manufacturers ranged from 380 µg m-2 h-1 in Pilgrim International THU to 760 µg m-2 h-1 in Spirit of America Coachmen THU. The Gulfstream Coach Cavalier trailer sampled by Maddalena et al.1,2 had an average emission factor of 700 µg m-2 h-1 but, in the current study the average emission factor in the Gulfstream Coach Cavalier trailers is 107 µg m-2 h-1. A possible reason for this difference in emission factors may be that the trailers had aged for an additional year since the Maddalena et al.1,2 study and many of the units tested in the current study had been stored with windows or scuppers in the open position. In addition to the temperature and RH effects, formaldehyde concentrations depend on the ventilation rate, area to volume loading ratio and the material specific or floor area

11
normalized emission factors. The highest formaldehyde emission factor of 1680 µg m-2 h-1 was sampled in a Forest River trailer, at 48% relative humidity, 29 ºC and a ventilation rate of 4.83 h-1. The lowest formaldehyde emission factor of 11 µg m-2 h-1 was sampled in a Fleetwood Canada trailer, at 69% relative humidity, 23 ºC and a ventilation rate of 0.25 h-1. This indicates that increasing ventilation rate does not proportionally decrease the concentration in a space because of changes in the emission rate. Across manufacturer types, the ratio of minimum to maximum average formaldehyde concentration was found to be 10, and the ratio of minimum to maximum average formaldehyde emission factor was found to be 20. This result shows that formaldehyde levels in THUs vary widely across the different trailer types, which further implies differences in personal exposures across the population living in the THUs. Maddalena et al.1,2 also measured VOC concentrations and evaluated whole trailer emission factors for 4 new FEMA THUs. Hodgson et al.3 reported VOC concentrations in 4 new manufactured homes and 7 site built homes. Hippelein4 measured VOC concentrations in 79 rooms in 39 homes in Germany, 27% of the rooms sampled were occupied by smokers. The geometric mean of concentrations from these studies was obtained and the values were converted to ppb using conversion factors reported by Hodgson and Levin37. The geometric mean VOC concentrations (ppb) was compared to values reported in the earlier studies listed (Figure 2a – c). The geometric mean formaldehyde concentration from the current study was found to be about 4 times lower than GM values reported by Maddalena et al.1,2. Maddalena et al.1,2 carried out sampling in 4 FEMA THUs 3-4 years old, and the current study carried out sampling in 16 FEMA THUs that are 4-5 years old. SEFA34 stated that formaldehyde emissions can drop by 25% within 6 months of manufacture, and by 50% over one year. Hence the lower concentrations in the currently sampled FEMA THUs may be attributable to the age of the trailers or difference in the aging conditions. The trailers tested in Maddalena et.al.1,2 had been recently refurbished while the units in the current study were previously occupied and tested as vacated. Most of the VOC concentrations in the current study were found to be lower than concentrations reported by Maddalena et al.1,2 previously. 2-ethyl 1-hexanol and toluene were present in slightly higher concentrations than observed in the Maddalena et al.1,2 study. However, the concentration of 2-ethyl 1-hexanol and toluene measured in both studies were well below their NIOSH RELs of 50 ppm and 100 ppm17 respectively. The age of the trailers may be a contributing factor to lower VOC concentrations observed in the current study compared to values reported in earlier literature. Park et al.33 showed that VOC emissions decreased over time in residences located in Japan which were monitored over 3 years. However, there is limited information in current literature on the effect of ageing of materials on VOC emissions. Emission data are not available in literature for some of the chemicals whose concentrations were measured in the current study. The concentrations of most of those chemicals (acetophenone, carbon tetrachloride, chloroform, dibutyl phthalate diethyl phthalate, and methylene chloride) were found to be lower than the median concentrations of other VOCs listed in Figures

12
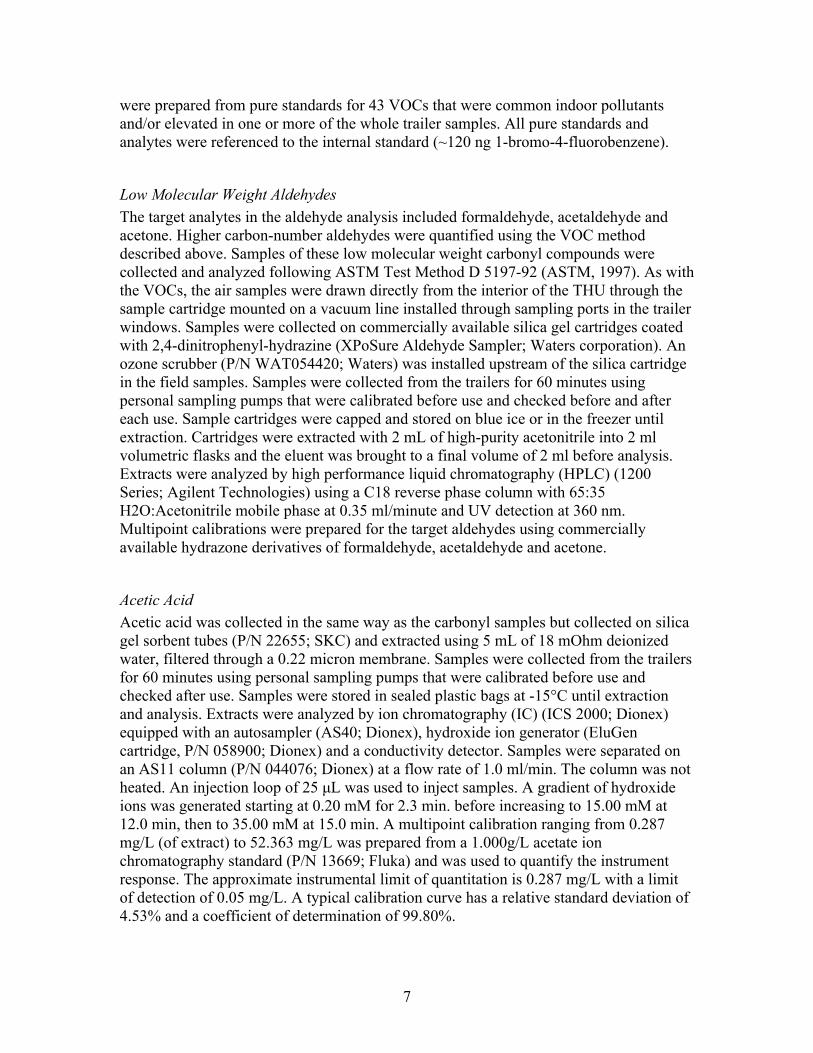
3a - c. The median acetone concentration was slightly higher than the 80th percentile of the VOC concentrations listed in Figures 3a - c. The acetone concentrations in the FEMA THUs were below the NIOSH REL for acetone of 250 ppm17. Hodgson et al.3 stated that carboxylic acids, less volatile aldehydes and aromatic hydrocarbons were most susceptible to olfactory perception. Acetic acid was found to exceed the odor threshold listed by Hodgson et al.37 by a large factor. However, the measured concentration of acetic acid did not exceed the levels that can cause sensory discomfort. The highest acetic acid concentration of 820 µg-m-3 was sampled in a Keystone trailer, and the lowest acetic acid concentration of 50 µg-m-3 was sampled in a Fleetwood Canada trailer. The mean concentration was highest in THUs made by Pilgrim International and the emission factor of acetic acid was found to be highest in THUs manufactured by Fleetwood, as seen in Figures 4a and 4b. In Figures 2a - c, the whole trailer emission factors of the VOCs were also compared to emission factors listed in Maddalena et al.1,2 and Hodgson et al.3 . Emission factors of alkanes (dodecane, hexadecane, pentadecane, tetradecane, tridecane), phenol, TMPB-MIB, d-limonene, hexanal and octanal were found to be higher than values reported by Maddalena et al.1,2 . The VOC emission factors for the current study remained lower, or negligibly higher than emission factors reported by Hodgson et al.3 for most VOCs except formaldehyde, phenol, and TMPB-DIB. As reported by Maddalena et al.1,2 vinyl flooring, where present, may have contributed to high TMPB-DIB emission factors. The concentrations and emission factors for most VOCs were seen to decrease when compared with values reported by Maddalena et al.1,2 previously. Numerous studies available (Park et al.33 and Wolkoff et al.38) report lower levels of VOC emissions in older homes compared to new houses. The decrease in source strength can be attributable to the ageing of the trailers sampled in the current study. Additionally, across manufacturer types, the ratio of minimum to maximum average VOC (excluding formaldehyde, acetic acid) concentration was found to be 2.7, and the ratio of minimum to maximum average VOC (excluding formaldehyde, acetic acid) emission factor was found to be 3.3. This highlights that VOC emissions from THUs made by different manufacturers can vary significantly. Additionally, the emission factors are concentrations in the current study were found to be lower when comparing across similar manufacturer types in Maddalena et al1,2. Across manufacturer types, the ratio of minimum to maximum average acetic acid concentration was found to be 5, and the ratio of minimum to maximum average acetic acid emission factor was found to be 5.
CONCLUSION
Whole trailer aldehyde and VOC emission factors were measured in sixteen FEMA THUs under field conditions. The influence of temperature, relative humidity and ventilation rates on whole trailer emission factors were studied along with differences in manufacturers. A multivariate regression model was built using log of percentage relative humidity (log RH), inverse of temperature (in K-1), and inverse log ACH as

13
continuous predictor variables, trailer manufacturer as a categorical predictor variable and log of emission factors as the target variable. The coefficients of inverse temperature, log inverse relative humidity, log inverse ACH with log emission factor were found to be statistically significant for all the samples at p<0.05. The variation in formaldehyde concentrations and emission factor across various manufacturers is also highlighted in this study. The results emphasize the need to incorporate the influence of environmental factors and manufacturer type during formaldehyde exposure assessment studies. Large diurnal variations in temperature and humidity can significantly change the formaldehyde emission rates. Other VOC emissions were also studied and compared to values reported in literature. Except for TMPB-DIB and acetic acid, VOC emissions were mostly found to be lower than values reported in previous studies. The formaldehyde measurement results from this study can be incorporated into an exposure and risk assessment of occupants of the THUs.
ACKNOWLEDGEMENTS
This work was supported by interagency agreement 08FED894632 by the National Center for Environmental Health (NCEH) of the Centers for Disease Control and Prevention (CDC) and the Assistant Secretary for Energy Efficiency and Renewable Energy, Office of Building Technology, State, and Community Programs of the U.S. Department of Energy (DOE) under Contract DE-AC02-05CH11231. The authors would like to thank Agnes Lobscheid and Henry Willem for their reviews of this paper.

14
REFERENCES
1. Maddalena, R.; Russell, M.; Sullivan, D.P.; Apte, M.G. Aldehyde and Other Volatile Organic Chemical Emissions in Four FEMA Temporary Housing units. Report LBNL-254E. 2008.
2. Maddalena, R.; Russell, M.; Sullivan, D.P.; Apte, M.G. Formaldehyde and Other Volatile Organic Chemical Emissions in Four FEMA Temporary Housing Units. Environmental Science and Technology. 2009,43,No.15, pp 5626-5632.
3. Hodgson, A.T., Rudd, A.F., Beal, D. and Chandra, S. Volatile Organic Compound Concentrations and Emission Rates in New Manufactured and Site-Built Houses. Indoor Air. 2000. 10, 178-192.
4. Hippelein, M. Background concentrations of individual and total volatile organic compounds in residential indoor air of Schleswig-Holstein, Germany. J. Environ. Monit. 2004. Vol. 6, 745-752.
5. Sierra Club. Toxic Trailers: Tests Reveal High Formaldehyde Levels in FEMA Trailers. April 2008. http://www.sierraclub.org/ (accessed October 2009).
6. Centers for Disease Control and Prevention. Final Report on Formaldehyde Levels in FEMA-Supplied Trailers, Park Models, and Mobile Homes. 2008. www.cdc.gov/nceh/ehhe/trailerstudy/ (accessed October 2009).
7. Agency for Toxic Substances and Disease Registry. Toxicological Profile for Formaldehyde. Public Health Service, U.S. Department of Health and Human Services, Atlanta, GA, 1999.
8. Andersen I.; Molhave L. Controlled human studies with formaldehyde. In: Gibson JE, Editor. Formaldehyde toxicity. Washington, DC: Hemisphere Publishing Corporation, 154‐165. 1983.
9. Bender, J.R.; Mullin, L.S.; Graepel, G.J.; Wilson, W.E.; 1983. Eye irritation response of humans to formaldehyde. American Industrial Hygiene Association Journal. 1983, 44, No. 6, pp 463‐465.
10. Main, D.M.; Hogan, T.J. Health effects of low-level exposure to formaldehyde. Journal of Occupational Medicine. 1983, 25(12), pp 896–900.
11. Holness, D.L.; Nethercott, J.R. Health status of funeral workers exposed to formaldehyde. Archives of Environmental Health. 1989, 44(4), pp 222-228.
12. Alexandersson, R.; Hedenstierna, G. Pulmonary function in wood workers exposed to formaldehyde: A prospective study. Archives of Environmental Health. 1989, 44, pp 5-11.
13. Kerns, W.D.; Pavkov, K.L.; Donofrio, D.J.; Gralla, E.J.; Swenberg, J.A. Carcinogenicity of formaldehyde in rats and mice after long-term exposure. Cancer Research. 1983, 43, pp 4382-4391.
14. Albert, R.E.; Sellakumar, A.R.; Laskin, S.; Kirschner, M.; Nelson, N.; Snyder, C.A. Nasal cancer in the rat induced by gaseous formaldehyde and hydrogen chloride. Journal of National Cancer Insititute. 1982, 68, pp 597–603.
15. Olsen, J.H.; Jensen, S.P.; Hink, M.; Faurbo, K.; Breum, N.O.; Jensen, O.M. Occupational formaldehyde exposure and increased nasal cancer risk in man. International Journal of Cancer. 2006, 34, 5, pp 639-644.
16. Freeman, L.E.B.; Blair, A.; Lubin, J.H.; Stewart, P.A.; Hayes, R.B.; Hoover, R.N.; Hauptmann, M. Mortality from lymphohematopoietic malignancies among

15
workers in formaldehyde industries. Journal of the National Cancer Institute. 2009, 101(10), pp 751–761.
17. National Institute for Occupational Safety and Health. NIOSH Pocket Guide to Chemical Hazards and Other Databases. Publication Number : NIOSH 2005-149. Department of Health and Human Services. Center for Disease Control and Prevention, National Institute for Occupational Safety and Health. Cincinnati, OH, 2005.
18. National Institute for Occupational Safety and Health. NIOSH Pocket Guide to Chemical Hazards and Other Databases. Appendix A – NIOSH Potential Occupational Carcinogens. Publication Number : NIOSH 2005-149 Department of Health and Human Services. Center for Disease Control and Prevention, National Institute for Occupational Safety and Health. Cincinnati, OH, 2005.
19. Hileman, B,. Formaldehyde. How did EPA develop its formaldehyde policy?. Environmental Science & Technology. 1982. Vol. 16 No.19, pp.543A-7A.
20. CPSC. CPSC Bans Urea Formaldehyde Foam Insulation (UFFI), Consumer Product Safety Commission NEWS from CPSC, Release No. 82-005, March 1982.
21. CPSC. Ban on UFFI Lifted. Consumer Product Safety Commission, NEWS from CPSC, Release No. 83-048. 1983.
22. Turner S., Martin C., Hetes R., and Northeim C. Project Summary -Sources and Factors Affecting Indoor Emissions from Engineered Wood Products: Summary and Evaluation of Current Literature, United States Environmental Protection Laboratory Agency, National Research Risk Management, Research Triangle Park NC 27711 EPA/600/SR-96/067. 1996.
23. HUD. Manufactured Home Construction And Safety Standards, --Housing and Urban Development Office of Assistant Secretary For Housing--Federal Housing Commissioner, Department Of Housing And Urban Development, Washington DC. 2006. CFR 24 Chapter XX-Parts 3280.308 and 3280.407.
24. ASTM. Standard Test Method for Determining Formaldehyde Concentrations in Air and Emission Rates from Wood Products Using a Large Chamber, ASTM Test Method E 1333-96. 2002.
25. Azuma K., Uchiyama I. Ikeda K. The risk management for indoor air pollution caused by formaldehyde in housing: The historical perspectives on early warnings and actions. Facilitie. 2006., Vol. 24 No. 11/12, pp. 420-429.
26. Hawthorne, A.R., Matthews, T.G. Models for estimating organic emissions from building materials: Formaldehyde example. Atmospheric Environment. 1987, 21, No.2, pp 419-424.
27. Schwarzenbach, R.P., Gschwend, P.M., Imboden, D.M.. Environmental Organic Chemistry. Wiley & Sons. New York. 1993.
28. Zhang, Z., Luo, X., Wang, X., Q, K., Zhao, R. Influence of temperature on formaldehyde emission parameters of dry building materials. Atmospheric Environment. 2007, 41, pp 3203-3216.

16
29. Anderson, I., Lundqvist, G.R., Molhave, L. Indoor air pollution due to chipboard used as a construction material. Atmospheric Environment. 1975, 9, pp 1121-1127.
30. Van Netten, C., Shirtliffe, C., Svec, J. Temperature and humidity dependence of formaldehyde release from selected building materials. Bulletin of Environmental Contamination and Toxicology. 1989, 42, pp 558-565.
31. Parthasarathy, S., Maddalena, R.; Russell, M.; Apte, M.G. Effect of temperature and humidity on formaldehyde emissions in temporary housing units. Report LBNL- 3547E. 2010.
32. Myers, G.E. The effects of temperature and humidity on formaldehyde emission from UF-bonded boards: a literature critique. Forest Products Journal. 1985, 35, pp 20-31.
33. Park, J., Ikeda, K,. Variations of formaldehyde and VOC levels during 3 years in new and older homes. Indoor Air. 2006, 42, pp 129-135.
34. Withee, D., (formerly of Case Systems Inc., the Scientific Equipment and Furniture Association, Garden City, NY). Formaldehyde Emissions and Particle Board Core Products. 2008. http://www.sefalabs.com/i4a/pages/index.cfm?pageID=3394 (accessed May 2010).
35. Matthews T.G. Modeling and Testing of Formaldehyde Emission Characteristics of Pressed-Wood Products: Report XVIII to the U.S. Consumer Product Safety Commission, Oak Ridge National Laboratory, Oak Ridge TN. ORNL/TM-9867. 1985.
36. U.S Environmental Protection Agency. Compendium of Methods for the Determination of Toxic Organic Compounds in Ambient Air. Center for Environmental Research Information, Office of Research and Development U.S Environmental Protection Agency, OH, 1999.
37. Hodgson, A.T., Levin, H,. Volatile Organic Compounds in Indoor Air: A Review of Concentrations Measured in North America Since 1990. Report LBNL-51715. 2003.
38. Wolkoff, P., Clausen, P.A., Neilsen, P.A., Molhave, L. The Danish Twin Apartment Study; Part I: Formaldehyde and Long-Term VOC Measurements. Indoor Air. 2004, Volume 1, Issue 4, pp 478-490.

17
TABLES
Table 1 - Trailer details
Trailer Name Manufacturer Area (m2)
Volume (m3)
Year of manufacture
Fleetwood 1 Fleetwood 22 43 2005 Fleetwood 2 Fleetwood 22 43 2005 Fleetwood 3 Fleetwood 21 42 2005 Fleetwood Canada 1 Fleetwood 21 42 2005 Fleetwood Canada 2 Fleetwood 21 42 2005 Fleetwood Canada 3 Fleetwood 21 42 2005 Forest River 1 Forest River 21 41 a
Forest River 2 Forest River 21 41 2005 Forest River 3 Forest River 21 41 2005 Gulfstream Cavalier 1 Gulfstream 22 43 2005 Gulfstream Cavalier 2 Gulfstream 22 43 a
Keystone 1 Keystone 21 41 2004 Keystone 2 Keystone 21 41 2004 Keystone 3 Keystone 21 41 2004 Pilgrim 1 Pilgrim 22 43 2005 Pilgrim 2 Pilgrim 22 43 2005
aAlthough the manufacturer’s plate on these THUs was not readable, the likely year of manufacture was 2005.

18
Table 2 - Steady state concentrations and floor area normalized emission factors of formaldehyde, acetaldehyde and acetone
Concentration Emission Factor (µg m-3) (µg m-2 h-1)
Day/time of sampling
Trailer Name
HCHO1 Acyd1 Aton1 HCHO1 Acyd1 Aton1
Temp (ºC)
RH (%)
VR (h-1)
5/19/09 AM FW 1 44 2.9 16 30 2.1 11 17 74 0.41 5/19/09 PM FW 1 110 6.1 18 74 4.3 12 25 63 0.41* 5/19/09 AM FW 2 50 5.2 16 160 16 50 16 68 1.8 5/19/09 PM FW 2 160 11 22 510 33 70 27 55 1.8* 5/21/09 AM FW 3 64 21 92 17 5.4 24 22 69 0.15* 5/21/09 PM FW 3 100 26 84 26 6.7 22 27 67 0.15 5/18/09 AM FWCA 1 34 6.6 26 12 2.3 9 14 65 0.20* 5/18/09 PM FWCA 1 87 13 35 30 4.3 12 23 66 0.20 5/20/09 AM FWCA 2 13 2.1 4 30 5 9 19 61 1.4* 5/20/09 PM FWCA 2 29 4.2 5 68 9.9 11 29 56 1.4 5/21/09 AM FWCA 3 26 2.2 20 11 0.9 8 23 69 0.25 5/21/09 PM FWCA 3 35 8.3 21 15 3.5 9 27 67 0.25* 5/18/09 AM FR 1 97 3 12 350 11 45 14 66 2.1* 5/18/09 PM FR 1 250 5.7 17 900 21 62 23 65 2.1* 5/19/09 PM FR 1v 180 2.6 7 660 9.3 26 25 51 2.1 5/20/09 PM FR 1v 200 2.2 4 1700 19 33 29 48 4.8 5/20/09 AM FR 2 360 6.7 19 170 3.2 9 19 61 0.28* 5/20/09 PM FR 2 1000 9.8 21 480 4.6 10 30 59 0.28 5/21/09 AM FR 3 79 1.9 21 40 1 11 22 72 0.30 5/21/09 PM FR 3 130 3.9 21 67 2 11 26 71 0.30* 5/18/09 AM GC 1 32 0.3 14 26 0.3 11 14 67 0.48 5/18/09 PM GC 1 87 1.4 18 72 1.1 15 22 68 0.48* 5/19/09 PM GC 1v 77 0.8 9 170 1.7 20 24 54 1.3* 5/20/09 PM GC 1t 52 0.3 4 110 0.6 8 23 54 1.2* 5/21/09 PM GC 1 56 0.4 5 140 1 13 22 66 1.4* 5/18/09 AM GC 2 94 2.5 20 44 1.2 9 14 66 0.27 5/18/09 PM GC 2 200 6.1 19 93 2.8 9 21 67 0.27* 5/19/09 PM GC 2v 110 0.4 5 59 0.2 3 23 54 0.32 5/20/09 PM GC 2t 66 0.3 3 150 0.7 7 22 54 1.4* 5/21/09 AM GC 2 73 0.4 5 200 1.2 13 21 62 1.6* 5/18/09 AM KS 1 120 4.8 13 62 2.4 7 14 63 0.3* 5/18/09 PM KS 1 400 8.1 22 200 4.1 11 23 63 0.3 5/20/09 AM KS 2 59 3.3 26 19 1.1 8 19 67 0.19* 5/20/09 PM KS 2 170 8.5 33 55 2.8 11 28 66 0.19 5/21/09 AM KS 3 150 2.6 37 48 0.8 12 22 72 0.19 5/21/09 PM KS 3 190 3.7 32 60 1.2 10 26 70 0.19* 5/18/09 AM PI 1 190 6.9 17 79 2.9 7 14 62 0.25 5/18/09 AM PI 1 510 9.8 22 220 4.1 9 24 59 0.25* 5/19/09 PM PI 1t 270 3.4 8 430 5.4 13 16 49 0.94 5/20/09 PM PI 1t 860 13 23 610 9.3 16 33 41 0.41 5/21/09 PM PI 1** 560 9.7 21 800 14 30 28 56 0.83 5/19/09 AM PI 2 84 2 16 74 1.7 14 16 71 0.51* 5/19/09 PM PI 2 250 4.5 11 220 3.9 9 27 59 0.51 Notes: FW = Fleetwood; FWCA = Fleetwood Canada; FR = Forest River; GS = Gulfstream
Cavalier; KS = Keystone; PI = Pilgrim Temp = Temperature; RH = Relative Humidity; VR= Ventilation Rate t – Special temperature experiment was carried out during
sampling. v – Special ventilation rate experiment was carried out during sampling. *- Ventilation rate was measured shortly before/after sample collection. The ventilation rate was assumed to be similar in each individual trailer.
** - Three samples were collected in the kitchen, bedroom and bunk area of Pilgrim 1 on 5/21/2009. The average concentration and emission factors are reported. 1HCHO = formaldehyde; Acyd = acetaldehyde; Aton = acetone

19
Table 3 - Steady state concentrations and floor area normalized emission factors of acetic acid. Temp RH VR Trailer
Name Concentration
(µg m-3) Emission Factor
(µg m-2 h-1)
(oC) (%) (h-1) Acetic Acid Acetic Acid
5/19/09 AM FW 1 210 170 17 74 0.20* 5/19/09 AM FW 2 290 1000 16 68 1.4* 5/21/09 AM FW 3 550 160 22 69 0.25 5/18/09 AM FWCA 1 710 280 14 70 2.1* 5/20/09 AM FWCA 2 160 430 19 61 0.28* 5/21/09 AM FWCA 3 46 22 23 69 0.3 5/18/09 AM FR 1 190 800 14 70 0.41 5/20/09 AM FR 2 250 140 19 61 1.8 5/21/09 AM FR 3 80 47 22 72 0.15* 5/18/09 AM GS 1 93 89 13 74 0.48 5/18/09 AM KS 1 820 480 14 67 0.30* 5/20/09 AM KS 2 140 52 19 67 0.19* 5/21/09 AM KS 3 230 86 22 72 0.19 5/18/09 AM PI 1 680 330 13 67 0.25 5/19/09 AM PI 2 210 210 16 71 0.51*
Notes: FW = Fleetwood; FWCA = Fleetwood Canada; FR = Forest River; GS = Gulfstream Cavalier; KS = Keystone; PI = Pilgrim Temp = Temperature; RH = Relative Humidity; VR= Ventilation Rate *- Ventilation rate was not measured while collecting the sample. The ventilation rate was assumed to be similar in each individual trailer.

20
Table 4a - Steady state concentrations of other VOCs (Day in May 2009) Trailer Name FW 1 FW 2 FW 3 FWCA 1 FWCA 2 FWCA 3 FR 1v FR 2 FR 3
Day/Time 19/AM 19/PM 21/PM 18/PM 20/PM 21/PM 20/PM 20/PM 21/PM VOC Measured VOC Concentration (µg m-3)
2-ethyl,1-hexanol 8.9 12 9.8 6.3 2.1 11 1 8.3 6.4 Phenol 15 32 8.6 23 4.2 2.3 2.7 34 1.4
n-hexanal 14 26 97 28 4 18 4.7 29 13 benzaldehyde 0.88 1.6 6.2 2.9 0 0 0 4.1 0
n-octanal 3.3 6 11 4.3 1.7 3 1.3 8.9 2.4 n –nonanal 4.1 8.8 7.3 6.7 3.5 4.8 2.3 6.9 4.9 n-hexane 34 0 4 0 9.3 7.2 1.9 0.34 0.29 Dodecane 0.18 0.48 0.82 0.04 2.1 0.35 0.19 Tridecane 7.5 27 3.1 0.92
Tetradecane 8.6 36 58 40 8.6 4 0.12 2.3 1.2 pentadecane 2.2 6.5 12 12 4.7 1.5 0.34 3.5 0.27 Hexadecane 1.2 2.6 1.9 2.5 1.7 0.25 0.48 3 0.2
Styrene 2.2 2.5 8.8 3.6 0.08 2.4 0.08 3 1 Benzene 0 0 0.93 0 0 0 0.05 0 0 Toluene 4.4 0.69 3.8 3.7 2.2 5.6 0.94 2.8 0.65
m/p-xylene 0.29 0.25 0.56 0.13 0.1 0.05 0.1 0.35 0.19 o-xylene 0.19 0.1 0.03
TMPD-MIB 13 19 0.47 0.44 0.47 0.33 1.7 21 1.4 TMPD-DIB 57 54 3.6 5.5 5.6 4.5 46 51 46
diethyl phthalate 0.09 0.22 0.05 0.06 0.17 0.38 0.03 0.11 0.03 dibutyl phthalate 3.9 7.1 0 0.04 0.03 0.02 0.03 0.03 0
methylene chloride 101 0 0.42 0 26 12 3.6 0 5.7 carbon tetrachloride 0 0 0 0 0 0 0 0 0
Chloroform 0.09 0 0.06 0 0.08 0 0.05 0.01 0.03 acetophenone 0 0.84 0 0 0 0 0 0 0 α-pinene 2.4 3.8 3.8 13 29 β-pinene 2 2.2 19 20 0.59 9.8 1.7 16 3.2 3-carene 6.5 5.4 5.3 8.5 0.58 3.7 0.42 10 1.5
d-limonene 2.3 2.8 8.7 21 0.22 8 0.58 15 4.4 Notes: FW = Fleetwood; FWCA = Fleetwood Canada; FR = Forest River; GS = Gulfstream Cavalier; KS = Keystone; PI = Pilgrim
t – Special temperature experiment was carried out during sampling. v – Special ventilation rate experiment was carried out during sampling.

21
Table 4a - Steady state concentrations of other VOCs (Day in May 2009, Continued )
Notes: FW = Fleetwood; FWCA = Fleetwood Canada; FR = Forest River; GS = Gulfstream Cavalier; KS = Keystone; PI = Pilgrim t – Special temperature experiment was carried out during sampling. v – Special ventilation rate experiment was carried out during sampling.
Trailer Name GC 1 GC 1v GC 1t GC 2 GC 2 GC 2v GC 2t KS 1 KS 2 KS 3 PI 1t PI 1t PI 1 PI 2 Day1/Time 21/AM 19/PM 20/PM 21/AM 18/PM 19/PM 20/PM 18/PM 20/PM 21/PM 19/PM 20/PM 21/PM 19/PM
VOC Measured VOC Concentration (µg m-3) 2-ethyl,1-hexanol 2 4.7 3.2 1.9 12 2.7 1.8 13 38 13 4.3 21 14 6.7
phenol 0 0.89 0 4 15 3.6 1.6 15 23 3.4 4.3 27 21 7.2 n-hexanal 2.1 4.7 2.7 2.7 24 5.1 2 25 18 31 6.7 30 25 20
benzaldehyde 0 0.38 0 0 1.7 0.37 0 3.2 1.2 0.46 0.12 1.4 0.99 0.45 n-octanal 1.4 3.3 2.5 1.7 4.5 1.6 1.5 4.6 5.4 5.2 1.2 5.5 4.8 3.5
n -nonanal 2.5 4.9 2.9 3.6 11 3.3 2.1 4.3 4.6 5.3 4.3 11 11 7.9 n-hexane 61 0 4.8 0.43 0 0 0 0 0.43 0.07 0.15 1 0.19 0 dodecane 0.1 0.02 0.14 0.26 1.2 7.1 5.4 0.18 tridecane 6 1.7 10 70 44 3.3
tetradecane 0.03 0.22 0.07 0.15 0.58 0.19 0.19 0.78 65 24 9.2 51 35 2.8 pentadecane 0.2 0.47 0.22 0.29 1.1 0.32 0.18 1.5 43 4.7 1.1 7.5 5 1.3 hexadecane 0.19 0.43 0.26 0.3 1.1 0.32 0.2 1.3 13 0.65 0.41 3.2 2 0.7
styrene 0.01 0.55 0.14 0 0.73 0.14 0.03 0.76 2.2 1.7 0.12 1.3 0.8 1.1 benzene 0 0 0 0 0 0 0 0 0.12 0.24 0 0 0 0 toluene 3.2 0 1.4 0 0.45 0 0 0.23 2.4 1.8 1.2 0.98 0.17 0.25
m/p-xylene 0 0.02 0.01 0 0.06 0 0 0.08 0.32 0.24 0.1 0.27 0.16 0.15 o-xylene 0.03 0.17 0.04
TMPD-MIB 6.4 16 8.9 6.7 30 11 6.5 18 32 0.64 1.7 9.6 6.7 7.6 TMPD-DIB 54 54 53 48 44 58 43 47 53 2.6 6.6 30 34 56
diethyl phthalate 0.21 0.5 0.33 0.07 0.18 0.05 0.03 0.12 2.2 0 0.04 0.25 0.17 0.12 dibutyl phthalate 0.02 0.02 0.02 0.02 0.03 0.01 0.02 0.04 0.08 0 0.01 0.07 0.06 0.01
methylene chloride 0 14 0 0 0 0 0 3.6 0 1.5 0.88 1.2 0 carbon
tetrachloride 0.38 0.12 0 0.42 0.07 0 0 0 0 0.73 0 0 0.48 0 chloroform 0.24 0 0.07 0 0 0 0 0 0 0 0 0.02 0.01 0
acetophenone 0 0 0 0 0.28 0 0 0.19 3.1 0 0 0 0 0 α-pinene 4 11 4.3 5.5 36 5.3 4.3 39 60 131 8.2 68 51 41 β-pinene 0.62 1.5 0.68 0.71 4.1 0.69 0.6 3.2 7.8 9.3 1.3 6.6 5.2 3.4 3-carene 0.43 1.3 0.54 0.69 7.6 1 0.61 3.6 7.8 4.2 0.58 3.5 2.6 2.5
d-limonene 0.27 0.7 0.24 0.32 5.7 0.41 0.21 4.3 8.8 10 0.53 4.1 3 4.9

22
Table 4b - Floor area normalized emission factors of other VOCs (Day in May 2009) Trailer Name FW 1 FW 2 FW 3 FWCA 1 FWCA 2 FWCA 3 FR 1v FR 2 FR 3
Day1/Time 19/AM 19/PM 21/PM 18/PM 20/PM 21/PM 20/PM 20/PM 21/PM VOC Measured VOC Emission Factor (µg m-2 h-1)
2-ethyl,1-hexanol 6.2 37 2.5 2.2 5 4.6 8.5 4 3.3 phenol 10 102 2.2 7.9 9.8 0.97 23 16 0.71
n-hexanal 10 83 25 9.8 9.4 7.4 39 14 6.6 benzaldehyde 0.62 4.9 1.6 1 0 0 0 2 0
n-octanal 2.3 19 2.8 1.5 4.1 1.3 11 4.2 1.2 n -nonanal 2.8 28 1.9 2.3 8.3 2 19 3.3 2.5 n-hexane 24 0 1 0 22 3 15 0.16 0.15 dodecane 0.13 1.5 0.21 0.1 0.9 0.16 0.1 tridecane 5.3 84 0.81 0.47
tetradecane 6 114 15 14 20 1.7 0.96 1.1 0.64 pentadecane 1.6 20 3.2 4 11 0.64 2.9 1.7 0.14 hexadecane 0.87 8.2 0.5 0.86 3.9 0.11 4 1.4 0.1
styrene 1.5 7.8 2.3 1.2 0.18 1 0.63 1.4 0.51 benzene 0 0 0.24 0 0 0 0.43 0 0 toluene 3.1 2.2 0.98 1.3 5.1 2.4 7.8 1.3 0.33
m/p-xylene 0.2 0.79 0.15 0.05 0.25 0.02 0.82 0.16 0.09 o-xylene 0.13 0.3 0.06
TMPD-MIB 8.9 61 0.12 0.15 1.1 0.14 14 9.9 0.73 TMPD-DIB 40 28 29 1.9 13 1.9 380 24 24
diethyl phthalate 0.06 0.68 0.01 0.02 0.39 0.16 0.23 0.05 0.01 dibutyl phthalate 2.7 22 0 0.01 0.06 0.01 0.26 0.01 0
methylene chloride 71 0 0.11 0 61 4.9 30 0 2.9 carbon tetrachloride 0 0 0 0 0 0 0 0 0
chloroform 0.06 0 0.02 0 0.2 0 0.4 0.01 0.01 acetophenone 0 2.7 0 0 0 0 0 0 0 α-pinene 1.7 12 9 106 15 β-pinene 1.4 7 4.8 7.1 1.4 4.1 14 7.8 1.6 3-carene 4.5 17 1.4 2.9 1.4 1.5 3.5 4.9 0.79
d-limonene 1.6 9 2.3 7.1 0.52 3.4 4.8 7 2.3 Notes: FW = Fleetwood; FWCA = Fleetwood Canada; FR = Forest River; GS = Gulfstream Cavalier; KS = Keystone; PI = Pilgrim
t – Special temperature experiment was carried out during sampling. v – Special ventilation rate experiment was carried out during sampling.

23
Table 4b - Floor area normalized emission factors of other VOCs (Day in May 2009, Continued )
Notes: FW = Fleetwood; FWCA = Fleetwood Canada; FR = Forest River; GS = Gulfstream Cavalier; KS = Keystone; PI = Pilgrim t – Special temperature experiment was carried out during sampling. v – Special ventilation rate experiment was carried out during sampling.
Trailer Name GC 1 GC 1v GC 1t GC 2 GC 2 GC 2v GC 2t KS 1 KS 2 KS 3 PI 1t PI 1t PI 1 PI 2 Day1/Time 21/AM 19/PM 20/PM 21/AM 18/PM 19/PM 20/PM 18/PM 20/PM 21/PM 19/PM 20/PM 21/PM 19/PM
VOC Measured VOC Emission Factor (µg m-2 h-1) 2-ethyl,1-hexanol 4.8 10 6.6 5.2 5.8 1.5 4.1 6.8 12 4.3 7 15 20 5.8
phenol 0 1.9 0 11 6.8 2 3.7 7.9 7.4 1.1 6.9 19 29 6.4 n-hexanal 5.3 10 5.6 7.4 11 2.8 4.7 13 5.8 10 11 21 36 18
benzaldehyde 0 0.83 0 0 0.78 0.2 0 1.6 0.38 0.15 0.19 1 1.4 0.4 n-octanal 3.4 7.2 5.1 4.8 2.1 0.88 3.6 2.3 1.7 1.7 1.9 3.9 6.8 3.1
n -nonanal 6.1 11 6 10 5 1.8 5 2.2 1.5 1.7 6.9 7.7 16 6.9 n-hexane 149 0 9.9 1.2 0 0 0 0 0.14 0.02 0.23 0.75 0.27 0 dodecane 0.23 0.05 0.07 0.09 1.9 5.1 7.8 0.16 tridecane 1.9 0.55 16 50 63 2.9
tetradecane 0.07 0.48 0.14 0.42 0.27 0.11 0.44 0.4 21 7.7 15 37 51 2.4 pentadecane 0.49 1 0.46 0.82 0.54 0.18 0.41 0.78 14 1.5 1.7 5.4 7.2 1.1 hexadecane 0.46 0.94 0.54 0.84 0.51 0.17 0.47 0.67 4.2 0.21 0.67 2.3 2.9 0.62
styrene 0.02 1.2 0.29 0 0.34 0.08 0.07 0.39 0.72 0.54 0.19 0.96 1.1 0.93 benzene 0 0 0 0 0 0 0 0 0.04 0.08 0 0 0 0 toluene 7.8 0 3 0 0.21 0 0 0.12 0.77 0.58 2 0.7 0.24 0.22
m/p-xylene 0 0.05 0.02 0 0.03 0 0 0.04 0.1 0.08 0.16 0.19 0.23 0.13 o-xylene 0.08 0.41 0.07
TMPD-MIB 16 35 19 19 14 6 15 9.5 10 0.21 2.7 6.9 9.6 6.6 TMPD-DIB 130 120 110 130 21 32 100 24 17 0.84 11 21 48 49
diethyl phthalate 0.53 1.1 0.69 0.2 0.08 0.03 0.07 0.06 0.7 0 0.06 0.18 0.25 0.1 dibutyl phthalate 0.05 0.04 0.04 0.06 0.01 0.01 0.05 0.02 0.03 0 0.01 0.05 0.09 0.01
methylene chloride 0 28 0 0 0 0 0 1.2 0 2.4 0.63 1.8 0 carbon tetrachloride 0.93 0.26 0 1.2 0.03 0 0 0 0 0.24 0 0 0.69 0
chloroform 0.59 0 0.14 0 0 0 0 0 0 0 0 0.02 0.02 0 acetophenone 0 0 0 0 0.13 0 0 0.1 1 0 0 0 0 0 α-pinene 9.9 23 9 15 17 2.9 10 20 19 43 13 49 73 36 β-pinene 1.5 3.2 1.4 2 1.9 0.38 1.4 1.6 2.5 3 2.2 4.7 7.4 3 3-carene 1.1 2.8 1.1 1.9 3.5 0.57 1.4 1.9 2.5 1.4 0.93 2.5 3.7 2.2
d-limonene 0.67 1.5 0.5 0.89 2.7 0.23 0.5 2.2 2.9 3.3 0.85 2.9 4.2 4.3

24
Table 5 - Multivariate Regression Modeling Results Confidence limits1 Regression statistics
Coefficients Upper Lower R2 p
Intercept 28.7 38.4 19.0 8.7E-07 Inverse Temperature Coefficient (K) -4050 -780 -7310 1.7E-02 Log RH Coefficient (log RH-1) -2.2 -0.40 -4.0 1.8E-02 Log Inverse Air Change Rate Coefficient (log h) 0.68 0.91 0.46 5.0E-07 Pilgrim Reference2 Fleetwood Canada -2.0 -1.4 -2.7 8.6E-08 Forest River -0.07 0.53 -0.66 8.2E-01 Fleetwood -1.0 -0.36 -1.6 3.2E-03 Gulfstream -1.0 -0.48 -1.6 5.1E-04 Keystone -0.54 0.09 -1.2
0.84
9.0E-02 1 Represents the 95% confidence limit of the coefficient. 2 All coefficients for THU manufacturer types express the formaldehyde emission factor in the THUs relative to the reference THU
manufacturer type (Pilgrim).

25
FIGURES
Figure 1 - Example of tracer gas experiment determining ventilation rate in Forest River 1 showing initial stabilization period followed by the linear decay region. The ventilation rate is determined from the slope of the decay curve in the linear region as described in the text. The response shown here is typical of all THUs tested.
y = -2.1087x + 8.6245
R! = 0.99717
6
6.5
7
7.5
8
8.5
9
0 0.2 0.4 0.6 0.8 1 1.2
ln (
CO
2 i
nd
oo
rs -
CO
2 o
utd
oo
rs)
Time (hours)

26
Figure 2a - Comparison of emission factor data separated by chemical class for new site-built and manufactured homes (Hodgson et. al., 2000), German residences (Hippelein, 2004), four FEMA THUs (Maddalena et al., 2009) and sixteen FEMA THUs. The geometric mean of the data is reported, and the error bars represent one standard deviation.
0
5
10
15
20
25
30
35
40
45
50
2-ethyl,1-hexanol Phenol Dodecane Hexadecane Pentadecane Tetradecane Tridecane
Em
issi
on
Fa
cto
r (!
g m
-2 h
-1)
16 FEMA THUs
4 FEMA THUs
4 Manufactured Homes
7 Site Built Homes
Alcohols Alkanes

27
Figure 2b - Comparison of emission factor data separated by chemical class for new site-built and manufactured homes (Hodgson et. al., 2000), German residences (Hippelein, 2004), four FEMA THUs (Maddalena et al., 2009) and sixteen FEMA THUs. The geometric mean of the data is reported, and the error bars represent one standard deviation.
0
20
40
60
80
100
120
140
Benzene p-Xylene Styrene Toluene TMPD-DIB TMPD-MIB 3-Carene a-Pinene b-Pinene d-Limonene
Em
issi
on
Fa
ctor
(!g m
-2 h
-1)
16 FEMA THUs
4 FEMA THUs
4 Manufactured Homes
7 Site Built Homes
Aromatics Esters Terpenes
28
Figure 2c - Comparison of emission factor data for new site-built and manufactured homes (Hodgson et. al., 2000), German residences (Hippelein, 2004), four FEMA THUs (Maddalena et al., 2009) and sixteen FEMA THUs. The geometric mean of the data is reported, and the error bars represent one standard deviation.
0
50
100
150
200
250
300
350
400
Acetic acid Acetaldehyde Benzaldehyde Formaldehyde Hexanal Nonanal Octanal
Em
issi
on
Fa
cto
r (!
g m
-2 h
-1)
16 FEMA THUs
4 FEMA THUs
4 Manufactured Homes
7 Site Built Homes
Acids Aldehydes

29
Figure 3a - Comparison of measured indoor air concentration (ppb) data for new site-built and manufactured homes (Hodgson et. al., 2000), German residences (Hippelein, 2004), four FEMA THUs (Maddalena et al., 2009) and sixteen FEMA THUs. The geometric mean of the data is reported, and the error bars represent one standard deviation.
0.0
2.0
4.0
6.0
8.0
10.0
2-ethyl,1-hexanol Phenol Dodecane Hexadecane n-hexane Pentadecane Tetradecane Tridecane
Co
nce
ntr
ati
on
(p
pb
) 16 FEMA THUs
4 FEMA THUs
4 Manufactured Homes
7 Site Built Homes
39 German Homes
Alcohols Alkanes

30
Figure 3b - Comparison of measured indoor air concentration (ppb) data separated by chemical class for new site-built and manufactured homes (Hodgson et. al., 2000), German residences (Hippelein, 2004), four FEMA THUs (Maddalena et al., 2009) and sixteen FEMA THUs. The geometric mean of the data is reported, and the error bars represent one standard deviation.
0
5
10
15
20
25
30
Benzene o-Xylene p-Xylene Styrene Toluene TMPD-DIB TMPD-MIB 3-Carene a-Pinene b-Pinene d-Limonene
Co
nce
ntr
ati
on
(p
pb
)
16 FEMA THUs
4 FEMA THUs
4 Manufactured Homes
7 Site Built Homes
39 German Homes
Aromatics Esters Terpenes

31
Figure 3c - Comparison of measured indoor air concentration (ppb) data separated by chemical class for new site-built and manufactured homes (Hodgson et. al., 2000), German residences (Hippelein, 2004), four FEMA THUs (Maddalena et al., 2009) and sixteen FEMA THUs. The geometric mean of the data is reported, and the error bars represent one standard deviation.
0
100
200
300
400
500
Acetic acid Acetaldehyde Benzaldehyde Formaldehyde Hexanal Nonanal Octanal
Co
nce
ntr
ati
on
(p
pb
) 16 FEMA THUs
4 FEMA THUs
4 Manufactured Homes
7 Site Built Homes
39 German Homes
Acids Aldehydes

32
Figure 4a - Comparison of mean formaldehyde and acetic acid emission factors across THU manufacturer types included in the Purvis study. The geometric mean of the data is reported, and the error bars represent one standard deviation.
0
100
200
300
400
500
600
700
Formaldehyde Acetic Acid
Em
issi
on
Fa
cto
r (!
g m
-2 h
-1)
Fleetwood
Fleetwood Canada
Forest River
Gulfstream Cavalier
Keystone
Pilgrim
33
Figure 4b - Comparison of mean formaldehyde and acetic acid concentrations across THU manufacturer types included in the Purvis study. The geometric mean of the data is reported, and the error bars represent one standard deviation.
0
100
200
300
400
500
600
Formaldehyde Acetic Acid
Co
nce
ntr
ati
on
(!
g m
-3)
Fleetwood
Fleetwood Canada
Forest River
Gulfstream Cavalier
Keystone
Pilgrim


![[XLS] Star... · Web viewSteel Calculation GHG OI IEQ-14 Emission Limits Public Transport DTS Paints & Adhesives OI IEQ-12 Formaldehyde Formaldehyde Emission Limits Chain of Custody](https://static.fdocuments.net/doc/165x107/5b1ecad27f8b9af1328beed8/xls-star-web-viewsteel-calculation-ghg-oi-ieq-14-emission-limits-public.jpg)


