
EMGT 901: Total Quality Management Using Six Sigma Techniques
62
University of Nebraska - Lincoln DigitalCommons@University of Nebraska - Lincoln UNL Faculty Course Portfolios Peer Review of Teaching Project 2019 EMGT 901: Total Quality Management Using Six Sigma Techniques Jena Shafai Asgarpoor University of Nebraska - Lincoln, [email protected] Follow this and additional works at: hps://digitalcommons.unl.edu/prtunl Part of the Higher Education Commons , and the Higher Education and Teaching Commons is Portfolio is brought to you for free and open access by the Peer Review of Teaching Project at DigitalCommons@University of Nebraska - Lincoln. It has been accepted for inclusion in UNL Faculty Course Portfolios by an authorized administrator of DigitalCommons@University of Nebraska - Lincoln. Shafai Asgarpoor, Jena, "EMGT 901: Total Quality Management Using Six Sigma Techniques" (2019). UNL Faculty Course Portfolios. 147. hps://digitalcommons.unl.edu/prtunl/147
Transcript of EMGT 901: Total Quality Management Using Six Sigma Techniques

University of Nebraska - LincolnDigitalCommons@University of Nebraska - Lincoln
UNL Faculty Course Portfolios Peer Review of Teaching Project
2019
EMGT 901: Total Quality Management Using SixSigma TechniquesJena Shafai AsgarpoorUniversity of Nebraska - Lincoln, [email protected]
Follow this and additional works at: https://digitalcommons.unl.edu/prtunl
Part of the Higher Education Commons, and the Higher Education and Teaching Commons
This Portfolio is brought to you for free and open access by the Peer Review of Teaching Project at DigitalCommons@University of Nebraska - Lincoln.It has been accepted for inclusion in UNL Faculty Course Portfolios by an authorized administrator of DigitalCommons@University of Nebraska -Lincoln.
Shafai Asgarpoor, Jena, "EMGT 901: Total Quality Management Using Six Sigma Techniques" (2019). UNL Faculty Course Portfolios.147.https://digitalcommons.unl.edu/prtunl/147

1
EMGT 901: Total Quality Management Using Six Sigma Techniques (A web-based fully online course)
A Peer Review of Teaching Project Course Benchmark Portfolio
Spring 2019
Jena Shafai Asgarpoor, Ph. D.
Director, Master of Engineering Management Program Associate Professor of Practice
Department of Architectural Engineering Durham School of Architectural Engineering and Construction
University of Nebraska – Lincoln [email protected]

2
Abstract
Total Quality Management Using Six Sigma Techniques (EMGT 901) is an elective course in the
Master of Engineering Management (MEM) Program at the University of Nebraska – Lincoln
and serves as my Peer Review of Teaching Project (PRTP). This is an elective course in a fully
online program. Students in this program have an earned undergraduate degree in engineering
and are practicing engineers with at least two years of
work experience. In this PRTP I will examine the
development and delivery of the course based on
pedagogical and backward design considerations and
the framework proposed by Quality Matters ®. I will,
also, document several items, including: my motivation
to participate in Peer Review of Teaching (PRT),
relevant information about the course and the MEM
program, my choice for course-level objectives, my
choice for assessments to determine whether students
achieve learning objectives, and my choice for course materials, activities, and technologies
which facilitate learning and achievement of
objectives. I will examine artifacts and assignments
produced by students to determine whether course
design, delivery, and teaching practices are effective.
Findings reveal that objectives, assessments, and
course activities and materials are in alignment with
each other. Mid-term survey indicates students
believe the course and learning materials and teaching practices are effective and helpful.
There is concern about one learning objective (#3) as there is indication that a low percentage
of students are meeting that objective. In conclusion, I will discuss what I have learned from
this project, and areas for improvements in the course for future offerings.
Key words: Six sigma, total quality management, online learning, student surveys

3
Contents Introduction: Objectives of Peer Review Course Portfolio ........................................................................... 5
Motivation to Participate in Peer Review of Teaching Project (PRTP) ..................................................... 5
Context: Enrollment/Demographics ......................................................................................................... 5
My PRTP Course ........................................................................................................................................ 7
Framework for the Study and Considerations in Syllabus Creation ............................................................. 8
Teaching Methods, Materials, Course Activities & Interactions ................................................................ 10
Course Rubrics ........................................................................................................................................ 11
Teaching Methods and Course Materials ............................................................................................... 11
Probability & Statistics Prerequisite ................................................................................................... 11
First Course in Quality Management .................................................................................................. 13
Resources and Teaching Methods for Quantitative Content ............................................................. 13
Resources and Teaching Methods for Qualitative Content ................................................................ 13
Teaching Strategies to Build a Community of Engaged Learners ........................................................... 14
Tour de Class Video ............................................................................................................................. 15
Introductions Discussion Area ............................................................................................................ 15
Graded Discussion ............................................................................................................................... 15
Online Office (Professor’s Corner) Discussion .................................................................................... 15
Weekly Ungraded Discussion .............................................................................................................. 15
All-Class and Targeted Communication .............................................................................................. 16
Timely Response and Feedback .......................................................................................................... 16
Mid-Term Surveys ............................................................................................................................... 16
Analysis of Student Learning and Performance on Assignments ............................................................... 16
Discussions .............................................................................................................................................. 17
Active and Passive Student Engagement ............................................................................................ 17
Average Participation per Student ...................................................................................................... 17
Students’ Reflection on What They Learned ...................................................................................... 18
Applying Tools of Quality .................................................................................................................... 18
Mid-term Survey ..................................................................................................................................... 20
Exam Results ........................................................................................................................................... 21
Course Project ......................................................................................................................................... 22
Case ......................................................................................................................................................... 23
Homework............................................................................................................................................... 23

4
Reflection on the Course ............................................................................................................................ 24
Summary of findings ............................................................................................................................... 24
Objective 3 .............................................................................................................................................. 26
Objective 4 .............................................................................................................................................. 26
Other findings ......................................................................................................................................... 27
Final Thoughts ......................................................................................................................................... 27
Appendices .................................................................................................................................................. 28
Appendix A: Syllabus ............................................................................................................................... 29
Appendix B: Course Rubrics for 3 Assignments ...................................................................................... 36
Appendix C: Sample Graded Discussion Assignment (Module 6) ........................................................... 40
Appendix D: Sample Students’ Work – Students’ Reflection on What They Learned ............................ 41
Appendix E: Sample Students’ Work - Applying Tools of Quality Management .................................... 45
Appendix F: Results of Mid-term Survey ................................................................................................ 54
Appendix G: 12 Exam Questions that did not meet good-performance standard ................................. 57
Appendix H: Case Submissions by Two Teams ....................................................................................... 61
5
Introduction: Objectives of Peer Review
Course Portfolio
In this section, I will describe the motivating factors for me to participate in the peer
review of teaching project (PRTP) and I will provide a detailed description of the course that is
the subject of my PRTP.
Motivation to Participate in Peer Review of Teaching Project (PRTP) I am the director for the Master of Engineering Management (MEM) Program in the
College of Engineering, which is a 100% online professional master’s degree. I joined UNL and
the MEM program in August of 2017, but I have been in the teaching profession for 27 years
and loving every minute of it. My students and their success have always been of the highest
priority to me. My decision to join the PRTP stems from a quality improvement perspective.
• One of the subjects I teach in the classroom is quality management.
• I am the Education Chair on the board for the Nebraska Section 1302 of the American
Society for Quality (ASQ).
• I have completed two certifications by Quality Matters, which is an organization dedicated
to promoting best course design practices for online and blended courses.
• The first semester I joined UNL, I joined ARISE which emphasizes backward course design.
• The first summer that I was at UNL, I participated in the Summer Institute for Online
Teaching (SIOT), which is a workshop dedicated to online course design and teaching.
• Since I have joined UNL, I have attended almost all symposia, lectures, events, and
workshops on teaching & learning improvement.
Given the above, it is no wonder that I totally believe in continuous quality
improvement. Teaching and pedagogy is no exception when it comes to subscribing to Total
Quality philosophy. No matter how long one has been in the profession, there is always room
for doing better and learning new knowledge to be more effective in the classroom, and that
applies to both on-ground and online courses.
It is for this reason that I decided to join PRT. I would like to, continually, learn new ways
to improve my courses and teaching practices, and to help students learn better and more
authentically. Additionally, as the director of the MEM program, I would like to be a mentor to
the faculty and lecturers who teach in the program so that our students will reap the benefit
that could emerge from sound course design and alignment of objectives, activities, and
assessments in MEM courses.
Context: Enrollment/Demographics To successfully grapple with what my course is, I must first consider the academic
program in which it resides, the students who pursue that program, and their motivation for

6
doing so. The Master of Engineering Management (MEM) is a professional graduate program in
the College of Engineering. It is a graduate degree for working engineers who have earned at
least a BS in engineering or STEM (Science, Technology, Engineering, Math) discipline, and have
work experience (among other admission requirements). These are individuals who are in a
technical track in their profession or are entering supervisory and/or management positions in
their present job. MEM program demographic data appears in Exhibit 1.
Exhibit 1: MEM Program Demographics (as of April 2019)
Total Enrollment: 72 Female: 8 Male: 64 Caucasian: 53 African-American: 3 Hispanic: 4 Asian: 3 Other: 9 3-Year Total Graduates (Fall 2015 – Fall 2018): 46 Female: 4 Male: 42 Caucasian: 38 African-American: 5 Asian: 2 Unspecified: 1 Nebraska Residents: 37 (Lincoln/Omaha: 23; Elsewhere in Nebraska: 14) Non-Nebraska Residents: 9
The motivation for pursuing this degree varies for each student. It could range from
earning a graduate degree for promotion and raise, to a sense of accomplishment and
satisfaction for accomplishing a long-life dream of doing graduate studies, to the desire to learn
how to be (or become) an effective manager and leader in a technical/engineering workplace,
or to even become a better employee and a better engineer. The curriculum in most
undergraduate degrees in engineering either mainly or entirely focus on transmitting STEM
concepts, knowledge, and skill sets. While those are critical and required for a practicing
engineer, engineering graduates end up in workplaces where they must be active members of
work teams, and interact with superiors, coworkers, subordinates, internal and external groups,
clients and customers, and other constituents. Generally, engineering UG curricula do not
include or scantly include subjects that prepare students with skills and business acumen such
as communicating, conflict management, teamwork, motivating and influencing others,
managing time, scope, and quality of projects, negotiation and legal considerations in
engineering projects, etc.
Students who pursue the MEM already have the technical knowledge due to their
undergraduate engineering degree and ample work experience, which is a requirement for
joining the program. Their main goal for pursuing the MEM is to learn the people skills, business
acumen, and management and leadership skills, while also gaining new technical knowledge in
such topics as decision and risk analysis, project management, financial management, or quality
management.
7
My PRTP Course For my PRT project, I have chosen EMGT 901 - Total Quality Management using Six
Sigma Techniques. While the Graduate Bulletin does not list a specific pre-requisite course for
this class, knowledge of probability and statistics is essential and by default is a pre-requisite
because an admission requirement for the program is an undergraduate course in probability
and statistics (200- or 300-level, depending on the institution where it was taken). EMGT 901 is
an elective course in the MEM program. Students may take two engineering electives and two
general graduate electives. EMGT 901 fulfills the requirement for either of those two types of
electives.
Enrollment for Spring 2019 was low. Only six students were in this class. This is because
when offered in Spring 2018, enrollment was 27 which is very high for an MEM elective and is
38% of the MEM population. So, those who wanted to take this elective, have probably taken it
already.
A couple of students pursuing graduate work in other engineering programs and from
the College of Business may enroll in EMGT 901, also as an elective class. Business students
must have earned a BS in engineering.
EMGT 901 is not a pre-requisite for another class in the program. However, what
students learn in this course and take away from it can be instrumental in success at their jobs,
their ability to see the big picture, critically evaluating processes that produce goods and
services, and being champions for making value-adding changes to work processes and work
flows by understanding and acting upon the Voice of the Customer.
Here is why I chose EMGT 901 for my PRT project. Given that EMGT 901 has no pre-
requisite course in the subject of quality management, it must be introductory as the students
are gaining “formal” knowledge about quality. For example, the course must expose the
students to something as simple as definitions of quality given various perspectives such as
what it means to customers, what it means to the workforce, and what it means from a process
perspective. However, at the same time, nearly all students who take this course are working
professionals who have had plenty of on-the-job exposure to quality-related concerns and
issues at their work place. Those experiences inform their attitude toward quality and
management of it. Depending on who they are and their prior experiences, almost all come into
the course with preconceived notions and attitudes on what quality means to them, how to
manage it, the worth/value of having a quality management department in their work place,
and the extent to which their own department must interface with the quality management
department.
To overcome those preconceptions and to enable the student to internalize the subject,
it is imperative to expose them to the teachings of the great philosophers in the field of quality
management. I want them to learn and contemplate on the differences in teachings of Quality
Gurus such as Juran, Crosby, and Deming. As graduate students, they must know the

8
evolutionary formation of the field of quality management, as it exists today. But, once they
learn those various philosophies and the focus of each, they must reflect and contemplate with
which philosophy their own views are aligned. This is important because one’s definition of
quality and perspectives on the scope and reach of quality initiatives greatly influences the
approach that one takes toward management of quality in the work place. As practicing
professionals in engineering, the students’ work and career invariably includes decisions that
directly or indirectly relate to quality of processes and products. This course must provide a
balance between qualitative and quantitative topics in quality management.
Framework for the Study and Considerations
in Syllabus Creation
The merits of backward course design is well documented in teaching and learning
literature and emphasizes that effective course design would include the following: a) identify
desired results, b) plan learning experiences and instruction, and c) determine acceptable
evidence that students have achieved those results. While this pedagogical perspective is valid
and necessary for both online and face-to-face learning, an online course must also meet certain
criteria to ensure high potential for student learning. Online courses must respond to several
social, motivational, and technological issues from perspectives of both learners and faculty.
Therefore, sound course design, development, and delivery remain of utmost importance to
ensure student success in achieving learning outcomes.
Quality Matters (QM) is an organization devoted to online and blended course design. In
evaluating a course, QM uses a rubric which includes eight general standards and 42 specific
review standards. In 2017, I completed two QM certifications in, a) applying the QM rubric, and
b) evaluating online courses with that rubric. It was stunning to learn of the vast amount of
overlap between the pedagogy I had applied over the years, and what QM promotes.
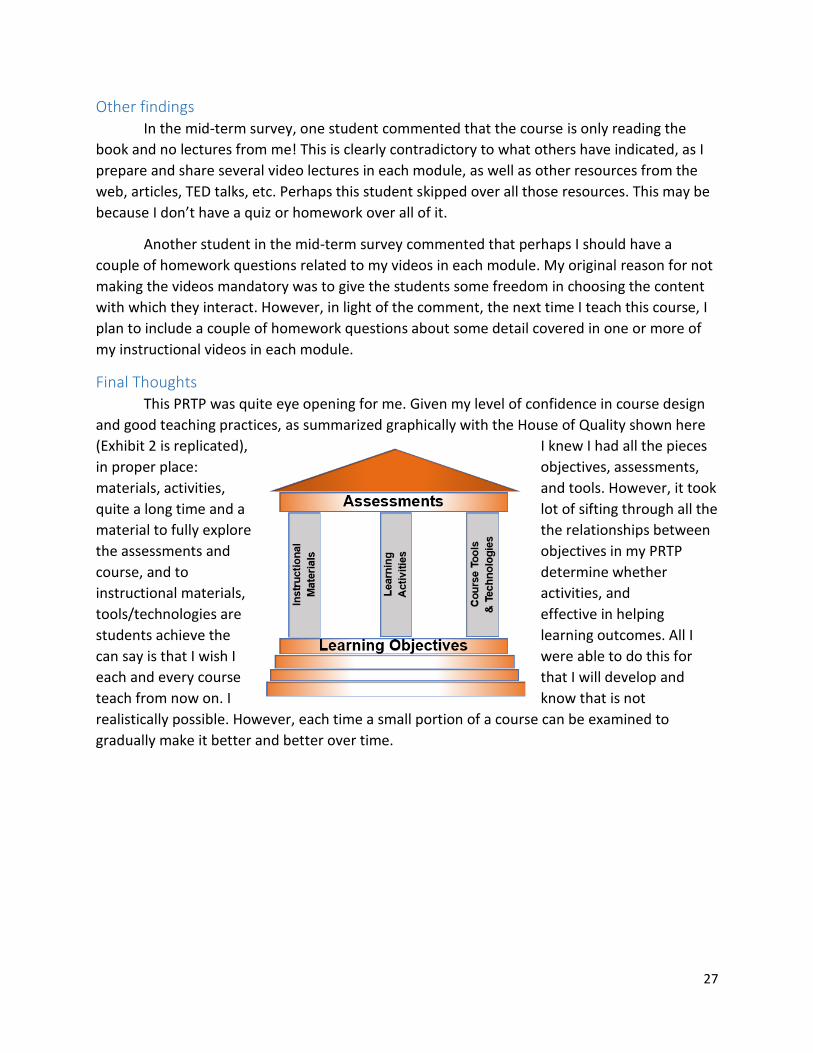
Exhibit 2 is a graphical representation of the relationship between QM rubric standards.
Although QM is dedicated to online and blended courses, the sound pedagogical framework
applied by QM transcends all delivery formats and mirrors backward design which is promoted
by ARISE, SIOT, and PRT, all of which are faculty workshops and projects at the University of
Nebraska – Lincoln, dedicated to the topic of teaching & learning.
As Exhibit 2 illustrates, learning objectives form the foundational support for the rest of the
course and for student learning. They describe what students must be able to do when the course
ends. Learning objectives must be SMART:
• Specific, clearly stated, and consistent with the curriculum
• Measurable so that data can be collected to evaluate student learning

9
• Appropriate for the course level (e.g., graduate v. undergraduate, major v. non-major, theory
v. laboratory, etc.)
• Realistic, doable objectives
• Tailored so that important course topics are captured
Exhibit 2: House of Quality for Course Design
Source: Adapted from Quality Matters®
The three pillars that support and hold up quality in online courses are depicted in Exhibit
2 as instructional materials, learning activities, and course tools and technologies. Planning and
use of instructional materials must be carefully done as it paves the path for students to achieve
course objectives. Learners must know and understand how course materials will help them in
achieving course objectives. A variety of instructional materials must be used in the course,
commensurate with various learning objectives, to ensure those objectives are achieved.
Learning activities must support interactions and engagement of the students with each
other, with content, with faculty. This is an incredibly important part of design for online courses
and must be considered as an important element in design for my PRTP course. Online instructors
must clearly state and carefully explain their plan for interacting with the students and their role,
visibility, and online presence in the course.
Technologies used must support student learning and achievement of course objectives
by promoting engagement and active learning. It is highly recommended to use a variety of
10
technology tools in online courses to facilitate the learning process. Most Learning Management
Systems (LMS) contain a number of tools, functions, and capabilities that are helpful in this
respect. When used properly, these technology tools can foster collaborative and engaging
interactions in the course and among learners. The most obvious is the Discussion Board where
students interact electronically with their peers and professor. Additionally, the online grade
center in most LMS provide a wealth of technology to help students in their learning journey. For
example, in Canvas LMS, instructors are not only able to draw on, write on, highlight, and
annotate submissions by students to provide feedback, but they are also able to provide audio
and video comments straight from the Grade Center, and they can even email targeted messages
to student groups based on their grades, performance on assignments, or participation level.
In designing any course, but particularly in an online course, one must treat assessments
as an integral part of the learning process. Grading policy and specific criteria for evaluating
students’ work must be clearly communicated to them from the start of the course. Graded
assignments should be carefully developed and aligned with learning objectives to facilitate
measurement and analysis. Learners must understand whether and how each assessment relates
to the learning objectives. Choice of assessments must be commensurate with the objective
level. For example it is unlikely that a multiple-choice quiz which contains questions to assess the
student’s ability to “remember” and “understand” key words and basic concepts would be an
appropriate choice for assessing the student’s ability to “evaluate” or “synthesize”.
Teaching Methods, Materials, Course
Activities & Interactions
Given this is an online course in a fully online program, there is no residential component (i.e., no face-to-face or inside the classroom meetings). Therefore, both the class-activities and what would normally be outside class activities all take place outside of the classroom, during the times that the student allocates to studying and learning. This is a challenge of online format and learning environment. Transmission of knowledge must take place at a distance and not in a face-to-face setting.
Compared to a face-to-face class, generally a more varied number of teaching methods are used in an online environment. The subjective and qualitative content is better conveyed through readings for the course and open discussion where students express and exchange their views, opinions, and experiences on a subject in the discussion area. I would also use other videos that are available on the internet to present some qualitative course content. For instance, videos on Quality Gurus such as Deming or Crosby in which they present their own perspectives and philosophies on quality management and continuous improvement, rather than someone else (me) verbalizing where they stood and the relevance of their positions. Some of the discussion are graded, but still during the course of it, key points and elements of the topic of study will surface which will be helpful to the students to reflect upon, discuss, and comprehend.
11
For quantitative content, I prepare instructional videos that are essentially like a lecture that I would present in a classroom, so that students who cannot comprehend the content from reading the book, will have guidance and pathway to success. I use a tablet, stylus, and a headphone/mic to create the videos using screen-capture technology such as Camtasia by TechSmith or VidGrid. For the quantitative materials, I would provide solutions to some problems from the book and the problems that I demo in the videos. Students would be able to study them on their own to hone in on the details of the various methods of analysis and ask questions in the discussion area if they require additional explanation or discussion.
I carefully considered the issues discussed in sections 1 and 2 related to the online
nature of the course, background of students, course level, prerequisite topics, and integrating
pedagogical backward design practices. All of those were instrumental in development of EMGT
901, resulted in the syllabus which appears in Appendix A, and identified five learning
objectives, which are shown in Exhibit 3.
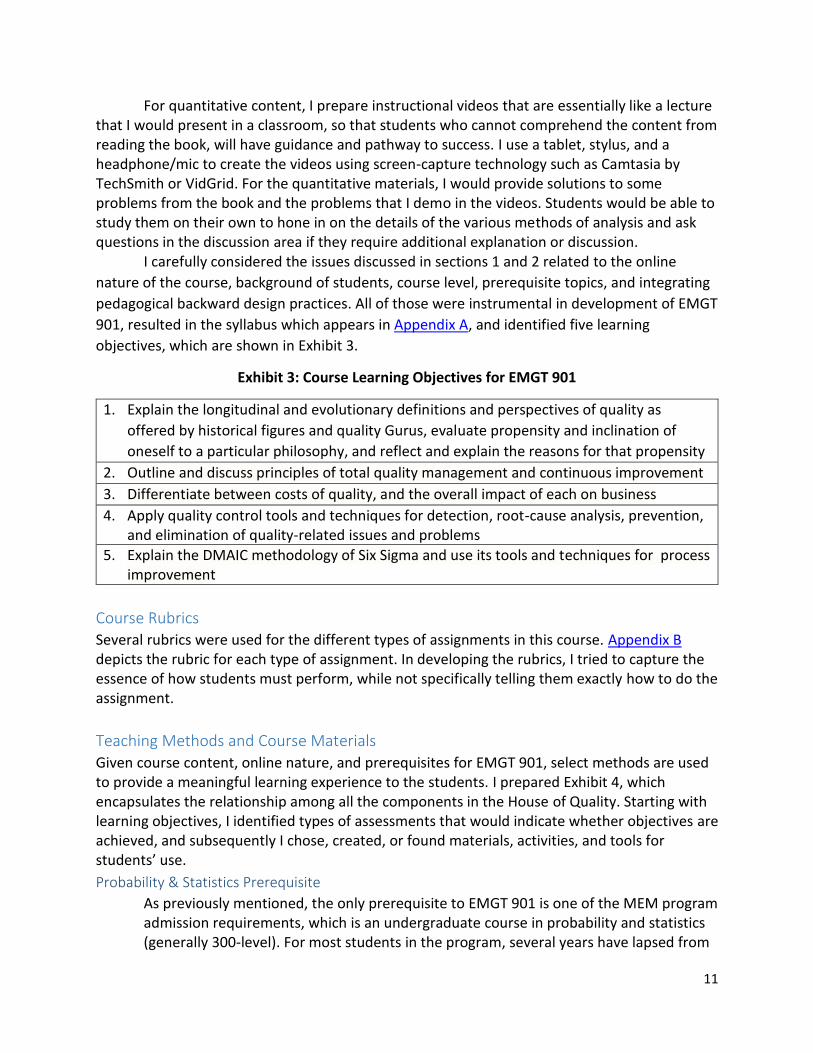
Exhibit 3: Course Learning Objectives for EMGT 901
1. Explain the longitudinal and evolutionary definitions and perspectives of quality as
offered by historical figures and quality Gurus, evaluate propensity and inclination of
oneself to a particular philosophy, and reflect and explain the reasons for that propensity
2. Outline and discuss principles of total quality management and continuous improvement
3. Differentiate between costs of quality, and the overall impact of each on business
4. Apply quality control tools and techniques for detection, root-cause analysis, prevention, and elimination of quality-related issues and problems
5. Explain the DMAIC methodology of Six Sigma and use its tools and techniques for process improvement
Course Rubrics Several rubrics were used for the different types of assignments in this course. Appendix B depicts the rubric for each type of assignment. In developing the rubrics, I tried to capture the essence of how students must perform, while not specifically telling them exactly how to do the assignment.
Teaching Methods and Course Materials
Given course content, online nature, and prerequisites for EMGT 901, select methods are used to provide a meaningful learning experience to the students. I prepared Exhibit 4, which encapsulates the relationship among all the components in the House of Quality. Starting with learning objectives, I identified types of assessments that would indicate whether objectives are achieved, and subsequently I chose, created, or found materials, activities, and tools for students’ use.
Probability & Statistics Prerequisite
As previously mentioned, the only prerequisite to EMGT 901 is one of the MEM program admission requirements, which is an undergraduate course in probability and statistics (generally 300-level). For most students in the program, several years have lapsed from

12
when they took that course until they enroll in EMGT 901. Therefore, it is important to provide refresher resources with prompts so that students are able to review and be ready for course material. I provide instructional videos that I have prepared, as well as some found from the Internet, as course resources, which students may review, as needed.
Exhibit 4: Alignment of Learning Objectives, Assessments, Activities, and Resources
13
First Course in Quality Management
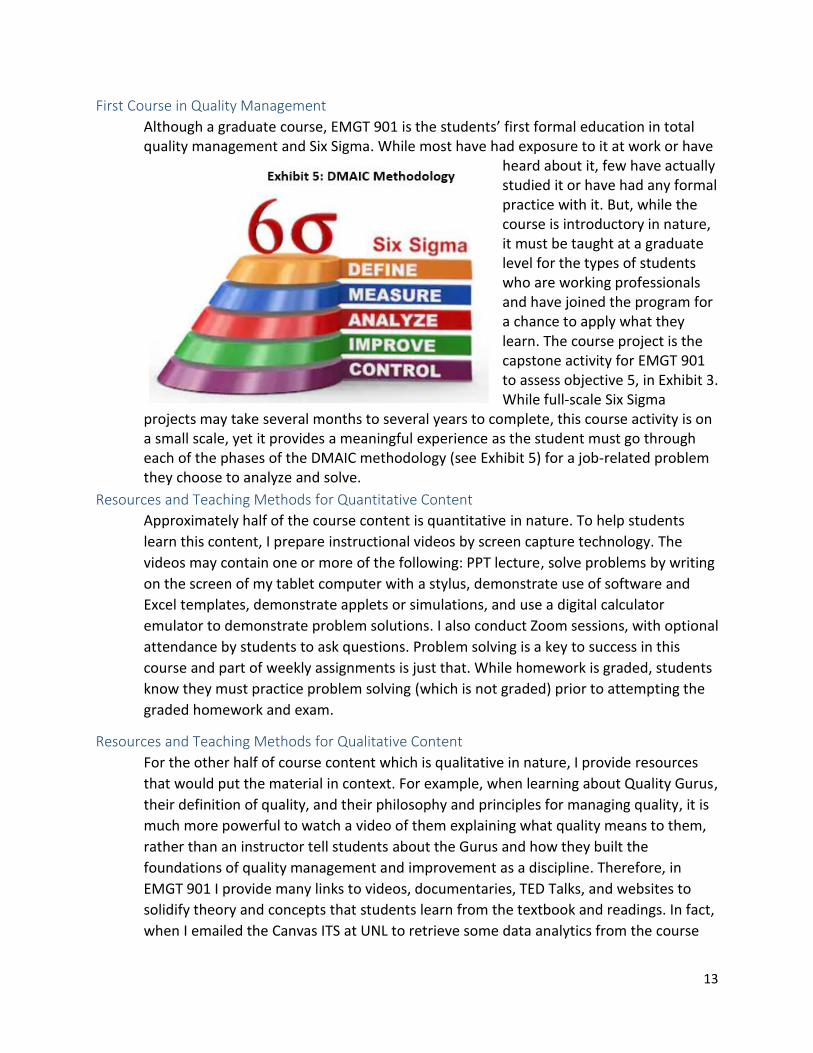
Although a graduate course, EMGT 901 is the students’ first formal education in total quality management and Six Sigma. While most have had exposure to it at work or have
heard about it, few have actually studied it or have had any formal practice with it. But, while the course is introductory in nature, it must be taught at a graduate level for the types of students who are working professionals and have joined the program for a chance to apply what they learn. The course project is the capstone activity for EMGT 901 to assess objective 5, in Exhibit 3. While full-scale Six Sigma
projects may take several months to several years to complete, this course activity is on a small scale, yet it provides a meaningful experience as the student must go through each of the phases of the DMAIC methodology (see Exhibit 5) for a job-related problem they choose to analyze and solve.
Resources and Teaching Methods for Quantitative Content
Approximately half of the course content is quantitative in nature. To help students
learn this content, I prepare instructional videos by screen capture technology. The
videos may contain one or more of the following: PPT lecture, solve problems by writing
on the screen of my tablet computer with a stylus, demonstrate use of software and
Excel templates, demonstrate applets or simulations, and use a digital calculator
emulator to demonstrate problem solutions. I also conduct Zoom sessions, with optional
attendance by students to ask questions. Problem solving is a key to success in this
course and part of weekly assignments is just that. While homework is graded, students
know they must practice problem solving (which is not graded) prior to attempting the
graded homework and exam.
Resources and Teaching Methods for Qualitative Content
For the other half of course content which is qualitative in nature, I provide resources
that would put the material in context. For example, when learning about Quality Gurus,
their definition of quality, and their philosophy and principles for managing quality, it is
much more powerful to watch a video of them explaining what quality means to them,
rather than an instructor tell students about the Gurus and how they built the
foundations of quality management and improvement as a discipline. Therefore, in
EMGT 901 I provide many links to videos, documentaries, TED Talks, and websites to
solidify theory and concepts that students learn from the textbook and readings. In fact,
when I emailed the Canvas ITS at UNL to retrieve some data analytics from the course

14
for my PRTP, the Instructional Designer who replied, volunteered the following
comment about my course: “Btw I love how you design your course and it’s an
information-rich course.” Exhibit 6 shows the content pages in a typical module in my
EMGT 901. The consent form was the document students had to sign to allow use of
their data in this project.
Exhibit 6: Typical Canvas Module and Content Pages for EMGT 901
Teaching Strategies to Build a Community of Engaged Learners EMGT 901 is a fully online course and a first rule in designing such a course is for the faculty to
build a sense of community and connectedness for students so that they are engaged and
active in the course. Online instructors must establish and maintain presence in their courses by
being visible, accessible, and willing to respond in a timely manner to questions and concerns
from their students.
The first thing I did intentionally in designing this course was to avoid instruction by email. I
have built different discussion areas to account for almost all forms of Q/A that may arise in a
course like this. If students do not have a venue to post their concerns and questions, they will
resort to emailing. However, I arranged to answer all questions through the LMS course site,
unless the communication is personal and sensitive in nature, which would require privacy.
There are a few reasons for this strategy:
a. For every student who has a question or concern, there are at least 2 others with the
same type of question; posting them to the discussion area will avail the Q/A to all
students

15
b. My ability to manage my time will be greatly impeded to engage in separate email
conversations with each student
c. Allowing students to respond to questions from their peers contributes to building
community as they help and support each other.
The following are the activities and assignments that I have integrated in the course to develop
and promote interactions between students, with me, and with course content.
Tour de Class Video
Without investing too much time and effort, students must learn quickly the layout or map of the course, how to navigate it, and the instructor’s expectation. I created a 10-minute screen capture video demo of the course to save students exploration time, to guide them in navigating the course, to give an overview of the syllabus and course requirements, to specify guidelines for interactions, discussions, and communication, and to explain how to locate, retrieve, and submit assignments.
Introductions Discussion Area
For introducing myself to class, I created a short video while sitting in my living room where they can see me on the screen, as well as my background, a picture of my family, and my contact information. In the video, I told them about my hobbies, my family, and a couple of fun facts about myself. I did this to present a friendly and approachable side of me so they feel comfortable and open to ask questions. In the video I also told them how they can contact me (video conference, course discussion boards, email, phone, Zoom, etc). One of the first required activities in the course is for the student to post a similar video message that is not text-based. I respond to each student with a personal video message.
Graded Discussion
I built six graded discussion activities in EMGT 901. In most of those discussions, I presented students with two or more questions and they had to pick one to answer. I chose this method to put the students in control of designing their learning experience to fit their needs. Rather than mandating response to one question, I gave them the option to pick one that interests them the most and they find more beneficial to their jobs. Appendix C contains the graded discussion assignment from module 6.
Online Office (Professor’s Corner) Discussion
This is a discussion area for non-content related questions, which deal with administrative concerns and issues. For example, students may have questions about due dates, course links not working, files not opening, etc. This discussion area is dedicated to such matters and promotes interaction not only with me, but also among students, as some will respond to others in a helpful, supportive manner.
Weekly Ungraded Discussion
As students study the material in a module, they will have questions about the content, which must be answered so that they can complete assignments and deliverables. I designed EMGT 901 with that in mind. I have created a forum for each module where content-related questioning takes place. An ungraded discussion area dedicated to
16
content questions is helpful for the students to get clarification and move on to the next activity. It facilitates supporting students in their learning endeavors in a timely manner, without having to wait for the weekly video-conference session, which may be days after they come up with their question. I use a variety of methods in this forum to interact with students, and to respond and clarify their questions. Some of those are: text-based messages, audio messages, instructional video tutorials, images, drawings, file uploads, etc. Everyone in class is encouraged to participate and respond, if they know the answer to a posted question.
All-Class and Targeted Communication
Communicating frequently with students assures them that I am interested in their learning and dedicated to their success. I frequently used all-class messages such as email, discussion board, or Canvas messaging function. These were any form of communication such as reminders, encouraging notes, websites or resources related to the topic for a module, or hints on assignments.
Timely Response and Feedback
In an online class, students must regularly be apprised of their progress in the course, with a reasonable amount of time from when the assignment is due until grades are issued. Similarly, they must get a response to their communications in a reasonable amount of time since, unlike a residential class, they don’t see their professor several times per week. My syllabus states that assignments are graded within 7 days of due-date, and I respond to communication from students within 48 hours. Although my response is generally within an hour!
Mid-Term Surveys
Student evaluations of the course and teaching are effective in making modifications to the course to make it better the next time I teach it. But, they are always too late to make improvements that positively impact experience of the students who wrote the evaluations. I used a mid-term survey to enable students co-create and impact their own learning process. Recommendations made in the mid-term survey or variations of them can be implemented as long as they facilitate learning without adversely impacting achievement of learning objectives. An example would be sliding due dates to Sunday, instead of Friday, to allow students to complete the assignment during weekend. The mid-term survey I used in this course was anonymous and instructions assured students of that. I shared the results of the survey with class.
Analysis of Student Learning and
Performance on Assignments
In this section, I will review performance of students on a few of a sample of assignments, as
well as the mid-term survey results. There were only six students in class. Therefore, the
analysis will be qualitative in nature.

17
Discussions A few key findings from the discussion activity in the course will be discussed below.
Active and Passive Student Engagement
In one of our last PRT meetings, an instructional designer spoke about Canvas Analytics
and various charts and reports that Canvas ITS staff are able to create related to student
performance. We were told that faculty are not able to create those graphs and reports and
that we must put in our request through Canvas ITS. I requested a few of those for EMGT 901,
but the Canvas ITS team only presented me with one, shown in Exhibit 7.
Exhibit 7: Student Engagement Chart - Discussion Analytics
Active Engagement (X-axis) & Passive Engagement (Y-axis)
Exhibit 7 was created with course-level analytics. The chart indicates that student grades
and their engagement level in the course are strongly positively associated, and that their grade
aligns with their level of interaction and activity within the course and discussion area. Please
note that the chart was created by ITS (signature is in red circle) and it only displayed the
bubbles. I hand-drew the broken line on the chart. The graph quality was as it appears in
Exhibit 7, when I received it.
I learned from the ITS staff who created the chart that UNL is leading this type of
research with data collected by, and retrieved from, Canvas courses. This form of analysis is
proprietary to UNL and at this point in time, individual faculty cannot generate analytic charts
for their courses. They can only be requested from ITS.
Average Participation per Student
Perhaps indicative of the findings in the above section is the average participation in graded
discussion areas. I had one student in class who was not participating in the course much and
18
ultimately received a grade of F (fail). But, the remaining 5 were quite active and engaged. In
fact the average number of messages posted to the discussions was slightly higher than 4,
whereas minimum requirement was only 3 (one original message and two replies).
Students’ Reflection on What They Learned
An ungraded assignment in this course was a set of Reflection Journals that the student
had to complete at the end of each module (each week). Although these were not graded,
students knew their journals would be the basis for the last discussion in the course. Appendix
D contains instructions for that assignment and messages posted to it. The assignment asked
students to identify the top 2 or 3 items they learned in EMGT 901, which are of value or
significance to them. I was happy to see that messages indicated both quantitative and
qualitative take-away that they found significant in their learning.
Course objectives 1 and 2 deal with understanding the historical perspective and
significance of quality management and quality principles. Messages posted by students
included topics directly linked to objectives 1 and 2, such as: Process benchmarking, quality
mindset, design review and product development process, Crosby’s “Zero Defects”, voice of the
customer, quality gurus and their philosophies.
Course objectives 4 and 5 deal with quantitative tools of quality management and six
sigma. To this end, students have mentioned the following: Mean time to failure, mean time
between failures, process capacity index and calculation, control charting, statistical analysis,
ANOVA, and DMAIC methodology of six sigma.
Overall analysis of discussion forum entries dedicated to reflecting on what students
gained and learned from the course is very encouraging and it appears students are able to
identify how the course added value to their knowledge and skills.
Applying Tools of Quality
Course objective #4 states: Apply quality control tools and techniques for detection,
root-cause analysis, prevention, and elimination of quality-related issues and problems. One of
the discussion topics required students to differentiate between the various quality control
tools. Appendix E contains the assignment and responses from each student. This was a
scenario-based assignment.
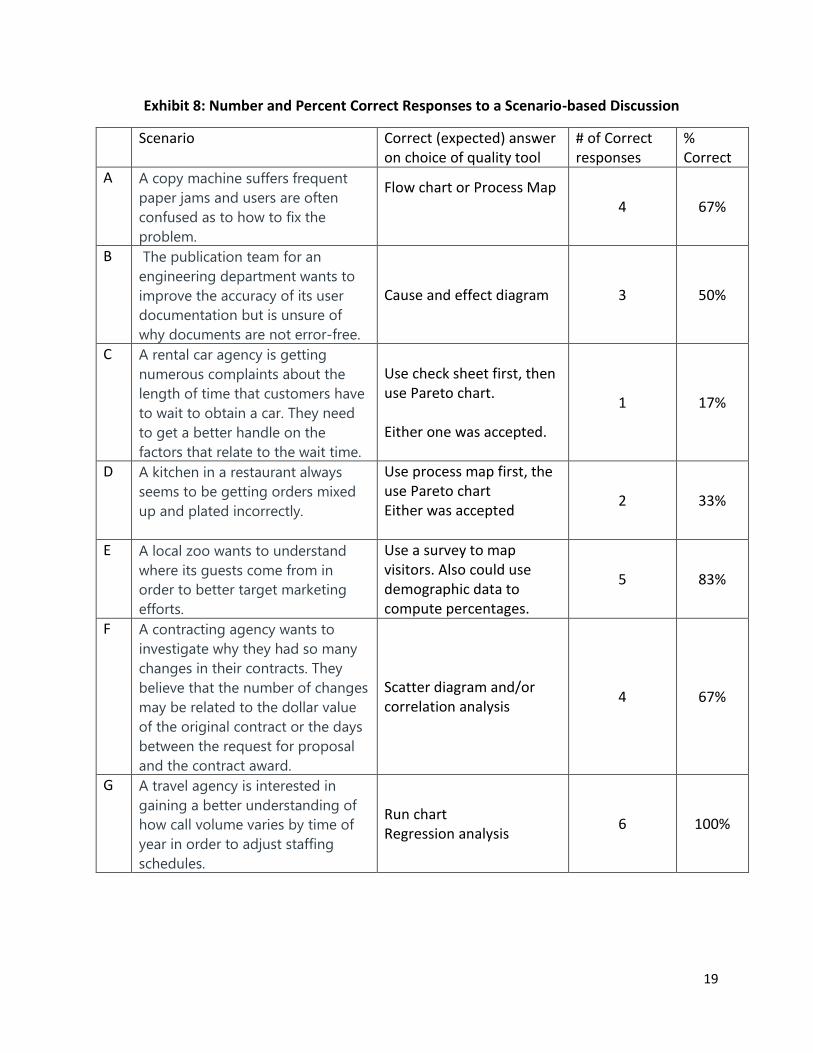
Exhibit 8 documents each scenario, correct answer, the number and percentage of
students who responded correctly to each scenario. Clearly, performance was sub-optimal on a
few of these scenarios and will be discussed in the last section of this document as reflections
about the course and future plans for improvement.
19
Exhibit 8: Number and Percent Correct Responses to a Scenario-based Discussion
Scenario Correct (expected) answer on choice of quality tool
# of Correct responses
% Correct
A A copy machine suffers frequent
paper jams and users are often
confused as to how to fix the
problem.
Flow chart or Process Map
4 67%
B The publication team for an
engineering department wants to
improve the accuracy of its user
documentation but is unsure of
why documents are not error-free.
Cause and effect diagram 3 50%
C A rental car agency is getting
numerous complaints about the
length of time that customers have
to wait to obtain a car. They need
to get a better handle on the
factors that relate to the wait time.
Use check sheet first, then use Pareto chart. Either one was accepted.
1 17%
D A kitchen in a restaurant always
seems to be getting orders mixed
up and plated incorrectly.
Use process map first, the use Pareto chart Either was accepted
2 33%
E A local zoo wants to understand
where its guests come from in
order to better target marketing
efforts.
Use a survey to map visitors. Also could use demographic data to compute percentages.
5 83%
F A contracting agency wants to
investigate why they had so many
changes in their contracts. They
believe that the number of changes
may be related to the dollar value
of the original contract or the days
between the request for proposal
and the contract award.
Scatter diagram and/or correlation analysis
4 67%
G A travel agency is interested in
gaining a better understanding of
how call volume varies by time of
year in order to adjust staffing
schedules.
Run chart Regression analysis
6 100%
20
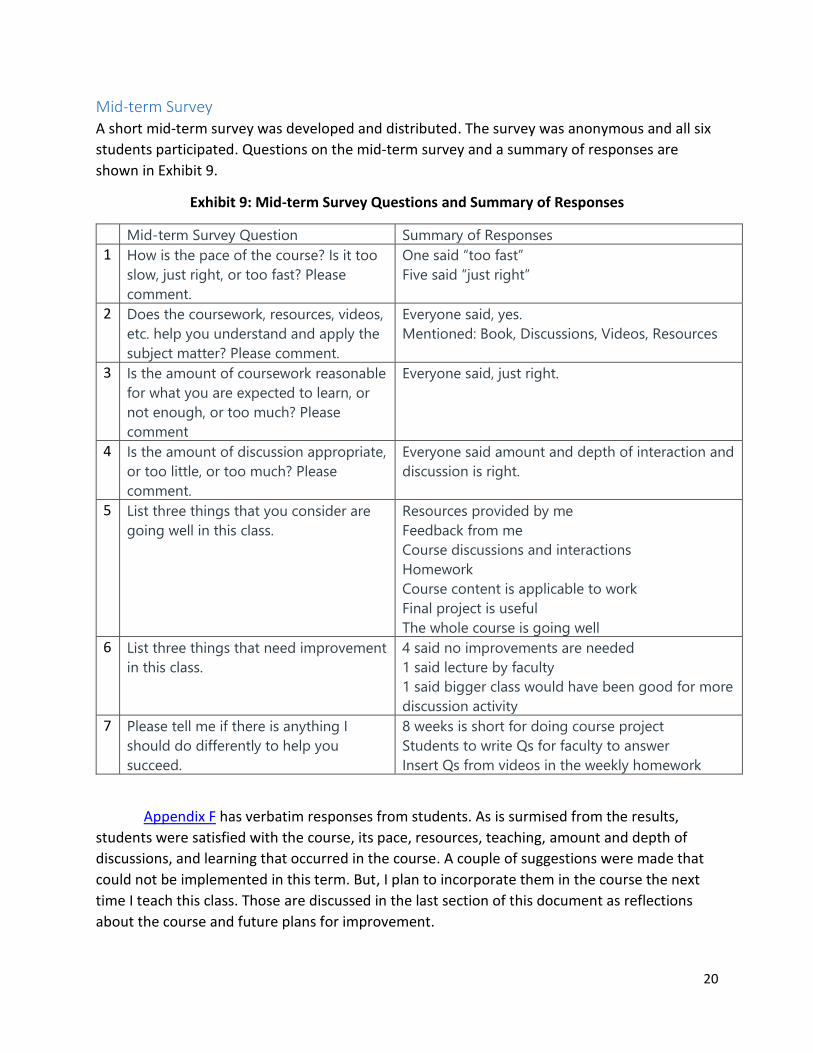
Mid-term Survey A short mid-term survey was developed and distributed. The survey was anonymous and all six
students participated. Questions on the mid-term survey and a summary of responses are
shown in Exhibit 9.
Exhibit 9: Mid-term Survey Questions and Summary of Responses
Mid-term Survey Question Summary of Responses
1 How is the pace of the course? Is it too
slow, just right, or too fast? Please
comment.
One said “too fast”
Five said “just right”
2 Does the coursework, resources, videos,
etc. help you understand and apply the
subject matter? Please comment.
Everyone said, yes.
Mentioned: Book, Discussions, Videos, Resources
3 Is the amount of coursework reasonable
for what you are expected to learn, or
not enough, or too much? Please
comment
Everyone said, just right.
4 Is the amount of discussion appropriate,
or too little, or too much? Please
comment.
Everyone said amount and depth of interaction and
discussion is right.
5 List three things that you consider are
going well in this class. Resources provided by me
Feedback from me
Course discussions and interactions
Homework
Course content is applicable to work
Final project is useful
The whole course is going well
6 List three things that need improvement
in this class. 4 said no improvements are needed
1 said lecture by faculty
1 said bigger class would have been good for more
discussion activity
7 Please tell me if there is anything I
should do differently to help you
succeed.
8 weeks is short for doing course project
Students to write Qs for faculty to answer
Insert Qs from videos in the weekly homework
Appendix F has verbatim responses from students. As is surmised from the results,
students were satisfied with the course, its pace, resources, teaching, amount and depth of
discussions, and learning that occurred in the course. A couple of suggestions were made that
could not be implemented in this term. But, I plan to incorporate them in the course the next
time I teach this class. Those are discussed in the last section of this document as reflections
about the course and future plans for improvement.

21
Exam Results Given that this is an 8-week course, to optimize use of time, I administered only one
exam during week 7, which was worth 100 points. It contained 79 items in total, 76 of which
were multiple-choice, but included both conceptual questions and several small problems to
solve. One item was short answer essay; one question was a large problem to solve; one
question was a problem to solve and discuss findings.
Exhibit 10 was retrieved from Canvas and shows summary statistics for the exam.
Minimum score was 68% and maximum score was 96%, with an average score of 82%. Standard
deviation was 8.34 and is somewhat high, but is representative of the wide range in exam
scores and the amount of variance that exists between students’ grades.
Exhibit 10: Exam Summary Scores
Since only six students were in class, I defined “good-performance” on a question to be:
At most one person answers the question incorrectly. In other words, if 5 or 6 students (i.e.,
83% or 100% of class) answers a question correctly, then that is defined to be good-
performance on the question by the whole class. Exhibit 11 shows the results for the 76
multiple-choice questions.
Exhibit 11: Class Performance on Exam
Class performance # of questions (out of 76)
No one missed the question (i.e. all students answered it correctly) 57
One students missed the question (i.e., 83% answered it correctly) 7
Two students missed the question (i.e., 67% answered it correctly) 8
Three students missed the question (i.e., 50% answered it correctly) 3
Four students missed the question (i.e., 33% answered it correctly) 1
Five students missed the question (i.e., 17% answered it correctly) 0
Six students missed the question (i.e., no one answered it correctly) 0
22
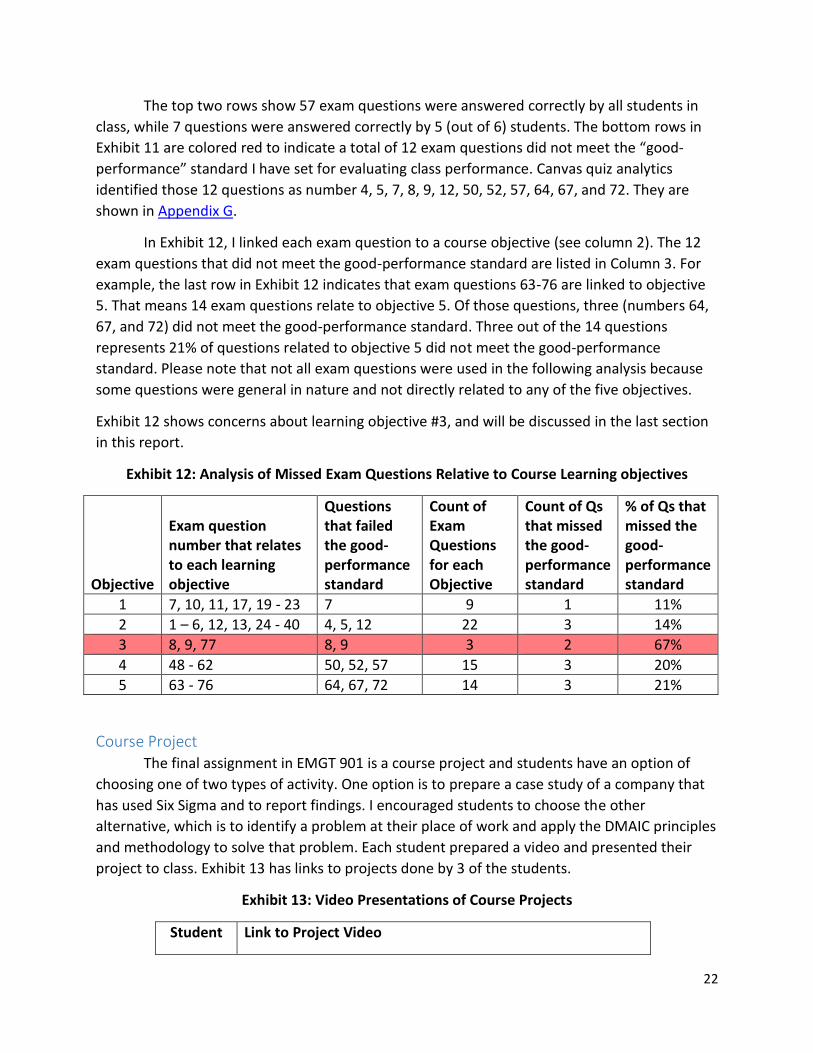
The top two rows show 57 exam questions were answered correctly by all students in
class, while 7 questions were answered correctly by 5 (out of 6) students. The bottom rows in
Exhibit 11 are colored red to indicate a total of 12 exam questions did not meet the “good-
performance” standard I have set for evaluating class performance. Canvas quiz analytics
identified those 12 questions as number 4, 5, 7, 8, 9, 12, 50, 52, 57, 64, 67, and 72. They are
shown in Appendix G.
In Exhibit 12, I linked each exam question to a course objective (see column 2). The 12
exam questions that did not meet the good-performance standard are listed in Column 3. For
example, the last row in Exhibit 12 indicates that exam questions 63-76 are linked to objective
5. That means 14 exam questions relate to objective 5. Of those questions, three (numbers 64,
67, and 72) did not meet the good-performance standard. Three out of the 14 questions
represents 21% of questions related to objective 5 did not meet the good-performance
standard. Please note that not all exam questions were used in the following analysis because
some questions were general in nature and not directly related to any of the five objectives.
Exhibit 12 shows concerns about learning objective #3, and will be discussed in the last section
in this report.
Exhibit 12: Analysis of Missed Exam Questions Relative to Course Learning objectives
Objective
Exam question number that relates to each learning objective
Questions that failed the good-performance standard
Count of Exam Questions for each Objective
Count of Qs that missed the good-performance standard
% of Qs that missed the good-performance standard
1 7, 10, 11, 17, 19 - 23 7 9 1 11%
2 1 – 6, 12, 13, 24 - 40 4, 5, 12 22 3 14%
3 8, 9, 77 8, 9 3 2 67%
4 48 - 62 50, 52, 57 15 3 20%
5 63 - 76 64, 67, 72 14 3 21%
Course Project The final assignment in EMGT 901 is a course project and students have an option of
choosing one of two types of activity. One option is to prepare a case study of a company that
has used Six Sigma and to report findings. I encouraged students to choose the other
alternative, which is to identify a problem at their place of work and apply the DMAIC principles
and methodology to solve that problem. Each student prepared a video and presented their
project to class. Exhibit 13 has links to projects done by 3 of the students.
Exhibit 13: Video Presentations of Course Projects
Student Link to Project Video
23
1 https://use.vg/q96bfv
2 https://use.vg/NGFszh
3 https://use.vg/tu0Qp3
Projects were evaluated on a rubric (see Appendix B). While presentations may have
had some minor delivery issues, the content was good and students followed the DMAIC
methodology of define the problem, measure and collect data, analyze the data, implement
solution to realize improvements, and control to continuously improve.
Given the 8-week nature of the course, students were very limited with what they could
do. Six Sigma projects often require months (if not years) from start to finish. In spite of this,
the course projects were actually quite good and reflective of how students are able to use
course content in their jobs. Several included estimates of cost savings that they expect to
realize and discussed plans to share their project with upper management to go full-scale with
what they started in the course project.
Case Students completed one case in teams (two teams of 3 persons, each). The case needed
analysis relating directly to objective 4. Case submissions are in Appendix H, and were graded
on a rubric. The two teams scored 90% and 98% on the case. This is evidence that based on this
assignment, objective 4 is achieved by learners.
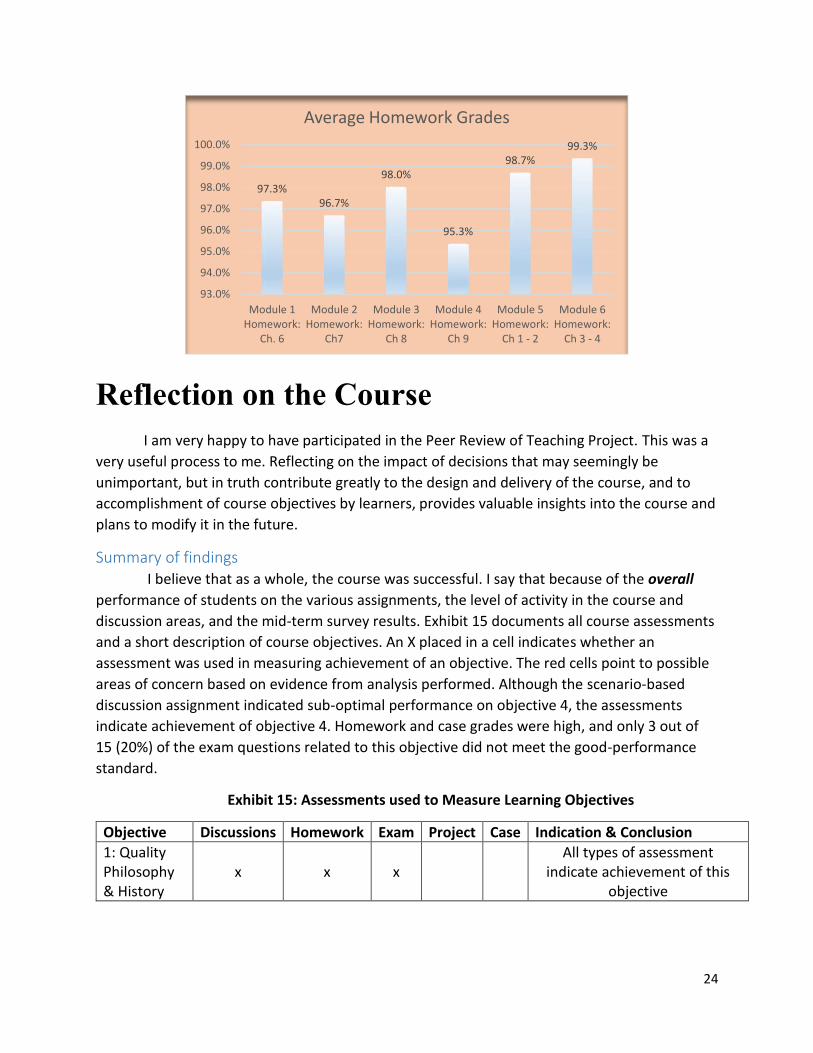
Homework Students completed six homework assignments which were linked to the various course
objectives. Each homework was worth 25 points. Overall, students performed very well and
demonstrated achievement of course objectives, as indicated by the homework. Exhibit 14
summarizes performance on homework as indicated by average score earned (reported as
percent). Minimum score earned by anyone was 22 points (88%). The highest standard
deviation on any homework was 1.07. Both of these statistics indicate that performance on
homework was very high and consistent among all students.
Exhibit 14: Average Homework Grades Expressed as % of 25 Points Possible
24
Reflection on the Course
I am very happy to have participated in the Peer Review of Teaching Project. This was a
very useful process to me. Reflecting on the impact of decisions that may seemingly be
unimportant, but in truth contribute greatly to the design and delivery of the course, and to
accomplishment of course objectives by learners, provides valuable insights into the course and
plans to modify it in the future.
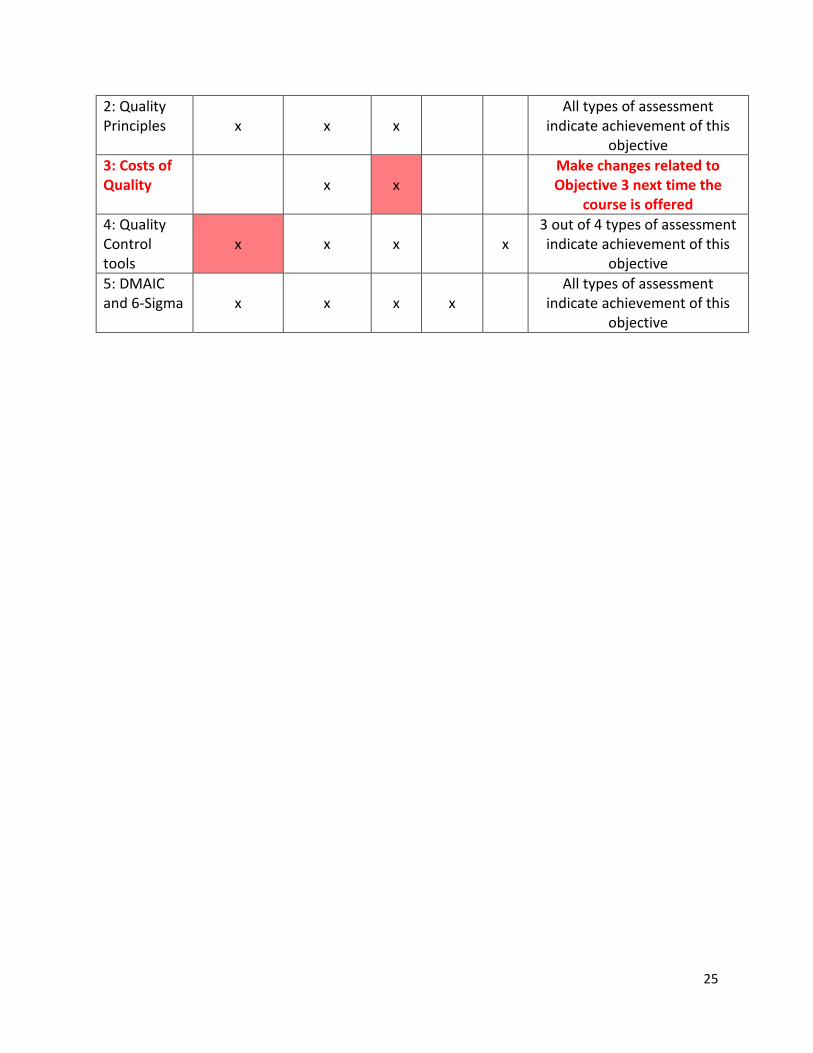
Summary of findings I believe that as a whole, the course was successful. I say that because of the overall
performance of students on the various assignments, the level of activity in the course and
discussion areas, and the mid-term survey results. Exhibit 15 documents all course assessments
and a short description of course objectives. An X placed in a cell indicates whether an
assessment was used in measuring achievement of an objective. The red cells point to possible
areas of concern based on evidence from analysis performed. Although the scenario-based
discussion assignment indicated sub-optimal performance on objective 4, the assessments
indicate achievement of objective 4. Homework and case grades were high, and only 3 out of
15 (20%) of the exam questions related to this objective did not meet the good-performance
standard.
Exhibit 15: Assessments used to Measure Learning Objectives
Objective Discussions Homework Exam Project Case Indication & Conclusion
1: Quality Philosophy & History
x x x All types of assessment
indicate achievement of this objective
97.3%96.7%
98.0%
95.3%
98.7%99.3%
93.0%
94.0%
95.0%
96.0%
97.0%
98.0%
99.0%
100.0%
Module 1Homework:
Ch. 6
Module 2Homework:
Ch7
Module 3Homework:
Ch 8
Module 4Homework:
Ch 9
Module 5Homework:
Ch 1 - 2
Module 6Homework:
Ch 3 - 4
Average Homework Grades
25
2: Quality Principles x x x
All types of assessment indicate achievement of this
objective
3: Costs of Quality x x
Make changes related to Objective 3 next time the
course is offered
4: Quality Control tools
x x x x 3 out of 4 types of assessment indicate achievement of this
objective
5: DMAIC and 6-Sigma x x x x
All types of assessment indicate achievement of this
objective

26
Objective 3 Objective 3 is of greatest concern to me. Exhibit 12 showed that only 3 exam questions
were dedicated to this objective. Perhaps if more questions were included, the law of averages
would kick in and a rosier picture might have been formed. Clearly this is one learning objective
which is in dire need of attention. I plan to do the following to improve students’ performance
as it relates to this objective.
I must re-examine and re-evaluate my teaching practices for Learning Objective 3. I must create
better instructional video(s) and look online for supplemental resources. I should include more
problems and questions about this topic on the homework and in formative assessments. I
could even design a course activity where the student must collect data from their work and
perform an analysis to discuss how poor quality drives up various costs and how it affects
bottom line.
Allocating more time and resources to this objective is definitely warranted when I teach the
course next time. Also, more ore exam questions should be devoted to that objective. Three
questions is not enough.
Objective 4 In evaluating results of the scenario-based discussion, it may appear that course
objective 4 is not fully achieved by all students. Of course, the scenarios are short and do not
reveal much details to use in making the call on which quality tool best fit them. This may have
contributed to incorrect responses by some students. Also, one may make the case (with
proper explanation and assumptions) that more than one tool could be used to address a
scenario. However, students did not elaborate on such detail when presenting their answers
because instructions did not require them to do so. In the future, I will expand on the
instructions for this discussion assignment to enable students to provide the proper context in
support of their choices.
In looking back at the homework for that module, I see that I have included very few
questions directly relating to tools for quality improvement and control. Additionally, there are
few course resources which are dedicated to this topic. The American Society for Quality (ASQ)
has a Resource page with templates and examples of each of the tools of quality. The next time
I teach this course, I must be very deliberate in integrating some of those resources as activities
in the course to better familiarize students with those tools and to improve the outcomes.
I still maintain that based on the varied types of assignments related to this objective (as
evidenced in Exhibit 14), this learning outcome is not of great concern. However, including
better instructions and deliberately including targeted course resources and more focused
instruction will help improve the outcomes for learning objective 4.
27
Other findings In the mid-term survey, one student commented that the course is only reading the
book and no lectures from me! This is clearly contradictory to what others have indicated, as I
prepare and share several video lectures in each module, as well as other resources from the
web, articles, TED talks, etc. Perhaps this student skipped over all those resources. This may be
because I don’t have a quiz or homework over all of it.
Another student in the mid-term survey commented that perhaps I should have a
couple of homework questions related to my videos in each module. My original reason for not
making the videos mandatory was to give the students some freedom in choosing the content
with which they interact. However, in light of the comment, the next time I teach this course, I
plan to include a couple of homework questions about some detail covered in one or more of
my instructional videos in each module.
Final Thoughts This PRTP was quite eye opening for me. Given my level of confidence in course design
and good teaching practices, as summarized graphically with the House of Quality shown here
(Exhibit 2 is replicated), I knew I had all the pieces
in proper place: objectives, assessments,
materials, activities, and tools. However, it took
quite a long time and a lot of sifting through all the
material to fully explore the relationships between
the assessments and objectives in my PRTP
course, and to determine whether
instructional materials, activities, and
tools/technologies are effective in helping
students achieve the learning outcomes. All I
can say is that I wish I were able to do this for
each and every course that I will develop and
teach from now on. I know that is not
realistically possible. However, each time a small portion of a course can be examined to
gradually make it better and better over time.

28
Appendices

29
Appendix A: Syllabus University of Nebraska - Lincoln
College of Engineering
Syllabus: ENGR 901 (sec. 911) Total Quality Management Using Six Sigma
Spring-A 2019 Mini Session (Jan. 7 – Mar. 1) 8 weeks/ 3 credit hours/Fully Online Course
Instructor Dr. Jena Shafai Asgarpoor (a.k.a.: Dr. J.)
Office Location My office is in Omaha, but I live in Lincoln and work from here almost entirely. If you need to see me, please make prior arrangements.
Office Phone # 402.554.2089 (Will go to my cell if I don’t answer)
Cell Phone # 402.440.2626
Email address [email protected]
Office Hours By appointment
Phone call or Zoom
If your questions are not addressed in the discussion area and you would like to speak or visit with me, we can speak on the phone or a Zoom video conference. Email me and we can schedule.
Home Page https://engineering.unl.edu/durhamschool/faculty/jena-shafai-asgarpoor/
Prerequisite
Graduate Standing and successful completion of Probability & Statistics (MECH 321 or equivalent)
Program and Course Philosophy
Undergraduate education ensures learning primarily through teaching and transmission. The Master of
Engineering Management (MEM) program is for career professionals with work experience. It assumes
andragogy, which postulates that the adult learner is a self-directed, autonomous, and internally
motivated individual who draws on their own existing knowledge and past life & work experiences,
actively interacts with peers at work and in class, and contemplates questions and controversies to
discover facts, relationships, and new knowledge. This is a course in the MEM program and subscribes to
the same Program philosophy.
Course Description/Purpose
Statistical quality control and improvement is more than an engineering concern. Quality management
is a major business strategy for increasing productivity and gaining competitive advantage in all
industries and types of organizations. This course covers differing perspectives and definitions of quality;
tools and techniques for managing quality and continuous improvement; statistical methods; creation
and interpretation of variable and attribute control charts; and Six Sigma tools for detection and
isolation of sources of variation, process control, and capability analysis. The goal is to develop an
operational use and familiarity with contemporary methods that are effective in managing quality,
including Six Sigma.
30
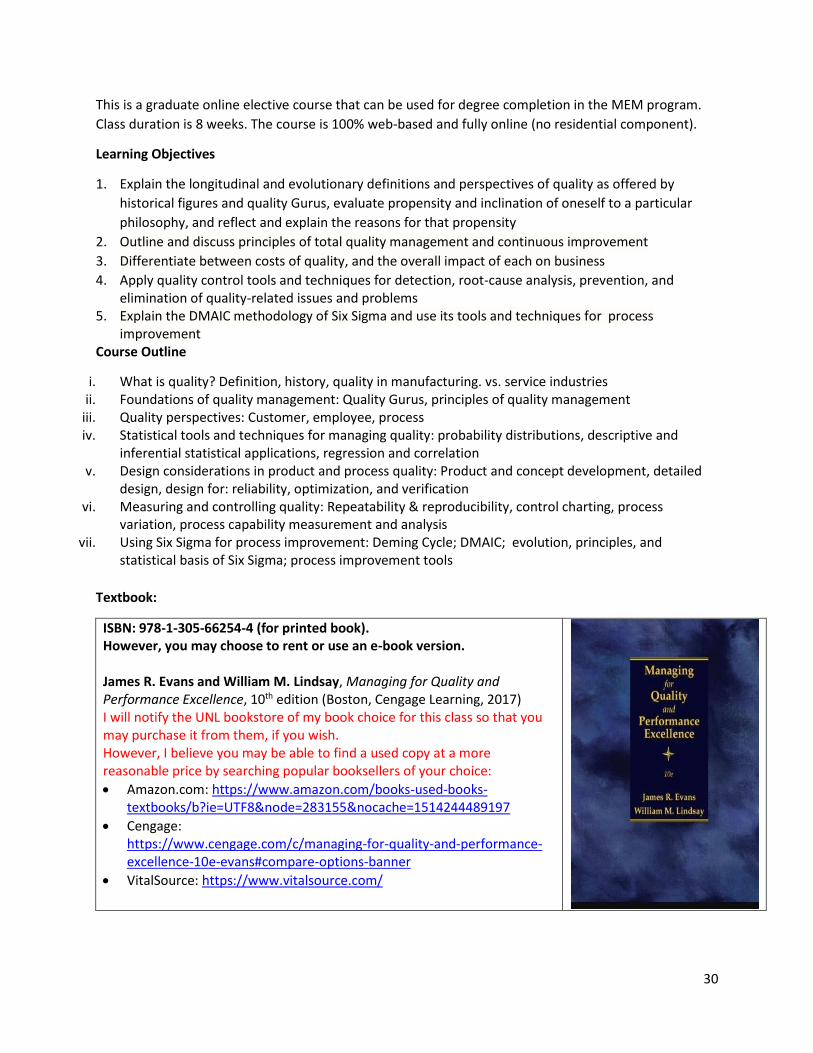
This is a graduate online elective course that can be used for degree completion in the MEM program.
Class duration is 8 weeks. The course is 100% web-based and fully online (no residential component).
Learning Objectives
1. Explain the longitudinal and evolutionary definitions and perspectives of quality as offered by
historical figures and quality Gurus, evaluate propensity and inclination of oneself to a particular
philosophy, and reflect and explain the reasons for that propensity
2. Outline and discuss principles of total quality management and continuous improvement
3. Differentiate between costs of quality, and the overall impact of each on business
4. Apply quality control tools and techniques for detection, root-cause analysis, prevention, and elimination of quality-related issues and problems
5. Explain the DMAIC methodology of Six Sigma and use its tools and techniques for process improvement
Course Outline
i. What is quality? Definition, history, quality in manufacturing. vs. service industries ii. Foundations of quality management: Quality Gurus, principles of quality management
iii. Quality perspectives: Customer, employee, process iv. Statistical tools and techniques for managing quality: probability distributions, descriptive and
inferential statistical applications, regression and correlation v. Design considerations in product and process quality: Product and concept development, detailed
design, design for: reliability, optimization, and verification vi. Measuring and controlling quality: Repeatability & reproducibility, control charting, process
variation, process capability measurement and analysis vii. Using Six Sigma for process improvement: Deming Cycle; DMAIC; evolution, principles, and
statistical basis of Six Sigma; process improvement tools
Textbook:
ISBN: 978-1-305-66254-4 (for printed book). However, you may choose to rent or use an e-book version. James R. Evans and William M. Lindsay, Managing for Quality and Performance Excellence, 10th edition (Boston, Cengage Learning, 2017) I will notify the UNL bookstore of my book choice for this class so that you may purchase it from them, if you wish. However, I believe you may be able to find a used copy at a more reasonable price by searching popular booksellers of your choice:
• Amazon.com: https://www.amazon.com/books-used-books-textbooks/b?ie=UTF8&node=283155&nocache=1514244489197
• Cengage: https://www.cengage.com/c/managing-for-quality-and-performance-excellence-10e-evans#compare-options-banner
• VitalSource: https://www.vitalsource.com/

31
Canvas Learning Management System (LMS)
Canvas is our virtual classroom where course content, grades, and communication will reside and
discussion will take place in this course.
• The URL to access Canvas is: http://canvas.unl.edu • For Canvas, passwords, or any other computer-related technical support, please contact the IT Help
Center (Phone: 402-472-3970; Submit a support ticket: [email protected])
Academic Integrity Policy
UNL is committed to academic excellence. Academic honesty from all University members is essential in
achieving that objective. Academic honesty includes adherence to guidelines established by the
instructor in a particular course. It prohibits representing the work of others to be one’s own
(plagiarism*); tampering with library, computer or student materials; or facilitating dishonesty by
others. Penalties for academic dishonesty may range from a grade of “F” on the work in question or for
the course, to expulsion from the University. The Student Handbook provides detailed information
pertaining to academic dishonesty, including procedures for determining disciplinary action.
*Plagiarism is defined as appropriation of the words, ideas, or creations of another without crediting the
source.
UNL Academic Integrity Policy: http://www.unl.edu/gradstudies/current/integrity
UNL Student Code of Conduct: http://stuafs.unl.edu/dos/code
Withdrawal Statement
If you wish to discontinue participation in class, you must contact the MEM program coordinator to
inquire about options, deadlines, and possible repercussions.
ADA Information
The University strives to make all learning experiences as accessible as possible. If you anticipate or
experience barriers based on your disability (including mental health, chronic or temporary medical
conditions), please let me know immediately so that we can discuss options privately. To establish
reasonable accommodations, I may request that you register with Services for Students with Disabilities
(SSD). If you are eligible for services and register with their office, make arrangements with me as soon
as possible to discuss your accommodations so they can be implemented in a timely manner. SSD contact
information: 232 Canfield Admin Bldg.; 402-472-3787. You may also visit this site for more information:
http://www.unl.edu/ssd/
Instructor Expectations:
1. The instructor will respond to students’ questions within 48 hours, excluding weekends and holidays.
2. Feedback on assignments will be given weekly. 3. If the instructor is unable to meet the above expectations, he/she will notify the students. 4. The final grade is determined using the weighed percentage points accumulated. 5. Final course grades will be submitted to the Registrar’s office within the time permitted by that
office for instructors to process grades.

32
Student Expectations
1. This is an Online Class, not a Self-Study Distant Education class. Unless your inquiry is personal in nature and demands privacy (such as discussing grade, standing in class, etc.), all course-related and content-related questions must be posted to the Discussion area in Canvas. My response to your inquiries will quite likely benefit others in class. Therefore, please reserve email communication for only private/personal matters that are not appropriate for Canvas Discussion. If you email me with a request that is appropriate to be posted to the Discussion area, I will direct you to do so, and then I will respond in there.
2. Students will prepare for and actively participate in the discussion boards. 3. Students are expected to respond to, verify, challenge, or otherwise expand upon fellow student’s
comments each week throughout the course. 4. Students are expected to fully participate in their team and for all team assignments and make
quality and timely contributions to the team in support of completion of group assignments. If a team member does not participate in the manner described, it is the responsibility of the team members to exclude his/her name from the submission. Also, the team must designate an individual to “email the professor” and report the incident.
5. All assignments are due by the prescribed date. Should a student request additional time to complete assignments, due to unforeseen circumstances, written request and justification must be provided. Permission is not guaranteed and is at the discretion of instructor.
6. Class Courtesy: All students have a right to express their opinion in a courteous and professional manner. Each student shall respect this right and allow other students to express their opinion in the DBs and in-group discussion areas.
Assignment Types
1. Read and Review Course Resources
• Reading assigned pages in the book
• Reading any articles that may be helpful in completing assignments
• Watching any videos that may be helpful in understanding the material and completing assignments 2. Discussion and Replies
• DB activity (original posts & responses as specified) graded on a rubric determine weekly DB grades.
• Read section “Class Discussion Board (DB) Activity and Expectations”, later in this syllabus. 3. NOT GRADED – Learning Journals This assignment helps you reflect on the readings so that you may put in perspective how quality
issues/topics are addressed in your job or at your company. Although not submitted (not graded) you
must complete the assignment because a discussion in the final module is based on your journal entries.
4. NOT GRADED – Practice Problem Solving To successfully complete the course and the exam you must practice problem solving on a regular
basis for the modules which cover quantitative content. The end-of-chapter problems are good for
this purpose and for every chapter, solutions to a few of the problems will be provided in Canvas.
You must attempt solving those problems on your own prior to reviewing the solutions provided.
5. Homework
• Although not a quiz, homework is administered using the Quiz function of Canvas. It is NOT a quiz because it is not timed. You will have access to homework early on Monday of each module. You must submit your answers on the last day of the module. You may open the homework and review it during the module as you study, then submit your answers when you are finished.

33
• Homework is objective in nature and in multiple-choice format. Items on the homework could be conceptual questions or problems to solve. You must pick the best answer which is closest to your own answer, among several options provided.
6. Group Case You must complete one case in a team environment. You will be given an extra week to collaborate
and prepare your submission.
7. Project In Module 8, you must submit your project. In the spirit of full-transparency, please read the following so you are not caught off guard. You should start thinking about the project and start planning for it early. We are covering chapters 6 - 9 in the first half of the course so that you will have time to plan and complete the project by the due date in last module. You must prepare and submit a video in which you present your project’s deliverables and outcomes, using PPT slides. The video can be 10 – 15 minutes long. You may use VidGrid technology to prepare the video. It is free and instructions are in our Canvas course. A. The project descriptions and guidelines are purposefully not rigid or prescriptive so you may have
some leeway and flexibility to make this a helpful and relevant assignment to your job, education, and learning process. The following are two project options from which you may choose. I highly encourage you to choose option A, if at all possible. Identify an important problem at your place of work. Apply the DMAIC process to develop an improved solution. You must either use existing data or collect relevant data to perform appropriate analysis and use the results to justify your findings and recommendations. . Use whatever process improvement tools (discussed in chapter 9) that are appropriate. You may also use the tools discussed in chapters 6 - 8. If possible, report financial implications and estimated/projected cost savings.
B. Locate a company that is using Six Sigma or lean principles. Prepare a case study of their experiences. Focus on: problems they chose to address; the specifics of their implementation; challenges they faced during the implementation process; outcomes of the process; success and/or failures; cost savings, ROI, financial implications, etc.; impact of the initiative on the employees, customers, and organization, in general; any other relevant information that you believe is important to report.
8. Final Exam
• You will have several days to complete the exam (i.e., it is not given under timed setting).
• It will contain multiple-choice questions, similar in design to the weekly multiple-choice homework. Some may be problems to solve and others may be conceptual in nature.
• The exam may also include a few problems to solve and submit answer files.
• The format of the exam will be similar to weekly HW.
Class Discussion Board (DB) Activity and Expectations
• During each week of this course, students will be asked to participate in the electronic discussion boards by posting: o ONE original message o TWO replies in the form of substantive comments, questions, or responses to messages posted
by peers
• The purpose is to create an interactive dialogue that draws from the experience of the entire class, to create a body of knowledge that has value to everybody.
• Students must fully engage in discussions of pertinent topics for each week.
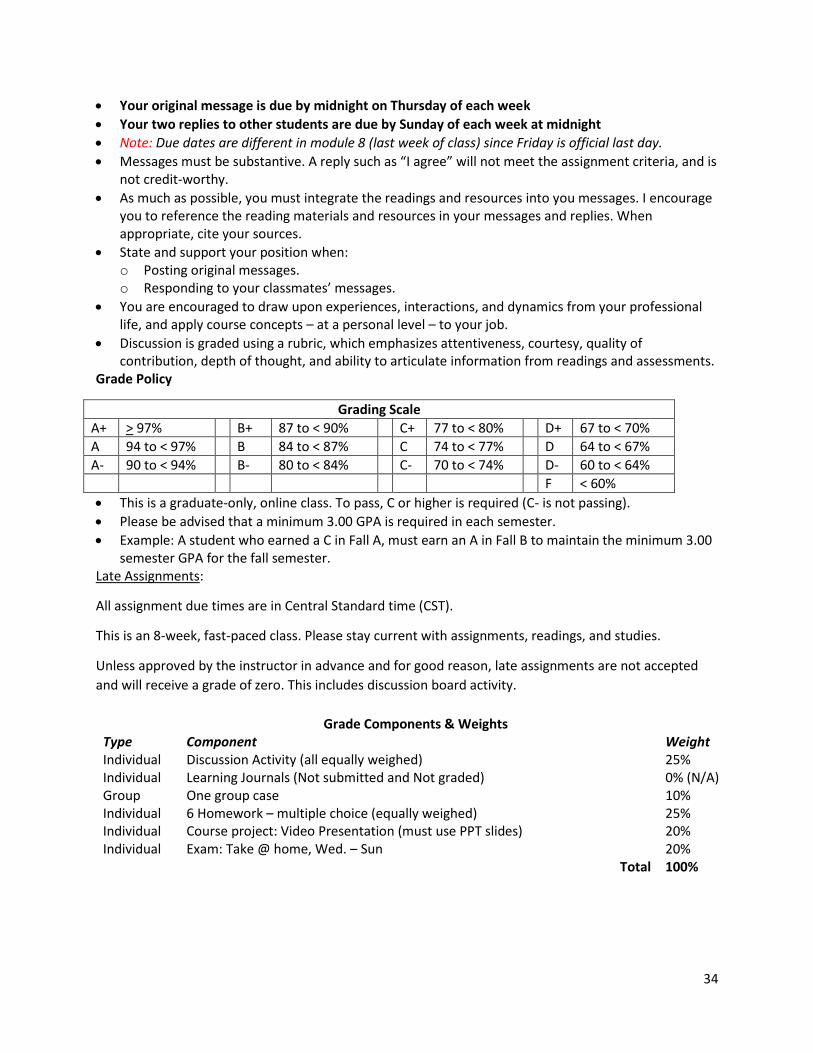
34
• Your original message is due by midnight on Thursday of each week
• Your two replies to other students are due by Sunday of each week at midnight
• Note: Due dates are different in module 8 (last week of class) since Friday is official last day.
• Messages must be substantive. A reply such as “I agree” will not meet the assignment criteria, and is not credit-worthy.
• As much as possible, you must integrate the readings and resources into you messages. I encourage you to reference the reading materials and resources in your messages and replies. When appropriate, cite your sources.
• State and support your position when: o Posting original messages. o Responding to your classmates’ messages.
• You are encouraged to draw upon experiences, interactions, and dynamics from your professional life, and apply course concepts – at a personal level – to your job.
• Discussion is graded using a rubric, which emphasizes attentiveness, courtesy, quality of contribution, depth of thought, and ability to articulate information from readings and assessments.
Grade Policy
Grading Scale
A+ > 97% B+ 87 to < 90% C+ 77 to < 80% D+ 67 to < 70%
A 94 to < 97% B 84 to < 87% C 74 to < 77% D 64 to < 67%
A- 90 to < 94% B- 80 to < 84% C- 70 to < 74% D- 60 to < 64%
F < 60%
• This is a graduate-only, online class. To pass, C or higher is required (C- is not passing).
• Please be advised that a minimum 3.00 GPA is required in each semester.
• Example: A student who earned a C in Fall A, must earn an A in Fall B to maintain the minimum 3.00 semester GPA for the fall semester.
Late Assignments:
All assignment due times are in Central Standard time (CST).
This is an 8-week, fast-paced class. Please stay current with assignments, readings, and studies.
Unless approved by the instructor in advance and for good reason, late assignments are not accepted
and will receive a grade of zero. This includes discussion board activity.
Grade Components & Weights Type Component Weight Individual Discussion Activity (all equally weighed) 25% Individual Learning Journals (Not submitted and Not graded) 0% (N/A) Group One group case 10% Individual 6 Homework – multiple choice (equally weighed) 25% Individual Course project: Video Presentation (must use PPT slides) 20% Individual Exam: Take @ home, Wed. – Sun 20% Total 100%
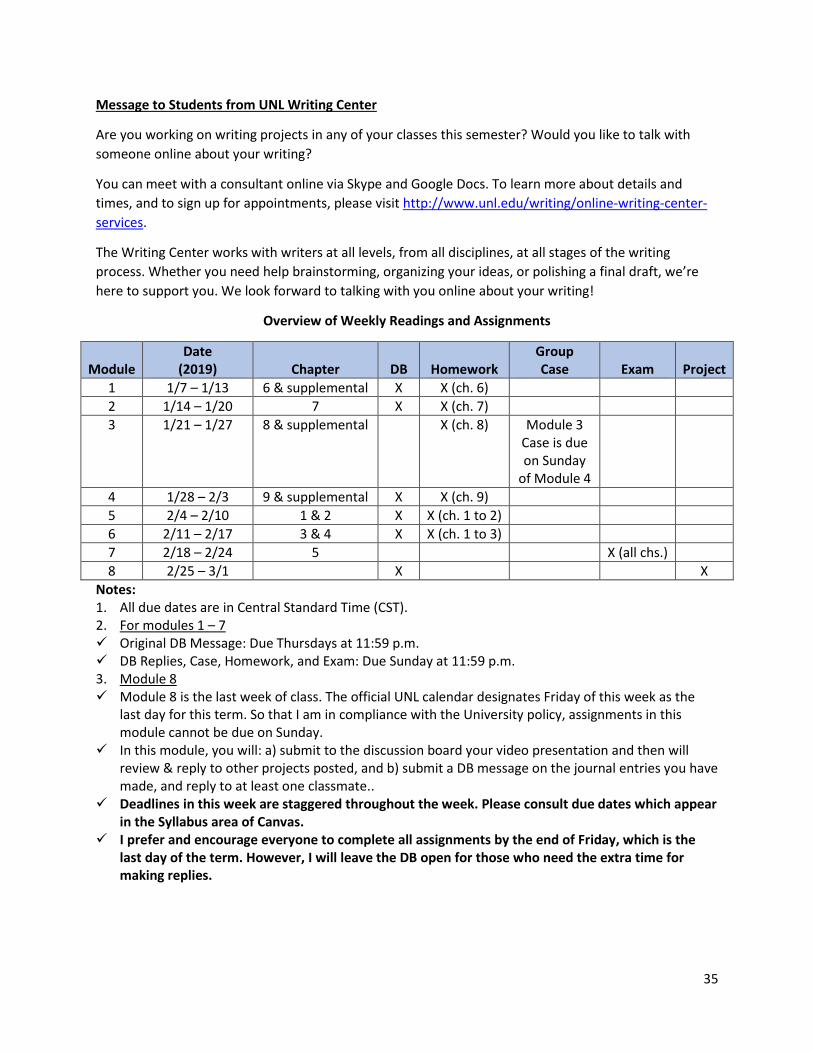
35
Message to Students from UNL Writing Center
Are you working on writing projects in any of your classes this semester? Would you like to talk with
someone online about your writing?
You can meet with a consultant online via Skype and Google Docs. To learn more about details and
times, and to sign up for appointments, please visit http://www.unl.edu/writing/online-writing-center-
services.
The Writing Center works with writers at all levels, from all disciplines, at all stages of the writing
process. Whether you need help brainstorming, organizing your ideas, or polishing a final draft, we’re
here to support you. We look forward to talking with you online about your writing!
Overview of Weekly Readings and Assignments
Module
Date (2019)
Chapter
DB
Homework
Group Case
Exam
Project
1 1/7 – 1/13 6 & supplemental X X (ch. 6)
2 1/14 – 1/20 7 X X (ch. 7)
3 1/21 – 1/27 8 & supplemental X (ch. 8) Module 3 Case is due on Sunday
of Module 4
4 1/28 – 2/3 9 & supplemental X X (ch. 9)
5 2/4 – 2/10 1 & 2 X X (ch. 1 to 2)
6 2/11 – 2/17 3 & 4 X X (ch. 1 to 3)
7 2/18 – 2/24 5 X (all chs.)
8 2/25 – 3/1 X X
Notes: 1. All due dates are in Central Standard Time (CST). 2. For modules 1 – 7 ✓ Original DB Message: Due Thursdays at 11:59 p.m. ✓ DB Replies, Case, Homework, and Exam: Due Sunday at 11:59 p.m. 3. Module 8 ✓ Module 8 is the last week of class. The official UNL calendar designates Friday of this week as the
last day for this term. So that I am in compliance with the University policy, assignments in this module cannot be due on Sunday.
✓ In this module, you will: a) submit to the discussion board your video presentation and then will review & reply to other projects posted, and b) submit a DB message on the journal entries you have made, and reply to at least one classmate..
✓ Deadlines in this week are staggered throughout the week. Please consult due dates which appear in the Syllabus area of Canvas.
✓ I prefer and encourage everyone to complete all assignments by the end of Friday, which is the last day of the term. However, I will leave the DB open for those who need the extra time for making replies.
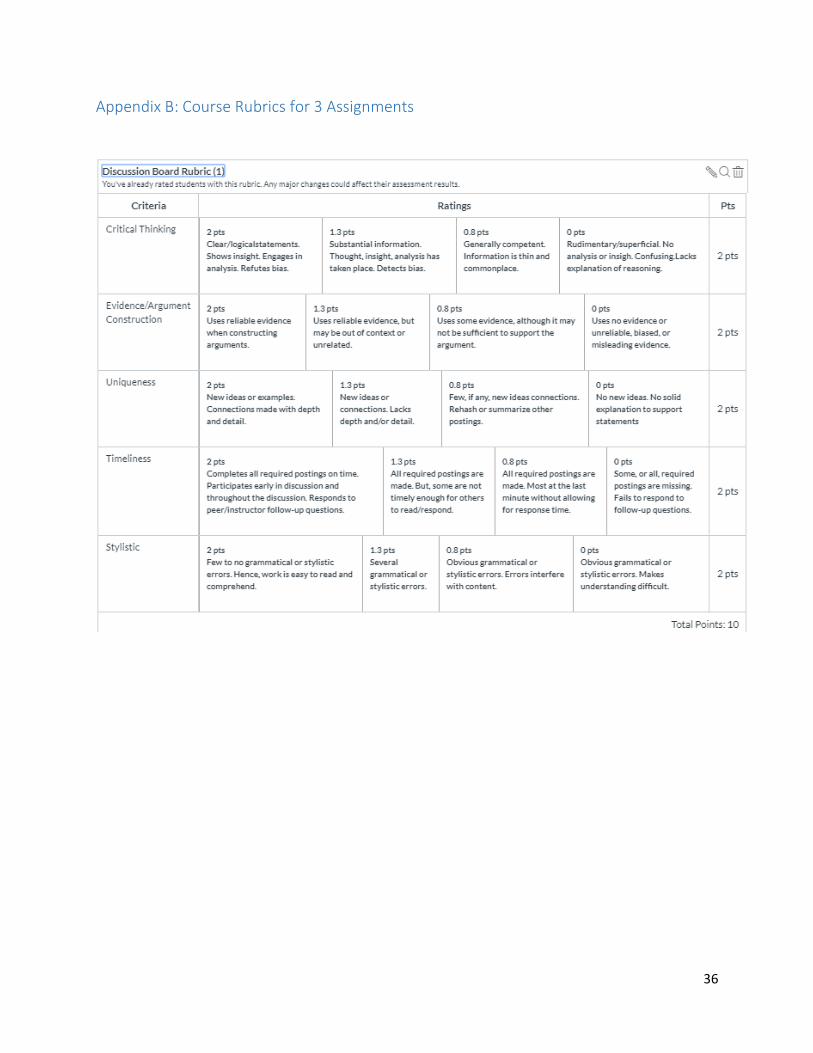
36
Appendix B: Course Rubrics for 3 Assignments
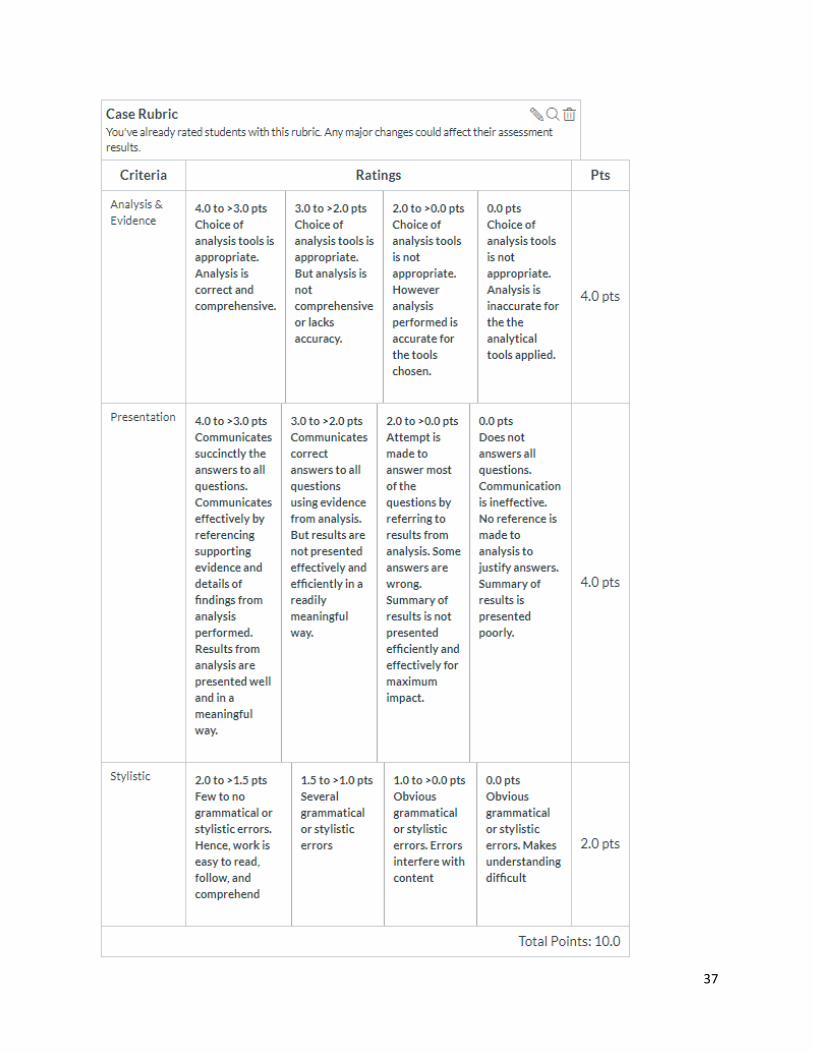
37

38
39
Project Rubric (continued)

40
Appendix C: Sample Graded Discussion Assignment (Module 6)
Module 6 DB activity
Please be familiar with section in the syllabus, which describes DB activity expectations.
In 200 -300 words to answer ONE of the following questions. Include the text of the
question that you answer at the top of your message. This will not be included in the
word count.
1. Watch the videos provided in this module for chapter 4. A) Select two statements (themes) made by the presenters; one with which you agree,
and one with which you disagree. If you would like to include more than two in your
post, please do so.
B) List each point specifically as presented in the video.
C) Clearly identify which video it comes from: a) Employee Involvement, b) The Perfect Boss,
c) Holacracy
D) State whether you agree or disagree with it, state the reason why, and give examples of
experiences that you have had which fuel your stand on the issue.
2. Thinking of the Kano model, should organizations pay the most attention to dissatisfiers,
satisfiers, or the exciters/delighters? Defend your choice with appropriate examples. Would
this depend on the type of industry or environment in which an organization competes?
What is your choice for your organization and WHY?
3. What is your reaction to the quote about Toyota in the opening paragraph of chapter 4?
Would such an observation be true of your organizations? Is it really true that competitors
cannot copy the human resources of an organization? Why or why not?
4. Refer to the article that you read this week at this
site: https://www.americanexpress.com/us/small-business/openforum/articles/how-to-get-
your-staff-to-go-the-extra-mile/?linknav=us-openforum-search-article-link2 (Links to an
external site.)Links to an external site.. Share your reactions to the article. Do you
agree? Discuss how your experiences at your present (or past) employers align with them.
Please elaborate and provide examples, as relevant.
5. Research a company that is known for its high-performance work culture. Report your
findings in the form of a few specific practices that they have used to achieve employee
engagement, involvement, and satisfaction, and to sustain that culture. If at all possible,
relate to topics that are discussed in our book. Give proper citation for your sources.
Post replies to your peers in the DB. Due: Sunday of this week at midnight.
Post at least two reply messages in this week’s DB area (each reply 150 – 200 words).
Please be familiar with section in the syllabus which describes DB activity expectations.
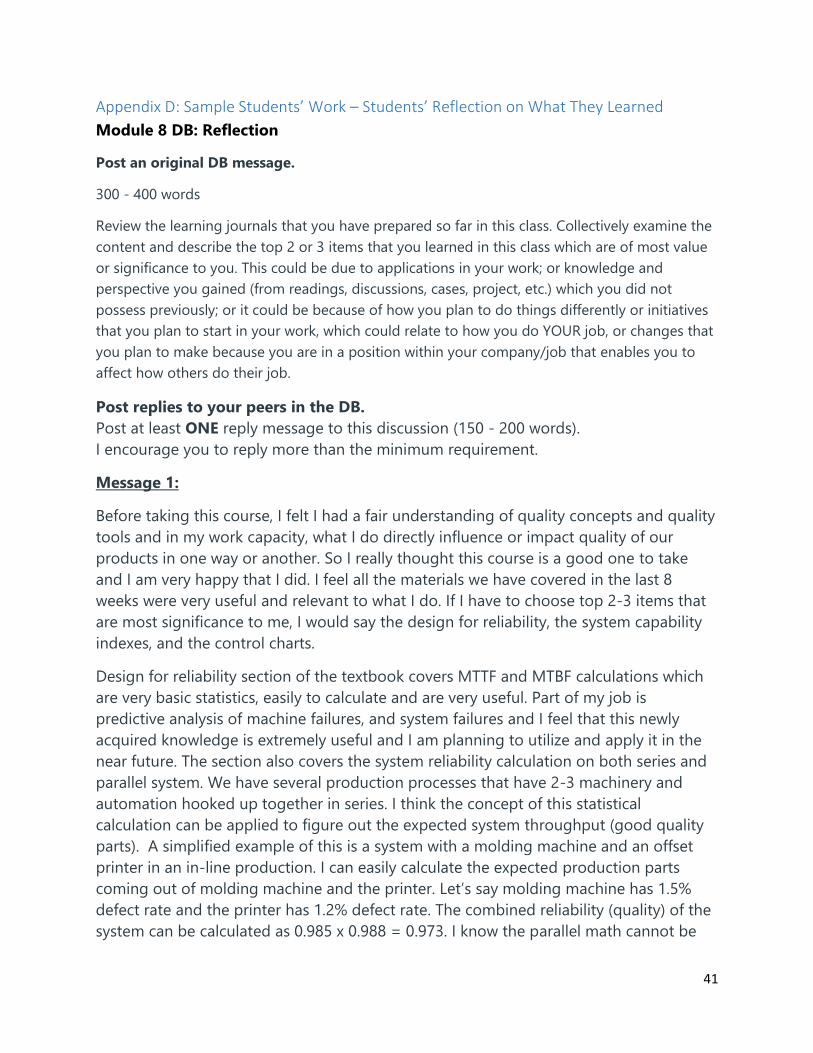
41
Appendix D: Sample Students’ Work – Students’ Reflection on What They Learned
Module 8 DB: Reflection
Post an original DB message.
300 - 400 words
Review the learning journals that you have prepared so far in this class. Collectively examine the
content and describe the top 2 or 3 items that you learned in this class which are of most value
or significance to you. This could be due to applications in your work; or knowledge and
perspective you gained (from readings, discussions, cases, project, etc.) which you did not
possess previously; or it could be because of how you plan to do things differently or initiatives
that you plan to start in your work, which could relate to how you do YOUR job, or changes that
you plan to make because you are in a position within your company/job that enables you to
affect how others do their job.
Post replies to your peers in the DB.
Post at least ONE reply message to this discussion (150 - 200 words).
I encourage you to reply more than the minimum requirement.
Message 1:
Before taking this course, I felt I had a fair understanding of quality concepts and quality
tools and in my work capacity, what I do directly influence or impact quality of our
products in one way or another. So I really thought this course is a good one to take
and I am very happy that I did. I feel all the materials we have covered in the last 8
weeks were very useful and relevant to what I do. If I have to choose top 2-3 items that
are most significance to me, I would say the design for reliability, the system capability
indexes, and the control charts.
Design for reliability section of the textbook covers MTTF and MTBF calculations which
are very basic statistics, easily to calculate and are very useful. Part of my job is
predictive analysis of machine failures, and system failures and I feel that this newly
acquired knowledge is extremely useful and I am planning to utilize and apply it in the
near future. The section also covers the system reliability calculation on both series and
parallel system. We have several production processes that have 2-3 machinery and
automation hooked up together in series. I think the concept of this statistical
calculation can be applied to figure out the expected system throughput (good quality
parts). A simplified example of this is a system with a molding machine and an offset
printer in an in-line production. I can easily calculate the expected production parts
coming out of molding machine and the printer. Let’s say molding machine has 1.5%
defect rate and the printer has 1.2% defect rate. The combined reliability (quality) of the
system can be calculated as 0.985 x 0.988 = 0.973. I know the parallel math cannot be

42
applied in the same manner but the point is that with some understanding of statistics,
most of the concepts learned can be applied to other things as well.
Process capability index calculation. We have our production software that already track
and report the CP and Cpk of molding machines. However the system doesn’t track and
report Cpk for the system (machine + printer or machine + robot). Most of our
production lines are series of machinery and automation, with the new knowledge and
understanding for process capability calculation, I now can figure out the true capability
of our process and not just a capability of an individual equipment reported by our
software.
Control charts, again our molding machines do have control charts built-in so we can
monitor the machine parameters if they are in control or drifting away from the
intended settings. I do utilize the control charts a lot when we have quality issues but I
never constructed one myself. Many of the equipment do not have the built-in control
charts so we didn’t have to ability to closely monitor it like we can on the molding
machines. Now that I know how to construct a control charts for both variable and
attribute data, I am planning to apply this knowledge on so many things in our
production process that I feel needed to be monitored and controlled. Much of the
needed data is already being recorded and available to me, all I need to do is to decide
the sample size, the interval, and start constructing and utilizing more of the control
charts to help us monitor the processes.
Message 2
Overall, this class has been pretty eye opening to me in a lot of ways. While I did not
consider myself a quality expert by any means, I did feel like I had a pretty good
understanding of quality in general based on my experiences that I have had in my
workplace over the past 3 years I have been there. I really could not have been more
wrong about that. I think there are a couple things that really stuck out to me, and will
really stick with me moving forward.
The first item is just the pure technical knowledge that I was able to gain in the course,
particularly chapters 6-9. I really invested in trying to learn the charts, the reasons for
them, and the statistics behind them. Statistics wasn’t necessarily something that I felt
overly confident in talking about when it first came to looking at the charts, but now I
feel like I have a much better understanding of them. I will be able to use that
knowledge to contribute much more within my organization moving forward into the
future, and hopefully use that to make some changes for the better as well. I have
already been talking to the quality department about which types of charts they are
using in our daily setups, monitoring, and reporting, and I am hoping to help us make
sure we are using the right tools in the right places.

43
The second item is less technical, but is more about the quality mindset. Reading the
philosophies of Deming, Juran, and Crosby, I could draw on certain points of all of them
that I agree with. I think the culture and mindset is key to success in an organization,
and it is no different with quality. I will work to bring this mindset to my organization,
and use my knowledge to help push us in the correct direction moving forward. As our
plant continues to move areas from ISO90001 to IATF16949, I feel like I can help use this
knowledge to really push us in the correct direction.
Overall, I m very happy that I was to take this class, as I feel that it provides me with a
great base to continue learning more in the future in regards to Quality and Quality
Management.
Message 3
The most shocking concept I learned about is on Page 15 in the textbook and talks
about how perception of a product by the workers actually affected the overall “quality”
as perceived by the customers. I believe this to be true based on what I’ve seen at my
current job. When a team focuses on the final product, their work tends to be more
meaningful than the team who focuses on fixing immediate issues and sticking to a rigid
process. Quality work is only achieved when workers think in terms of, “How will this
affect my customer?” At work, we were always encouraged to pretend we were in the
customer’s shoes and imagine the things they would want to see as a direct result of our
work. Going forward, it’s important to have a customer focus to ensure I am producing
quality work for both internal and external customers.
The most useful tools I have learned about are the X-Bar and R charts. Both of these
process control charts were extremely helpful in visualizing issues and patterns within
data sets. Scatter charts only tell half the story and give information that relates to raw
data, but X-Bar and R charts tell if you have quality issues. A process isn’t useful if its
outputs repeatedly fail to fall within specification. These charts would be helpful in a
Development setting since this would allow me to interpret data and determine which
course of action would be appropriate for an unknown quantity. I actually used these
charts in my Final Project and will be showcasing an example with regards to a
Contamination Study.
The most useful concept I have learned about is Process Benchmarking. This involves
looking at other groups and seeing how they conduct business that is similar to your
own. In my current job, I run a weekly meeting where we teardown axles and review
components. I’ve focused much of my MEM studies on this weekly review and so far
have received fantastic results! However, the process is still far from perfect and does

44
have some drawbacks. I’m hoping to benchmark my review meeting against other
departments and see if I can borrow ideas to make my own meeting more efficient.
Message 4
In reviewing my journal entries throughout the class, I think that the three most significant
topics that I learned about include the DMAIC approach to problem solving, the use of design
reviews in the product development process to facilitate an effective design from start to finish,
and the use of ANOVA studies to compare the means of multiple populations. The first item,
DMAIC, is very commonly applied in my workplace. The quality manager drives problem solving
using this process and even requires a formal write up for all major systemic problems solved in
the department using this DMAIC outline. When I first entered the organization, I was not very
familiar with the structure. Through the readings, homework, and final project, I am now much
more affluent in the topic and will be able to handle this type of problem solving approach
much more effectively in the future. The second significant topic that I learned about in this
class includes the use of structure design reviews at set stages in the product development cycle
to facilitate an effective design from start to finish. I was first introduced to this structured
design review process and how it can positively influence the product development process in
my first position right out of school. After moving into a new position at Motorola, I now see the
opposite end of the spectrum. I have personally experienced how the absence of these design
reviews can negatively affect the success of a new product launch. Through the readings, I am
now much more familiar with the proper way to structure these reviews and will use this
knowledge to drive change in my organization. The last significant topic that I learned in this
class is the use of ANOVA studies to compare the means of multiple populations. It is very
common that I run a DOE at work to standardize a process, and previously I was not aware of
this ANOVA study and it's true capability. It is so much easier to analyze data and recommend
standard parameters using this tool instead of comparing process means individually. It truly
takes the guesswork out of certain types of analyses that I perform on a frequent basis.This has
already shown great benefit in my daily work as it seems to be a much more effective tool to
present recommendations to management after a study is performed. I will continue to use
these three significant topics in my everyday work to drive change and improve operational
efficiency which I would not have been able to do as quickly or effectively without taking this
course in total quality management.
Message 5
I think the biggest part I am going to take away from this class is a new way of thinking.
It added a whole deeper element behind management and techniques that I can use to
make my management style stronger. I truly enjoyed learning from all of you and
hearing about your experiences in an industry different than my own.
There are two lessons that really stood out to me. The first item is something I want to
adopt into my own personal life as well as professionally. At first, I thought Crosby’s

45
belief of Zero Defects as a performance standard was too strict and unrealistic. However,
after some thought, it is the type of thinking and mentality that everyone should have. If
you don’t strive to have a perfect first attempt, then (as Crosby mentioned) you
anticipate error. This thinking lowers your personal standards and let’s you become
lackadaisical in your work. After this lesson, I started catching myself being okay with
someone else fixing my errors at work. For this reason, I want to change my way of
thinking and strive for zero “defects”. If there are less (or zero) defects after the first
attempt, then there are less errors to fix later.
The second lesson that also stood out to me was chapter 3. This chapter was extremely
insightful on how to get to the root need of your customer and maintain that
relationship. It provided several tools and strategies that I can bring to my company for
us to nail down the wants of our clients. My industry is based on relationships because
relationships bring in our business. For the most part, all civil engineering firms can
design functioning and sustainable products. Therefore, when a client is deciding what
firm to hire for a project, it essentially comes down to the firm whom they have the
strongest relationship with. Therefore, I think my company should start creating an
effective customer satisfaction measurement system. The best part about this was when
I read Portland benchmarks the results of their satisfaction survey against six other cities.
If they don’t meet their standards, then they begin to adjust. The second tool I think my
company should use is an affinity diagram to visualize and pinpoint our customer’s
needs. We are reviewing our values and mission statement as a company right now. If
we focus on our customer’s needs, I think it would help direct our decisions.
Appendix E: Sample Students’ Work - Applying Tools of Quality Management
Discussion Assignment
What to do: Seven problems are listed at the bottom of this page. What would be the
most appropriate tool to use to attack each of the problems.
Instructions: Of course, you could classify the problems into various types such as
conformance, structured, efficiency, etc. and recommend the "type" of analysis that
would fit best. For example, Conformance problems are best addressed by Six Sigma
tools.
However, for the purposes of this assignment, I'd like you to be specific about the actual
tool that you recommend. Choose from among those we have studied so far, including
but not limited to the following:
• Check sheet
• Process map
• Histogram
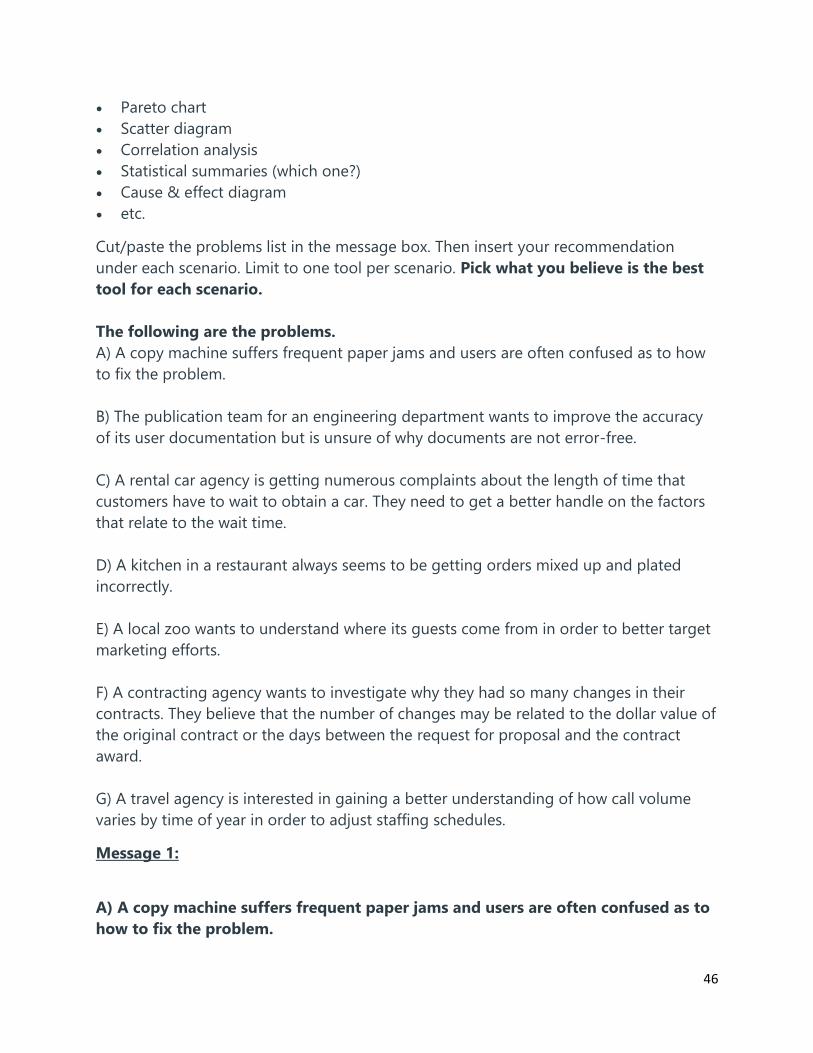
46
• Pareto chart
• Scatter diagram
• Correlation analysis
• Statistical summaries (which one?)
• Cause & effect diagram
• etc.
Cut/paste the problems list in the message box. Then insert your recommendation
under each scenario. Limit to one tool per scenario. Pick what you believe is the best
tool for each scenario.
The following are the problems.
A) A copy machine suffers frequent paper jams and users are often confused as to how
to fix the problem.
B) The publication team for an engineering department wants to improve the accuracy
of its user documentation but is unsure of why documents are not error-free.
C) A rental car agency is getting numerous complaints about the length of time that
customers have to wait to obtain a car. They need to get a better handle on the factors
that relate to the wait time.
D) A kitchen in a restaurant always seems to be getting orders mixed up and plated
incorrectly.
E) A local zoo wants to understand where its guests come from in order to better target
marketing efforts.
F) A contracting agency wants to investigate why they had so many changes in their
contracts. They believe that the number of changes may be related to the dollar value of
the original contract or the days between the request for proposal and the contract
award.
G) A travel agency is interested in gaining a better understanding of how call volume
varies by time of year in order to adjust staffing schedules.
Message 1:
A) A copy machine suffers frequent paper jams and users are often confused as to
how to fix the problem.
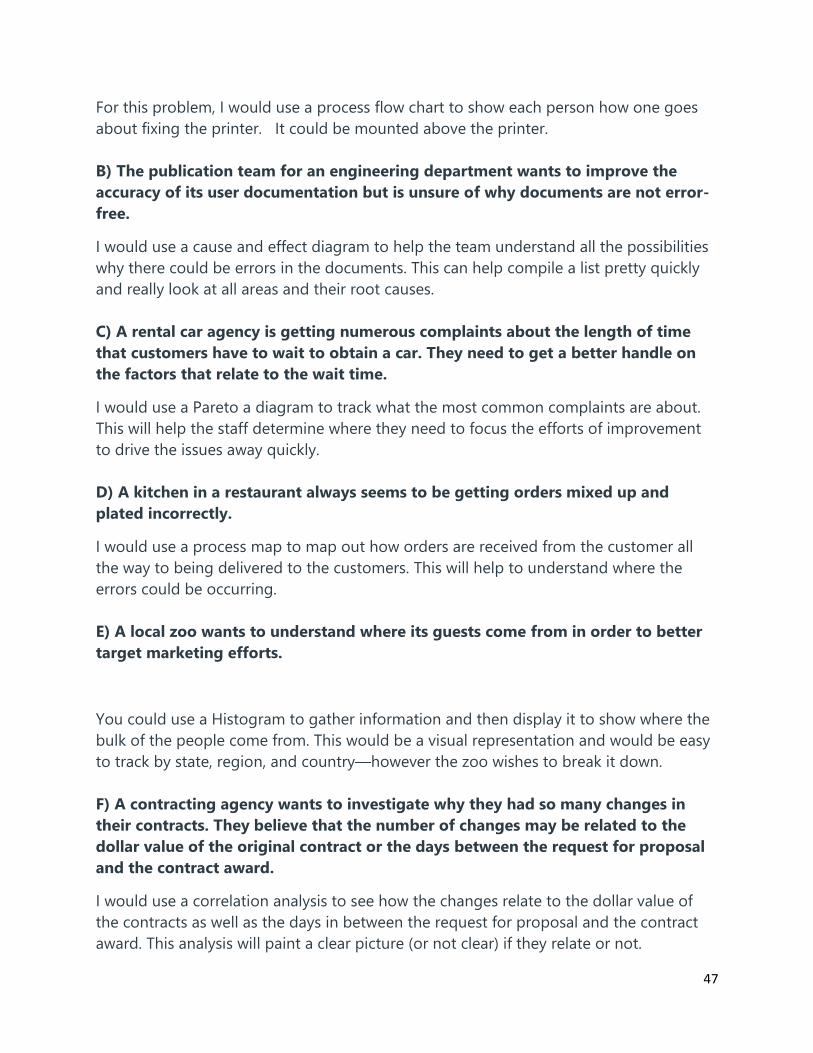
47
For this problem, I would use a process flow chart to show each person how one goes
about fixing the printer. It could be mounted above the printer.
B) The publication team for an engineering department wants to improve the
accuracy of its user documentation but is unsure of why documents are not error-
free.
I would use a cause and effect diagram to help the team understand all the possibilities
why there could be errors in the documents. This can help compile a list pretty quickly
and really look at all areas and their root causes.
C) A rental car agency is getting numerous complaints about the length of time
that customers have to wait to obtain a car. They need to get a better handle on
the factors that relate to the wait time.
I would use a Pareto a diagram to track what the most common complaints are about.
This will help the staff determine where they need to focus the efforts of improvement
to drive the issues away quickly.
D) A kitchen in a restaurant always seems to be getting orders mixed up and
plated incorrectly.
I would use a process map to map out how orders are received from the customer all
the way to being delivered to the customers. This will help to understand where the
errors could be occurring.
E) A local zoo wants to understand where its guests come from in order to better
target marketing efforts.
You could use a Histogram to gather information and then display it to show where the
bulk of the people come from. This would be a visual representation and would be easy
to track by state, region, and country—however the zoo wishes to break it down.
F) A contracting agency wants to investigate why they had so many changes in
their contracts. They believe that the number of changes may be related to the
dollar value of the original contract or the days between the request for proposal
and the contract award.
I would use a correlation analysis to see how the changes relate to the dollar value of
the contracts as well as the days in between the request for proposal and the contract
award. This analysis will paint a clear picture (or not clear) if they relate or not.

48
G) A travel agency is interested in gaining a better understanding of how call
volume varies by time of year in order to adjust staffing schedules.
I would use a scatter diagram that tracks the number of calls per day as the data point.
This would show if it is in fact cyclical or not.
Message 2
A) A copy machine suffers frequent paper jams and users are often confused as to
how to fix the problem.
The staff should create process flow charts to explain how to fix/use the copy machine.
It would lay out the process step by step for new users.
B) The publication team for an engineering department wants to improve the
accuracy of its user documentation but is unsure of why documents are not error-
free.
The publication team should conduct a root cause analysis to determine the ‘root cause’
to why their documents are not error-free. They could use a DFMEA to identify the
causes.
C) A rental car agency is getting numerous complaints about the length of time
that customers have to wait to obtain a car. They need to get a better handle on
the factors that relate to the wait time.
The rental car agency should create a cause and effect diagram to effectively brainstorm
problem factors that relate to a large wait time for customers.
D) A kitchen in a restaurant always seems to be getting orders mixed up and
plated incorrectly.
Again, I would recommend using a cause and effect diagram. It would initiate
brainstorming among the kitchen to improve their process and determine solutions to
eliminate this issue.
E) A local zoo wants to understand where its guests come from in order to better
target marketing efforts.
The marketing team could use the zip codes you can get from credit cards and plot the
areas on a scatter plot. This would visualize where the zoo obtains its guests.
F) A contracting agency wants to investigate why they had so many changes in their

49
contracts. They believe that the number of changes may be related to the dollar value of
the original contract or the days between the request for proposal and the contract award.
To verify their assumption, they should perform a correlation analysis to evaluate the
strength of relation between the dollar value of the original contract or the days
between a request for proposal and the contract award and the number of changes to a
contract.
G) A travel agency is interested in gaining a better understanding of how call
volume varies by time of year in order to adjust staffing schedules.
The travel agency could use a run chart to plot the call volume over time.
Message 3
1. A) A copy machine suffers frequent paper jams and users are often confused as
to how to fix the problem.
- A cause and effect diagram would be best because it would allow the users to possibly
troubleshoot the problem and it could also allow the company to determine why the
problem is occurring in the first place.
B) The publication team for an engineering department wants to improve the
accuracy of its user documentation but is unsure of why documents are not error-
free.
- A check sheet needs to be deployed to identify particular areas in the documents
where mistakes are most commonly being made.
C) A rental car agency is getting numerous complaints about the length of time
that customers have to wait to obtain a car. They need to get a better handle on
the factors that relate to the wait time.
- A cause and effect diagram would be best to identify the causes of the wait time.
D) A kitchen in a restaurant always seems to be getting orders mixed up and
plated incorrectly.
- A cause and effect diagram would be best in this situation because it would allow the
restaurant to identify the issue(s) causing the mix up.
E) A local zoo wants to understand where its guests come from in order to better
target marketing efforts.
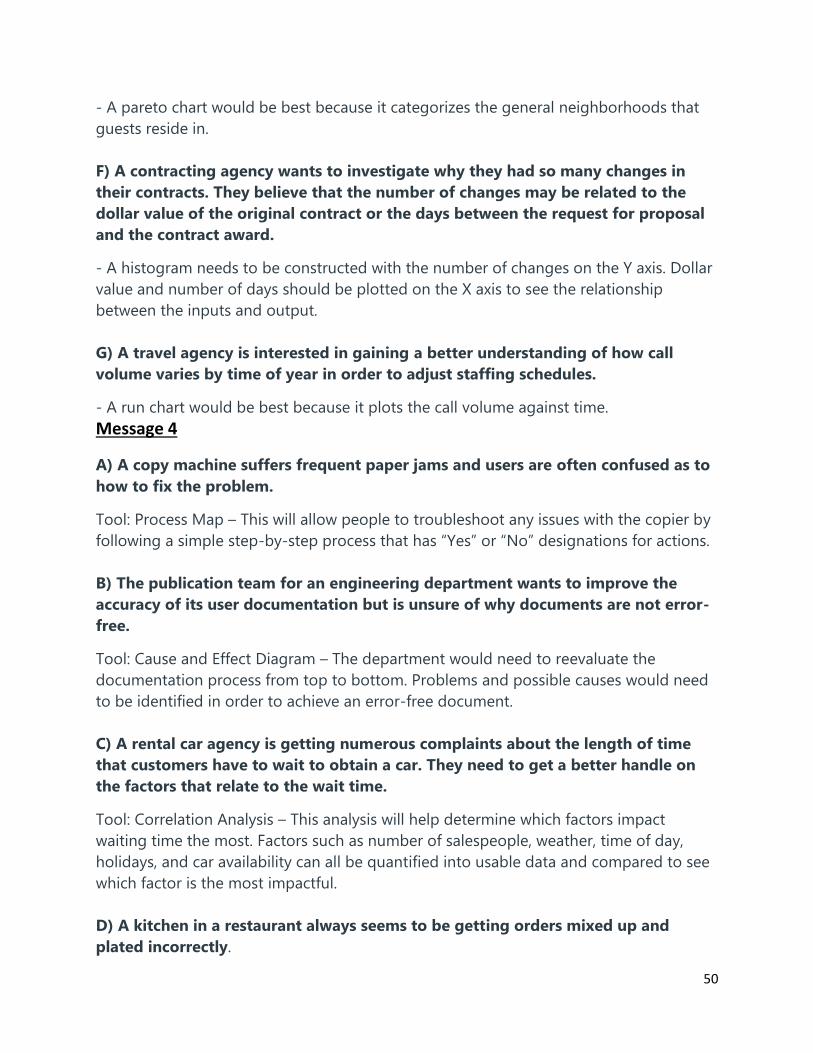
50
- A pareto chart would be best because it categorizes the general neighborhoods that
guests reside in.
F) A contracting agency wants to investigate why they had so many changes in
their contracts. They believe that the number of changes may be related to the
dollar value of the original contract or the days between the request for proposal
and the contract award.
- A histogram needs to be constructed with the number of changes on the Y axis. Dollar
value and number of days should be plotted on the X axis to see the relationship
between the inputs and output.
G) A travel agency is interested in gaining a better understanding of how call
volume varies by time of year in order to adjust staffing schedules.
- A run chart would be best because it plots the call volume against time.
Message 4
A) A copy machine suffers frequent paper jams and users are often confused as to
how to fix the problem.
Tool: Process Map – This will allow people to troubleshoot any issues with the copier by
following a simple step-by-step process that has “Yes” or “No” designations for actions.
B) The publication team for an engineering department wants to improve the
accuracy of its user documentation but is unsure of why documents are not error-
free.
Tool: Cause and Effect Diagram – The department would need to reevaluate the
documentation process from top to bottom. Problems and possible causes would need
to be identified in order to achieve an error-free document.
C) A rental car agency is getting numerous complaints about the length of time
that customers have to wait to obtain a car. They need to get a better handle on
the factors that relate to the wait time.
Tool: Correlation Analysis – This analysis will help determine which factors impact
waiting time the most. Factors such as number of salespeople, weather, time of day,
holidays, and car availability can all be quantified into usable data and compared to see
which factor is the most impactful.
D) A kitchen in a restaurant always seems to be getting orders mixed up and
plated incorrectly.

51
Tool: A3 Report – This report evaluates the current conditions and works towards an
implementation plan that will correct the issue. Once the plan is in place, Follow-Up
actions will ensure the issue has been corrected at a satisfactory level.
E) A local zoo wants to understand where its guests come from in order to better
target marketing efforts.
Tool: Histogram – A histogram would show the distribution of park patrons in an easy
format. The zoo could group patrons by a city’s county and find out which county
residents visit the zoo the most.
F) A contracting agency wants to investigate why they had so many changes in
their contracts. They believe that the number of changes may be related to the
dollar value of the original contract or the days between the request for proposal
and the contract award.
Tool: Pareto Diagram – Start at the top with “which contract had the most changes?”
and narrow down the issues to “average days between proposal and award” or “contract
rewrite”.
G) A travel agency is interested in gaining a better understanding of how call
volume varies by time of year in order to adjust staffing schedules.
Tool: Scatter Diagram – The agency would want to plot out data from previous years
and analyze the data for seasonal trends. Then a seasonal forecast could be made to
help assist with future staffing schedules.
Message 5
a. Cause and effect diagram. It is a simple diagram to show the relationship between
cause and effect. It may help to ensure the problem and the most possible cause.
b. Flowchart. It could help the publication team to understand the any process of
creating documents and how it works.
c. Cause and effect diagram. There might be many factors to cause the customers need
to wait for a long time.
d. Flow chart. To understand every step and identify the orders and plated.
e. Histogram. It is a simple QC tool to understand the amount of the guests is coming
from.

52
f. Scatter diagram. It may show the association between the variable and the amount of
change because it is a diagram for regression analysis.
g. Run chart. The travel agency could easily understand the call volume variation of the
schedule issues by the diagram is showing data of period of time.
Message 6
A) A copy machine suffers frequent paper jams and users are often confused as to
how to fix the problem.
This is “efficiency problem” Simple task that are not perform efficiently. The process map
can be created to help trouble shoot a paper jam issue. Users can quickly follow the
troubleshooting process which is not just limited to paper jam.
B) The publication team for an engineering department wants to improve the
accuracy of its user documentation but is unsure of why documents are not error-
free.
This, in my opinion, is the “unstructured performance problem” processes are not well
specified or understood. I feel DMAIC is an appropriate tool for solving this particular
problem that is not yet defined. DMAIC, as its name, will help define, measure, analyze,
improve and control.
C) A rental car agency is getting numerous complaints about the length of time
that customers have to wait to obtain a car. They need to get a better handle on
the factors that relate to the wait time.
This is a “conformance problem” with unsatisfied customers. Process capability analysis
tool such as X bar and R chart can be utilized to identify the average amount of time it
takes for customer to get a car, the variation of the time. Identify the special causes and
correct them.
D) A kitchen in a restaurant always seems to be getting orders mixed up and
plated incorrectly.
Check sheet can be used to collect ordering data, it is easily interpreted without
additional processing. Correct orders on check sheet should help kitchen crew get order
plated correctly.
E) A local zoo wants to understand where its guests come from in order to better
target marketing efforts.
Pareto chart is a good tool to help identify where zoo goers are coming from.
F) A contracting agency wants to investigate why they had so many changes in
their contracts. They believe that the number of changes may be related to the

53
dollar value of the original contract or the days between the request for proposal
and the contract award.
Correlation analysis is a good tool to help contracting agency validate or invalidate their
hypothesis that the number of changes relate to the dollar value or the days between
RFP and contract ward.
G) A travel agency is interested in gaining a better understanding of how call
volume varies by time of year in order to adjust staffing schedules.
A histogram tools is a great graphical tool that displays call volumes by the time of year.
It is also very easy to use.

54
Appendix F: Results of Mid-term Survey
1 How is the pace of the
course? Is it too slow,
just right, or too fast?
Please comment.
1. It's a little too fast.
2. I feel as though it is just right. I don't feel crammed with
information, but I feel as though as I'm learning a lot each week
3. It is just right for me.
4. Pace is just right, I have a solid work/life/school balancing going at
the moment. This class is insightful but hasn't been as grueling as
some previous courses.
5. I think the pace of the course is just right for working professionals.
Any faster would be too much to handle with all of the other things
that we have going on
6. I think the pace of the course is good. If anything, a little on the fast
side, but it has been alot of information to comprehend and read in
chapters 6, 7, and 8. By the time I brushed off my statistics and
really dove in, the course was moving along well. I would say no
changes necessary.
2 Does the coursework,
resources, videos, etc.
help you understand
and apply the subject
matter? Please
comment.
1. Yes, they helped me a lot.
2. Reading the book and the discussion posts have been the most
helpful to me. I have not utilized the additional resources as much
as I probably should
3. absolutely. The videos do help a lot. I actually prefer them over
reading the book.
4. Absolutely! I really like our textbook but do worry a little when a
homework question is not explicitly talked about in the book.
Usually that forces me to look at the extra materials (Word
documents, PDFs, etc) because those custom references typically
contain information about the "stranger" questions.
5. Yes. Personally I have learned alot from the readings each week. The
supplemental materials are also helpful and relevant if I get stuck on
a certain part.
6. I think this part has been very good. As everything is relatively new
to me, all the extra resources really help to paint the picture and
give me a better understanding of it.
3 Is the amount of
coursework
reasonable for what
you are expected to
learn, or not enough,
or too much? Please
comment
1. Yes, it is reasonable.
2. I feel as though it is just the right amount. I start the week off with
the homework so I get a good sense of the material, and then I
work on the discussion board. Your feedback has really helped me
think more critically about the material too. (so thank you).
3. Good for me.
4. Yes, very reasonable.
5. I think the amount of coursework is reasonable. Any more would be
a bit much to complete each week, especially if you are taking more
than one class at a time.
55
6. I feel like the course work is about right. The quizzes are really
encompassing and make sure I am doing the reading.
4 Is the amount of
discussion
appropriate, or too
little, or too much?
Please comment.
1. Most of them is appropriate till now.
2. I think it's just the right amount, but I liked the last week's
discussion where we had situations and we had to use the material
we just read to solve them. I helped me understand the material
better.
3. I think it is appropriate and relevant to the course work. I can learn
from other's experience as well as expanding my view points.
4. I feel it's appropriate. I don't like doing Group Case studies but one
for this class seems appropriate, anymore would be too much.
5. I think the discussion boards are sufficient. In the beginning I
thought the discussions would not be helpful since there are only
six people in the class but most students seem to post above and
beyond the minimum requirement which is a plus.
6. The discussion is good. Definitely on the more in depth side of
discussion boards I have been on, but that is ok in my opinion. It
benefits the class much more.
5 List three things that
you consider are
going well in this class.
1. A) The additional resources which Dr. Jena provides; B) The
examples in the powerpoint.
2. A) The discussions have been insightful and more importantly have
forced me to really think about the material and how it's applicable
in my work place. I have already had discussions with other
employers about this material. B) Homework. C) Your feedback
3. A) course contents, B) Application of TQM, C) Pace
4. A) I'm actually ahead on assignments for the first time in this
program, B) Other students are actually in my line of work so it's a
little easier to relate to some of the discussion board
examples/stories, C) I believe my final project will be relatively
smooth since this material is applicable to my job.
5. I think that the group case, weekly readings, and discussion boards
are working well.
6. I think the class as a whole is going well. I have been able to keep
up and understand, the group project is going well, and my final
project has started and is progressing nicely.
6 List three things that
need improvement in
this class.
1. None
2. Nothing
3. N/A
4. A) Admittedly, I don't want to do the Case Study, but only having to
do one instead of multiple is fine by me, B) I can't think of anything
else. (I originally had my video question idea in this space but then
56
read Question 7 and realized it fit better there.) C) I've got nothing
for this last one.
5. Initially I thought that the class would include some sort of lecture
material from the professor. I was a little disappointed that there is
nothing like this in the course - it is simply reading from the book
each week which is definitely helpful but almost seems like I could
have done that on my own.
6. I just wish the class was a little bigger for the discussion board. With
only 6 or 7 people in the class, it makes it difficult to get alot of
views. This is really only a minor problem though.
7 Please tell me if there
is anything I should do
differently to help you
succeed.
1. I think I should take more time to understand the discussion case. I
know it only has eight weeks to finish the class so it will have lots of
information to get in a short time.
2. I think your comments are very helpful at the end of the week. If
you wanted it might be helpful to require us to write a question
about the material in your discussion boards, so we can see your
feedback and it'll seem more like a class too. Plus I know that
everyone would at least have one question.
3. N/A
4. I think it'd be kind of neat if we had one homework question (1-2
points) a week that pertained to a short video (5 min or less) just to
kind of help reinforce a certain subject. This might help some
people who are more visual learners than just reading the textbook.
5. More professor engagement in weekly discussion boards.
6. Nothing new. I like what you are doing

57
Appendix G: 12 Exam Questions that did not meet good-performance standard Exam Q4 appears below
Exam Q5 appears below
Exam Q7 appears below
Exam Q8 appears below
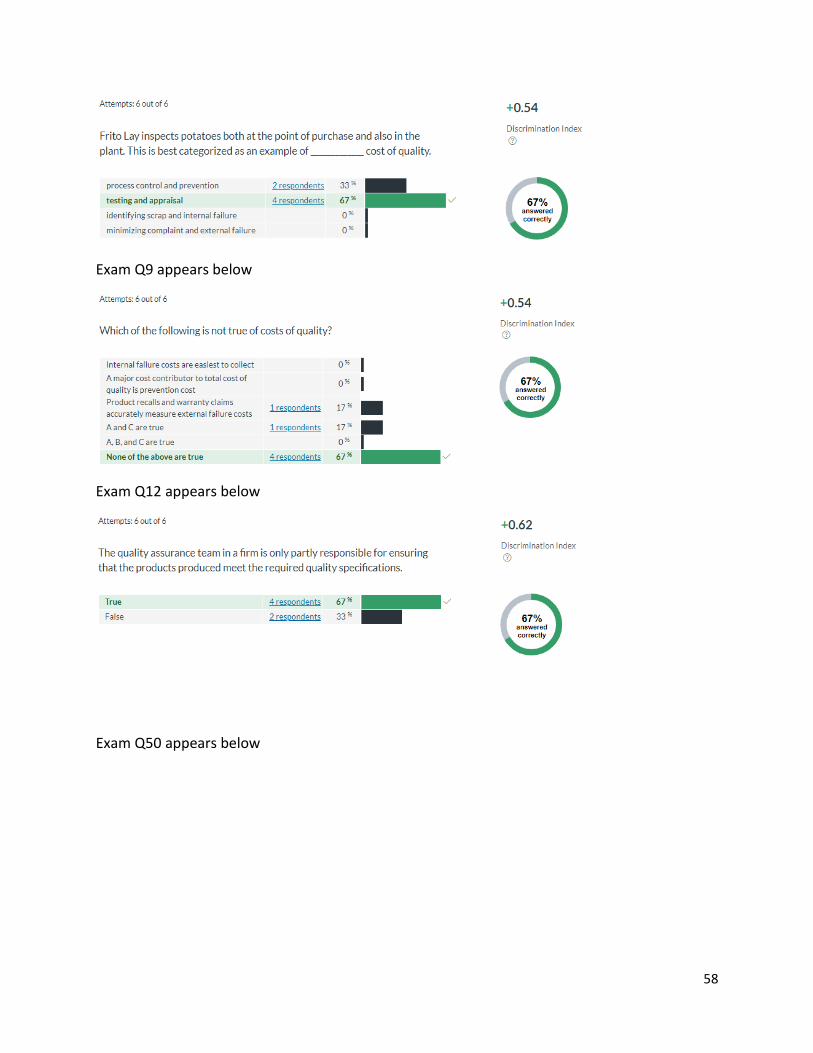
58
Exam Q9 appears below
Exam Q12 appears below
Exam Q50 appears below
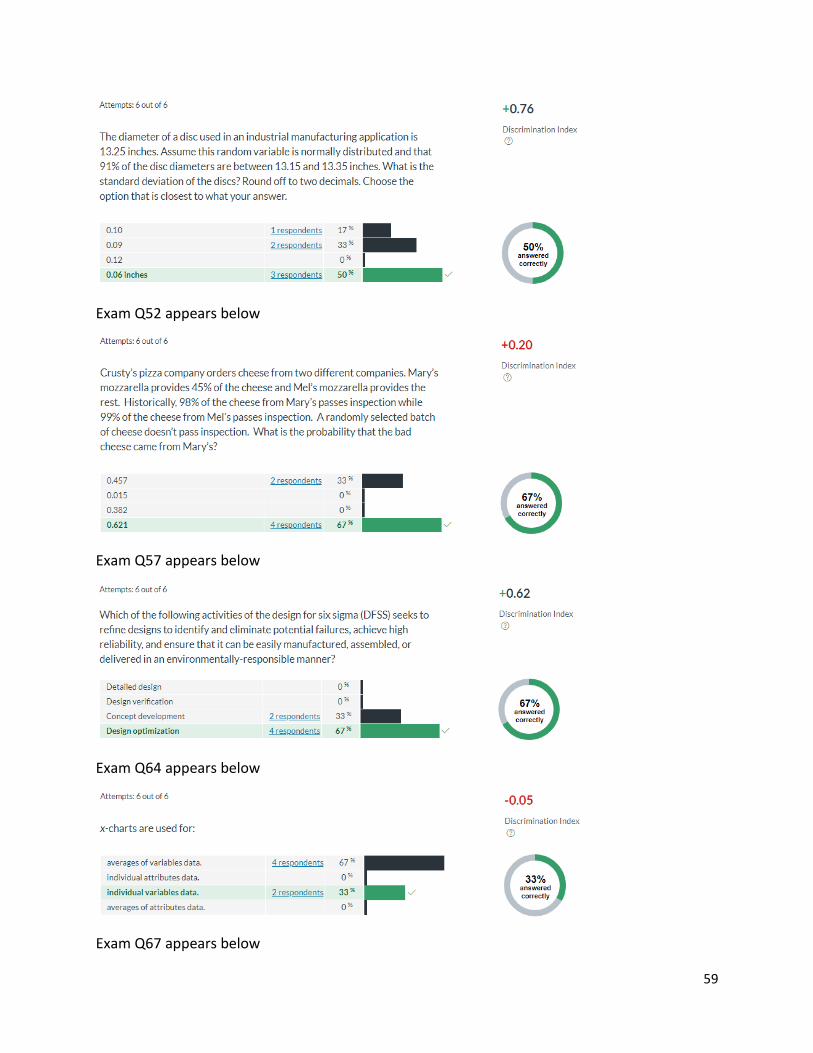
59
Exam Q52 appears below
Exam Q57 appears below
Exam Q64 appears below
Exam Q67 appears below
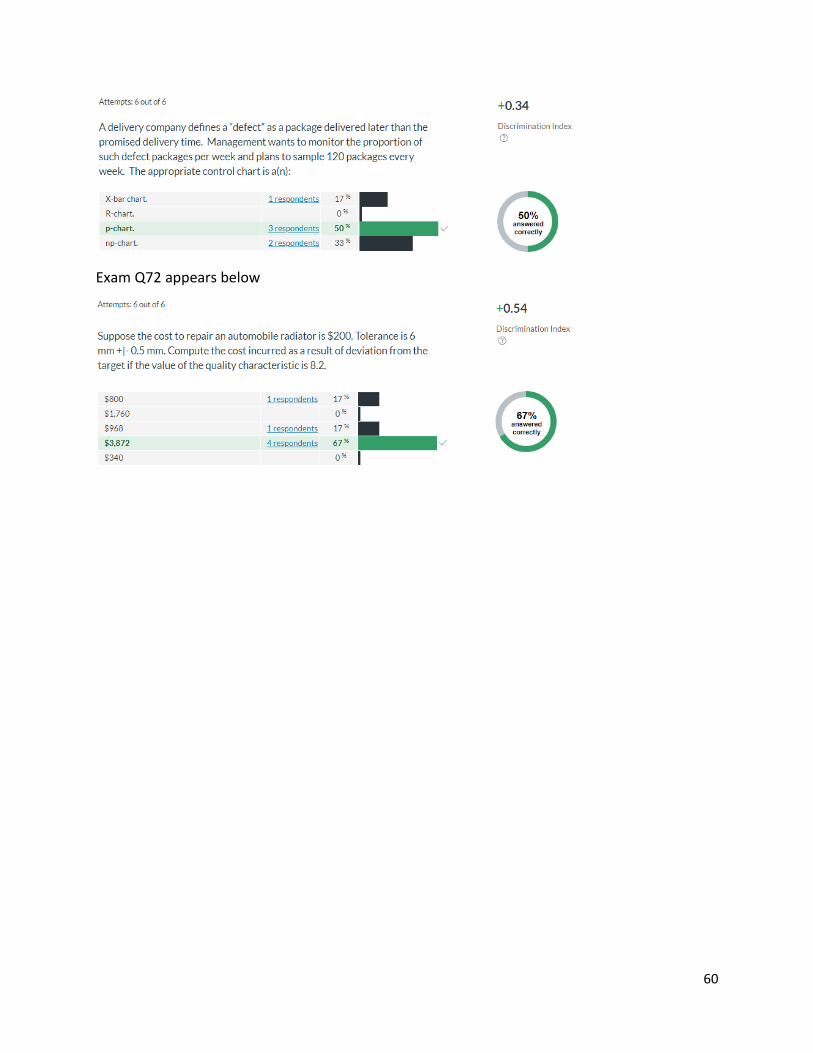
60
Exam Q72 appears below
61
Appendix H: Case Submissions by Two Teams
These are annotated files and include my comments
Group 1_Case.pdf
Group 2_Case.pdf

ENGR 901 TQMModule 3 Case
Group 1
2/3/19

Morelia Mortgage Company has been struggling to meet its loan servicing promises, specifically with respect to processing time. Their deficiencies in this area has driven the VP to hire a quality consultant to assess the current conditions and identify areas for improvement. In solving this problem, we are first asked to assess the current conditions in order to gain a deeper understanding of what is going on. The first step is to develop the initial control charts for the process. The control charts are shown below and are based on 30 data points that were collected in the middle of each shift over a 15-day period. The X-bar and R charts are shown below in Figure 1 and 2, respectively.
Figure 1: X-bar Chart of initial data
Figure 2: R Chart of initial data
The X-bar chart above shows that the process is undeniably out of control. There are two outliers that are far above the upper control limit. Upon further analysis, we find

that both data points correspond to Shaun being in place of Carmen. Other than the two outliers, we do not observe any other phenomena such as hugging the centerline or hugging the control limits. The R chart looks to be in control, but the first 9 data points seem to show slightly greater variation which tells us that there might be something going on in the beginning of the process causing a larger range of processing times. We can also see that the R chart seems to be trending up which is something that should be examined deeper.
The next step in analyzing the initial data and control charts is to further assess the outliers in the X-bar chart and the trend in the R chart. It is found that the two out of control points are caused by Shaun being in place of Carmen but when Shaun is in place of Rex, his processing time is not an outlier. Carmen and Rex work the first and second shift, respectively. This is a breakthrough - does Shaun work more quickly and efficiently on second shift than on first shift? This idea will be discussed further in the second part of this discussion after additional data is gathered. In looking deeper into the R chart trends mentioned above, we conclude that the processing times became more consistent as the days went on and the team realized that they were being observed.
Upon calculation of the capability indices for the process, we again see that the process is not under control. Figure 3 and 4 show the capability calculations with and without outliers, respectively. Figure 4 is included to show the process capability when the outliers are deleted from the data set since there is an assignable cause to the problem that can be addressed. In both cases, the Cp is below 1, indicating that the process is grossly out of control whether the outliers are included or not. On the bright side, we do see a positive trend when the outliers are deleted, as the control chart becomes much closer to centered based on the Cpu and Cpl calculations. In short, MMC is facing a serious problem in their loan processing times that needs to be addressed immediately to meet customer requirements.
Jena Asgarpoor
65070000000076269
Good Q to answer.
Jena Asgarpoor
65070000000076269
When a process is not in statistical control, performing capability analysis does not make sense because there is too much variation. Capability indexes would be meaningless.
Jena Asgarpoor
65070000000076269
Good review and interpretation of the control chart.

Six sigma 23.906
Cp 0.4183
Cpu 0.3748
Cpl 0.4619
Cpk 0.3748
Figure 3: Capability Calculations with outliers included
Six sigma 20.819
Cp 0.4803
Cpu 0.4773
Cpl 0.4834
Cpk 0.4773
Figure 4: Capability Calculations without outliers included
Moving forward, we notice that the average processing time is right around 15-16 hours which is very close to the specification limit. This makes us wonder where the customer complaints are originating from. We would like to analyze other lenders in the industry to see where their average processing time goals fall and compare them to MMC. Is MMC simply setting control limits that are too tight which is translating to an incapable process? Another important step that should be taken is to draw out the process flow and identify where the bottlenecks are being encountered. If these bottlenecks can be improved or eliminated completely, the process will likely become much more capable. The bottlenecks could include anything from varying customer requirements, long processing times at certain steps, or incoming information delays. The last step to be taken is to have MMC sit down with Shaun and figure out the reason for his poor performance. Is there something that MMC can do to improve this
Jena Asgarpoor
65070000000076269
May be proprietary information. Good idea to do some kind of benchmarking. However, control limits generally are not just set. They result from data collection and analysis to specify 3 standard deviations above and below the process average.
Jena Asgarpoor
65070000000076269
Good observation.
Jena Asgarpoor
65070000000076269

poor performance or is it simply inherent to Shaun? Is he processing more complex loans than the other Carmen and Rex that require longer processing times?
For the second part of this case, the manager has implemented the controls that were mentioned in Part 1, and then decides to take another sample of 20 to determine if the process has changed or not. Based on the initial evidence, it does appear that the process has changed from the original control limits. Figure 5 and Figure 6 below show the newest 20 points plotted on an X-bar Chart and R-Chart with the control limits and center that were established from the previous sample run above. The previous limits and center were used to get a direct comparison to the process before and after the process changes were implemented relative to the established control limits.
Figure 5: X-bar chart of improved data
Figure 6: R chart of improved data

Looking at both Figure 5 and Figure 6, some out of control patterns still seem to exist in the data. In the X-Bar chart, the data appears to be hugging the centerline much tighter than before, except for one point (16), and this once again corresponds to Shaun working. This time, Shaun is working on second shift, but is still an outlier. This disproves the prior conclusion that Shaun might work better on the second shift than on the first shift. In the R-Chart, it appears that there could possibly be a shift in the process average overall, as only 4 points fall above the centerline. That notion is not exactly clear because Carmen has 2 very high points which appear to be some sort of outlier. By removing those 2 points, it looks like there is a shift as most points are below and are much closer to the centerline.
Based on the findings of the latest sample set, there are a few things that the company needs to continue to investigate. The most apparent item that still jumps out the most is the work that Shaun is doing, whether he is doing it on first or second shift. In the first study, Shaun was the outlier and that was flagged. Now, in the latest data set, he is still an outlier. What part of the training didn’t work for Shaun? Is he incapable or not motivated? Is the company still missing a shortcoming in the process?
The next trend to be investigated is the hugging of the centerline in the X-Bar chart. This trend shows that the processing times are becoming more consistent and repeatable. With this improved consistency, the company should investigate if Rex and Carmen are still doing a good job as they try to move faster. The qualitative part of their service is not shown in these charts. It appears they are trying hard, but it could also be leading to other problems. It could be the case that by focusing on the processing time, they are not providing a high level of customer service.
The last trend to be investigated is seen in the R chart. Looking at the chart, the standard deviation seems to have improved drastically. This means that they are on the right path to a more consistent process. With that said, MMC still needs to investigate what was unique about the days that led to the two outliers from Carmen. Is there an outside influence on those days? Or is the problem only Carmen on those days?
Based on the second sample taken, there are still issues that need to be fixed. The results look better than what we saw in the initial sample set, but there are still items that need to be addressed. MMC needs to continue to have events that help them determine what the issues are, as well as continue to monitor the process to determine when issues have been fixed. Process improvement is an iterative process and this is a prime example of it.
Jena Asgarpoor
65070000000076269
Good
Jena Asgarpoor
65070000000076269
Jena Asgarpoor
65070000000076269
Good

ENGR 901 (sec. 911)Total Quality Management Using Six Sigma
Morelia Mortgage Company
Group 2
February 3, 2019

1. Interpret the data in the worksheet, establish a state of statistical control, and evaluate the capability of the process to meet specifications. Consider the following questions:
a.) What do the initial control charts tell you? b.) Do any out-of-control conditions exist? c.) If the process is not in control, what might be the likely causes, based on the
information that is available? d.) What is the process capability?e.) What do the process capability indexes tell the company?f.) Is MMC facing a serious problem that it needs to address?g.) How might the company eliminate the problems of slow loan processing?
Figure 1: MMC - 30 Samples Data
Jena Asgarpoor
65070000000076269
If the process is out of control, then results of capability analysis is meaningless since process mean and variation are not dependable.

Figure 2: MMC 30 Samples - XBar Chart
Figure 3: MMC 30 Samples - R Chart

A. As shown in Figure 2 and Figure 3, the initial control charts show the R-Chart is in control, whereas, the XBar-Chart shows the data is consistently alternating sides of the center line, but there are two outlier samples that go out-of-control. The two outliers peak above the UCL.
B. The XBar-Chart indicates a process that is out-of-control due to samples 9 and 21 going beyond the UCL. If only one point went beyond the limit, it could have been written off as an error, but two points indicate an out-of-control process.
C. Shaun is responsible for samples 9, 21, and 24. Samples 9 and 21 are out-of-control and signs point to this being human error. Shaun does not appear to be a regular loan worker and perhaps does not have the same training and experience as Rex and Carmen.
D. The process capability (Cp) is 0.418, which can be found in Figure 1. Since Cp < 1, this current process cannot produce 100% of the loans in the specified range of 20.5-10.5 hours. The process variation is too high.
E. The process capability indexes can tell MMC if the current process is feasible (with 100% conforming output) and if the data is centered on the specification. We know 100% output is not feasible, but Cpk/Cp = 0.375/0.418 = 0.897 which indicates the process is fairly well centered. This leads us to believe that the outliers are preventing an “in-control” process.
F. MMC isn’t facing a serious problem, since it was concluded the outliers are caused by a person who is not a regular loan officer, Shaun.
G. This issue can be eliminated if MMC either replaces or trains Shaun in an attempt to bring the loan process back in control.
Jena Asgarpoor
65070000000076269
Since process is out of control, computing capability indexes is meaningless.
Jena Asgarpoor
65070000000076269
Please see my solution file to see how to get beyond the out-of-control state and determine the impact on process average and variation, once the outliers are removed from calculations.
Jena Asgarpoor
65070000000076269
Then you should remove the outliers from the original data set, computing conrol limits again, and plotting the remaining 28 points to comment on process average and capabiity.

2. The process manager who initiated the trial project implemented the recommendations that resulted from the initial study. Because of her success in using control charts, MMC made a decision to continue using them on that process. After establishing control, one additional sample was taken over the next 20 shifts, shown in the second part of the table in the worksheet. Evaluate whether the process remains in control and suggest any actions that should be taken. Consider the following issues:
a.) Does any evidence suggest that the process has changed relative to the established control limits?
b.) If any out-of-control patterns are suspected, what might be the cause?c.) What should the company investigate?
Figure 4: MMC - Samples 31-50 (1-20)
Jena Asgarpoor
65070000000076269
you are setting brand new control limits using the sample of 20. But, we want to know if the process is longitudinally in control. Therefore, the 20 observations should have been plotted based on control limits that were set previously (after removal of sample 9 and 21).

Figure 5: MMC 20 Samples - XBar Chart: Out of Control
Figure 6: MMC 20 Samples - R Chart: Out of Control
Jena Asgarpoor
65070000000076269
Control limits for these charts are based on the sample of 20. If you plot the sample of 20 in a chart with control limits previously set, you would get different answers.

Figure 7: MMC - Process in Control (removed samples 5 and 16)
Figure 8: MMC 18 Samples - XBar Chart: In Control

Figure 9: MMC 18 Samples - R Chart: In Control
A. The process has been improved as evidenced by the XBar-Chart shown in Figure 5. The points are now much closer to the center line than they were in the original 30 samples, except for a single outlier which goes above the UCL.
B. Sample 16 shown in Figure 5 is above the UCL on the XBar-Chart and could possibly indicate an out-of-control system. Once again, Shaun is the case of the issue and it appears his methods have not improved since the first 30 samples were taken. Sample 5 on Figure 6 is 16.34 on the R-Chart is extremely close to going over the UCL (16.51) but seems to be more of an outlier than a shift in the data.
C. MMC needs to evaluate training for its staff, since the methods they are using seem to be effective as indicated by the centering of the process on the XBar-Chart, but not completely effective since Shaun still caused the system to become out-of-control after the changes were implemented. In order to demonstrate the system is only out of control when Shaun did the loan process the XBar-Chart and R Chart were reconfigured removing samples 5 and 16 as shown in Figure 7. The new Xbar-Chart and R Chart are shown in Figures 8 and Figure 9, respectively, show an in-control process without Samples 5 and 16. Removing these two data points reduces the amount of variation in the process.