Emerging Stock Market Integration Among Selected SAARC and ...
36
* ** Professor, Department of Commerce, Delhi School of Economics, University of Delhi, New Delhi – 110007. Email: [email protected] PhD. Research Scholar, Department of Commerce, Delhi School of Economics, University of Delhi, New Delhi – 110007. Email: [email protected], (Corresponding Author) RIJBR ISSN : 2455-5959 Emerging Stock Market Integration Among Selected SAARC and Developed Countries: An Empirical Analysis of ShortTerm and Long-Term Linkages Vanita Tripathi* Ritika Seth ABSTRACT This paper has tried to explain the presence of integration among the stock markets of selected SAARC countries within themselves as well as with selected three Developed countries of the world. The data set consists of daily closing values of benchmark stock indices of selected SAARC and developed th countries for more than 27 years period starting from November 5 , 1991 till st December 31 , 2018. The data is analysed using Unit Root tests, Correlation Analysis, Vector Autoregression, Granger Causality Test, Impulse Response Analysis, Johansen's Co-integration Test and Vector Error Correction Model. The results indicate the strong influencing nature of USA economy which is found to significantly affect the stock market behaviour of selected SAARC countries both in the short term as well as long term specially after the Asian and Global Financial Crisis. Not much integration has been found among the stock markets of SAARC countries. The extent of linkages among the stock markets has been found to intensify with the passage of time because of opening up of economies, capital market reforms and advancements in Technology. This study is unique because of its emphases on selected SAARC countries, for which there is dearth of literature. Moreover, the time period of study is substantial. Sub-period analysis has also been carried on to check for the impact of Asian and Global Financial Crisis. Therefore, its results can be of great help in formulating portfolio diversification strategies by potential investors. The findings also have noteworthy value for government, regulators, policy makers, academicians and researchers. Keywords: Financial Econometrics, Integration, SAARC, Financial Crisis, Unit Root, Short Term Linkages, Long Term Co-Integration. JEL Classification: C58, G01, F36, G15 ** 101
Transcript of Emerging Stock Market Integration Among Selected SAARC and ...

*
**
Professor, Department of Commerce, Delhi School of Economics, University of Delhi, New Delhi – 110007. Email: [email protected]
PhD. Research Scholar, Department of Commerce, Delhi School of Economics, University of Delhi, New Delhi – 110007. Email: [email protected], (Corresponding Author)
RIJBR ISSN : 2455-5959
Emerging Stock Market Integration Among Selected SAARC
and Developed Countries: An Empirical Analysis of ShortTerm
and Long-Term Linkages
Vanita Tripathi*
Ritika Seth
ABSTRACT
This paper has tried to explain the presence of integration among the stock markets of selected SAARC countries within themselves as well as with selected three Developed countries of the world. The data set consists of daily closing values of benchmark stock indices of selected SAARC and developed
thcountries for more than 27 years period starting from November 5 , 1991 till
stDecember 31 , 2018. The data is analysed using Unit Root tests, Correlation Analysis, Vector Autoregression, Granger Causality Test, Impulse Response Analysis, Johansen's Co-integration Test and Vector Error Correction Model. The results indicate the strong influencing nature of USA economy which is found to significantly affect the stock market behaviour of selected SAARC countries both in the short term as well as long term specially after the Asian and Global Financial Crisis. Not much integration has been found among the stock markets of SAARC countries. The extent of linkages among the stock markets has been found to intensify with the passage of time because of opening up of economies, capital market reforms and advancements in Technology. This study is unique because of its emphases on selected SAARC countries, for which there is dearth of literature. Moreover, the time period of study is substantial. Sub-period analysis has also been carried on to check for the impact of Asian and Global Financial Crisis. Therefore, its results can be of great help in formulating portfolio diversification strategies by potential investors. The findings also have noteworthy value for government, regulators, policy makers, academicians and researchers.
Keywords: Financial Econometrics, Integration, SAARC, Financial Crisis, Unit Root, Short Term Linkages, Long Term Co-Integration.
JEL Classification: C58, G01, F36, G15
**
101
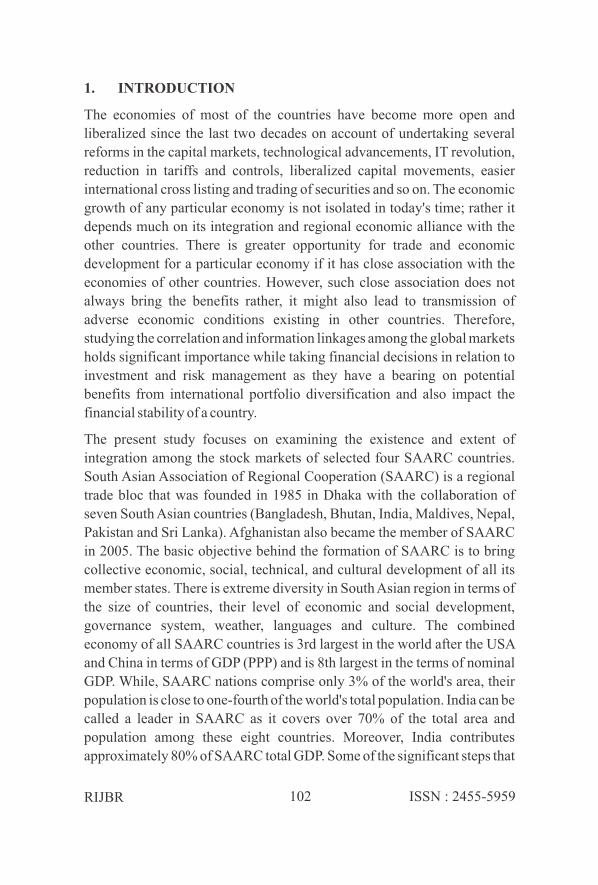
1. INTRODUCTION
The economies of most of the countries have become more open and
liberalized since the last two decades on account of undertaking several
reforms in the capital markets, technological advancements, IT revolution,
reduction in tariffs and controls, liberalized capital movements, easier
international cross listing and trading of securities and so on. The economic
growth of any particular economy is not isolated in today's time; rather it
depends much on its integration and regional economic alliance with the
other countries. There is greater opportunity for trade and economic
development for a particular economy if it has close association with the
economies of other countries. However, such close association does not
always bring the benefits rather, it might also lead to transmission of
adverse economic conditions existing in other countries. Therefore,
studying the correlation and information linkages among the global markets
holds significant importance while taking financial decisions in relation to
investment and risk management as they have a bearing on potential
benefits from international portfolio diversification and also impact the
financial stability of a country.
The present study focuses on examining the existence and extent of
integration among the stock markets of selected four SAARC countries.
South Asian Association of Regional Cooperation (SAARC) is a regional
trade bloc that was founded in 1985 in Dhaka with the collaboration of
seven South Asian countries (Bangladesh, Bhutan, India, Maldives, Nepal,
Pakistan and Sri Lanka). Afghanistan also became the member of SAARC
in 2005. The basic objective behind the formation of SAARC is to bring
collective economic, social, technical, and cultural development of all its
member states. There is extreme diversity in South Asian region in terms of
the size of countries, their level of economic and social development,
governance system, weather, languages and culture. The combined
economy of all SAARC countries is 3rd largest in the world after the USA
and China in terms of GDP (PPP) and is 8th largest in the terms of nominal
GDP. While, SAARC nations comprise only 3% of the world's area, their
population is close to one-fourth of the world's total population. India can be
called a leader in SAARC as it covers over 70% of the total area and
population among these eight countries. Moreover, India contributes
approximately 80% of SAARC total GDP. Some of the significant steps that
RIJBR ISSN : 2455-5959102

have been initiated in order to improve the integration among the regional
capital markets of SAARC countries include SAARCFINANCE (1998),
South Asian Federation of Exchanges – SAFE (2000) and South Asian
Securities Regulators' Forum – SASRF (2005).
Therefore, the focus of this research paper is mainly on the South Asian
markets that have received relatively little research interest by the
researchers. There is plethora of studies that have been carried out in the
past studying the presence and extent of integration among several
countries of the world, but there is hardly any study that has specifically
focussed on the emerging economies of South Asia together and
extensively as well as their association with the developed economies of the
world. Moreover, there is no study that has concentrated on recent data with
respect to these four selected SAARC countries and that too for such a long-
time span of over 27 years and using the most advanced econometric
techniques. Sub-period analysis has also been carried on checking for the
impact of Asian and Global Financial Crisis. This makes our study unique
and an important contribution to the existing literature.
Ÿ Research Objectives and Hypotheses
The Main Research Objectives of the present study are:
1) To check for the presence of any short-term causal relationship
among stock markets of selected SAARC countries among
themselves and with the stock markets of three developed countries
of the world, namely, USA, UK and Japan.
2) To check for the presence of any long-term co-integration
relationship among stock markets of selected SAARC countries
among themselves and with the stock markets of three developed
countries of the world, namely, USA, UK and Japan.
3) To check for the presence of sensitivity in the stock markets of
selected SAARC countries to the shocks created in the stock markets
of other countries (SAARC and Developed) in the short term.
All the above stated objectives have been checked for the entire sample
period and pre and post Asian Financial Crisis (1997) and Global Financial
Crisis (2007).
RIJBR ISSN : 2455-5959103
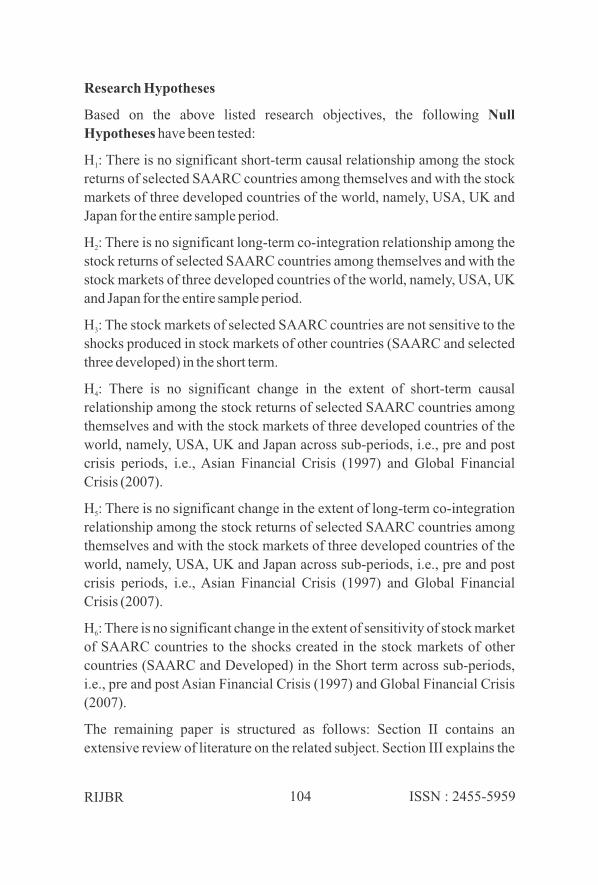
Research Hypotheses
Based on the above listed research objectives, the following Null
Hypotheses have been tested:
H : There is no significant short-term causal relationship among the stock 1
returns of selected SAARC countries among themselves and with the stock
markets of three developed countries of the world, namely, USA, UK and
Japan for the entire sample period.
H : There is no significant long-term co-integration relationship among the 2
stock returns of selected SAARC countries among themselves and with the
stock markets of three developed countries of the world, namely, USA, UK
and Japan for the entire sample period.
H : The stock markets of selected SAARC countries are not sensitive to the 3
shocks produced in stock markets of other countries (SAARC and selected
three developed) in the short term.
H : There is no significant change in the extent of short-term causal 4
relationship among the stock returns of selected SAARC countries among
themselves and with the stock markets of three developed countries of the
world, namely, USA, UK and Japan across sub-periods, i.e., pre and post
crisis periods, i.e., Asian Financial Crisis (1997) and Global Financial
Crisis (2007).
H : There is no significant change in the extent of long-term co-integration 5
relationship among the stock returns of selected SAARC countries among
themselves and with the stock markets of three developed countries of the
world, namely, USA, UK and Japan across sub-periods, i.e., pre and post
crisis periods, i.e., Asian Financial Crisis (1997) and Global Financial
Crisis (2007).
H : There is no significant change in the extent of sensitivity of stock market 6
of SAARC countries to the shocks created in the stock markets of other
countries (SAARC and Developed) in the Short term across sub-periods,
i.e., pre and post Asian Financial Crisis (1997) and Global Financial Crisis
(2007).
The remaining paper is structured as follows: Section II contains an
extensive review of literature on the related subject. Section III explains the
RIJBR ISSN : 2455-5959104

data and methodology employed in order to achieve the said research
objectives in Section I. Section IV provides the empirical results and
Section V concludes.
2. LITERATURE REVIEW
The study of examining the integration and inter-linkages among stock
markets began as early as in 1968 with Grubel's seminal paper. The
empirical study by Grubel (1968) was concerned with the range of potential
gains that US investors could avail through international diversification.
The process of globalisation has been identified as one of the driving forces
of market integration. Agmon (1972), Hilliard (1979), Eun and Shim
(1989), Becker, Finnerty and Gupta (1990), Koch and Koch (1991) and
Arshanapalli and Doukas (1993) are a few names who also tried to find out
the correlation among the then developed markets, namely, the USA, the
UK, Germany, Australia, Singapore and Japan.
A lot of studies have been carried out in the past in order to study the inter-
linkages between the stock markets of Asian countries with the stock
market of USA. Arshanapalli, Doukas and Lang (1995), Elyasiani, Perera
and Puri (1998), Hashmi and Xingyun (2001) and Bose and Mukherjee
(2006) are a few names. It was found that the inter-linkages among the
South East Asian markets increased after the Asian Financial Crisis and
there was existence of information leadership from the US market to the
Asian markets.
Lamba (2004) focused on investigating the markets of India, Pakistan and
Sri Lanka in South Asia, and the major developed markets, and did not find
Indian market to be the leader among South Asian countries. Narayan,
Smyth and Nandha (2004), Sharma and Bodla (2011), Prakash and Kumar
(2014) and Tripathi and Seth (2016) also tried exploring the extent of
linkages between the stock markets of South Asian countries and indicated
the presence of long-run relationship and the existence of short run linkages
as well. Khan and Aslam (2014) investigated the co-integration of Pakistan
stock exchange with the other major stock exchanges of south Asia and
indicated the presence of co-integration of Pakistan's stock market with the
market of India, Indonesia, Malaysia and Singapore. Latha and Kumar
(2016) examined the short and long run correlating, causal and
RIJBR ISSN : 2455-5959105
cointegrating relationship between Indian and other major developed and
developing markets. They found Indian stock market to have high
correlating, short run causal and long run cointegrating relationship with
Brazil, China, Russia and South Africa among the developing countries and
with Australia and Canada among the developed ones. It was further
established that while the correlations significantly reduced post crisis,
causal and cointegrating relationships increased post crisis. Sehgal, Pandey
and Deisting (2018) also empirically evaluated the dynamic co-movements
between the equity market indices of the member countries of the SAARC
region. The results obtained from both time invariant and time varying
copula models indicated very low level of financial integration in the region
due to almost zero dependencies between the equity markets of SAARC
member countries.
Dhal (2009) tried to capture the impact of global financial crisis of 2008 on
the market integration and found that the global crisis had a very
moderating impact on the long-run coefficients pertaining to the integration
among the regional and global markets. Srivastava, Bhatia and Gupta
(2015) also investigated the integration of the developed market of the US
and emerging Asian stock markets, namely, Japan, Singapore, Hong Kong
and India, pre and post global financial crisis from the perspective of
international portfolio diversification. They found the existence of strong
long-term integration but the lack of short-term integration of Indian stock
market with global markets. Tripathi and Sethi (2010) found Indian stock
market to be integrated with the US stock market and in their other paper
(Tripathi and Sethi (2012)), they found that both the short run and long run
integration of the Indian stock market with Advanced emerging markets has
increased over the study period. Tripathi, Seth and Kumar (2013) also
conducted a study where they found contagion effect on Indian economy
while examining the short run inter-linkages and long run co-integration
between India and some major economies of the world namely, US, Europe,
other emerging markets and World economy.
The literature can be summarized as increase in the level of integration
among the international stock markets with the passage of time. A lot of
studies have considerably supported this result as some of them reported
above. Therefore, a comprehensive attempt has been made to ponder over
such relationship between major equity markets of SAARC countries and
RIJBR ISSN : 2455-5959106

Developed countries, incorporating the impact of Asian and Global
Financial crisis.
3. DATA AND METHODOLOGY
A. Data
The data consists of closing values of daily benchmark stock indices of four
out of eight SAARC countries, namely, Bangladesh, India, Pakistan and Sri
Lanka and three developed countries of the world, namely, USA, UK and
Japan. The Time period of study spans over 27 years period starting from th stNovember 5 , 1991 till December 31 , 2018. Such a long period holds great
significance in reaching at important conclusions. There have been
significant economic developments that took place in each of the SAARC
countries post 1991 affecting the performance of stock markets and
ultimately the stock returns. Because of several regional agreements, the
trade and commerce has also grown in SAARC countries post 1991. Most
of the SAARC countries are now considered as Emerging Economies of the
world.
Only four countries out of the eight (SAARC) countries could be included
in the study because of non-availability of enough stock indices data for the
other four markets. The stock markets of Nepal, Bhutan and Maldives are
not much developed and there is very little trading activity. Nepal Stock
Exchange Limited (NEPSE) is the only Stock Exchange of Nepal that
operates under Securities Exchange Act, 1983. The Royal Securities
Exchange of Bhutan is the only stock exchange in Bhutan founded in 1993
and it is one of the world's smallest stock exchanges, with a market
capitalization of around 493.40 million Ngultrum (Nu. – Bhutanese
Currency) and only 21 listed companies as of June 2018. It has only 3
trading days, Monday, Wednesday and Friday. There are lot of restrictions
to deal in Bhutanese stock market, for instance, International companies are
not allowed to be listed in Bhutan and they are also not permitted to work in
the country. The Maldives Stock Exchange was established on April 14,
2002 and it is operated by the Maldives Stock Exchange Company Private
Ltd., with effect from January 24, 2008. Currently, only 10 (8 Equity and 2
Debt) companies are listed on the Maldives Stock Exchange (MSE). The
stock exchange of Afghanistan is not yet operational. (Tripathi and Seth,
2016).
RIJBR ISSN : 2455-5959107

The three developed countries chosen for analysis are USA, UK and Japan.
The choice of developed countries is based upon the logic that USA
economy is the world's largest national economy and has significant
influence on the rest of the world including South Asian countries; UK's
stock exchange is the largest stock exchange in Europe and can be
considered as the next substantial and influencing economy of the world;
and Finally, Japan's stock exchange is regarded as the Asian giant and third
largest stock exchange in the world in terms of market capitalization. The
stock exchanges are chosen for each of the selected country based on
Volume of trading taking place at that exchange. The ones with the largest
volume or Market Turnover are chosen and then the benchmark stock index
of that exchange is selected for further study.
The stock market indices for Bangladesh, India, Pakistan and Sri Lanka are
Dhaka Stock Exchange Broad Index (DSEX), Bombay Stock Exchange
Sensitive Index (BSE Sensex), Karachi Stock Exchange 100 Index
(KSE100) and Colombo Stock Exchange All Share Index (CSEALL),
respectively. The benchmark indices taken up in the study of three
developed countries of USA, UK and Japan are S&P 500 Index, FTSE 100
Index and Nikkei 225 Index respectively. All the data has been collected
from Bloomberg Database denominated in their respective local currency
units and adjusted for dividends and splits. The data has been filtered to
consider only those dates where all the selected stock markets were open for
trading.
It is best to use daily frequency data for meeting research objectives as stock
markets are dynamic in nature where the securities are dealt on real time
basis. Therefore, to capture the potential interactions, daily data fits in the
best. Also, we expect the spillovers between financial markets to take place
within very short time intervals due to modern information technology.
The whole analysis has been done for the entire sample period as well as for
the sub-periods. The entire time-period of study is divided into three sub-
periods based on the dates of Asian Financial Crisis (1997) and Global
Financial Crisis (2007). The purpose is to check if there is any change in the
extent of Short-term and Long-term integration among the selected
countries because of the Crisis situation.
RIJBR ISSN : 2455-5959108


4. EMPIRICAL RESULTS
1. ADF and PP Unit Root Tests
The result of ADF and PP Unit Root test suggest that the stock returns series
of all the selected four SAARC countries are stationary at level. The results
are reported in Table 1.
Table 1: Results of ADF and PP Unit Root Test at level
Since the stock returns series are stationary at level, the further analysis of
data in order to find out the short-term linkages using Correlation analysis,
VAR, Granger Causality Test and Impulse Response Analysis is performed
using the stock returns series of selected four SAARC countries. The log
series of stock indices of selected countries is taken up for the application of
Johansen's Co-integration test and VECM in order to check for Long-term
inter-linkages.
2. Correlation Analysis
Table 2: Correlation Coefficients (Daily Data)
As per the results of Correlation Analysis, the stock returns of Bangladesh
stock market doesnot appear to be correlated with stock returns of any of the
other stock markets, while, on the other hand, Indian stock returns are
RIJBR ISSN : 2455-5959113
Level
Log Returns of Stock Index
ADF PP
Intercept Trend and Intercept Intercept Trend and Intercept
t – statistics
Bangladesh -61.76824* -61.77336* -62.25878* -62.21338*
India -59.12852* -59.12166* -59.20455* -59.19745*
Pakistan -38.65643* -38.65128* -56.78031* -56.77394*
Sri Lanka -23.38757* -23.38462* -54.54038* -54.53420*
*Significant at 1%; **Significant at 5%
Series Bangladesh India Pakistan Sri Lanka USA UK Japan
Bangladesh 1 -0.01568 0.010478 -0.00638 -0.01078 -0.00286 -0.02384
India 1 0.110903* 0.11947* 0.19778* 0.27885* 0.269198*
Pakistan 1 0.11638* -0.01745 0.02993 0.046187*
Sri Lanka 1 -0.04059* 0.010398 0.054762*
*Significant at 1%
positively and significantly related to stock returns of all other stock
markets taken up in the study. The reason that can be attributed to this
positive and significant correlation of Indian stock market returns with the
stock market returns of other countries is the open nature of Indian
economy. Over the last two decades, several reforms have taken place in
India in order to liberalize and globalize the economy to keep pace with
other developed economies of the world. Further, Rapid development in
technology (especially in the last one decade) is another major driver of
linking the various markets across the world. Internet has enabled the
investors to virtually trade/invest in any developed market across the world.
Also, stock returns of Pakistan stock market are positively and significantly
related to the Indian, Sri Lankan and Japanese stock returns, while, Sri
Lankan stock returns has significant correlations with USA and Japanese
stock returns, besides Indian stock returns.
Since notable correlations have been found between the variables under
consideration, so further econometric tools are applied on them. However,
one important point to be noted here is that a high or low degree of
correlation surely doesn't signify or rules out causality. It merely points
towards the positive or negative linear relationship that exists between the
two variables.
3. Vector Auto Regression (VAR) Test
Akaike Information Criterion (AIC) and Schwarz Information
Criterion (SC) are applied to calculate the optimal lag length to be used in
applying the statistical tools. It has come out to be two as per AIC and one as
per SC. Therefore, VAR is applied on Lag one on Stationary series of
indices because VAR is a vector extension of the univariate autoregressive
(AR) process and therefore, it is applicable only with I(0) variables. The
stock markets of two countries are said to be integrated with each other if the
t-statistics is more than 2.58 (i.e. at 1% level of significance); 1.96 (i.e. at
5% level of significance) and 1.645 (i.e. at 10% level of significance).
RIJBR ISSN : 2455-5959114

Table 3: Results of VAR - 1 Lag – Daily Data (Log Differenced
Series)
The following inferences can be made from the results obtained for VAR
and reported in Table 3:
Ÿ Returns in Bangladesh and India has no significant influence on the
returns from any other stock exchange at lag 1.
Ÿ Returns in Pakistan has an influence on its own returns and returns of Sri
Lanka at 1% and 5% level of significance respectively.
Ÿ Returns in Sri Lanka has an influence on its own returns at lag 1 at 1%
level of significance. Further it has influence on returns of Pakistan and
Japan at lag 1 with 1% and 5% level of significance respectively.
Ÿ Returns in USA has an influence on the stock returns of all other selected
markets including its own returns except Bangladesh stock returns at lag
1 with significance level of 1%. These results again establish the strong
nature of USA economy having influence on practically all other
countries of the world.
Ÿ Returns in UK has an influence on its own returns and returns of USA
and Japan.
Ÿ Returns in Japan are found to influence its own returns and the returns of
RIJBR ISSN : 2455-5959115
VAR Estimates
t-statistics in []Bangladesh India Pakistan Sri Lanka USA UK Japan
Bang(-1)-0.003584 0.010860 -0.021997 0.012572 0.005714 -0.008444 0.014866
[-0.22046] [0.68425] [-1.44790] [1.10980] [0.53391] [-0.79013] [1.10335]
Ind(-1)0.019279 0.018781 0.021730 0.001277 -0.010022 0.000970 0.015484
[1.09364] [1.09122] [1.31899] [0.10392] [-0.86361] [0.08368 [1.05976]
Pak(-1)0.017767 -0.025500 0.091460* 0.029138** 0.010635 -0.012758 0.010464
[1.01899] [-1.49788] [5.61274] [2.39808] [0.92651] [-1.11304] [0.72407]
Slk(-1)-0.029682 0.021280 0.059919* 0.152877* 0.014201 0.015057 0.044401**
[-1.27342] [0.93506] [2.75062] [9.41160] [0.92546] [0.98256] [2.29821]
USA(-1)-0.018614 0.199338* 0.119635* 0.093643* -0.061365* 0.244563* 0.326414*
[-0.57001] [6.24310] [3.91443] [4.10907] [-2.85031] [11.3755] [12.0425]
UK(-1)0.007431 -0.012519 0.008780 0.000699 0.039474*** -0.167036* 0.067129**
[0.21957] [-0.37888] [0.27760] [0.02965] [1.77175] [-7.50763] [2.39318]
Japan(-1)-0.006626 -0.005814 -0.009745 -0.010027 -0.012234 -0.065149* -0.164341*
[-0.31011] [-0.27870] [-0.48807] [-0.67344] [-0.86981] [-4.63830] [-9.28047]
C 0.000784 0.000673 0.000758 0.000402 0.000489 0.000184 0.000290-
[2.15471] [1.89640] [2.23192] [1.58636] [2.04200] [0.76951] [-0.96228]
*Significant at 1%**Significant at 5%***Significant at 10%

UK at 1% level of significance.
4. Granger Causality Test
Granger Causality test is also applied at one lag length. Also, Stock market
is a dynamic market where it is generally not expected that the lag would be
more than one or two as it is unlikely that effects of a shock in one market on
others will extend beyond two days.
Table 4: Granger Causality Test - 1 Lag – Daily Data (Log
Differenced Series)
Table 4 shows the result of Granger causality test at one lag length. It is
found that the stock returns of all the selected SAARC countries except
Bangladesh are granger caused by the changes taking place in the stock
markets of developed countries, namely, USA and UK at 1% level of
significance. The impact of USA and UK markets on Asian markets can be
attributed to the Asian country's trade and financial exposures to these
advanced markets, their individual cyclical positions, and their
internal/external imbalances. Moreover, most of the investment in Asian
markets is dominated by foreign direct investment and portfolio investment
held by private investors in US and European economies. This structure is
susceptible to “risk-on, risk off” flows, which are often driven by
developments in advanced economies, especially when global markets
experience stress.
Further, there is two-way causality found between Japanese and Indian
stock returns; Pakistan and Sri Lankan stock returns; and UK and Japanese
stock returns. Also, Indian stock returns are granger causing Pakistan stock
RIJBR ISSN : 2455-5959116
(Lag 1) DlogBang DlogInd DlogPak DlogSlk DlogUSA DlogUK DlogJapan
DlogBang N.A.
DlogInd N.A. * *
DlogPak *** N.A. *
DlogSlk N.A.
DlogUSA * * * N.A. * *
DlogUK * * * N.A. *
DlogJapan ** ** N.A.
* Significant at 1%** Significant at 5%*** Significant at 10%


and large countries mainly depend on exporting to American markets. As a
result, analysts track the news related to USA very closely (for example
weekly USA employment numbers, sub-prime crisis of USA, FED interest
rate movement etc). Whenever we see any negative news occuring in
American markets, it triggers a tsunami in global markets especially in short
term.
Further, looking at the responses given by the SAARC countries for the
shocks created in other SAARC countries, it is observed that Bangladesh
stock market responds positively to one standard deviation shock created in
Indian and Pakistan stock market that lasts for upto 3-4 days; Indian stock
market responds negatively to one standard deviation shock created in
Pakistan stock market that lasts for upto 2-3 days; Pakistan stock market
responds positively to one standard deviation shock created in Indian and
Sri Lankan stock market that lasts for upto 4-5 days and Sri Lankan stock
market also responds positively to one standard deviation shock created in
Indian and Pakistan stock market lasting for upto 4-5 days. The results are
similar to the ones obtained under Granger Causality Test.
6. Johansen's Co-integration Test
The Johansen co-integration test to check for the long-term relationship
based on both Trace and Maximum Eigenvalue statistics is applied using
the following models:
1. No Intercept, No Trend;
2. Intercept, No Trend;
3. Linear Intercept, No Trend;
4. Linear Intercept with Trend; and
5. Quadratic Intercept with Trend.
RIJBR ISSN : 2455-5959119

Table 5: Johansen's Co-integration Test – Daily Data (Log Series)
RIJBR ISSN : 2455-5959120
Variables Test Type
Number of Co-integrating Relations by Model
Presence of Co-
integration
No Intercept, No Trend
Intercept, No Trend
Linear Intercept
& No Trend
Linear Intercept & Trend
Quadratic Intercept &
Trend
Bang – IndTrace 1 1 0 0 0
YesMax Eigen 1 1 0 0 0
Bang – PakTrace 1 0 0 0 0
YesMax Eigen 0 0 0 0 0
Bang – SlkTrace 2
0
0
0
0
YesMax Eigen 0
0
0
0
0
Bang – USATrace 0
0
0
0
0
NoMax Eigen 0
0
0
0
0
Bang – UKTrace 0
0
0
0
0
NoMax Eigen 0
0
0
0
0
Bang –Japan
Trace 0
0
0
0
0
NoMax Eigen 0
0
0
0
0
Ind – PakTrace 0
1
0
0
2
YesMax Eigen 0
1
1
0
0
Ind – SlkTrace 0
0
0
0
1
YesMax Eigen 0
1
0
0
0
Ind – USA Trace 0
0
0
0
0
No
Max Eigen 0
0
0
0
0
Ind – UKTrace 0
0
0
0
0
NoMax Eigen 0 0 0 0 0
Ind – JapanTrace 0
0
0
0
0
NoMax Eigen 0 0 0 0 0
Pak – Slk
Trace 2
0
0
0
0
Yes
Max Eigen 0
0
0
0
0
Pak – USATrace 0
0
0
0
0
NoMax Eigen 0
0
0
0
0
Pak – UK
Trace 0
0
0
0
0
NoMax Eigen 0
0
0
0
0
Pak – JapanTrace 0
0
0
0
0
NoMax Eigen 0
0
0
0
0
Slk – USATrace 0 0 0 0 0
NoMax Eigen 0 0 0 0 0
Slk – UKTrace 0 0 0 0 0
NoMax Eigen 0 0 0 0 0

Table 5 shows the results obtained from using different models of
Johansen's Co-integration Test of finding the long term co-integrating
relationship between the stock markets of selected four SAARC countries
and selected three developed countries considered in the study. It has been
found that the stock markets of following pairs of countries are co-
integrated in the long term by atleast one of the model, Bangladesh & India;
Bangladesh & Pakistan; Bangladesh & Sri Lanka; India & Pakistan; India
& Sri Lanka; and Pakistan & Sri Lanka. This implies that the stock markets
of all four selected SAARC countries are co-intgrated in the long term.
Multi-variate Johansen's co-integration test is also applied using all these
five above mentioned models on all the selected SAARC countries as well
as total set of countries taken up in the study including both SAARC and
developed countries. The results revealed that there is long term co-
integrating relationship among the stock market indices of selected SAARC
countries together at 5% level of significance. However, all seven selected
countries are not co-integrated in the long term. This opens up long term
benefits from portfolio diversification across these markets.
7. Vector Error Correction Model (VECM)
Now, let us discuss the results derived from the application of VECM on
those pairs of variables that are co-integrated in the long term. While, long
term relationship among the variables is established through co-integration
test, it is the VECM that helps in capturing the short-term dynamics.
Therefore, before the VECM can be performed, there first has to be an
evidence of co-integration. VECM results help in knowing which variable
among the two long term co-integrated variables makes more adjustment in
order to reach this long term co-integrating relationship. The results are
summarised in Table 6.
RIJBR ISSN : 2455-5959121
Slk – JapanTrace 0 0 0 0 0
NoMax Eigen 0 0 0 0 0
Bang – Ind –Pak – Slk
Trace 1 0 0 0 0Yes
Max-Eigen 0 0 0 0 0
Bang – Ind –Pak – Slk –USA – UK –
Japan
Trace 0 0 0 0 0No
Max-Eigen 0 0 0 0 0
“0” means Absence of Co-integration
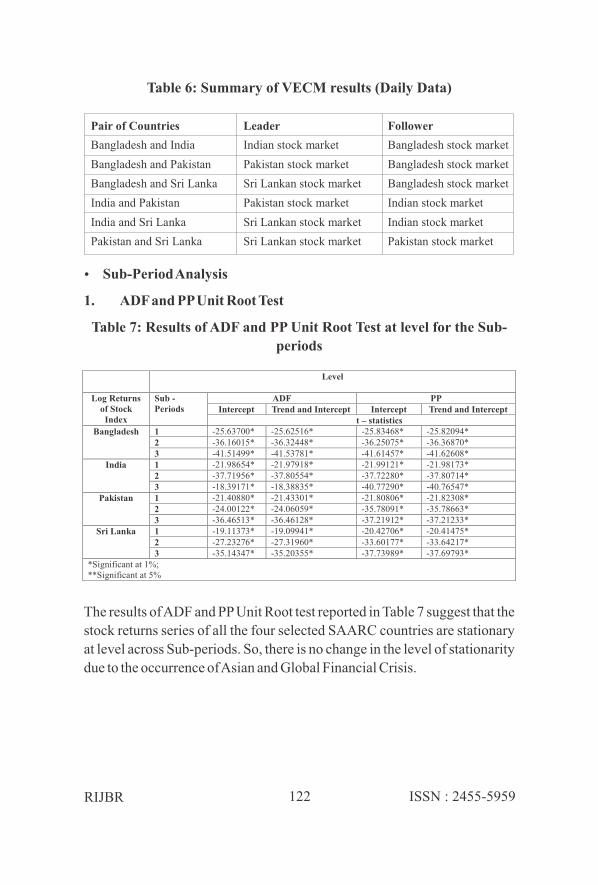
Table 6: Summary of VECM results (Daily Data)
Ÿ Sub-Period Analysis
1. ADF and PP Unit Root Test
Table 7: Results of ADF and PP Unit Root Test at level for the Sub-
periods
The results of ADF and PP Unit Root test reported in Table 7 suggest that the
stock returns series of all the four selected SAARC countries are stationary
at level across Sub-periods. So, there is no change in the level of stationarity
due to the occurrence of Asian and Global Financial Crisis.
RIJBR ISSN : 2455-5959122
Pair of Countries Leader Follower
Bangladesh and India Indian stock market Bangladesh stock market
Bangladesh and Pakistan Pakistan stock market Bangladesh stock market
Bangladesh and Sri Lanka Sri Lankan stock market Bangladesh stock market
India and Pakistan Pakistan stock market Indian stock market
India and Sri Lanka Sri Lankan stock market Indian stock market
Pakistan and Sri Lanka Sri Lankan stock market Pakistan stock market
Level
Log Returns of Stock
Index
Sub -Periods
ADF PPIntercept Trend and Intercept Intercept Trend and Intercept
t – statisticsBangladesh 1 -25.63700* -25.62516* -25.83468* -25.82094*
2 -36.16015* -36.32448* -36.25075* -36.36870*3 -41.51499* -41.53781* -41.61457* -41.62608*
India 1 -21.98654* -21.97918* -21.99121* -21.98173*2 -37.71956* -37.80554* -37.72280* -37.80714*3 -18.39171* -18.38835* -40.77290* -40.76547*
Pakistan 1 -21.40880* -21.43301* -21.80806* -21.82308*2 -24.00122* -24.06059* -35.78091* -35.78663*3 -36.46513* -36.46128* -37.21912* -37.21233*
Sri Lanka 1 -19.11373* -19.09941* -20.42706* -20.41475*2 -27.23276* -27.31960* -33.60177* -33.64217*3 -35.14347* -35.20355* -37.73989* -37.69793*
*Significant at 1%; **Significant at 5%

2. Correlation Analysis
Table 8: Correlation Coefficients (Daily Data – Sub-Period Analysis)
By comparing the results of Correlation coefficients across sub-periods, it
has been found that the Bangladesh stock returns are not correlated to the
stock returns of any of the other selected countries stock returns across all
the three sub-periods, while, on the other hand, Indian stock returns are
positively and significantly correlated to the stock returns of Bangladesh
and Japanese stock returns as well after Asian Financial Crisis besides
having significant correlation with Sri Lankan, USA and UK stock returns
even before the occurence of Crisis. Pakistan stock returns are also
postively and significantly related to the Sri Lankan stock returns in Sub-
period 1 and 2 but the correlation with Sri Lankan stock returns does not
remain significant post Global Financial Crisis. Lastly, both Pakistan and
Sri Lankan stock returns are negatively and significantly correlated to the
stock returns of all the three developed countries stock market in Sub-
period 1. However, the correlation turned insignificant in Sub-period 2 and
then, positive and significant in Sub-period 3.
RIJBR ISSN : 2455-5959123
Series Sub-Periods
Bangladesh India PakistanSri
LankaUSA UK Japan
Bangladesh1
1-0.05242 0.03715 0.000003 -0.02516 0.04203 -0.02585
2 0.028663 -0.00294 -0.018982 0.024101 0.000749 -0.013423 -0.02154 0.001635 0.004398 -0.03529 -0.03703 -0.03309
India1
10.19412 0.1702* -0.122* -0.087** -0.05262
2 0.15156* 0.08096* 0.14766* 0.21336* 0.27858*3 0.12738* 0.14767* 0.40478* 0.53767* 0.45767*
Pakistan1
10.3226* -0.2239* -0.1522* -0.1459*
2 0.08052* -0.00056 0.038967 0.07075*3 0.025600 0.05133** 0.107942* 0.128547*
Sri Lanka1
1-0.2229* -0.1562* -0.1075*
2 -0.02066 0.012257 0.0491263 0.00991 0.089379* 0.160356*
*Significant at 1%**Significant at 5%

3. Vector Auto Regression (VAR) Test
Table 9: Results of VAR - 1 Lag – Daily Data (Log Differenced
Series)
RIJBR ISSN : 2455-5959124
VAR Estimates
t-statistics in []
Sub-Periods
Bangladesh India Pakistan Sri Lanka USA UK Japan
Bang(-1)
1 -0.042387 0.007889 -0.06033** -0.009372 0.007369 -0.02573*** 0.050065**
[-1.03524] [ 0.24699] [-2.30238] [-0.49983] [ 0.52890] [-1.72794] [ 2.21880]
2 0.040808 0.042843 0.045638 0.039239 -0.026308 -0.004905 -0.042161
[ 1.53735] [ 1.36088] [ 1.28611] [ 1.44279] [-1.24140] [-0.23261] [-1.63264]
3 0.008232 -0.001080 -0.031952 0.023728 0.032135 0.010001 0.019457
[0.34436] [-0.04435] [-1.55673] [1.58857] [1.58983] [0.050075] [0.81231]
Ind(-1)
1 0.017439
0.110997*
0.006217
-0.008002
-0.003292
0.023739 0.015934
[ 0.32964]
[ 2.68957]
[ 0.18362]
[-0.33029]
[-0.18286]
[ 1.23406] [ 0.54653]
2 0.013429
-0.036808
0.06668**
0.006571
-0.007145
-0.022151 -0.019884
[ 0.57292]
[-1.32406]
[ 2.12808]
[ 0.27361]
[-0.38183]
[-1.18957] [-0.87199]
3 0.034643
-0.05828**
-0.034844
-0.005713
-0.028463
-0.000241 0.032656
[1.21569]
[-2.00722]
[-1.42401]
[-0.32082]
[-1.1812]
[-0.01011] [1.14361]
Pak(-1)
1 0.080994
-0.11418**
0.142734*
-0.006955
-0.007825
-0.013321 -0.038171
[ 1.20346]
[-2.17490]
[ 3.31408]
[-0.22567]
[-0.34167]
[-0.54436] [-1.02920]
2 0.014187
-0.002812
0.05024***
0.04638**
0.03443**
-0.002406 0.014600
[ 0.70858]
[-0.11840]
[ 1.87697]
[ 2.26114]
[ 2.15381]
[-0.15127] [ 0.74952]
3 -0.018376
-0.003115
0.134571
-0.010826
-0.019462
-0.025715 0.027495
[-0.66866]
[-0.11127]
[5.70284]
[0.63046]
[-0.8375]
[-1.11996] [0.99845]
Slk(-1)
1 -0.062714
0.012662
0.075310
0.273715*
0.05886***
0.013263 0.077673
[-0.67230]
[ 0.17400]
[ 1.26155]
[ 6.40707]
[ 1.85422]
[ 0.39101] [ 1.51093]
2 -0.040793
0.013175
0.037518
0.109365*
-0.026474
-0.007221 0.018007
[-1.58093]
[ 0.43051]
[ 1.08764]
[ 4.13673]
[-1.28514]
[-0.35227] [ 0.71731]
3 0.003403
0.049919
0.105336*
0.176369*
0.08291**
0.06868** 0.07549**
[0.08918] [1.28407] [3.21494] [7.39703] [2.56946] [2.15425] [1.97423]
USA(-1)
1 -0.059076 0.090780 0.062087 0.153597** 0.09103*** 0.167726* 0.100740
[-0.37781]
[ 0.74425]
[ 0.62047]
[ 2.14493]
[ 1.71090]
[ 2.95002] [ 1.16909]
2 0.006227
0.216079*
0.134998**
0.07645***
-0.033001
0.248613* 0.272285*
[ 0.14615]
[ 4.27588]
[ 2.36999]
[ 1.75126]
[-0.97014]
[ 7.34471] [ 6.56868]
3
-0.034654
0.201245*
0.121303*
0.098159*
-0.117375* 0.269575* 0.420558*
[-0.89866]
[5.09303]
[3.64249]
[4.05037]
[-3.57897]
[8.31908] [10.8213]
UK(-1)
1 0.011798
-0.161838
0.084313
-0.033126
-0.014259
-0.027301 0.054084
[ 0.08386]
[-1.47459]
[ 0.93643]
[-0.51412]
[-0.29783]
[-0.53366] [ 0.69755]
2 0.018883
0.000757
-0.052526
0.039859
0.012347
-0.201028* 0.032026
[ 0.43633]
[ 0.01476]
[-0.90792]
[ 0.89895]
[ 0.35736]
[-5.84733] [ 0.76068]
3 0.000107
0.08037***
0.07106***
-0.017135
0.085838** -0.186586* 0.10345**
[0.00245]
[1.80461]
[1.89303]
[-0.62730]
[2.32215]
[-5.10859] [2.36164]
Japan(-1)
1 0.005315
0.007356
0.020655
0.005682
-0.039723
-0.102379 -0.088732
(0.07888)
(0.06153)
(0.05048)
(0.03612)
(0.02684)
(0.02868) (0.04347)
2 0.012332
0.05852***
0.004544
-0.026143
-0.04124***
-0.04975** -0.146926*
[ 0.41268]
[ 1.65112]
[ 0.11375]
[-0.85387]
[-1.72880]
[-2.09561] [-5.05402]
3 -0.023820 -0.044897 -0.035616 -0.002506 0.016210 -0.54620** -0.21377*
[-0.88835] [-1.64349] [-1.54693] [-0.14958] [0.71495] [-2.43812] [-7.95614]
C
1 0.002304 0.001287 0.000457 3.65E-05 0.001190 0.000768 -0.000610
[ 1.51042] [ 1.08210] [ 0.46813] [ 0.05222] [ 2.29211] [ 1.38477] [-0.72598]
2 0.000492 0.000821 0.001269 0.000554 0.000347 0.000188 -0.000242
[ 0.99052] [ 1.39194] [ 1.90986] [ 1.08806] [ 0.87323] [ 0.47626] [-0.50016]
3 0.000526 0.000450 0.000472 0.000379 0.000297 -0.0000535 -0.000085
[1.23491] [1.03725] [1.29210] [1.42489] [0.82351] [-0.15044] [-0.19911]
*Significant at 1%**Significant at 5%***Significant at 10%
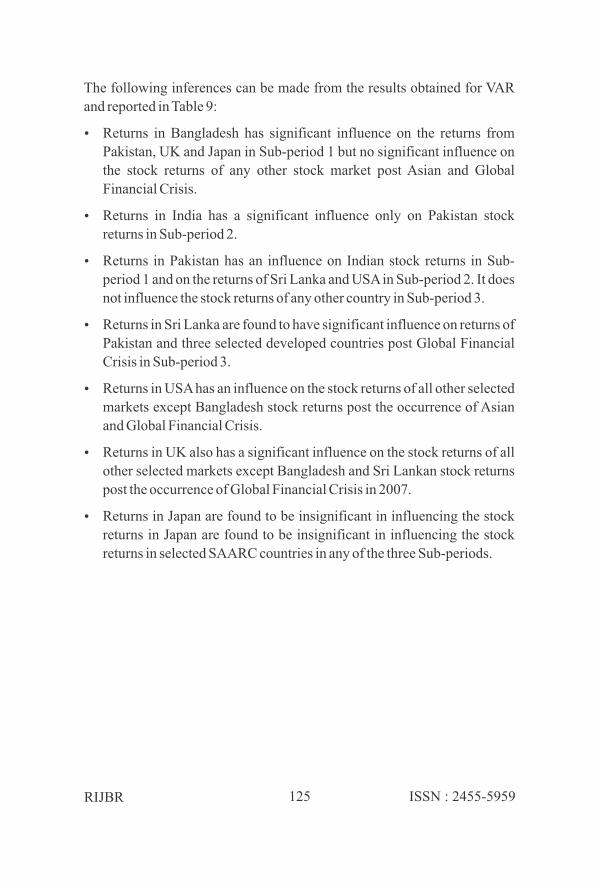
The following inferences can be made from the results obtained for VAR
and reported in Table 9:
Ÿ Returns in Bangladesh has significant influence on the returns from
Pakistan, UK and Japan in Sub-period 1 but no significant influence on
the stock returns of any other stock market post Asian and Global
Financial Crisis.
Ÿ Returns in India has a significant influence only on Pakistan stock
returns in Sub-period 2.
Ÿ Returns in Pakistan has an influence on Indian stock returns in Sub-
period 1 and on the returns of Sri Lanka and USA in Sub-period 2. It does
not influence the stock returns of any other country in Sub-period 3.
Ÿ Returns in Sri Lanka are found to have significant influence on returns of
Pakistan and three selected developed countries post Global Financial
Crisis in Sub-period 3.
Ÿ Returns in USA has an influence on the stock returns of all other selected
markets except Bangladesh stock returns post the occurrence of Asian
and Global Financial Crisis.
Ÿ Returns in UK also has a significant influence on the stock returns of all
other selected markets except Bangladesh and Sri Lankan stock returns
post the occurrence of Global Financial Crisis in 2007.
Ÿ Returns in Japan are found to be insignificant in influencing the stock
returns in Japan are found to be insignificant in influencing the stock
returns in selected SAARC countries in any of the three Sub-periods.
RIJBR ISSN : 2455-5959125

4. Granger Causality Test
Table 10: Granger Causality Test - 1 Lag (Daily Data – Sub Period
Analysis)
Table 10 shows the result of Granger causality test at 1 lag length. There is
not much causality found among the stock returns of selected SAARC
countries post Asian and Global Financial Crisis except Indian stock returns
causing Pakistan stock returns and Pakistan stock returns causing Sri
Lankan stock returns in Sub-period 2 and Bangladesh and Sri Lankan stock
returns causing Pakistan stock returns in Sub-period 3.
What is more important to be noted here is the causality running from the
stock markets of developed countries to the stock markets of selected
SAARC countries. The extent of integration has intensified with the
passage of time. USA and UK stock returns are found to granger cause the
RIJBR ISSN : 2455-5959126
(Lag 1) Sub-Periods
DlogBang DlogInd DlogPak DlogSlk DlogUSA DlogUK DlogJapan
DlogBang 1 N.A. ** *** **
2
3 ***
DlogInd 1 N.A.
2 *
3 *
DlogPak 1 ** N.A.
2 ** ***
3
DlogSlk 1 N.A.
2
3 *
DlogUSA 1 ** N.A. ** ***
2 * * * * *
3 * * ** * *
DlogUK 1 N.A.
2 * ** *
3 * * * *
DlogJapan 1 * N.A.
2 *
3 *** **
* Significant at 1%; ** Significant at 5%; *** Significant at 10%

stock returns of all the remaining countries except Bangladesh stock returns
post Global Financial Crisis. This shows the increasing dominance of USA
among the world stock markets over a period of time. Japanese stock returns
are not found to granger cause the stock returns of selected SAARC
countries in any of the three Sub-periods.
5. Impulse Response Analysis
The comparison of results among the three Sub-periods obtained from
Impulse Response Analysis gives almost the same conclusion as obtained
through Granger Causality test. It is found that all selected SAARC
countries stock markets except Bangladesh responds positively to one
standard deviation shock occured in USA stock market that lasts for 3-4
days in Sub-period 2 and 3. There is almost negligible response observed in
case of SAARC countries stock markets for the shocks taking place in UK
and Japanese stock market in all the three Sub-periods except Indian and Sri
Lankan stock markets responding negatively to the shocks created in UK
stock market in Sub-period 1.
Now, looking at the responses given by the SAARC countries for the shocks
created in other SAARC countries, it is found that the Bangladesh stock
market is immune to the shocks created in other selected SAARC countries
stock markets in all the sub-periods except responding positively to one
standard deviation shock occured in Pakistan stock market in Sub-period 1.
Indian stock market gives a negative response to one standard deviation
shock occured in Bangladesh and Pakistan stock market in Sub-period 1
and a positive response to one standard deviation shock occured in
Bangladesh stock market in Sub-period 2. However, in Sub-period 3, there
is no response recorded for Indian stock market for changes taking place in
rest of the SAARC countries. There is positive response observed in the
case of Pakistan and Sri Lankan stock market for one standard deviation
shock occuring in Indian stock market that lasts for upto 3-4 days in all the
three Sub-periods.
RIJBR ISSN : 2455-5959127

6. Johansen's Co-integration Test and Vector Error Correction
Model (VECM)
Table 11: Summary of Johansen Co-integration Test and VECM
Results
RIJBR ISSN : 2455-5959128
Pair of CountriesCo-integration relationship in the Long term
Sub-Period 1 Sub-Period 2 Sub-Period 3
Bangladesh and India No
Yes
NoLeader Follower
Indian Stock Market
Bangladesh Stock
Market
Bangladesh and Pakistan
No
Yes
NoLeader Follower
Pakistan Stock Market
Bangladesh Stock
Market
Bangladesh and Sri Lanka No
Yes
NoLeader Follower
Sri Lankan Stock Market
Bangladesh Stock
Market
Bangladesh and USA
No NoNo
Bangladesh and UK No No No
Bangladesh and Japan
Yes
NoNoLeader Follower
Bangladesh Stock Market
Japanese Stock Market
India and Pakistan
Yes
NoNo
Leader Follower
Pakistan Stock Market
Indian Stock Market
India and Sri LankaNo
Yes
No
Leader Follower
Sri Lankan Stock Market
Indian Stock Market
India and USA
Yes
No
Yes
Leader Follower Leader Follower
Indian Stock Market
USA Stock Market
Indian Stock Market
USA Stock Market
India and UK
Yes
No
No
Leader Follower
Indian Stock Market
UK Stock Market
India and Japan
Yes Yes Yes
Leader Follower Leader Follower Leader Follower
Indian Stock Market
Japanese Stock
Market
Indian Stock Market
Japanese Stock
Market
Indian Stock Market
Japanese Stock Market

The results reported in Table 11 indicates that the Bangladesh and Sri
Lankan stock market had long term co-integration with rest of the selected
SAARC countries only in Sub-period 2, i.e., post Asian Financial Crisis.
Besides this, Bangladesh stock market had long term co-integration
relationship with only Japanese stock market among the selected three
developed countries in Sub-period 1. Indian stock market had long term co-
integration with Pakistan stock market in Sub-period 1 and with
Bangladesh and Sri Lankan stock market in Sub-period 2. Further, Indian
stock market has long term co-integration with all the three developed
countries in Sub-period 1; with only Japanese stock market in Sub-period 2;
and USA and Japanese stock market in Sub-period 3. Pakistan stock market
had long term co-integration with Bangladesh and Sri Lankan stock market
in Sub-period 2 and with all three developed countries in Sub-period 3.
These results also reinforce the strong nature of USA economy whose stock
market is found to have long term relationship with Indian and Pakistan
stock markets specially after Global Financial Crisis in Sub-period 3.
RIJBR ISSN : 2455-5959129
Pakistan and Sri Lanka
No
Yes
NoLeader Follower
Sri Lankan Stock Market
Pakistan Stock Market
Pakistan and USA No No
Yes
Leader Follower
Pakistan Stock Market
USA Stock Market
Pakistan and UK No No
Yes
Leader Follower
Pakistan Stock Market
UK Stock Market
Pakistan and Japan No No
Yes
Leader Follower
Pakistan Stock Market
Japanese Stock Market
Sri Lanka and USA No No No
Sri Lanka and UK No No No
Sri Lanka and Japan No
Yes
NoLeader Follower
Japanese Stock Market
Sri Lankan Stock Market

5. CONCLUSION
This paper focussed on checking for the presence of any short-term causal
relationship and long-term co-integration relationship among stock
markets of selected SAARC countries among themselves and with the stock
markets of three developed countries of the world, namely, USA, UK and
Japan. It also checked for the presence of sensitivity in the stock markets of
selected SAARC countries to the shocks created in the stock markets of
other countries (SAARC and Developed) in the short term. The data
consisted of daily stock indices of these seven countries for more than th
twenty-seven years period starting from November 5 , 1991 till December st31 , 2018. The analysis is carried out using ADF and PP Unit root tests, Karl
– Pearson's Correlation Matrix, Granger-Causality Test, Impulse Response
Analysis, Johansen's Co-integration Test and VECM. Apart from the
analysis of objectives for the entire sample period, a Sub-period analysis
has also been carried on checking for the impact of Asian and Global
Financial Crisis.
The result of correlation analysis points towards the fact that Indian stock
returns are positively and significantly related to the stock returns of all
other countries stock markets taken up in the study, except Bangladesh
stock returns. The reason that can be attributed to this positive and
significant correlation of Indian stock market returns with the stock market
returns of other countries is the large bi-lateral trade between these
countries. Also, the countries in the SAARC region have close social,
political and cultural ties that makes their stock returns closely related. The
degree of correlation of stock returns of SAARC countries with the stock
returns of developed countries has increased post global financial crisis.
The short run causal relationships reported by VAR, Granger Causality Test
and Impulse Response Analysis with respect to the stock market integration
of selected four SAARC countries (not only among themselves but also
their integration with the developed economies of the world) unanimously
point towards the strong influencing nature of USA economy on rest of the
selected countries. USA stock returns are found to significantly influence
the stock returns of all other selected countries except Bangladesh stock
returns for the entire sample period. Not much short-term financial
integration has been found among the selected four SAARC countries. The
RIJBR ISSN : 2455-5959130

reasons for the same can be low regional trade intensity in the SAARC
region which is in fact found to be the lowest amongst all the major regional
trading blocs of the world. Janakiramanan and Lamba (1998) and
Mukherjee and Bose (2008) also reported that the US market has a
dominating effect on other markets. As per the results of Johansen's co-
integration test, there is found long-term co-integrating relationship among
the selected SAARC countries. VECM results helped in finding out the long
run correction mechanism to arrive at the equilibrium situation.
The result of VAR, Granger Causality Test, Johansen's Co-integration test
and VECM varies among the three sub-periods. It is found that the short-
term inter-linkages among SAARC countries are not significant, but the
influence coming from the developed countries is substantial. Among the
developed countries, USA and UK stock returns have more influence on the
stock returns of selected SAARC countries as compared to the stock returns
of Japan. The result of Johansen's co-integration test also reinforces the
strong nature of USA economy whose stock market is found to have long
term relationship with Indian and Pakistan stock markets specially after
Global Financial Crisis in Sub-period 3. It can be concluded that the extent
of inter-linkages of SAARC countries (among themselves and also their
integration with the developed economies of the world) has intensified with
the passage of time and have been found to be at their peak after the Global
Financial Crisis of 2007, i.e., Sub-period 3.
Ÿ Policy Implications
The findings of present study can have significant implications for policy
makers, regulators, government, potential investors, academicians and
researchers.
Since, there are found Inter-Linkages across the stock markets of SAARC
countries (not only from their own SAARC counterparts but also from the
selected three developed countries of the world), the regulators in these
markets must consider the effect of any policy or regulation change taking
place in counter markets so as to take preventive measures well in advance.
Among the SAARC countries, Indian stock market has been found to be the
dominant one and therefore, the market regulators of Bangladesh, Pakistan
and Sri Lanka should keep a close watch on the developments taking place
RIJBR ISSN : 2455-5959131

in Indian Stock Market as these developments might change the perception
of investors across the remaining three markets. On an International front,
USA stock market has been found to be the dominant one and the regulators
of all the South Asian Markets are always required to formulate their
policies keeping in consideration the developments taking place in USA
stock market as well USA economy.
In order to further enhance the level of trade integration among the member
countries, the policy-makers of SAARC countries must try to improve their
macroeconomic fundamentals, reinforce the regional institutional
frameworks, carry out capital market reforms and efficiently manage cross-
border portfolio investments. They should also take steps to foster a stable
political environment for clean and transparent governance, while ensuring
the security concerns of member countries.
In order to promote the development of equity markets in SAARC
countries, the member countries can come up with an Integrated Equity
Markets Platform where companies of only the member countries can get
their shares listed. India can take the lead by providing its financial support
and technical expertise for establishing and operating equity market
infrastructure in other SAARC member countries which are lagging like
Bhutan, Afghanistan, Nepal and Maldives, as India has the most
sophisticated equity market infrastructure with effective regulatory
framework in the SAARC region.
The investors would find little opportunity to make abnormal gains through
international diversification because of the significant positive correlation
among the stock returns of selected stock markets. Potential investors need
to work upon some schemes in order to exploit possible arbitrage
opportunities as there is presence of lead-lag relationships among selected
markets.
Ÿ Limitations and Scope for Future Research
The study is confined to only four out of eight SAARC countries because
the stock markets of rest four countries are either not developed or they are
in their nascent stage of existence. So, a complete analysis of SAARC as a
whole could not be performed. Further, the study is exclusively based on
secondary data collected from Bloomberg Database. Therefore, the quality
RIJBR ISSN : 2455-5959132
of the study depends purely on the accuracy, reliability and quality of the
secondary data source.
In future, a greater number of developed countries can be considered and
the study can be made more in line with the recent times by including the
data for recently established stock markets of Nepal and Maldives among
the SAARC countries.
REFERENCES
Agmon, T. (1972). The relations among Equity Markets: A Study of Share
Price Co-movements in the United States, United Kingdom, Germany and
Japan. The Journal of Finance, 27(4), 839-855.
Arshanapalli, B., & Doukas, J., (1993). International Stock Market
Linkages: Evidence from the Pre- and Post-October 1987 period, Journal of
Banking and Finance, 17, 193-208.
Arshanapalli, B., Doukas, J., & Lang, L., (1995). Pre and Post October 1987
Stock Market Linkages between US and Asian Markets, Pacific-Basin
Finance Journal 3, 57-73.
Becker, K. G., Finnerty, J. E., & Gupta, M. (1990). The Intertemporal
Relation between the US and Japanese Stock Markets. The Journal of
Finance, 45, 1297- 1306.
Bose, S., & Mukherjee, P. (2006). A Study of Inter Linkages between the
Indian Stock Market and some other Emerging and Developed markets.
Paper presented at the 9th Capital Markets Conference, Indian Institute of
Capital Markets, Mumbai, India, 2005. Available at SSRN:
http://ssrn.com/abstract=876397
Dhal, S. (2009). Global Crisis and the Integration of India's Stock Market.
Journal of Economic Integration, 24(4), 778-805.
Elyasiani, E., Perera, P., & Puri, T.N. (1998), Interdependence and Dynamic
Linkages between Stock Markets of Sri Lanka and its Trading Partners.
Journal of Multinational Financial Management, 8, 89-101.
Eun, C., & Shim, S. (1989). International Transmission of Stock Market
Movements. Journal of Financial and Quantitative Analysis, 24, 241 – 256.
RIJBR ISSN : 2455-5959133

Grubel, H. (1968). Internationally diversified portfolios: Welfare gains and
capital flows. The American Economic Review, 58, 1299- 1314.
Hashmi, A.R., & Xingyun, L. (2001). Interlinkages among South East
Asian Stock Markets (A Comparison Between Pre- and Post-1997-Crisis
Periods). Working Paper presented at the 10th International Tor Vergata
Financial Conference, December 2001, Rome, Italy. Web Link:
http://www.chass.utoronto.ca/~ ahashmi/pdf_files/Hashmi_ECO2401.pdf
Hilliard, J. (1979). The Relationship between Equity Indices on World
Exchanges. The Journal of Finance, 34, 103- 114.
IHS Global Inc. (2013). Eviews 8 User's Guide I & II. Web-link:
www.eviews.com.
Janakiramanan, S., & Lamba, A.S. (1998). An Empirical Examination of
Linkages between Pacific-Basin Stock Markets. Journal of International
Financial Markets, Institutions and Money, 8. 155-173.
Khan, S.N., & Aslam, M.S. (2014). Co-integration of Karachi Stock
Exchange with Major South Asian Stock Exchanges. International Journal
of Accounting and Financial Reporting, 4(1), 106-117.
Koch, P.D., & Koch, T.W. (1991). Evolution in Dynamic Linkages across
Daily National Stock Indexes. Journal of International Money and
Finance, 10, 231-251.
Lamba, A.S. (2004). An Analysis of the Dynamic Relationships between
South Asian and Developed Equity Markets, NSE Research Initiative,
Paper 83. Web Link:
http://nseindia.com/content/research/comppaper_lat83.pdf
Latha, K., & Kumar, A. (2016). Inter-Linkages between Indian and Major
Equity Markets - Impact of Global Financial Crisis. Ramanujan
International Journal of Business and Research, 1, 1-15.
Mukherjee, P., & Bose, S. (2008). Does the Stock Market in India Move
with Asia? A Multivariate Co-integration-Vector Autoregression Approach.
Emerging Markets Finance & Trade, 44(5), 5-22.
Narayan, P., Smyth, R., & Nandha M. (2004). Interdependence and
Dynamic Linkages between the Emerging Stock Markets of South Asia.
RIJBR ISSN : 2455-5959134

Accounting and Finance, 44(3), 419–439.
Prakash, S., & Kumar, S. (2014). Stock Market Linkages: Examining the
case of Emerging South Asian Markets. Pacific Business Review
International, 6(12), 29-36.
Sehgal, S., Pandey, P. & Deisting, F. (2018) Time Varying Integration
amongst the South Asian Equity Markets: An Empirical Study. Cogent
Economics and Finance, 6, 1-26.
Sharma, G.D., & Bodla, B.S. (2011). Inter – Linkages among Stock
Markets of South Asia. Asia Pacific Journal of Business Administration,
3(2), 132-148.
Srivastava, A., Bhatia, S., & Gupta, P. (2015). Financial Crisis and Stock
Market Integration: An Analysis of Select Economies. Global Business
Review, 16(6), 1127–1142.
Tripathi, V., & Sethi, S. (2010). Integration of Indian Stock Market with
Major Global Stock Markets. Asian Journal of Business and Accounting,
3(1), 117-134.
Tripathi, V., & Sethi, S. (2012). Inter linkages of Indian Stock Market with
Advanced Emerging Markets. Asia-Pacific Finance and Accounting
Review, 1(1), 34-51.
Tripathi, V., Seth, R., & Kumar, M. (2013). Inter-Linkages, Co-integration
and Global Financial Crisis: India's Experience and Preparedness. The
Indian Journal of Commerce, 66(3), 173-188.
Tripathi, V. & Seth, R. (2016). Market Efficiency, Inter – Linkages and
Volatility Transmission in Stock Markets of Selected SAARC Countries.
South Asian Journal of Management 23(4), 149-174.
RIJBR ISSN : 2455-5959135