Emerging Risks and Opportunities Related to Food, and ... von Braun, IFPRI, September 2006 Food...
49
Emerging Risks and Opportunities Emerging Risks and Opportunities Related to Food, and Agriculture in Related to Food, and Agriculture in Development Development - - Implications for Policy and Research Implications for Policy and Research Joachim von Braun Joachim von Braun International Food Policy Research Institute International Food Policy Research Institute DFID-ODI seminar September 18, 2006
Transcript of Emerging Risks and Opportunities Related to Food, and ... von Braun, IFPRI, September 2006 Food...

Emerging Risks and Opportunities Emerging Risks and Opportunities Related to Food, and Agriculture in Related to Food, and Agriculture in
Development Development --Implications for Policy and ResearchImplications for Policy and Research
Joachim von BraunJoachim von BraunInternational Food Policy Research InstituteInternational Food Policy Research Institute
DFID-ODI seminarSeptember 18, 2006

Joachim von Braun, IFPRI, September 2006
Hunger and malnutritionHunger and malnutrition
500
550
600
650
700
750
800
850
900
950
1000
1969-1971 1979-1981 1990-1992 1995-1997 2001-2003provisional
2002-2004preliminary
Developing world
Developing world without China
Data source: FAO 2006
Number of hungry people in millions

Joachim von Braun, IFPRI, September 2006
Territory size based on the proportion of Territory size based on the proportion of underweight children that live thereunderweight children that live there
Source: SASI Group (University of Sheffield) and Newman (University of Michigan) 2006

Joachim von Braun, IFPRI, September 2006
Who is affected by hunger? Who is affected by hunger?
Source: UN Millennium Project, Hunger Task Force, 2005
Land less, rural 20%
Urban poor20%
Small Farmers50%
Fishers, herders

Joachim von Braun, IFPRI, September 2006
OverviewOverview
1. Big drivers of the food, health and agriculture situation
2. Agriculture and food/health related development concepts and complexities
3. Getting jointly to priorities for research and development actions

Joachim von Braun, IFPRI, September 2006
Driving forces of the food, health and Driving forces of the food, health and agriculture situationagriculture situation
Linkages among them, nat. resource impacts,and different risk/opportunity profiles
1-Consumer and corporate driven agri-food system
2-Science and
Technology
3-Energy and Climate4-Economic growth and distributions
Pop. growth and aging
Infections

Joachim von Braun, IFPRI, September 2006
Food retailers
top 10:$777bln
• Wal-Mart• Carrefour • Royal Ahold • Metro AG• Tesco
C o n s u m
e r s $4.000 billion11--The corporate world food system, 2005The corporate world food system, 2005
Food processors and traders
top 10: $363 bln
• Nestle• Cargill • Unilever • ADM • Kraft Foods
Agricultural input
industry
top 10: $37 bln
• Syngenta• Bayer • BASF • Monsanto • DuPont
Farms
Agricultural value added:
$1,315 bln
450 million>100 ha: 0.5%
< 2 ha: 85%
Source: von Braun 2005

Joachim von Braun, IFPRI, September 2006
Consumer demand for food quality and Consumer demand for food quality and safety and attributes of agriculturesafety and attributes of agriculture
• Growing consumer demand for product quality and food safety are due to
–– rising incomes levelsrising incomes levels–– changing dietary habits changing dietary habits –– increasing health awarenessincreasing health awareness
• Consumers increasingly aware of ethical and environmental aspects related to food and agricultural trade; > costs of compliance
• Increased latent demand for agric. eco-systems services

Joachim von Braun, IFPRI, September 2006
22--Science and TechnologyScience and Technology
•• Innovation systems in agricultureInnovation systems in agriculture
•• Molecular biologyMolecular biology
•• ICT revolution and developmentICT revolution and development

Joachim von Braun, IFPRI, September 2006
Agriculture research expenditure1991 and 2000
Share of global total (percent)Region/country 1991 2000China 8.7 13.7India 5.0 8.1Brazil 5.0 4.4Sub-Saharan Africa (44)
6.8 6.3
Middle East and North Africa (18)
5.7 6.0
Developing Country subtotal (117)
47.3 55.7
Total R&D expenditures (billion, 2000 international dollars)
Global (139) 19,9 23,0Source: Pardey et. al. 2006

Joachim von Braun, IFPRI, September 2006
BiotechnologyBiotechnology

Joachim von Braun, IFPRI, September 2006
Information technology and the poorInformation technology and the poor
•• Telephones annual growth, 1990Telephones annual growth, 1990––2003 2003 •• South Asia: South Asia: 22 %22 %•• Sub Saharan Africa: Sub Saharan Africa: 17%17%
but access remains too low: but access remains too low: 6%6% in 2003in 2003
•• Net value for the rural poor of a phone call Net value for the rural poor of a phone call •• Peru: Peru: US$ 1.62US$ 1.62•• Bangladesh: Bangladesh: US$ 1.19US$ 1.19
Source: Torero and von Braun 2005

Joachim von Braun, IFPRI, September 2006
33--Climate changeClimate change
•• Changed perception and concern Changed perception and concern •• Large impact on the poorLarge impact on the poor•• Need for an ecosystem Need for an ecosystem
perspectiveperspective

Joachim von Braun, IFPRI, September 2006
Climate and water??Climate and water??Regional per capita availability of waterRegional per capita availability of water
0
2
4
6
8
10
12
14
16
1960 1990 2025
Africa
WorldAsia
MENA
‘000 m3
Source: Serageldin 2005

Joachim von Braun, IFPRI, September 2006
BiofuelsBiofuels: potential benefits & risks: potential benefits & risks
opportunities:opportunities:
Alternative energy sourceAlternative energy sourcePotential Potential reduction of greenhouse gasesreduction of greenhouse gasesOpportunity for new income sources for Opportunity for new income sources for farmers farmers
risks:diversion of land and water away from food diversion of land and water away from food and feed?and feed?higher food prices?higher food prices?Environmental impacts?Environmental impacts?

Joachim von Braun, IFPRI, September 2006
World food and energy prices, 1995–2005
Source: World Economic Outlook, IMF, April 2006
0
50
100
150
200
250
300
350
1995 1996 1997 1998 1999 2000 2001 2002 2003 2004 2005
SugarCrude oilMaizeRiceWheat
Price indices 1995= 100

Joachim von Braun, IFPRI, September 2006
Agriculture as a producer of energy Agriculture as a producer of energy has become competitivehas become competitiveNet cost of BioNet cost of Bio--ethanol production (US cents/liter)ethanol production (US cents/liter)
Source: Henniges 2005 and European Commission 2005
55
16
3026
0
10
20
30
40
50
60
Brazil (cane) Thailand (cassava) United States(maize)
EU (wheat) largeplant
US cents / liter

Joachim von Braun, IFPRI, September 2006
44--And what about agriculture and growth?And what about agriculture and growth?
•• Driven by markets, technology, Driven by markets, technology, infrastructure, institutions / governanceinfrastructure, institutions / governance
•• Re Re WTOsWTOs agriculture trade policyagriculture trade policy•• African growthAfrican growth•• DistributionsDistributions•• Link to hungerLink to hunger

Joachim von Braun, IFPRI, September 2006
WTO Doha negotiations: Potential WTO Doha negotiations: Potential scenariosscenarios
Developed countries
Middle income
countries
Low-income
countriesInitial share in real world income 80 18.7 1.2
Basic scenarioReal income gain (billions of US$) 32 21.7 1
Share of real income gain (%) 58.5 39.6 1.9Free LDC access to OECD
Real income gain (billions of US$) 38.9 23 7
Share of real income gain (%) 56.4 33.4 10.2
Source: Bouët 2006

Joachim von Braun, IFPRI, September 2006
SubSub--Sahara African agriculture growth needed for Sahara African agriculture growth needed for economy wide growth and poverty reductioneconomy wide growth and poverty reduction
Data source: World Bank 2006
Five year average of annual growth rates (in %)
GDPGDP 1980-84 85-89 90-94 95-99 2000-04
Agriculture 0.1 4.5 1.1 4.5 3.5
Total GDP 1.7 2.6 0.6 3.5 3.8
Correlation between Ag and total GDP growth
remains strong

Joachim von Braun, IFPRI, September 2006
Pro-Poor? in some countries growth has been accompanied by increased poverty…
Out of Out of 3030 developing countries developing countries (recent world wide (recent world wide data)data),,
in in 1212 increased poverty with growth (e.g. increased poverty with growth (e.g. Peru, Uganda, Pakistan)Peru, Uganda, Pakistan)
In In 1818 reduced poverty with growthreduced poverty with growth
Implications for rural growth strategiesImplications for rural growth strategies

Joachim von Braun, IFPRI, September 2006
Growth matters: hunger - income linkage
Source: von Braun, regressions based on data from World Bank (2005) and FAO (2005)
Hunger and GDP/ capita in developing countries
0
10
20
30
40
50
0 1000 2000 3000 4000 5000 6000GDP per Capita (in constant 2000 US$)
Undernourishment (% of pop)
Log. (1990-1992)Log. (2001-03)Log. (1995-1997)

Joachim von Braun, IFPRI, September 2006
1. Ag. growth works in combination with infrastructure, market access, and innovation
2. Agriculture-to-rural growth linkages remain strong (high value agriculture)
3. Food and nutrition security has key links to agriculture (availability of healthy diets)
Traditional but relevant concepts

Joachim von Braun, IFPRI, September 2006
OverviewOverview
1. Big drivers of the food, health and agriculture situation
2. Agriculture and food/health related development concepts and complexities
3. Getting jointly to priorities for research and development actions

Joachim von Braun, IFPRI, September 2006
Newly understood Newly understood complicationscomplications in food, in food, health and agriculture health and agriculture
1.1. Around Poverty:Around Poverty: pathways, pathways, transformations, traps and transformations, traps and thresholdsthresholds
2.2. Around Risks and UncertaintiesAround Risks and Uncertainties: : combined risks, the long run, combined risks, the long run, scenariosscenarios

Joachim von Braun, IFPRI, September 2006
Re 1: Pathways and dynamics of Re 1: Pathways and dynamics of transformations transformations
Pathways from poverty: Pathways from poverty: •• Institutional rigidities Institutional rigidities
(communities, and assets)(communities, and assets)•• Transformation of small farm Transformation of small farm
agricultureagriculture

Joachim von Braun, IFPRI, September 2006
What future for the small farms?What future for the small farms?““grow, or part time, or move outgrow, or part time, or move out””
Farm Size (ha)Farm Size (ha) % of all farms% of all farms Number of farms Number of farms (millions)(millions)
< 2< 2 8585 387387
2 2 -- 1010 1212 5454
10 10 -- 100100 33 12.512.5
> 100> 100 0.50.5 22
TotalTotal 100100 456456
The numbers still increase in Africa and diminish very slowly inThe numbers still increase in Africa and diminish very slowly in Asia;Asia;Labor markets, food markets, and technology will determine the cLabor markets, food markets, and technology will determine the course of transformationourse of transformation
Source: von Braun 2003

Joachim von Braun, IFPRI, September 2006
Big Picture on global Big Picture on global employment:employment: farm, farm, services, and industry 2005 services, and industry 2005 –– 2020 (Billions)2020 (Billions)
Farm Farm SISI--Rural Rural AreasAreas
SISI--UrbanUrbanAreasAreas
TotalTotal
20052005 0.90.9 0.60.6 1.51.5 33
20202020 0.60.6 1.01.0 1.91.9 3.53.5
Change Change 20052005--20202020
-- 0.30.3 +0.4+0.4 +0.4+0.4 +0.5+0.5
SI refers to services and industrySource: von Braun based on Tarantino 2005, UN World Population Prospects and ILO 2005

Joachim von Braun, IFPRI, September 2006
Poverty traps and thresholds Poverty traps and thresholds Conceptualization Conceptualization
Poverty traps exist when certain people are excluded from opportunities
Linkages +/- (e.g. agriculture to health) need to be better understood & managed
Source: more see Barrett, 2005

Joachim von Braun, IFPRI, September 2006
Example of a trap: Example of a trap: Early Childhood nutrition trap (mostly in rural areas)
-2
-1.75
-1.5
-1.25
-1
-0.75
-0.5
-0.25
0
0.25
0.5
0 3 6 9 12 15 18 21 24 27 30 33 36 39 42 45 48 51 54 57 60
Age (months)
Wei
ght f
or a
ge Z
-sco
re (N
CH
S
Africa Latin America and Caribbean Asia
Source: Shrimpton et al. 2001

Joachim von Braun, IFPRI, September 2006
Linkages & externalities: value chain linkages Linkages & externalities: value chain linkages (e.g. agriculture, food & health) (e.g. agriculture, food & health)
AGRICULTURAL SUPPLY CHAIN
INTERMEDIARY PROCESSES
POL
ICY
AN
D P
OL
ICY
PR
OC
ESS
/GO
VE
RN
AN
CE
HEALTH OUTCOMES
Producers
Agricultural
system
Agricultural
outputs
Occupa-tional health
Water- vector-born
diseases
Nutrition
Food-borne
illnesses
HIV/AIDS
Labor Environmental Income Access
Livestock-
related illnesses
Expanding the value chain concept
Joachim von Braun, IFPRI, September 2006
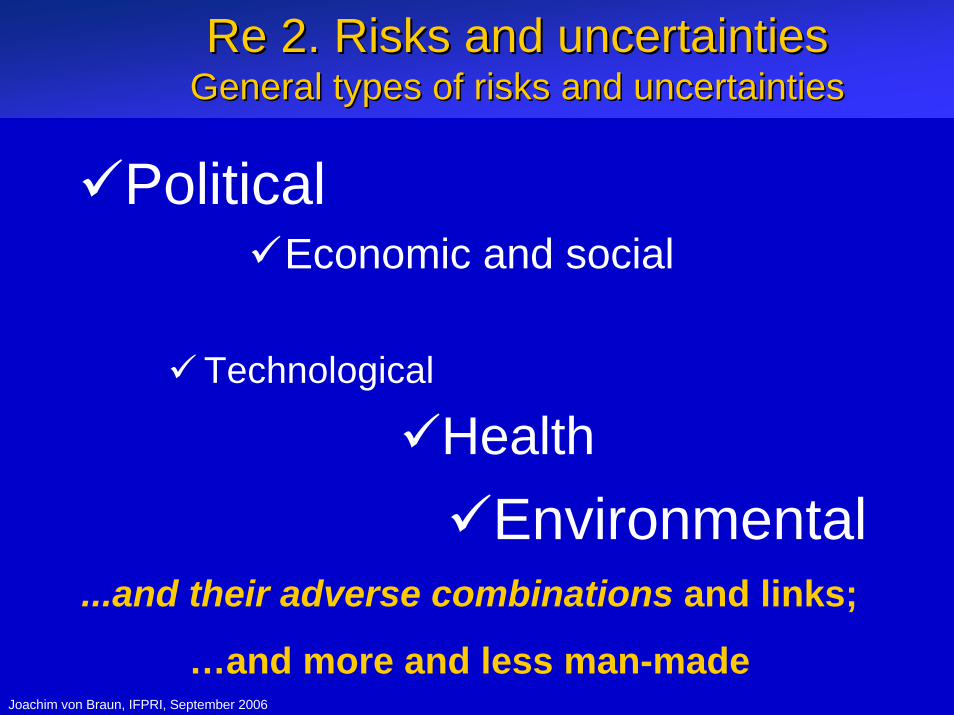
Re 2. Risks and uncertaintiesRe 2. Risks and uncertaintiesGeneral types of risks and uncertaintiesGeneral types of risks and uncertainties
Economic and socialPolitical
Environmental...and their adverse combinations and links;
…and more and less man-made
HealthTechnological

Joachim von Braun, IFPRI, September 2006
Inclusion of Inclusion of governancegovernance issues in risk and issues in risk and opportunitiesopportunities’’ assessmentsassessments
Political stability and control Political stability and control of corruptionof corruptionRule of lawVoice and accountabilityRegulatory qualityGovernment effectiveness
Governance is key: Essential elements at the Governance is key: Essential elements at the national levelnational level

Joachim von Braun, IFPRI, September 2006
Government effectiveness mapGovernment effectiveness map
Green: Best quartile (over 75th percentile), with top 10th colored in darker green
Yellow: second best quartile (over 50th)Orange: third quartile (over 25th) Red: fourth quartile, with bottom 10th in darker red.
Source: Kaufmann et al., 2005

Joachim von Braun, IFPRI, September 2006
Poor people themselves cope with risk Poor people themselves cope with risk and uncertaintyand uncertainty
DiversificationDiversificationInnovationInnovationNetworksNetworksMigrationMigrationSavingsSavings
and should be supported in these autonomous and should be supported in these autonomous strategies with strategies with innovation, market access, innovation, market access, social protectionsocial protection

Joachim von Braun, IFPRI, September 2006
So, what to do about these complications in So, what to do about these complications in policy research and advise?policy research and advise?
Two ways forward:Two ways forward:
1.1. Apply a framework for risks and Apply a framework for risks and uncertaintyuncertainty
2.2. Apply better (more transparent) scenario Apply better (more transparent) scenario buildingbuilding
and combine the twoand combine the two

Joachim von Braun, IFPRI, September 2006
Low SeverityLow Likelihood
High SeverityHigh Likelihood
High SeverityLow Likelihood
Low SeverityHigh Likelihood
Mass migration away from
smallholder farming
Oil price shocks
Re 1.Framework: severity & likelihood Re 1.Framework: severity & likelihood of risksof risks
Likelihood
Severity
Avian Flu –end of
globalization
Source: adapted from World Economic Forum 2006

Joachim von Braun, IFPRI, September 2006
Re 2.Combining Risks and Opportunities: Scenarios of IMPACT Model
Progressive Policy Actions Scenario: New Focus on Agricultural Growth and Rural Development
Policy Failure Scenario:Trade and Political Conflict, rise in protectionism worldwide
Technology and Resource Management Failure Scenario:
Adverse technology/natural resource interactions

Joachim von Braun, IFPRI, September 2006
Percentage of malnourished children
10
15
20
25
30
35
1997 2015 2030 2050
Progressive Policy ActionsPolicy FailureTechnology and Resource Management Failure
Source: von Braun 2003

Joachim von Braun, IFPRI, September 2006
OverviewOverview
1. Big drivers of the food, health and agriculture situation
2. Agriculture and food/health related development concepts and complexities
3. Getting jointly to priorities for research and development actions
Joachim von Braun, IFPRI, September 2006
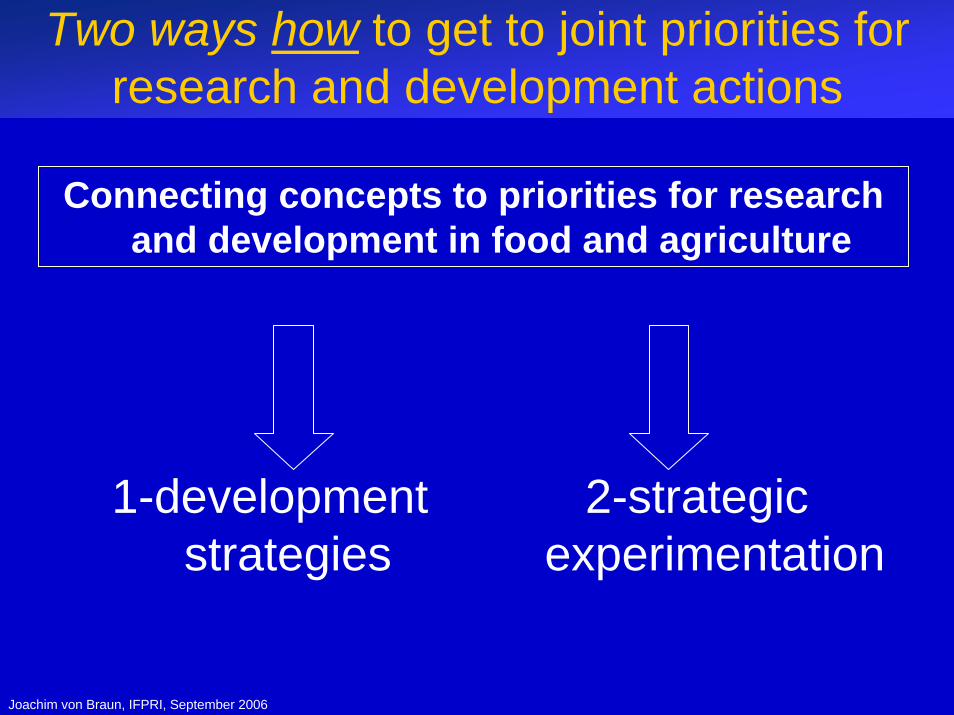
Two ways how to get to joint priorities for research and development actions
1-developmentstrategies
2-strategic experimentation
Connecting concepts to priorities for research and development in food and agriculture

Joachim von Braun, IFPRI, September 2006
Re 1Re 1--Development strategy: macro frameworkDevelopment strategy: macro framework
Building a Strategic Analysis and Knowledge System (SAKSS) to inBuilding a Strategic Analysis and Knowledge System (SAKSS) to inform form the design and implementation of rural development strategiesthe design and implementation of rural development strategies
Source: IFPRI 2005

Joachim von Braun, IFPRI, September 2006
An agriculture and rural growth strategy? An agriculture and rural growth strategy?
•• Not Not ““one fits allone fits all””•• Each country is differentEach country is different•• Typologies may help Typologies may help •• Complex political processes Complex political processes •• LongLong--term institutional cooperation term institutional cooperation
neededneeded

Joachim von Braun, IFPRI, September 2006
Example: Ethiopia SAKSSExample: Ethiopia SAKSS
•development domains•water harvesting•access to markets and space
•smallholder commercialization•ag/non-ag linkages•price stabilization•public investment
Source: IFPRI 2005

Joachim von Braun, IFPRI, September 2006
Re 2Re 2-- strategic experiments strategic experiments –– the how tothe how to
A new basis for cooperation of A new basis for cooperation of research with development research with development policy on key agriculture & food policy on key agriculture & food action areasaction areas
Toward Toward ““experimentalismexperimentalism””1.1. Classical (a la China, Classical (a la China, Du Du RunshengRunsheng))2.2. Randomized (a la Randomized (a la ProgressaProgressa) )

Joachim von Braun, IFPRI, September 2006
Experiments & evaluation design: Experiments & evaluation design: new standardsnew standards
Good quantitative evaluation design requires the Good quantitative evaluation design requires the use of data collected:use of data collected:• Before and after the intervention is implementedAnd• From both beneficiaries and non-beneficiaries (those
“with” and “without” the intervention
PrePre--program/treatment and control groups program/treatment and control groups have to be as alike as possiblehave to be as alike as possible

Joachim von Braun, IFPRI, September 2006
Innovations through strategic experimentsInnovations through strategic experiments
Some examples for experiments: Some examples for experiments: institutional and technical changes in institutional and technical changes in
food and agriculturefood and agriculture
Breeding programsBreeding programsCrop insuranceCrop insuranceExtension systemsExtension systemsCredit (microCredit (micro--finance)finance)Employment programsEmployment programsHealth and nutrition interventionsHealth and nutrition interventions
Joachim von Braun, IFPRI, September 2006
Summing up: research for and with Summing up: research for and with developmentdevelopment
Influencing the Influencing the ““driversdrivers””through through
attention to attention to action areas,action areas,informed by the sets of informed by the sets of
concepts: concepts: 1.Dev. strategy work 1.Dev. strategy work
andand2. Experimenting2. Experimenting

Joachim von Braun, IFPRI, September 2006
Summing up: Linking the concepts to changing drivers and actions
Drivers - >• Demographics
• Consumer & corporate driven agri-food system
• Ag. Science & technology
• Energy and climate
• Disease (human, & animal)
• Growth and distributions
<- Concepts ->•• Growth linkagesGrowth linkages•• Poverty Poverty
pathways, traps, pathways, traps, thresholds; thresholds;
•• Risks and Risks and uncertaintiesuncertainties
\\ how?/how?/\\ …… //
1.Dev. strategy work 1.Dev. strategy work andand
2. Experimenting2. Experimenting
->Action areas• Macro policy and
governance
• Agricultural growth promotion
• Rural infrastructure & employment
• Targeted programs
• Insurance and social protection