Emerging Markets Review | First Quarter 2020 April 16, 202010 Years. 1. Since Inception. 1, 2. HL...
22
Fundamental. Thinking. Worldwide. Emerging Markets Review | First Quarter 2020
Transcript of Emerging Markets Review | First Quarter 2020 April 16, 202010 Years. 1. Since Inception. 1, 2. HL...

Fundamental. Thinking. Worldwide.
Emerging Markets Review | First Quarter 2020

HARDING LOEVNER 2
Composite Performance SummaryAs of March 31, 2020
1Annualized Returns; 2Inception date November 30, 1998; 3The Benchmark Index; 4Gross of withholding taxes. The performance returns shown are preliminary.The Emerging Markets Composite contains fully discretionary, fee-paying accounts investing in US and non-US equity and equity-equivalent securities and cash reserves, and is measuredagainst the MSCI Emerging Markets Index (Gross) for comparison purposes. Harding Loevner LP is an investment adviser registered with the Securities and Exchange Commission. HardingLoevner is an affiliate of Affiliated Managers Group, Inc. (NYSE: AMG), an investment holding company with stakes in a diverse group of boutique firms. Harding Loevner claims compliance withthe Global Investment Performance Standards (GIPS®). Harding Loevner has been independently verified for the period December 1, 1989 through December 31, 2019. Verification assesseswhether (1) the firm has complied with all composite construction requirements of the GIPS standards on a firm-wide basis and (2) the firm’s policy and procedures are designed to calculateand present performance in compliance with GIPS standards. The Emerging Markets Composite has been examined for the periods November 30, 1998 through December 31, 2019. Theverification and performance examination reports are available upon request. Performance data quoted represents past performance; past performance does not guarantee future results.Returns are presented both gross and net of management fees and include the reinvestment of all income. Net returns are calculated using actual fees. The US dollar is the currency used toexpress performance. For complete information on the construction and historical record of the Emerging Markets Composite, please contact Harding Loevner at (908) 218-7900 or visitwww.hardingloevner.com. The firm maintains a complete list and description of composites, which is available upon request.Please read the disclosures on the last page, which are an integral part of this presentation.
3 Months 1 Year 3 Years1 5 Years1 10 Years1 Since Inception1, 2
HL Emerging Markets Equity (gross) -27.17 -19.02 -2.17 0.70 3.25 10.89
HL Emerging Markets Equity (net) -27.34 -19.76 -3.04 -0.18 2.33 9.99
MSCI Emerging Markets Index3,4 -23.57 -17.36 -1.25 0.01 1.04 7.71
Up/Down Capture (trailing five years, annualized): 99/97
Performance (% Total Return)
HARDING LOEVNER 3
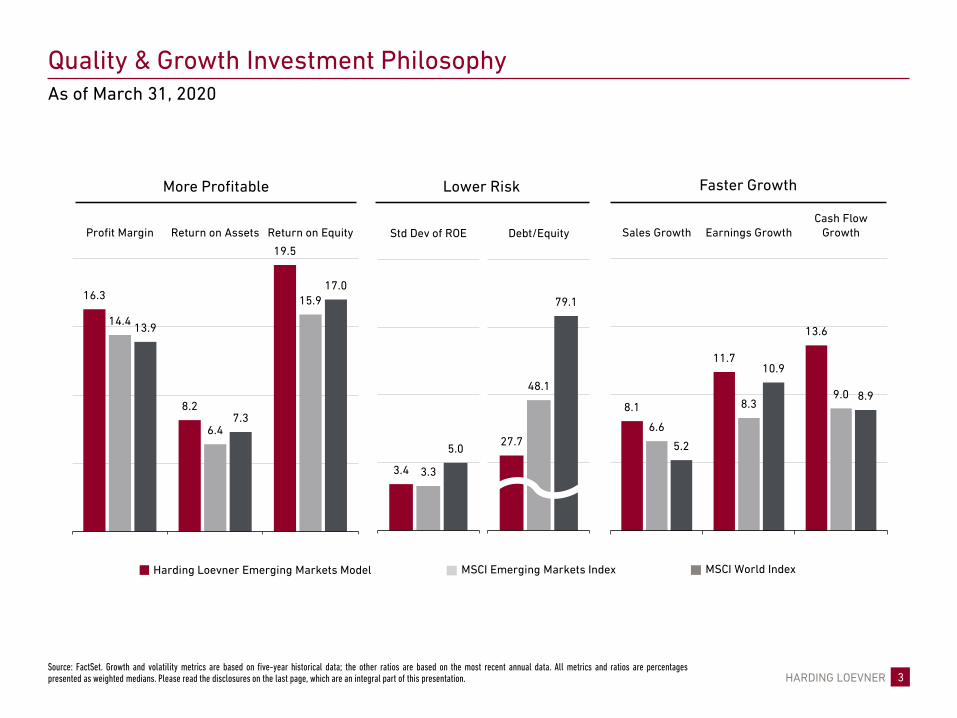
Quality & Growth Investment PhilosophyAs of March 31, 2020
Source: FactSet. Growth and volatility metrics are based on five-year historical data; the other ratios are based on the most recent annual data. All metrics and ratios are percentagespresented as weighted medians. Please read the disclosures on the last page, which are an integral part of this presentation.
27.7
48.1
79.1
Debt/Equity
3.4 3.3
5.0
Std Dev of ROE
8.1
11.7
13.6
6.6
8.39.0
5.2
10.9
8.9
Sales Growth Earnings GrowthCash Flow
Growth
16.3
8.2
19.5
14.4
6.4
15.9
13.9
7.3
17.0
Profit Margin Return on Assets Return on Equity
Faster GrowthMore Profitable Lower Risk
Harding Loevner Emerging Markets Model MSCI Emerging Markets Index MSCI World Index
HARDING LOEVNER 4
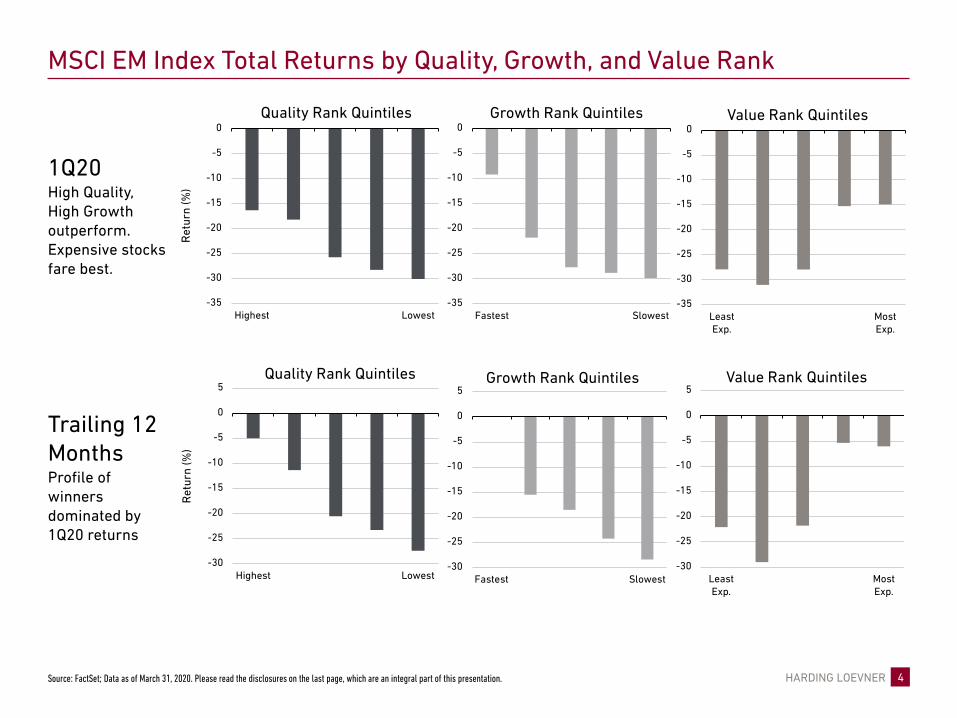
MSCI EM Index Total Returns by Quality, Growth, and Value Rank
Source: FactSet; Data as of March 31, 2020. Please read the disclosures on the last page, which are an integral part of this presentation.
1Q20High Quality, High Growth outperform. Expensive stocks fare best.
Trailing 12 MonthsProfile of winners dominated by 1Q20 returns
-35
-30
-25
-20
-15
-10
-5
0
Highest Lowest
Ret
urn
(%)
Quality Rank Quintiles
-35
-30
-25
-20
-15
-10
-5
0
Fastest Slowest
Growth Rank Quintiles
-35
-30
-25
-20
-15
-10
-5
0
LeastExp.
MostExp.
Value Rank Quintiles
-30
-25
-20
-15
-10
-5
0
5
Fastest Slowest
Growth Rank Quintiles
-30
-25
-20
-15
-10
-5
0
5
Highest Lowest
Ret
urn
(%)
Quality Rank Quintiles
-30
-25
-20
-15
-10
-5
0
5
LeastExp.
MostExp.
Value Rank Quintiles

HARDING LOEVNER 5
Currency Returns
Source: Bloomberg Data as of March 31, 2020
-40%
-30%
-20%
-10%
0%
10%
20%
1Q20 Currency Returns for Periods Ended March 31, 2020
2019 1Q20
HARDING LOEVNER 6
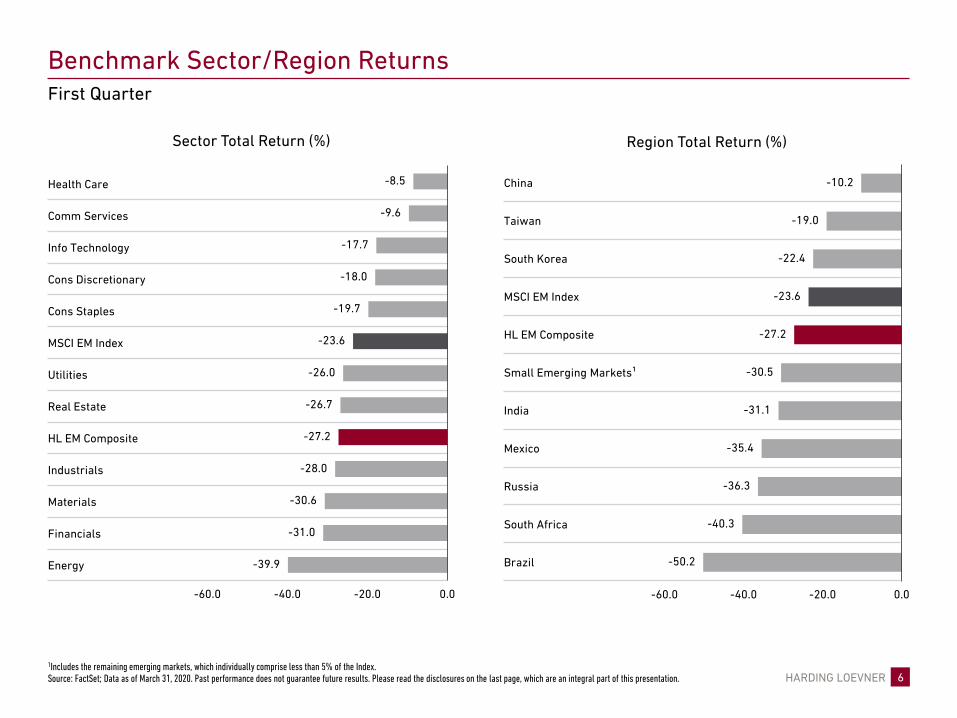
China
Taiwan
South Korea
MSCI EM Index
HL EM Composite
Small Emerging Markets¹
India
Mexico
Russia
South Africa
Brazil
Health Care
Comm Services
Info Technology
Cons Discretionary
Cons Staples
MSCI EM Index
Utilities
Real Estate
HL EM Composite
Industrials
Materials
Financials
Energy -50.2
-40.3
-36.3
-35.4
-31.1
-30.5
-27.2
-23.6
-22.4
-19.0
-10.2
-60.0 -40.0 -20.0 0.0
-39.9
-31.0
-30.6
-28.0
-27.2
-26.7
-26.0
-23.6
-19.7
-18.0
-17.7
-9.6
-8.5
-60.0 -40.0 -20.0 0.0
Benchmark Sector/Region ReturnsFirst Quarter
1Includes the remaining emerging markets, which individually comprise less than 5% of the Index.Source: FactSet; Data as of March 31, 2020. Past performance does not guarantee future results. Please read the disclosures on the last page, which are an integral part of this presentation.
Sector Total Return (%) Region Total Return (%)
HARDING LOEVNER 7
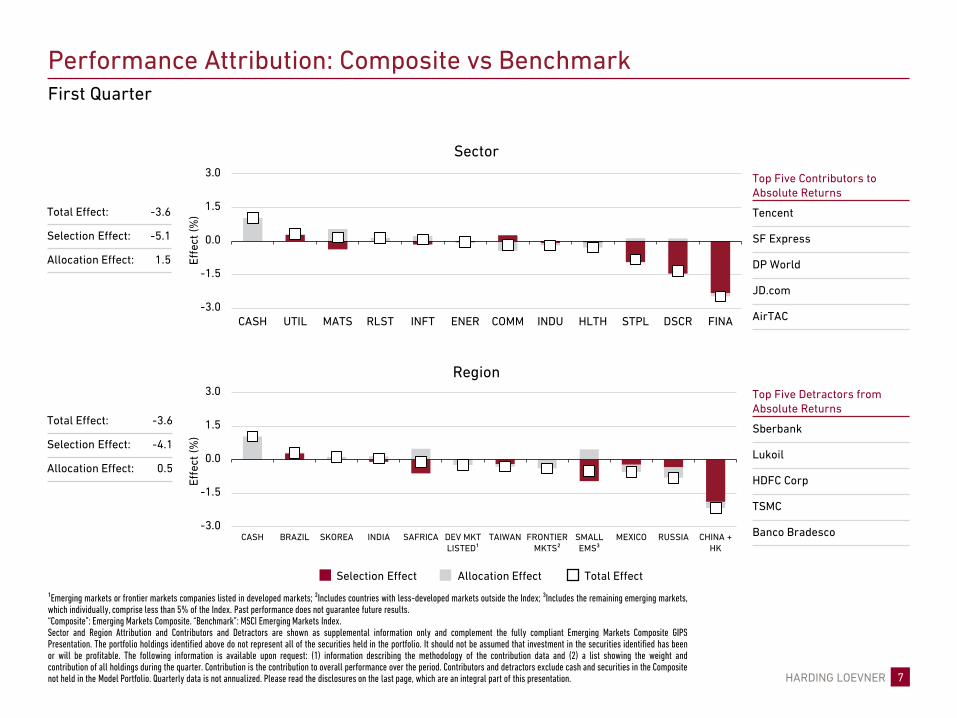
Performance Attribution: Composite vs BenchmarkFirst Quarter
¹Emerging markets or frontier markets companies listed in developed markets; ²Includes countries with less-developed markets outside the Index; ³Includes the remaining emerging markets,which individually, comprise less than 5% of the Index. Past performance does not guarantee future results.“Composite”: Emerging Markets Composite. “Benchmark”: MSCI Emerging Markets Index.Sector and Region Attribution and Contributors and Detractors are shown as supplemental information only and complement the fully compliant Emerging Markets Composite GIPSPresentation. The portfolio holdings identified above do not represent all of the securities held in the portfolio. It should not be assumed that investment in the securities identified has beenor will be profitable. The following information is available upon request: (1) information describing the methodology of the contribution data and (2) a list showing the weight andcontribution of all holdings during the quarter. Contribution is the contribution to overall performance over the period. Contributors and detractors exclude cash and securities in the Compositenot held in the Model Portfolio. Quarterly data is not annualized. Please read the disclosures on the last page, which are an integral part of this presentation.
-3.0
-1.5
0.0
1.5
3.0
CASH UTIL MATS RLST INFT ENER COMM INDU HLTH STPL DSCR FINA
Sector
Effe
ct (%
)Top Five Contributors to Absolute Returns
Tencent
SF Express
DP World
JD.com
AirTAC
Top Five Detractors from Absolute Returns
Sberbank
Lukoil
HDFC Corp
TSMC
Banco Bradesco
Effe
ct (%
)
Region
Total Effect: -3.6
Selection Effect: -5.1
Allocation Effect: 1.5
Total Effect: -3.6
Selection Effect: -4.1
Allocation Effect: 0.5
-3.0
-1.5
0.0
1.5
3.0
CASH BRAZIL SKOREA INDIA SAFRICA DEV MKTLISTED¹
TAIWAN FRONTIERMKTS²
SMALLEMS³
MEXICO RUSSIA CHINA +HK
Selection Effect Allocation Effect Total Effect
HARDING LOEVNER 8
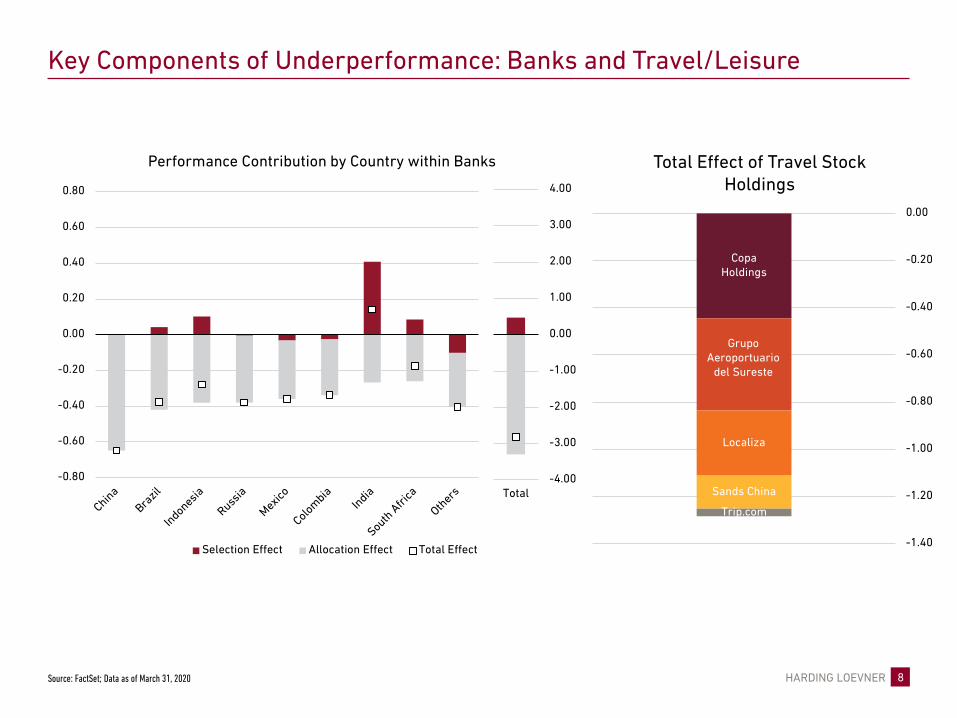
Key Components of Underperformance: Banks and Travel/Leisure
Source: FactSet; Data as of March 31, 2020
-0.80
-0.60
-0.40
-0.20
0.00
0.20
0.40
0.60
0.80
Performance Contribution by Country within Banks
Selection Effect Allocation Effect Total Effect
-4.00
-3.00
-2.00
-1.00
0.00
1.00
2.00
3.00
4.00
Total
Copa Holdings
Grupo Aeroportuario
del Sureste
Localiza
Sands China
Trip.com
-1.40
-1.20
-1.00
-0.80
-0.60
-0.40
-0.20
0.00
Total Effect of Travel Stock Holdings

HARDING LOEVNER 9
Characteristics of HL EM Bank Holdings
Source: FactSet; Data as of March 31, 2020
0%
10%
20%
30%HL EM Bank Holdings - Tier 1 Capital Ratios
2008 2019
0.0%
1.0%
2.0%
3.0%HL EM Bank Holdings - Return on Assets
2019

HARDING LOEVNER 10
Valuations in 1Q20 Fall from 12 Month Highs down to GFC Levels
Source: FactSet; Data as of March 31, 2020
0.00
1.00
2.00
3.00
4.00
5.00
6.00
HL EM Banks - Current Valuations compared with GFC Lows (Price-to-Book)
GFC Low P/B Last 12M High 1Q20 Low

HARDING LOEVNER 11
Completed Portfolio Transactions
The portfolio is actively managed therefore holdings shown may not be current. The portfolio holdings identified above do not represent all of the securities held in the portfolio. It should notbe assumed that investment in the securities identified has been or will be profitable. To request a complete list of portfolio holdings for the past year, contact Harding Loevner. Holdings areshown as supplemental information only and complement the fully compliant Emerging Markets Composite GIPS Presentation. Please read the disclosures on the last page, which are anintegral part of this presentation.
Company Country Sector
Fuyao Glass Industry China Cons Discretionary
ZTO Express China Industrials
HDFC Bank India Financials
Lojas Renner Brazil Cons Discretionary
Positions Established Positions Sold
Portfolio Turnover (5 year annualized average): 18.5%
Company Country Sector
JD.com China Cons Discretionary
Sasol South Africa Materials
Weibo China Comm Services
First Quarter
HARDING LOEVNER 12
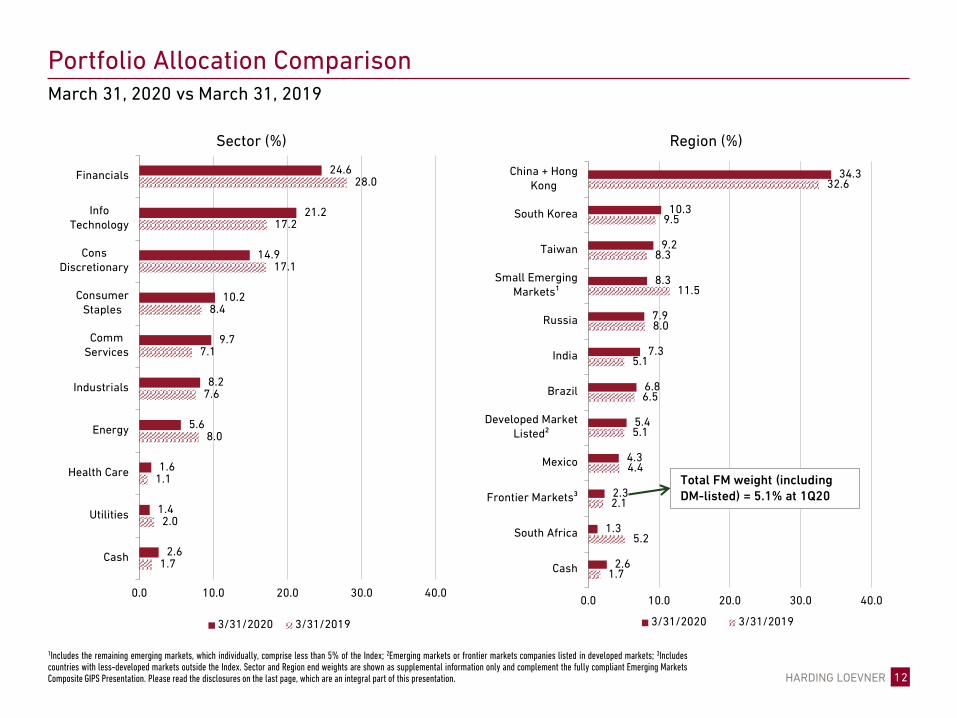
1.7
2.0
1.1
8.0
7.6
7.1
8.4
17.1
17.2
28.0
2.6
1.4
1.6
5.6
8.2
9.7
10.2
14.9
21.2
24.6
0.0 10.0 20.0 30.0 40.0
Cash
Utilities
Health Care
Energy
Industrials
CommServices
ConsumerStaples
ConsDiscretionary
InfoTechnology
Financials
3/31/2020 3/31/2019
Sector (%)
1.7
5.2
2.1
4.4
5.1
6.5
5.1
8.0
11.5
8.3
9.5
32.6
2.6
1.3
2.3
4.3
5.4
6.8
7.3
7.9
8.3
9.2
10.3
34.3
0.0 10.0 20.0 30.0 40.0
Cash
South Africa
Frontier Markets³
Mexico
Developed MarketListed²
Brazil
India
Russia
Small EmergingMarkets¹
Taiwan
South Korea
China + HongKong
3/31/2020 3/31/2019
March 31, 2020 vs March 31, 2019
1Includes the remaining emerging markets, which individually, comprise less than 5% of the Index; 2Emerging markets or frontier markets companies listed in developed markets; 3Includescountries with less-developed markets outside the Index. Sector and Region end weights are shown as supplemental information only and complement the fully compliant Emerging MarketsComposite GIPS Presentation. Please read the disclosures on the last page, which are an integral part of this presentation.
Region (%)
Portfolio Allocation Comparison
Total FM weight (includingDM-listed) = 5.1% at 1Q20

HARDING LOEVNER 13
Company Country Sector Wt (%)
LG Household & Health Care South Korea Cons Staples 2.6
EPAM US Info Technology 2.6
Lukoil Russia Energy 2.3
HDFC Corp India Financials 2.3
Sberbank Russia Financials 2.1
Geography HL % EM % (Under) / Over
Dev Market Listed¹ 5.4 —
Russia 7.9 3.3
Cash 2.6 —
Mexico 4.3 1.9
Frontier Markets² 2.3 —
Brazil 6.8 4.9
India 7.3 7.7
South Korea 10.3 11.8
South Africa 1.3 3.7
Taiwan 9.2 12.3
Small Ems³ 8.3 13.7
China + Hong Kong⁴ 34.3 40.7
Portfolio ExposuresAs of March 31, 2020
1Emerging markets or frontier markets companies listed in developed markets; 2Includes countries with less-developed markets outside the Index; 3Includes the remaining emerging markets,which individually comprise less than 5% of the Index; 4The Harding Loevner Emerging Markets Model portfolio’s end weight in China at March 31, 2020 is 27.2% and Hong Kong is 7.2%. TheBenchmark does not include Hong Kong. Source: Harding Loevner Emerging Markets Model; MSCI Inc. and S&P. Sector and Region end weights, holdings, and active share are shown assupplemental information only and complement the fully compliant Emerging Markets Composite GIPS Presentation. Please read the disclosures on the last page, which are an integral part ofthis presentation.
Sector HL % EM % (Under) / Over
Info Technology 21.2 16.9
Cons Staples 10.2 6.6
Industrials 8.2 4.9
Financials 24.6 21.6
Cash 2.6 —
Energy 5.6 5.9
Cons Discretionary 14.9 15.4
Utilities 1.4 2.5
Health Care 1.6 3.5
Real Estate 0.0 2.9
Comm Services 9.7 13.1
Materials 0.0 6.7
Company Country Sector Wt (%)
TSMC Taiwan Info Technology 5.8
Samsung Electronics South Korea Info Technology 5.6
Tencent China Comm Services 5.4
Alibaba China Cons Discretionary 5.1
AIA Group Hong Kong Financials 3.1
Ten Largest Holdings – Total Weight: 36.9%
69% Active Share
(10.0) (5.0) 0.0 5.0 10.0 (10.0) (5.0) 0.0 5.0 10.0
HARDING LOEVNER 14
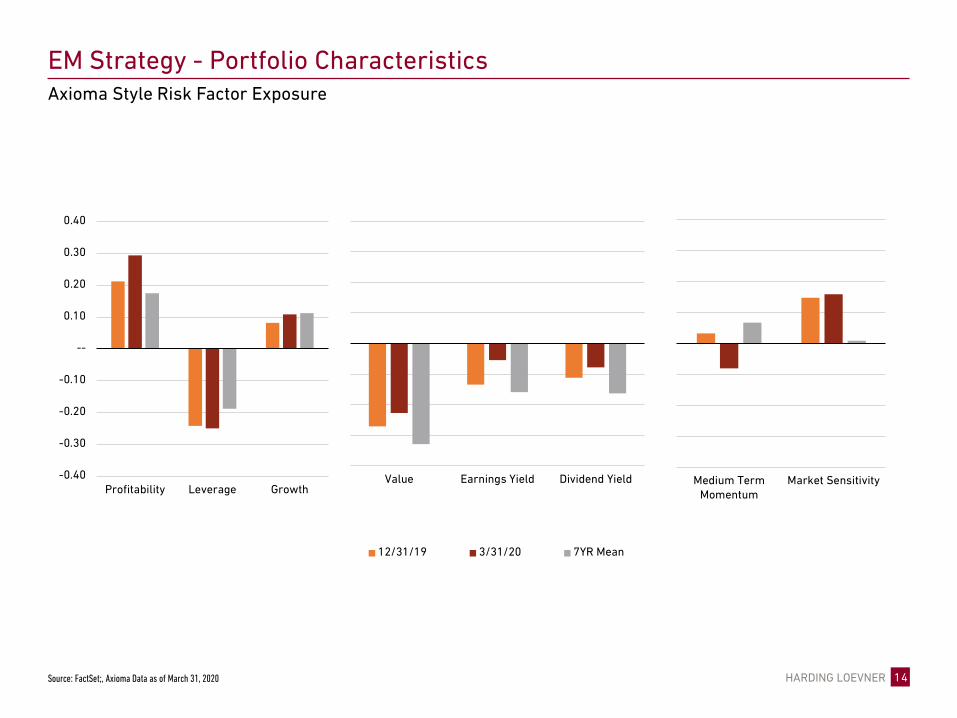
EM Strategy - Portfolio CharacteristicsAxioma Style Risk Factor Exposure
Source: FactSet;, Axioma Data as of March 31, 2020
-0.40
-0.30
-0.20
-0.10
--
0.10
0.20
0.30
0.40
Profitability Leverage GrowthValue Earnings Yield Dividend Yield
12/31/19 3/31/20 7YR Mean
Medium TermMomentum
Market Sensitivity

HARDING LOEVNER 15
Harding Loevner ProfileAs of March 31, 2020
Data as of March 31, 2020. Total AUM includes all the assets under management and is presented as supplemental information. Please read the disclosures on the last page, which are an integral part of this presentation.
43 investment professionals Emerging Markets portfolio management team averages 14 years at Harding Loevner
Total Assets$57B
Strategy Assets Firm Assets
Global $14.3B 25%
International (non-US) $28.5B 50%
Emerging Markets $14.0B 24%
Frontier Emerging Markets $0.2B <1%
Global Small Companies <$0.1B <1%
International Small Companies $0.4B 1%
Research Portfolios <$0.1B <1%

HARDING LOEVNER 16
Appendix

HARDING LOEVNER 17
Fiscal and Monetary Measures Taken by Major EM CountriesAs of April 9, 2020
Fiscal
Monetary
China Brazil India Russia Indonesia Korea Mexico South Africa
Tax Relief x x x x x x x
Temporary Income to Vulnerable Households x x x x x
Improvements to Existing Health Infrastructure x x x x x
Support to the Tourism Sector x x
Unemployment Benefits x x x x
Reduced Duties on Certain Imported Goods x x
Expanding Credit Lines for Businesses and Households x
Increased Benefits for Front-Line Workers x x
Sick Leave Benefits x
China Brazil India Russia Indonesia Korea Mexico South AfricaLower Policy Rates x x x x x x x
Decrease bank reserve requirements x x x x x
Relaxing loan repayment requirements for SMEs and households x x x x x x
Corporate bond issuance x x x

HARDING LOEVNER 18
EM Country Valuations (Price/Book) Relative to Long Term Averages
Source: FactSet; Data as of March 31, 2020
-2.00
-1.50
-1.00
-0.50
0.00
0.50
1.00
1.50
2.00
1Q20 - 10YR Mean 1Q20 - 3YR Mean
HARDING LOEVNER 19
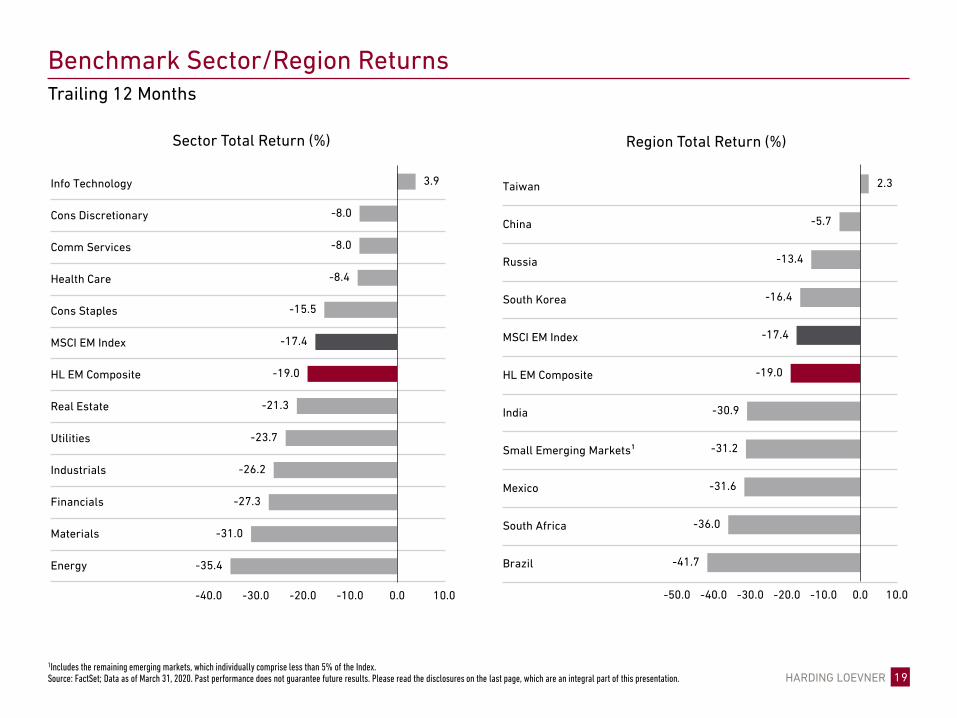
Taiwan
China
Russia
South Korea
MSCI EM Index
HL EM Composite
India
Small Emerging Markets¹
Mexico
South Africa
Brazil
Info Technology
Cons Discretionary
Comm Services
Health Care
Cons Staples
MSCI EM Index
HL EM Composite
Real Estate
Utilities
Industrials
Financials
Materials
Energy -41.7
-36.0
-31.6
-31.2
-30.9
-19.0
-17.4
-16.4
-13.4
-5.7
2.3
-50.0 -40.0 -30.0 -20.0 -10.0 0.0 10.0
-35.4
-31.0
-27.3
-26.2
-23.7
-21.3
-19.0
-17.4
-15.5
-8.4
-8.0
-8.0
3.9
-40.0 -30.0 -20.0 -10.0 0.0 10.0
Benchmark Sector/Region ReturnsTrailing 12 Months
1Includes the remaining emerging markets, which individually comprise less than 5% of the Index.Source: FactSet; Data as of March 31, 2020. Past performance does not guarantee future results. Please read the disclosures on the last page, which are an integral part of this presentation.
Sector Total Return (%) Region Total Return (%)

HARDING LOEVNER 20
Performance Attribution: Composite vs BenchmarkTrailing 12 Months
¹Includes the remaining emerging markets, which individually, comprise less than 5% of the Index; ²Includes countries with less-developed markets outside the Index; ³Emerging markets orfrontier markets companies listed in developed markets. Past performance does not guarantee future results.“Composite”: Emerging Markets Composite. “Benchmark”: MSCI Emerging Markets Index.Sector and Region Attribution and Contributors and Detractors are shown as supplemental information only and complement the fully compliant Emerging Markets Composite GIPSPresentation. The portfolio holdings identified above do not represent all of the securities held in the portfolio. It should not be assumed that investment in the securities identified has beenor will be profitable. The following information is available upon request: (1) information describing the methodology of the contribution data and (2) a list showing the weight andcontribution of all holdings during the period. Contribution is the contribution to overall performance over the period. Contributors and detractors exclude cash and securities in the Compositenot held in the Model Portfolio. Data is not annualized. Please read the disclosures on the last page, which are an integral part of this presentation.
-3.0
-1.5
0.0
1.5
3.0
CASH INFT INDU UTIL MATS RLST HLTH ENER COMM STPL FINA DSCR
Top Five Contributors to Absolute Returns
TSMC
WEG
Alibaba
Tencent
Sunny Optical
Top Five Detractors from Absolute Returns
Banco Bradesco
Sasol
Lukoil
HDFC Corp
GF Banorte
Selection Effect Allocation Effect Total Effect
-3.0
-1.5
0.0
1.5
3.0
CASH INDIA BRAZIL SMALLEMS¹
SKOREA FRONTIERMKTS²
DEV MKTLISTED³
MEXICO TAIWAN SAFRICA RUSSIA CHINA +HK
Total Effect: -1.5
Selection Effect: -3.9
Allocation Effect: 2.4
Total Effect: -1.5
Selection Effect: -3.2
Allocation Effect: 1.7
Effe
ct (%
)Ef
fect
(%)
Sector
Region
HARDING LOEVNER 21
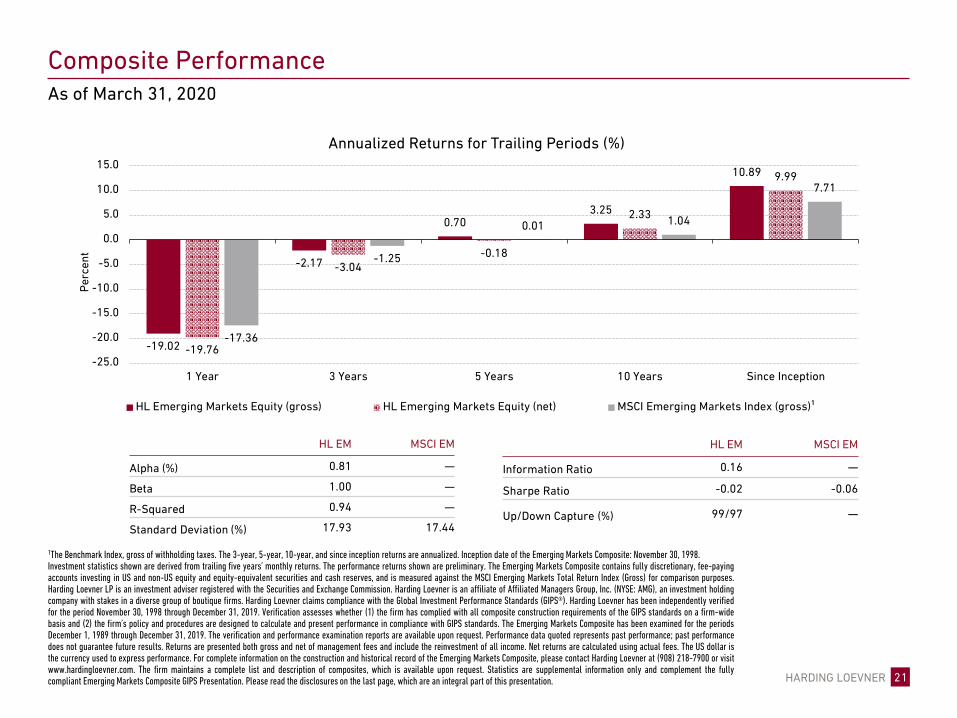
HL EM MSCI EM
Information Ratio 0.16 —
Sharpe Ratio -0.02 -0.06
Up/Down Capture (%) 99/97 —
HL EM MSCI EM
Alpha (%) 0.81 —
Beta 1.00 —
R-Squared 0.94 —
Standard Deviation (%) 17.93 17.44
Composite PerformanceAs of March 31, 2020
1The Benchmark Index, gross of withholding taxes. The 3-year, 5-year, 10-year, and since inception returns are annualized. Inception date of the Emerging Markets Composite: November 30, 1998.Investment statistics shown are derived from trailing five years’ monthly returns. The performance returns shown are preliminary. The Emerging Markets Composite contains fully discretionary, fee-payingaccounts investing in US and non-US equity and equity-equivalent securities and cash reserves, and is measured against the MSCI Emerging Markets Total Return Index (Gross) for comparison purposes.Harding Loevner LP is an investment adviser registered with the Securities and Exchange Commission. Harding Loevner is an affiliate of Affiliated Managers Group, Inc. (NYSE: AMG), an investment holdingcompany with stakes in a diverse group of boutique firms. Harding Loevner claims compliance with the Global Investment Performance Standards (GIPS®). Harding Loevner has been independently verifiedfor the period November 30, 1998 through December 31, 2019. Verification assesses whether (1) the firm has complied with all composite construction requirements of the GIPS standards on a firm-widebasis and (2) the firm’s policy and procedures are designed to calculate and present performance in compliance with GIPS standards. The Emerging Markets Composite has been examined for the periodsDecember 1, 1989 through December 31, 2019. The verification and performance examination reports are available upon request. Performance data quoted represents past performance; past performancedoes not guarantee future results. Returns are presented both gross and net of management fees and include the reinvestment of all income. Net returns are calculated using actual fees. The US dollar isthe currency used to express performance. For complete information on the construction and historical record of the Emerging Markets Composite, please contact Harding Loevner at (908) 218-7900 or visitwww.hardingloevner.com. The firm maintains a complete list and description of composites, which is available upon request. Statistics are supplemental information only and complement the fullycompliant Emerging Markets Composite GIPS Presentation. Please read the disclosures on the last page, which are an integral part of this presentation.
-19.02
-2.17
0.703.25
10.89
-19.76
-3.04-0.18
2.33
9.99
-17.36
-1.25
0.01 1.04
7.71
-25.0
-20.0
-15.0
-10.0
-5.0
0.0
5.0
10.0
15.0
1 Year 3 Years 5 Years 10 Years Since Inception
Per
cent
HL Emerging Markets Equity (gross) HL Emerging Markets Equity (net) MSCI Emerging Markets Index (gross)¹
Annualized Returns for Trailing Periods (%)

HARDING LOEVNER 22
The information provided in this Presentation should not be considered a recommendation to purchase or sell a particular security. Unless otherwise stated, non-performance based criteria have been used to select the securitieslisted. The portfolio is actively managed therefore securities shown may not be current. It should not be assumed that investment in the securities identified has been or will be profitable. To request a complete list of portfolioholdings for the past year contact Harding Loevner. A complete list of holdings for the Emerging Markets Model at March 31, 2020 is available on request.
Investing in stocks entails the risks of market volatility. The value of all types of stocks may increase or decrease over varying time periods. To the extent the investments depicted herein represent international securities, youshould be aware that there may be additional risks associated with international investing, including foreign economic, political, monetary and/or legal factors, changing currency exchange rates, foreign taxes, and differences infinancial and accounting standards.
Quality & Growth Characteristics, Investment Statistics, Benchmark Returns, Performance Attribution, Portfolio Profile and Portfolio Transactions are shown as supplemental information only and complement the fully compliantEmerging Markets Composite GIPS Presentation, which is available on request.
Profit Margin: relationship of gross profits to net sales. Return on Assets: net income for past 12 months divided by total assets. Return on Equity: the net income divided by total common equity outstanding, expressed as apercent. Debt/Equity Ratio: total long-term debt divided by total shareholder’s equity. Standard Deviation: the statistical measure of the degree to which an individual value in a probability distribution tends to vary from the meanof the distribution. Sales Per Share: the total revenue earned per share over a 12-month period, net of returns, allowances, and discounts. Earnings Per Share: portion of a company’s profit allocated to each outstanding share ofcommon stock. Cash Flow: a measure of the cash generating capability of a company calculated by adding non-cash charges (e.g. depreciation) and interest expense to pretax income. Dividend Per Share: a total dividends pershare paid during the previous fiscal year. Active Share: the proportion of holdings by weight that differ from holdings of the benchmark index. Turnover: calculated by dividing the lesser of Purchases or Sales by Average Capital.
The MSCI Emerging Markets Index is a free float-adjusted market capitalization index that is designed to measure equity market performance in the global emerging markets. The Index consists of 26 emerging market countries.The MSCI All Country World Index is a free float-adjusted market capitalization index that is designed to measure equity market performance in the global developed and emerging markets. The Index consists of 49 developed andemerging market countries. The MSCI World Index is a free float-adjusted market capitalization index that is designed to measure global developed market equity performance. The Index consists of 23 developed market countries.You cannot invest directly in these Indexes.
All performance and data shown are in US dollar terms, unless otherwise noted.
Harding Loevner’s Quality, Growth, and Value rankings are proprietary measures determined using objective data. Quality rankings are based on the stability, trend, and level of profitability, as well as balance sheet strength.Growth rankings are based on historical growth of earnings, sales, and assets, as well as expected changes in earnings and profitability. Value rankings are based on several valuation measures, including price ratios.
The Composite and Attribution returns may show discrepancies due to the different data sources for these returns. Composite performance is preliminary and obtained from Harding Loevner’s accounting system and Attributionreturns are obtained from the FactSet portfolio analysis system. Please note returns from FactSet are not audited for GIPS compliance and are for reference only.
Source (Benchmark Performance, Performance Attribution, Contributors and Detractors): FactSet; Harding Loevner Emerging Markets Composite; MSCI Inc.
Source (Portfolio Profile, Portfolio Transactions, Portfolio Allocation Comparison, Quality & Growth Characteristics [Run date: April 3, 2020]): FactSet; Harding Loevner Emerging Markets Model; MSCI Inc.
Source (Investment Statistics): eVestment Alliance; Harding Loevner Emerging Markets Composite, based on composite returns.
MSCI Inc. and S&P do not make any express or implied warranties or representations and shall have no liability whatsoever with respect to any GICS data contained herein.
FactSet Fundamentals, Copyright 2020 FactSet Research Systems, Inc. All rights reserved.
Disclosures