Emerging Consumer Survey Databook 2014 - Credit Suisse€¦ · Brazil: Brand penetration...
240
Emerging Consumer Survey Databook 2014 Research Institute Thought leadership from Credit Suisse Research and the world’s foremost experts February 2014
Transcript of Emerging Consumer Survey Databook 2014 - Credit Suisse€¦ · Brazil: Brand penetration...
Emerging ConsumerSurvey Databook 2014
Research InstituteThought leadership from Credit Suisse Research
and the world’s foremost experts
February 2014
Contents
For more information, please contact:
Mujtaba Rana, Vice President
Thematic Equity Research
Credit Suisse Investment Banking
+44 20 7883 3773
3 Introduction
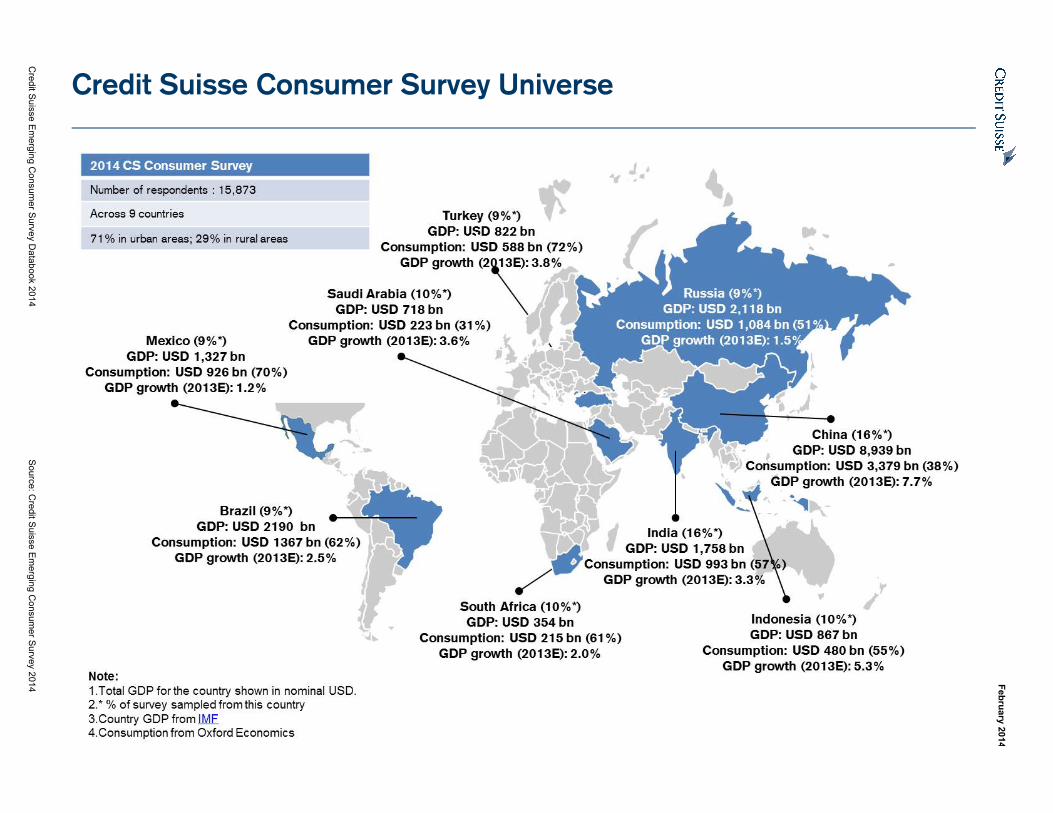
4 Credit Suisse Consumer Survey Universe
5 Brazil
30 China
58 India
85 Indonesia
110 Mexico
136 Russia
162 Saudi Arabia
185 South Africa
211 Turkey
237 Appendix: Methodology
238 About the survey
239 Imprint
240 General disclaimer/Important information
February 2014
Credit Suisse Emerging Consumer Survey Databook 2014 Source: Credit Suisse Emerging Consumer Survey 2014
Introduction This Credit Suisse Emerging Consumer Survey Databook provides granular detail of the market research that underpins the conclusions and themes highlighted in the Credit Suisse Emerging Consumer Survey 2014, a comprehensive and exclusive study of the consumption patterns and plans of individuals residing in nine key economies across the emerging world. Specifically, the markets we have incorporated in this survey are China, India, Brazil, Russia, Mexico, Saudi Arabia, South Africa, Indonesia and Turkey. In total, these markets account for almost 3.5 billion people.
As comprehensive as this Databook is, we have not provided every aspect of the detail which can be derived from the survey along the lines of gender, age, city and rural/urban locations. This is available on request. The pages that follow have focused on income bands as a source of disaggregation of the responses which was a principal feature of the themes we have explored.
This report builds on work Credit Suisse published on consumption trends in emerging markets over the past 36 months. The Emerging Consumer Surveys in 2013, 2012 and 2011 were in themselves an extension to the China Consumer Survey, a publication released annually since 2005. The survey structure and questionnaire used in this previous work has been used as a template for this project, ensuring both a degree of consistency with previous work and a comparable dataset across the different countries.
To conduct the primary research for this project, the Credit Suisse Research Institute engaged the global market research firm Nielsen to advise on the questionnaire construction and to undertake the interview process on our behalf. Using a global firm with local offices has provided a consistent approach to this multi-region survey, as well as allowing sufficient flexibility to incorporate questions specific to the countries concerned.
This survey is designed to capture information regarding the spending patterns (past, present and future) and general lifestyles and aspirations of the consumers across these markets. The data is proprietary to Credit Suisse and is based on face-to-face interviews carried out in 91 distinct regional areas, spread over the nine different countries. Data from such a sample will vary in quality due to the sampling and non-sampling problems inherent in all surveys. Approximately 1,500 respondents were surveyed for each region, with the largest two markets (India and China) having a larger sample size of 2,500 each. The male-to-female split between respondents was roughly 50:50 in all cases, with rural-to-urban split varying by country.
A total of 16,000 respondents were screened and surveyed on questions within 12 categories: 1) general income and wealth, 2) autos, 3) food and beverages, 4) household and personal care, 5) luxury goods, 6) technology, 7) telecoms, 8) internet, 9) travelling, 10) property, 11) education and 12) healthcare. Detailed results from each of the eight markets are shown in the "Country Specific Data" section from page 5 onwards. The survey methodology is described in the appendix.
Although each respondent was asked up to 120 questions during the course of the survey, the Databook aims to present detailed information on those areas which investors may find most compelling and those which garnered the most thought-provoking ideas during the course of our study. Certain topics are more pertinent in some markets than others: questions on holiday plans yielded far more interesting results in Russia and Saudi Arabia than they did in Indonesia, for instance. Similarly, questions on stock market investments are more pertinent in China than they are in India. Nevertheless, for the sake of consistency, we have included a standard set of results for each market in this Databook. Numbered references within the tables, such as A7 and D5, allude to specific questions surveyed. More detail is available on request.
Mujtaba Rana Equity Research, Credit Suisse Investment Banking
Feb
ruary 2014
Credit S
uisse Em
erging Consum
er Survey D
atabook 2014 Source: C
redit Suisse E
merging C
onsumer S
urvey 2014
Credit Suisse Consumer Survey Universe
February 2014
Credit Suisse Emerging Consumer Survey Databook 2014 Source: Credit Suisse Emerging Consumer Survey 2014 5
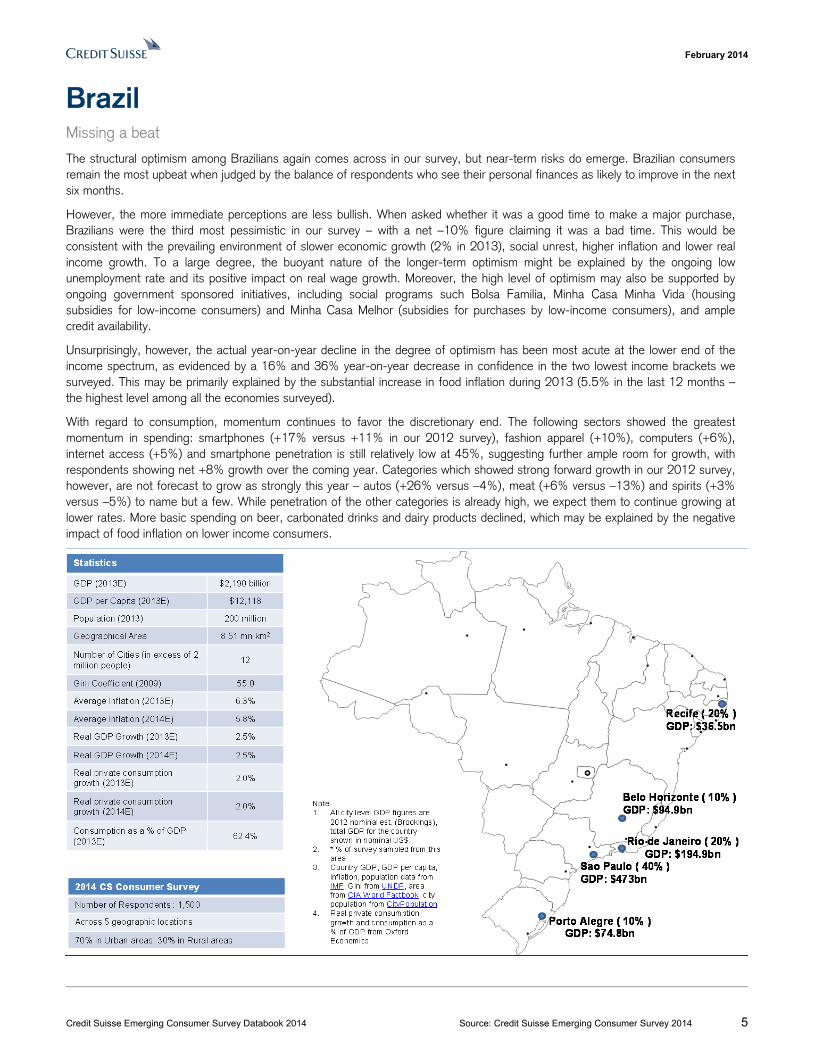
Brazil Missing a beat
The structural optimism among Brazilians again comes across in our survey, but near-term risks do emerge. Brazilian consumers remain the most upbeat when judged by the balance of respondents who see their personal finances as likely to improve in the next six months.
However, the more immediate perceptions are less bullish. When asked whether it was a good time to make a major purchase, Brazilians were the third most pessimistic in our survey – with a net –10% figure claiming it was a bad time. This would be consistent with the prevailing environment of slower economic growth (2% in 2013), social unrest, higher inflation and lower real income growth. To a large degree, the buoyant nature of the longer-term optimism might be explained by the ongoing low unemployment rate and its positive impact on real wage growth. Moreover, the high level of optimism may also be supported by ongoing government sponsored initiatives, including social programs such Bolsa Familia, Minha Casa Minha Vida (housing subsidies for low-income consumers) and Minha Casa Melhor (subsidies for purchases by low-income consumers), and ample credit availability.
Unsurprisingly, however, the actual year-on-year decline in the degree of optimism has been most acute at the lower end of the income spectrum, as evidenced by a 16% and 36% year-on-year decrease in confidence in the two lowest income brackets we surveyed. This may be primarily explained by the substantial increase in food inflation during 2013 (5.5% in the last 12 months – the highest level among all the economies surveyed).
With regard to consumption, momentum continues to favor the discretionary end. The following sectors showed the greatest momentum in spending: smartphones (+17% versus +11% in our 2012 survey), fashion apparel (+10%), computers (+6%), internet access (+5%) and smartphone penetration is still relatively low at 45%, suggesting further ample room for growth, with respondents showing net +8% growth over the coming year. Categories which showed strong forward growth in our 2012 survey, however, are not forecast to grow as strongly this year – autos (+26% versus –4%), meat (+6% versus –13%) and spirits (+3% versus –5%) to name but a few. While penetration of the other categories is already high, we expect them to continue growing at lower rates. More basic spending on beer, carbonated drinks and dairy products declined, which may be explained by the negative impact of food inflation on lower income consumers.
February 2014
Credit Suisse Emerging Consumer Survey Databook 2014 Source: Credit Suisse Emerging Consumer Survey 2014 6
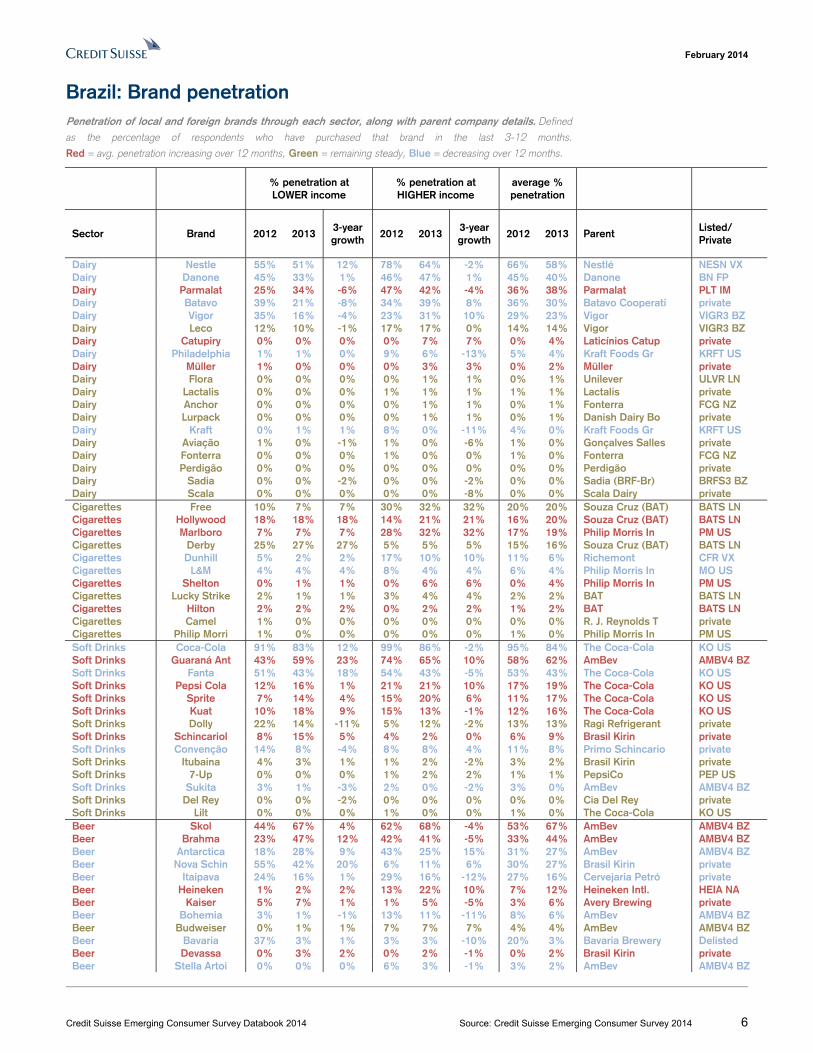
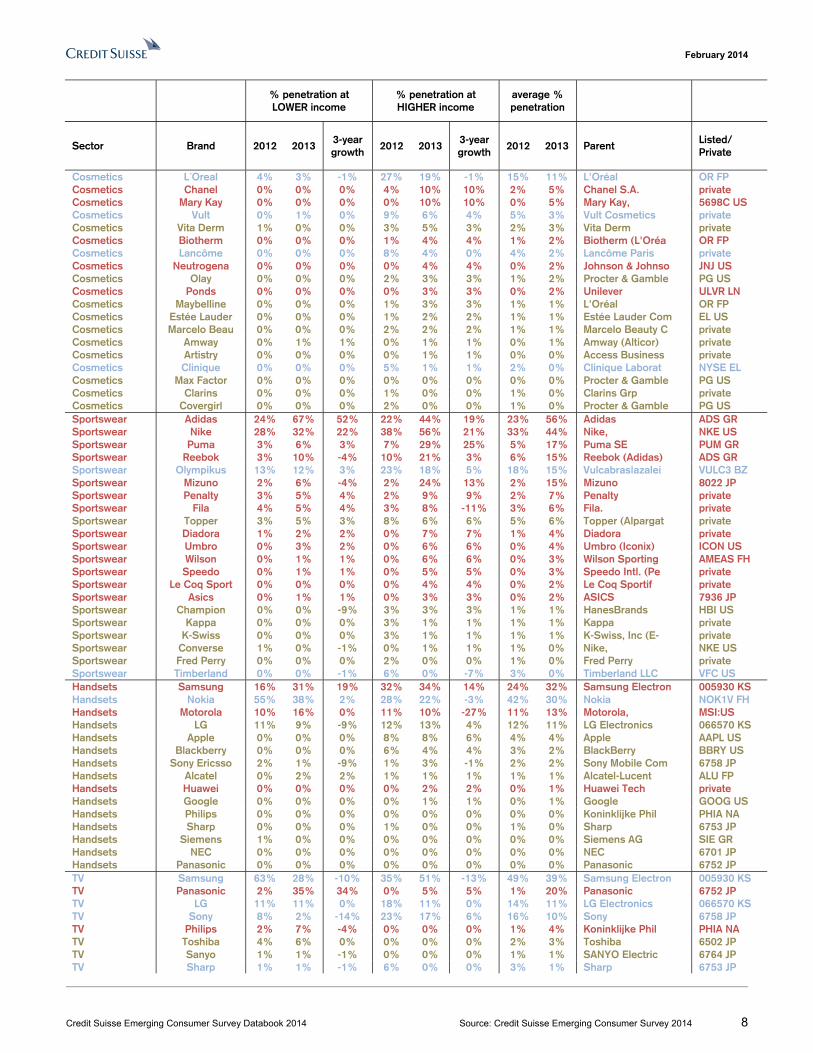
Brazil: Brand penetration Penetration of local and foreign brands through each sector, along with parent company details. Defined
as the percentage of respondents who have purchased that brand in the last 3-12 months.
Red = avg. penetration increasing over 12 months, Green = remaining steady, Blue = decreasing over 12 months.
% penetration at LOWER income
% penetration at HIGHER income
average % penetration
Sector Brand 2012 2013 3-year growth
2012 2013 3-year growth
2012 2013 Parent Listed/ Private
Dairy Nestle 55% 51% 12% 78% 64% -2% 66% 58% Nestlé NESN VX Dairy Danone 45% 33% 1% 46% 47% 1% 45% 40% Danone BN FP Dairy Parmalat 25% 34% -6% 47% 42% -4% 36% 38% Parmalat PLT IM Dairy Batavo 39% 21% -8% 34% 39% 8% 36% 30% Batavo Cooperati private Dairy Vigor 35% 16% -4% 23% 31% 10% 29% 23% Vigor VIGR3 BZ Dairy Leco 12% 10% -1% 17% 17% 0% 14% 14% Vigor VIGR3 BZ Dairy Catupiry 0% 0% 0% 0% 7% 7% 0% 4% Laticínios Catup private Dairy Philadelphia 1% 1% 0% 9% 6% -13% 5% 4% Kraft Foods Gr KRFT US Dairy Müller 1% 0% 0% 0% 3% 3% 0% 2% Müller private Dairy Flora 0% 0% 0% 0% 1% 1% 0% 1% Unilever ULVR LN Dairy Lactalis 0% 0% 0% 1% 1% 1% 1% 1% Lactalis private Dairy Anchor 0% 0% 0% 0% 1% 1% 0% 1% Fonterra FCG NZ Dairy Lurpack 0% 0% 0% 0% 1% 1% 0% 1% Danish Dairy Bo private Dairy Kraft 0% 1% 1% 8% 0% -11% 4% 0% Kraft Foods Gr KRFT US Dairy Aviação 1% 0% -1% 1% 0% -6% 1% 0% Gonçalves Salles private Dairy Fonterra 0% 0% 0% 1% 0% 0% 1% 0% Fonterra FCG NZ Dairy Perdigão 0% 0% 0% 0% 0% 0% 0% 0% Perdigão private Dairy Sadia 0% 0% -2% 0% 0% -2% 0% 0% Sadia (BRF-Br) BRFS3 BZ Dairy Scala 0% 0% 0% 0% 0% -8% 0% 0% Scala Dairy private Cigarettes Free 10% 7% 7% 30% 32% 32% 20% 20% Souza Cruz (BAT) BATS LN Cigarettes Hollywood 18% 18% 18% 14% 21% 21% 16% 20% Souza Cruz (BAT) BATS LN Cigarettes Marlboro 7% 7% 7% 28% 32% 32% 17% 19% Philip Morris In PM US Cigarettes Derby 25% 27% 27% 5% 5% 5% 15% 16% Souza Cruz (BAT) BATS LN Cigarettes Dunhill 5% 2% 2% 17% 10% 10% 11% 6% Richemont CFR VX Cigarettes L&M 4% 4% 4% 8% 4% 4% 6% 4% Philip Morris In MO US Cigarettes Shelton 0% 1% 1% 0% 6% 6% 0% 4% Philip Morris In PM US Cigarettes Lucky Strike 2% 1% 1% 3% 4% 4% 2% 2% BAT BATS LN Cigarettes Hilton 2% 2% 2% 0% 2% 2% 1% 2% BAT BATS LN Cigarettes Camel 1% 0% 0% 0% 0% 0% 0% 0% R. J. Reynolds T private Cigarettes Philip Morri 1% 0% 0% 0% 0% 0% 1% 0% Philip Morris In PM US Soft Drinks Coca-Cola 91% 83% 12% 99% 86% -2% 95% 84% The Coca-Cola KO US Soft Drinks Guaraná Ant 43% 59% 23% 74% 65% 10% 58% 62% AmBev AMBV4 BZ Soft Drinks Fanta 51% 43% 18% 54% 43% -5% 53% 43% The Coca-Cola KO US Soft Drinks Pepsi Cola 12% 16% 1% 21% 21% 10% 17% 19% The Coca-Cola KO US Soft Drinks Sprite 7% 14% 4% 15% 20% 6% 11% 17% The Coca-Cola KO US Soft Drinks Kuat 10% 18% 9% 15% 13% -1% 12% 16% The Coca-Cola KO US Soft Drinks Dolly 22% 14% -11% 5% 12% -2% 13% 13% Ragi Refrigerant private Soft Drinks Schincariol 8% 15% 5% 4% 2% 0% 6% 9% Brasil Kirin private Soft Drinks Convenção 14% 8% -4% 8% 8% 4% 11% 8% Primo Schincario private Soft Drinks Itubaina 4% 3% 1% 1% 2% -2% 3% 2% Brasil Kirin private Soft Drinks 7-Up 0% 0% 0% 1% 2% 2% 1% 1% PepsiCo PEP US Soft Drinks Sukita 3% 1% -3% 2% 0% -2% 3% 0% AmBev AMBV4 BZ Soft Drinks Del Rey 0% 0% -2% 0% 0% 0% 0% 0% Cia Del Rey private Soft Drinks Lilt 0% 0% 0% 1% 0% 0% 1% 0% The Coca-Cola KO US Beer Skol 44% 67% 4% 62% 68% -4% 53% 67% AmBev AMBV4 BZ Beer Brahma 23% 47% 12% 42% 41% -5% 33% 44% AmBev AMBV4 BZ Beer Antarctica 18% 28% 9% 43% 25% 15% 31% 27% AmBev AMBV4 BZ Beer Nova Schin 55% 42% 20% 6% 11% 6% 30% 27% Brasil Kirin private Beer Itaipava 24% 16% 1% 29% 16% -12% 27% 16% Cervejaria Petró private Beer Heineken 1% 2% 2% 13% 22% 10% 7% 12% Heineken Intl. HEIA NA Beer Kaiser 5% 7% 1% 1% 5% -5% 3% 6% Avery Brewing private Beer Bohemia 3% 1% -1% 13% 11% -11% 8% 6% AmBev AMBV4 BZ Beer Budweiser 0% 1% 1% 7% 7% 7% 4% 4% AmBev AMBV4 BZ Beer Bavaria 37% 3% 1% 3% 3% -10% 20% 3% Bavaria Brewery Delisted Beer Devassa 0% 3% 2% 0% 2% -1% 0% 2% Brasil Kirin private Beer Stella Artoi 0% 0% 0% 6% 3% -1% 3% 2% AmBev AMBV4 BZ
February 2014
Credit Suisse Emerging Consumer Survey Databook 2014 Source: Credit Suisse Emerging Consumer Survey 2014 7
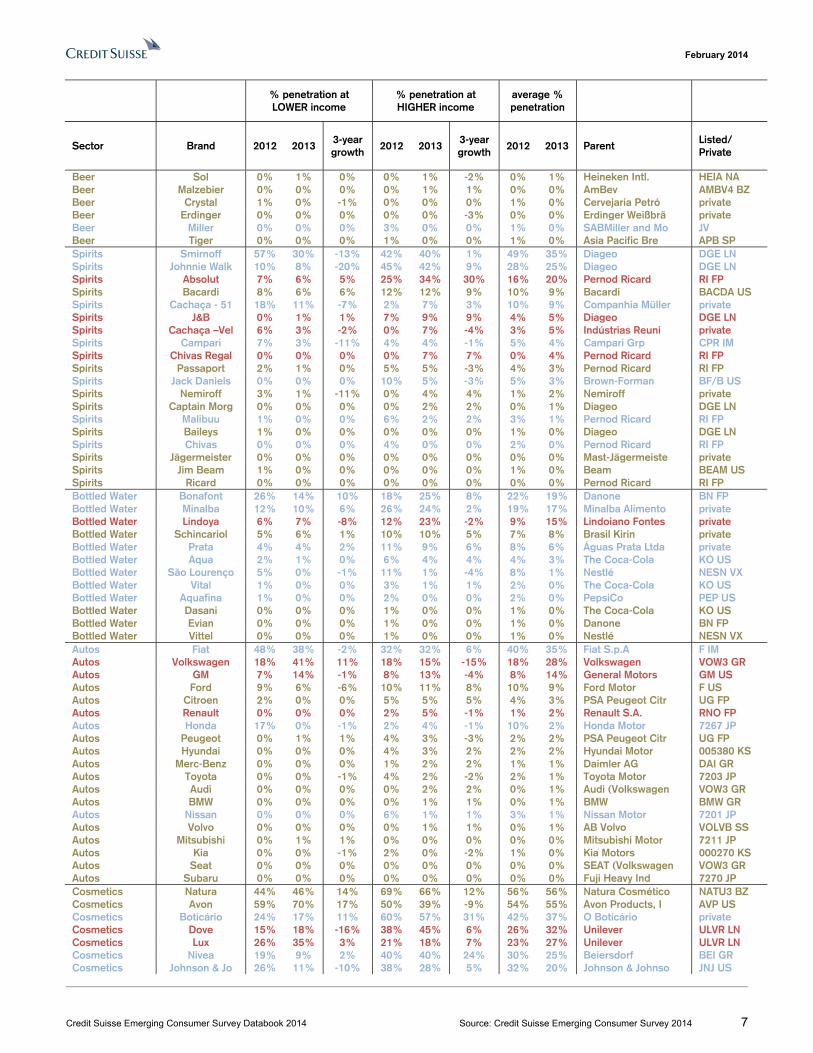
% penetration at LOWER income
% penetration at HIGHER income
average % penetration
Sector Brand 2012 2013 3-year growth
2012 2013 3-year growth
2012 2013 Parent Listed/ Private
Beer Sol 0% 1% 0% 0% 1% -2% 0% 1% Heineken Intl. HEIA NA Beer Malzebier 0% 0% 0% 0% 1% 1% 0% 0% AmBev AMBV4 BZ Beer Crystal 1% 0% -1% 0% 0% 0% 1% 0% Cervejaria Petró private Beer Erdinger 0% 0% 0% 0% 0% -3% 0% 0% Erdinger Weißbrä private Beer Miller 0% 0% 0% 3% 0% 0% 1% 0% SABMiller and Mo JV Beer Tiger 0% 0% 0% 1% 0% 0% 1% 0% Asia Pacific Bre APB SP Spirits Smirnoff 57% 30% -13% 42% 40% 1% 49% 35% Diageo DGE LN Spirits Johnnie Walk 10% 8% -20% 45% 42% 9% 28% 25% Diageo DGE LN Spirits Absolut 7% 6% 5% 25% 34% 30% 16% 20% Pernod Ricard RI FP Spirits Bacardi 8% 6% 6% 12% 12% 9% 10% 9% Bacardi BACDA US Spirits Cachaça - 51 18% 11% -7% 2% 7% 3% 10% 9% Companhia Müller private Spirits J&B 0% 1% 1% 7% 9% 9% 4% 5% Diageo DGE LN Spirits Cachaça –Vel 6% 3% -2% 0% 7% -4% 3% 5% Indústrias Reuni private Spirits Campari 7% 3% -11% 4% 4% -1% 5% 4% Campari Grp CPR IM Spirits Chivas Regal 0% 0% 0% 0% 7% 7% 0% 4% Pernod Ricard RI FP Spirits Passaport 2% 1% 0% 5% 5% -3% 4% 3% Pernod Ricard RI FP Spirits Jack Daniels 0% 0% 0% 10% 5% -3% 5% 3% Brown-Forman BF/B US Spirits Nemiroff 3% 1% -11% 0% 4% 4% 1% 2% Nemiroff private Spirits Captain Morg 0% 0% 0% 0% 2% 2% 0% 1% Diageo DGE LN Spirits Malibuu 1% 0% 0% 6% 2% 2% 3% 1% Pernod Ricard RI FP Spirits Baileys 1% 0% 0% 0% 0% 0% 1% 0% Diageo DGE LN Spirits Chivas 0% 0% 0% 4% 0% 0% 2% 0% Pernod Ricard RI FP Spirits Jägermeister 0% 0% 0% 0% 0% 0% 0% 0% Mast-Jägermeiste private Spirits Jim Beam 1% 0% 0% 0% 0% 0% 1% 0% Beam BEAM US Spirits Ricard 0% 0% 0% 0% 0% 0% 0% 0% Pernod Ricard RI FP Bottled Water Bonafont 26% 14% 10% 18% 25% 8% 22% 19% Danone BN FP Bottled Water Minalba 12% 10% 6% 26% 24% 2% 19% 17% Minalba Alimento private Bottled Water Lindoya 6% 7% -8% 12% 23% -2% 9% 15% Lindoiano Fontes private Bottled Water Schincariol 5% 6% 1% 10% 10% 5% 7% 8% Brasil Kirin private Bottled Water Prata 4% 4% 2% 11% 9% 6% 8% 6% Águas Prata Ltda private Bottled Water Aqua 2% 1% 0% 6% 4% 4% 4% 3% The Coca-Cola KO US Bottled Water São Lourenço 5% 0% -1% 11% 1% -4% 8% 1% Nestlé NESN VX Bottled Water Vital 1% 0% 0% 3% 1% 1% 2% 0% The Coca-Cola KO US Bottled Water Aquafina 1% 0% 0% 2% 0% 0% 2% 0% PepsiCo PEP US Bottled Water Dasani 0% 0% 0% 1% 0% 0% 1% 0% The Coca-Cola KO US Bottled Water Evian 0% 0% 0% 1% 0% 0% 1% 0% Danone BN FP Bottled Water Vittel 0% 0% 0% 1% 0% 0% 1% 0% Nestlé NESN VX Autos Fiat 48% 38% -2% 32% 32% 6% 40% 35% Fiat S.p.A F IM Autos Volkswagen 18% 41% 11% 18% 15% -15% 18% 28% Volkswagen VOW3 GR Autos GM 7% 14% -1% 8% 13% -4% 8% 14% General Motors GM US Autos Ford 9% 6% -6% 10% 11% 8% 10% 9% Ford Motor F US Autos Citroen 2% 0% 0% 5% 5% 5% 4% 3% PSA Peugeot Citr UG FP Autos Renault 0% 0% 0% 2% 5% -1% 1% 2% Renault S.A. RNO FP Autos Honda 17% 0% -1% 2% 4% -1% 10% 2% Honda Motor 7267 JP Autos Peugeot 0% 1% 1% 4% 3% -3% 2% 2% PSA Peugeot Citr UG FP Autos Hyundai 0% 0% 0% 4% 3% 2% 2% 2% Hyundai Motor 005380 KS Autos Merc-Benz 0% 0% 0% 1% 2% 2% 1% 1% Daimler AG DAI GR Autos Toyota 0% 0% -1% 4% 2% -2% 2% 1% Toyota Motor 7203 JP Autos Audi 0% 0% 0% 0% 2% 2% 0% 1% Audi (Volkswagen VOW3 GR Autos BMW 0% 0% 0% 0% 1% 1% 0% 1% BMW BMW GR Autos Nissan 0% 0% 0% 6% 1% 1% 3% 1% Nissan Motor 7201 JP Autos Volvo 0% 0% 0% 0% 1% 1% 0% 1% AB Volvo VOLVB SS Autos Mitsubishi 0% 1% 1% 0% 0% 0% 0% 0% Mitsubishi Motor 7211 JP Autos Kia 0% 0% -1% 2% 0% -2% 1% 0% Kia Motors 000270 KS Autos Seat 0% 0% 0% 0% 0% 0% 0% 0% SEAT (Volkswagen VOW3 GR Autos Subaru 0% 0% 0% 0% 0% 0% 0% 0% Fuji Heavy Ind 7270 JP Cosmetics Natura 44% 46% 14% 69% 66% 12% 56% 56% Natura Cosmético NATU3 BZ Cosmetics Avon 59% 70% 17% 50% 39% -9% 54% 55% Avon Products, I AVP US Cosmetics Boticário 24% 17% 11% 60% 57% 31% 42% 37% O Boticário private Cosmetics Dove 15% 18% -16% 38% 45% 6% 26% 32% Unilever ULVR LN Cosmetics Lux 26% 35% 3% 21% 18% 7% 23% 27% Unilever ULVR LN Cosmetics Nivea 19% 9% 2% 40% 40% 24% 30% 25% Beiersdorf BEI GR Cosmetics Johnson & Jo 26% 11% -10% 38% 28% 5% 32% 20% Johnson & Johnso JNJ US
February 2014
Credit Suisse Emerging Consumer Survey Databook 2014 Source: Credit Suisse Emerging Consumer Survey 2014 8
% penetration at LOWER income
% penetration at HIGHER income
average % penetration
Sector Brand 2012 2013 3-year growth
2012 2013 3-year growth
2012 2013 Parent Listed/ Private
Cosmetics L´Oreal 4% 3% -1% 27% 19% -1% 15% 11% L'Oréal OR FP Cosmetics Chanel 0% 0% 0% 4% 10% 10% 2% 5% Chanel S.A. private Cosmetics Mary Kay 0% 0% 0% 0% 10% 10% 0% 5% Mary Kay, 5698C US Cosmetics Vult 0% 1% 0% 9% 6% 4% 5% 3% Vult Cosmetics private Cosmetics Vita Derm 1% 0% 0% 3% 5% 3% 2% 3% Vita Derm private Cosmetics Biotherm 0% 0% 0% 1% 4% 4% 1% 2% Biotherm (L'Oréa OR FP Cosmetics Lancôme 0% 0% 0% 8% 4% 0% 4% 2% Lancôme Paris private Cosmetics Neutrogena 0% 0% 0% 0% 4% 4% 0% 2% Johnson & Johnso JNJ US Cosmetics Olay 0% 0% 0% 2% 3% 3% 1% 2% Procter & Gamble PG US Cosmetics Ponds 0% 0% 0% 0% 3% 3% 0% 2% Unilever ULVR LN Cosmetics Maybelline 0% 0% 0% 1% 3% 3% 1% 1% L'Oréal OR FP Cosmetics Estée Lauder 0% 0% 0% 1% 2% 2% 1% 1% Estée Lauder Com EL US Cosmetics Marcelo Beau 0% 0% 0% 2% 2% 2% 1% 1% Marcelo Beauty C private Cosmetics Amway 0% 1% 1% 0% 1% 1% 0% 1% Amway (Alticor) private Cosmetics Artistry 0% 0% 0% 0% 1% 1% 0% 0% Access Business private Cosmetics Clinique 0% 0% 0% 5% 1% 1% 2% 0% Clinique Laborat NYSE EL Cosmetics Max Factor 0% 0% 0% 0% 0% 0% 0% 0% Procter & Gamble PG US Cosmetics Clarins 0% 0% 0% 1% 0% 0% 1% 0% Clarins Grp private Cosmetics Covergirl 0% 0% 0% 2% 0% 0% 1% 0% Procter & Gamble PG US Sportswear Adidas 24% 67% 52% 22% 44% 19% 23% 56% Adidas ADS GR Sportswear Nike 28% 32% 22% 38% 56% 21% 33% 44% Nike, NKE US Sportswear Puma 3% 6% 3% 7% 29% 25% 5% 17% Puma SE PUM GR Sportswear Reebok 3% 10% -4% 10% 21% 3% 6% 15% Reebok (Adidas) ADS GR Sportswear Olympikus 13% 12% 3% 23% 18% 5% 18% 15% Vulcabrasǀazalei VULC3 BZ Sportswear Mizuno 2% 6% -4% 2% 24% 13% 2% 15% Mizuno 8022 JP Sportswear Penalty 3% 5% 4% 2% 9% 9% 2% 7% Penalty private Sportswear Fila 4% 5% 4% 3% 8% -11% 3% 6% Fila. private Sportswear Topper 3% 5% 3% 8% 6% 6% 5% 6% Topper (Alpargat private Sportswear Diadora 1% 2% 2% 0% 7% 7% 1% 4% Diadora private Sportswear Umbro 0% 3% 2% 0% 6% 6% 0% 4% Umbro (Iconix) ICON US Sportswear Wilson 0% 1% 1% 0% 6% 6% 0% 3% Wilson Sporting AMEAS FH Sportswear Speedo 0% 1% 1% 0% 5% 5% 0% 3% Speedo Intl. (Pe private Sportswear Le Coq Sport 0% 0% 0% 0% 4% 4% 0% 2% Le Coq Sportif private Sportswear Asics 0% 1% 1% 0% 3% 3% 0% 2% ASICS 7936 JP Sportswear Champion 0% 0% -9% 3% 3% 3% 1% 1% HanesBrands HBI US Sportswear Kappa 0% 0% 0% 3% 1% 1% 1% 1% Kappa private Sportswear K-Swiss 0% 0% 0% 3% 1% 1% 1% 1% K-Swiss, Inc (E- private Sportswear Converse 1% 0% -1% 0% 1% 1% 1% 0% Nike, NKE US Sportswear Fred Perry 0% 0% 0% 2% 0% 0% 1% 0% Fred Perry private Sportswear Timberland 0% 0% -1% 6% 0% -7% 3% 0% Timberland LLC VFC US Handsets Samsung 16% 31% 19% 32% 34% 14% 24% 32% Samsung Electron 005930 KS Handsets Nokia 55% 38% 2% 28% 22% -3% 42% 30% Nokia NOK1V FH Handsets Motorola 10% 16% 0% 11% 10% -27% 11% 13% Motorola, MSI:US Handsets LG 11% 9% -9% 12% 13% 4% 12% 11% LG Electronics 066570 KS Handsets Apple 0% 0% 0% 8% 8% 6% 4% 4% Apple AAPL US Handsets Blackberry 0% 0% 0% 6% 4% 4% 3% 2% BlackBerry BBRY US Handsets Sony Ericsso 2% 1% -9% 1% 3% -1% 2% 2% Sony Mobile Com 6758 JP Handsets Alcatel 0% 2% 2% 1% 1% 1% 1% 1% Alcatel-Lucent ALU FP Handsets Huawei 0% 0% 0% 0% 2% 2% 0% 1% Huawei Tech private Handsets Google 0% 0% 0% 0% 1% 1% 0% 1% Google GOOG US Handsets Philips 0% 0% 0% 0% 0% 0% 0% 0% Koninklijke Phil PHIA NA Handsets Sharp 0% 0% 0% 1% 0% 0% 1% 0% Sharp 6753 JP Handsets Siemens 1% 0% 0% 0% 0% 0% 0% 0% Siemens AG SIE GR Handsets NEC 0% 0% 0% 0% 0% 0% 0% 0% NEC 6701 JP Handsets Panasonic 0% 0% 0% 0% 0% 0% 0% 0% Panasonic 6752 JP TV Samsung 63% 28% -10% 35% 51% -13% 49% 39% Samsung Electron 005930 KS TV Panasonic 2% 35% 34% 0% 5% 5% 1% 20% Panasonic 6752 JP TV LG 11% 11% 0% 18% 11% 0% 14% 11% LG Electronics 066570 KS TV Sony 8% 2% -14% 23% 17% 6% 16% 10% Sony 6758 JP TV Philips 2% 7% -4% 0% 0% 0% 1% 4% Koninklijke Phil PHIA NA TV Toshiba 4% 6% 0% 0% 0% 0% 2% 3% Toshiba 6502 JP TV Sanyo 1% 1% -1% 0% 0% 0% 1% 1% SANYO Electric 6764 JP TV Sharp 1% 1% -1% 6% 0% 0% 3% 1% Sharp 6753 JP
February 2014
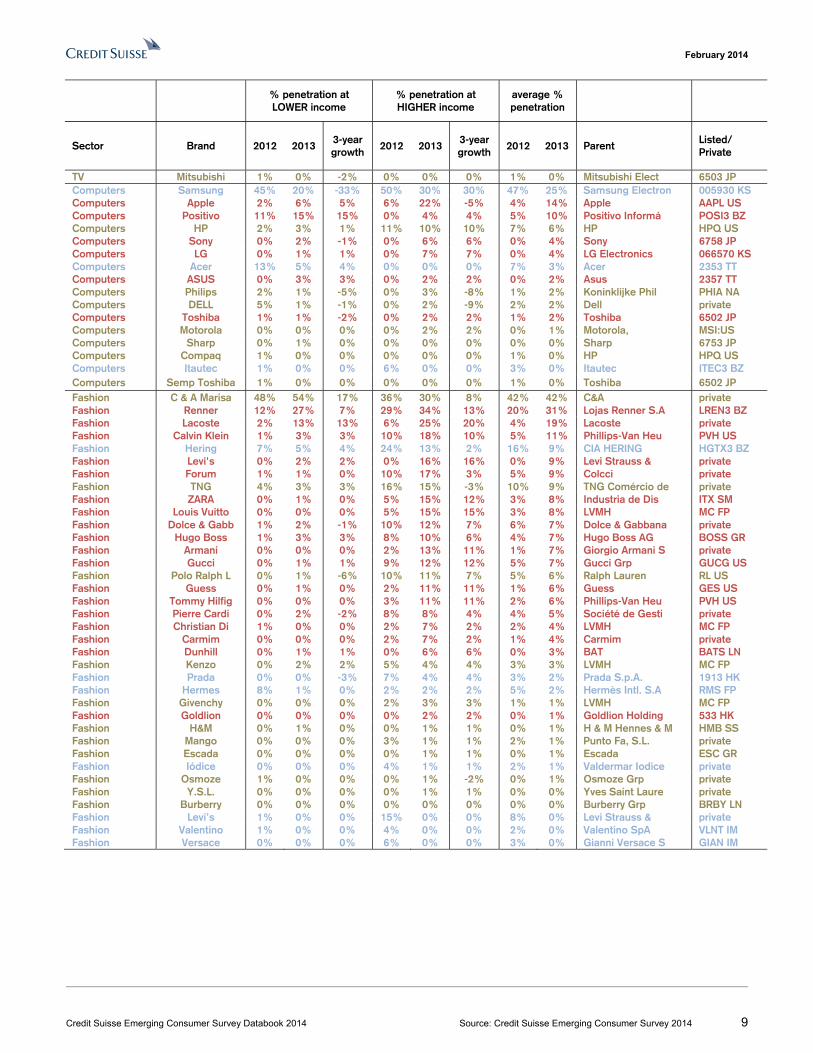
Credit Suisse Emerging Consumer Survey Databook 2014 Source: Credit Suisse Emerging Consumer Survey 2014 9
% penetration at LOWER income
% penetration at HIGHER income
average % penetration
Sector Brand 2012 2013 3-year growth
2012 2013 3-year growth
2012 2013 Parent Listed/ Private
TV Mitsubishi 1% 0% -2% 0% 0% 0% 1% 0% Mitsubishi Elect 6503 JP Computers Samsung 45% 20% -33% 50% 30% 30% 47% 25% Samsung Electron 005930 KS Computers Apple 2% 6% 5% 6% 22% -5% 4% 14% Apple AAPL US Computers Positivo 11% 15% 15% 0% 4% 4% 5% 10% Positivo Informá POSI3 BZ Computers HP 2% 3% 1% 11% 10% 10% 7% 6% HP HPQ US Computers Sony 0% 2% -1% 0% 6% 6% 0% 4% Sony 6758 JP Computers LG 0% 1% 1% 0% 7% 7% 0% 4% LG Electronics 066570 KS Computers Acer 13% 5% 4% 0% 0% 0% 7% 3% Acer 2353 TT Computers ASUS 0% 3% 3% 0% 2% 2% 0% 2% Asus 2357 TT Computers Philips 2% 1% -5% 0% 3% -8% 1% 2% Koninklijke Phil PHIA NA Computers DELL 5% 1% -1% 0% 2% -9% 2% 2% Dell private Computers Toshiba 1% 1% -2% 0% 2% 2% 1% 2% Toshiba 6502 JP Computers Motorola 0% 0% 0% 0% 2% 2% 0% 1% Motorola, MSI:US Computers Sharp 0% 1% 0% 0% 0% 0% 0% 0% Sharp 6753 JP Computers Compaq 1% 0% 0% 0% 0% 0% 1% 0% HP HPQ US Computers Itautec 1% 0% 0% 6% 0% 0% 3% 0% Itautec ITEC3 BZ Computers Semp Toshiba 1% 0% 0% 0% 0% 0% 1% 0% Toshiba 6502 JP Fashion C & A Marisa 48% 54% 17% 36% 30% 8% 42% 42% C&A private Fashion Renner 12% 27% 7% 29% 34% 13% 20% 31% Lojas Renner S.A LREN3 BZ Fashion Lacoste 2% 13% 13% 6% 25% 20% 4% 19% Lacoste private Fashion Calvin Klein 1% 3% 3% 10% 18% 10% 5% 11% Phillips-Van Heu PVH US Fashion Hering 7% 5% 4% 24% 13% 2% 16% 9% CIA HERING HGTX3 BZ Fashion Levi's 0% 2% 2% 0% 16% 16% 0% 9% Levi Strauss & private Fashion Forum 1% 1% 0% 10% 17% 3% 5% 9% Colcci private Fashion TNG 4% 3% 3% 16% 15% -3% 10% 9% TNG Comércio de private Fashion ZARA 0% 1% 0% 5% 15% 12% 3% 8% Industria de Dis ITX SM Fashion Louis Vuitto 0% 0% 0% 5% 15% 15% 3% 8% LVMH MC FP Fashion Dolce & Gabb 1% 2% -1% 10% 12% 7% 6% 7% Dolce & Gabbana private Fashion Hugo Boss 1% 3% 3% 8% 10% 6% 4% 7% Hugo Boss AG BOSS GR Fashion Armani 0% 0% 0% 2% 13% 11% 1% 7% Giorgio Armani S private Fashion Gucci 0% 1% 1% 9% 12% 12% 5% 7% Gucci Grp GUCG US Fashion Polo Ralph L 0% 1% -6% 10% 11% 7% 5% 6% Ralph Lauren RL US Fashion Guess 0% 1% 0% 2% 11% 11% 1% 6% Guess GES US Fashion Tommy Hilfig 0% 0% 0% 3% 11% 11% 2% 6% Phillips-Van Heu PVH US Fashion Pierre Cardi 0% 2% -2% 8% 8% 4% 4% 5% Société de Gesti private Fashion Christian Di 1% 0% 0% 2% 7% 2% 2% 4% LVMH MC FP Fashion Carmim 0% 0% 0% 2% 7% 2% 1% 4% Carmim private Fashion Dunhill 0% 1% 1% 0% 6% 6% 0% 3% BAT BATS LN Fashion Kenzo 0% 2% 2% 5% 4% 4% 3% 3% LVMH MC FP Fashion Prada 0% 0% -3% 7% 4% 4% 3% 2% Prada S.p.A. 1913 HK Fashion Hermes 8% 1% 0% 2% 2% 2% 5% 2% Hermès Intl. S.A RMS FP Fashion Givenchy 0% 0% 0% 2% 3% 3% 1% 1% LVMH MC FP Fashion Goldlion 0% 0% 0% 0% 2% 2% 0% 1% Goldlion Holding 533 HK Fashion H&M 0% 1% 0% 0% 1% 1% 0% 1% H & M Hennes & M HMB SS Fashion Mango 0% 0% 0% 3% 1% 1% 2% 1% Punto Fa, S.L. private Fashion Escada 0% 0% 0% 0% 1% 1% 0% 1% Escada ESC GR Fashion Iódice 0% 0% 0% 4% 1% 1% 2% 1% Valdermar Iodice private Fashion Osmoze 1% 0% 0% 0% 1% -2% 0% 1% Osmoze Grp private Fashion Y.S.L. 0% 0% 0% 0% 1% 1% 0% 0% Yves Saint Laure private Fashion Burberry 0% 0% 0% 0% 0% 0% 0% 0% Burberry Grp BRBY LN Fashion Levi’s 1% 0% 0% 15% 0% 0% 8% 0% Levi Strauss & private Fashion Valentino 1% 0% 0% 4% 0% 0% 2% 0% Valentino SpA VLNT IM Fashion Versace 0% 0% 0% 6% 0% 0% 3% 0% Gianni Versace S GIAN IM

February 2014
Credit Suisse Emerging Consumer Survey Databook 2014 Source: Credit Suisse Emerging Consumer Survey 2014 10
Brazil: Demographics Figure 1: A6. Could you please tell me your age? Figure 2: N2. What is your total after tax monthly income?
Note: Sample size: 1,500 respondents across 5 geographical regions
Figure 3: Urban / Rural split Figure 4: Male / Female split
Figure 5: A9. How many people live in your household? % of respondents (by income bracket)
Total Less than
R$ 489
R$ 490 - 1,142
R$ 1,142 - 1,630
R$ 1,631 - 3,260
R$ 3,261 - 4,890
R$ 4,891 - 6,520
R$ 6,521 - 8,150
R$ 8,151 - 11,410
More than R
$ 11,411
Would prefer not to answer
D.K
1 5 0 15 8 4 4 0 0 0 0 6 22 17 25 21 19 18 15 17 12 6 7 17 12
3 29 38 26 29 31 31 34 20 24 23 24 23
4 29 38 20 24 30 29 27 43 30 28 30 26
5 or more 21 0 19 20 17 20 23 25 40 42 24 37
Mean 3.46 3.13 3.06 3.29 3.40 3.47 3.56 3.80 4.04 4.05 3.49 3.84
32
41
1710
0
10
20
30
40
50
18-29 30-45 46-55 56-65
% o
f res
pond
ents
8
15
34
148
5 3 3
0
10
20
30
40
Be
twee
n R
$49
0 -
R$
1,14
1
Be
twee
n R
$1,
142
- R
$1,
630
Be
twee
n R
$1,
631
- R
$3,
260
Be
twee
n R
$3,
261
- R
$4,
890
Be
twee
n R
$4,
891
- R
$6,
520
Be
twee
n R
$6,
521
- R
$8,
150
Be
twee
n R
$8,
151
- R
$11
,410
Mor
e th
anR
$ 11
,411
% o
f res
pond
ents
30
70
0
20
40
60
80
100
Rural Urban
% o
f res
pond
ents
50 50
0
10
20
30
40
50
60
Male Female
% o
f res
pond
ents
February 2014
Credit Suisse Emerging Consumer Survey Databook 2014 Source: Credit Suisse Emerging Consumer Survey 2014 11
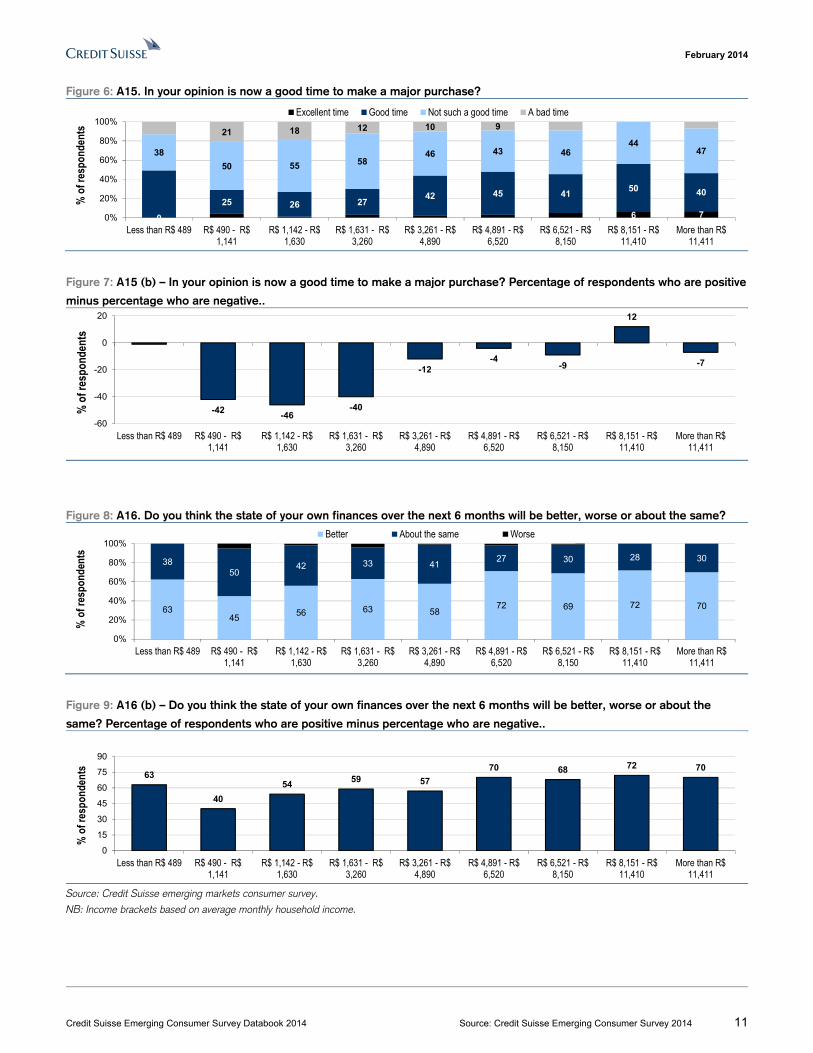
Figure 6: A15. In your opinion is now a good time to make a major purchase?
Figure 7: A15 (b) – In your opinion is now a good time to make a major purchase? Percentage of respondents who are positive
minus percentage who are negative..
Figure 8: A16. Do you think the state of your own finances over the next 6 months will be better, worse or about the same?
Figure 9: A16 (b) – Do you think the state of your own finances over the next 6 months will be better, worse or about the
same? Percentage of respondents who are positive minus percentage who are negative..
Source: Credit Suisse emerging markets consumer survey.
NB: Income brackets based on average monthly household income.
0 6 725 26 27
42 45 4150 40
38
50 55 5846 43 46
4447
21 18 12 10 9
0%
20%
40%
60%
80%
100%
Less than R$ 489 R$ 490 - R$1,141
R$ 1,142 - R$1,630
R$ 1,631 - R$3,260
R$ 3,261 - R$4,890
R$ 4,891 - R$6,520
R$ 6,521 - R$8,150
R$ 8,151 - R$11,410
More than R$11,411
% o
f res
pond
ents
Excellent time Good time Not such a good time A bad time
-42-46
-40
-12-4
-9
12
-7
-60
-40
-20
0
20
Less than R$ 489 R$ 490 - R$1,141
R$ 1,142 - R$1,630
R$ 1,631 - R$3,260
R$ 3,261 - R$4,890
R$ 4,891 - R$6,520
R$ 6,521 - R$8,150
R$ 8,151 - R$11,410
More than R$11,411
% o
f res
pond
ents
6345
56 63 5872 69 72 70
3850
42 33 4127 30 28 30
0%
20%
40%
60%
80%
100%
Less than R$ 489 R$ 490 - R$1,141
R$ 1,142 - R$1,630
R$ 1,631 - R$3,260
R$ 3,261 - R$4,890
R$ 4,891 - R$6,520
R$ 6,521 - R$8,150
R$ 8,151 - R$11,410
More than R$11,411
% o
f res
pond
ents
Better About the same Worse
63
40
5459 57
70 68 72 70
0
15
30
45
60
75
90
Less than R$ 489 R$ 490 - R$1,141
R$ 1,142 - R$1,630
R$ 1,631 - R$3,260
R$ 3,261 - R$4,890
R$ 4,891 - R$6,520
R$ 6,521 - R$8,150
R$ 8,151 - R$11,410
More than R$11,411
% o
f res
pond
ents
February 2014
Credit Suisse Emerging Consumer Survey Databook 2014 Source: Credit Suisse Emerging Consumer Survey 2014 12
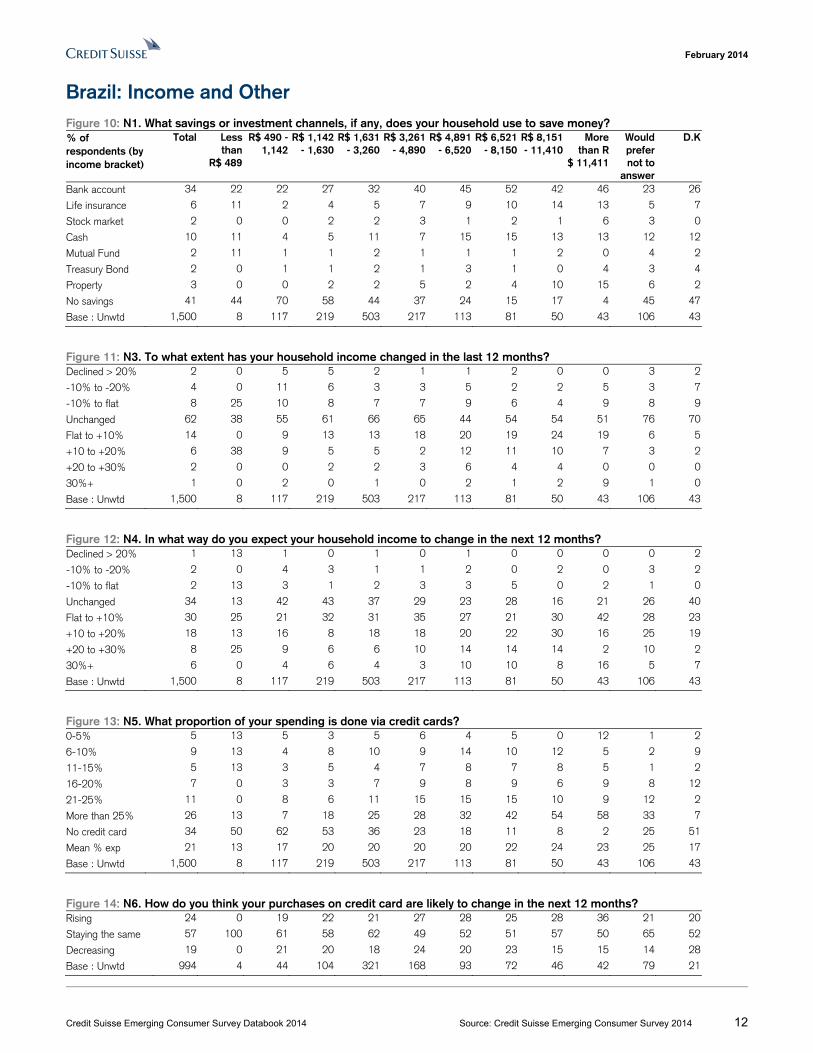
Brazil: Income and Other Figure 10: N1. What savings or investment channels, if any, does your household use to save money? % of respondents (by income bracket)
Total Less than
R$ 489
R$ 490 - 1,142
R$ 1,142 - 1,630
R$ 1,631 - 3,260
R$ 3,261 - 4,890
R$ 4,891 - 6,520
R$ 6,521 - 8,150
R$ 8,151 - 11,410
More than R
$ 11,411
Would prefer not to
answer
D.K
Bank account 34 22 22 27 32 40 45 52 42 46 23 26
Life insurance 6 11 2 4 5 7 9 10 14 13 5 7
Stock market 2 0 0 2 2 3 1 2 1 6 3 0
Cash 10 11 4 5 11 7 15 15 13 13 12 12
Mutual Fund 2 11 1 1 2 1 1 1 2 0 4 2
Treasury Bond 2 0 1 1 2 1 3 1 0 4 3 4
Property 3 0 0 2 2 5 2 4 10 15 6 2
No savings 41 44 70 58 44 37 24 15 17 4 45 47
Base : Unwtd 1,500 8 117 219 503 217 113 81 50 43 106 43
Figure 11: N3. To what extent has your household income changed in the last 12 months? Declined > 20% 2 0 5 5 2 1 1 2 0 0 3 2
-10% to -20% 4 0 11 6 3 3 5 2 2 5 3 7
-10% to flat 8 25 10 8 7 7 9 6 4 9 8 9
Unchanged 62 38 55 61 66 65 44 54 54 51 76 70
Flat to +10% 14 0 9 13 13 18 20 19 24 19 6 5
+10 to +20% 6 38 9 5 5 2 12 11 10 7 3 2
+20 to +30% 2 0 0 2 2 3 6 4 4 0 0 0
30%+ 1 0 2 0 1 0 2 1 2 9 1 0
Base : Unwtd 1,500 8 117 219 503 217 113 81 50 43 106 43
Figure 12: N4. In what way do you expect your household income to change in the next 12 months? Declined > 20% 1 13 1 0 1 0 1 0 0 0 0 2
-10% to -20% 2 0 4 3 1 1 2 0 2 0 3 2
-10% to flat 2 13 3 1 2 3 3 5 0 2 1 0
Unchanged 34 13 42 43 37 29 23 28 16 21 26 40
Flat to +10% 30 25 21 32 31 35 27 21 30 42 28 23
+10 to +20% 18 13 16 8 18 18 20 22 30 16 25 19
+20 to +30% 8 25 9 6 6 10 14 14 14 2 10 2
30%+ 6 0 4 6 4 3 10 10 8 16 5 7
Base : Unwtd 1,500 8 117 219 503 217 113 81 50 43 106 43
Figure 13: N5. What proportion of your spending is done via credit cards? 0-5% 5 13 5 3 5 6 4 5 0 12 1 2
6-10% 9 13 4 8 10 9 14 10 12 5 2 9
11-15% 5 13 3 5 4 7 8 7 8 5 1 2
16-20% 7 0 3 3 7 9 8 9 6 9 8 12
21-25% 11 0 8 6 11 15 15 15 10 9 12 2
More than 25% 26 13 7 18 25 28 32 42 54 58 33 7
No credit card 34 50 62 53 36 23 18 11 8 2 25 51
Mean % exp 21 13 17 20 20 20 20 22 24 23 25 17
Base : Unwtd 1,500 8 117 219 503 217 113 81 50 43 106 43
Figure 14: N6. How do you think your purchases on credit card are likely to change in the next 12 months? Rising 24 0 19 22 21 27 28 25 28 36 21 20
Staying the same 57 100 61 58 62 49 52 51 57 50 65 52
Decreasing 19 0 21 20 18 24 20 23 15 15 14 28
Base : Unwtd 994 4 44 104 321 168 93 72 46 42 79 21
February 2014
Credit Suisse Emerging Consumer Survey Databook 2014 Source: Credit Suisse Emerging Consumer Survey 2014 13
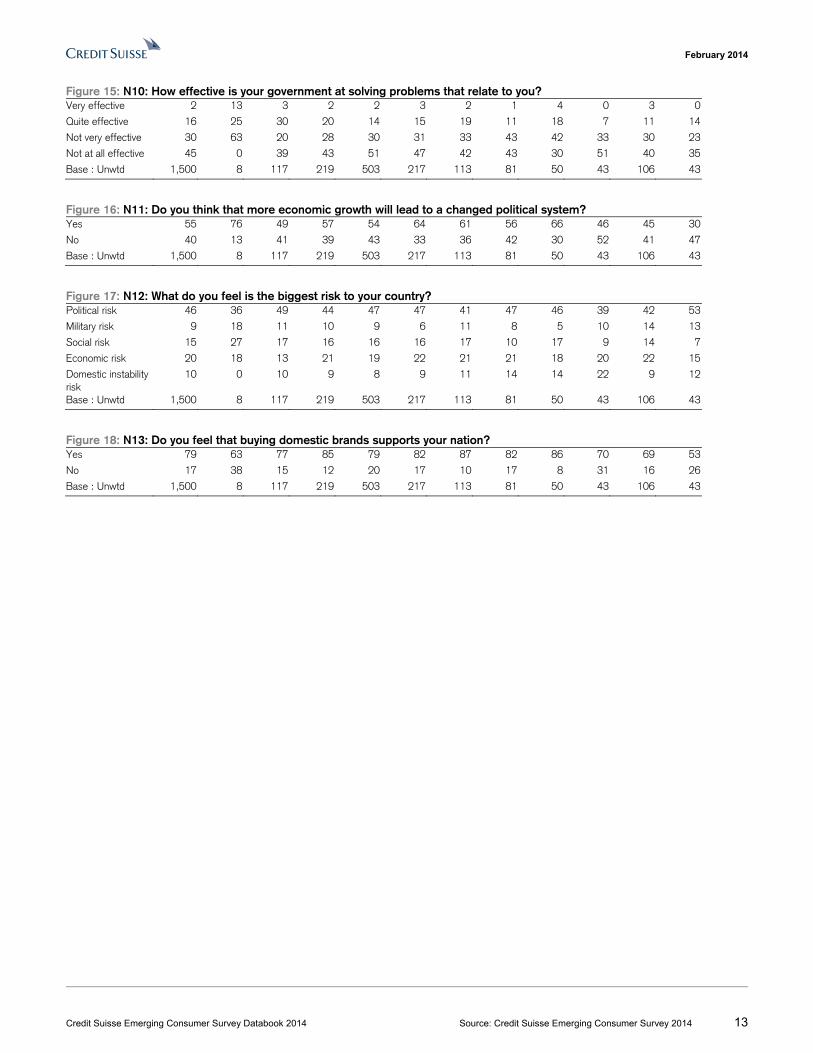
Figure 15: N10: How effective is your government at solving problems that relate to you? Very effective 2 13 3 2 2 3 2 1 4 0 3 0
Quite effective 16 25 30 20 14 15 19 11 18 7 11 14
Not very effective 30 63 20 28 30 31 33 43 42 33 30 23
Not at all effective 45 0 39 43 51 47 42 43 30 51 40 35
Base : Unwtd 1,500 8 117 219 503 217 113 81 50 43 106 43
Figure 16: N11: Do you think that more economic growth will lead to a changed political system? Yes 55 76 49 57 54 64 61 56 66 46 45 30
No 40 13 41 39 43 33 36 42 30 52 41 47
Base : Unwtd 1,500 8 117 219 503 217 113 81 50 43 106 43
Figure 17: N12: What do you feel is the biggest risk to your country? Political risk 46 36 49 44 47 47 41 47 46 39 42 53
Military risk 9 18 11 10 9 6 11 8 5 10 14 13
Social risk 15 27 17 16 16 16 17 10 17 9 14 7
Economic risk 20 18 13 21 19 22 21 21 18 20 22 15
Domestic instability risk
10 0 10 9 8 9 11 14 14 22 9 12
Base : Unwtd 1,500 8 117 219 503 217 113 81 50 43 106 43
Figure 18: N13: Do you feel that buying domestic brands supports your nation? Yes 79 63 77 85 79 82 87 82 86 70 69 53
No 17 38 15 12 20 17 10 17 8 31 16 26
Base : Unwtd 1,500 8 117 219 503 217 113 81 50 43 106 43
February 2014
Credit Suisse Emerging Consumer Survey Databook 2014 Source: Credit Suisse Emerging Consumer Survey 2014 14
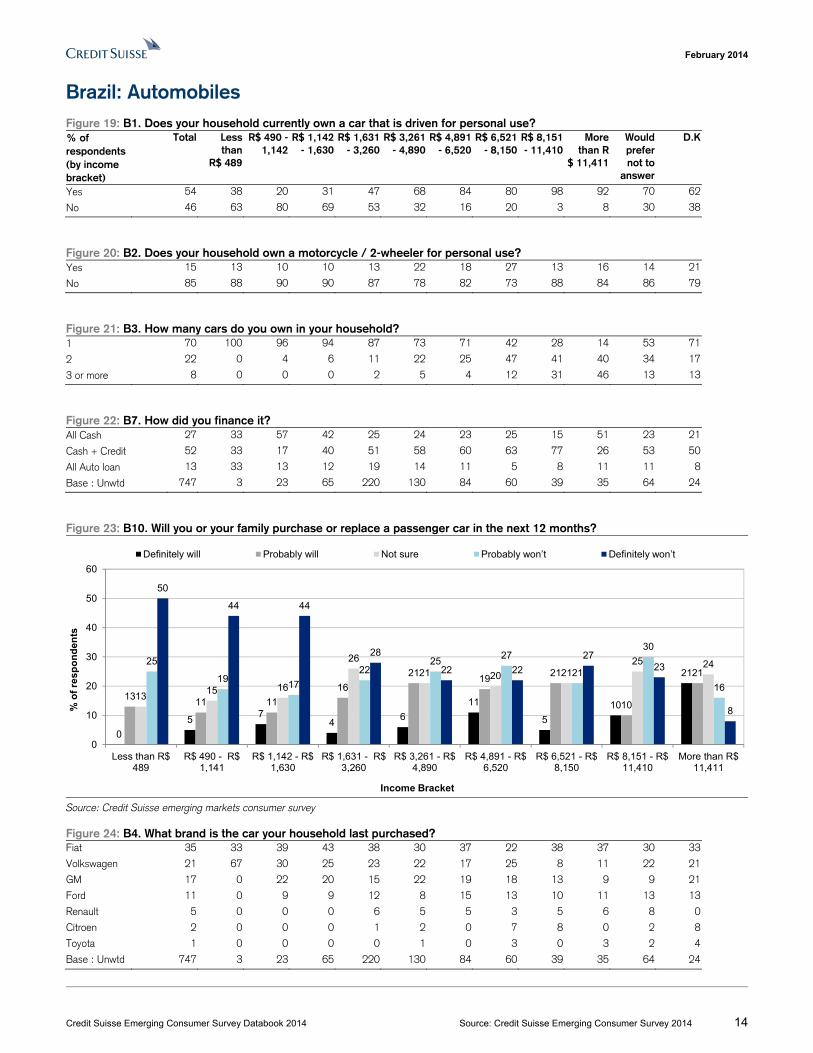
Brazil: Automobiles Figure 19: B1. Does your household currently own a car that is driven for personal use? % of respondents (by income bracket)
Total Less than
R$ 489
R$ 490 - 1,142
R$ 1,142 - 1,630
R$ 1,631 - 3,260
R$ 3,261 - 4,890
R$ 4,891 - 6,520
R$ 6,521 - 8,150
R$ 8,151 - 11,410
More than R
$ 11,411
Would prefer not to
answer
D.K
Yes 54 38 20 31 47 68 84 80 98 92 70 62
No 46 63 80 69 53 32 16 20 3 8 30 38
Figure 20: B2. Does your household own a motorcycle / 2-wheeler for personal use? Yes 15 13 10 10 13 22 18 27 13 16 14 21
No 85 88 90 90 87 78 82 73 88 84 86 79
Figure 21: B3. How many cars do you own in your household? 1 70 100 96 94 87 73 71 42 28 14 53 71
2 22 0 4 6 11 22 25 47 41 40 34 17
3 or more 8 0 0 0 2 5 4 12 31 46 13 13
Figure 22: B7. How did you finance it? All Cash 27 33 57 42 25 24 23 25 15 51 23 21
Cash + Credit 52 33 17 40 51 58 60 63 77 26 53 50
All Auto loan 13 33 13 12 19 14 11 5 8 11 11 8
Base : Unwtd 747 3 23 65 220 130 84 60 39 35 64 24
Figure 23: B10. Will you or your family purchase or replace a passenger car in the next 12 months?
Source: Credit Suisse emerging markets consumer survey
Figure 24: B4. What brand is the car your household last purchased? Fiat 35 33 39 43 38 30 37 22 38 37 30 33
Volkswagen 21 67 30 25 23 22 17 25 8 11 22 21
GM 17 0 22 20 15 22 19 18 13 9 9 21
Ford 11 0 9 9 12 8 15 13 10 11 13 13
Renault 5 0 0 0 6 5 5 3 5 6 8 0
Citroen 2 0 0 0 1 2 0 7 8 0 2 8
Toyota 1 0 0 0 0 1 0 3 0 3 2 4
Base : Unwtd 747 3 23 65 220 130 84 60 39 35 64 24
0
57
46
11
5
10
21
1311 11
16
2119
21
10
21
1315 16
26
21 20 2125 2425
1917
2225
27
21
30
16
50
44 44
28
22 22
2723
8
0
10
20
30
40
50
60
Less than R$489
R$ 490 - R$1,141
R$ 1,142 - R$1,630
R$ 1,631 - R$3,260
R$ 3,261 - R$4,890
R$ 4,891 - R$6,520
R$ 6,521 - R$8,150
R$ 8,151 - R$11,410
More than R$11,411
% o
f re
spo
nd
ents
Income Bracket
Definitely will Probably will Not sure Probably won’t Definitely won’t
February 2014
Credit Suisse Emerging Consumer Survey Databook 2014 Source: Credit Suisse Emerging Consumer Survey 2014 15
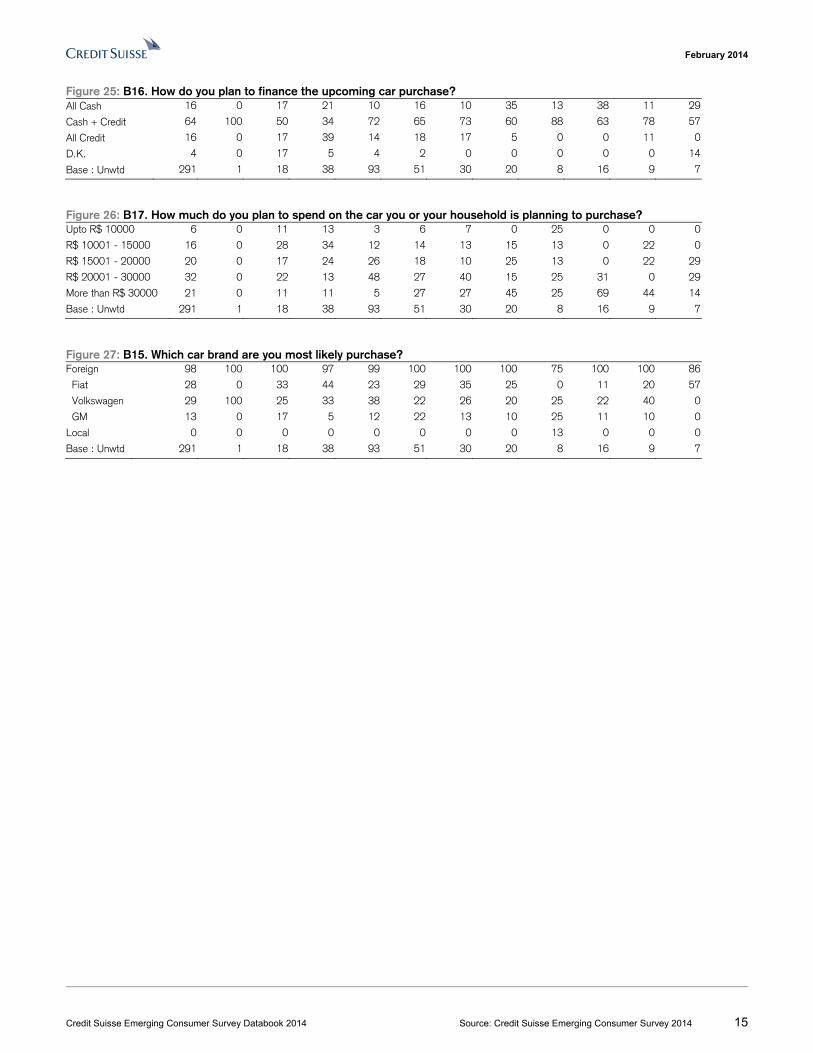
Figure 25: B16. How do you plan to finance the upcoming car purchase? All Cash 16 0 17 21 10 16 10 35 13 38 11 29
Cash + Credit 64 100 50 34 72 65 73 60 88 63 78 57
All Credit 16 0 17 39 14 18 17 5 0 0 11 0
D.K. 4 0 17 5 4 2 0 0 0 0 0 14
Base : Unwtd 291 1 18 38 93 51 30 20 8 16 9 7
Figure 26: B17. How much do you plan to spend on the car you or your household is planning to purchase? Upto R$ 10000 6 0 11 13 3 6 7 0 25 0 0 0
R$ 10001 - 15000 16 0 28 34 12 14 13 15 13 0 22 0
R$ 15001 - 20000 20 0 17 24 26 18 10 25 13 0 22 29
R$ 20001 - 30000 32 0 22 13 48 27 40 15 25 31 0 29
More than R$ 30000 21 0 11 11 5 27 27 45 25 69 44 14
Base : Unwtd 291 1 18 38 93 51 30 20 8 16 9 7
Figure 27: B15. Which car brand are you most likely purchase? Foreign 98 100 100 97 99 100 100 100 75 100 100 86
Fiat 28 0 33 44 23 29 35 25 0 11 20 57
Volkswagen 29 100 25 33 38 22 26 20 25 22 40 0
GM 13 0 17 5 12 22 13 10 25 11 10 0
Local 0 0 0 0 0 0 0 0 13 0 0 0
Base : Unwtd 291 1 18 38 93 51 30 20 8 16 9 7
February 2014
Credit Suisse Emerging Consumer Survey Databook 2014 Source: Credit Suisse Emerging Consumer Survey 2014 16
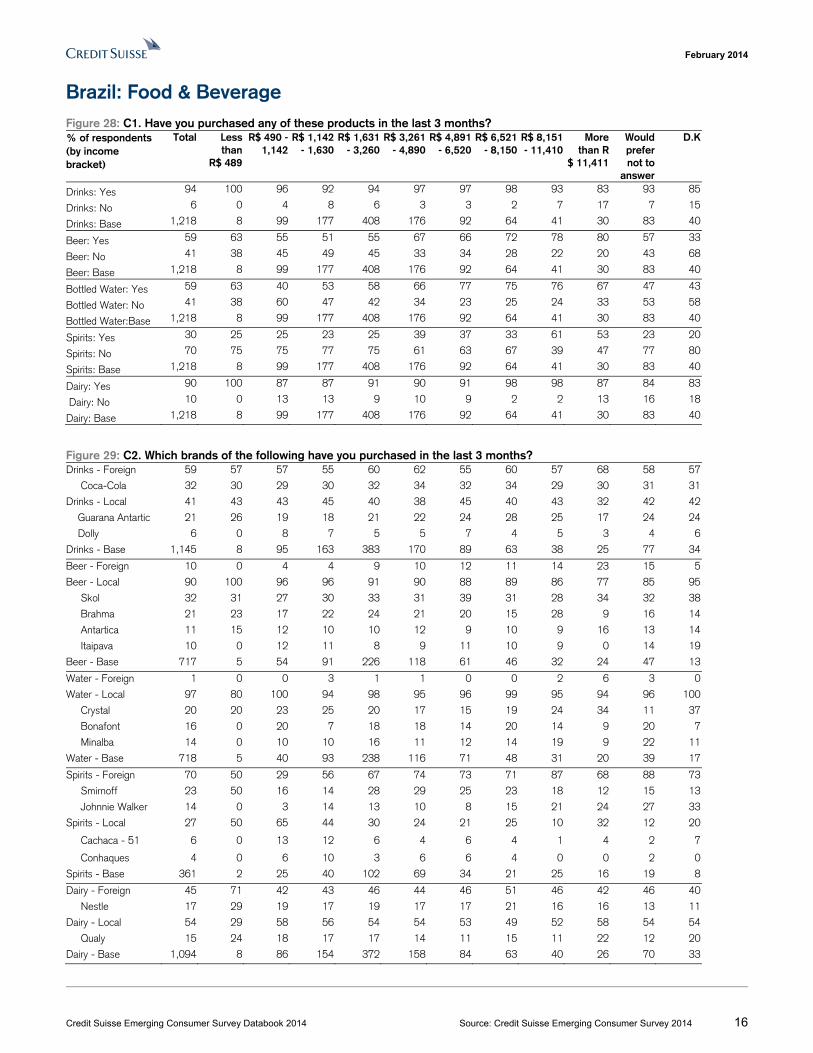
Brazil: Food & Beverage Figure 28: C1. Have you purchased any of these products in the last 3 months? % of respondents (by income bracket)
Total Less than
R$ 489
R$ 490 - 1,142
R$ 1,142 - 1,630
R$ 1,631 - 3,260
R$ 3,261 - 4,890
R$ 4,891 - 6,520
R$ 6,521 - 8,150
R$ 8,151 - 11,410
More than R
$ 11,411
Would prefer not to
answer
D.K
Drinks: Yes 94 100 96 92 94 97 97 98 93 83 93 85
Drinks: No 6 0 4 8 6 3 3 2 7 17 7 15
Drinks: Base 1,218 8 99 177 408 176 92 64 41 30 83 40
Beer: Yes 59 63 55 51 55 67 66 72 78 80 57 33
Beer: No 41 38 45 49 45 33 34 28 22 20 43 68
Beer: Base 1,218 8 99 177 408 176 92 64 41 30 83 40
Bottled Water: Yes 59 63 40 53 58 66 77 75 76 67 47 43
Bottled Water: No 41 38 60 47 42 34 23 25 24 33 53 58
Bottled Water:Base 1,218 8 99 177 408 176 92 64 41 30 83 40
Spirits: Yes 30 25 25 23 25 39 37 33 61 53 23 20
Spirits: No 70 75 75 77 75 61 63 67 39 47 77 80
Spirits: Base 1,218 8 99 177 408 176 92 64 41 30 83 40
Dairy: Yes 90 100 87 87 91 90 91 98 98 87 84 83
Dairy: No 10 0 13 13 9 10 9 2 2 13 16 18
Dairy: Base 1,218 8 99 177 408 176 92 64 41 30 83 40
Figure 29: C2. Which brands of the following have you purchased in the last 3 months? Drinks - Foreign 59 57 57 55 60 62 55 60 57 68 58 57
Coca-Cola 32 30 29 30 32 34 32 34 29 30 31 31
Drinks - Local 41 43 43 45 40 38 45 40 43 32 42 42
Guarana Antartic 21 26 19 18 21 22 24 28 25 17 24 24
Dolly 6 0 8 7 5 5 7 4 5 3 4 6
Drinks - Base 1,145 8 95 163 383 170 89 63 38 25 77 34
Beer - Foreign 10 0 4 4 9 10 12 11 14 23 15 5
Beer - Local 90 100 96 96 91 90 88 89 86 77 85 95
Skol 32 31 27 30 33 31 39 31 28 34 32 38
Brahma 21 23 17 22 24 21 20 15 28 9 16 14
Antartica 11 15 12 10 10 12 9 10 9 16 13 14
Itaipava 10 0 12 11 8 9 11 10 9 0 14 19
Beer - Base 717 5 54 91 226 118 61 46 32 24 47 13
Water - Foreign 1 0 0 3 1 1 0 0 2 6 3 0
Water - Local 97 80 100 94 98 95 96 99 95 94 96 100
Crystal 20 20 23 25 20 17 15 19 24 34 11 37
Bonafont 16 0 20 7 18 18 14 20 14 9 20 7
Minalba 14 0 10 10 16 11 12 14 19 9 22 11
Water - Base 718 5 40 93 238 116 71 48 31 20 39 17
Spirits - Foreign 70 50 29 56 67 74 73 71 87 68 88 73
Smirnoff 23 50 16 14 28 29 25 23 18 12 15 13
Johnnie Walker 14 0 3 14 13 10 8 15 21 24 27 33
Spirits - Local 27 50 65 44 30 24 21 25 10 32 12 20
Cachaca - 51 6 0 13 12 6 4 6 4 1 4 2 7
Conhaques 4 0 6 10 3 6 6 4 0 0 2 0
Spirits - Base 361 2 25 40 102 69 34 21 25 16 19 8
Dairy - Foreign 45 71 42 43 46 44 46 51 46 42 46 40
Nestle 17 29 19 17 19 17 17 21 16 16 13 11
Dairy - Local 54 29 58 56 54 54 53 49 52 58 54 54
Qualy 15 24 18 17 17 14 11 15 11 22 12 20
Dairy - Base 1,094 8 86 154 372 158 84 63 40 26 70 33
February 2014
Credit Suisse Emerging Consumer Survey Databook 2014 Source: Credit Suisse Emerging Consumer Survey 2014 17
Figure 30: C3. Do you expect to spend more on any of these products in the next 12 months? % of respondents (by income bracket)
Total Less than
R$ 489
R$ 490 - 1,142
R$ 1,142 - 1,630
R$ 1,631 - 3,260
R$ 3,261 - 4,890
R$ 4,891 - 6,520
R$ 6,521 - 8,150
R$ 8,151 - 11,410
More than R
$ 11,411
Would prefer not to
answer
D.K
Drinks: Yes 28 13 15 19 31 33 36 41 29 13 37 5
Drinks: No 72 88 85 81 69 67 64 59 71 87 63 95
Drinks: Base 1,218 8 99 177 408 176 92 64 41 30 83 40
Beer: Yes 16 0 18 12 16 14 16 25 22 17 20 5
Beer: No 84 100 82 88 84 86 84 75 78 83 80 95
Beer: Base 1,218 8 99 177 408 176 92 64 41 30 83 40
Water: Yes 31 0 18 21 31 41 41 44 37 30 29 8
Water: No 69 100 82 79 69 59 59 56 63 70 71 93
Water: Base 1,218 8 99 177 408 176 92 64 41 30 83 40
Spirits: Yes 7 0 6 8 5 7 10 11 10 10 6 3
Spirits: No 93 100 94 92 95 93 90 89 90 90 94 98
Spirits: Base 1,218 8 99 177 408 176 92 64 41 30 83 40
Dairy: Yes 39 25 28 27 40 44 48 53 46 37 47 18
Dairy: No 61 75 72 73 60 56 52 47 54 63 53 83
Dairy: Base 1,218 8 99 177 408 176 92 64 41 30 83 40
Figure 31: C4. What % of your diet is made up of meat? 0% 1 13 1 1 2 1 0 0 0 3 1 0
0-5% 11 38 19 18 9 10 5 13 20 7 2 5
6-15% 36 38 40 40 41 35 34 38 24 30 14 20
16-25% 24 0 19 20 25 26 28 16 32 23 33 23
More than 25% 21 13 11 14 18 23 29 31 22 30 33 30
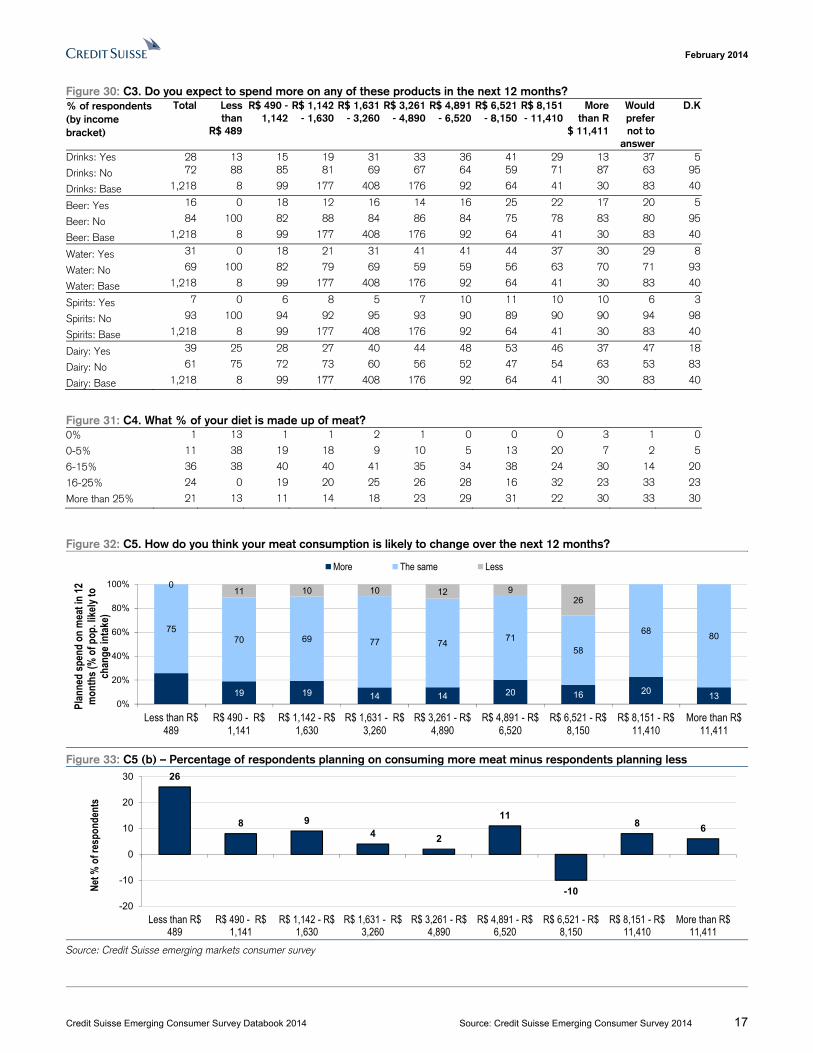
Figure 32: C5. How do you think your meat consumption is likely to change over the next 12 months?
Figure 33: C5 (b) – Percentage of respondents planning on consuming more meat minus respondents planning less
Source: Credit Suisse emerging markets consumer survey
19 19 14 14 20 16 2013
7570 69 77 74
71
58
6880
011 10 10 12 9
26
0%
20%
40%
60%
80%
100%
Less than R$489
R$ 490 - R$1,141
R$ 1,142 - R$1,630
R$ 1,631 - R$3,260
R$ 3,261 - R$4,890
R$ 4,891 - R$6,520
R$ 6,521 - R$8,150
R$ 8,151 - R$11,410
More than R$11,411
Plan
ned
spen
d on
mea
t in
12
mon
ths (
% o
f pop
. like
ly to
ch
ange
inta
ke)
More The same Less
26
8 94 2
11
-10
8 6
-20
-10
0
10
20
30
Less than R$489
R$ 490 - R$1,141
R$ 1,142 - R$1,630
R$ 1,631 - R$3,260
R$ 3,261 - R$4,890
R$ 4,891 - R$6,520
R$ 6,521 - R$8,150
R$ 8,151 - R$11,410
More than R$11,411
Net %
of r
espo
nden
ts
February 2014
Credit Suisse Emerging Consumer Survey Databook 2014 Source: Credit Suisse Emerging Consumer Survey 2014 18
Figure 34: C6. What level of inflation have you seen over the past 12 months on basic food and drink? Below 1% 1 0 1 0 1 2 0 0 0 0 0 0
1-3% 10 13 5 11 12 11 14 14 10 0 5 3
3-5% 16 0 15 13 17 18 26 20 24 30 4 5
5-7% 14 0 16 9 17 18 15 23 15 7 4 3
7-10% 12 0 10 11 14 10 15 5 12 23 11 8
Above 10% 28 75 25 39 26 27 21 30 22 20 28 40
Haven’t noticed any 5 0 2 3 4 4 4 5 7 0 22 3
D.K. 13 13 25 14 9 10 4 3 10 20 28 40
Base : Unwtd 1,218 8 99 177 408 176 92 64 41 30 83 40
Figure 35: C7. How sensitive are you to rising food and drink prices generally? Very sensitive 57 88 62 66 59 53 48 45 49 40 52 63
Somewhat sensitive 36 0 33 27 37 40 46 41 32 47 35 28
Somewhat not sensitive
7 13 5 7 4 6 7 14 17 13 13 5
Not at all sensitive 0 0 0 0 0 0 0 0 2 0 0 5
Base : Unwtd 1,218 8 99 177 408 176 92 64 41 30 83 40
February 2014
Credit Suisse Emerging Consumer Survey Databook 2014 Source: Credit Suisse Emerging Consumer Survey 2014 19
Brazil: Home & Personal Care Figure 36: E1. Have you purchased any of these products in the last 3 months? % of respondents (by income bracket)
Total Less than
R$ 489
R$ 490 - 1,142
R$ 1,142 - 1,630
R$ 1,631 - 3,260
R$ 3,261 - 4,890
R$ 4,891 - 6,520
R$ 6,521 - 8,150
R$ 8,151 - 11,410
More than R
$ 11,411
Would prefer not to
answer
D.K
Tissues: Yes 91 100 95 94 93 88 92 90 89 83 81 78
Tissues: No 9 0 5 6 7 12 8 10 11 18 19 22
Tissues: Base 1,354 7 110 206 459 201 93 70 46 40 86 36
Fem Hygiene: Yes 85 40 83 82 85 82 98 85 83 94 91 91
Fem Hygiene: No 15 60 17 18 15 18 2 15 17 6 9 9
Fem Hygiene: Base 670 5 53 111 224 99 44 27 23 17 45 22
Cosmetics: Yes 82 57 75 77 85 82 87 91 78 78 78 75
Cosmetics: No 18 43 25 23 15 18 13 9 22 23 22 25
Cosmetics: Base 1,354 7 110 206 459 201 93 70 46 40 86 36
Figure 37: E2. Which brands have you purchased in the last 3 months? Tissues - Foreign 24 0 16 14 20 30 30 30 46 17 34 22
Scott 13 0 8 9 12 16 16 19 15 15 11 16
Kleenex 4 0 3 1 3 5 4 3 11 2 8 2
Tissues - Local 73 100 78 83 76 68 66 69 52 83 65 73 Personal 35 56 35 42 37 30 31 32 27 33 35 33
Neve 24 22 20 20 22 26 24 34 21 33 24 31
Tissues - Base 1,227 7 104 194 425 176 86 63 41 33 70 28
Fem Hygiene - Foreign 43 50 41 41 45 39 35 43 62 45 45 50
Always 32 0 35 34 34 28 24 22 31 30 37 41
Fem Hygiene - Local 56 50 56 59 54 60 65 57 38 50 55 50
Sempre Livre 25 0 27 35 23 30 24 22 12 20 14 26
Intimus Gel 16 0 12 12 16 16 22 19 12 10 23 21
Fem Hygiene - Base 570 2 44 91 190 81 43 23 19 16 41 20
Cosmetics - Foreign 62 60 65 64 60 61 57 61 66 61 67 67
Avon 17 40 27 22 17 17 14 10 10 12 12 26
Dove 12 0 11 12 11 11 13 14 11 13 13 13
Cosmetics - Local 38 40 35 35 40 38 42 39 34 39 33 32
Natura 21 20 20 19 24 21 23 19 14 21 19 22
Boticário 13 0 12 10 12 15 17 17 15 13 10 7
Cosmetics - Base 1,104 4 83 158 389 164 81 64 36 31 67 27
Figure 38: E3. Do you expect to spend more on any of these products in the next 12 months? Tissues: Yes 20 14 11 16 23 24 19 21 22 13 33 3
Tissues: Base 1,354 7 110 206 459 201 93 70 46 40 86 36
Fem Hygiene: Yes 15 0 8 10 20 13 20 22 17 24 18 0
Fem Hygiene: Base 670 5 53 111 224 99 44 27 23 17 45 22
Cosmetics: Yes 27 14 17 19 27 34 30 36 37 28 33 3Cosmetics: Base 1,354 7 110 206 459 201 93 70 46 40 86 36
February 2014
Credit Suisse Emerging Consumer Survey Databook 2014 Source: Credit Suisse Emerging Consumer Survey 2014 20
Brazil: Luxury Goods Figure 39: F9. Do you favour domestic brands, or do you favour western luxury brands? Domestic 36 100 44 47 40 29 36 25 8 16 24 19
Western 39 0 39 40 38 40 36 28 47 42 46 42
No preference 23 0 15 10 22 31 25 43 44 39 21 25
Base : Unwtd 1,229 7 104 191 411 169 83 67 38 31 92 36
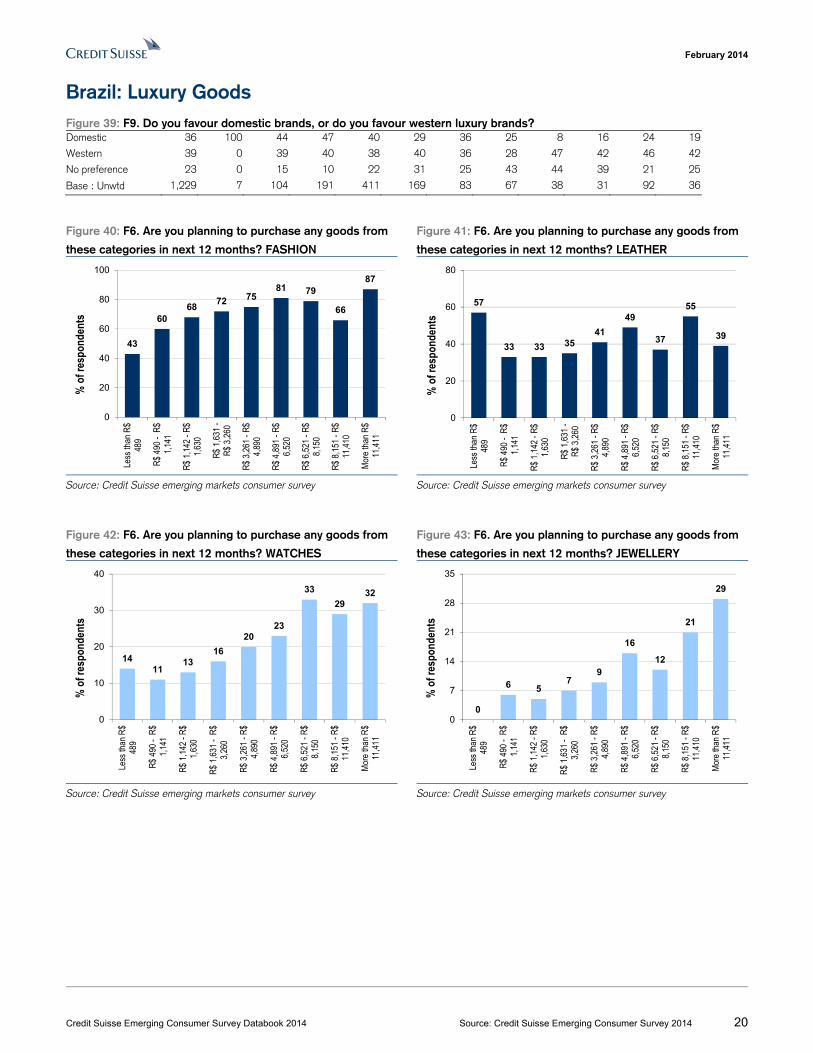
Figure 40: F6. Are you planning to purchase any goods from
these categories in next 12 months? FASHION
Figure 41: F6. Are you planning to purchase any goods from
these categories in next 12 months? LEATHER
Source: Credit Suisse emerging markets consumer survey Source: Credit Suisse emerging markets consumer survey
Figure 42: F6. Are you planning to purchase any goods from
these categories in next 12 months? WATCHES
Figure 43: F6. Are you planning to purchase any goods from
these categories in next 12 months? JEWELLERY
Source: Credit Suisse emerging markets consumer survey Source: Credit Suisse emerging markets consumer survey
43
6068
72 7581 79
66
87
0
20
40
60
80
100
Less
than
R$
489
R$
490
- R
$1,
141
R$
1,14
2 - R
$1,
630
R$
1,63
1 -
R$
3,26
0
R$
3,26
1 - R
$4,
890
R$
4,89
1 - R
$6,
520
R$
6,52
1 - R
$8,
150
R$
8,15
1 - R
$11
,410
Mor
e th
an R
$11
,411
% o
f res
pond
ents
57
33 33 3541
49
37
55
39
0
20
40
60
80
Less
than
R$
489
R$
490
- R
$1,
141
R$
1,14
2 - R
$1,
630
R$
1,63
1 -
R$
3,26
0
R$
3,26
1 - R
$4,
890
R$
4,89
1 - R
$6,
520
R$
6,52
1 - R
$8,
150
R$
8,15
1 - R
$11
,410
Mor
e th
an R
$11
,411
% o
f res
pond
ents
1411
1316
2023
33
2932
0
10
20
30
40
Less
than
R$
489
R$
490
- R
$1,
141
R$
1,14
2 - R
$1,
630
R$
1,63
1 -
R$
3,26
0
R$
3,26
1 - R
$4,
890
R$
4,89
1 - R
$6,
520
R$
6,52
1 - R
$8,
150
R$
8,15
1 - R
$11
,410
Mor
e th
an R
$11
,411
% o
f res
pond
ents
0
6 57
9
16
12
21
29
0
7
14
21
28
35
Less
than
R$
489
R$
490
- R
$1,
141
R$
1,14
2 - R
$1,
630
R$
1,63
1 -
R$
3,26
0
R$
3,26
1 - R
$4,
890
R$
4,89
1 - R
$6,
520
R$
6,52
1 - R
$8,
150
R$
8,15
1 - R
$11
,410
Mor
e th
an R
$11
,411
% o
f res
pond
ents
February 2014
Credit Suisse Emerging Consumer Survey Databook 2014 Source: Credit Suisse Emerging Consumer Survey 2014 21
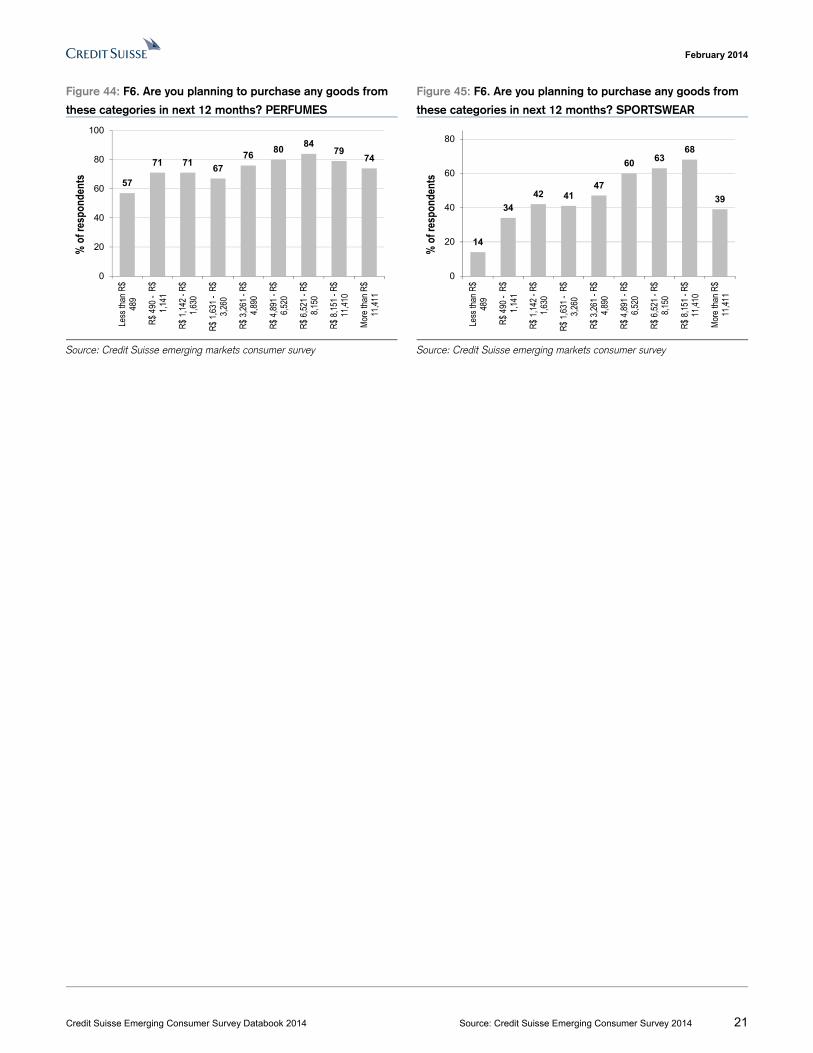
Figure 44: F6. Are you planning to purchase any goods from
these categories in next 12 months? PERFUMES
Figure 45: F6. Are you planning to purchase any goods from
these categories in next 12 months? SPORTSWEAR
Source: Credit Suisse emerging markets consumer survey Source: Credit Suisse emerging markets consumer survey
57
71 7167
7680
8479
74
0
20
40
60
80
100Le
ss th
an R
$48
9
R$
490
- R
$1,
141
R$
1,14
2 - R
$1,
630
R$
1,63
1 -
R$
3,26
0
R$
3,26
1 - R
$4,
890
R$
4,89
1 - R
$6,
520
R$
6,52
1 - R
$8,
150
R$
8,15
1 - R
$11
,410
Mor
e th
an R
$11
,411
% o
f res
pond
ents
14
34
42 4147
60 6368
39
0
20
40
60
80
Less
than
R$
489
R$
490
- R
$1,
141
R$
1,14
2 - R
$1,
630
R$
1,63
1 -
R$
3,26
0
R$
3,26
1 - R
$4,
890
R$
4,89
1 - R
$6,
520
R$
6,52
1 - R
$8,
150
R$
8,15
1 - R
$11
,410
Mor
e th
an R
$11
,411
% o
f res
pond
ents
February 2014
Credit Suisse Emerging Consumer Survey Databook 2014 Source: Credit Suisse Emerging Consumer Survey 2014 22
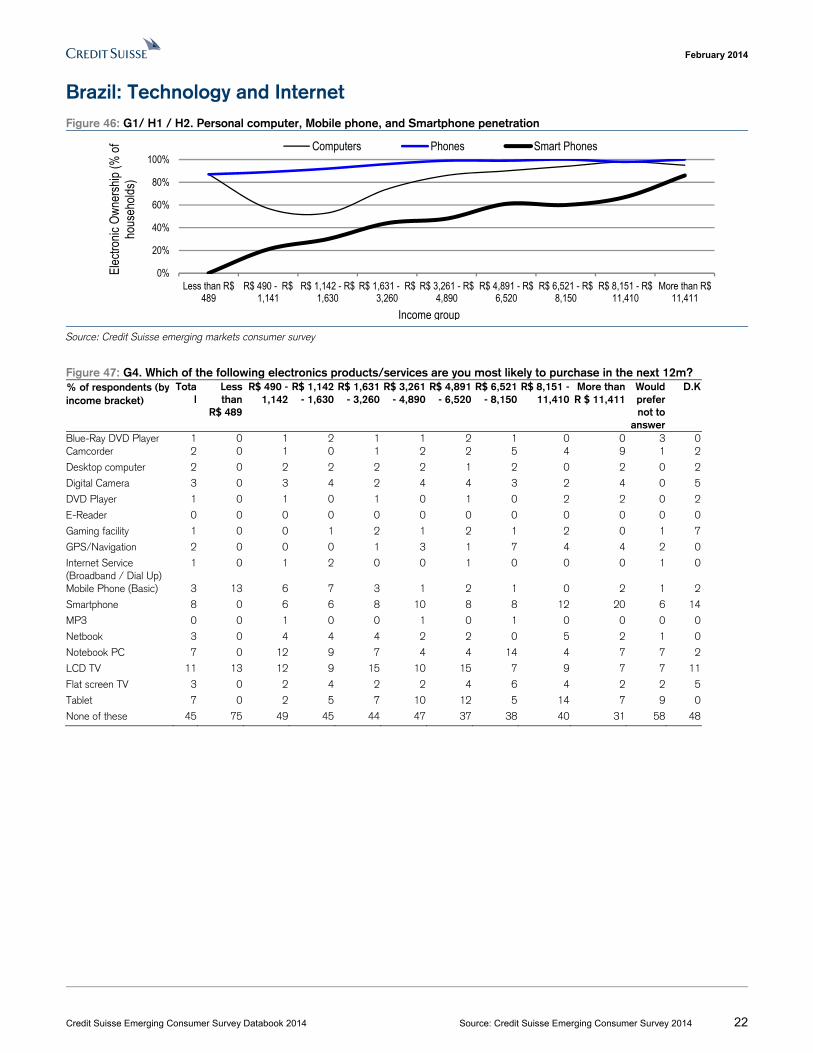
Brazil: Technology and Internet Figure 46: G1/ H1 / H2. Personal computer, Mobile phone, and Smartphone penetration
Source: Credit Suisse emerging markets consumer survey
Figure 47: G4. Which of the following electronics products/services are you most likely to purchase in the next 12m? % of respondents (by income bracket)
Total
Less than
R$ 489
R$ 490 - 1,142
R$ 1,142 - 1,630
R$ 1,631 - 3,260
R$ 3,261 - 4,890
R$ 4,891 - 6,520
R$ 6,521 - 8,150
R$ 8,151 -11,410
More than R $ 11,411
Would prefer not to
answer
D.K
Blue-Ray DVD Player 1 0 1 2 1 1 2 1 0 0 3 0Camcorder 2 0 1 0 1 2 2 5 4 9 1 2
Desktop computer 2 0 2 2 2 2 1 2 0 2 0 2
Digital Camera 3 0 3 4 2 4 4 3 2 4 0 5
DVD Player 1 0 1 0 1 0 1 0 2 2 0 2
E-Reader 0 0 0 0 0 0 0 0 0 0 0 0
Gaming facility 1 0 0 1 2 1 2 1 2 0 1 7
GPS/Navigation 2 0 0 0 1 3 1 7 4 4 2 0
Internet Service (Broadband / Dial Up)
1 0 1 2 0 0 1 0 0 0 1 0
Mobile Phone (Basic) 3 13 6 7 3 1 2 1 0 2 1 2
Smartphone 8 0 6 6 8 10 8 8 12 20 6 14
MP3 0 0 1 0 0 1 0 1 0 0 0 0
Netbook 3 0 4 4 4 2 2 0 5 2 1 0
Notebook PC 7 0 12 9 7 4 4 14 4 7 7 2
LCD TV 11 13 12 9 15 10 15 7 9 7 7 11
Flat screen TV 3 0 2 4 2 2 4 6 4 2 2 5
Tablet 7 0 2 5 7 10 12 5 14 7 9 0
None of these 45 75 49 45 44 47 37 38 40 31 58 48
0%
20%
40%
60%
80%
100%
Less than R$489
R$ 490 - R$1,141
R$ 1,142 - R$1,630
R$ 1,631 - R$3,260
R$ 3,261 - R$4,890
R$ 4,891 - R$6,520
R$ 6,521 - R$8,150
R$ 8,151 - R$11,410
More than R$11,411
Elec
troni
c O
wne
rshi
p (%
of
hous
ehol
ds)
Computers Phones Smart Phones
Income group
February 2014
Credit Suisse Emerging Consumer Survey Databook 2014 Source: Credit Suisse Emerging Consumer Survey 2014 23
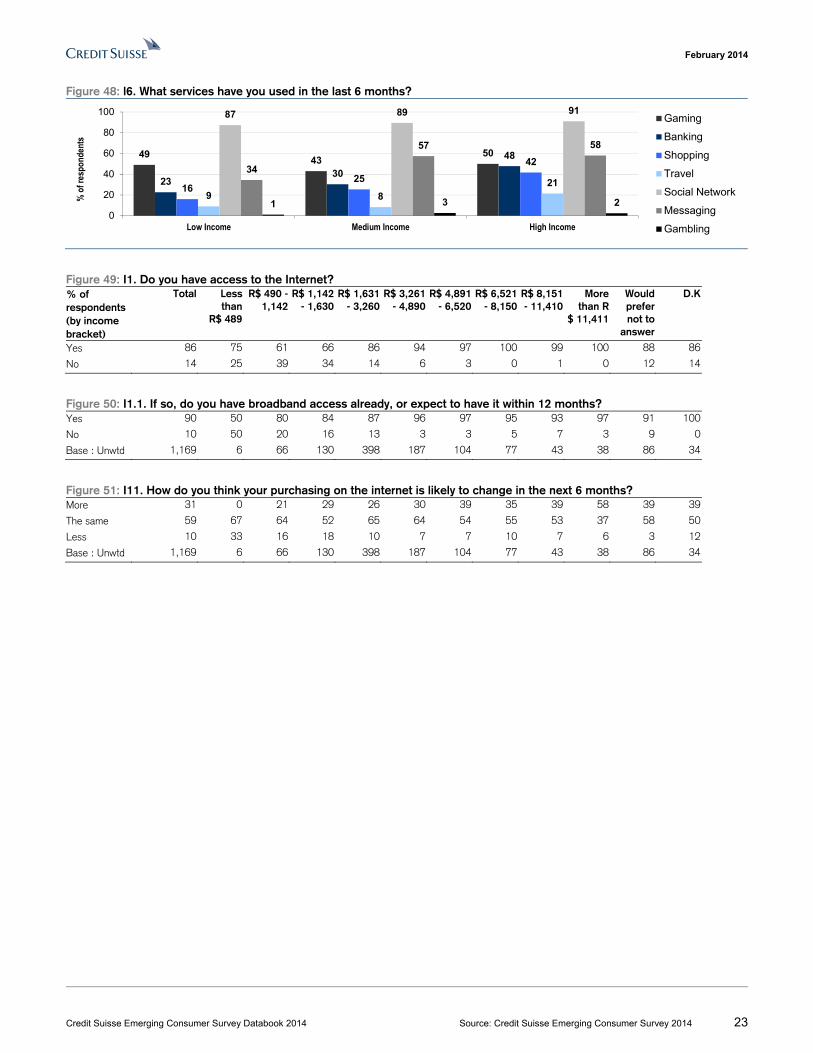
Figure 48: l6. What services have you used in the last 6 months?
Figure 49: I1. Do you have access to the Internet? % of respondents (by income bracket)
Total Less than
R$ 489
R$ 490 - 1,142
R$ 1,142 - 1,630
R$ 1,631 - 3,260
R$ 3,261 - 4,890
R$ 4,891 - 6,520
R$ 6,521 - 8,150
R$ 8,151 - 11,410
More than R
$ 11,411
Would prefer not to
answer
D.K
Yes 86 75 61 66 86 94 97 100 99 100 88 86
No 14 25 39 34 14 6 3 0 1 0 12 14
Figure 50: I1.1. If so, do you have broadband access already, or expect to have it within 12 months? Yes 90 50 80 84 87 96 97 95 93 97 91 100
No 10 50 20 16 13 3 3 5 7 3 9 0
Base : Unwtd 1,169 6 66 130 398 187 104 77 43 38 86 34
Figure 51: I11. How do you think your purchasing on the internet is likely to change in the next 6 months? More 31 0 21 29 26 30 39 35 39 58 39 39
The same 59 67 64 52 65 64 54 55 53 37 58 50
Less 10 33 16 18 10 7 7 10 7 6 3 12
Base : Unwtd 1,169 6 66 130 398 187 104 77 43 38 86 34
4943
50
2330
48
1625
42
9 821
87 89 91
34
57 58
1 3 20
20
40
60
80
100
Low Income Medium Income High Income
% o
f res
pond
ents
Gaming
Banking
Shopping
Travel
Social Network
Messaging
Gambling
February 2014
Credit Suisse Emerging Consumer Survey Databook 2014 Source: Credit Suisse Emerging Consumer Survey 2014 24
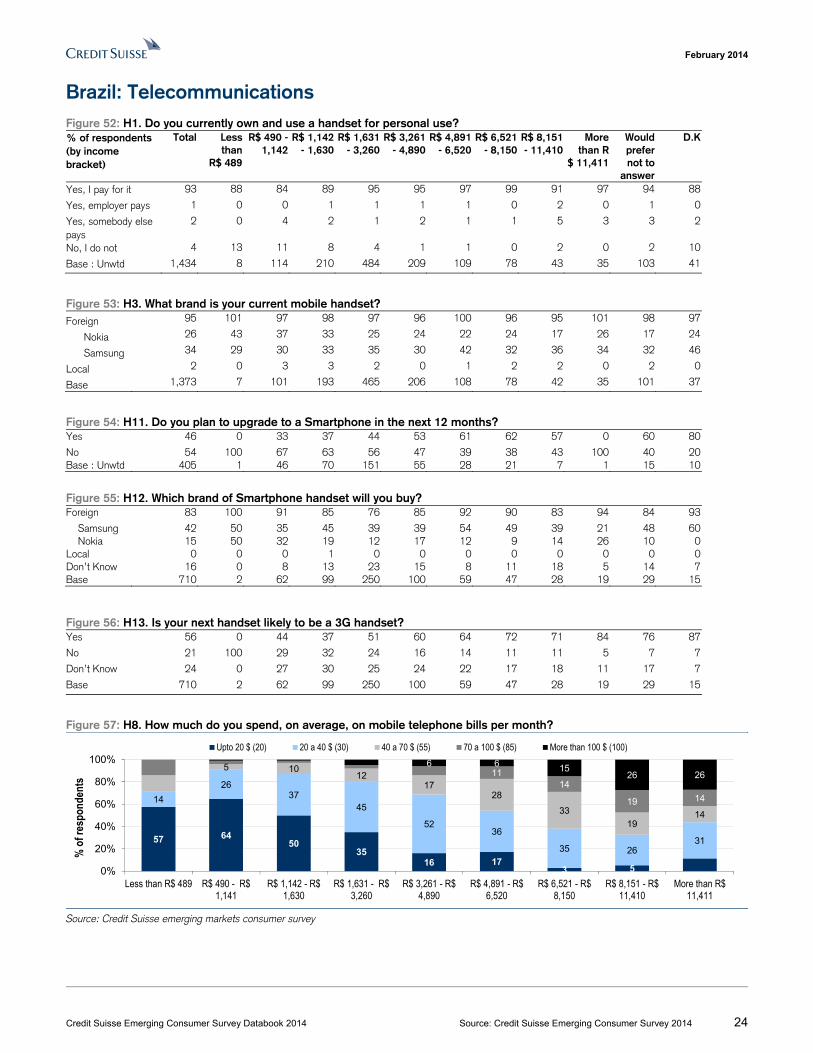
Brazil: Telecommunications Figure 52: H1. Do you currently own and use a handset for personal use? % of respondents (by income bracket)
Total Less than
R$ 489
R$ 490 - 1,142
R$ 1,142 - 1,630
R$ 1,631 - 3,260
R$ 3,261 - 4,890
R$ 4,891 - 6,520
R$ 6,521 - 8,150
R$ 8,151 - 11,410
More than R
$ 11,411
Would prefer not to
answer
D.K
Yes, I pay for it 93 88 84 89 95 95 97 99 91 97 94 88
Yes, employer pays 1 0 0 1 1 1 1 0 2 0 1 0
Yes, somebody else pays
2 0 4 2 1 2 1 1 5 3 3 2
No, I do not 4 13 11 8 4 1 1 0 2 0 2 10
Base : Unwtd 1,434 8 114 210 484 209 109 78 43 35 103 41
Figure 53: H3. What brand is your current mobile handset? Foreign 95 101 97 98 97 96 100 96 95 101 98 97
Nokia 26 43 37 33 25 24 22 24 17 26 17 24
Samsung 34 29 30 33 35 30 42 32 36 34 32 46
Local 2 0 3 3 2 0 1 2 2 0 2 0
Base 1,373 7 101 193 465 206 108 78 42 35 101 37
Figure 54: H11. Do you plan to upgrade to a Smartphone in the next 12 months? Yes 46 0 33 37 44 53 61 62 57 0 60 80
No 54 100 67 63 56 47 39 38 43 100 40 20Base : Unwtd 405 1 46 70 151 55 28 21 7 1 15 10
Figure 55: H12. Which brand of Smartphone handset will you buy? Foreign 83 100 91 85 76 85 92 90 83 94 84 93
Samsung 42 50 35 45 39 39 54 49 39 21 48 60 Nokia 15 50 32 19 12 17 12 9 14 26 10 0Local 0 0 0 1 0 0 0 0 0 0 0 0Don’t Know 16 0 8 13 23 15 8 11 18 5 14 7Base 710 2 62 99 250 100 59 47 28 19 29 15 Figure 56: H13. Is your next handset likely to be a 3G handset? Yes 56 0 44 37 51 60 64 72 71 84 76 87
No 21 100 29 32 24 16 14 11 11 5 7 7
Don’t Know 24 0 27 30 25 24 22 17 18 11 17 7
Base 710 2 62 99 250 100 59 47 28 19 29 15
Figure 57: H8. How much do you spend, on average, on mobile telephone bills per month?
Source: Credit Suisse emerging markets consumer survey
57 6450
3516 17
3 5
14
2637
45
5236
35 2631
5 1012
1728
33
1914
1114
19 14
6 6 1526 26
0%
20%
40%
60%
80%
100%
Less than R$ 489 R$ 490 - R$1,141
R$ 1,142 - R$1,630
R$ 1,631 - R$3,260
R$ 3,261 - R$4,890
R$ 4,891 - R$6,520
R$ 6,521 - R$8,150
R$ 8,151 - R$11,410
More than R$11,411
% o
f res
pond
ents
Upto 20 $ (20) 20 a 40 $ (30) 40 a 70 $ (55) 70 a 100 $ (85) More than 100 $ (100)
February 2014
Credit Suisse Emerging Consumer Survey Databook 2014 Source: Credit Suisse Emerging Consumer Survey 2014 25
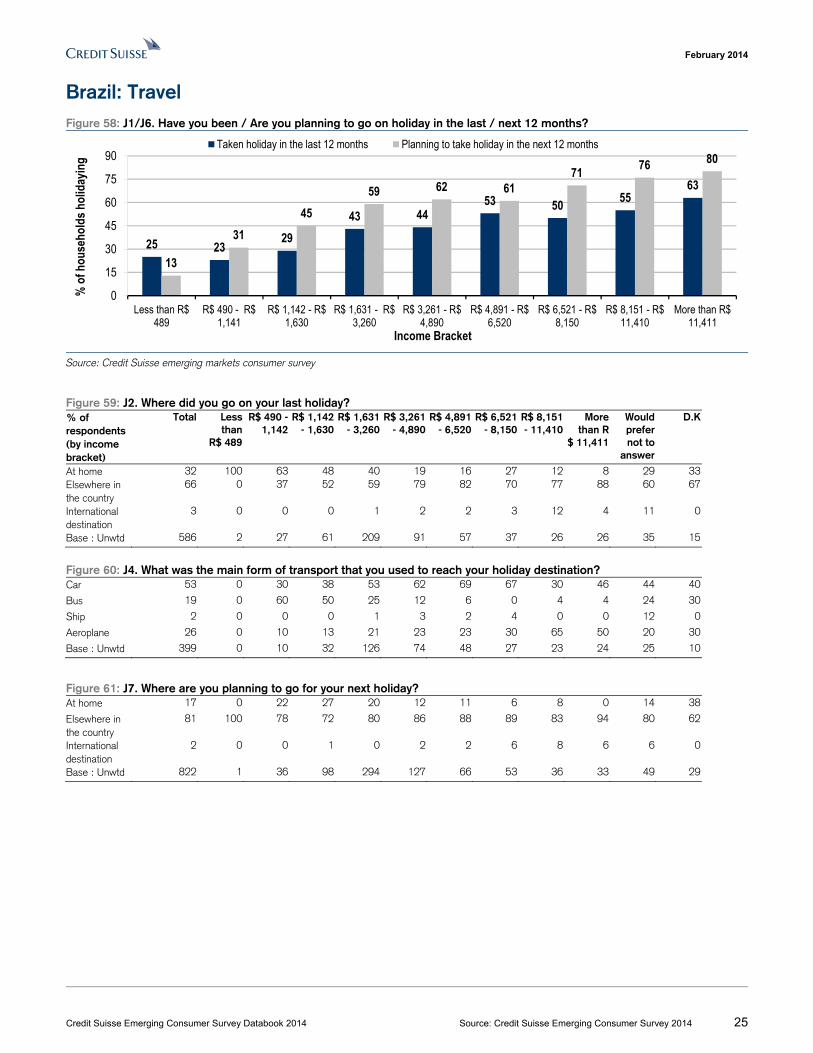
Brazil: Travel Figure 58: J1/J6. Have you been / Are you planning to go on holiday in the last / next 12 months?
Source: Credit Suisse emerging markets consumer survey
Figure 59: J2. Where did you go on your last holiday? % of respondents (by income bracket)
Total Less than
R$ 489
R$ 490 - 1,142
R$ 1,142 - 1,630
R$ 1,631 - 3,260
R$ 3,261 - 4,890
R$ 4,891 - 6,520
R$ 6,521 - 8,150
R$ 8,151 - 11,410
More than R
$ 11,411
Would prefer not to
answer
D.K
At home 32 100 63 48 40 19 16 27 12 8 29 33Elsewhere in the country
66 0 37 52 59 79 82 70 77 88 60 67
International destination
3 0 0 0 1 2 2 3 12 4 11 0
Base : Unwtd 586 2 27 61 209 91 57 37 26 26 35 15
Figure 60: J4. What was the main form of transport that you used to reach your holiday destination? Car 53 0 30 38 53 62 69 67 30 46 44 40
Bus 19 0 60 50 25 12 6 0 4 4 24 30
Ship 2 0 0 0 1 3 2 4 0 0 12 0
Aeroplane 26 0 10 13 21 23 23 30 65 50 20 30
Base : Unwtd 399 0 10 32 126 74 48 27 23 24 25 10
Figure 61: J7. Where are you planning to go for your next holiday? At home 17 0 22 27 20 12 11 6 8 0 14 38
Elsewhere in the country
81 100 78 72 80 86 88 89 83 94 80 62
International destination
2 0 0 1 0 2 2 6 8 6 6 0
Base : Unwtd 822 1 36 98 294 127 66 53 36 33 49 29
25 2329
43 4453 50 55
63
13
3145
59 62 6171 76 80
0
15
30
45
60
75
90
Less than R$489
R$ 490 - R$1,141
R$ 1,142 - R$1,630
R$ 1,631 - R$3,260
R$ 3,261 - R$4,890
R$ 4,891 - R$6,520
R$ 6,521 - R$8,150
R$ 8,151 - R$11,410
More than R$11,411
% o
f hou
seho
lds h
olid
ayin
g
Income Bracket
Taken holiday in the last 12 months Planning to take holiday in the next 12 months
February 2014
Credit Suisse Emerging Consumer Survey Databook 2014 Source: Credit Suisse Emerging Consumer Survey 2014 26
Brazil: Property Figure 62: K1. Do you or your family live in your own property? % of respondents (by income bracket)
Total Less than
R$ 489
R$ 490 - 1,142
R$ 1,142 - 1,630
R$ 1,631 - 3,260
R$ 3,261 - 4,890
R$ 4,891 - 6,520
R$ 6,521 - 8,150
R$ 8,151 - 11,410
More than R
$ 11,411
Would prefer not to
answer
D.K
Yes 75 86 73 71 68 79 82 85 91 95 75 76
No 25 14 27 30 32 22 18 15 9 5 25 24
Base : Unwtd 1,372 7 103 200 464 200 102 74 47 40 97 38
Figure 63: K2. If you do not own your own property, on what terms do you occupy the property? Rented 94 100 93 92 95 95 100 100 100 100 88 89
Allocated 2 0 4 2 1 2 0 0 0 0 8 0
Borrowed 4 0 4 7 5 2 0 0 0 0 4 11
Base : Unwtd 348 1 28 59 149 43 18 11 4 2 24 9
Figure 64: K6. If you are planning to purchase a property in the next 2 years, what is the main motivation for doing so? Upgrade 23 100 40 17 26 17 22 23 38 13 17 20
First-time buyer 41 0 53 49 48 42 39 32 13 6 22 50
Investment 18 0 0 12 12 25 22 27 25 56 22 10
Change of location 11 0 7 12 10 11 9 5 13 19 9 20
Holiday property 7 0 0 7 3 6 9 14 13 6 30 0
Base : Unwtd 336 1 15 41 124 53 23 22 8 16 23 10
Figure 65: K9. How, if at all, do you expect local property prices to change in the next 12 months? Increase 56 86 57 70 55 60 60 51 45 68 38 42
No Change 19 14 16 18 18 17 25 26 28 15 27 13
Decrease 16 0 11 6 22 20 14 22 21 16 10 11
Don’t know 8 0 17 8 5 4 1 1 6 3 26 34
Base : Unwtd 1,372 7 103 200 464 200 102 74 47 40 97 38
Figure 66: K10. How much of your total wealth is made up of property? Below 25% 33 100 31 34 44 33 27 22 19 20 12 21
25% - 50% 26 0 18 28 28 27 29 28 40 33 18 18
51% - 75% 14 0 13 11 9 20 25 31 19 23 14 8
76% - 95% 7 0 3 6 7 7 11 16 6 15 7 5
Above 95% 4 0 7 6 3 3 3 1 4 8 5 5
Don't know 14 0 28 17 9 12 5 1 11 3 43 42
Base : Unwtd 1,372 7 103 200 464 200 102 74 47 40 97 38
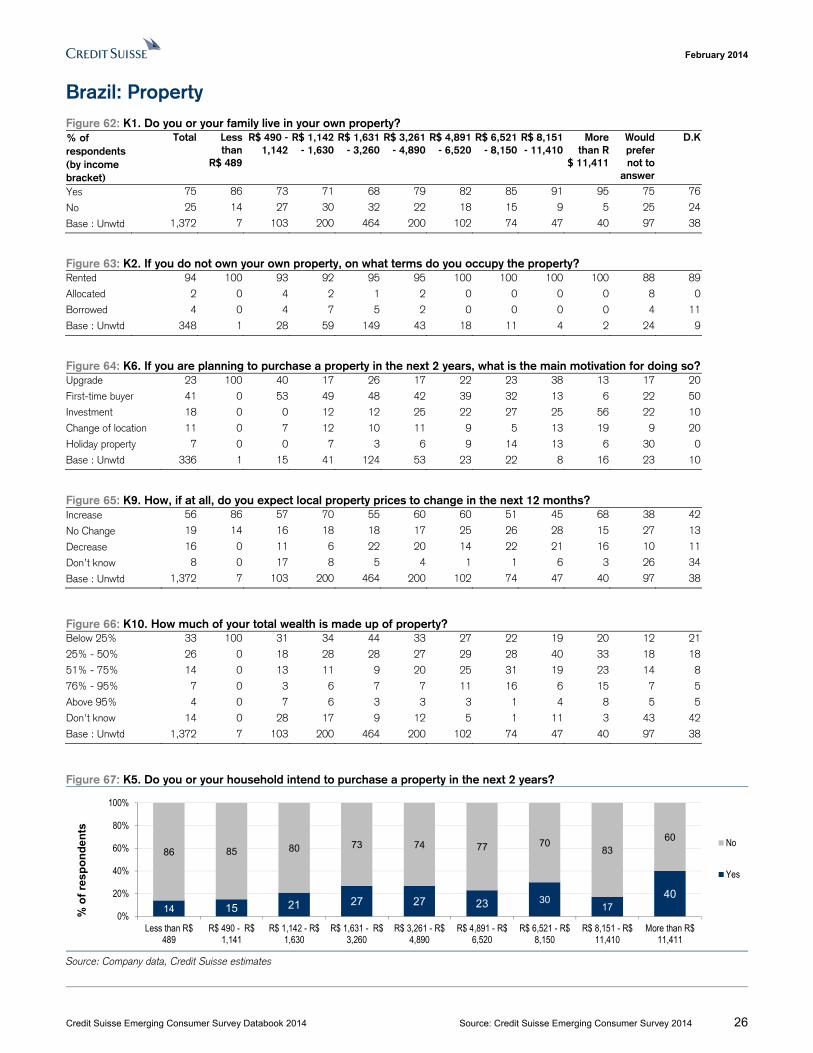
Figure 67: K5. Do you or your household intend to purchase a property in the next 2 years?
Source: Company data, Credit Suisse estimates
14 15 21 27 27 23 3017
40
86 85 80 73 74 77 7083
60
0%
20%
40%
60%
80%
100%
Less than R$489
R$ 490 - R$1,141
R$ 1,142 - R$1,630
R$ 1,631 - R$3,260
R$ 3,261 - R$4,890
R$ 4,891 - R$6,520
R$ 6,521 - R$8,150
R$ 8,151 - R$11,410
More than R$11,411
% o
f re
sp
on
de
nts
No
Yes
February 2014
Credit Suisse Emerging Consumer Survey Databook 2014 Source: Credit Suisse Emerging Consumer Survey 2014 27
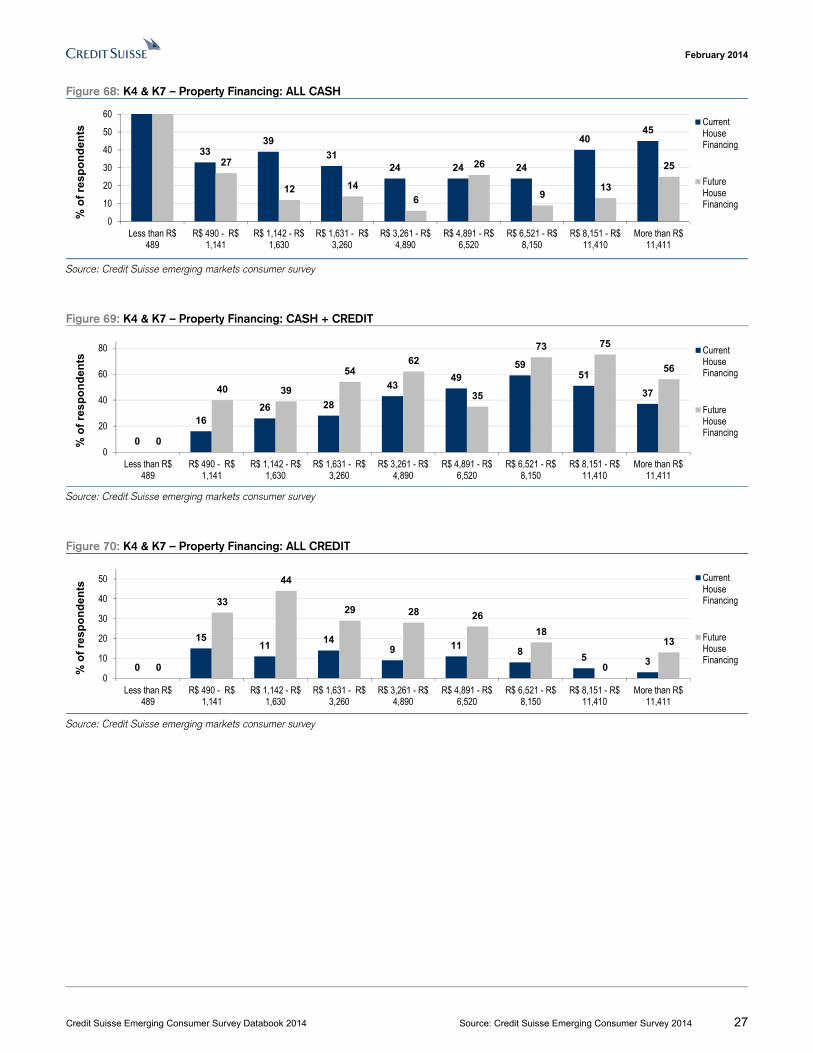
Figure 68: K4 & K7 – Property Financing: ALL CASH
Source: Credit Suisse emerging markets consumer survey
Figure 69: K4 & K7 – Property Financing: CASH + CREDIT
Source: Credit Suisse emerging markets consumer survey
Figure 70: K4 & K7 – Property Financing: ALL CREDIT
Source: Credit Suisse emerging markets consumer survey
3339
3124 24 24
4045
27
12 14
6
26
913
25
0
10
20
30
40
50
60
Less than R$489
R$ 490 - R$1,141
R$ 1,142 - R$1,630
R$ 1,631 - R$3,260
R$ 3,261 - R$4,890
R$ 4,891 - R$6,520
R$ 6,521 - R$8,150
R$ 8,151 - R$11,410
More than R$11,411
% o
f re
sp
on
de
nts
CurrentHouseFinancing
FutureHouseFinancing
0
1626 28
4349
5951
37
0
40 39
5462
35
73 75
56
0
20
40
60
80
Less than R$489
R$ 490 - R$1,141
R$ 1,142 - R$1,630
R$ 1,631 - R$3,260
R$ 3,261 - R$4,890
R$ 4,891 - R$6,520
R$ 6,521 - R$8,150
R$ 8,151 - R$11,410
More than R$11,411
% o
f re
sp
on
de
nts
CurrentHouseFinancing
FutureHouseFinancing
0
1511
149 11
85 3
0
33
44
29 28 26
18
0
13
0
10
20
30
40
50
Less than R$489
R$ 490 - R$1,141
R$ 1,142 - R$1,630
R$ 1,631 - R$3,260
R$ 3,261 - R$4,890
R$ 4,891 - R$6,520
R$ 6,521 - R$8,150
R$ 8,151 - R$11,410
More than R$11,411
% o
f re
sp
on
de
nts
CurrentHouseFinancing
FutureHouseFinancing
February 2014
Credit Suisse Emerging Consumer Survey Databook 2014 Source: Credit Suisse Emerging Consumer Survey 2014 28
Brazil: Education Figure 71: L3. Do you conduct any education online? Yes 8 0 6 4 6 9 12 7 12 15 11 12
No 92 100 94 96 94 91 88 93 88 85 89 88
Base : Unwtd 1,419 8 112 210 480 207 101 69 49 41 100 42
Figure 72: L6. Do you intend to spend more, or less, on education or training courses in the next 12 months More 15 13 11 11 14 18 22 23 22 20 11 21
About the same 65 38 64 70 67 68 64 64 67 76 53 38
Less 19 50 25 19 19 14 14 13 10 5 36 40
Base : Unwtd 1,419 8 112 210 480 207 101 69 49 41 100 42
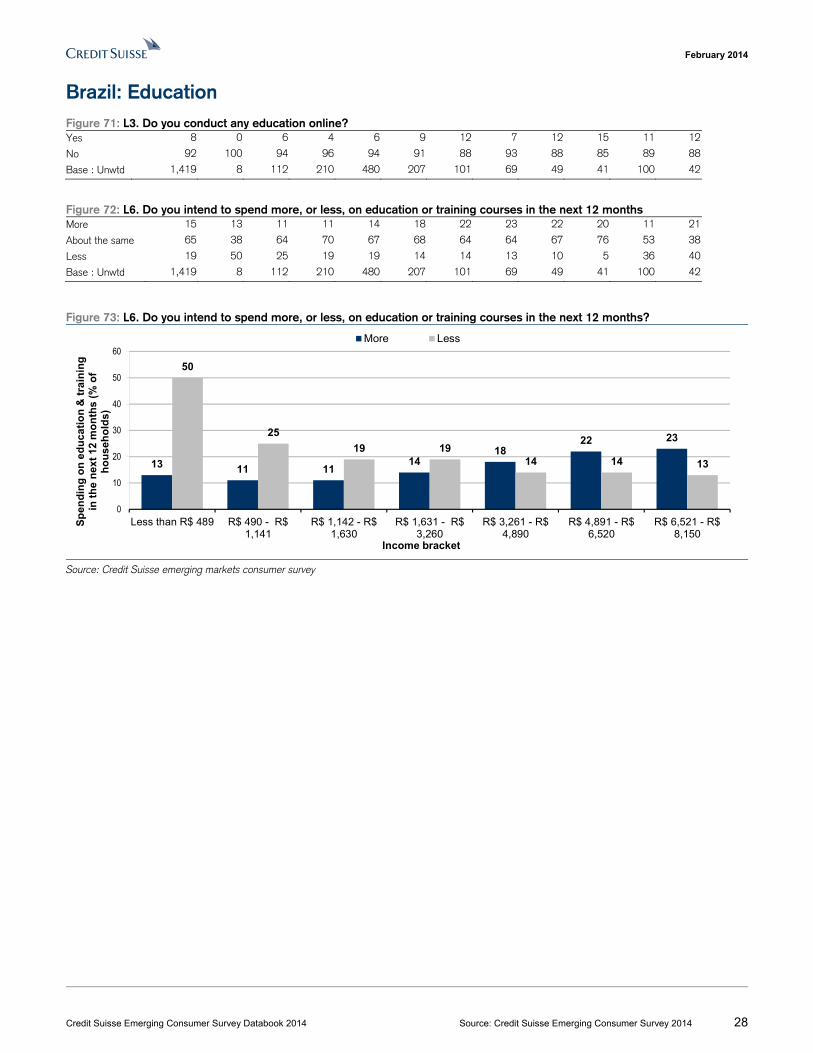
Figure 73: L6. Do you intend to spend more, or less, on education or training courses in the next 12 months?
Source: Credit Suisse emerging markets consumer survey
13 11 1114
1822 23
50
25
19 1914 14 13
0
10
20
30
40
50
60
Less than R$ 489 R$ 490 - R$1,141
R$ 1,142 - R$1,630
R$ 1,631 - R$3,260
R$ 3,261 - R$4,890
R$ 4,891 - R$6,520
R$ 6,521 - R$8,150
Sp
end
ing
on
ed
uca
tio
n &
tra
inin
g
in t
he
nex
t 12
mo
nth
s (
% o
f h
ou
seh
old
s)
Income bracket
More Less
February 2014
Credit Suisse Emerging Consumer Survey Databook 2014 Source: Credit Suisse Emerging Consumer Survey 2014 29
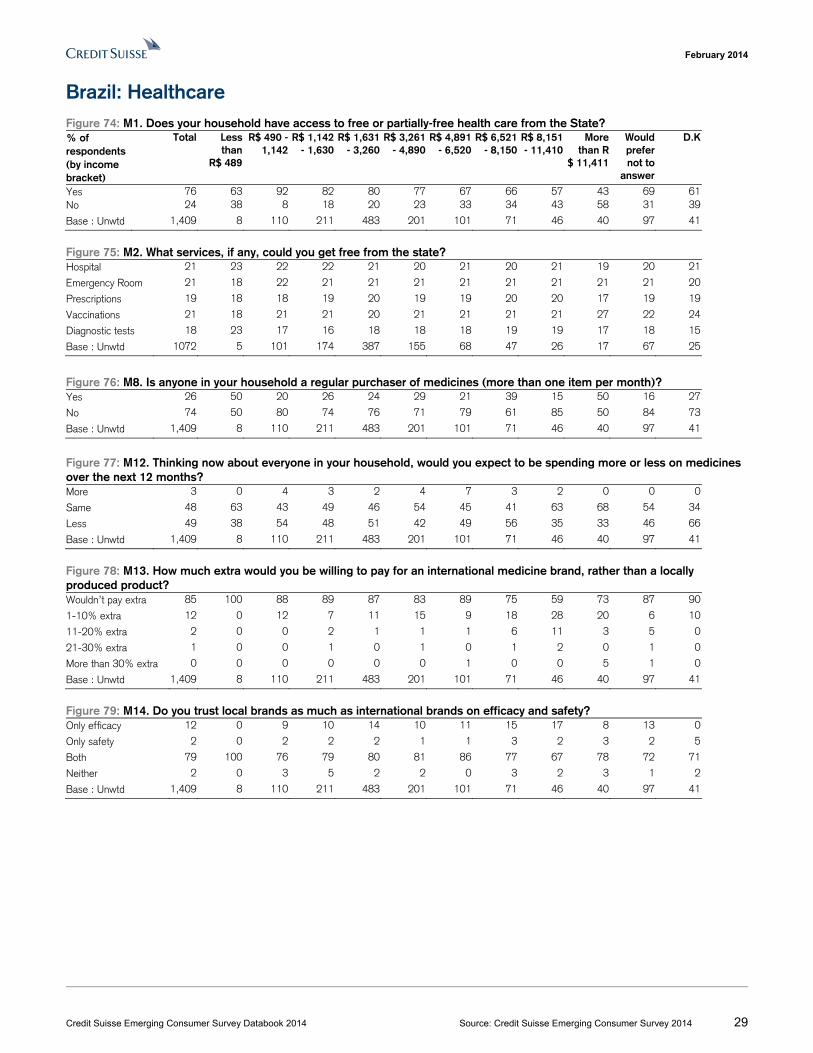
Brazil: Healthcare Figure 74: M1. Does your household have access to free or partially-free health care from the State? % of respondents (by income bracket)
Total Less than
R$ 489
R$ 490 - 1,142
R$ 1,142 - 1,630
R$ 1,631 - 3,260
R$ 3,261 - 4,890
R$ 4,891 - 6,520
R$ 6,521 - 8,150
R$ 8,151 - 11,410
More than R
$ 11,411
Would prefer not to
answer
D.K
Yes 76 63 92 82 80 77 67 66 57 43 69 61No 24 38 8 18 20 23 33 34 43 58 31 39
Base : Unwtd 1,409 8 110 211 483 201 101 71 46 40 97 41
Figure 75: M2. What services, if any, could you get free from the state? Hospital 21 23 22 22 21 20 21 20 21 19 20 21
Emergency Room 21 18 22 21 21 21 21 21 21 21 21 20
Prescriptions 19 18 18 19 20 19 19 20 20 17 19 19
Vaccinations 21 18 21 21 20 21 21 21 21 27 22 24
Diagnostic tests 18 23 17 16 18 18 18 19 19 17 18 15
Base : Unwtd 1072 5 101 174 387 155 68 47 26 17 67 25
Figure 76: M8. Is anyone in your household a regular purchaser of medicines (more than one item per month)? Yes 26 50 20 26 24 29 21 39 15 50 16 27
No 74 50 80 74 76 71 79 61 85 50 84 73
Base : Unwtd 1,409 8 110 211 483 201 101 71 46 40 97 41
Figure 77: M12. Thinking now about everyone in your household, would you expect to be spending more or less on medicines over the next 12 months? More 3 0 4 3 2 4 7 3 2 0 0 0
Same 48 63 43 49 46 54 45 41 63 68 54 34
Less 49 38 54 48 51 42 49 56 35 33 46 66
Base : Unwtd 1,409 8 110 211 483 201 101 71 46 40 97 41
Figure 78: M13. How much extra would you be willing to pay for an international medicine brand, rather than a locally produced product? Wouldn’t pay extra 85 100 88 89 87 83 89 75 59 73 87 90
1-10% extra 12 0 12 7 11 15 9 18 28 20 6 10
11-20% extra 2 0 0 2 1 1 1 6 11 3 5 0
21-30% extra 1 0 0 1 0 1 0 1 2 0 1 0
More than 30% extra 0 0 0 0 0 0 1 0 0 5 1 0
Base : Unwtd 1,409 8 110 211 483 201 101 71 46 40 97 41
Figure 79: M14. Do you trust local brands as much as international brands on efficacy and safety? Only efficacy 12 0 9 10 14 10 11 15 17 8 13 0
Only safety 2 0 2 2 2 1 1 3 2 3 2 5
Both 79 100 76 79 80 81 86 77 67 78 72 71
Neither 2 0 3 5 2 2 0 3 2 3 1 2
Base : Unwtd 1,409 8 110 211 483 201 101 71 46 40 97 41
February 2014
Credit Suisse Emerging Consumer Survey Databook 2014 Source: Credit Suisse Emerging Consumer Survey 2014 30
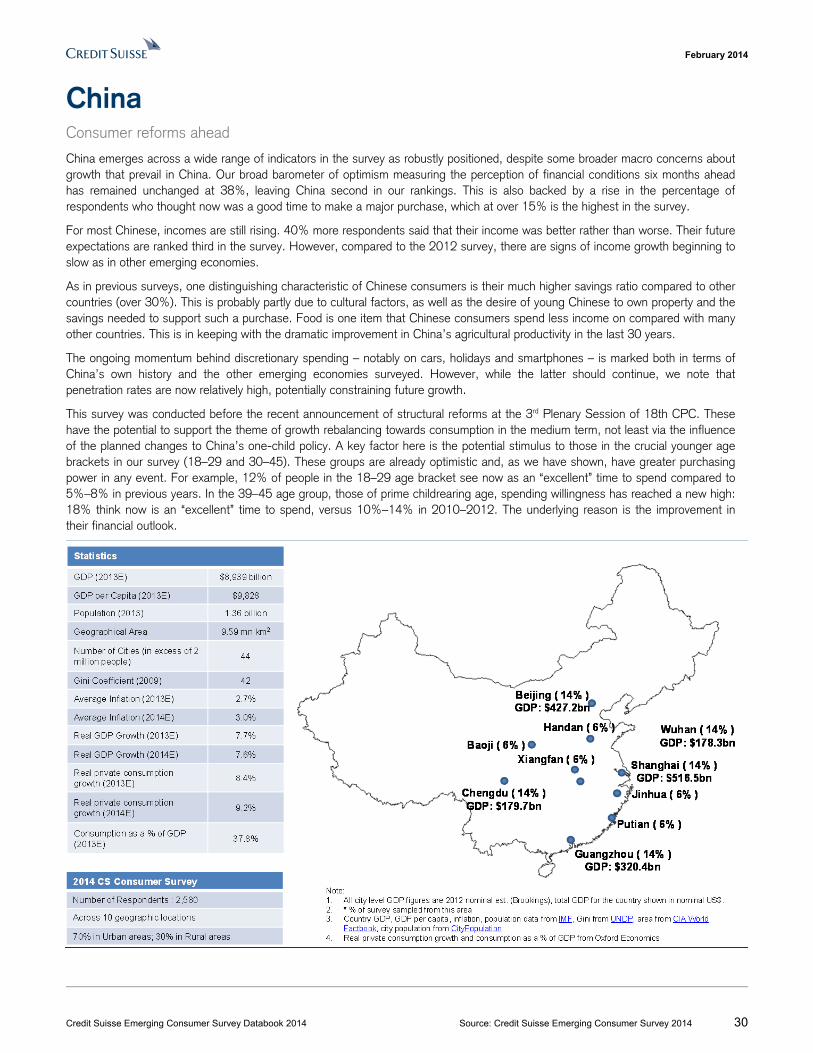
China Consumer reforms ahead
China emerges across a wide range of indicators in the survey as robustly positioned, despite some broader macro concerns about growth that prevail in China. Our broad barometer of optimism measuring the perception of financial conditions six months ahead has remained unchanged at 38%, leaving China second in our rankings. This is also backed by a rise in the percentage of respondents who thought now was a good time to make a major purchase, which at over 15% is the highest in the survey.
For most Chinese, incomes are still rising. 40% more respondents said that their income was better rather than worse. Their future expectations are ranked third in the survey. However, compared to the 2012 survey, there are signs of income growth beginning to slow as in other emerging economies.
As in previous surveys, one distinguishing characteristic of Chinese consumers is their much higher savings ratio compared to other countries (over 30%). This is probably partly due to cultural factors, as well as the desire of young Chinese to own property and the savings needed to support such a purchase. Food is one item that Chinese consumers spend less income on compared with many other countries. This is in keeping with the dramatic improvement in China’s agricultural productivity in the last 30 years.
The ongoing momentum behind discretionary spending – notably on cars, holidays and smartphones – is marked both in terms of China’s own history and the other emerging economies surveyed. However, while the latter should continue, we note that penetration rates are now relatively high, potentially constraining future growth.
This survey was conducted before the recent announcement of structural reforms at the 3rd Plenary Session of 18th CPC. These have the potential to support the theme of growth rebalancing towards consumption in the medium term, not least via the influence of the planned changes to China’s one-child policy. A key factor here is the potential stimulus to those in the crucial younger age brackets in our survey (18–29 and 30–45). These groups are already optimistic and, as we have shown, have greater purchasing power in any event. For example, 12% of people in the 18–29 age bracket see now as an “excellent” time to spend compared to 5%–8% in previous years. In the 39–45 age group, those of prime childrearing age, spending willingness has reached a new high: 18% think now is an “excellent” time to spend, versus 10%–14% in 2010–2012. The underlying reason is the improvement in their financial outlook.
February 2014
Credit Suisse Emerging Consumer Survey Databook 2014 Source: Credit Suisse Emerging Consumer Survey 2014 31
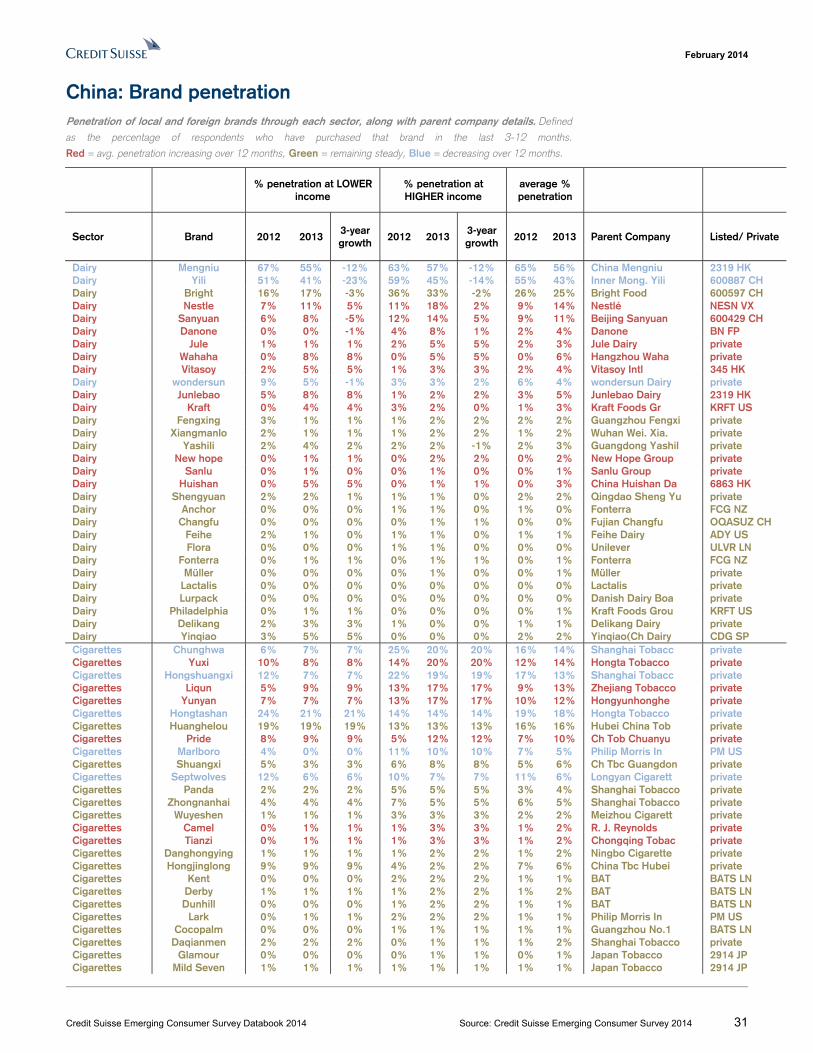
China: Brand penetration Penetration of local and foreign brands through each sector, along with parent company details. Defined
as the percentage of respondents who have purchased that brand in the last 3-12 months.
Red = avg. penetration increasing over 12 months, Green = remaining steady, Blue = decreasing over 12 months.
% penetration at LOWER income
% penetration at HIGHER income
average % penetration
Sector Brand 2012 2013 3-year growth
2012 2013 3-year growth
2012 2013 Parent Company Listed/ Private
Dairy Mengniu 67% 55% -12% 63% 57% -12% 65% 56% China Mengniu 2319 HK Dairy Yili 51% 41% -23% 59% 45% -14% 55% 43% Inner Mong. Yili 600887 CH Dairy Bright 16% 17% -3% 36% 33% -2% 26% 25% Bright Food 600597 CH Dairy Nestle 7% 11% 5% 11% 18% 2% 9% 14% Nestlé NESN VX Dairy Sanyuan 6% 8% -5% 12% 14% 5% 9% 11% Beijing Sanyuan 600429 CH Dairy Danone 0% 0% -1% 4% 8% 1% 2% 4% Danone BN FP Dairy Jule 1% 1% 1% 2% 5% 5% 2% 3% Jule Dairy private Dairy Wahaha 0% 8% 8% 0% 5% 5% 0% 6% Hangzhou Waha private Dairy Vitasoy 2% 5% 5% 1% 3% 3% 2% 4% Vitasoy Intl 345 HK Dairy wondersun 9% 5% -1% 3% 3% 2% 6% 4% wondersun Dairy private Dairy Junlebao 5% 8% 8% 1% 2% 2% 3% 5% Junlebao Dairy 2319 HK Dairy Kraft 0% 4% 4% 3% 2% 0% 1% 3% Kraft Foods Gr KRFT US Dairy Fengxing 3% 1% 1% 1% 2% 2% 2% 2% Guangzhou Fengxi private Dairy Xiangmanlo 2% 1% 1% 1% 2% 2% 1% 2% Wuhan Wei. Xia. private Dairy Yashili 2% 4% 2% 2% 2% -1% 2% 3% Guangdong Yashil private Dairy New hope 0% 1% 1% 0% 2% 2% 0% 2% New Hope Group private Dairy Sanlu 0% 1% 0% 0% 1% 0% 0% 1% Sanlu Group private Dairy Huishan 0% 5% 5% 0% 1% 1% 0% 3% China Huishan Da 6863 HK Dairy Shengyuan 2% 2% 1% 1% 1% 0% 2% 2% Qingdao Sheng Yu private Dairy Anchor 0% 0% 0% 1% 1% 0% 1% 0% Fonterra FCG NZ Dairy Changfu 0% 0% 0% 0% 1% 1% 0% 0% Fujian Changfu OQASUZ CH Dairy Feihe 2% 1% 0% 1% 1% 0% 1% 1% Feihe Dairy ADY US Dairy Flora 0% 0% 0% 1% 1% 0% 0% 0% Unilever ULVR LN Dairy Fonterra 0% 1% 1% 0% 1% 1% 0% 1% Fonterra FCG NZ Dairy Müller 0% 0% 0% 0% 1% 0% 0% 1% Müller private Dairy Lactalis 0% 0% 0% 0% 0% 0% 0% 0% Lactalis private Dairy Lurpack 0% 0% 0% 0% 0% 0% 0% 0% Danish Dairy Boa private Dairy Philadelphia 0% 1% 1% 0% 0% 0% 0% 1% Kraft Foods Grou KRFT US Dairy Delikang 2% 3% 3% 1% 0% 0% 1% 1% Delikang Dairy private Dairy Yinqiao 3% 5% 5% 0% 0% 0% 2% 2% Yinqiao(Ch Dairy CDG SP Cigarettes Chunghwa 6% 7% 7% 25% 20% 20% 16% 14% Shanghai Tobacc private Cigarettes Yuxi 10% 8% 8% 14% 20% 20% 12% 14% Hongta Tobacco private Cigarettes Hongshuangxi 12% 7% 7% 22% 19% 19% 17% 13% Shanghai Tobacc private Cigarettes Liqun 5% 9% 9% 13% 17% 17% 9% 13% Zhejiang Tobacco private Cigarettes Yunyan 7% 7% 7% 13% 17% 17% 10% 12% Hongyunhonghe private Cigarettes Hongtashan 24% 21% 21% 14% 14% 14% 19% 18% Hongta Tobacco private Cigarettes Huanghelou 19% 19% 19% 13% 13% 13% 16% 16% Hubei China Tob private Cigarettes Pride 8% 9% 9% 5% 12% 12% 7% 10% Ch Tob Chuanyu private Cigarettes Marlboro 4% 0% 0% 11% 10% 10% 7% 5% Philip Morris In PM US Cigarettes Shuangxi 5% 3% 3% 6% 8% 8% 5% 6% Ch Tbc Guangdon private Cigarettes Septwolves 12% 6% 6% 10% 7% 7% 11% 6% Longyan Cigarett private Cigarettes Panda 2% 2% 2% 5% 5% 5% 3% 4% Shanghai Tobacco private Cigarettes Zhongnanhai 4% 4% 4% 7% 5% 5% 6% 5% Shanghai Tobacco private Cigarettes Wuyeshen 1% 1% 1% 3% 3% 3% 2% 2% Meizhou Cigarett private Cigarettes Camel 0% 1% 1% 1% 3% 3% 1% 2% R. J. Reynolds private Cigarettes Tianzi 0% 1% 1% 1% 3% 3% 1% 2% Chongqing Tobac private Cigarettes Danghongying 1% 1% 1% 1% 2% 2% 1% 2% Ningbo Cigarette private Cigarettes Hongjinglong 9% 9% 9% 4% 2% 2% 7% 6% China Tbc Hubei private Cigarettes Kent 0% 0% 0% 2% 2% 2% 1% 1% BAT BATS LN Cigarettes Derby 1% 1% 1% 1% 2% 2% 1% 2% BAT BATS LN Cigarettes Dunhill 0% 0% 0% 1% 2% 2% 1% 1% BAT BATS LN Cigarettes Lark 0% 1% 1% 2% 2% 2% 1% 1% Philip Morris In PM US Cigarettes Cocopalm 0% 0% 0% 1% 1% 1% 1% 1% Guangzhou No.1 BATS LN Cigarettes Daqianmen 2% 2% 2% 0% 1% 1% 1% 2% Shanghai Tobacco private Cigarettes Glamour 0% 0% 0% 0% 1% 1% 0% 1% Japan Tobacco 2914 JP Cigarettes Mild Seven 1% 1% 1% 1% 1% 1% 1% 1% Japan Tobacco 2914 JP
February 2014
Credit Suisse Emerging Consumer Survey Databook 2014 Source: Credit Suisse Emerging Consumer Survey 2014 32
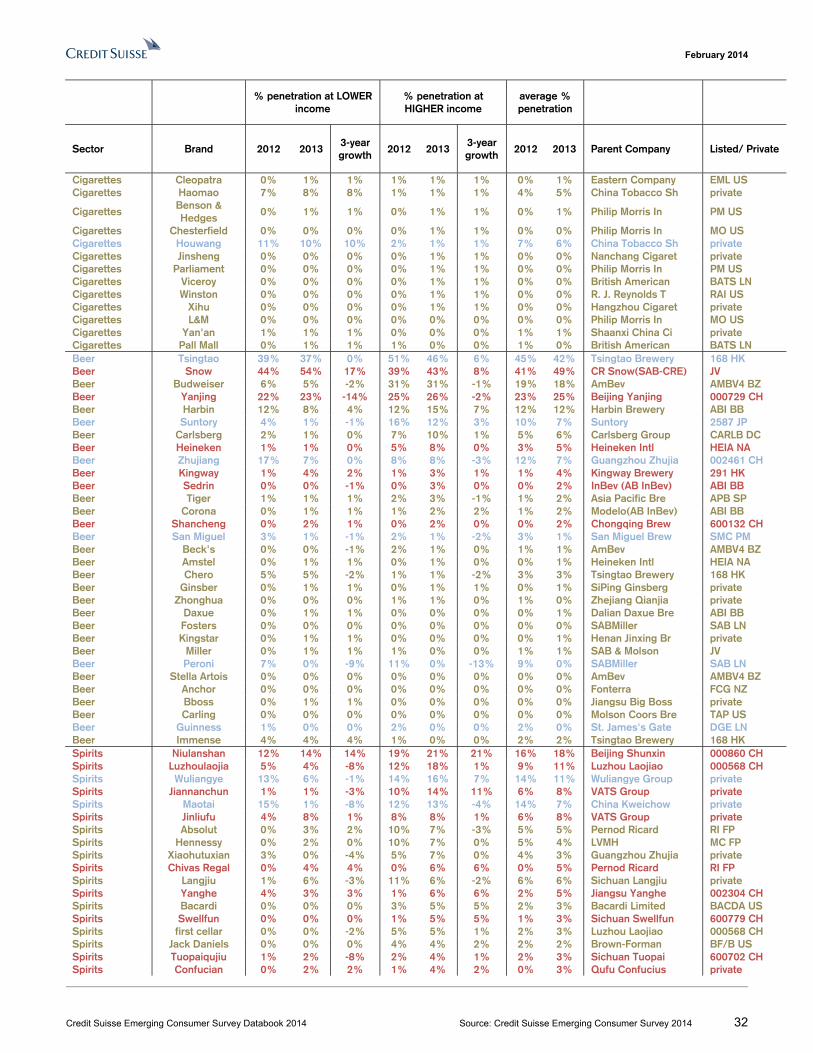
% penetration at LOWER income
% penetration at HIGHER income
average % penetration
Sector Brand 2012 2013 3-year growth
2012 2013 3-year growth
2012 2013 Parent Company Listed/ Private
Cigarettes Cleopatra 0% 1% 1% 1% 1% 1% 0% 1% Eastern Company EML US Cigarettes Haomao 7% 8% 8% 1% 1% 1% 4% 5% China Tobacco Sh private
Cigarettes Benson & Hedges
0% 1% 1% 0% 1% 1% 0% 1% Philip Morris In PM US
Cigarettes Chesterfield 0% 0% 0% 0% 1% 1% 0% 0% Philip Morris In MO US Cigarettes Houwang 11% 10% 10% 2% 1% 1% 7% 6% China Tobacco Sh private Cigarettes Jinsheng 0% 0% 0% 0% 1% 1% 0% 0% Nanchang Cigaret private Cigarettes Parliament 0% 0% 0% 0% 1% 1% 0% 0% Philip Morris In PM US Cigarettes Viceroy 0% 0% 0% 0% 1% 1% 0% 0% British American BATS LN Cigarettes Winston 0% 0% 0% 0% 1% 1% 0% 0% R. J. Reynolds T RAI US Cigarettes Xihu 0% 0% 0% 0% 1% 1% 0% 0% Hangzhou Cigaret private Cigarettes L&M 0% 0% 0% 0% 0% 0% 0% 0% Philip Morris In MO US Cigarettes Yan'an 1% 1% 1% 0% 0% 0% 1% 1% Shaanxi China Ci private Cigarettes Pall Mall 0% 1% 1% 1% 0% 0% 1% 0% British American BATS LN Beer Tsingtao 39% 37% 0% 51% 46% 6% 45% 42% Tsingtao Brewery 168 HK Beer Snow 44% 54% 17% 39% 43% 8% 41% 49% CR Snow(SAB-CRE) JV Beer Budweiser 6% 5% -2% 31% 31% -1% 19% 18% AmBev AMBV4 BZ Beer Yanjing 22% 23% -14% 25% 26% -2% 23% 25% Beijing Yanjing 000729 CH Beer Harbin 12% 8% 4% 12% 15% 7% 12% 12% Harbin Brewery ABI BB Beer Suntory 4% 1% -1% 16% 12% 3% 10% 7% Suntory 2587 JP Beer Carlsberg 2% 1% 0% 7% 10% 1% 5% 6% Carlsberg Group CARLB DC Beer Heineken 1% 1% 0% 5% 8% 0% 3% 5% Heineken Intl HEIA NA Beer Zhujiang 17% 7% 0% 8% 8% -3% 12% 7% Guangzhou Zhujia 002461 CH Beer Kingway 1% 4% 2% 1% 3% 1% 1% 4% Kingway Brewery 291 HK Beer Sedrin 0% 0% -1% 0% 3% 0% 0% 2% InBev (AB InBev) ABI BB Beer Tiger 1% 1% 1% 2% 3% -1% 1% 2% Asia Pacific Bre APB SP Beer Corona 0% 1% 1% 1% 2% 2% 1% 2% Modelo(AB InBev) ABI BB Beer Shancheng 0% 2% 1% 0% 2% 0% 0% 2% Chongqing Brew 600132 CH Beer San Miguel 3% 1% -1% 2% 1% -2% 3% 1% San Miguel Brew SMC PM Beer Beck's 0% 0% -1% 2% 1% 0% 1% 1% AmBev AMBV4 BZ Beer Amstel 0% 1% 1% 0% 1% 0% 0% 1% Heineken Intl HEIA NA Beer Chero 5% 5% -2% 1% 1% -2% 3% 3% Tsingtao Brewery 168 HK Beer Ginsber 0% 1% 1% 0% 1% 1% 0% 1% SiPing Ginsberg private Beer Zhonghua 0% 0% 0% 1% 1% 0% 1% 0% Zhejiang Qianjia private Beer Daxue 0% 1% 1% 0% 0% 0% 0% 1% Dalian Daxue Bre ABI BB Beer Fosters 0% 0% 0% 0% 0% 0% 0% 0% SABMiller SAB LN Beer Kingstar 0% 1% 1% 0% 0% 0% 0% 1% Henan Jinxing Br private Beer Miller 0% 1% 1% 1% 0% 0% 1% 1% SAB & Molson JV Beer Peroni 7% 0% -9% 11% 0% -13% 9% 0% SABMiller SAB LN Beer Stella Artois 0% 0% 0% 0% 0% 0% 0% 0% AmBev AMBV4 BZ Beer Anchor 0% 0% 0% 0% 0% 0% 0% 0% Fonterra FCG NZ Beer Bboss 0% 1% 1% 0% 0% 0% 0% 0% Jiangsu Big Boss private Beer Carling 0% 0% 0% 0% 0% 0% 0% 0% Molson Coors Bre TAP US Beer Guinness 1% 0% 0% 2% 0% 0% 2% 0% St. James's Gate DGE LN Beer Immense 4% 4% 4% 1% 0% 0% 2% 2% Tsingtao Brewery 168 HK Spirits Niulanshan 12% 14% 14% 19% 21% 21% 16% 18% Beijing Shunxin 000860 CH Spirits Luzhoulaojia 5% 4% -8% 12% 18% 1% 9% 11% Luzhou Laojiao 000568 CH Spirits Wuliangye 13% 6% -1% 14% 16% 7% 14% 11% Wuliangye Group private Spirits Jiannanchun 1% 1% -3% 10% 14% 11% 6% 8% VATS Group private Spirits Maotai 15% 1% -8% 12% 13% -4% 14% 7% China Kweichow private Spirits Jinliufu 4% 8% 1% 8% 8% 1% 6% 8% VATS Group private Spirits Absolut 0% 3% 2% 10% 7% -3% 5% 5% Pernod Ricard RI FP Spirits Hennessy 0% 2% 0% 10% 7% 0% 5% 4% LVMH MC FP Spirits Xiaohutuxian 3% 0% -4% 5% 7% 0% 4% 3% Guangzhou Zhujia private Spirits Chivas Regal 0% 4% 4% 0% 6% 6% 0% 5% Pernod Ricard RI FP Spirits Langjiu 1% 6% -3% 11% 6% -2% 6% 6% Sichuan Langjiu private Spirits Yanghe 4% 3% 3% 1% 6% 6% 2% 5% Jiangsu Yanghe 002304 CH Spirits Bacardi 0% 0% 0% 3% 5% 5% 2% 3% Bacardi Limited BACDA US Spirits Swellfun 0% 0% 0% 1% 5% 5% 1% 3% Sichuan Swellfun 600779 CH Spirits first cellar 0% 0% -2% 5% 5% 1% 2% 3% Luzhou Laojiao 000568 CH Spirits Jack Daniels 0% 0% 0% 4% 4% 2% 2% 2% Brown-Forman BF/B US Spirits Tuopaiqujiu 1% 2% -8% 2% 4% 1% 2% 3% Sichuan Tuopai 600702 CH Spirits Confucian 0% 2% 2% 1% 4% 2% 0% 3% Qufu Confucius private
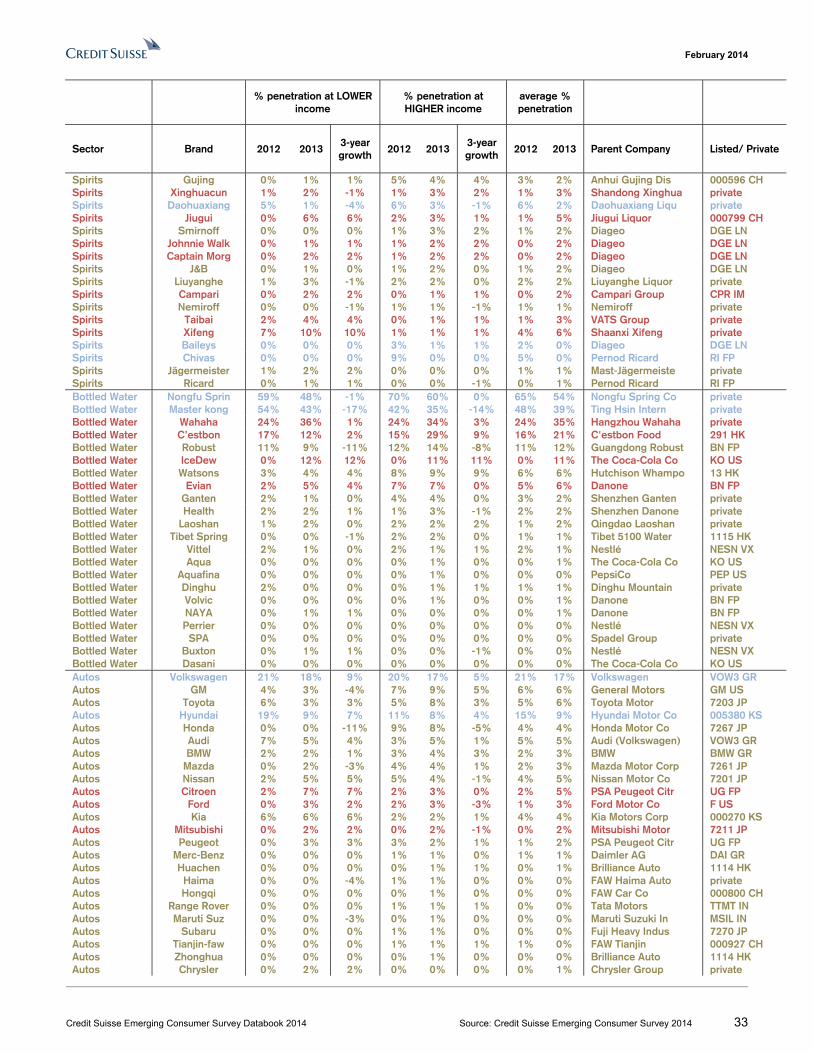
February 2014
Credit Suisse Emerging Consumer Survey Databook 2014 Source: Credit Suisse Emerging Consumer Survey 2014 33
% penetration at LOWER income
% penetration at HIGHER income
average % penetration
Sector Brand 2012 2013 3-year growth
2012 2013 3-year growth
2012 2013 Parent Company Listed/ Private
Spirits Gujing 0% 1% 1% 5% 4% 4% 3% 2% Anhui Gujing Dis 000596 CH Spirits Xinghuacun 1% 2% -1% 1% 3% 2% 1% 3% Shandong Xinghua private Spirits Daohuaxiang 5% 1% -4% 6% 3% -1% 6% 2% Daohuaxiang Liqu private Spirits Jiugui 0% 6% 6% 2% 3% 1% 1% 5% Jiugui Liquor 000799 CH Spirits Smirnoff 0% 0% 0% 1% 3% 2% 1% 2% Diageo DGE LN Spirits Johnnie Walk 0% 1% 1% 1% 2% 2% 0% 2% Diageo DGE LN Spirits Captain Morg 0% 2% 2% 1% 2% 2% 0% 2% Diageo DGE LN Spirits J&B 0% 1% 0% 1% 2% 0% 1% 2% Diageo DGE LN Spirits Liuyanghe 1% 3% -1% 2% 2% 0% 2% 2% Liuyanghe Liquor private Spirits Campari 0% 2% 2% 0% 1% 1% 0% 2% Campari Group CPR IM Spirits Nemiroff 0% 0% -1% 1% 1% -1% 1% 1% Nemiroff private Spirits Taibai 2% 4% 4% 0% 1% 1% 1% 3% VATS Group private Spirits Xifeng 7% 10% 10% 1% 1% 1% 4% 6% Shaanxi Xifeng private Spirits Baileys 0% 0% 0% 3% 1% 1% 2% 0% Diageo DGE LN Spirits Chivas 0% 0% 0% 9% 0% 0% 5% 0% Pernod Ricard RI FP Spirits Jägermeister 1% 2% 2% 0% 0% 0% 1% 1% Mast-Jägermeiste private Spirits Ricard 0% 1% 1% 0% 0% -1% 0% 1% Pernod Ricard RI FP Bottled Water Nongfu Sprin 59% 48% -1% 70% 60% 0% 65% 54% Nongfu Spring Co private Bottled Water Master kong 54% 43% -17% 42% 35% -14% 48% 39% Ting Hsin Intern private Bottled Water Wahaha 24% 36% 1% 24% 34% 3% 24% 35% Hangzhou Wahaha private Bottled Water C’estbon 17% 12% 2% 15% 29% 9% 16% 21% C'estbon Food 291 HK Bottled Water Robust 11% 9% -11% 12% 14% -8% 11% 12% Guangdong Robust BN FP Bottled Water IceDew 0% 12% 12% 0% 11% 11% 0% 11% The Coca-Cola Co KO US Bottled Water Watsons 3% 4% 4% 8% 9% 9% 6% 6% Hutchison Whampo 13 HK Bottled Water Evian 2% 5% 4% 7% 7% 0% 5% 6% Danone BN FP Bottled Water Ganten 2% 1% 0% 4% 4% 0% 3% 2% Shenzhen Ganten private Bottled Water Health 2% 2% 1% 1% 3% -1% 2% 2% Shenzhen Danone private Bottled Water Laoshan 1% 2% 0% 2% 2% 2% 1% 2% Qingdao Laoshan private Bottled Water Tibet Spring 0% 0% -1% 2% 2% 0% 1% 1% Tibet 5100 Water 1115 HK Bottled Water Vittel 2% 1% 0% 2% 1% 1% 2% 1% Nestlé NESN VX Bottled Water Aqua 0% 0% 0% 0% 1% 0% 0% 1% The Coca-Cola Co KO US Bottled Water Aquafina 0% 0% 0% 0% 1% 0% 0% 0% PepsiCo PEP US Bottled Water Dinghu 2% 0% 0% 0% 1% 1% 1% 1% Dinghu Mountain private Bottled Water Volvic 0% 0% 0% 0% 1% 0% 0% 1% Danone BN FP Bottled Water NAYA 0% 1% 1% 0% 0% 0% 0% 1% Danone BN FP Bottled Water Perrier 0% 0% 0% 0% 0% 0% 0% 0% Nestlé NESN VX Bottled Water SPA 0% 0% 0% 0% 0% 0% 0% 0% Spadel Group private Bottled Water Buxton 0% 1% 1% 0% 0% -1% 0% 0% Nestlé NESN VX Bottled Water Dasani 0% 0% 0% 0% 0% 0% 0% 0% The Coca-Cola Co KO US Autos Volkswagen 21% 18% 9% 20% 17% 5% 21% 17% Volkswagen VOW3 GR Autos GM 4% 3% -4% 7% 9% 5% 6% 6% General Motors GM US Autos Toyota 6% 3% 3% 5% 8% 3% 5% 6% Toyota Motor 7203 JP Autos Hyundai 19% 9% 7% 11% 8% 4% 15% 9% Hyundai Motor Co 005380 KS Autos Honda 0% 0% -11% 9% 8% -5% 4% 4% Honda Motor Co 7267 JP Autos Audi 7% 5% 4% 3% 5% 1% 5% 5% Audi (Volkswagen) VOW3 GR Autos BMW 2% 2% 1% 3% 4% 3% 2% 3% BMW BMW GR Autos Mazda 0% 2% -3% 4% 4% 1% 2% 3% Mazda Motor Corp 7261 JP Autos Nissan 2% 5% 5% 5% 4% -1% 4% 5% Nissan Motor Co 7201 JP Autos Citroen 2% 7% 7% 2% 3% 0% 2% 5% PSA Peugeot Citr UG FP Autos Ford 0% 3% 2% 2% 3% -3% 1% 3% Ford Motor Co F US Autos Kia 6% 6% 6% 2% 2% 1% 4% 4% Kia Motors Corp 000270 KS Autos Mitsubishi 0% 2% 2% 0% 2% -1% 0% 2% Mitsubishi Motor 7211 JP Autos Peugeot 0% 3% 3% 3% 2% 1% 1% 2% PSA Peugeot Citr UG FP Autos Merc-Benz 0% 0% 0% 1% 1% 0% 1% 1% Daimler AG DAI GR Autos Huachen 0% 0% 0% 0% 1% 1% 0% 1% Brilliance Auto 1114 HK Autos Haima 0% 0% -4% 1% 1% 0% 0% 0% FAW Haima Auto private Autos Hongqi 0% 0% 0% 0% 1% 0% 0% 0% FAW Car Co 000800 CH Autos Range Rover 0% 0% 0% 1% 1% 1% 0% 0% Tata Motors TTMT IN Autos Maruti Suz 0% 0% -3% 0% 1% 0% 0% 0% Maruti Suzuki In MSIL IN Autos Subaru 0% 0% 0% 1% 1% 0% 0% 0% Fuji Heavy Indus 7270 JP Autos Tianjin-faw 0% 0% 0% 1% 1% 1% 1% 0% FAW Tianjin 000927 CH Autos Zhonghua 0% 0% 0% 0% 1% 0% 0% 0% Brilliance Auto 1114 HK Autos Chrysler 0% 2% 2% 0% 0% 0% 0% 1% Chrysler Group private
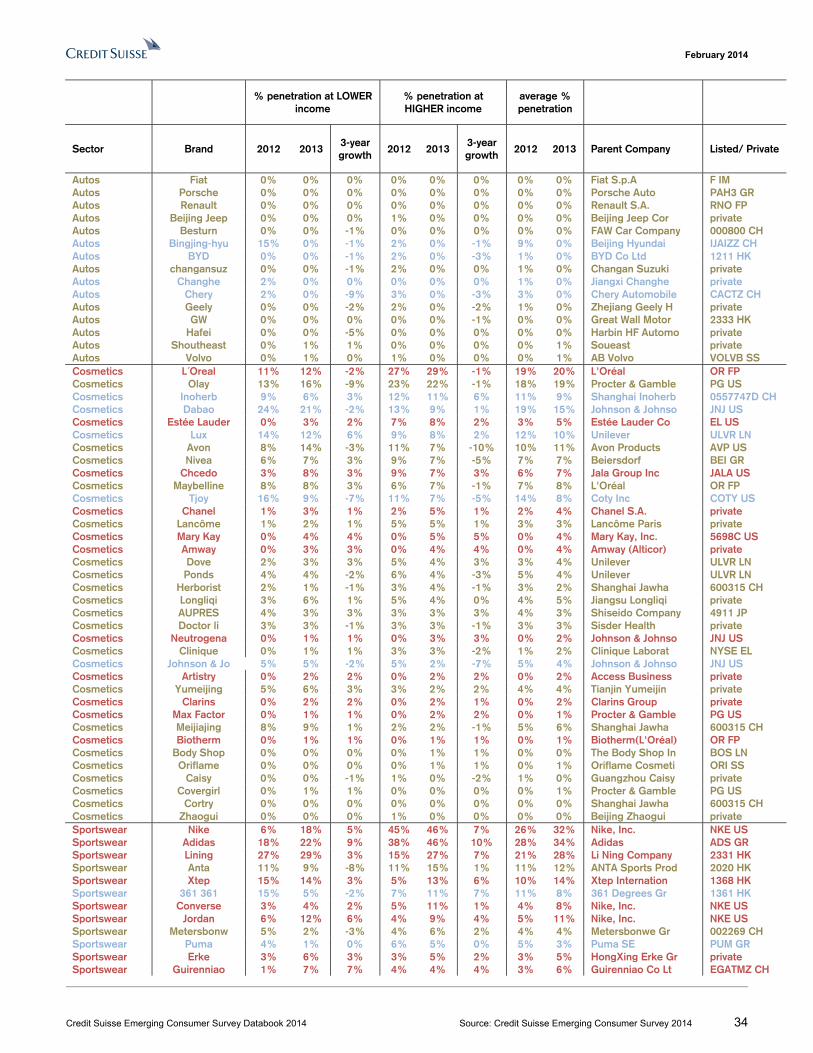
February 2014
Credit Suisse Emerging Consumer Survey Databook 2014 Source: Credit Suisse Emerging Consumer Survey 2014 34
% penetration at LOWER income
% penetration at HIGHER income
average % penetration
Sector Brand 2012 2013 3-year growth
2012 2013 3-year growth
2012 2013 Parent Company Listed/ Private
Autos Fiat 0% 0% 0% 0% 0% 0% 0% 0% Fiat S.p.A F IM Autos Porsche 0% 0% 0% 0% 0% 0% 0% 0% Porsche Auto PAH3 GR Autos Renault 0% 0% 0% 0% 0% 0% 0% 0% Renault S.A. RNO FP Autos Beijing Jeep 0% 0% 0% 1% 0% 0% 0% 0% Beijing Jeep Cor private Autos Besturn 0% 0% -1% 0% 0% 0% 0% 0% FAW Car Company 000800 CH Autos Bingjing-hyu 15% 0% -1% 2% 0% -1% 9% 0% Beijing Hyundai IJAIZZ CH Autos BYD 0% 0% -1% 2% 0% -3% 1% 0% BYD Co Ltd 1211 HK Autos changansuz 0% 0% -1% 2% 0% 0% 1% 0% Changan Suzuki private Autos Changhe 2% 0% 0% 0% 0% 0% 1% 0% Jiangxi Changhe private Autos Chery 2% 0% -9% 3% 0% -3% 3% 0% Chery Automobile CACTZ CH Autos Geely 0% 0% -2% 2% 0% -2% 1% 0% Zhejiang Geely H private Autos GW 0% 0% 0% 0% 0% -1% 0% 0% Great Wall Motor 2333 HK Autos Hafei 0% 0% -5% 0% 0% 0% 0% 0% Harbin HF Automo private Autos Shoutheast 0% 1% 1% 0% 0% 0% 0% 1% Soueast private Autos Volvo 0% 1% 0% 1% 0% 0% 0% 1% AB Volvo VOLVB SS Cosmetics L´Oreal 11% 12% -2% 27% 29% -1% 19% 20% L'Oréal OR FP Cosmetics Olay 13% 16% -9% 23% 22% -1% 18% 19% Procter & Gamble PG US Cosmetics Inoherb 9% 6% 3% 12% 11% 6% 11% 9% Shanghai Inoherb 0557747D CH Cosmetics Dabao 24% 21% -2% 13% 9% 1% 19% 15% Johnson & Johnso JNJ US Cosmetics Estée Lauder 0% 3% 2% 7% 8% 2% 3% 5% Estée Lauder Co EL US Cosmetics Lux 14% 12% 6% 9% 8% 2% 12% 10% Unilever ULVR LN Cosmetics Avon 8% 14% -3% 11% 7% -10% 10% 11% Avon Products AVP US Cosmetics Nivea 6% 7% 3% 9% 7% -5% 7% 7% Beiersdorf BEI GR Cosmetics Chcedo 3% 8% 3% 9% 7% 3% 6% 7% Jala Group Inc JALA US Cosmetics Maybelline 8% 8% 3% 6% 7% -1% 7% 8% L'Oréal OR FP Cosmetics Tjoy 16% 9% -7% 11% 7% -5% 14% 8% Coty Inc COTY US Cosmetics Chanel 1% 3% 1% 2% 5% 1% 2% 4% Chanel S.A. private Cosmetics Lancôme 1% 2% 1% 5% 5% 1% 3% 3% Lancôme Paris private Cosmetics Mary Kay 0% 4% 4% 0% 5% 5% 0% 4% Mary Kay, Inc. 5698C US Cosmetics Amway 0% 3% 3% 0% 4% 4% 0% 4% Amway (Alticor) private Cosmetics Dove 2% 3% 3% 5% 4% 3% 3% 4% Unilever ULVR LN Cosmetics Ponds 4% 4% -2% 6% 4% -3% 5% 4% Unilever ULVR LN Cosmetics Herborist 2% 1% -1% 3% 4% -1% 3% 2% Shanghai Jawha 600315 CH Cosmetics Longliqi 3% 6% 1% 5% 4% 0% 4% 5% Jiangsu Longliqi private Cosmetics AUPRES 4% 3% 3% 3% 3% 3% 4% 3% Shiseido Company 4911 JP Cosmetics Doctor li 3% 3% -1% 3% 3% -1% 3% 3% Sisder Health private Cosmetics Neutrogena 0% 1% 1% 0% 3% 3% 0% 2% Johnson & Johnso JNJ US Cosmetics Clinique 0% 1% 1% 3% 3% -2% 1% 2% Clinique Laborat NYSE EL Cosmetics Johnson & Jo 5% 5% -2% 5% 2% -7% 5% 4% Johnson & Johnso JNJ US Cosmetics Artistry 0% 2% 2% 0% 2% 2% 0% 2% Access Business private Cosmetics Yumeijing 5% 6% 3% 3% 2% 2% 4% 4% Tianjin Yumeijin private Cosmetics Clarins 0% 2% 2% 0% 2% 1% 0% 2% Clarins Group private Cosmetics Max Factor 0% 1% 1% 0% 2% 2% 0% 1% Procter & Gamble PG US Cosmetics Meijiajing 8% 9% 1% 2% 2% -1% 5% 6% Shanghai Jawha 600315 CH Cosmetics Biotherm 0% 1% 1% 0% 1% 1% 0% 1% Biotherm(L'Oréal) OR FP Cosmetics Body Shop 0% 0% 0% 0% 1% 1% 0% 0% The Body Shop In BOS LN Cosmetics Oriflame 0% 0% 0% 0% 1% 1% 0% 1% Oriflame Cosmeti ORI SS Cosmetics Caisy 0% 0% -1% 1% 0% -2% 1% 0% Guangzhou Caisy private Cosmetics Covergirl 0% 1% 1% 0% 0% 0% 0% 1% Procter & Gamble PG US Cosmetics Cortry 0% 0% 0% 0% 0% 0% 0% 0% Shanghai Jawha 600315 CH Cosmetics Zhaogui 0% 0% 0% 1% 0% 0% 0% 0% Beijing Zhaogui private Sportswear Nike 6% 18% 5% 45% 46% 7% 26% 32% Nike, Inc. NKE US Sportswear Adidas 18% 22% 9% 38% 46% 10% 28% 34% Adidas ADS GR Sportswear Lining 27% 29% 3% 15% 27% 7% 21% 28% Li Ning Company 2331 HK Sportswear Anta 11% 9% -8% 11% 15% 1% 11% 12% ANTA Sports Prod 2020 HK Sportswear Xtep 15% 14% 3% 5% 13% 6% 10% 14% Xtep Internation 1368 HK Sportswear 361 361 15% 5% -2% 7% 11% 7% 11% 8% 361 Degrees Gr 1361 HK Sportswear Converse 3% 4% 2% 5% 11% 1% 4% 8% Nike, Inc. NKE US Sportswear Jordan 6% 12% 6% 4% 9% 4% 5% 11% Nike, Inc. NKE US Sportswear Metersbonw 5% 2% -3% 4% 6% 2% 4% 4% Metersbonwe Gr 002269 CH Sportswear Puma 4% 1% 0% 6% 5% 0% 5% 3% Puma SE PUM GR Sportswear Erke 3% 6% 3% 3% 5% 2% 3% 5% HongXing Erke Gr private Sportswear Guirenniao 1% 7% 7% 4% 4% 4% 3% 6% Guirenniao Co Lt EGATMZ CH
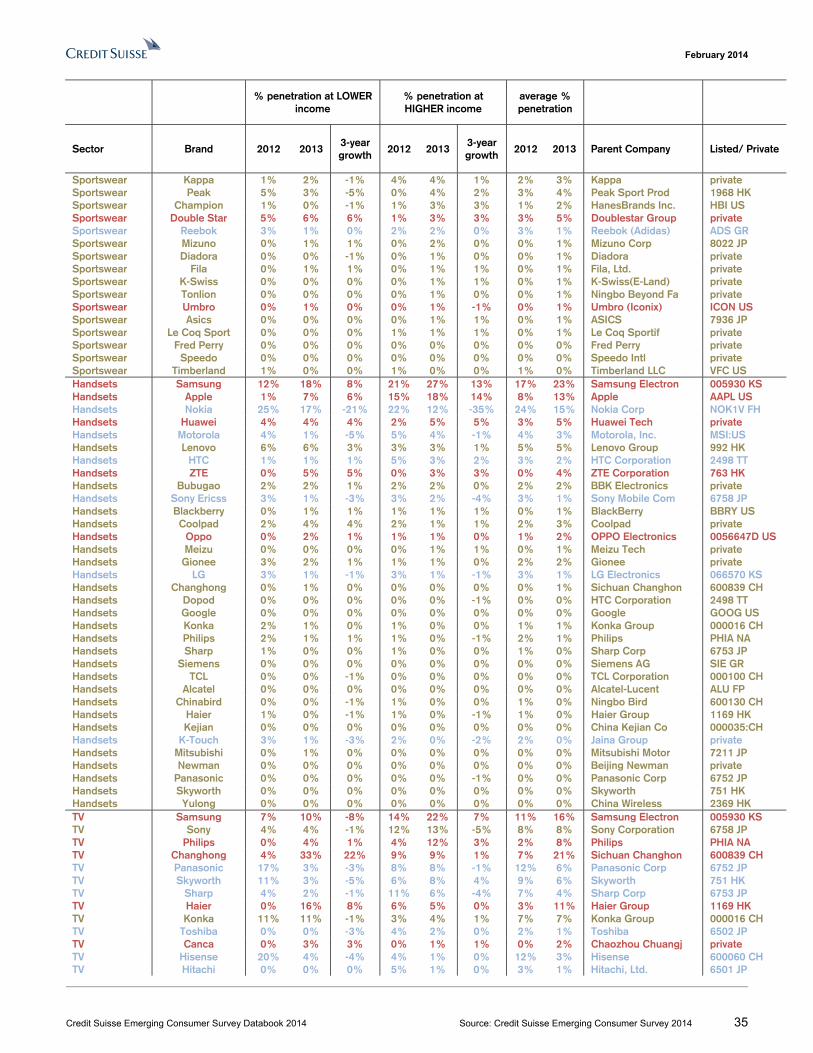
February 2014
Credit Suisse Emerging Consumer Survey Databook 2014 Source: Credit Suisse Emerging Consumer Survey 2014 35
% penetration at LOWER income
% penetration at HIGHER income
average % penetration
Sector Brand 2012 2013 3-year growth
2012 2013 3-year growth
2012 2013 Parent Company Listed/ Private
Sportswear Kappa 1% 2% -1% 4% 4% 1% 2% 3% Kappa private Sportswear Peak 5% 3% -5% 0% 4% 2% 3% 4% Peak Sport Prod 1968 HK Sportswear Champion 1% 0% -1% 1% 3% 3% 1% 2% HanesBrands Inc. HBI US Sportswear Double Star 5% 6% 6% 1% 3% 3% 3% 5% Doublestar Group private Sportswear Reebok 3% 1% 0% 2% 2% 0% 3% 1% Reebok (Adidas) ADS GR Sportswear Mizuno 0% 1% 1% 0% 2% 0% 0% 1% Mizuno Corp 8022 JP Sportswear Diadora 0% 0% -1% 0% 1% 0% 0% 1% Diadora private Sportswear Fila 0% 1% 1% 0% 1% 1% 0% 1% Fila, Ltd. private Sportswear K-Swiss 0% 0% 0% 0% 1% 1% 0% 1% K-Swiss(E-Land) private Sportswear Tonlion 0% 0% 0% 0% 1% 0% 0% 1% Ningbo Beyond Fa private Sportswear Umbro 0% 1% 0% 0% 1% -1% 0% 1% Umbro (Iconix) ICON US Sportswear Asics 0% 0% 0% 0% 1% 1% 0% 1% ASICS 7936 JP Sportswear Le Coq Sport 0% 0% 0% 1% 1% 1% 0% 1% Le Coq Sportif private Sportswear Fred Perry 0% 0% 0% 0% 0% 0% 0% 0% Fred Perry private Sportswear Speedo 0% 0% 0% 0% 0% 0% 0% 0% Speedo Intl private Sportswear Timberland 1% 0% 0% 1% 0% 0% 1% 0% Timberland LLC VFC US Handsets Samsung 12% 18% 8% 21% 27% 13% 17% 23% Samsung Electron 005930 KS Handsets Apple 1% 7% 6% 15% 18% 14% 8% 13% Apple AAPL US Handsets Nokia 25% 17% -21% 22% 12% -35% 24% 15% Nokia Corp NOK1V FH Handsets Huawei 4% 4% 4% 2% 5% 5% 3% 5% Huawei Tech private Handsets Motorola 4% 1% -5% 5% 4% -1% 4% 3% Motorola, Inc. MSI:US Handsets Lenovo 6% 6% 3% 3% 3% 1% 5% 5% Lenovo Group 992 HK Handsets HTC 1% 1% 1% 5% 3% 2% 3% 2% HTC Corporation 2498 TT Handsets ZTE 0% 5% 5% 0% 3% 3% 0% 4% ZTE Corporation 763 HK Handsets Bubugao 2% 2% 1% 2% 2% 0% 2% 2% BBK Electronics private Handsets Sony Ericss 3% 1% -3% 3% 2% -4% 3% 1% Sony Mobile Com 6758 JP Handsets Blackberry 0% 1% 1% 1% 1% 1% 0% 1% BlackBerry BBRY US Handsets Coolpad 2% 4% 4% 2% 1% 1% 2% 3% Coolpad private Handsets Oppo 0% 2% 1% 1% 1% 0% 1% 2% OPPO Electronics 0056647D US Handsets Meizu 0% 0% 0% 0% 1% 1% 0% 1% Meizu Tech private Handsets Gionee 3% 2% 1% 1% 1% 0% 2% 2% Gionee private Handsets LG 3% 1% -1% 3% 1% -1% 3% 1% LG Electronics 066570 KS Handsets Changhong 0% 1% 0% 0% 0% 0% 0% 1% Sichuan Changhon 600839 CH Handsets Dopod 0% 0% 0% 0% 0% -1% 0% 0% HTC Corporation 2498 TT Handsets Google 0% 0% 0% 0% 0% 0% 0% 0% Google GOOG US Handsets Konka 2% 1% 0% 1% 0% 0% 1% 1% Konka Group 000016 CH Handsets Philips 2% 1% 1% 1% 0% -1% 2% 1% Philips PHIA NA Handsets Sharp 1% 0% 0% 1% 0% 0% 1% 0% Sharp Corp 6753 JP Handsets Siemens 0% 0% 0% 0% 0% 0% 0% 0% Siemens AG SIE GR Handsets TCL 0% 0% -1% 0% 0% 0% 0% 0% TCL Corporation 000100 CH Handsets Alcatel 0% 0% 0% 0% 0% 0% 0% 0% Alcatel-Lucent ALU FP Handsets Chinabird 0% 0% -1% 1% 0% 0% 1% 0% Ningbo Bird 600130 CH Handsets Haier 1% 0% -1% 1% 0% -1% 1% 0% Haier Group 1169 HK Handsets Kejian 0% 0% 0% 0% 0% 0% 0% 0% China Kejian Co 000035:CH Handsets K-Touch 3% 1% -3% 2% 0% -2% 2% 0% Jaina Group private Handsets Mitsubishi 0% 1% 0% 0% 0% 0% 0% 0% Mitsubishi Motor 7211 JP Handsets Newman 0% 0% 0% 0% 0% 0% 0% 0% Beijing Newman private Handsets Panasonic 0% 0% 0% 0% 0% -1% 0% 0% Panasonic Corp 6752 JP Handsets Skyworth 0% 0% 0% 0% 0% 0% 0% 0% Skyworth 751 HK Handsets Yulong 0% 0% 0% 0% 0% 0% 0% 0% China Wireless 2369 HK TV Samsung 7% 10% -8% 14% 22% 7% 11% 16% Samsung Electron 005930 KS TV Sony 4% 4% -1% 12% 13% -5% 8% 8% Sony Corporation 6758 JP TV Philips 0% 4% 1% 4% 12% 3% 2% 8% Philips PHIA NA TV Changhong 4% 33% 22% 9% 9% 1% 7% 21% Sichuan Changhon 600839 CH TV Panasonic 17% 3% -3% 8% 8% -1% 12% 6% Panasonic Corp 6752 JP TV Skyworth 11% 3% -5% 6% 8% 4% 9% 6% Skyworth 751 HK TV Sharp 4% 2% -1% 11% 6% -4% 7% 4% Sharp Corp 6753 JP TV Haier 0% 16% 8% 6% 5% 0% 3% 11% Haier Group 1169 HK TV Konka 11% 11% -1% 3% 4% 1% 7% 7% Konka Group 000016 CH TV Toshiba 0% 0% -3% 4% 2% 0% 2% 1% Toshiba 6502 JP TV Canca 0% 3% 3% 0% 1% 1% 0% 2% Chaozhou Chuangj private TV Hisense 20% 4% -4% 4% 1% 0% 12% 3% Hisense 600060 CH TV Hitachi 0% 0% 0% 5% 1% 0% 3% 1% Hitachi, Ltd. 6501 JP
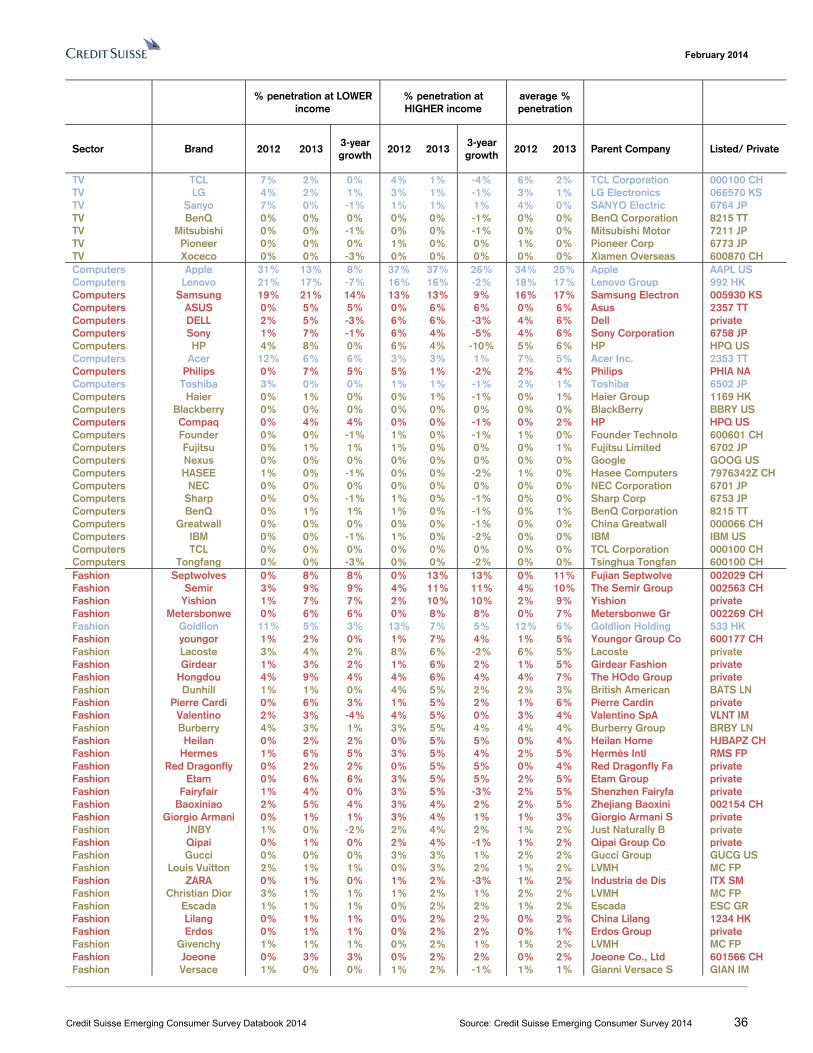
February 2014
Credit Suisse Emerging Consumer Survey Databook 2014 Source: Credit Suisse Emerging Consumer Survey 2014 36
% penetration at LOWER income
% penetration at HIGHER income
average % penetration
Sector Brand 2012 2013 3-year growth
2012 2013 3-year growth
2012 2013 Parent Company Listed/ Private
TV TCL 7% 2% 0% 4% 1% -4% 6% 2% TCL Corporation 000100 CH TV LG 4% 2% 1% 3% 1% -1% 3% 1% LG Electronics 066570 KS TV Sanyo 7% 0% -1% 1% 1% 1% 4% 0% SANYO Electric 6764 JP TV BenQ 0% 0% 0% 0% 0% -1% 0% 0% BenQ Corporation 8215 TT TV Mitsubishi 0% 0% -1% 0% 0% -1% 0% 0% Mitsubishi Motor 7211 JP TV Pioneer 0% 0% 0% 1% 0% 0% 1% 0% Pioneer Corp 6773 JP TV Xoceco 0% 0% -3% 0% 0% 0% 0% 0% Xiamen Overseas 600870 CH Computers Apple 31% 13% 8% 37% 37% 26% 34% 25% Apple AAPL US Computers Lenovo 21% 17% -7% 16% 16% -2% 18% 17% Lenovo Group 992 HK Computers Samsung 19% 21% 14% 13% 13% 9% 16% 17% Samsung Electron 005930 KS Computers ASUS 0% 5% 5% 0% 6% 6% 0% 6% Asus 2357 TT Computers DELL 2% 5% -3% 6% 6% -3% 4% 6% Dell private Computers Sony 1% 7% -1% 6% 4% -5% 4% 6% Sony Corporation 6758 JP Computers HP 4% 8% 0% 6% 4% -10% 5% 6% HP HPQ US Computers Acer 12% 6% 6% 3% 3% 1% 7% 5% Acer Inc. 2353 TT Computers Philips 0% 7% 5% 5% 1% -2% 2% 4% Philips PHIA NA Computers Toshiba 3% 0% 0% 1% 1% -1% 2% 1% Toshiba 6502 JP Computers Haier 0% 1% 0% 0% 1% -1% 0% 1% Haier Group 1169 HK Computers Blackberry 0% 0% 0% 0% 0% 0% 0% 0% BlackBerry BBRY US Computers Compaq 0% 4% 4% 0% 0% -1% 0% 2% HP HPQ US Computers Founder 0% 0% -1% 1% 0% -1% 1% 0% Founder Technolo 600601 CH Computers Fujitsu 0% 1% 1% 1% 0% 0% 0% 1% Fujitsu Limited 6702 JP Computers Nexus 0% 0% 0% 0% 0% 0% 0% 0% Google GOOG US Computers HASEE 1% 0% -1% 0% 0% -2% 1% 0% Hasee Computers 7976342Z CH Computers NEC 0% 0% 0% 0% 0% 0% 0% 0% NEC Corporation 6701 JP Computers Sharp 0% 0% -1% 1% 0% -1% 0% 0% Sharp Corp 6753 JP Computers BenQ 0% 1% 1% 1% 0% -1% 0% 1% BenQ Corporation 8215 TT Computers Greatwall 0% 0% 0% 0% 0% -1% 0% 0% China Greatwall 000066 CH Computers IBM 0% 0% -1% 1% 0% -2% 0% 0% IBM IBM US Computers TCL 0% 0% 0% 0% 0% 0% 0% 0% TCL Corporation 000100 CH Computers Tongfang 0% 0% -3% 0% 0% -2% 0% 0% Tsinghua Tongfan 600100 CH Fashion Septwolves 0% 8% 8% 0% 13% 13% 0% 11% Fujian Septwolve 002029 CH Fashion Semir 3% 9% 9% 4% 11% 11% 4% 10% The Semir Group 002563 CH Fashion Yishion 1% 7% 7% 2% 10% 10% 2% 9% Yishion private Fashion Metersbonwe 0% 6% 6% 0% 8% 8% 0% 7% Metersbonwe Gr 002269 CH Fashion Goldlion 11% 5% 3% 13% 7% 5% 12% 6% Goldlion Holding 533 HK Fashion youngor 1% 2% 0% 1% 7% 4% 1% 5% Youngor Group Co 600177 CH Fashion Lacoste 3% 4% 2% 8% 6% -2% 6% 5% Lacoste private Fashion Girdear 1% 3% 2% 1% 6% 2% 1% 5% Girdear Fashion private Fashion Hongdou 4% 9% 4% 4% 6% 4% 4% 7% The HOdo Group private Fashion Dunhill 1% 1% 0% 4% 5% 2% 2% 3% British American BATS LN Fashion Pierre Cardi 0% 6% 3% 1% 5% 2% 1% 6% Pierre Cardin private Fashion Valentino 2% 3% -4% 4% 5% 0% 3% 4% Valentino SpA VLNT IM Fashion Burberry 4% 3% 1% 3% 5% 4% 4% 4% Burberry Group BRBY LN Fashion Heilan 0% 2% 2% 0% 5% 5% 0% 4% Heilan Home HJBAPZ CH Fashion Hermes 1% 6% 5% 3% 5% 4% 2% 5% Hermès Intl RMS FP Fashion Red Dragonfly 0% 2% 2% 0% 5% 5% 0% 4% Red Dragonfly Fa private Fashion Etam 0% 6% 6% 3% 5% 5% 2% 5% Etam Group private Fashion Fairyfair 1% 4% 0% 3% 5% -3% 2% 5% Shenzhen Fairyfa private Fashion Baoxiniao 2% 5% 4% 3% 4% 2% 2% 5% Zhejiang Baoxini 002154 CH Fashion Giorgio Armani 0% 1% 1% 3% 4% 1% 1% 3% Giorgio Armani S private Fashion JNBY 1% 0% -2% 2% 4% 2% 1% 2% Just Naturally B private Fashion Qipai 0% 1% 0% 2% 4% -1% 1% 2% Qipai Group Co private Fashion Gucci 0% 0% 0% 3% 3% 1% 2% 2% Gucci Group GUCG US Fashion Louis Vuitton 2% 1% 1% 0% 3% 2% 1% 2% LVMH MC FP Fashion ZARA 0% 1% 0% 1% 2% -3% 1% 2% Industria de Dis ITX SM Fashion Christian Dior 3% 1% 1% 1% 2% 1% 2% 2% LVMH MC FP Fashion Escada 1% 1% 1% 0% 2% 2% 1% 2% Escada ESC GR Fashion Lilang 0% 1% 1% 0% 2% 2% 0% 2% China Lilang 1234 HK Fashion Erdos 0% 1% 1% 0% 2% 2% 0% 1% Erdos Group private Fashion Givenchy 1% 1% 1% 0% 2% 1% 1% 2% LVMH MC FP Fashion Joeone 0% 3% 3% 0% 2% 2% 0% 2% Joeone Co., Ltd 601566 CH Fashion Versace 1% 0% 0% 1% 2% -1% 1% 1% Gianni Versace S GIAN IM
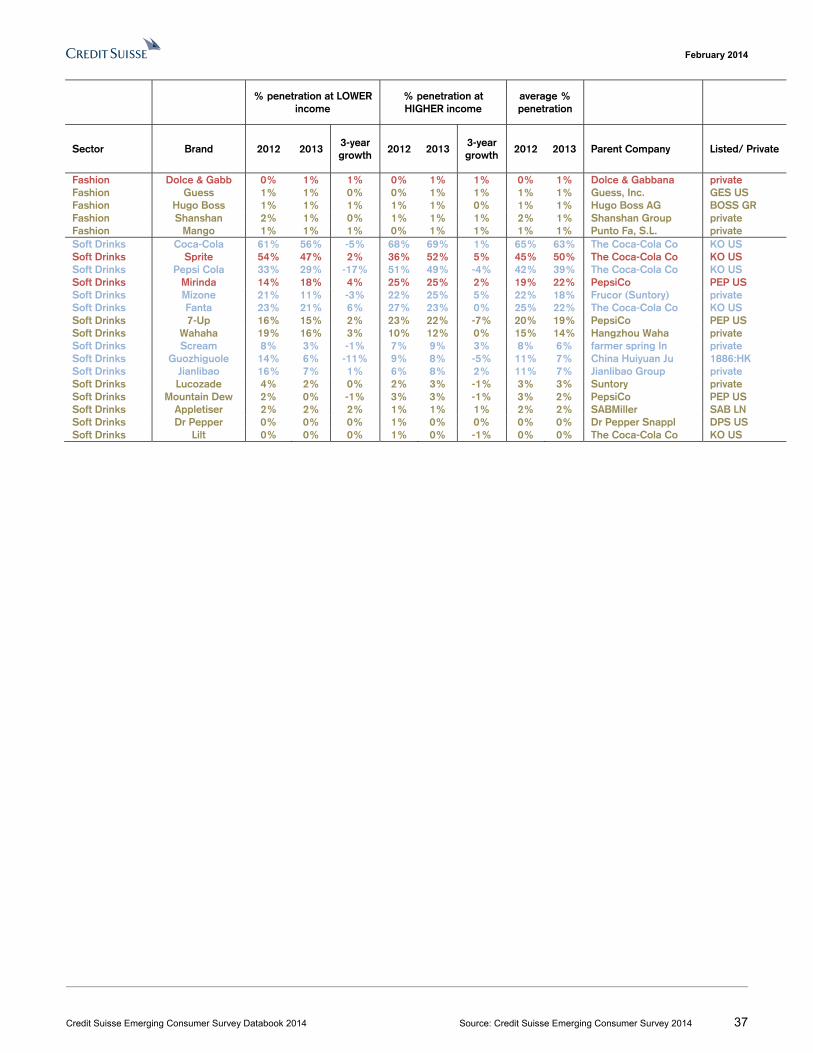
February 2014
Credit Suisse Emerging Consumer Survey Databook 2014 Source: Credit Suisse Emerging Consumer Survey 2014 37
% penetration at LOWER income
% penetration at HIGHER income
average % penetration
Sector Brand 2012 2013 3-year growth
2012 2013 3-year growth
2012 2013 Parent Company Listed/ Private
Fashion Dolce & Gabb 0% 1% 1% 0% 1% 1% 0% 1% Dolce & Gabbana private Fashion Guess 1% 1% 0% 0% 1% 1% 1% 1% Guess, Inc. GES US Fashion Hugo Boss 1% 1% 1% 1% 1% 0% 1% 1% Hugo Boss AG BOSS GR Fashion Shanshan 2% 1% 0% 1% 1% 1% 2% 1% Shanshan Group private Fashion Mango 1% 1% 1% 0% 1% 1% 1% 1% Punto Fa, S.L. private Soft Drinks Coca-Cola 61% 56% -5% 68% 69% 1% 65% 63% The Coca-Cola Co KO US Soft Drinks Sprite 54% 47% 2% 36% 52% 5% 45% 50% The Coca-Cola Co KO US Soft Drinks Pepsi Cola 33% 29% -17% 51% 49% -4% 42% 39% The Coca-Cola Co KO US Soft Drinks Mirinda 14% 18% 4% 25% 25% 2% 19% 22% PepsiCo PEP US Soft Drinks Mizone 21% 11% -3% 22% 25% 5% 22% 18% Frucor (Suntory) private Soft Drinks Fanta 23% 21% 6% 27% 23% 0% 25% 22% The Coca-Cola Co KO US Soft Drinks 7-Up 16% 15% 2% 23% 22% -7% 20% 19% PepsiCo PEP US Soft Drinks Wahaha 19% 16% 3% 10% 12% 0% 15% 14% Hangzhou Waha private Soft Drinks Scream 8% 3% -1% 7% 9% 3% 8% 6% farmer spring In private Soft Drinks Guozhiguole 14% 6% -11% 9% 8% -5% 11% 7% China Huiyuan Ju 1886:HK Soft Drinks Jianlibao 16% 7% 1% 6% 8% 2% 11% 7% Jianlibao Group private Soft Drinks Lucozade 4% 2% 0% 2% 3% -1% 3% 3% Suntory private Soft Drinks Mountain Dew 2% 0% -1% 3% 3% -1% 3% 2% PepsiCo PEP US Soft Drinks Appletiser 2% 2% 2% 1% 1% 1% 2% 2% SABMiller SAB LN Soft Drinks Dr Pepper 0% 0% 0% 1% 0% 0% 0% 0% Dr Pepper Snappl DPS US Soft Drinks Lilt 0% 0% 0% 1% 0% -1% 0% 0% The Coca-Cola Co KO US
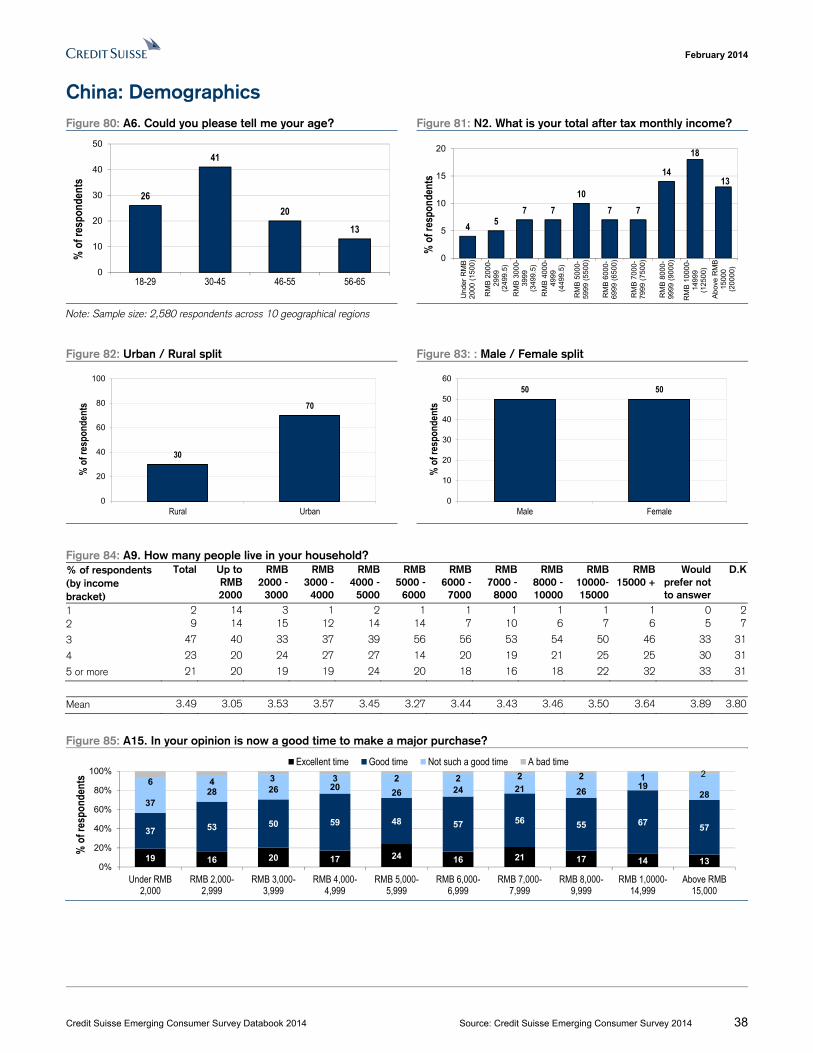
February 2014
Credit Suisse Emerging Consumer Survey Databook 2014 Source: Credit Suisse Emerging Consumer Survey 2014 38
China: Demographics Figure 80: A6. Could you please tell me your age? Figure 81: N2. What is your total after tax monthly income?
Note: Sample size: 2,580 respondents across 10 geographical regions
Figure 82: Urban / Rural split Figure 83: : Male / Female split
Figure 84: A9. How many people live in your household? % of respondents (by income bracket)
Total Up to RMB 2000
RMB 2000 -
3000
RMB 3000 -
4000
RMB 4000 -
5000
RMB 5000 -
6000
RMB 6000 -
7000
RMB 7000 -
8000
RMB 8000 -10000
RMB 10000- 15000
RMB 15000 +
Would prefer not to answer
D.K
1 2 14 3 1 2 1 1 1 1 1 1 0 22 9 14 15 12 14 14 7 10 6 7 6 5 7
3 47 40 33 37 39 56 56 53 54 50 46 33 31
4 23 20 24 27 27 14 20 19 21 25 25 30 31
5 or more 21 20 19 19 24 20 18 16 18 22 32 33 31
Mean 3.49 3.05 3.53 3.57 3.45 3.27 3.44 3.43 3.46 3.50 3.64 3.89 3.80
Figure 85: A15. In your opinion is now a good time to make a major purchase?
26
41
20
13
0
10
20
30
40
50
18-29 30-45 46-55 56-65
% o
f res
pond
ents
4 57 7
107 7
14
18
13
0
5
10
15
20
Und
er R
MB
2000
(15
00)
RM
B 2
000-
2999
(249
9.5
)
RM
B 3
000-
3999
(349
9.5
)
RM
B 4
000-
4999
(449
9.5
)
RM
B 5
000-
5999
(55
00)
RM
B 6
000-
6999
(65
00)
RM
B 7
000-
7999
(75
00)
RM
B 8
000-
9999
(90
00)
RM
B 1
0000
-14
999
(125
00)
Ab
ove
RM
B15
000
(200
00)
% o
f res
pond
ents
30
70
0
20
40
60
80
100
Rural Urban
% o
f res
pond
ents
50 50
0
10
20
30
40
50
60
Male Female
% o
f res
pond
ents
19 16 20 17 24 16 21 17 14 13
37 53 50 59 48 57 56 55 6757
3728 26 20
26 24 21 2619
28
6 4 3 3 2 2 2 2 1 2
0%
20%
40%
60%
80%
100%
Under RMB2,000
RMB 2,000-2,999
RMB 3,000-3,999
RMB 4,000-4,999
RMB 5,000-5,999
RMB 6,000-6,999
RMB 7,000-7,999
RMB 8,000-9,999
RMB 1,0000-14,999
Above RMB15,000
% o
f res
pond
ents
Excellent time Good time Not such a good time A bad time
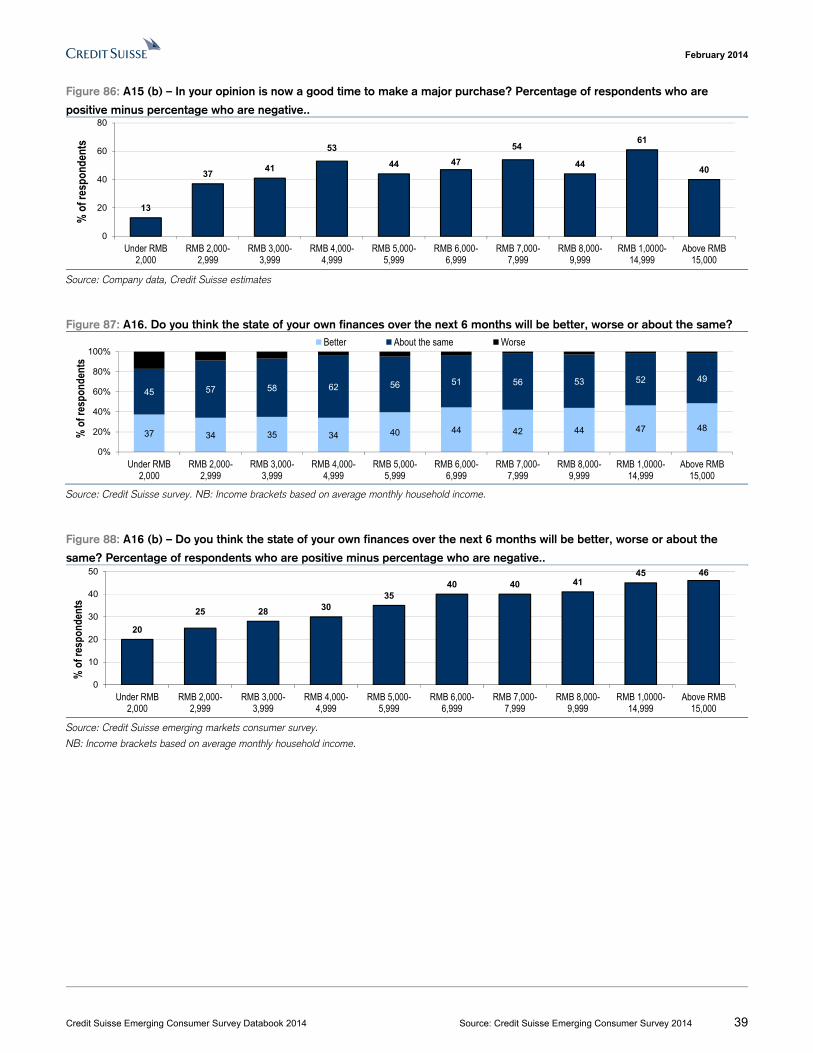
February 2014
Credit Suisse Emerging Consumer Survey Databook 2014 Source: Credit Suisse Emerging Consumer Survey 2014 39
Figure 86: A15 (b) – In your opinion is now a good time to make a major purchase? Percentage of respondents who are
positive minus percentage who are negative..
Source: Company data, Credit Suisse estimates
Figure 87: A16. Do you think the state of your own finances over the next 6 months will be better, worse or about the same?
Source: Credit Suisse survey. NB: Income brackets based on average monthly household income.
Figure 88: A16 (b) – Do you think the state of your own finances over the next 6 months will be better, worse or about the
same? Percentage of respondents who are positive minus percentage who are negative..
Source: Credit Suisse emerging markets consumer survey.
NB: Income brackets based on average monthly household income.
13
3741
53
44 47
54
44
61
40
0
20
40
60
80
Under RMB2,000
RMB 2,000-2,999
RMB 3,000-3,999
RMB 4,000-4,999
RMB 5,000-5,999
RMB 6,000-6,999
RMB 7,000-7,999
RMB 8,000-9,999
RMB 1,0000-14,999
Above RMB15,000
% o
f res
pond
ents
37 34 35 34 40 44 42 44 47 48
45 57 58 62 56 51 56 53 52 49
0%
20%
40%
60%
80%
100%
Under RMB2,000
RMB 2,000-2,999
RMB 3,000-3,999
RMB 4,000-4,999
RMB 5,000-5,999
RMB 6,000-6,999
RMB 7,000-7,999
RMB 8,000-9,999
RMB 1,0000-14,999
Above RMB15,000
% o
f res
pond
ents
Better About the same Worse
20
25 28 3035
40 40 4145 46
0
10
20
30
40
50
Under RMB2,000
RMB 2,000-2,999
RMB 3,000-3,999
RMB 4,000-4,999
RMB 5,000-5,999
RMB 6,000-6,999
RMB 7,000-7,999
RMB 8,000-9,999
RMB 1,0000-14,999
Above RMB15,000
% o
f res
pond
ents
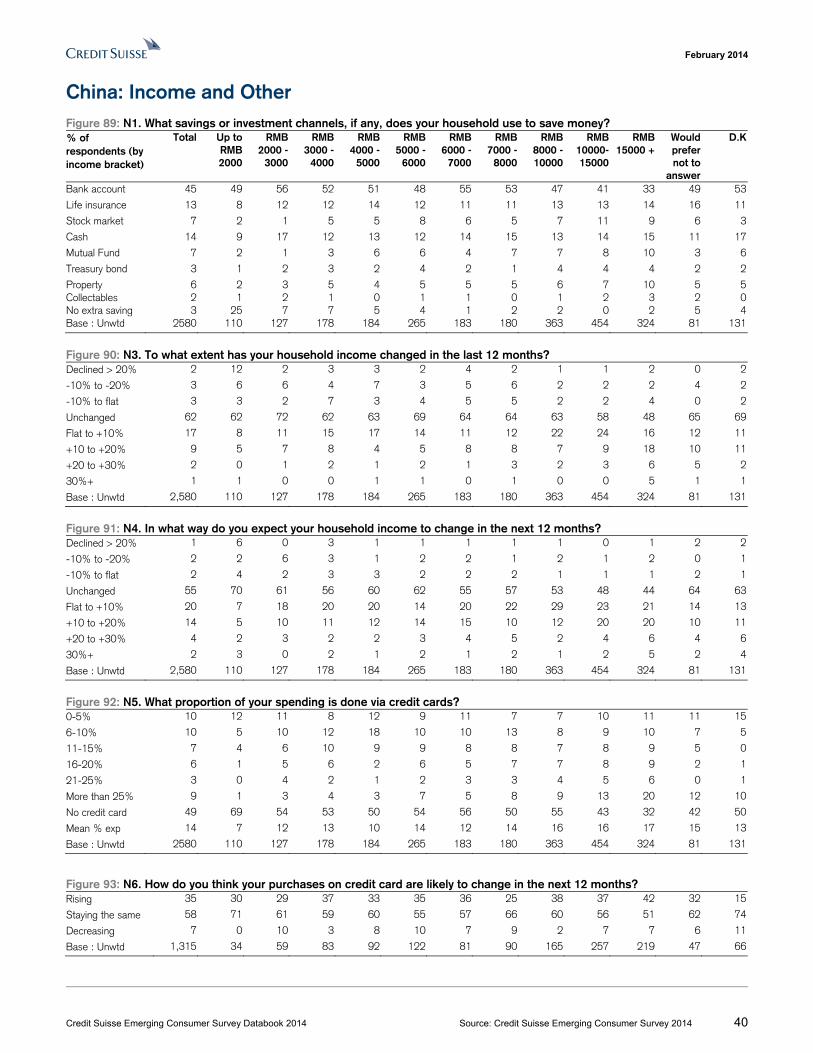
February 2014
Credit Suisse Emerging Consumer Survey Databook 2014 Source: Credit Suisse Emerging Consumer Survey 2014 40
China: Income and Other Figure 89: N1. What savings or investment channels, if any, does your household use to save money? % of respondents (by income bracket)
Total Up to RMB 2000
RMB 2000 -
3000
RMB 3000 -
4000
RMB 4000 -
5000
RMB 5000 -
6000
RMB 6000 -
7000
RMB 7000 -
8000
RMB 8000 -10000
RMB 10000- 15000
RMB 15000 +
Would prefer not to
answer
D.K
Bank account 45 49 56 52 51 48 55 53 47 41 33 49 53
Life insurance 13 8 12 12 14 12 11 11 13 13 14 16 11
Stock market 7 2 1 5 5 8 6 5 7 11 9 6 3
Cash 14 9 17 12 13 12 14 15 13 14 15 11 17
Mutual Fund 7 2 1 3 6 6 4 7 7 8 10 3 6
Treasury bond 3 1 2 3 2 4 2 1 4 4 4 2 2
Property 6 2 3 5 4 5 5 5 6 7 10 5 5Collectables 2 1 2 1 0 1 1 0 1 2 3 2 0No extra saving 3 25 7 7 5 4 1 2 2 0 2 5 4Base : Unwtd 2580 110 127 178 184 265 183 180 363 454 324 81 131
Figure 90: N3. To what extent has your household income changed in the last 12 months? Declined > 20% 2 12 2 3 3 2 4 2 1 1 2 0 2
-10% to -20% 3 6 6 4 7 3 5 6 2 2 2 4 2
-10% to flat 3 3 2 7 3 4 5 5 2 2 4 0 2
Unchanged 62 62 72 62 63 69 64 64 63 58 48 65 69
Flat to +10% 17 8 11 15 17 14 11 12 22 24 16 12 11
+10 to +20% 9 5 7 8 4 5 8 8 7 9 18 10 11
+20 to +30% 2 0 1 2 1 2 1 3 2 3 6 5 2
30%+ 1 1 0 0 1 1 0 1 0 0 5 1 1
Base : Unwtd 2,580 110 127 178 184 265 183 180 363 454 324 81 131
Figure 91: N4. In what way do you expect your household income to change in the next 12 months? Declined > 20% 1 6 0 3 1 1 1 1 1 0 1 2 2
-10% to -20% 2 2 6 3 1 2 2 1 2 1 2 0 1
-10% to flat 2 4 2 3 3 2 2 2 1 1 1 2 1
Unchanged 55 70 61 56 60 62 55 57 53 48 44 64 63
Flat to +10% 20 7 18 20 20 14 20 22 29 23 21 14 13
+10 to +20% 14 5 10 11 12 14 15 10 12 20 20 10 11
+20 to +30% 4 2 3 2 2 3 4 5 2 4 6 4 6
30%+ 2 3 0 2 1 2 1 2 1 2 5 2 4
Base : Unwtd 2,580 110 127 178 184 265 183 180 363 454 324 81 131
Figure 92: N5. What proportion of your spending is done via credit cards? 0-5% 10 12 11 8 12 9 11 7 7 10 11 11 15
6-10% 10 5 10 12 18 10 10 13 8 9 10 7 5
11-15% 7 4 6 10 9 9 8 8 7 8 9 5 0
16-20% 6 1 5 6 2 6 5 7 7 8 9 2 1
21-25% 3 0 4 2 1 2 3 3 4 5 6 0 1
More than 25% 9 1 3 4 3 7 5 8 9 13 20 12 10
No credit card 49 69 54 53 50 54 56 50 55 43 32 42 50
Mean % exp 14 7 12 13 10 14 12 14 16 16 17 15 13
Base : Unwtd 2580 110 127 178 184 265 183 180 363 454 324 81 131
Figure 93: N6. How do you think your purchases on credit card are likely to change in the next 12 months? Rising 35 30 29 37 33 35 36 25 38 37 42 32 15
Staying the same 58 71 61 59 60 55 57 66 60 56 51 62 74
Decreasing 7 0 10 3 8 10 7 9 2 7 7 6 11
Base : Unwtd 1,315 34 59 83 92 122 81 90 165 257 219 47 66
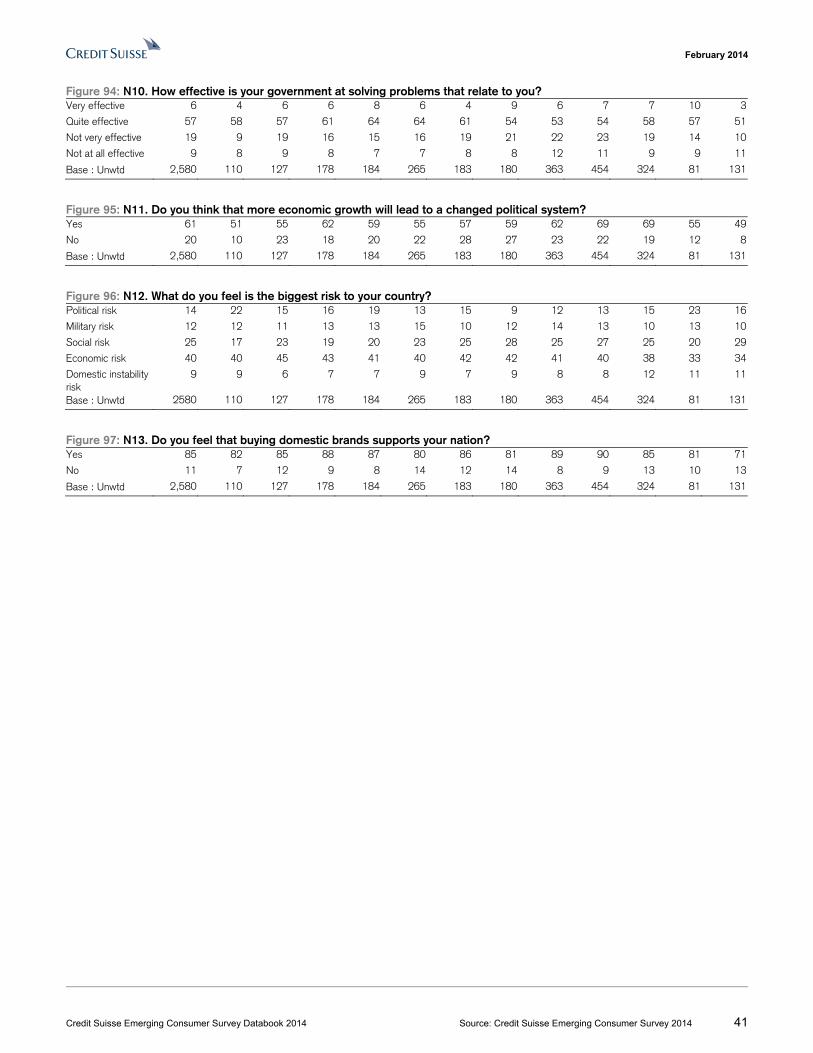
February 2014
Credit Suisse Emerging Consumer Survey Databook 2014 Source: Credit Suisse Emerging Consumer Survey 2014 41
Figure 94: N10. How effective is your government at solving problems that relate to you? Very effective 6 4 6 6 8 6 4 9 6 7 7 10 3
Quite effective 57 58 57 61 64 64 61 54 53 54 58 57 51
Not very effective 19 9 19 16 15 16 19 21 22 23 19 14 10
Not at all effective 9 8 9 8 7 7 8 8 12 11 9 9 11
Base : Unwtd 2,580 110 127 178 184 265 183 180 363 454 324 81 131
Figure 95: N11. Do you think that more economic growth will lead to a changed political system? Yes 61 51 55 62 59 55 57 59 62 69 69 55 49
No 20 10 23 18 20 22 28 27 23 22 19 12 8
Base : Unwtd 2,580 110 127 178 184 265 183 180 363 454 324 81 131
Figure 96: N12. What do you feel is the biggest risk to your country? Political risk 14 22 15 16 19 13 15 9 12 13 15 23 16
Military risk 12 12 11 13 13 15 10 12 14 13 10 13 10
Social risk 25 17 23 19 20 23 25 28 25 27 25 20 29
Economic risk 40 40 45 43 41 40 42 42 41 40 38 33 34
Domestic instability risk
9 9 6 7 7 9 7 9 8 8 12 11 11
Base : Unwtd 2580 110 127 178 184 265 183 180 363 454 324 81 131
Figure 97: N13. Do you feel that buying domestic brands supports your nation? Yes 85 82 85 88 87 80 86 81 89 90 85 81 71
No 11 7 12 9 8 14 12 14 8 9 13 10 13
Base : Unwtd 2,580 110 127 178 184 265 183 180 363 454 324 81 131
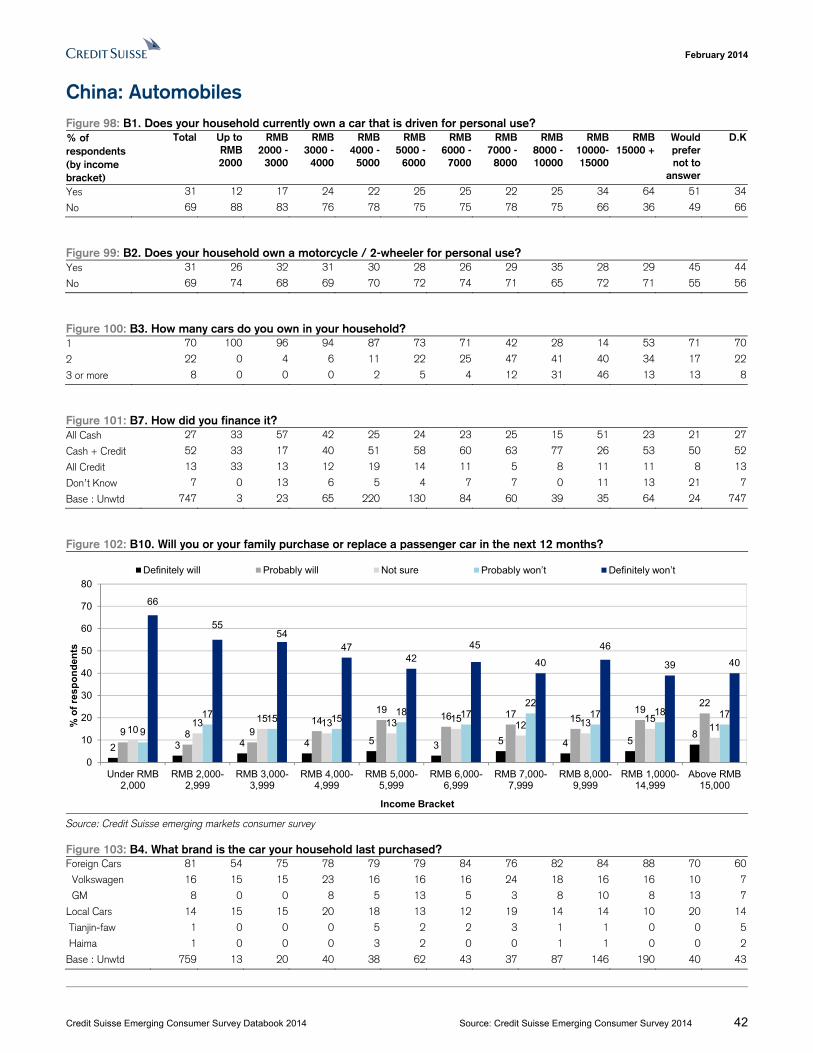
February 2014
Credit Suisse Emerging Consumer Survey Databook 2014 Source: Credit Suisse Emerging Consumer Survey 2014 42
China: Automobiles Figure 98: B1. Does your household currently own a car that is driven for personal use? % of respondents (by income bracket)
Total Up to RMB 2000
RMB 2000 -
3000
RMB 3000 -
4000
RMB 4000 -
5000
RMB 5000 -
6000
RMB 6000 -
7000
RMB 7000 -
8000
RMB 8000 -10000
RMB 10000- 15000
RMB 15000 +
Would prefer not to
answer
D.K
Yes 31 12 17 24 22 25 25 22 25 34 64 51 34
No 69 88 83 76 78 75 75 78 75 66 36 49 66
Figure 99: B2. Does your household own a motorcycle / 2-wheeler for personal use? Yes 31 26 32 31 30 28 26 29 35 28 29 45 44
No 69 74 68 69 70 72 74 71 65 72 71 55 56
Figure 100: B3. How many cars do you own in your household? 1 70 100 96 94 87 73 71 42 28 14 53 71 70
2 22 0 4 6 11 22 25 47 41 40 34 17 22
3 or more 8 0 0 0 2 5 4 12 31 46 13 13 8
Figure 101: B7. How did you finance it? All Cash 27 33 57 42 25 24 23 25 15 51 23 21 27
Cash + Credit 52 33 17 40 51 58 60 63 77 26 53 50 52
All Credit 13 33 13 12 19 14 11 5 8 11 11 8 13
Don’t Know 7 0 13 6 5 4 7 7 0 11 13 21 7
Base : Unwtd 747 3 23 65 220 130 84 60 39 35 64 24 747
Figure 102: B10. Will you or your family purchase or replace a passenger car in the next 12 months?
Source: Credit Suisse emerging markets consumer survey
Figure 103: B4. What brand is the car your household last purchased? Foreign Cars 81 54 75 78 79 79 84 76 82 84 88 70 60
Volkswagen 16 15 15 23 16 16 16 24 18 16 16 10 7
GM 8 0 0 8 5 13 5 3 8 10 8 13 7
Local Cars 14 15 15 20 18 13 12 19 14 14 10 20 14
Tianjin-faw 1 0 0 0 5 2 2 3 1 1 0 0 5
Haima 1 0 0 0 3 2 0 0 1 1 0 0 2
Base : Unwtd 759 13 20 40 38 62 43 37 87 146 190 40 43
2 3 4 4 5 3 5 4 589 8 9
1419
16 17 1519
22
1013 15 13 13 15
12 13 15119
17 15 1518 17
2217 18 17
66
5554
4742
45
40
46
39 40
0
10
20
30
40
50
60
70
80
Under RMB2,000
RMB 2,000-2,999
RMB 3,000-3,999
RMB 4,000-4,999
RMB 5,000-5,999
RMB 6,000-6,999
RMB 7,000-7,999
RMB 8,000-9,999
RMB 1,0000-14,999
Above RMB15,000
% o
f re
spo
nd
ents
Income Bracket
Definitely will Probably will Not sure Probably won’t Definitely won’t
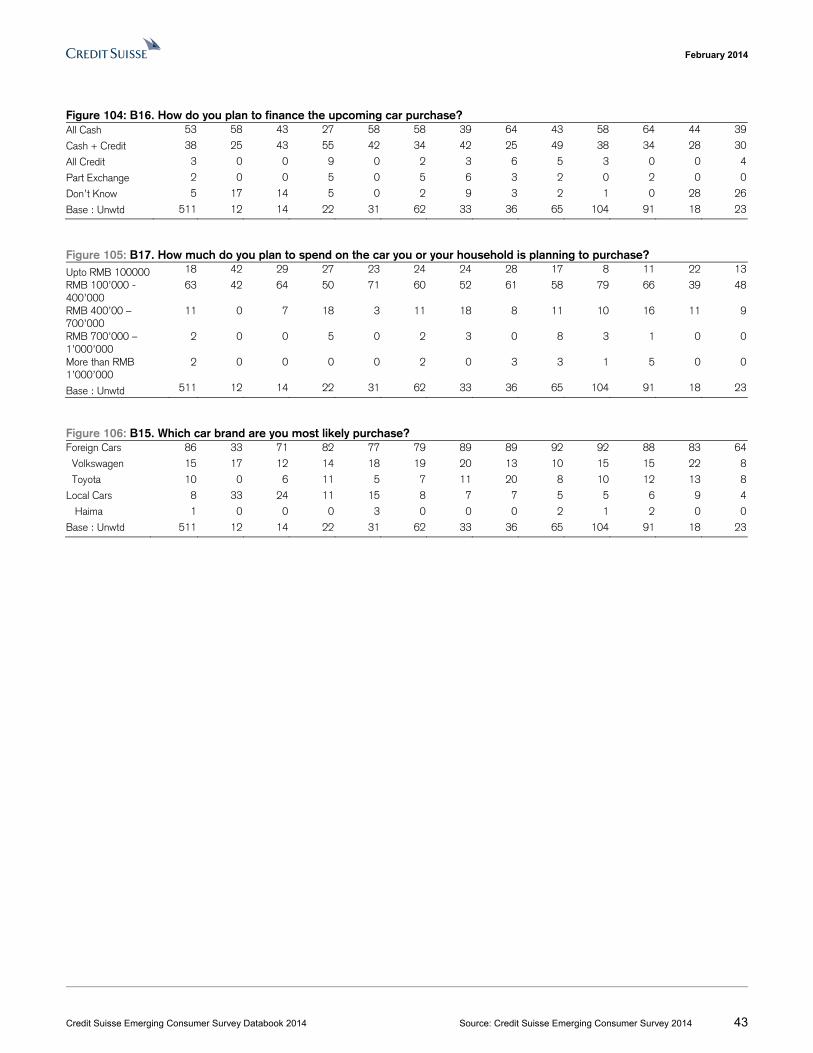
February 2014
Credit Suisse Emerging Consumer Survey Databook 2014 Source: Credit Suisse Emerging Consumer Survey 2014 43
Figure 104: B16. How do you plan to finance the upcoming car purchase? All Cash 53 58 43 27 58 58 39 64 43 58 64 44 39
Cash + Credit 38 25 43 55 42 34 42 25 49 38 34 28 30
All Credit 3 0 0 9 0 2 3 6 5 3 0 0 4
Part Exchange 2 0 0 5 0 5 6 3 2 0 2 0 0
Don’t Know 5 17 14 5 0 2 9 3 2 1 0 28 26
Base : Unwtd 511 12 14 22 31 62 33 36 65 104 91 18 23
Figure 105: B17. How much do you plan to spend on the car you or your household is planning to purchase? Upto RMB 100000 18 42 29 27 23 24 24 28 17 8 11 22 13
RMB 100’000 - 400’000
63 42 64 50 71 60 52 61 58 79 66 39 48
RMB 400’00 – 700’000
11 0 7 18 3 11 18 8 11 10 16 11 9
RMB 700’000 – 1’000’000
2 0 0 5 0 2 3 0 8 3 1 0 0
More than RMB 1’000’000
2 0 0 0 0 2 0 3 3 1 5 0 0
Base : Unwtd 511 12 14 22 31 62 33 36 65 104 91 18 23
Figure 106: B15. Which car brand are you most likely purchase? Foreign Cars 86 33 71 82 77 79 89 89 92 92 88 83 64
Volkswagen 15 17 12 14 18 19 20 13 10 15 15 22 8
Toyota 10 0 6 11 5 7 11 20 8 10 12 13 8
Local Cars 8 33 24 11 15 8 7 7 5 5 6 9 4
Haima 1 0 0 0 3 0 0 0 2 1 2 0 0
Base : Unwtd 511 12 14 22 31 62 33 36 65 104 91 18 23
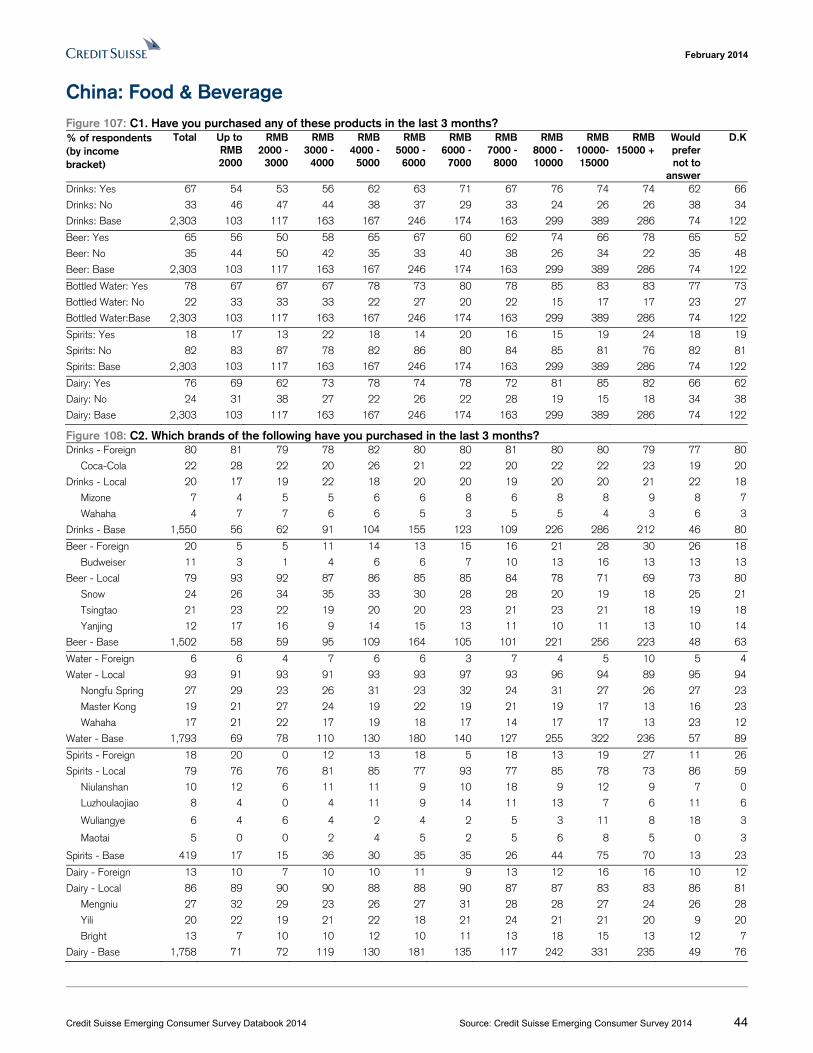
February 2014
Credit Suisse Emerging Consumer Survey Databook 2014 Source: Credit Suisse Emerging Consumer Survey 2014 44
China: Food & Beverage Figure 107: C1. Have you purchased any of these products in the last 3 months? % of respondents (by income bracket)
Total Up to RMB 2000
RMB 2000 -
3000
RMB 3000 -
4000
RMB 4000 -
5000
RMB 5000 -
6000
RMB 6000 -
7000
RMB 7000 -
8000
RMB 8000 -10000
RMB 10000- 15000
RMB 15000 +
Would prefer not to
answer
D.K
Drinks: Yes 67 54 53 56 62 63 71 67 76 74 74 62 66
Drinks: No 33 46 47 44 38 37 29 33 24 26 26 38 34
Drinks: Base 2,303 103 117 163 167 246 174 163 299 389 286 74 122
Beer: Yes 65 56 50 58 65 67 60 62 74 66 78 65 52
Beer: No 35 44 50 42 35 33 40 38 26 34 22 35 48
Beer: Base 2,303 103 117 163 167 246 174 163 299 389 286 74 122
Bottled Water: Yes 78 67 67 67 78 73 80 78 85 83 83 77 73
Bottled Water: No 22 33 33 33 22 27 20 22 15 17 17 23 27
Bottled Water:Base 2,303 103 117 163 167 246 174 163 299 389 286 74 122
Spirits: Yes 18 17 13 22 18 14 20 16 15 19 24 18 19
Spirits: No 82 83 87 78 82 86 80 84 85 81 76 82 81
Spirits: Base 2,303 103 117 163 167 246 174 163 299 389 286 74 122
Dairy: Yes 76 69 62 73 78 74 78 72 81 85 82 66 62
Dairy: No 24 31 38 27 22 26 22 28 19 15 18 34 38
Dairy: Base 2,303 103 117 163 167 246 174 163 299 389 286 74 122
Figure 108: C2. Which brands of the following have you purchased in the last 3 months? Drinks - Foreign 80 81 79 78 82 80 80 81 80 80 79 77 80
Coca-Cola 22 28 22 20 26 21 22 20 22 22 23 19 20
Drinks - Local 20 17 19 22 18 20 20 19 20 20 21 22 18
Mizone 7 4 5 5 6 6 8 6 8 8 9 8 7
Wahaha 4 7 7 6 6 5 3 5 5 4 3 6 3
Drinks - Base 1,550 56 62 91 104 155 123 109 226 286 212 46 80
Beer - Foreign 20 5 5 11 14 13 15 16 21 28 30 26 18
Budweiser 11 3 1 4 6 6 7 10 13 16 13 13 13
Beer - Local 79 93 92 87 86 85 85 84 78 71 69 73 80
Snow 24 26 34 35 33 30 28 28 20 19 18 25 21
Tsingtao 21 23 22 19 20 20 23 21 23 21 18 19 18
Yanjing 12 17 16 9 14 15 13 11 10 11 13 10 14
Beer - Base 1,502 58 59 95 109 164 105 101 221 256 223 48 63
Water - Foreign 6 6 4 7 6 6 3 7 4 5 10 5 4
Water - Local 93 91 93 91 93 93 97 93 96 94 89 95 94
Nongfu Spring 27 29 23 26 31 23 32 24 31 27 26 27 23
Master Kong 19 21 27 24 19 22 19 21 19 17 13 16 23
Wahaha 17 21 22 17 19 18 17 14 17 17 13 23 12
Water - Base 1,793 69 78 110 130 180 140 127 255 322 236 57 89
Spirits - Foreign 18 20 0 12 13 18 5 18 13 19 27 11 26
Spirits - Local 79 76 76 81 85 77 93 77 85 78 73 86 59
Niulanshan 10 12 6 11 11 9 10 18 9 12 9 7 0
Luzhoulaojiao 8 4 0 4 11 9 14 11 13 7 6 11 6
Wuliangye 6 4 6 4 2 4 2 5 3 11 8 18 3
Maotai 5 0 0 2 4 5 2 5 6 8 5 0 3
Spirits - Base 419 17 15 36 30 35 35 26 44 75 70 13 23
Dairy - Foreign 13 10 7 10 10 11 9 13 12 16 16 10 12
Dairy - Local 86 89 90 90 88 88 90 87 87 83 83 86 81
Mengniu 27 32 29 23 26 27 31 28 28 27 24 26 28
Yili 20 22 19 21 22 18 21 24 21 21 20 9 20
Bright 13 7 10 10 12 10 11 13 18 15 13 12 7
Dairy - Base 1,758 71 72 119 130 181 135 117 242 331 235 49 76
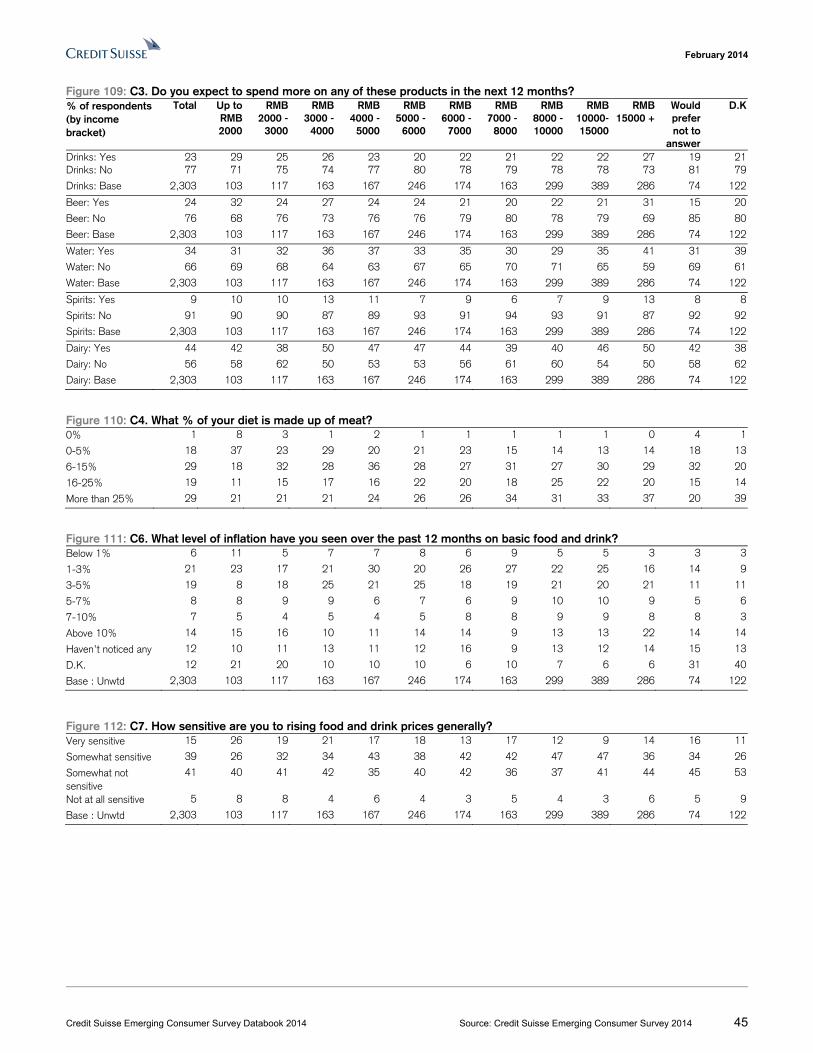
February 2014
Credit Suisse Emerging Consumer Survey Databook 2014 Source: Credit Suisse Emerging Consumer Survey 2014 45
Figure 109: C3. Do you expect to spend more on any of these products in the next 12 months? % of respondents (by income bracket)
Total Up to RMB 2000
RMB 2000 -
3000
RMB 3000 -
4000
RMB 4000 -
5000
RMB 5000 -
6000
RMB 6000 -
7000
RMB 7000 -
8000
RMB 8000 -10000
RMB 10000- 15000
RMB 15000 +
Would prefer not to
answer
D.K
Drinks: Yes 23 29 25 26 23 20 22 21 22 22 27 19 21Drinks: No 77 71 75 74 77 80 78 79 78 78 73 81 79
Drinks: Base 2,303 103 117 163 167 246 174 163 299 389 286 74 122
Beer: Yes 24 32 24 27 24 24 21 20 22 21 31 15 20
Beer: No 76 68 76 73 76 76 79 80 78 79 69 85 80
Beer: Base 2,303 103 117 163 167 246 174 163 299 389 286 74 122
Water: Yes 34 31 32 36 37 33 35 30 29 35 41 31 39
Water: No 66 69 68 64 63 67 65 70 71 65 59 69 61
Water: Base 2,303 103 117 163 167 246 174 163 299 389 286 74 122
Spirits: Yes 9 10 10 13 11 7 9 6 7 9 13 8 8
Spirits: No 91 90 90 87 89 93 91 94 93 91 87 92 92
Spirits: Base 2,303 103 117 163 167 246 174 163 299 389 286 74 122
Dairy: Yes 44 42 38 50 47 47 44 39 40 46 50 42 38
Dairy: No 56 58 62 50 53 53 56 61 60 54 50 58 62
Dairy: Base 2,303 103 117 163 167 246 174 163 299 389 286 74 122
Figure 110: C4. What % of your diet is made up of meat? 0% 1 8 3 1 2 1 1 1 1 1 0 4 1
0-5% 18 37 23 29 20 21 23 15 14 13 14 18 13
6-15% 29 18 32 28 36 28 27 31 27 30 29 32 20
16-25% 19 11 15 17 16 22 20 18 25 22 20 15 14
More than 25% 29 21 21 21 24 26 26 34 31 33 37 20 39
Figure 111: C6. What level of inflation have you seen over the past 12 months on basic food and drink? Below 1% 6 11 5 7 7 8 6 9 5 5 3 3 3
1-3% 21 23 17 21 30 20 26 27 22 25 16 14 9
3-5% 19 8 18 25 21 25 18 19 21 20 21 11 11
5-7% 8 8 9 9 6 7 6 9 10 10 9 5 6
7-10% 7 5 4 5 4 5 8 8 9 9 8 8 3
Above 10% 14 15 16 10 11 14 14 9 13 13 22 14 14
Haven’t noticed any 12 10 11 13 11 12 16 9 13 12 14 15 13
D.K. 12 21 20 10 10 10 6 10 7 6 6 31 40
Base : Unwtd 2,303 103 117 163 167 246 174 163 299 389 286 74 122
Figure 112: C7. How sensitive are you to rising food and drink prices generally? Very sensitive 15 26 19 21 17 18 13 17 12 9 14 16 11
Somewhat sensitive 39 26 32 34 43 38 42 42 47 47 36 34 26
Somewhat not sensitive
41 40 41 42 35 40 42 36 37 41 44 45 53
Not at all sensitive 5 8 8 4 6 4 3 5 4 3 6 5 9
Base : Unwtd 2,303 103 117 163 167 246 174 163 299 389 286 74 122
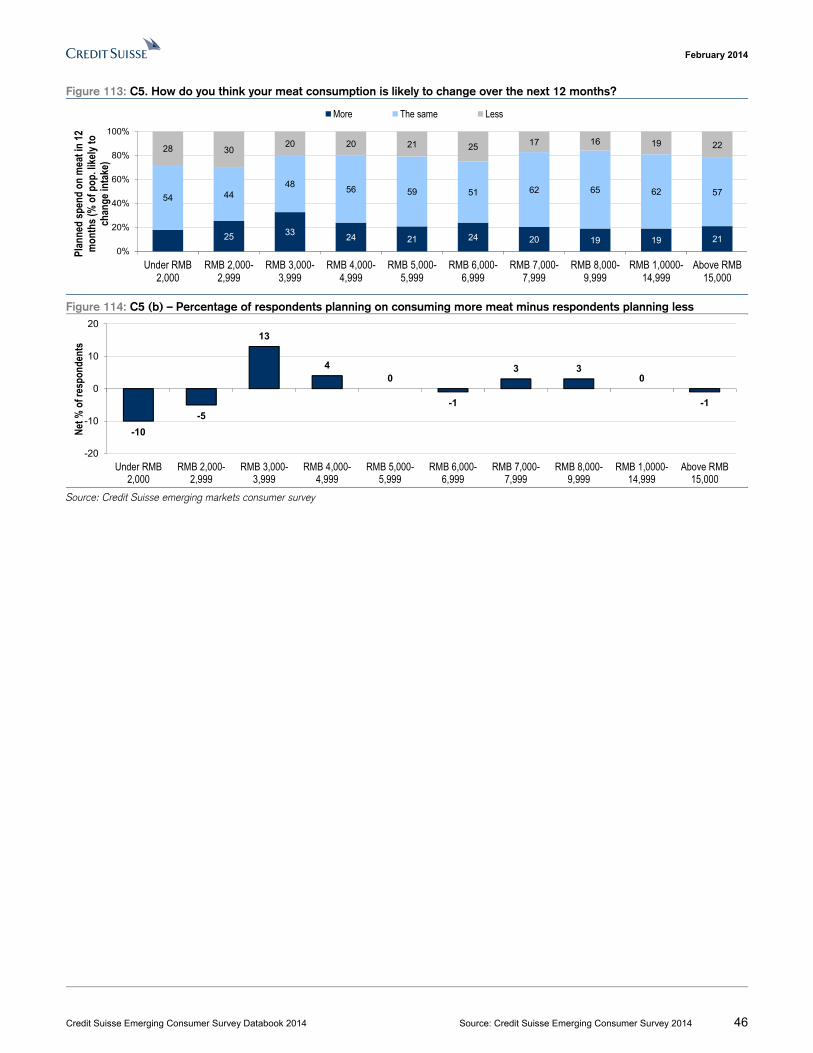
February 2014
Credit Suisse Emerging Consumer Survey Databook 2014 Source: Credit Suisse Emerging Consumer Survey 2014 46
Figure 113: C5. How do you think your meat consumption is likely to change over the next 12 months?
Figure 114: C5 (b) – Percentage of respondents planning on consuming more meat minus respondents planning less
Source: Credit Suisse emerging markets consumer survey
25 3324 21 24 20 19 19 21
54 4448
56 59 51 62 65 62 57
28 3020 20 21 25 17 16 19 22
0%
20%
40%
60%
80%
100%
Under RMB2,000
RMB 2,000-2,999
RMB 3,000-3,999
RMB 4,000-4,999
RMB 5,000-5,999
RMB 6,000-6,999
RMB 7,000-7,999
RMB 8,000-9,999
RMB 1,0000-14,999
Above RMB15,000
Plan
ned
spen
d on
mea
t in
12
mon
ths (
% o
f pop
. like
ly to
ch
ange
inta
ke)
More The same Less
-10
-5
13
40
-1
3 30
-1
-20
-10
0
10
20
Under RMB2,000
RMB 2,000-2,999
RMB 3,000-3,999
RMB 4,000-4,999
RMB 5,000-5,999
RMB 6,000-6,999
RMB 7,000-7,999
RMB 8,000-9,999
RMB 1,0000-14,999
Above RMB15,000
Net %
of r
espo
nden
ts
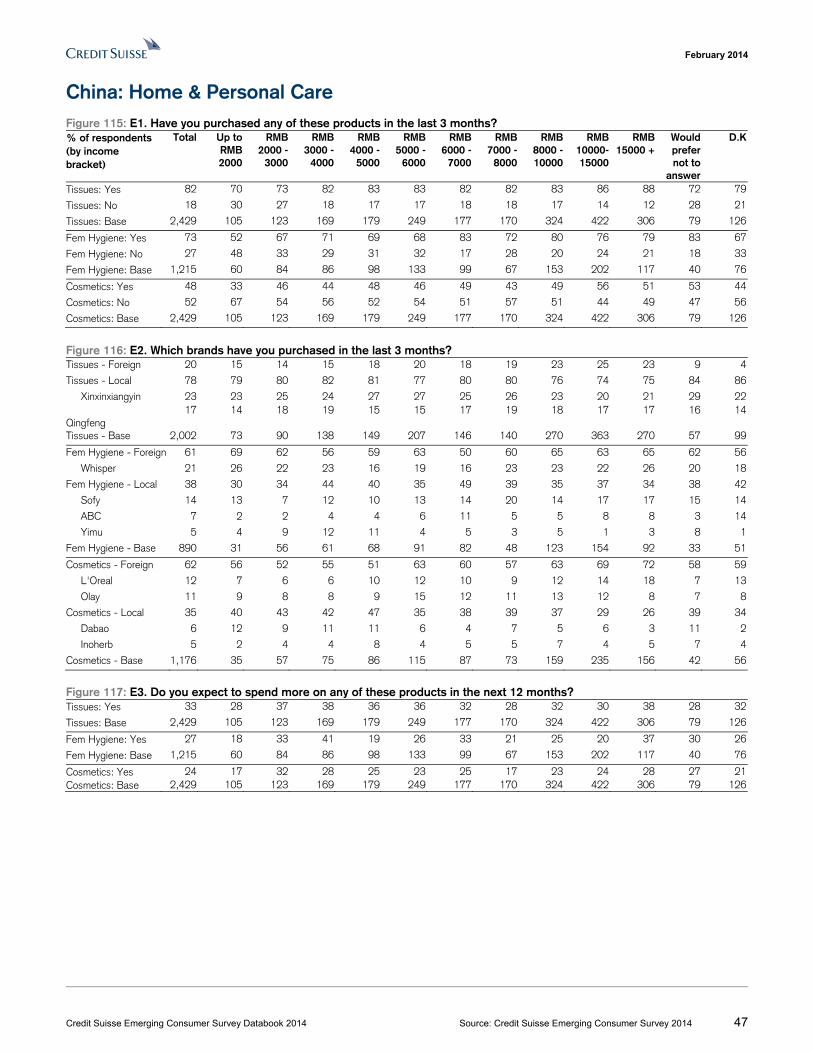
February 2014
Credit Suisse Emerging Consumer Survey Databook 2014 Source: Credit Suisse Emerging Consumer Survey 2014 47
China: Home & Personal Care Figure 115: E1. Have you purchased any of these products in the last 3 months? % of respondents (by income bracket)
Total Up to RMB 2000
RMB 2000 -
3000
RMB 3000 -
4000
RMB 4000 -
5000
RMB 5000 -
6000
RMB 6000 -
7000
RMB 7000 -
8000
RMB 8000 -10000
RMB 10000- 15000
RMB 15000 +
Would prefer not to
answer
D.K
Tissues: Yes 82 70 73 82 83 83 82 82 83 86 88 72 79
Tissues: No 18 30 27 18 17 17 18 18 17 14 12 28 21
Tissues: Base 2,429 105 123 169 179 249 177 170 324 422 306 79 126
Fem Hygiene: Yes 73 52 67 71 69 68 83 72 80 76 79 83 67
Fem Hygiene: No 27 48 33 29 31 32 17 28 20 24 21 18 33
Fem Hygiene: Base 1,215 60 84 86 98 133 99 67 153 202 117 40 76
Cosmetics: Yes 48 33 46 44 48 46 49 43 49 56 51 53 44
Cosmetics: No 52 67 54 56 52 54 51 57 51 44 49 47 56
Cosmetics: Base 2,429 105 123 169 179 249 177 170 324 422 306 79 126
Figure 116: E2. Which brands have you purchased in the last 3 months? Tissues - Foreign 20 15 14 15 18 20 18 19 23 25 23 9 4
Tissues - Local 78 79 80 82 81 77 80 80 76 74 75 84 86
Xinxinxiangyin 23 23 25 24 27 27 25 26 23 20 21 29 22 Qingfeng
17 14 18 19 15 15 17 19 18 17 17 16 14
Tissues - Base 2,002 73 90 138 149 207 146 140 270 363 270 57 99
Fem Hygiene - Foreign 61 69 62 56 59 63 50 60 65 63 65 62 56
Whisper 21 26 22 23 16 19 16 23 23 22 26 20 18
Fem Hygiene - Local 38 30 34 44 40 35 49 39 35 37 34 38 42
Sofy 14 13 7 12 10 13 14 20 14 17 17 15 14
ABC 7 2 2 4 4 6 11 5 5 8 8 3 14
Yimu 5 4 9 12 11 4 5 3 5 1 3 8 1
Fem Hygiene - Base 890 31 56 61 68 91 82 48 123 154 92 33 51
Cosmetics - Foreign 62 56 52 55 51 63 60 57 63 69 72 58 59
L'Oreal 12 7 6 6 10 12 10 9 12 14 18 7 13
Olay 11 9 8 8 9 15 12 11 13 12 8 7 8
Cosmetics - Local 35 40 43 42 47 35 38 39 37 29 26 39 34
Dabao 6 12 9 11 11 6 4 7 5 6 3 11 2
Inoherb 5 2 4 4 8 4 5 5 7 4 5 7 4
Cosmetics - Base 1,176 35 57 75 86 115 87 73 159 235 156 42 56
Figure 117: E3. Do you expect to spend more on any of these products in the next 12 months? Tissues: Yes 33 28 37 38 36 36 32 28 32 30 38 28 32
Tissues: Base 2,429 105 123 169 179 249 177 170 324 422 306 79 126
Fem Hygiene: Yes 27 18 33 41 19 26 33 21 25 20 37 30 26
Fem Hygiene: Base 1,215 60 84 86 98 133 99 67 153 202 117 40 76
Cosmetics: Yes 24 17 32 28 25 23 25 17 23 24 28 27 21Cosmetics: Base 2,429 105 123 169 179 249 177 170 324 422 306 79 126
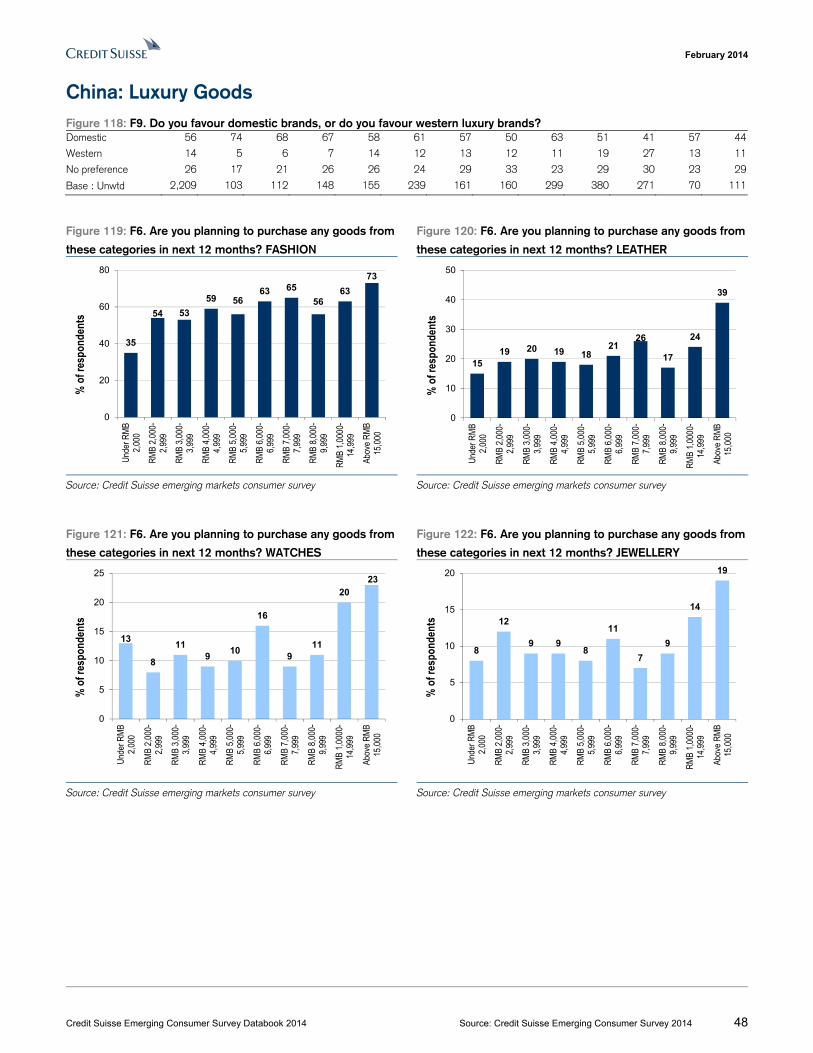
February 2014
Credit Suisse Emerging Consumer Survey Databook 2014 Source: Credit Suisse Emerging Consumer Survey 2014 48
China: Luxury Goods Figure 118: F9. Do you favour domestic brands, or do you favour western luxury brands? Domestic 56 74 68 67 58 61 57 50 63 51 41 57 44
Western 14 5 6 7 14 12 13 12 11 19 27 13 11
No preference 26 17 21 26 26 24 29 33 23 29 30 23 29
Base : Unwtd 2,209 103 112 148 155 239 161 160 299 380 271 70 111
Figure 119: F6. Are you planning to purchase any goods from
these categories in next 12 months? FASHION
Figure 120: F6. Are you planning to purchase any goods from
these categories in next 12 months? LEATHER
Source: Credit Suisse emerging markets consumer survey Source: Credit Suisse emerging markets consumer survey
Figure 121: F6. Are you planning to purchase any goods from
these categories in next 12 months? WATCHES
Figure 122: F6. Are you planning to purchase any goods from
these categories in next 12 months? JEWELLERY
Source: Credit Suisse emerging markets consumer survey Source: Credit Suisse emerging markets consumer survey
35
54 53
59 5663 65
5663
73
0
20
40
60
80
Und
er R
MB
2,00
0
RM
B 2,
000-
2,99
9
RM
B 3,
000-
3,99
9
RM
B 4,
000-
4,99
9
RM
B 5,
000-
5,99
9
RM
B 6,
000-
6,99
9
RM
B 7,
000-
7,99
9
RM
B 8,
000-
9,99
9
RM
B 1,
0000
-14
,999
Abov
e R
MB
15,0
00
% o
f res
pond
ents
1519 20 19 18
2126
17
24
39
0
10
20
30
40
50
Und
er R
MB
2,00
0
RM
B 2,
000-
2,99
9
RM
B 3,
000-
3,99
9
RM
B 4,
000-
4,99
9
RM
B 5,
000-
5,99
9
RM
B 6,
000-
6,99
9
RM
B 7,
000-
7,99
9
RM
B 8,
000-
9,99
9
RM
B 1,
0000
-14
,999
Abov
e R
MB
15,0
00
% o
f res
pond
ents
13
8
119
10
16
911
2023
0
5
10
15
20
25
Und
er R
MB
2,00
0
RM
B 2,
000-
2,99
9
RM
B 3,
000-
3,99
9
RM
B 4,
000-
4,99
9
RM
B 5,
000-
5,99
9
RM
B 6,
000-
6,99
9
RM
B 7,
000-
7,99
9
RM
B 8,
000-
9,99
9
RM
B 1,
0000
-14
,999
Abov
e R
MB
15,0
00
% o
f res
pond
ents
8
12
9 98
11
7
9
14
19
0
5
10
15
20
Und
er R
MB
2,00
0
RM
B 2,
000-
2,99
9
RM
B 3,
000-
3,99
9
RM
B 4,
000-
4,99
9
RM
B 5,
000-
5,99
9
RM
B 6,
000-
6,99
9
RM
B 7,
000-
7,99
9
RM
B 8,
000-
9,99
9
RM
B 1,
0000
-14
,999
Abov
e R
MB
15,0
00
% o
f res
pond
ents
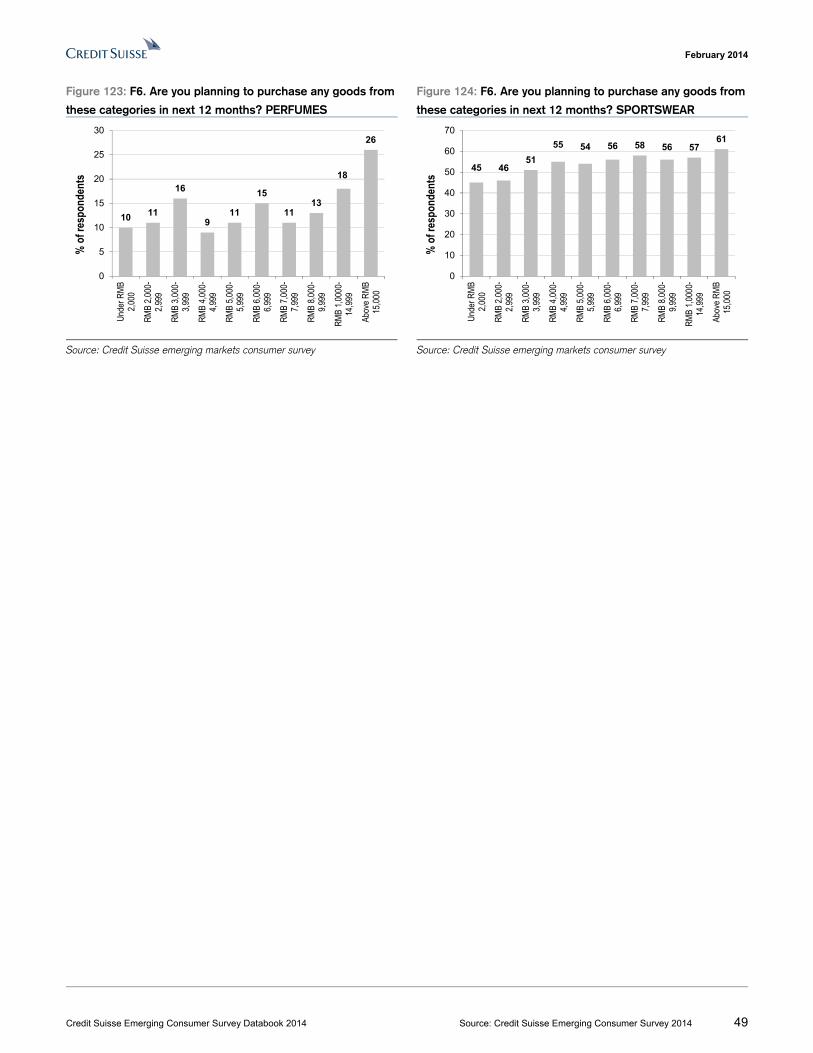
February 2014
Credit Suisse Emerging Consumer Survey Databook 2014 Source: Credit Suisse Emerging Consumer Survey 2014 49
Figure 123: F6. Are you planning to purchase any goods from
these categories in next 12 months? PERFUMES
Figure 124: F6. Are you planning to purchase any goods from
these categories in next 12 months? SPORTSWEAR
Source: Credit Suisse emerging markets consumer survey Source: Credit Suisse emerging markets consumer survey
10 11
16
911
15
1113
18
26
0
5
10
15
20
25
30U
nder
RM
B2,
000
RM
B 2,
000-
2,99
9
RM
B 3,
000-
3,99
9
RM
B 4,
000-
4,99
9
RM
B 5,
000-
5,99
9
RM
B 6,
000-
6,99
9
RM
B 7,
000-
7,99
9
RM
B 8,
000-
9,99
9
RM
B 1,
0000
-14
,999
Abov
e R
MB
15,0
00
% o
f res
pond
ents
45 4651
55 54 56 58 56 5761
0
10
20
30
40
50
60
70
Und
er R
MB
2,00
0
RM
B 2,
000-
2,99
9
RM
B 3,
000-
3,99
9
RM
B 4,
000-
4,99
9
RM
B 5,
000-
5,99
9
RM
B 6,
000-
6,99
9
RM
B 7,
000-
7,99
9
RM
B 8,
000-
9,99
9
RM
B 1,
0000
-14
,999
Abov
e R
MB
15,0
00
% o
f res
pond
ents
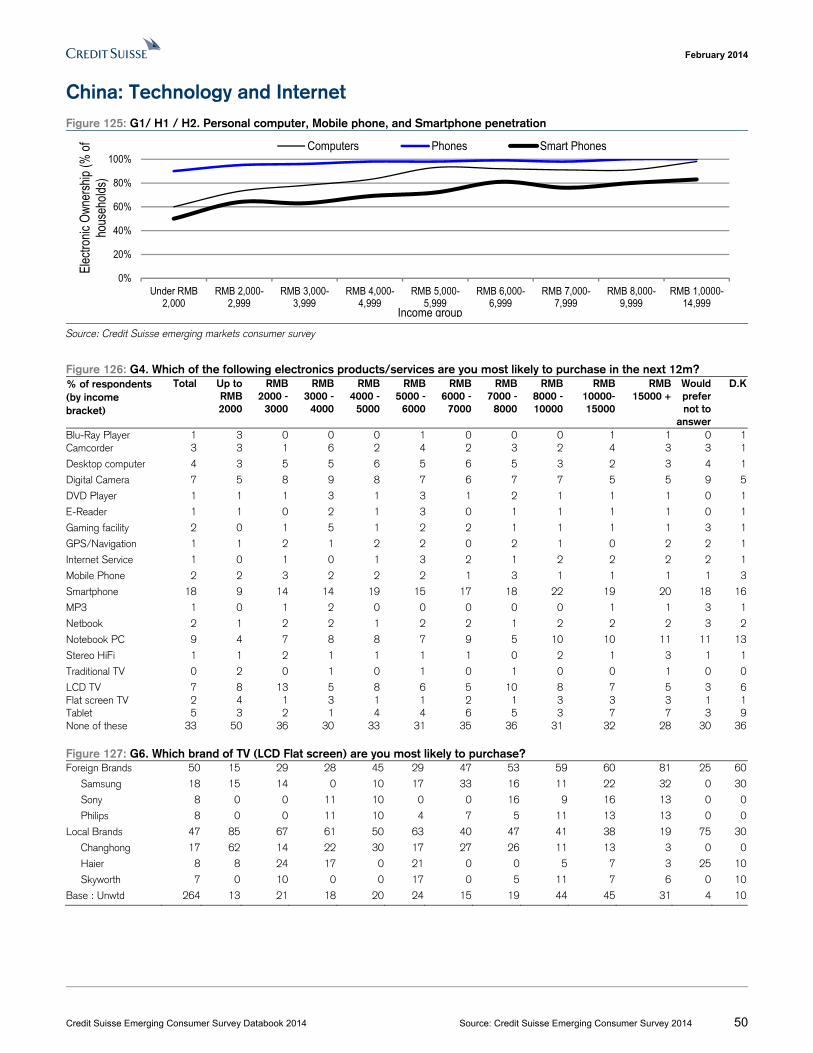
February 2014
Credit Suisse Emerging Consumer Survey Databook 2014 Source: Credit Suisse Emerging Consumer Survey 2014 50
China: Technology and Internet Figure 125: G1/ H1 / H2. Personal computer, Mobile phone, and Smartphone penetration
Source: Credit Suisse emerging markets consumer survey
Figure 126: G4. Which of the following electronics products/services are you most likely to purchase in the next 12m? % of respondents (by income bracket)
Total Up to RMB 2000
RMB 2000 -
3000
RMB 3000 -
4000
RMB 4000 -
5000
RMB 5000 -
6000
RMB 6000 -
7000
RMB 7000 -
8000
RMB 8000 -10000
RMB 10000- 15000
RMB 15000 +
Would prefer not to
answer
D.K
Blu-Ray Player 1 3 0 0 0 1 0 0 0 1 1 0 1Camcorder 3 3 1 6 2 4 2 3 2 4 3 3 1
Desktop computer 4 3 5 5 6 5 6 5 3 2 3 4 1
Digital Camera 7 5 8 9 8 7 6 7 7 5 5 9 5
DVD Player 1 1 1 3 1 3 1 2 1 1 1 0 1
E-Reader 1 1 0 2 1 3 0 1 1 1 1 0 1
Gaming facility 2 0 1 5 1 2 2 1 1 1 1 3 1
GPS/Navigation 1 1 2 1 2 2 0 2 1 0 2 2 1
Internet Service 1 0 1 0 1 3 2 1 2 2 2 2 1
Mobile Phone 2 2 3 2 2 2 1 3 1 1 1 1 3
Smartphone 18 9 14 14 19 15 17 18 22 19 20 18 16
MP3 1 0 1 2 0 0 0 0 0 1 1 3 1
Netbook 2 1 2 2 1 2 2 1 2 2 2 3 2
Notebook PC 9 4 7 8 8 7 9 5 10 10 11 11 13
Stereo HiFi 1 1 2 1 1 1 1 0 2 1 3 1 1
Traditional TV 0 2 0 1 0 1 0 1 0 0 1 0 0
LCD TV 7 8 13 5 8 6 5 10 8 7 5 3 6Flat screen TV 2 4 1 3 1 1 2 1 3 3 3 1 1Tablet 5 3 2 1 4 4 6 5 3 7 7 3 9None of these 33 50 36 30 33 31 35 36 31 32 28 30 36 Figure 127: G6. Which brand of TV (LCD Flat screen) are you most likely to purchase? Foreign Brands 50 15 29 28 45 29 47 53 59 60 81 25 60
Samsung 18 15 14 0 10 17 33 16 11 22 32 0 30
Sony 8 0 0 11 10 0 0 16 9 16 13 0 0
Philips 8 0 0 11 10 4 7 5 11 13 13 0 0
Local Brands 47 85 67 61 50 63 40 47 41 38 19 75 30
Changhong 17 62 14 22 30 17 27 26 11 13 3 0 0
Haier 8 8 24 17 0 21 0 0 5 7 3 25 10
Skyworth 7 0 10 0 0 17 0 5 11 7 6 0 10
Base : Unwtd 264 13 21 18 20 24 15 19 44 45 31 4 10
0%
20%
40%
60%
80%
100%
Under RMB2,000
RMB 2,000-2,999
RMB 3,000-3,999
RMB 4,000-4,999
RMB 5,000-5,999
RMB 6,000-6,999
RMB 7,000-7,999
RMB 8,000-9,999
RMB 1,0000-14,999
Elec
troni
c O
wner
ship
(% o
f ho
useh
olds
)
Computers Phones Smart Phones
Income group
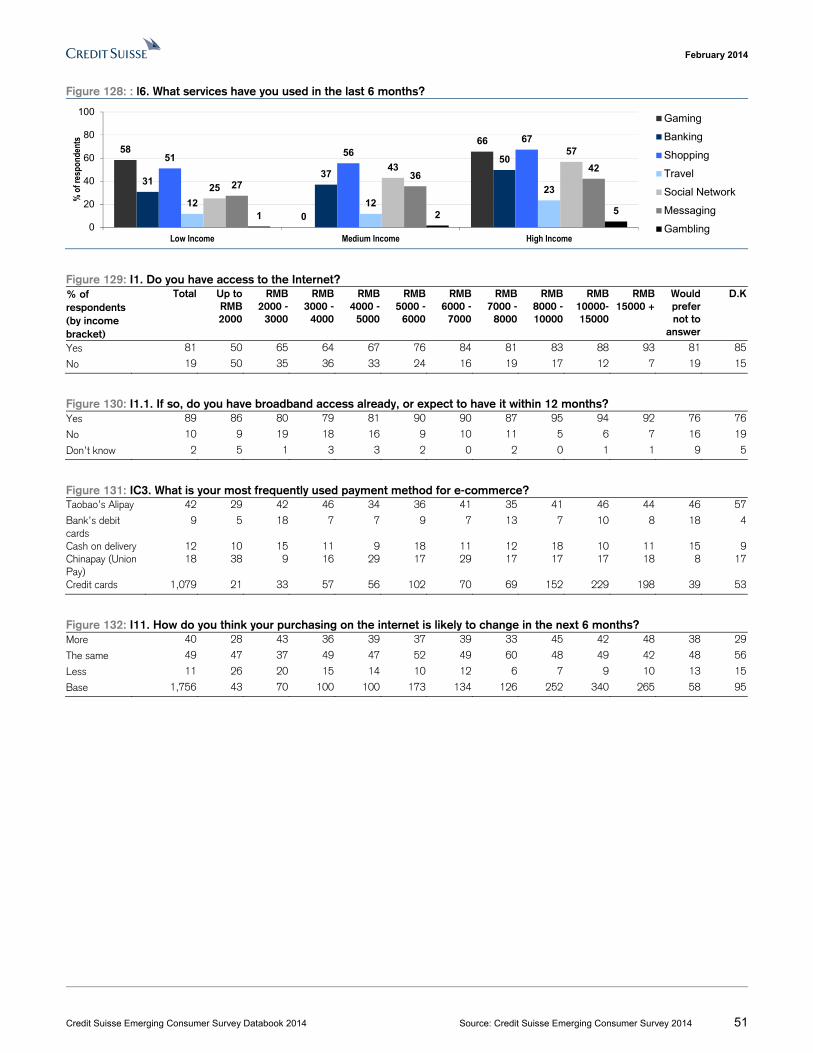
February 2014
Credit Suisse Emerging Consumer Survey Databook 2014 Source: Credit Suisse Emerging Consumer Survey 2014 51
Figure 128: : l6. What services have you used in the last 6 months?
Figure 129: I1. Do you have access to the Internet? % of respondents (by income bracket)
Total Up to RMB 2000
RMB 2000 -
3000
RMB 3000 -
4000
RMB 4000 -
5000
RMB 5000 -
6000
RMB 6000 -
7000
RMB 7000 -
8000
RMB 8000 -10000
RMB 10000- 15000
RMB 15000 +
Would prefer not to
answer
D.K
Yes 81 50 65 64 67 76 84 81 83 88 93 81 85
No 19 50 35 36 33 24 16 19 17 12 7 19 15
Figure 130: I1.1. If so, do you have broadband access already, or expect to have it within 12 months? Yes 89 86 80 79 81 90 90 87 95 94 92 76 76
No 10 9 19 18 16 9 10 11 5 6 7 16 19
Don’t know 2 5 1 3 3 2 0 2 0 1 1 9 5
Figure 131: IC3. What is your most frequently used payment method for e-commerce? Taobao’s Alipay 42 29 42 46 34 36 41 35 41 46 44 46 57
Bank’s debit cards
9 5 18 7 7 9 7 13 7 10 8 18 4
Cash on delivery 12 10 15 11 9 18 11 12 18 10 11 15 9Chinapay (Union Pay)
18 38 9 16 29 17 29 17 17 17 18 8 17
Credit cards 1,079 21 33 57 56 102 70 69 152 229 198 39 53
Figure 132: I11. How do you think your purchasing on the internet is likely to change in the next 6 months? More 40 28 43 36 39 37 39 33 45 42 48 38 29
The same 49 47 37 49 47 52 49 60 48 49 42 48 56
Less 11 26 20 15 14 10 12 6 7 9 10 13 15
Base 1,756 43 70 100 100 173 134 126 252 340 265 58 95
58
0
66
3137
5051 5667
12 122325
43
57
2736
42
1 2 5
0
20
40
60
80
100
Low Income Medium Income High Income
% o
f res
pond
ents
Gaming
Banking
Shopping
Travel
Social Network
Messaging
Gambling
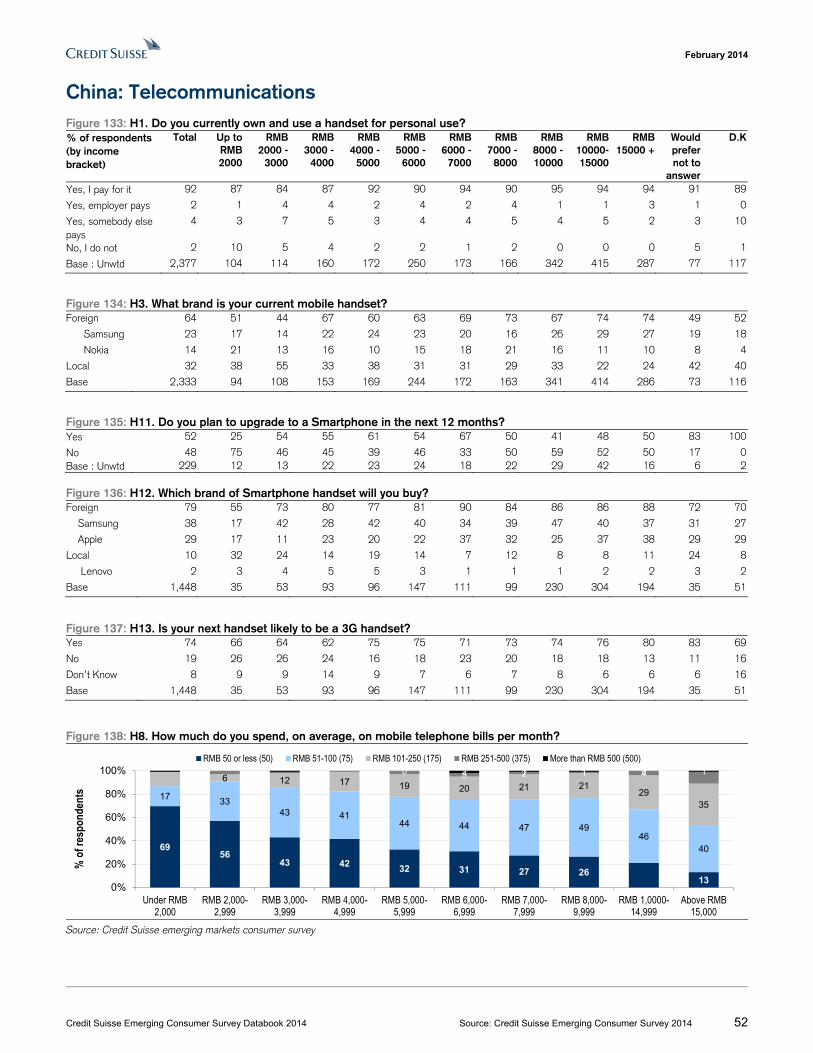
February 2014
Credit Suisse Emerging Consumer Survey Databook 2014 Source: Credit Suisse Emerging Consumer Survey 2014 52
China: Telecommunications Figure 133: H1. Do you currently own and use a handset for personal use? % of respondents (by income bracket)
Total Up to RMB 2000
RMB 2000 -
3000
RMB 3000 -
4000
RMB 4000 -
5000
RMB 5000 -
6000
RMB 6000 -
7000
RMB 7000 -
8000
RMB 8000 -10000
RMB 10000- 15000
RMB 15000 +
Would prefer not to
answer
D.K
Yes, I pay for it 92 87 84 87 92 90 94 90 95 94 94 91 89
Yes, employer pays 2 1 4 4 2 4 2 4 1 1 3 1 0
Yes, somebody else pays
4 3 7 5 3 4 4 5 4 5 2 3 10
No, I do not 2 10 5 4 2 2 1 2 0 0 0 5 1
Base : Unwtd 2,377 104 114 160 172 250 173 166 342 415 287 77 117
Figure 134: H3. What brand is your current mobile handset? Foreign 64 51 44 67 60 63 69 73 67 74 74 49 52
Samsung 23 17 14 22 24 23 20 16 26 29 27 19 18
Nokia 14 21 13 16 10 15 18 21 16 11 10 8 4
Local 32 38 55 33 38 31 31 29 33 22 24 42 40
Base 2,333 94 108 153 169 244 172 163 341 414 286 73 116
Figure 135: H11. Do you plan to upgrade to a Smartphone in the next 12 months? Yes 52 25 54 55 61 54 67 50 41 48 50 83 100
No 48 75 46 45 39 46 33 50 59 52 50 17 0Base : Unwtd 229 12 13 22 23 24 18 22 29 42 16 6 2 Figure 136: H12. Which brand of Smartphone handset will you buy? Foreign 79 55 73 80 77 81 90 84 86 86 88 72 70
Samsung 38 17 42 28 42 40 34 39 47 40 37 31 27
Apple 29 17 11 23 20 22 37 32 25 37 38 29 29
Local 10 32 24 14 19 14 7 12 8 8 11 24 8
Lenovo 2 3 4 5 5 3 1 1 1 2 2 3 2
Base 1,448 35 53 93 96 147 111 99 230 304 194 35 51
Figure 137: H13. Is your next handset likely to be a 3G handset? Yes 74 66 64 62 75 75 71 73 74 76 80 83 69
No 19 26 26 24 16 18 23 20 18 18 13 11 16
Don’t Know 8 9 9 14 9 7 6 7 8 6 6 6 16
Base 1,448 35 53 93 96 147 111 99 230 304 194 35 51
Figure 138: H8. How much do you spend, on average, on mobile telephone bills per month?
Source: Credit Suisse emerging markets consumer survey
6956
43 42 32 31 27 2613
17 3343 41
44 44 47 4946
40
6 12 17 19 20 21 2129
35
3 2 1 40 2 1 1 0 1
0%
20%
40%
60%
80%
100%
Under RMB2,000
RMB 2,000-2,999
RMB 3,000-3,999
RMB 4,000-4,999
RMB 5,000-5,999
RMB 6,000-6,999
RMB 7,000-7,999
RMB 8,000-9,999
RMB 1,0000-14,999
Above RMB15,000
% o
f res
pond
ents
RMB 50 or less (50) RMB 51-100 (75) RMB 101-250 (175) RMB 251-500 (375) More than RMB 500 (500)
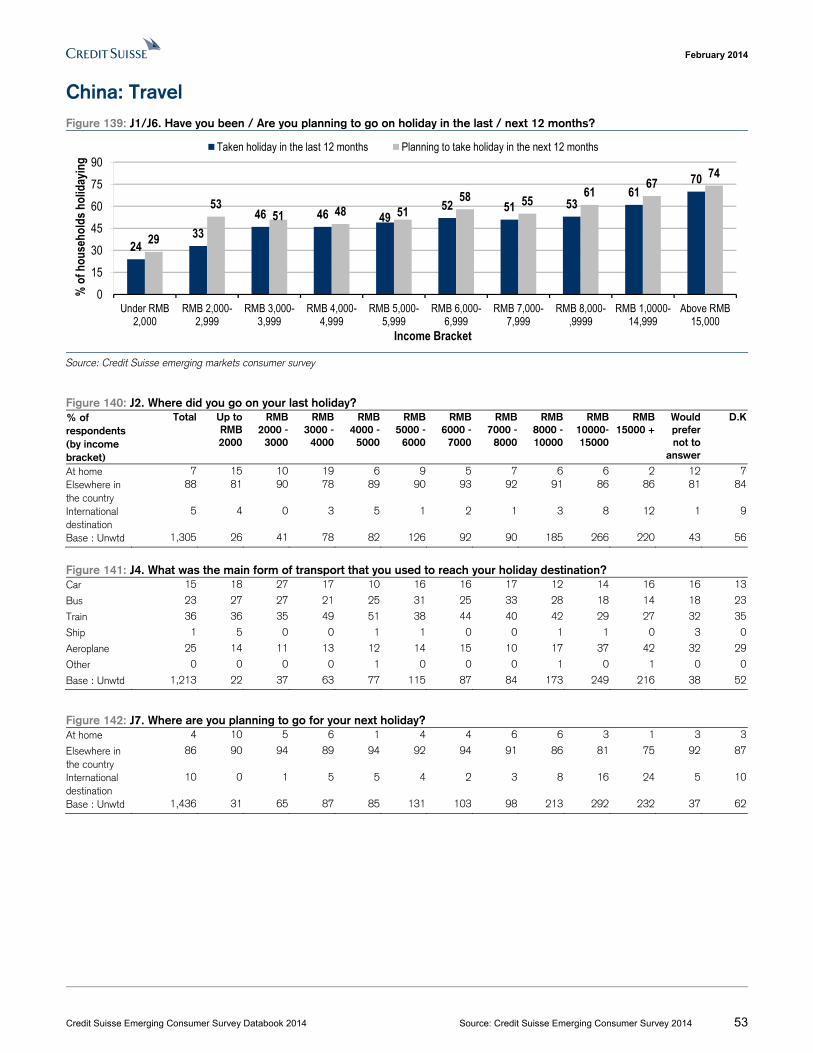
February 2014
Credit Suisse Emerging Consumer Survey Databook 2014 Source: Credit Suisse Emerging Consumer Survey 2014 53
China: Travel Figure 139: J1/J6. Have you been / Are you planning to go on holiday in the last / next 12 months?
Source: Credit Suisse emerging markets consumer survey
Figure 140: J2. Where did you go on your last holiday? % of respondents (by income bracket)
Total Up to RMB 2000
RMB 2000 -
3000
RMB 3000 -
4000
RMB 4000 -
5000
RMB 5000 -
6000
RMB 6000 -
7000
RMB 7000 -
8000
RMB 8000 -10000
RMB 10000- 15000
RMB 15000 +
Would prefer not to
answer
D.K
At home 7 15 10 19 6 9 5 7 6 6 2 12 7Elsewhere in the country
88 81 90 78 89 90 93 92 91 86 86 81 84
International destination
5 4 0 3 5 1 2 1 3 8 12 1 9
Base : Unwtd 1,305 26 41 78 82 126 92 90 185 266 220 43 56
Figure 141: J4. What was the main form of transport that you used to reach your holiday destination? Car 15 18 27 17 10 16 16 17 12 14 16 16 13
Bus 23 27 27 21 25 31 25 33 28 18 14 18 23
Train 36 36 35 49 51 38 44 40 42 29 27 32 35
Ship 1 5 0 0 1 1 0 0 1 1 0 3 0
Aeroplane 25 14 11 13 12 14 15 10 17 37 42 32 29
Other 0 0 0 0 1 0 0 0 1 0 1 0 0
Base : Unwtd 1,213 22 37 63 77 115 87 84 173 249 216 38 52
Figure 142: J7. Where are you planning to go for your next holiday? At home 4 10 5 6 1 4 4 6 6 3 1 3 3
Elsewhere in the country
86 90 94 89 94 92 94 91 86 81 75 92 87
International destination
10 0 1 5 5 4 2 3 8 16 24 5 10
Base : Unwtd 1,436 31 65 87 85 131 103 98 213 292 232 37 62
2433
46 46 4952 51 53
6170
29
5351 48 51
58 55 61 6774
0
15
30
45
60
75
90
Under RMB2,000
RMB 2,000-2,999
RMB 3,000-3,999
RMB 4,000-4,999
RMB 5,000-5,999
RMB 6,000-6,999
RMB 7,000-7,999
RMB 8,000-,9999
RMB 1,0000-14,999
Above RMB15,000
% o
f hou
seho
lds h
olid
ayin
g
Income Bracket
Taken holiday in the last 12 months Planning to take holiday in the next 12 months
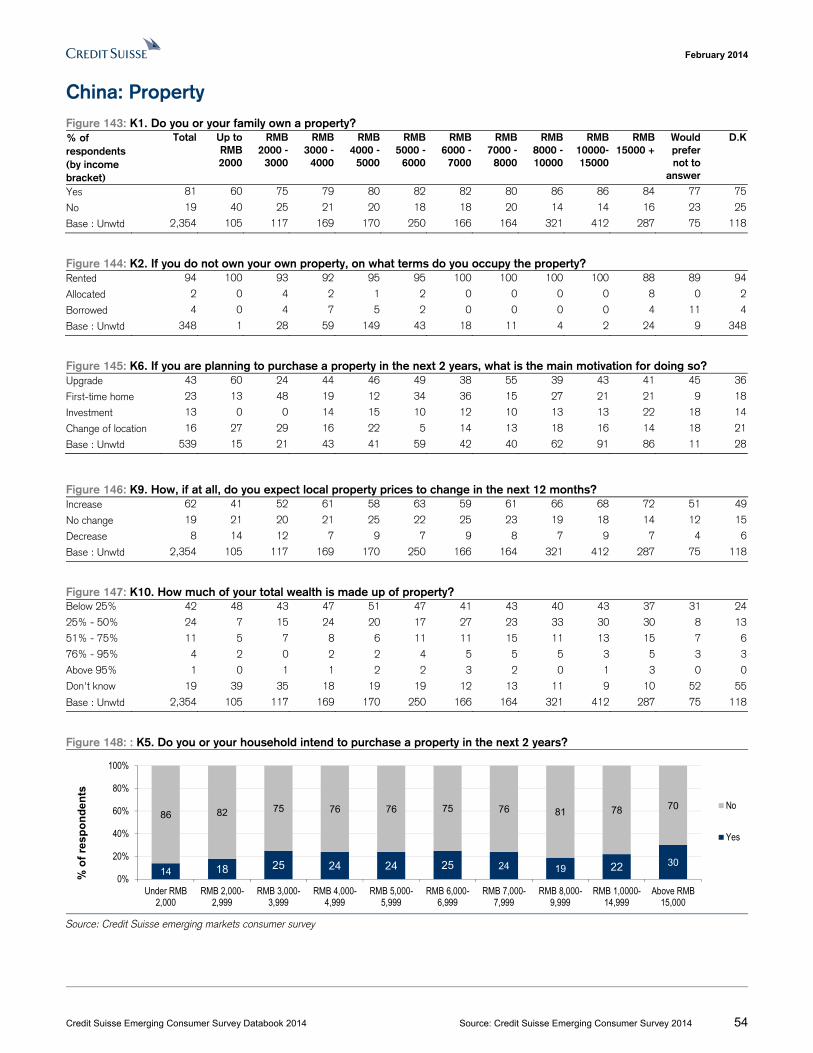
February 2014
Credit Suisse Emerging Consumer Survey Databook 2014 Source: Credit Suisse Emerging Consumer Survey 2014 54
China: Property Figure 143: K1. Do you or your family own a property? % of respondents (by income bracket)
Total Up to RMB 2000
RMB 2000 -
3000
RMB 3000 -
4000
RMB 4000 -
5000
RMB 5000 -
6000
RMB 6000 -
7000
RMB 7000 -
8000
RMB 8000 -10000
RMB 10000- 15000
RMB 15000 +
Would prefer not to
answer
D.K
Yes 81 60 75 79 80 82 82 80 86 86 84 77 75
No 19 40 25 21 20 18 18 20 14 14 16 23 25
Base : Unwtd 2,354 105 117 169 170 250 166 164 321 412 287 75 118
Figure 144: K2. If you do not own your own property, on what terms do you occupy the property? Rented 94 100 93 92 95 95 100 100 100 100 88 89 94
Allocated 2 0 4 2 1 2 0 0 0 0 8 0 2
Borrowed 4 0 4 7 5 2 0 0 0 0 4 11 4
Base : Unwtd 348 1 28 59 149 43 18 11 4 2 24 9 348
Figure 145: K6. If you are planning to purchase a property in the next 2 years, what is the main motivation for doing so? Upgrade 43 60 24 44 46 49 38 55 39 43 41 45 36
First-time home 23 13 48 19 12 34 36 15 27 21 21 9 18
Investment 13 0 0 14 15 10 12 10 13 13 22 18 14
Change of location 16 27 29 16 22 5 14 13 18 16 14 18 21
Base : Unwtd 539 15 21 43 41 59 42 40 62 91 86 11 28
Figure 146: K9. How, if at all, do you expect local property prices to change in the next 12 months? Increase 62 41 52 61 58 63 59 61 66 68 72 51 49
No change 19 21 20 21 25 22 25 23 19 18 14 12 15
Decrease 8 14 12 7 9 7 9 8 7 9 7 4 6
Base : Unwtd 2,354 105 117 169 170 250 166 164 321 412 287 75 118
Figure 147: K10. How much of your total wealth is made up of property? Below 25% 42 48 43 47 51 47 41 43 40 43 37 31 24
25% - 50% 24 7 15 24 20 17 27 23 33 30 30 8 13
51% - 75% 11 5 7 8 6 11 11 15 11 13 15 7 6
76% - 95% 4 2 0 2 2 4 5 5 5 3 5 3 3
Above 95% 1 0 1 1 2 2 3 2 0 1 3 0 0
Don't know 19 39 35 18 19 19 12 13 11 9 10 52 55
Base : Unwtd 2,354 105 117 169 170 250 166 164 321 412 287 75 118
Figure 148: : K5. Do you or your household intend to purchase a property in the next 2 years?
Source: Credit Suisse emerging markets consumer survey
14 18 25 24 24 25 24 19 22 30
86 82 75 76 76 75 76 81 78 70
0%
20%
40%
60%
80%
100%
Under RMB2,000
RMB 2,000-2,999
RMB 3,000-3,999
RMB 4,000-4,999
RMB 5,000-5,999
RMB 6,000-6,999
RMB 7,000-7,999
RMB 8,000-9,999
RMB 1,0000-14,999
Above RMB15,000
% o
f re
sp
on
de
nts
No
Yes
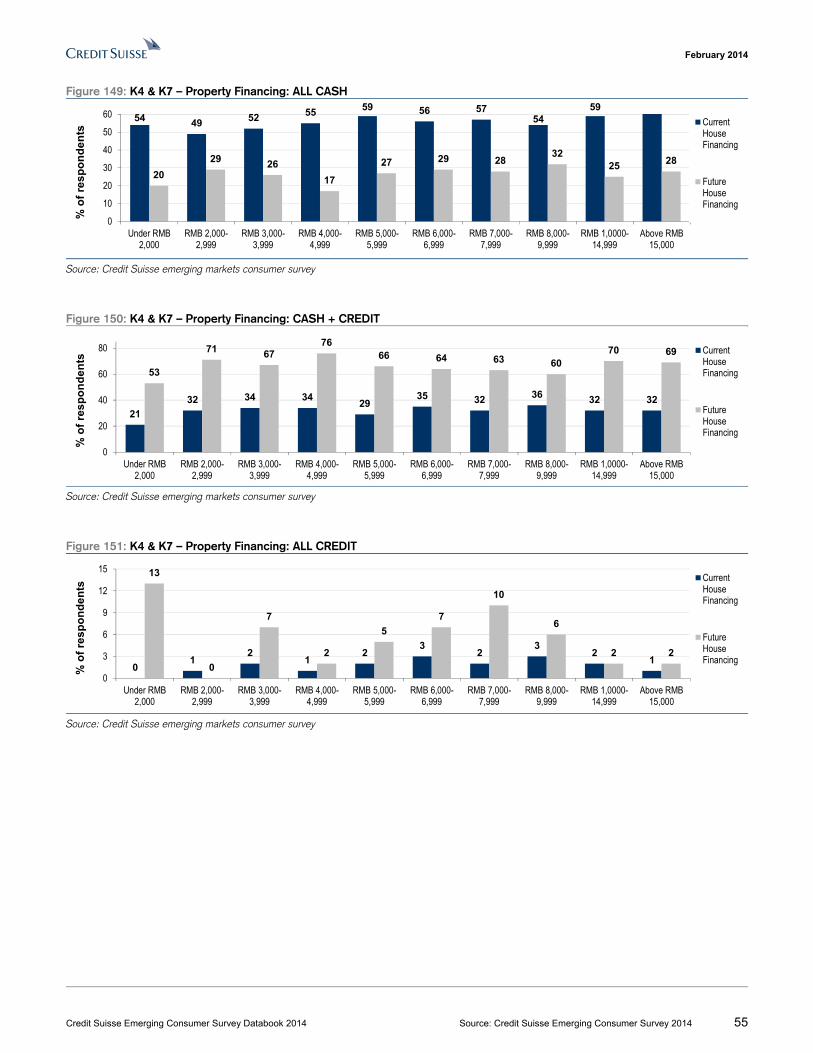
February 2014
Credit Suisse Emerging Consumer Survey Databook 2014 Source: Credit Suisse Emerging Consumer Survey 2014 55
Figure 149: K4 & K7 – Property Financing: ALL CASH
Source: Credit Suisse emerging markets consumer survey
Figure 150: K4 & K7 – Property Financing: CASH + CREDIT
Source: Credit Suisse emerging markets consumer survey
Figure 151: K4 & K7 – Property Financing: ALL CREDIT
Source: Credit Suisse emerging markets consumer survey
54 49 52 55 59 56 5754
59
20
29 26
17
27 29 2832
25 28
0
10
20
30
40
50
60
Under RMB2,000
RMB 2,000-2,999
RMB 3,000-3,999
RMB 4,000-4,999
RMB 5,000-5,999
RMB 6,000-6,999
RMB 7,000-7,999
RMB 8,000-9,999
RMB 1,0000-14,999
Above RMB15,000
% o
f re
sp
on
de
nts
CurrentHouseFinancing
FutureHouseFinancing
21
32 34 3429
35 32 36 32 32
53
71 6776
66 64 63 6070 69
0
20
40
60
80
Under RMB2,000
RMB 2,000-2,999
RMB 3,000-3,999
RMB 4,000-4,999
RMB 5,000-5,999
RMB 6,000-6,999
RMB 7,000-7,999
RMB 8,000-9,999
RMB 1,0000-14,999
Above RMB15,000
% o
f re
sp
on
de
nts
CurrentHouseFinancing
FutureHouseFinancing
01
21
23
23
21
13
0
7
2
5
7
10
6
2 2
0
3
6
9
12
15
Under RMB2,000
RMB 2,000-2,999
RMB 3,000-3,999
RMB 4,000-4,999
RMB 5,000-5,999
RMB 6,000-6,999
RMB 7,000-7,999
RMB 8,000-9,999
RMB 1,0000-14,999
Above RMB15,000
% o
f re
sp
on
de
nts
CurrentHouseFinancing
FutureHouseFinancing
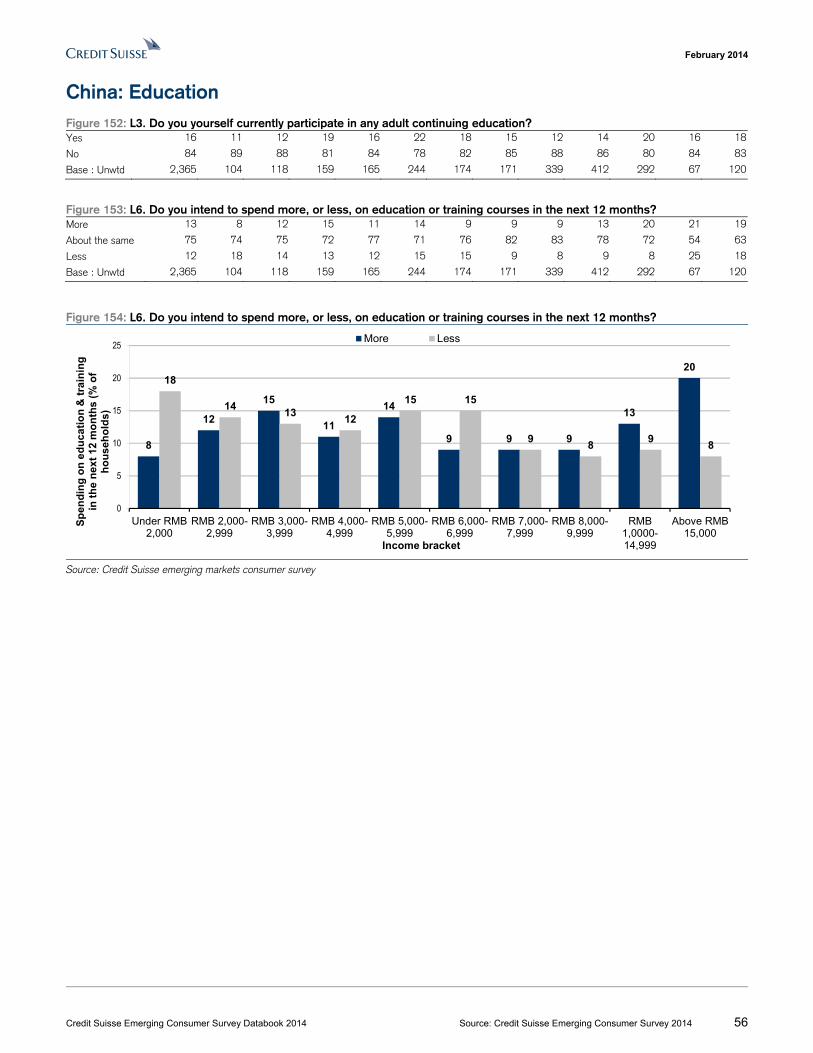
February 2014
Credit Suisse Emerging Consumer Survey Databook 2014 Source: Credit Suisse Emerging Consumer Survey 2014 56
China: Education Figure 152: L3. Do you yourself currently participate in any adult continuing education? Yes 16 11 12 19 16 22 18 15 12 14 20 16 18
No 84 89 88 81 84 78 82 85 88 86 80 84 83
Base : Unwtd 2,365 104 118 159 165 244 174 171 339 412 292 67 120
Figure 153: L6. Do you intend to spend more, or less, on education or training courses in the next 12 months? More 13 8 12 15 11 14 9 9 9 13 20 21 19
About the same 75 74 75 72 77 71 76 82 83 78 72 54 63
Less 12 18 14 13 12 15 15 9 8 9 8 25 18
Base : Unwtd 2,365 104 118 159 165 244 174 171 339 412 292 67 120
Figure 154: L6. Do you intend to spend more, or less, on education or training courses in the next 12 months?
Source: Credit Suisse emerging markets consumer survey
8
12
15
11
14
9 9 9
13
2018
1413
12
15 15
98
98
0
5
10
15
20
25
Under RMB2,000
RMB 2,000-2,999
RMB 3,000-3,999
RMB 4,000-4,999
RMB 5,000-5,999
RMB 6,000-6,999
RMB 7,000-7,999
RMB 8,000-9,999
RMB1,0000-14,999
Above RMB15,000
Sp
end
ing
on
ed
uca
tio
n &
tra
inin
g
in t
he
nex
t 12
mo
nth
s (
% o
f h
ou
seh
old
s)
Income bracket
More Less
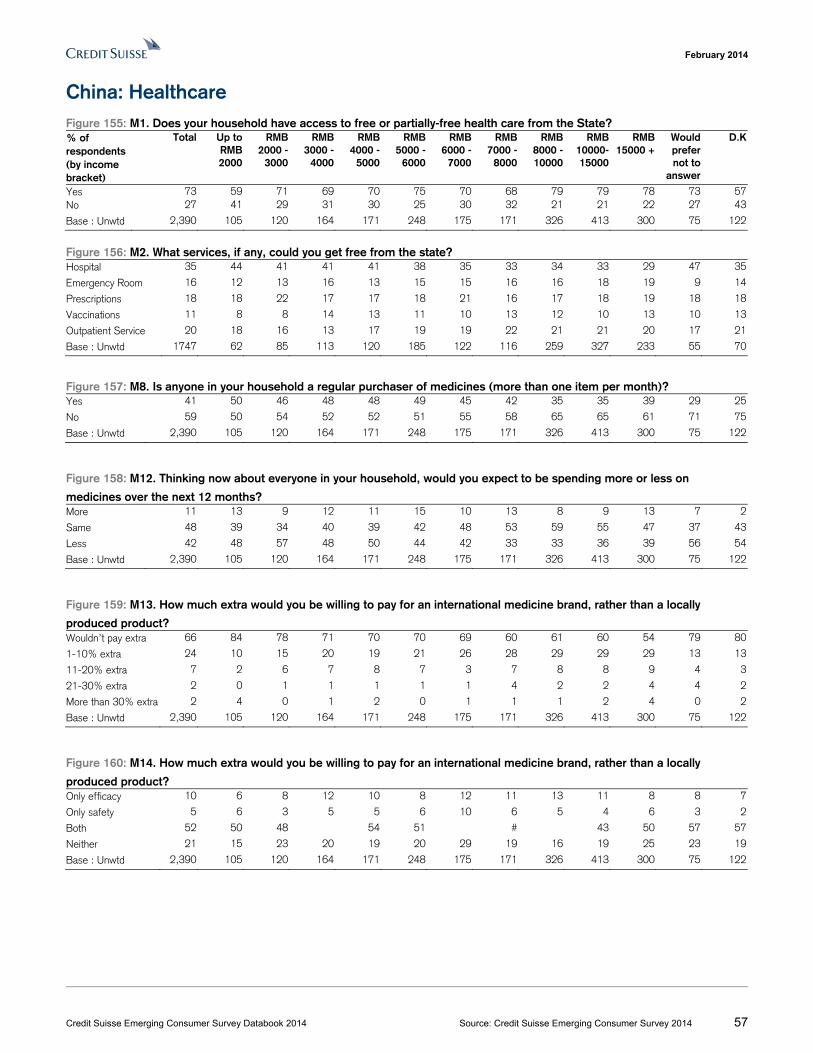
February 2014
Credit Suisse Emerging Consumer Survey Databook 2014 Source: Credit Suisse Emerging Consumer Survey 2014 57
China: Healthcare Figure 155: M1. Does your household have access to free or partially-free health care from the State? % of respondents (by income bracket)
Total Up to RMB 2000
RMB 2000 -
3000
RMB 3000 -
4000
RMB 4000 -
5000
RMB 5000 -
6000
RMB 6000 -
7000
RMB 7000 -
8000
RMB 8000 -10000
RMB 10000- 15000
RMB 15000 +
Would prefer not to
answer
D.K
Yes 73 59 71 69 70 75 70 68 79 79 78 73 57No 27 41 29 31 30 25 30 32 21 21 22 27 43
Base : Unwtd 2,390 105 120 164 171 248 175 171 326 413 300 75 122
Figure 156: M2. What services, if any, could you get free from the state? Hospital 35 44 41 41 41 38 35 33 34 33 29 47 35
Emergency Room 16 12 13 16 13 15 15 16 16 18 19 9 14
Prescriptions 18 18 22 17 17 18 21 16 17 18 19 18 18
Vaccinations 11 8 8 14 13 11 10 13 12 10 13 10 13
Outpatient Service 20 18 16 13 17 19 19 22 21 21 20 17 21
Base : Unwtd 1747 62 85 113 120 185 122 116 259 327 233 55 70
Figure 157: M8. Is anyone in your household a regular purchaser of medicines (more than one item per month)? Yes 41 50 46 48 48 49 45 42 35 35 39 29 25
No 59 50 54 52 52 51 55 58 65 65 61 71 75
Base : Unwtd 2,390 105 120 164 171 248 175 171 326 413 300 75 122
Figure 158: M12. Thinking now about everyone in your household, would you expect to be spending more or less on
medicines over the next 12 months? More 11 13 9 12 11 15 10 13 8 9 13 7 2
Same 48 39 34 40 39 42 48 53 59 55 47 37 43
Less 42 48 57 48 50 44 42 33 33 36 39 56 54
Base : Unwtd 2,390 105 120 164 171 248 175 171 326 413 300 75 122
Figure 159: M13. How much extra would you be willing to pay for an international medicine brand, rather than a locally
produced product? Wouldn’t pay extra 66 84 78 71 70 70 69 60 61 60 54 79 80
1-10% extra 24 10 15 20 19 21 26 28 29 29 29 13 13
11-20% extra 7 2 6 7 8 7 3 7 8 8 9 4 3
21-30% extra 2 0 1 1 1 1 1 4 2 2 4 4 2
More than 30% extra 2 4 0 1 2 0 1 1 1 2 4 0 2
Base : Unwtd 2,390 105 120 164 171 248 175 171 326 413 300 75 122
Figure 160: M14. How much extra would you be willing to pay for an international medicine brand, rather than a locally
produced product? Only efficacy 10 6 8 12 10 8 12 11 13 11 8 8 7
Only safety 5 6 3 5 5 6 10 6 5 4 6 3 2
Both 52 50 48 54 51 # 43 50 57 57
Neither 21 15 23 20 19 20 29 19 16 19 25 23 19
Base : Unwtd 2,390 105 120 164 171 248 175 171 326 413 300 75 122
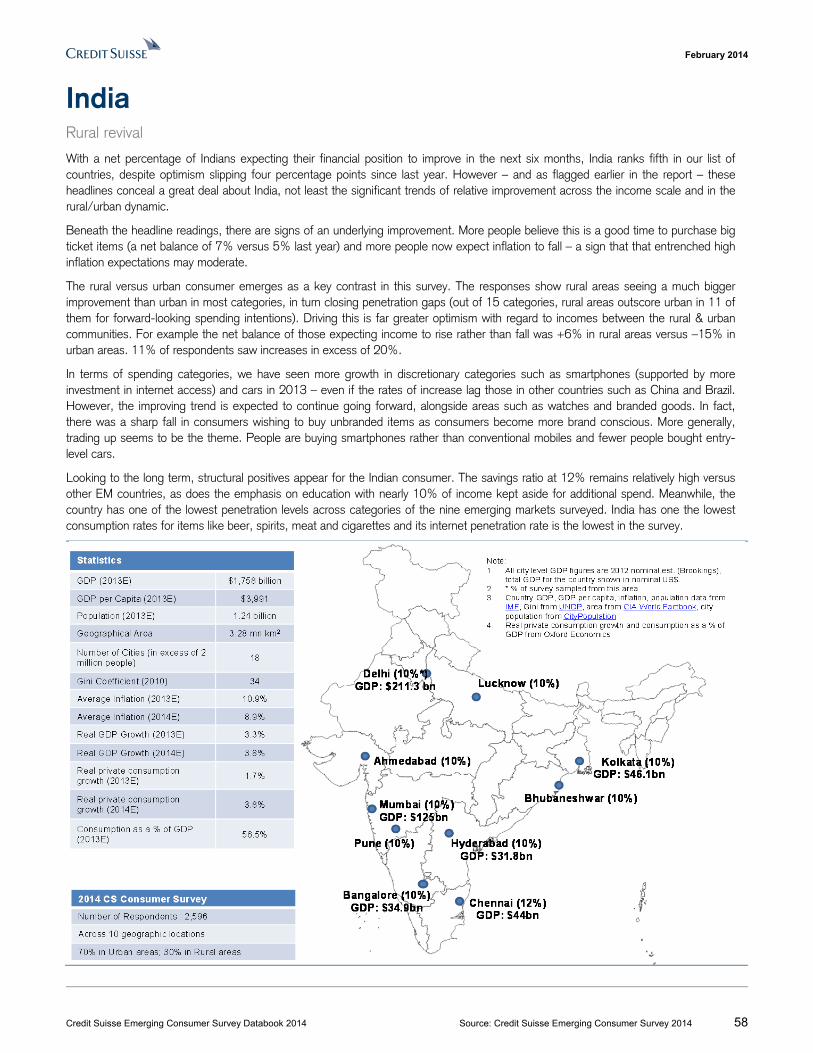
February 2014
Credit Suisse Emerging Consumer Survey Databook 2014 Source: Credit Suisse Emerging Consumer Survey 2014 58
India Rural revival
With a net percentage of Indians expecting their financial position to improve in the next six months, India ranks fifth in our list of countries, despite optimism slipping four percentage points since last year. However – and as flagged earlier in the report – these headlines conceal a great deal about India, not least the significant trends of relative improvement across the income scale and in the rural/urban dynamic.
Beneath the headline readings, there are signs of an underlying improvement. More people believe this is a good time to purchase big ticket items (a net balance of 7% versus 5% last year) and more people now expect inflation to fall – a sign that that entrenched high inflation expectations may moderate.
The rural versus urban consumer emerges as a key contrast in this survey. The responses show rural areas seeing a much bigger improvement than urban in most categories, in turn closing penetration gaps (out of 15 categories, rural areas outscore urban in 11 of them for forward-looking spending intentions). Driving this is far greater optimism with regard to incomes between the rural & urban communities. For example the net balance of those expecting income to rise rather than fall was +6% in rural areas versus –15% in urban areas. 11% of respondents saw increases in excess of 20%.
In terms of spending categories, we have seen more growth in discretionary categories such as smartphones (supported by more investment in internet access) and cars in 2013 – even if the rates of increase lag those in other countries such as China and Brazil. However, the improving trend is expected to continue going forward, alongside areas such as watches and branded goods. In fact, there was a sharp fall in consumers wishing to buy unbranded items as consumers become more brand conscious. More generally, trading up seems to be the theme. People are buying smartphones rather than conventional mobiles and fewer people bought entry-level cars.
Looking to the long term, structural positives appear for the Indian consumer. The savings ratio at 12% remains relatively high versus other EM countries, as does the emphasis on education with nearly 10% of income kept aside for additional spend. Meanwhile, the country has one of the lowest penetration levels across categories of the nine emerging markets surveyed. India has one the lowest consumption rates for items like beer, spirits, meat and cigarettes and its internet penetration rate is the lowest in the survey.
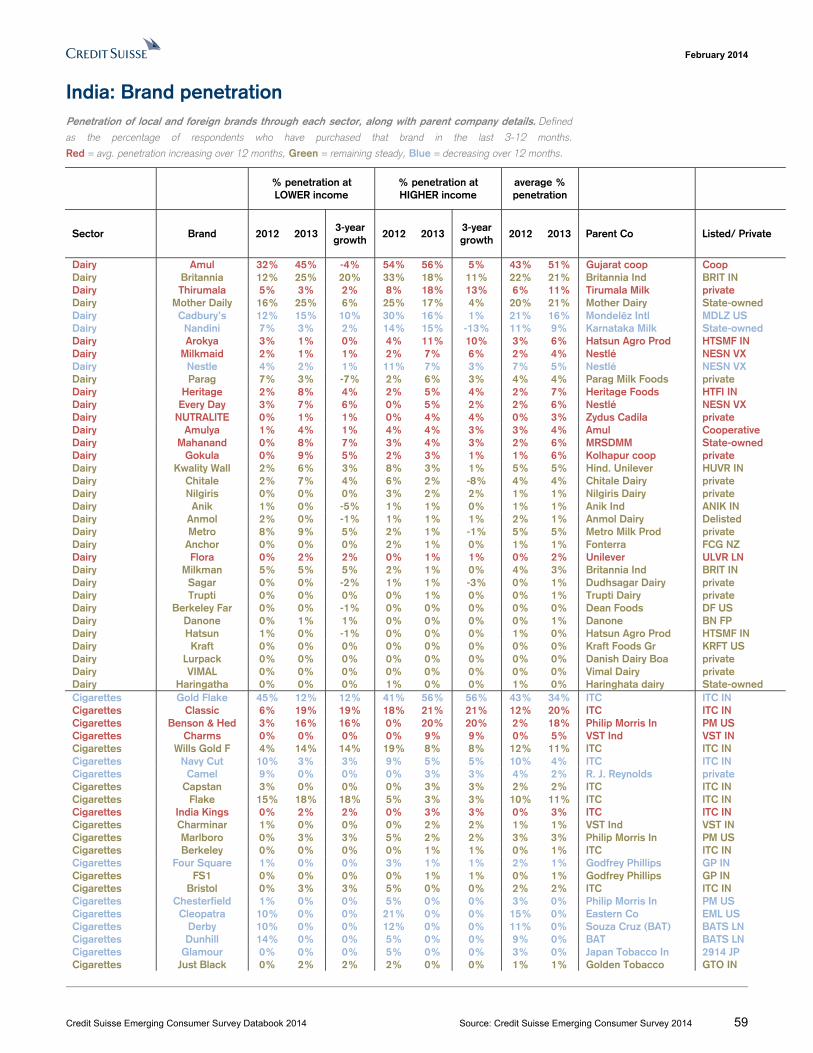
February 2014
Credit Suisse Emerging Consumer Survey Databook 2014 Source: Credit Suisse Emerging Consumer Survey 2014 59
India: Brand penetration Penetration of local and foreign brands through each sector, along with parent company details. Defined
as the percentage of respondents who have purchased that brand in the last 3-12 months.
Red = avg. penetration increasing over 12 months, Green = remaining steady, Blue = decreasing over 12 months.
% penetration at LOWER income
% penetration at HIGHER income
average % penetration
Sector Brand 2012 2013 3-year growth
2012 2013 3-year growth
2012 2013 Parent Co Listed/ Private
Dairy Amul 32% 45% -4% 54% 56% 5% 43% 51% Gujarat coop Coop Dairy Britannia 12% 25% 20% 33% 18% 11% 22% 21% Britannia Ind BRIT IN Dairy Thirumala 5% 3% 2% 8% 18% 13% 6% 11% Tirumala Milk private Dairy Mother Daily 16% 25% 6% 25% 17% 4% 20% 21% Mother Dairy State-owned Dairy Cadbury’s 12% 15% 10% 30% 16% 1% 21% 16% Mondelēz Intl MDLZ US Dairy Nandini 7% 3% 2% 14% 15% -13% 11% 9% Karnataka Milk State-owned Dairy Arokya 3% 1% 0% 4% 11% 10% 3% 6% Hatsun Agro Prod HTSMF IN Dairy Milkmaid 2% 1% 1% 2% 7% 6% 2% 4% Nestlé NESN VX Dairy Nestle 4% 2% 1% 11% 7% 3% 7% 5% Nestlé NESN VX Dairy Parag 7% 3% -7% 2% 6% 3% 4% 4% Parag Milk Foods private Dairy Heritage 2% 8% 4% 2% 5% 4% 2% 7% Heritage Foods HTFI IN Dairy Every Day 3% 7% 6% 0% 5% 2% 2% 6% Nestlé NESN VX Dairy NUTRALITE 0% 1% 1% 0% 4% 4% 0% 3% Zydus Cadila private Dairy Amulya 1% 4% 1% 4% 4% 3% 3% 4% Amul Cooperative Dairy Mahanand 0% 8% 7% 3% 4% 3% 2% 6% MRSDMM State-owned Dairy Gokula 0% 9% 5% 2% 3% 1% 1% 6% Kolhapur coop private Dairy Kwality Wall 2% 6% 3% 8% 3% 1% 5% 5% Hind. Unilever HUVR IN Dairy Chitale 2% 7% 4% 6% 2% -8% 4% 4% Chitale Dairy private Dairy Nilgiris 0% 0% 0% 3% 2% 2% 1% 1% Nilgiris Dairy private Dairy Anik 1% 0% -5% 1% 1% 0% 1% 1% Anik Ind ANIK IN Dairy Anmol 2% 0% -1% 1% 1% 1% 2% 1% Anmol Dairy Delisted Dairy Metro 8% 9% 5% 2% 1% -1% 5% 5% Metro Milk Prod private Dairy Anchor 0% 0% 0% 2% 1% 0% 1% 1% Fonterra FCG NZ Dairy Flora 0% 2% 2% 0% 1% 1% 0% 2% Unilever ULVR LN Dairy Milkman 5% 5% 5% 2% 1% 0% 4% 3% Britannia Ind BRIT IN Dairy Sagar 0% 0% -2% 1% 1% -3% 0% 1% Dudhsagar Dairy private Dairy Trupti 0% 0% 0% 0% 1% 0% 0% 1% Trupti Dairy private Dairy Berkeley Far 0% 0% -1% 0% 0% 0% 0% 0% Dean Foods DF US Dairy Danone 0% 1% 1% 0% 0% 0% 0% 1% Danone BN FP Dairy Hatsun 1% 0% -1% 0% 0% 0% 1% 0% Hatsun Agro Prod HTSMF IN Dairy Kraft 0% 0% 0% 0% 0% 0% 0% 0% Kraft Foods Gr KRFT US Dairy Lurpack 0% 0% 0% 0% 0% 0% 0% 0% Danish Dairy Boa private Dairy VIMAL 0% 0% 0% 0% 0% 0% 0% 0% Vimal Dairy private Dairy Haringatha 0% 0% 0% 1% 0% 0% 1% 0% Haringhata dairy State-owned Cigarettes Gold Flake 45% 12% 12% 41% 56% 56% 43% 34% ITC ITC IN Cigarettes Classic 6% 19% 19% 18% 21% 21% 12% 20% ITC ITC IN Cigarettes Benson & Hed 3% 16% 16% 0% 20% 20% 2% 18% Philip Morris In PM US Cigarettes Charms 0% 0% 0% 0% 9% 9% 0% 5% VST Ind VST IN Cigarettes Wills Gold F 4% 14% 14% 19% 8% 8% 12% 11% ITC ITC IN Cigarettes Navy Cut 10% 3% 3% 9% 5% 5% 10% 4% ITC ITC IN Cigarettes Camel 9% 0% 0% 0% 3% 3% 4% 2% R. J. Reynolds private Cigarettes Capstan 3% 0% 0% 0% 3% 3% 2% 2% ITC ITC IN Cigarettes Flake 15% 18% 18% 5% 3% 3% 10% 11% ITC ITC IN Cigarettes India Kings 0% 2% 2% 0% 3% 3% 0% 3% ITC ITC IN Cigarettes Charminar 1% 0% 0% 0% 2% 2% 1% 1% VST Ind VST IN Cigarettes Marlboro 0% 3% 3% 5% 2% 2% 3% 3% Philip Morris In PM US Cigarettes Berkeley 0% 0% 0% 0% 1% 1% 0% 1% ITC ITC IN Cigarettes Four Square 1% 0% 0% 3% 1% 1% 2% 1% Godfrey Phillips GP IN Cigarettes FS1 0% 0% 0% 0% 1% 1% 0% 1% Godfrey Phillips GP IN Cigarettes Bristol 0% 3% 3% 5% 0% 0% 2% 2% ITC ITC IN Cigarettes Chesterfield 1% 0% 0% 5% 0% 0% 3% 0% Philip Morris In PM US Cigarettes Cleopatra 10% 0% 0% 21% 0% 0% 15% 0% Eastern Co EML US Cigarettes Derby 10% 0% 0% 12% 0% 0% 11% 0% Souza Cruz (BAT) BATS LN Cigarettes Dunhill 14% 0% 0% 5% 0% 0% 9% 0% BAT BATS LN Cigarettes Glamour 0% 0% 0% 5% 0% 0% 3% 0% Japan Tobacco In 2914 JP Cigarettes Just Black 0% 2% 2% 2% 0% 0% 1% 1% Golden Tobacco GTO IN
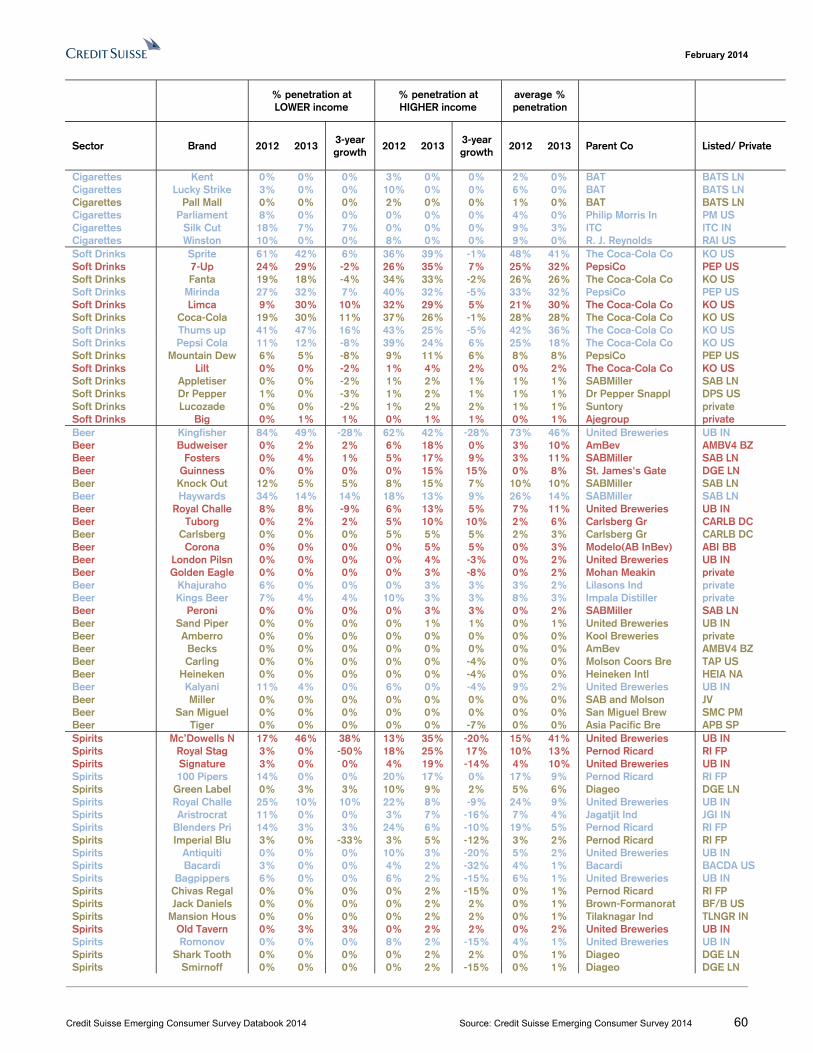
February 2014
Credit Suisse Emerging Consumer Survey Databook 2014 Source: Credit Suisse Emerging Consumer Survey 2014 60
% penetration at LOWER income
% penetration at HIGHER income
average % penetration
Sector Brand 2012 2013 3-year growth
2012 2013 3-year growth
2012 2013 Parent Co Listed/ Private
Cigarettes Kent 0% 0% 0% 3% 0% 0% 2% 0% BAT BATS LN Cigarettes Lucky Strike 3% 0% 0% 10% 0% 0% 6% 0% BAT BATS LN Cigarettes Pall Mall 0% 0% 0% 2% 0% 0% 1% 0% BAT BATS LN Cigarettes Parliament 8% 0% 0% 0% 0% 0% 4% 0% Philip Morris In PM US Cigarettes Silk Cut 18% 7% 7% 0% 0% 0% 9% 3% ITC ITC IN Cigarettes Winston 10% 0% 0% 8% 0% 0% 9% 0% R. J. Reynolds RAI US Soft Drinks Sprite 61% 42% 6% 36% 39% -1% 48% 41% The Coca-Cola Co KO US Soft Drinks 7-Up 24% 29% -2% 26% 35% 7% 25% 32% PepsiCo PEP US Soft Drinks Fanta 19% 18% -4% 34% 33% -2% 26% 26% The Coca-Cola Co KO US Soft Drinks Mirinda 27% 32% 7% 40% 32% -5% 33% 32% PepsiCo PEP US Soft Drinks Limca 9% 30% 10% 32% 29% 5% 21% 30% The Coca-Cola Co KO US Soft Drinks Coca-Cola 19% 30% 11% 37% 26% -1% 28% 28% The Coca-Cola Co KO US Soft Drinks Thums up 41% 47% 16% 43% 25% -5% 42% 36% The Coca-Cola Co KO US Soft Drinks Pepsi Cola 11% 12% -8% 39% 24% 6% 25% 18% The Coca-Cola Co KO US Soft Drinks Mountain Dew 6% 5% -8% 9% 11% 6% 8% 8% PepsiCo PEP US Soft Drinks Lilt 0% 0% -2% 1% 4% 2% 0% 2% The Coca-Cola Co KO US Soft Drinks Appletiser 0% 0% -2% 1% 2% 1% 1% 1% SABMiller SAB LN Soft Drinks Dr Pepper 1% 0% -3% 1% 2% 1% 1% 1% Dr Pepper Snappl DPS US Soft Drinks Lucozade 0% 0% -2% 1% 2% 2% 1% 1% Suntory private Soft Drinks Big 0% 1% 1% 0% 1% 1% 0% 1% Ajegroup private Beer Kingfisher 84% 49% -28% 62% 42% -28% 73% 46% United Breweries UB IN Beer Budweiser 0% 2% 2% 6% 18% 0% 3% 10% AmBev AMBV4 BZ Beer Fosters 0% 4% 1% 5% 17% 9% 3% 11% SABMiller SAB LN Beer Guinness 0% 0% 0% 0% 15% 15% 0% 8% St. James's Gate DGE LN Beer Knock Out 12% 5% 5% 8% 15% 7% 10% 10% SABMiller SAB LN Beer Haywards 34% 14% 14% 18% 13% 9% 26% 14% SABMiller SAB LN Beer Royal Challe 8% 8% -9% 6% 13% 5% 7% 11% United Breweries UB IN Beer Tuborg 0% 2% 2% 5% 10% 10% 2% 6% Carlsberg Gr CARLB DC Beer Carlsberg 0% 0% 0% 5% 5% 5% 2% 3% Carlsberg Gr CARLB DC Beer Corona 0% 0% 0% 0% 5% 5% 0% 3% Modelo(AB InBev) ABI BB Beer London Pilsn 0% 0% 0% 0% 4% -3% 0% 2% United Breweries UB IN Beer Golden Eagle 0% 0% 0% 0% 3% -8% 0% 2% Mohan Meakin private Beer Khajuraho 6% 0% 0% 0% 3% 3% 3% 2% Lilasons Ind private Beer Kings Beer 7% 4% 4% 10% 3% 3% 8% 3% Impala Distiller private Beer Peroni 0% 0% 0% 0% 3% 3% 0% 2% SABMiller SAB LN Beer Sand Piper 0% 0% 0% 0% 1% 1% 0% 1% United Breweries UB IN Beer Amberro 0% 0% 0% 0% 0% 0% 0% 0% Kool Breweries private Beer Becks 0% 0% 0% 0% 0% 0% 0% 0% AmBev AMBV4 BZ Beer Carling 0% 0% 0% 0% 0% -4% 0% 0% Molson Coors Bre TAP US Beer Heineken 0% 0% 0% 0% 0% -4% 0% 0% Heineken Intl HEIA NA Beer Kalyani 11% 4% 0% 6% 0% -4% 9% 2% United Breweries UB IN Beer Miller 0% 0% 0% 0% 0% 0% 0% 0% SAB and Molson JV Beer San Miguel 0% 0% 0% 0% 0% 0% 0% 0% San Miguel Brew SMC PM Beer Tiger 0% 0% 0% 0% 0% -7% 0% 0% Asia Pacific Bre APB SP Spirits Mc’Dowells N 17% 46% 38% 13% 35% -20% 15% 41% United Breweries UB IN Spirits Royal Stag 3% 0% -50% 18% 25% 17% 10% 13% Pernod Ricard RI FP Spirits Signature 3% 0% 0% 4% 19% -14% 4% 10% United Breweries UB IN Spirits 100 Pipers 14% 0% 0% 20% 17% 0% 17% 9% Pernod Ricard RI FP Spirits Green Label 0% 3% 3% 10% 9% 2% 5% 6% Diageo DGE LN Spirits Royal Challe 25% 10% 10% 22% 8% -9% 24% 9% United Breweries UB IN Spirits Aristrocrat 11% 0% 0% 3% 7% -16% 7% 4% Jagatjit Ind JGI IN Spirits Blenders Pri 14% 3% 3% 24% 6% -10% 19% 5% Pernod Ricard RI FP Spirits Imperial Blu 3% 0% -33% 3% 5% -12% 3% 2% Pernod Ricard RI FP Spirits Antiquiti 0% 0% 0% 10% 3% -20% 5% 2% United Breweries UB IN Spirits Bacardi 3% 0% 0% 4% 2% -32% 4% 1% Bacardi BACDA US Spirits Bagpippers 6% 0% 0% 6% 2% -15% 6% 1% United Breweries UB IN Spirits Chivas Regal 0% 0% 0% 0% 2% -15% 0% 1% Pernod Ricard RI FP Spirits Jack Daniels 0% 0% 0% 0% 2% 2% 0% 1% Brown-Formanorat BF/B US Spirits Mansion Hous 0% 0% 0% 0% 2% 2% 0% 1% Tilaknagar Ind TLNGR IN Spirits Old Tavern 0% 3% 3% 0% 2% 2% 0% 2% United Breweries UB IN Spirits Romonov 0% 0% 0% 8% 2% -15% 4% 1% United Breweries UB IN Spirits Shark Tooth 0% 0% 0% 0% 2% 2% 0% 1% Diageo DGE LN Spirits Smirnoff 0% 0% 0% 0% 2% -15% 0% 1% Diageo DGE LN
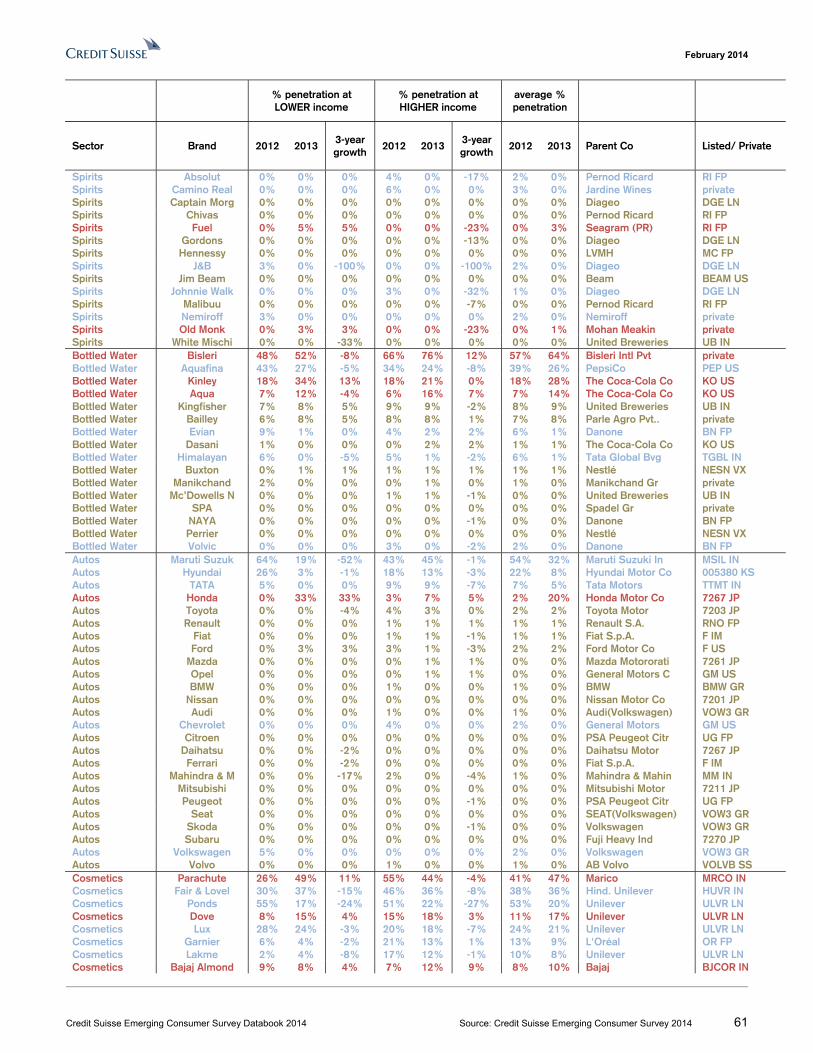
February 2014
Credit Suisse Emerging Consumer Survey Databook 2014 Source: Credit Suisse Emerging Consumer Survey 2014 61
% penetration at LOWER income
% penetration at HIGHER income
average % penetration
Sector Brand 2012 2013 3-year growth
2012 2013 3-year growth
2012 2013 Parent Co Listed/ Private
Spirits Absolut 0% 0% 0% 4% 0% -17% 2% 0% Pernod Ricard RI FP Spirits Camino Real 0% 0% 0% 6% 0% 0% 3% 0% Jardine Wines private Spirits Captain Morg 0% 0% 0% 0% 0% 0% 0% 0% Diageo DGE LN Spirits Chivas 0% 0% 0% 0% 0% 0% 0% 0% Pernod Ricard RI FP Spirits Fuel 0% 5% 5% 0% 0% -23% 0% 3% Seagram (PR) RI FP Spirits Gordons 0% 0% 0% 0% 0% -13% 0% 0% Diageo DGE LN Spirits Hennessy 0% 0% 0% 0% 0% 0% 0% 0% LVMH MC FP Spirits J&B 3% 0% -100% 0% 0% -100% 2% 0% Diageo DGE LN Spirits Jim Beam 0% 0% 0% 0% 0% 0% 0% 0% Beam BEAM US Spirits Johnnie Walk 0% 0% 0% 3% 0% -32% 1% 0% Diageo DGE LN Spirits Malibuu 0% 0% 0% 0% 0% -7% 0% 0% Pernod Ricard RI FP Spirits Nemiroff 3% 0% 0% 0% 0% 0% 2% 0% Nemiroff private Spirits Old Monk 0% 3% 3% 0% 0% -23% 0% 1% Mohan Meakin private Spirits White Mischi 0% 0% -33% 0% 0% 0% 0% 0% United Breweries UB IN Bottled Water Bisleri 48% 52% -8% 66% 76% 12% 57% 64% Bisleri Intl Pvt private Bottled Water Aquafina 43% 27% -5% 34% 24% -8% 39% 26% PepsiCo PEP US Bottled Water Kinley 18% 34% 13% 18% 21% 0% 18% 28% The Coca-Cola Co KO US Bottled Water Aqua 7% 12% -4% 6% 16% 7% 7% 14% The Coca-Cola Co KO US Bottled Water Kingfisher 7% 8% 5% 9% 9% -2% 8% 9% United Breweries UB IN Bottled Water Bailley 6% 8% 5% 8% 8% 1% 7% 8% Parle Agro Pvt.. private Bottled Water Evian 9% 1% 0% 4% 2% 2% 6% 1% Danone BN FP Bottled Water Dasani 1% 0% 0% 0% 2% 2% 1% 1% The Coca-Cola Co KO US Bottled Water Himalayan 6% 0% -5% 5% 1% -2% 6% 1% Tata Global Bvg TGBL IN Bottled Water Buxton 0% 1% 1% 1% 1% 1% 1% 1% Nestlé NESN VX Bottled Water Manikchand 2% 0% 0% 0% 1% 0% 1% 0% Manikchand Gr private Bottled Water Mc’Dowells N 0% 0% 0% 1% 1% -1% 0% 0% United Breweries UB IN Bottled Water SPA 0% 0% 0% 0% 0% 0% 0% 0% Spadel Gr private Bottled Water NAYA 0% 0% 0% 0% 0% -1% 0% 0% Danone BN FP Bottled Water Perrier 0% 0% 0% 0% 0% 0% 0% 0% Nestlé NESN VX Bottled Water Volvic 0% 0% 0% 3% 0% -2% 2% 0% Danone BN FP Autos Maruti Suzuk 64% 19% -52% 43% 45% -1% 54% 32% Maruti Suzuki In MSIL IN Autos Hyundai 26% 3% -1% 18% 13% -3% 22% 8% Hyundai Motor Co 005380 KS Autos TATA 5% 0% 0% 9% 9% -7% 7% 5% Tata Motors TTMT IN Autos Honda 0% 33% 33% 3% 7% 5% 2% 20% Honda Motor Co 7267 JP Autos Toyota 0% 0% -4% 4% 3% 0% 2% 2% Toyota Motor 7203 JP Autos Renault 0% 0% 0% 1% 1% 1% 1% 1% Renault S.A. RNO FP Autos Fiat 0% 0% 0% 1% 1% -1% 1% 1% Fiat S.p.A. F IM Autos Ford 0% 3% 3% 3% 1% -3% 2% 2% Ford Motor Co F US Autos Mazda 0% 0% 0% 0% 1% 1% 0% 0% Mazda Motororati 7261 JP Autos Opel 0% 0% 0% 0% 1% 1% 0% 0% General Motors C GM US Autos BMW 0% 0% 0% 1% 0% 0% 1% 0% BMW BMW GR Autos Nissan 0% 0% 0% 0% 0% 0% 0% 0% Nissan Motor Co 7201 JP Autos Audi 0% 0% 0% 1% 0% 0% 1% 0% Audi(Volkswagen) VOW3 GR Autos Chevrolet 0% 0% 0% 4% 0% 0% 2% 0% General Motors GM US Autos Citroen 0% 0% 0% 0% 0% 0% 0% 0% PSA Peugeot Citr UG FP Autos Daihatsu 0% 0% -2% 0% 0% 0% 0% 0% Daihatsu Motor 7267 JP Autos Ferrari 0% 0% -2% 0% 0% 0% 0% 0% Fiat S.p.A. F IM Autos Mahindra & M 0% 0% -17% 2% 0% -4% 1% 0% Mahindra & Mahin MM IN Autos Mitsubishi 0% 0% 0% 0% 0% 0% 0% 0% Mitsubishi Motor 7211 JP Autos Peugeot 0% 0% 0% 0% 0% -1% 0% 0% PSA Peugeot Citr UG FP Autos Seat 0% 0% 0% 0% 0% 0% 0% 0% SEAT(Volkswagen) VOW3 GR Autos Skoda 0% 0% 0% 0% 0% -1% 0% 0% Volkswagen VOW3 GR Autos Subaru 0% 0% 0% 0% 0% 0% 0% 0% Fuji Heavy Ind 7270 JP Autos Volkswagen 5% 0% 0% 0% 0% 0% 2% 0% Volkswagen VOW3 GR Autos Volvo 0% 0% 0% 1% 0% 0% 1% 0% AB Volvo VOLVB SS Cosmetics Parachute 26% 49% 11% 55% 44% -4% 41% 47% Marico MRCO IN Cosmetics Fair & Lovel 30% 37% -15% 46% 36% -8% 38% 36% Hind. Unilever HUVR IN Cosmetics Ponds 55% 17% -24% 51% 22% -27% 53% 20% Unilever ULVR LN Cosmetics Dove 8% 15% 4% 15% 18% 3% 11% 17% Unilever ULVR LN Cosmetics Lux 28% 24% -3% 20% 18% -7% 24% 21% Unilever ULVR LN Cosmetics Garnier 6% 4% -2% 21% 13% 1% 13% 9% L'Oréal OR FP Cosmetics Lakme 2% 4% -8% 17% 12% -1% 10% 8% Unilever ULVR LN Cosmetics Bajaj Almond 9% 8% 4% 7% 12% 9% 8% 10% Bajaj BJCOR IN
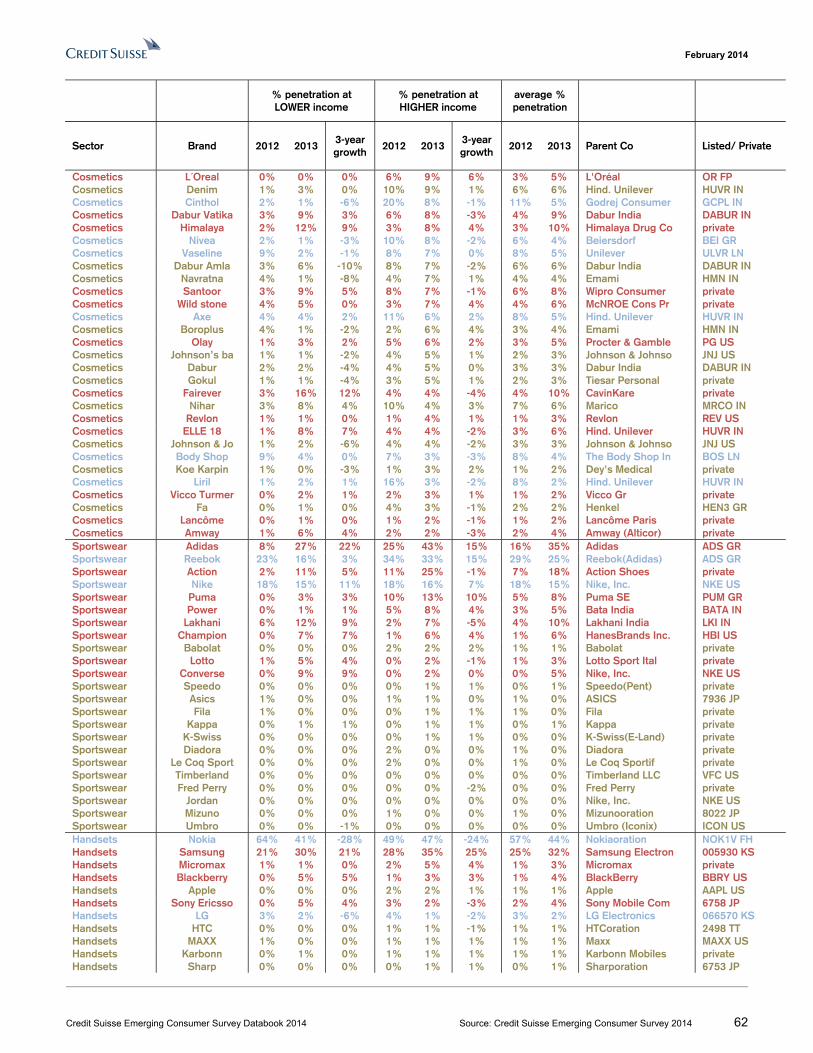
February 2014
Credit Suisse Emerging Consumer Survey Databook 2014 Source: Credit Suisse Emerging Consumer Survey 2014 62
% penetration at LOWER income
% penetration at HIGHER income
average % penetration
Sector Brand 2012 2013 3-year growth
2012 2013 3-year growth
2012 2013 Parent Co Listed/ Private
Cosmetics L´Oreal 0% 0% 0% 6% 9% 6% 3% 5% L'Oréal OR FP Cosmetics Denim 1% 3% 0% 10% 9% 1% 6% 6% Hind. Unilever HUVR IN Cosmetics Cinthol 2% 1% -6% 20% 8% -1% 11% 5% Godrej Consumer GCPL IN Cosmetics Dabur Vatika 3% 9% 3% 6% 8% -3% 4% 9% Dabur India DABUR IN Cosmetics Himalaya 2% 12% 9% 3% 8% 4% 3% 10% Himalaya Drug Co private Cosmetics Nivea 2% 1% -3% 10% 8% -2% 6% 4% Beiersdorf BEI GR Cosmetics Vaseline 9% 2% -1% 8% 7% 0% 8% 5% Unilever ULVR LN Cosmetics Dabur Amla 3% 6% -10% 8% 7% -2% 6% 6% Dabur India DABUR IN Cosmetics Navratna 4% 1% -8% 4% 7% 1% 4% 4% Emami HMN IN Cosmetics Santoor 3% 9% 5% 8% 7% -1% 6% 8% Wipro Consumer private Cosmetics Wild stone 4% 5% 0% 3% 7% 4% 4% 6% McNROE Cons Pr private Cosmetics Axe 4% 4% 2% 11% 6% 2% 8% 5% Hind. Unilever HUVR IN Cosmetics Boroplus 4% 1% -2% 2% 6% 4% 3% 4% Emami HMN IN Cosmetics Olay 1% 3% 2% 5% 6% 2% 3% 5% Procter & Gamble PG US Cosmetics Johnson’s ba 1% 1% -2% 4% 5% 1% 2% 3% Johnson & Johnso JNJ US Cosmetics Dabur 2% 2% -4% 4% 5% 0% 3% 3% Dabur India DABUR IN Cosmetics Gokul 1% 1% -4% 3% 5% 1% 2% 3% Tiesar Personal private Cosmetics Fairever 3% 16% 12% 4% 4% -4% 4% 10% CavinKare private Cosmetics Nihar 3% 8% 4% 10% 4% 3% 7% 6% Marico MRCO IN Cosmetics Revlon 1% 1% 0% 1% 4% 1% 1% 3% Revlon REV US Cosmetics ELLE 18 1% 8% 7% 4% 4% -2% 3% 6% Hind. Unilever HUVR IN Cosmetics Johnson & Jo 1% 2% -6% 4% 4% -2% 3% 3% Johnson & Johnso JNJ US Cosmetics Body Shop 9% 4% 0% 7% 3% -3% 8% 4% The Body Shop In BOS LN Cosmetics Koe Karpin 1% 0% -3% 1% 3% 2% 1% 2% Dey's Medical private Cosmetics Liril 1% 2% 1% 16% 3% -2% 8% 2% Hind. Unilever HUVR IN Cosmetics Vicco Turmer 0% 2% 1% 2% 3% 1% 1% 2% Vicco Gr private Cosmetics Fa 0% 1% 0% 4% 3% -1% 2% 2% Henkel HEN3 GR Cosmetics Lancôme 0% 1% 0% 1% 2% -1% 1% 2% Lancôme Paris private Cosmetics Amway 1% 6% 4% 2% 2% -3% 2% 4% Amway (Alticor) private Sportswear Adidas 8% 27% 22% 25% 43% 15% 16% 35% Adidas ADS GR Sportswear Reebok 23% 16% 3% 34% 33% 15% 29% 25% Reebok(Adidas) ADS GR Sportswear Action 2% 11% 5% 11% 25% -1% 7% 18% Action Shoes private Sportswear Nike 18% 15% 11% 18% 16% 7% 18% 15% Nike, Inc. NKE US Sportswear Puma 0% 3% 3% 10% 13% 10% 5% 8% Puma SE PUM GR Sportswear Power 0% 1% 1% 5% 8% 4% 3% 5% Bata India BATA IN Sportswear Lakhani 6% 12% 9% 2% 7% -5% 4% 10% Lakhani India LKI IN Sportswear Champion 0% 7% 7% 1% 6% 4% 1% 6% HanesBrands Inc. HBI US Sportswear Babolat 0% 0% 0% 2% 2% 2% 1% 1% Babolat private Sportswear Lotto 1% 5% 4% 0% 2% -1% 1% 3% Lotto Sport Ital private Sportswear Converse 0% 9% 9% 0% 2% 0% 0% 5% Nike, Inc. NKE US Sportswear Speedo 0% 0% 0% 0% 1% 1% 0% 1% Speedo(Pent) private Sportswear Asics 1% 0% 0% 1% 1% 0% 1% 0% ASICS 7936 JP Sportswear Fila 1% 0% 0% 0% 1% 1% 1% 0% Fila private Sportswear Kappa 0% 1% 1% 0% 1% 1% 0% 1% Kappa private Sportswear K-Swiss 0% 0% 0% 0% 1% 1% 0% 0% K-Swiss(E-Land) private Sportswear Diadora 0% 0% 0% 2% 0% 0% 1% 0% Diadora private Sportswear Le Coq Sport 0% 0% 0% 2% 0% 0% 1% 0% Le Coq Sportif private Sportswear Timberland 0% 0% 0% 0% 0% 0% 0% 0% Timberland LLC VFC US Sportswear Fred Perry 0% 0% 0% 0% 0% -2% 0% 0% Fred Perry private Sportswear Jordan 0% 0% 0% 0% 0% 0% 0% 0% Nike, Inc. NKE US Sportswear Mizuno 0% 0% 0% 1% 0% 0% 1% 0% Mizunooration 8022 JP Sportswear Umbro 0% 0% -1% 0% 0% 0% 0% 0% Umbro (Iconix) ICON US Handsets Nokia 64% 41% -28% 49% 47% -24% 57% 44% Nokiaoration NOK1V FH Handsets Samsung 21% 30% 21% 28% 35% 25% 25% 32% Samsung Electron 005930 KS Handsets Micromax 1% 1% 0% 2% 5% 4% 1% 3% Micromax private Handsets Blackberry 0% 5% 5% 1% 3% 3% 1% 4% BlackBerry BBRY US Handsets Apple 0% 0% 0% 2% 2% 1% 1% 1% Apple AAPL US Handsets Sony Ericsso 0% 5% 4% 3% 2% -3% 2% 4% Sony Mobile Com 6758 JP Handsets LG 3% 2% -6% 4% 1% -2% 3% 2% LG Electronics 066570 KS Handsets HTC 0% 0% 0% 1% 1% -1% 1% 1% HTCoration 2498 TT Handsets MAXX 1% 0% 0% 1% 1% 1% 1% 1% Maxx MAXX US Handsets Karbonn 0% 1% 0% 1% 1% 1% 1% 1% Karbonn Mobiles private Handsets Sharp 0% 0% 0% 0% 1% 1% 0% 1% Sharporation 6753 JP
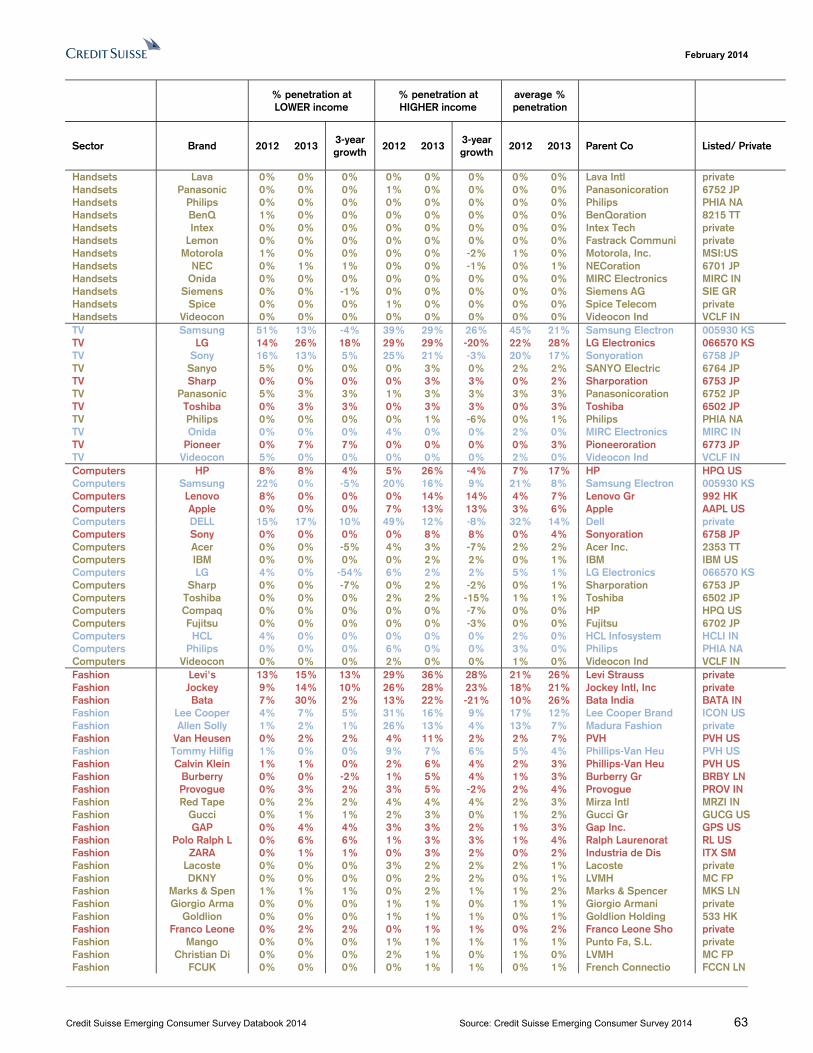
February 2014
Credit Suisse Emerging Consumer Survey Databook 2014 Source: Credit Suisse Emerging Consumer Survey 2014 63
% penetration at LOWER income
% penetration at HIGHER income
average % penetration
Sector Brand 2012 2013 3-year growth
2012 2013 3-year growth
2012 2013 Parent Co Listed/ Private
Handsets Lava 0% 0% 0% 0% 0% 0% 0% 0% Lava Intl private Handsets Panasonic 0% 0% 0% 1% 0% 0% 0% 0% Panasonicoration 6752 JP Handsets Philips 0% 0% 0% 0% 0% 0% 0% 0% Philips PHIA NA Handsets BenQ 1% 0% 0% 0% 0% 0% 0% 0% BenQoration 8215 TT Handsets Intex 0% 0% 0% 0% 0% 0% 0% 0% Intex Tech private Handsets Lemon 0% 0% 0% 0% 0% 0% 0% 0% Fastrack Communi private Handsets Motorola 1% 0% 0% 0% 0% -2% 1% 0% Motorola, Inc. MSI:US Handsets NEC 0% 1% 1% 0% 0% -1% 0% 1% NECoration 6701 JP Handsets Onida 0% 0% 0% 0% 0% 0% 0% 0% MIRC Electronics MIRC IN Handsets Siemens 0% 0% -1% 0% 0% 0% 0% 0% Siemens AG SIE GR Handsets Spice 0% 0% 0% 1% 0% 0% 0% 0% Spice Telecom private Handsets Videocon 0% 0% 0% 0% 0% 0% 0% 0% Videocon Ind VCLF IN TV Samsung 51% 13% -4% 39% 29% 26% 45% 21% Samsung Electron 005930 KS TV LG 14% 26% 18% 29% 29% -20% 22% 28% LG Electronics 066570 KS TV Sony 16% 13% 5% 25% 21% -3% 20% 17% Sonyoration 6758 JP TV Sanyo 5% 0% 0% 0% 3% 0% 2% 2% SANYO Electric 6764 JP TV Sharp 0% 0% 0% 0% 3% 3% 0% 2% Sharporation 6753 JP TV Panasonic 5% 3% 3% 1% 3% 3% 3% 3% Panasonicoration 6752 JP TV Toshiba 0% 3% 3% 0% 3% 3% 0% 3% Toshiba 6502 JP TV Philips 0% 0% 0% 0% 1% -6% 0% 1% Philips PHIA NA TV Onida 0% 0% 0% 4% 0% 0% 2% 0% MIRC Electronics MIRC IN TV Pioneer 0% 7% 7% 0% 0% 0% 0% 3% Pioneeroration 6773 JP TV Videocon 5% 0% 0% 0% 0% 0% 2% 0% Videocon Ind VCLF IN Computers HP 8% 8% 4% 5% 26% -4% 7% 17% HP HPQ US Computers Samsung 22% 0% -5% 20% 16% 9% 21% 8% Samsung Electron 005930 KS Computers Lenovo 8% 0% 0% 0% 14% 14% 4% 7% Lenovo Gr 992 HK Computers Apple 0% 0% 0% 7% 13% 13% 3% 6% Apple AAPL US Computers DELL 15% 17% 10% 49% 12% -8% 32% 14% Dell private Computers Sony 0% 0% 0% 0% 8% 8% 0% 4% Sonyoration 6758 JP Computers Acer 0% 0% -5% 4% 3% -7% 2% 2% Acer Inc. 2353 TT Computers IBM 0% 0% 0% 0% 2% 2% 0% 1% IBM IBM US Computers LG 4% 0% -54% 6% 2% 2% 5% 1% LG Electronics 066570 KS Computers Sharp 0% 0% -7% 0% 2% -2% 0% 1% Sharporation 6753 JP Computers Toshiba 0% 0% 0% 2% 2% -15% 1% 1% Toshiba 6502 JP Computers Compaq 0% 0% 0% 0% 0% -7% 0% 0% HP HPQ US Computers Fujitsu 0% 0% 0% 0% 0% -3% 0% 0% Fujitsu 6702 JP Computers HCL 4% 0% 0% 0% 0% 0% 2% 0% HCL Infosystem HCLI IN Computers Philips 0% 0% 0% 6% 0% 0% 3% 0% Philips PHIA NA Computers Videocon 0% 0% 0% 2% 0% 0% 1% 0% Videocon Ind VCLF IN Fashion Levi's 13% 15% 13% 29% 36% 28% 21% 26% Levi Strauss private Fashion Jockey 9% 14% 10% 26% 28% 23% 18% 21% Jockey Intl, Inc private Fashion Bata 7% 30% 2% 13% 22% -21% 10% 26% Bata India BATA IN Fashion Lee Cooper 4% 7% 5% 31% 16% 9% 17% 12% Lee Cooper Brand ICON US Fashion Allen Solly 1% 2% 1% 26% 13% 4% 13% 7% Madura Fashion private Fashion Van Heusen 0% 2% 2% 4% 11% 2% 2% 7% PVH PVH US Fashion Tommy Hilfig 1% 0% 0% 9% 7% 6% 5% 4% Phillips-Van Heu PVH US Fashion Calvin Klein 1% 1% 0% 2% 6% 4% 2% 3% Phillips-Van Heu PVH US Fashion Burberry 0% 0% -2% 1% 5% 4% 1% 3% Burberry Gr BRBY LN Fashion Provogue 0% 3% 2% 3% 5% -2% 2% 4% Provogue PROV IN Fashion Red Tape 0% 2% 2% 4% 4% 4% 2% 3% Mirza Intl MRZI IN Fashion Gucci 0% 1% 1% 2% 3% 0% 1% 2% Gucci Gr GUCG US Fashion GAP 0% 4% 4% 3% 3% 2% 1% 3% Gap Inc. GPS US Fashion Polo Ralph L 0% 6% 6% 1% 3% 3% 1% 4% Ralph Laurenorat RL US Fashion ZARA 0% 1% 1% 0% 3% 2% 0% 2% Industria de Dis ITX SM Fashion Lacoste 0% 0% 0% 3% 2% 2% 2% 1% Lacoste private Fashion DKNY 0% 0% 0% 0% 2% 2% 0% 1% LVMH MC FP Fashion Marks & Spen 1% 1% 1% 0% 2% 1% 1% 2% Marks & Spencer MKS LN Fashion Giorgio Arma 0% 0% 0% 1% 1% 0% 1% 1% Giorgio Armani private Fashion Goldlion 0% 0% 0% 1% 1% 1% 0% 1% Goldlion Holding 533 HK Fashion Franco Leone 0% 2% 2% 0% 1% 1% 0% 2% Franco Leone Sho private Fashion Mango 0% 0% 0% 1% 1% 1% 1% 1% Punto Fa, S.L. private Fashion Christian Di 0% 0% 0% 2% 1% 0% 1% 0% LVMH MC FP Fashion FCUK 0% 0% 0% 0% 1% 1% 0% 1% French Connectio FCCN LN
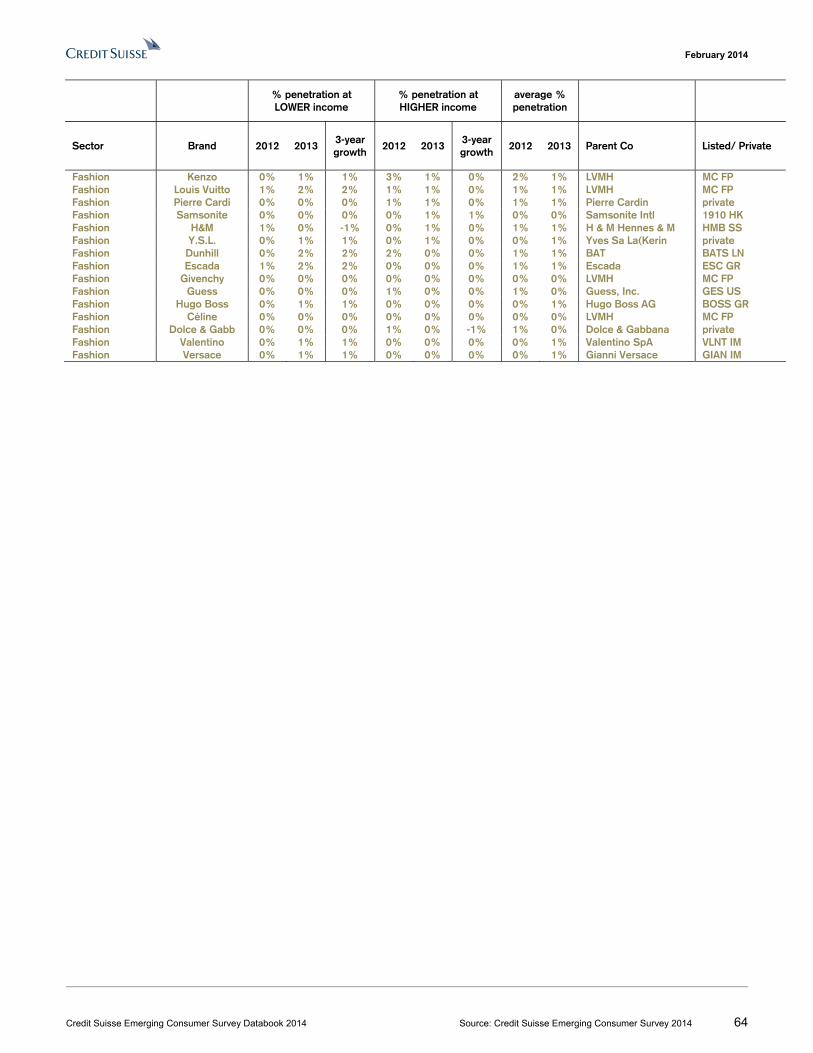
February 2014
Credit Suisse Emerging Consumer Survey Databook 2014 Source: Credit Suisse Emerging Consumer Survey 2014 64
% penetration at LOWER income
% penetration at HIGHER income
average % penetration
Sector Brand 2012 2013 3-year growth
2012 2013 3-year growth
2012 2013 Parent Co Listed/ Private
Fashion Kenzo 0% 1% 1% 3% 1% 0% 2% 1% LVMH MC FP Fashion Louis Vuitto 1% 2% 2% 1% 1% 0% 1% 1% LVMH MC FP Fashion Pierre Cardi 0% 0% 0% 1% 1% 0% 1% 1% Pierre Cardin private Fashion Samsonite 0% 0% 0% 0% 1% 1% 0% 0% Samsonite Intl 1910 HK Fashion H&M 1% 0% -1% 0% 1% 0% 1% 1% H & M Hennes & M HMB SS Fashion Y.S.L. 0% 1% 1% 0% 1% 0% 0% 1% Yves Sa La(Kerin private Fashion Dunhill 0% 2% 2% 2% 0% 0% 1% 1% BAT BATS LN Fashion Escada 1% 2% 2% 0% 0% 0% 1% 1% Escada ESC GR Fashion Givenchy 0% 0% 0% 0% 0% 0% 0% 0% LVMH MC FP Fashion Guess 0% 0% 0% 1% 0% 0% 1% 0% Guess, Inc. GES US Fashion Hugo Boss 0% 1% 1% 0% 0% 0% 0% 1% Hugo Boss AG BOSS GR Fashion Céline 0% 0% 0% 0% 0% 0% 0% 0% LVMH MC FP Fashion Dolce & Gabb 0% 0% 0% 1% 0% -1% 1% 0% Dolce & Gabbana private Fashion Valentino 0% 1% 1% 0% 0% 0% 0% 1% Valentino SpA VLNT IM Fashion Versace 0% 1% 1% 0% 0% 0% 0% 1% Gianni Versace GIAN IM
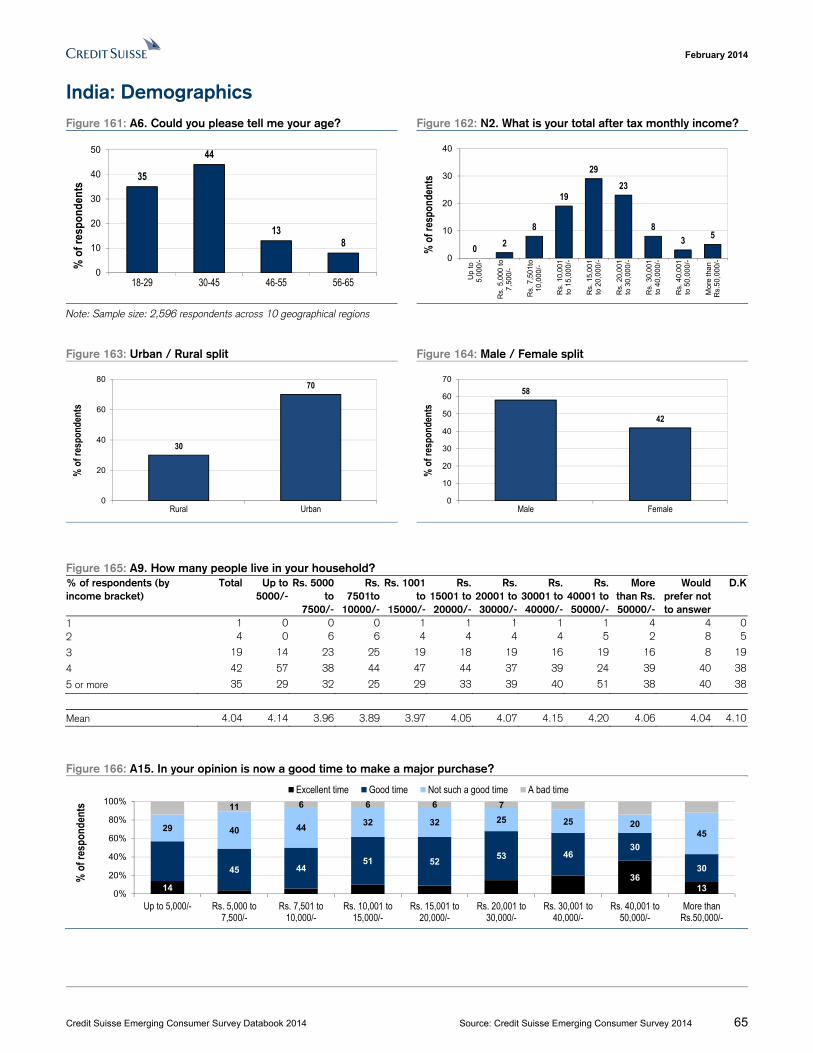
February 2014
Credit Suisse Emerging Consumer Survey Databook 2014 Source: Credit Suisse Emerging Consumer Survey 2014 65
India: Demographics Figure 161: A6. Could you please tell me your age? Figure 162: N2. What is your total after tax monthly income?
Note: Sample size: 2,596 respondents across 10 geographical regions
Figure 163: Urban / Rural split Figure 164: Male / Female split
Figure 165: A9. How many people live in your household? % of respondents (by income bracket)
Total Up to 5000/-
Rs. 5000 to
7500/-
Rs. 7501to
10000/-
Rs. 1001 to
15000/-
Rs. 15001 to 20000/-
Rs. 20001 to 30000/-
Rs. 30001 to 40000/-
Rs. 40001 to 50000/-
More than Rs. 50000/-
Would prefer not to answer
D.K
1 1 0 0 0 1 1 1 1 1 4 4 02 4 0 6 6 4 4 4 4 5 2 8 5
3 19 14 23 25 19 18 19 16 19 16 8 19
4 42 57 38 44 47 44 37 39 24 39 40 38
5 or more 35 29 32 25 29 33 39 40 51 38 40 38
Mean 4.04 4.14 3.96 3.89 3.97 4.05 4.07 4.15 4.20 4.06 4.04 4.10
Figure 166: A15. In your opinion is now a good time to make a major purchase?
35
44
138
0
10
20
30
40
50
18-29 30-45 46-55 56-65
% o
f res
pond
ents
0 28
19
2923
83 5
0
10
20
30
40
Up
to5,
000/
-
Rs.
5,0
00 t
o7,
500/
-
Rs.
7,5
01to
10,0
00/-
Rs.
10,
001
to 1
5,00
0/-
Rs.
15,
001
to 2
0,00
0/-
Rs.
20,
001
to 3
0,00
0/-
Rs.
30,
001
to 4
0,00
0/-
Rs.
40,
001
to 5
0,00
0/-
Mor
e th
anR
s.50
,000
/-
% o
f res
pond
ents
30
70
0
20
40
60
80
Rural Urban
% o
f res
pond
ents
58
42
0
10
20
30
40
50
60
70
Male Female
% o
f res
pond
ents
1436
13
45 4451 52
53 4630
30
29 40 4432 32 25 25 20
45
11 6 6 6 7
0%
20%
40%
60%
80%
100%
Up to 5,000/- Rs. 5,000 to7,500/-
Rs. 7,501 to10,000/-
Rs. 10,001 to15,000/-
Rs. 15,001 to20,000/-
Rs. 20,001 to30,000/-
Rs. 30,001 to40,000/-
Rs. 40,001 to50,000/-
More thanRs.50,000/-
% o
f res
pond
ents
Excellent time Good time Not such a good time A bad time
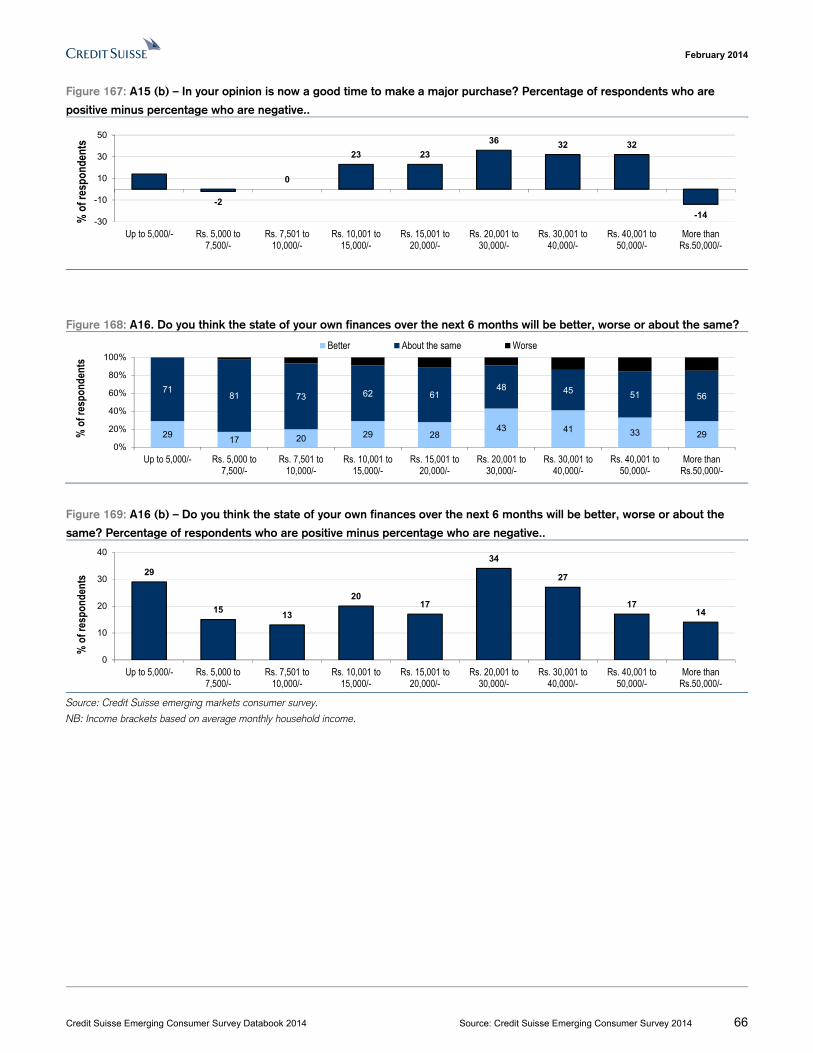
February 2014
Credit Suisse Emerging Consumer Survey Databook 2014 Source: Credit Suisse Emerging Consumer Survey 2014 66
Figure 167: A15 (b) – In your opinion is now a good time to make a major purchase? Percentage of respondents who are
positive minus percentage who are negative..
Figure 168: A16. Do you think the state of your own finances over the next 6 months will be better, worse or about the same?
Figure 169: A16 (b) – Do you think the state of your own finances over the next 6 months will be better, worse or about the
same? Percentage of respondents who are positive minus percentage who are negative..
Source: Credit Suisse emerging markets consumer survey.
NB: Income brackets based on average monthly household income.
-2
0
23 23
36 32 32
-14-30
-10
10
30
50
Up to 5,000/- Rs. 5,000 to7,500/-
Rs. 7,501 to10,000/-
Rs. 10,001 to15,000/-
Rs. 15,001 to20,000/-
Rs. 20,001 to30,000/-
Rs. 30,001 to40,000/-
Rs. 40,001 to50,000/-
More thanRs.50,000/-
% o
f res
pond
ents
2917 20 29 28
43 41 33 29
7181 73 62 61
48 45 51 56
0%
20%
40%
60%
80%
100%
Up to 5,000/- Rs. 5,000 to7,500/-
Rs. 7,501 to10,000/-
Rs. 10,001 to15,000/-
Rs. 15,001 to20,000/-
Rs. 20,001 to30,000/-
Rs. 30,001 to40,000/-
Rs. 40,001 to50,000/-
More thanRs.50,000/-
% o
f res
pond
ents
Better About the same Worse
29
1513
2017
34
27
1714
0
10
20
30
40
Up to 5,000/- Rs. 5,000 to7,500/-
Rs. 7,501 to10,000/-
Rs. 10,001 to15,000/-
Rs. 15,001 to20,000/-
Rs. 20,001 to30,000/-
Rs. 30,001 to40,000/-
Rs. 40,001 to50,000/-
More thanRs.50,000/-
% o
f res
pond
ents
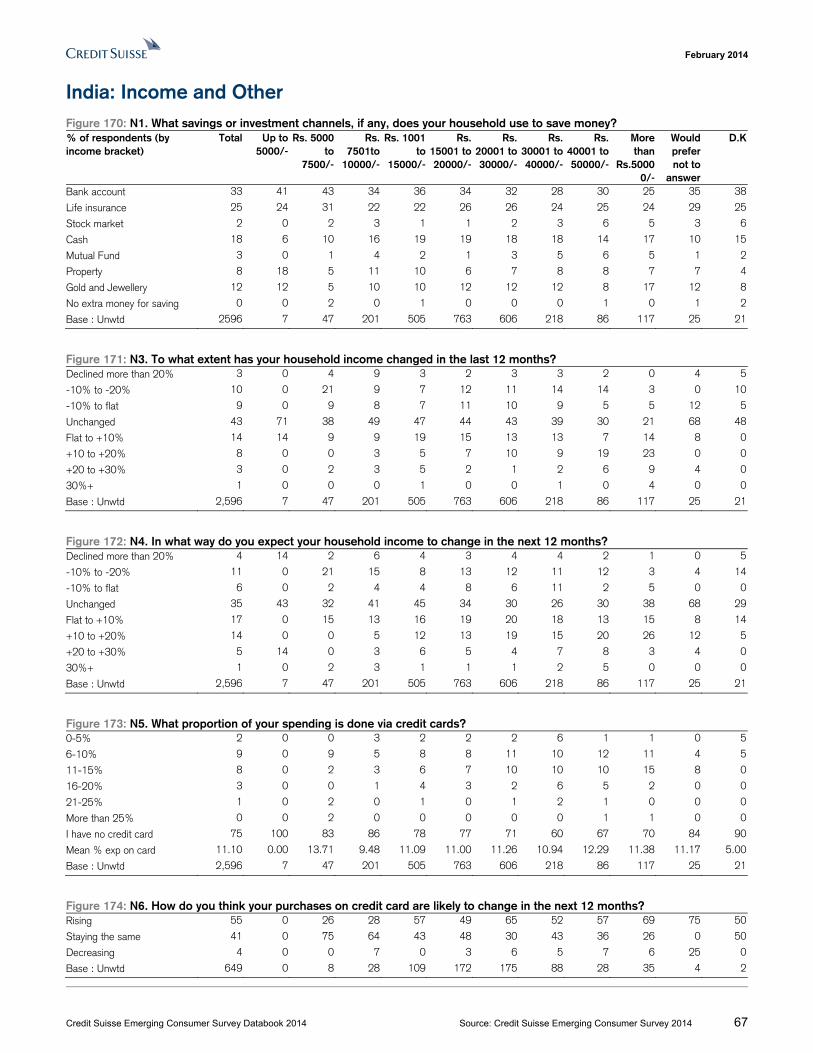
February 2014
Credit Suisse Emerging Consumer Survey Databook 2014 Source: Credit Suisse Emerging Consumer Survey 2014 67
India: Income and Other Figure 170: N1. What savings or investment channels, if any, does your household use to save money? % of respondents (by income bracket)
Total Up to 5000/-
Rs. 5000 to
7500/-
Rs. 7501to
10000/-
Rs. 1001 to
15000/-
Rs. 15001 to 20000/-
Rs. 20001 to 30000/-
Rs. 30001 to 40000/-
Rs. 40001 to 50000/-
More than
Rs.50000/-
Would prefer not to
answer
D.K
Bank account 33 41 43 34 36 34 32 28 30 25 35 38
Life insurance 25 24 31 22 22 26 26 24 25 24 29 25
Stock market 2 0 2 3 1 1 2 3 6 5 3 6
Cash 18 6 10 16 19 19 18 18 14 17 10 15
Mutual Fund 3 0 1 4 2 1 3 5 6 5 1 2
Property 8 18 5 11 10 6 7 8 8 7 7 4
Gold and Jewellery 12 12 5 10 10 12 12 12 8 17 12 8
No extra money for saving 0 0 2 0 1 0 0 0 1 0 1 2
Base : Unwtd 2596 7 47 201 505 763 606 218 86 117 25 21
Figure 171: N3. To what extent has your household income changed in the last 12 months? Declined more than 20% 3 0 4 9 3 2 3 3 2 0 4 5
-10% to -20% 10 0 21 9 7 12 11 14 14 3 0 10
-10% to flat 9 0 9 8 7 11 10 9 5 5 12 5
Unchanged 43 71 38 49 47 44 43 39 30 21 68 48
Flat to +10% 14 14 9 9 19 15 13 13 7 14 8 0
+10 to +20% 8 0 0 3 5 7 10 9 19 23 0 0
+20 to +30% 3 0 2 3 5 2 1 2 6 9 4 0
30%+ 1 0 0 0 1 0 0 1 0 4 0 0
Base : Unwtd 2,596 7 47 201 505 763 606 218 86 117 25 21
Figure 172: N4. In what way do you expect your household income to change in the next 12 months? Declined more than 20% 4 14 2 6 4 3 4 4 2 1 0 5
-10% to -20% 11 0 21 15 8 13 12 11 12 3 4 14
-10% to flat 6 0 2 4 4 8 6 11 2 5 0 0
Unchanged 35 43 32 41 45 34 30 26 30 38 68 29
Flat to +10% 17 0 15 13 16 19 20 18 13 15 8 14
+10 to +20% 14 0 0 5 12 13 19 15 20 26 12 5
+20 to +30% 5 14 0 3 6 5 4 7 8 3 4 0
30%+ 1 0 2 3 1 1 1 2 5 0 0 0
Base : Unwtd 2,596 7 47 201 505 763 606 218 86 117 25 21
Figure 173: N5. What proportion of your spending is done via credit cards? 0-5% 2 0 0 3 2 2 2 6 1 1 0 5
6-10% 9 0 9 5 8 8 11 10 12 11 4 5
11-15% 8 0 2 3 6 7 10 10 10 15 8 0
16-20% 3 0 0 1 4 3 2 6 5 2 0 0
21-25% 1 0 2 0 1 0 1 2 1 0 0 0
More than 25% 0 0 2 0 0 0 0 0 1 1 0 0
I have no credit card 75 100 83 86 78 77 71 60 67 70 84 90
Mean % exp on card 11.10 0.00 13.71 9.48 11.09 11.00 11.26 10.94 12.29 11.38 11.17 5.00
Base : Unwtd 2,596 7 47 201 505 763 606 218 86 117 25 21
Figure 174: N6. How do you think your purchases on credit card are likely to change in the next 12 months? Rising 55 0 26 28 57 49 65 52 57 69 75 50
Staying the same 41 0 75 64 43 48 30 43 36 26 0 50
Decreasing 4 0 0 7 0 3 6 5 7 6 25 0
Base : Unwtd 649 0 8 28 109 172 175 88 28 35 4 2

February 2014
Credit Suisse Emerging Consumer Survey Databook 2014 Source: Credit Suisse Emerging Consumer Survey 2014 68
Figure 175: N10. How effective is your government at solving problems that relate to you? Very effective 13 0 9 11 13 13 16 13 16 7 12 24
Quite effective 38 57 36 33 38 44 37 36 27 21 48 24
Not very effective 25 14 32 39 32 24 22 24 15 11 12 29
Not at all effective 22 29 21 16 17 18 24 25 36 61 24 19
Base : Unwtd 2,596 7 47 201 505 763 606 218 86 117 25 21
Figure 176: N11. Do you think that more economic growth will lead to a changed political system? Yes 84 43 79 89 85 87 84 81 71 73 76 77
No 16 57 21 11 15 13 16 18 29 26 24 24
Base : Unwtd 2,596 7 47 201 505 763 606 218 86 117 25 21
Figure 177: N12. What do you feel is the biggest risk to your country? Political risk 42 27 45 53 43 45 39 33 50 32 38 50
Military risk 9 0 3 11 8 9 10 11 6 10 18 8
Social risk 12 27 21 7 10 14 14 16 14 10 3 4
Economic risk 30 36 31 26 30 26 32 36 26 32 32 38
Domestic instability risk 7 9 1 2 8 7 5 4 5 16 9 0
Base : Unwtd 2596 7 47 201 505 763 606 218 86 117 25 21
Figure 178: N13. Do you feel that buying domestic brands supports your nation? Yes 84 43 79 89 85 87 84 81 71 73 76 77
No 16 57 21 11 15 13 16 18 29 26 24 24
Base : Unwtd 2,596 7 47 201 505 763 606 218 86 117 25 21
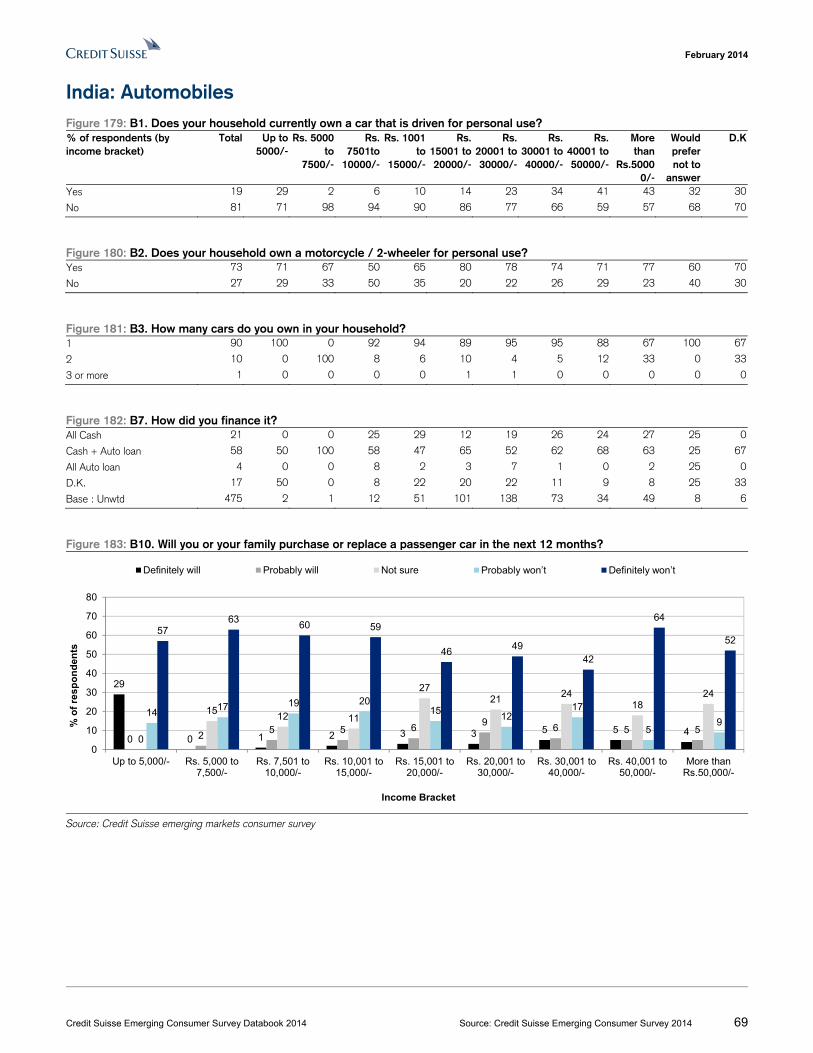
February 2014
Credit Suisse Emerging Consumer Survey Databook 2014 Source: Credit Suisse Emerging Consumer Survey 2014 69
India: Automobiles Figure 179: B1. Does your household currently own a car that is driven for personal use? % of respondents (by income bracket)
Total Up to 5000/-
Rs. 5000 to
7500/-
Rs. 7501to
10000/-
Rs. 1001 to
15000/-
Rs. 15001 to 20000/-
Rs. 20001 to 30000/-
Rs. 30001 to 40000/-
Rs. 40001 to 50000/-
More than
Rs.50000/-
Would prefer not to
answer
D.K
Yes 19 29 2 6 10 14 23 34 41 43 32 30
No 81 71 98 94 90 86 77 66 59 57 68 70
Figure 180: B2. Does your household own a motorcycle / 2-wheeler for personal use? Yes 73 71 67 50 65 80 78 74 71 77 60 70
No 27 29 33 50 35 20 22 26 29 23 40 30
Figure 181: B3. How many cars do you own in your household? 1 90 100 0 92 94 89 95 95 88 67 100 67
2 10 0 100 8 6 10 4 5 12 33 0 33
3 or more 1 0 0 0 0 1 1 0 0 0 0 0
Figure 182: B7. How did you finance it? All Cash 21 0 0 25 29 12 19 26 24 27 25 0
Cash + Auto loan 58 50 100 58 47 65 52 62 68 63 25 67
All Auto loan 4 0 0 8 2 3 7 1 0 2 25 0
D.K. 17 50 0 8 22 20 22 11 9 8 25 33
Base : Unwtd 475 2 1 12 51 101 138 73 34 49 8 6
Figure 183: B10. Will you or your family purchase or replace a passenger car in the next 12 months?
Source: Credit Suisse emerging markets consumer survey
29
0 1 2 3 3 5 5 40 2
5 5 69
6 5 50
1512 11
2721
2418
24
1417 19 20
1512
17
59
5763
60 59
4649
42
64
52
0
10
20
30
40
50
60
70
80
Up to 5,000/- Rs. 5,000 to7,500/-
Rs. 7,501 to10,000/-
Rs. 10,001 to15,000/-
Rs. 15,001 to20,000/-
Rs. 20,001 to30,000/-
Rs. 30,001 to40,000/-
Rs. 40,001 to50,000/-
More thanRs.50,000/-
% o
f re
spo
nd
ents
Income Bracket
Definitely will Probably will Not sure Probably won’t Definitely won’t
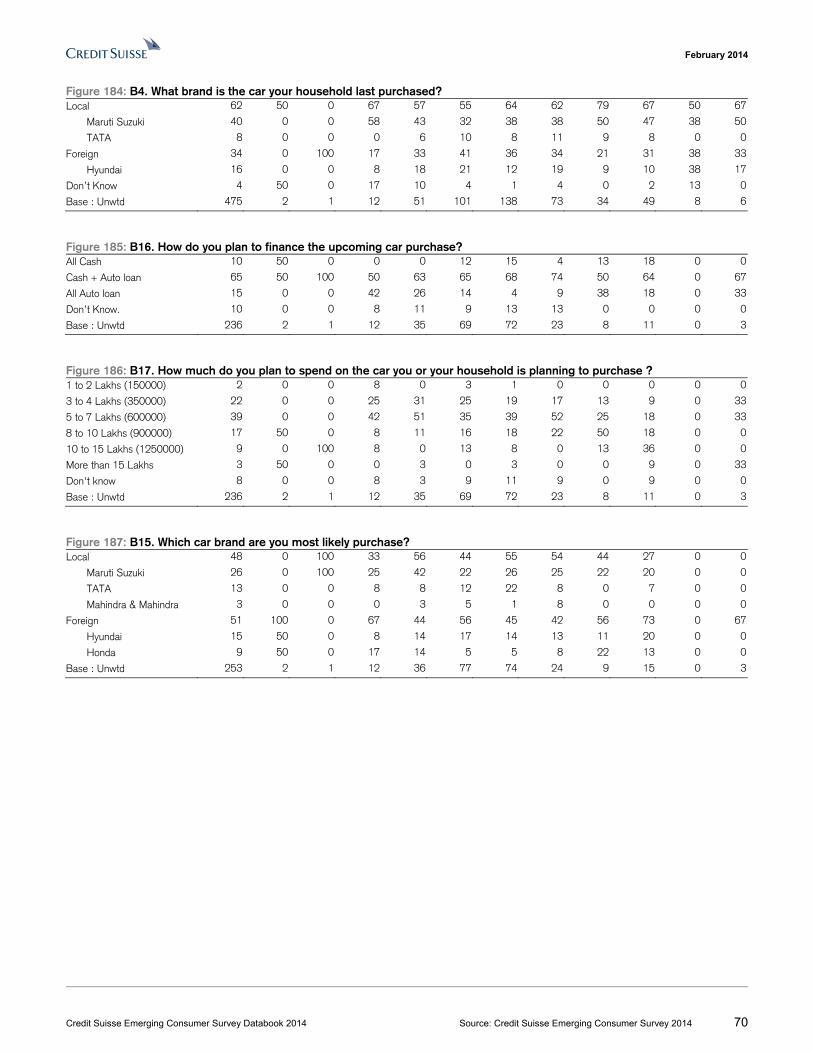
February 2014
Credit Suisse Emerging Consumer Survey Databook 2014 Source: Credit Suisse Emerging Consumer Survey 2014 70
Figure 184: B4. What brand is the car your household last purchased? Local 62 50 0 67 57 55 64 62 79 67 50 67
Maruti Suzuki 40 0 0 58 43 32 38 38 50 47 38 50
TATA 8 0 0 0 6 10 8 11 9 8 0 0
Foreign 34 0 100 17 33 41 36 34 21 31 38 33
Hyundai 16 0 0 8 18 21 12 19 9 10 38 17
Don’t Know 4 50 0 17 10 4 1 4 0 2 13 0
Base : Unwtd 475 2 1 12 51 101 138 73 34 49 8 6
Figure 185: B16. How do you plan to finance the upcoming car purchase? All Cash 10 50 0 0 0 12 15 4 13 18 0 0
Cash + Auto loan 65 50 100 50 63 65 68 74 50 64 0 67
All Auto loan 15 0 0 42 26 14 4 9 38 18 0 33
Don’t Know. 10 0 0 8 11 9 13 13 0 0 0 0
Base : Unwtd 236 2 1 12 35 69 72 23 8 11 0 3
Figure 186: B17. How much do you plan to spend on the car you or your household is planning to purchase ? 1 to 2 Lakhs (150000) 2 0 0 8 0 3 1 0 0 0 0 0
3 to 4 Lakhs (350000) 22 0 0 25 31 25 19 17 13 9 0 33
5 to 7 Lakhs (600000) 39 0 0 42 51 35 39 52 25 18 0 33
8 to 10 Lakhs (900000) 17 50 0 8 11 16 18 22 50 18 0 0
10 to 15 Lakhs (1250000) 9 0 100 8 0 13 8 0 13 36 0 0
More than 15 Lakhs 3 50 0 0 3 0 3 0 0 9 0 33
Don't know 8 0 0 8 3 9 11 9 0 9 0 0
Base : Unwtd 236 2 1 12 35 69 72 23 8 11 0 3
Figure 187: B15. Which car brand are you most likely purchase? Local 48 0 100 33 56 44 55 54 44 27 0 0
Maruti Suzuki 26 0 100 25 42 22 26 25 22 20 0 0
TATA 13 0 0 8 8 12 22 8 0 7 0 0
Mahindra & Mahindra 3 0 0 0 3 5 1 8 0 0 0 0
Foreign 51 100 0 67 44 56 45 42 56 73 0 67
Hyundai 15 50 0 8 14 17 14 13 11 20 0 0
Honda 9 50 0 17 14 5 5 8 22 13 0 0
Base : Unwtd 253 2 1 12 36 77 74 24 9 15 0 3
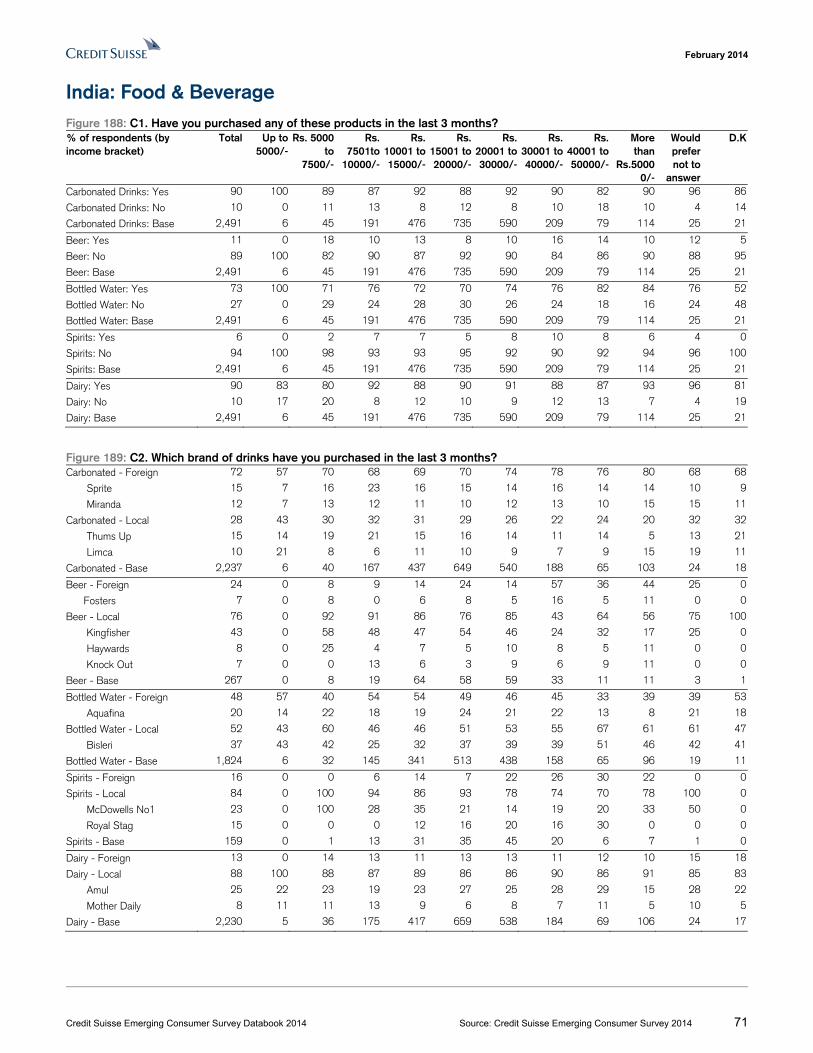
February 2014
Credit Suisse Emerging Consumer Survey Databook 2014 Source: Credit Suisse Emerging Consumer Survey 2014 71
India: Food & Beverage Figure 188: C1. Have you purchased any of these products in the last 3 months? % of respondents (by income bracket)
Total Up to 5000/-
Rs. 5000 to
7500/-
Rs. 7501to
10000/-
Rs. 10001 to 15000/-
Rs. 15001 to 20000/-
Rs. 20001 to 30000/-
Rs. 30001 to 40000/-
Rs. 40001 to 50000/-
More than
Rs.50000/-
Would prefer not to
answer
D.K
Carbonated Drinks: Yes 90 100 89 87 92 88 92 90 82 90 96 86
Carbonated Drinks: No 10 0 11 13 8 12 8 10 18 10 4 14
Carbonated Drinks: Base 2,491 6 45 191 476 735 590 209 79 114 25 21
Beer: Yes 11 0 18 10 13 8 10 16 14 10 12 5
Beer: No 89 100 82 90 87 92 90 84 86 90 88 95
Beer: Base 2,491 6 45 191 476 735 590 209 79 114 25 21
Bottled Water: Yes 73 100 71 76 72 70 74 76 82 84 76 52
Bottled Water: No 27 0 29 24 28 30 26 24 18 16 24 48
Bottled Water: Base 2,491 6 45 191 476 735 590 209 79 114 25 21
Spirits: Yes 6 0 2 7 7 5 8 10 8 6 4 0
Spirits: No 94 100 98 93 93 95 92 90 92 94 96 100
Spirits: Base 2,491 6 45 191 476 735 590 209 79 114 25 21
Dairy: Yes 90 83 80 92 88 90 91 88 87 93 96 81
Dairy: No 10 17 20 8 12 10 9 12 13 7 4 19
Dairy: Base 2,491 6 45 191 476 735 590 209 79 114 25 21
Figure 189: C2. Which brand of drinks have you purchased in the last 3 months? Carbonated - Foreign 72 57 70 68 69 70 74 78 76 80 68 68
Sprite 15 7 16 23 16 15 14 16 14 14 10 9
Miranda 12 7 13 12 11 10 12 13 10 15 15 11
Carbonated - Local 28 43 30 32 31 29 26 22 24 20 32 32
Thums Up 15 14 19 21 15 16 14 11 14 5 13 21
Limca 10 21 8 6 11 10 9 7 9 15 19 11
Carbonated - Base 2,237 6 40 167 437 649 540 188 65 103 24 18
Beer - Foreign 24 0 8 9 14 24 14 57 36 44 25 0
Fosters 7 0 8 0 6 8 5 16 5 11 0 0
Beer - Local 76 0 92 91 86 76 85 43 64 56 75 100
Kingfisher 43 0 58 48 47 54 46 24 32 17 25 0
Haywards 8 0 25 4 7 5 10 8 5 11 0 0
Knock Out 7 0 0 13 6 3 9 6 9 11 0 0
Beer - Base 267 0 8 19 64 58 59 33 11 11 3 1
Bottled Water - Foreign 48 57 40 54 54 49 46 45 33 39 39 53
Aquafina 20 14 22 18 19 24 21 22 13 8 21 18
Bottled Water - Local 52 43 60 46 46 51 53 55 67 61 61 47
Bisleri 37 43 42 25 32 37 39 39 51 46 42 41
Bottled Water - Base 1,824 6 32 145 341 513 438 158 65 96 19 11
Spirits - Foreign 16 0 0 6 14 7 22 26 30 22 0 0
Spirits - Local 84 0 100 94 86 93 78 74 70 78 100 0
McDowells No1 23 0 100 28 35 21 14 19 20 33 50 0
Royal Stag 15 0 0 0 12 16 20 16 30 0 0 0
Spirits - Base 159 0 1 13 31 35 45 20 6 7 1 0
Dairy - Foreign 13 0 14 13 11 13 13 11 12 10 15 18
Dairy - Local 88 100 88 87 89 86 86 90 86 91 85 83
Amul 25 22 23 19 23 27 25 28 29 15 28 22
Mother Daily 8 11 11 13 9 6 8 7 11 5 10 5
Dairy - Base 2,230 5 36 175 417 659 538 184 69 106 24 17
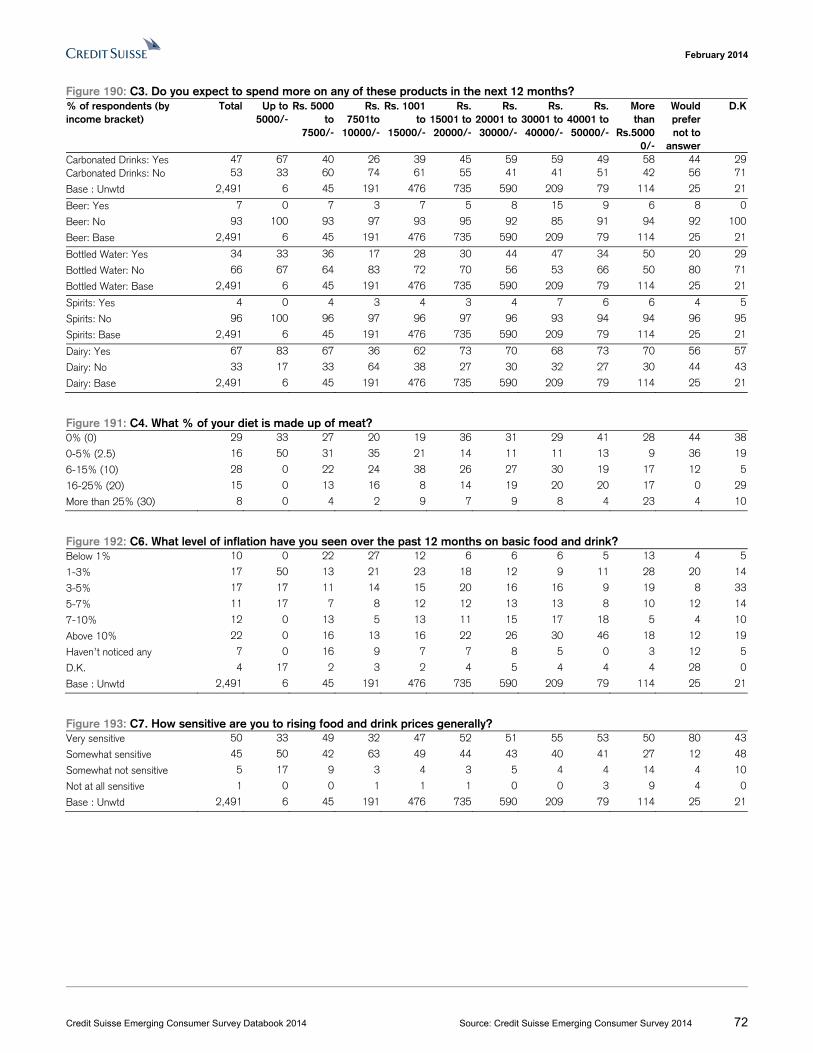
February 2014
Credit Suisse Emerging Consumer Survey Databook 2014 Source: Credit Suisse Emerging Consumer Survey 2014 72
Figure 190: C3. Do you expect to spend more on any of these products in the next 12 months? % of respondents (by income bracket)
Total Up to 5000/-
Rs. 5000 to
7500/-
Rs. 7501to
10000/-
Rs. 1001 to
15000/-
Rs. 15001 to 20000/-
Rs. 20001 to 30000/-
Rs. 30001 to 40000/-
Rs. 40001 to 50000/-
More than
Rs.50000/-
Would prefer not to
answer
D.K
Carbonated Drinks: Yes 47 67 40 26 39 45 59 59 49 58 44 29Carbonated Drinks: No 53 33 60 74 61 55 41 41 51 42 56 71
Base : Unwtd 2,491 6 45 191 476 735 590 209 79 114 25 21
Beer: Yes 7 0 7 3 7 5 8 15 9 6 8 0
Beer: No 93 100 93 97 93 95 92 85 91 94 92 100
Beer: Base 2,491 6 45 191 476 735 590 209 79 114 25 21
Bottled Water: Yes 34 33 36 17 28 30 44 47 34 50 20 29
Bottled Water: No 66 67 64 83 72 70 56 53 66 50 80 71
Bottled Water: Base 2,491 6 45 191 476 735 590 209 79 114 25 21
Spirits: Yes 4 0 4 3 4 3 4 7 6 6 4 5
Spirits: No 96 100 96 97 96 97 96 93 94 94 96 95
Spirits: Base 2,491 6 45 191 476 735 590 209 79 114 25 21
Dairy: Yes 67 83 67 36 62 73 70 68 73 70 56 57
Dairy: No 33 17 33 64 38 27 30 32 27 30 44 43
Dairy: Base 2,491 6 45 191 476 735 590 209 79 114 25 21
Figure 191: C4. What % of your diet is made up of meat? 0% (0) 29 33 27 20 19 36 31 29 41 28 44 38
0-5% (2.5) 16 50 31 35 21 14 11 11 13 9 36 19
6-15% (10) 28 0 22 24 38 26 27 30 19 17 12 5
16-25% (20) 15 0 13 16 8 14 19 20 20 17 0 29
More than 25% (30) 8 0 4 2 9 7 9 8 4 23 4 10
Figure 192: C6. What level of inflation have you seen over the past 12 months on basic food and drink? Below 1% 10 0 22 27 12 6 6 6 5 13 4 5
1-3% 17 50 13 21 23 18 12 9 11 28 20 14
3-5% 17 17 11 14 15 20 16 16 9 19 8 33
5-7% 11 17 7 8 12 12 13 13 8 10 12 14
7-10% 12 0 13 5 13 11 15 17 18 5 4 10
Above 10% 22 0 16 13 16 22 26 30 46 18 12 19
Haven’t noticed any 7 0 16 9 7 7 8 5 0 3 12 5
D.K. 4 17 2 3 2 4 5 4 4 4 28 0
Base : Unwtd 2,491 6 45 191 476 735 590 209 79 114 25 21
Figure 193: C7. How sensitive are you to rising food and drink prices generally? Very sensitive 50 33 49 32 47 52 51 55 53 50 80 43
Somewhat sensitive 45 50 42 63 49 44 43 40 41 27 12 48
Somewhat not sensitive 5 17 9 3 4 3 5 4 4 14 4 10
Not at all sensitive 1 0 0 1 1 1 0 0 3 9 4 0
Base : Unwtd 2,491 6 45 191 476 735 590 209 79 114 25 21
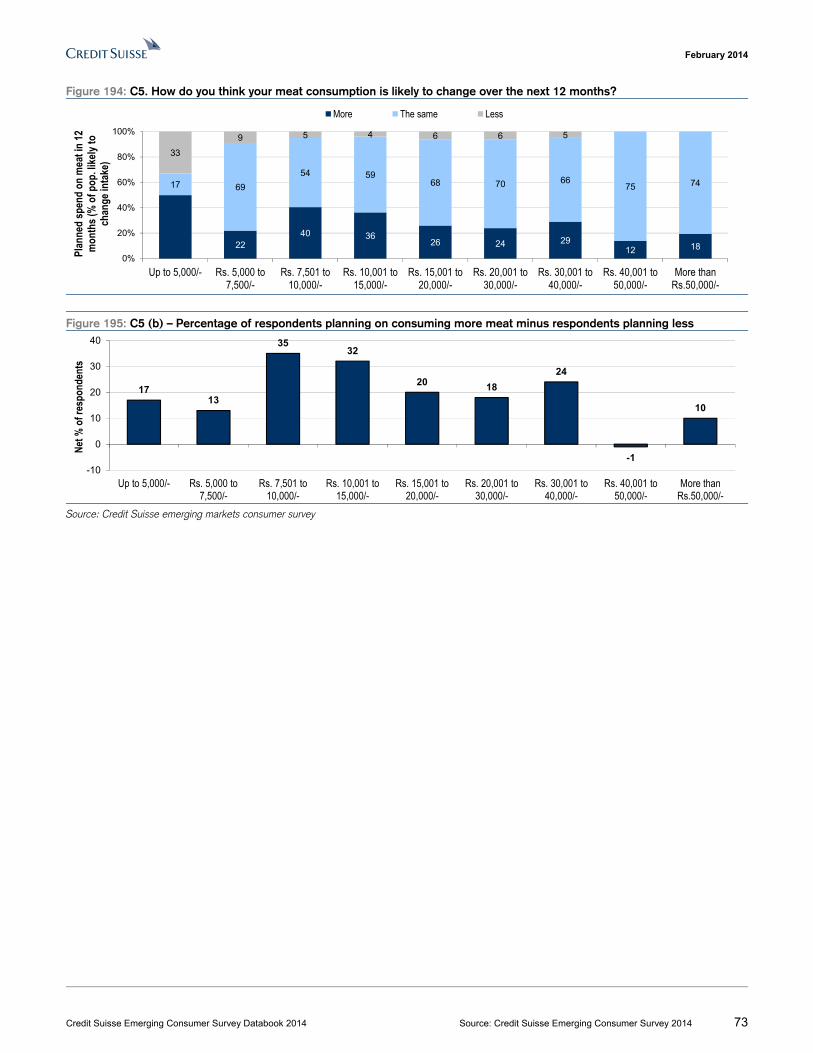
February 2014
Credit Suisse Emerging Consumer Survey Databook 2014 Source: Credit Suisse Emerging Consumer Survey 2014 73
Figure 194: C5. How do you think your meat consumption is likely to change over the next 12 months?
Figure 195: C5 (b) – Percentage of respondents planning on consuming more meat minus respondents planning less
Source: Credit Suisse emerging markets consumer survey
2240 36
26 24 2912 18
17 69
54 5968 70 66
75 74
33
9 5 4 6 6 5
0%
20%
40%
60%
80%
100%
Up to 5,000/- Rs. 5,000 to7,500/-
Rs. 7,501 to10,000/-
Rs. 10,001 to15,000/-
Rs. 15,001 to20,000/-
Rs. 20,001 to30,000/-
Rs. 30,001 to40,000/-
Rs. 40,001 to50,000/-
More thanRs.50,000/-
Plan
ned
spen
d on
mea
t in
12
mon
ths (
% o
f pop
. like
ly to
ch
ange
inta
ke)
More The same Less
1713
3532
20 18
24
-1
10
-10
0
10
20
30
40
Up to 5,000/- Rs. 5,000 to7,500/-
Rs. 7,501 to10,000/-
Rs. 10,001 to15,000/-
Rs. 15,001 to20,000/-
Rs. 20,001 to30,000/-
Rs. 30,001 to40,000/-
Rs. 40,001 to50,000/-
More thanRs.50,000/-
Net %
of r
espo
nden
ts
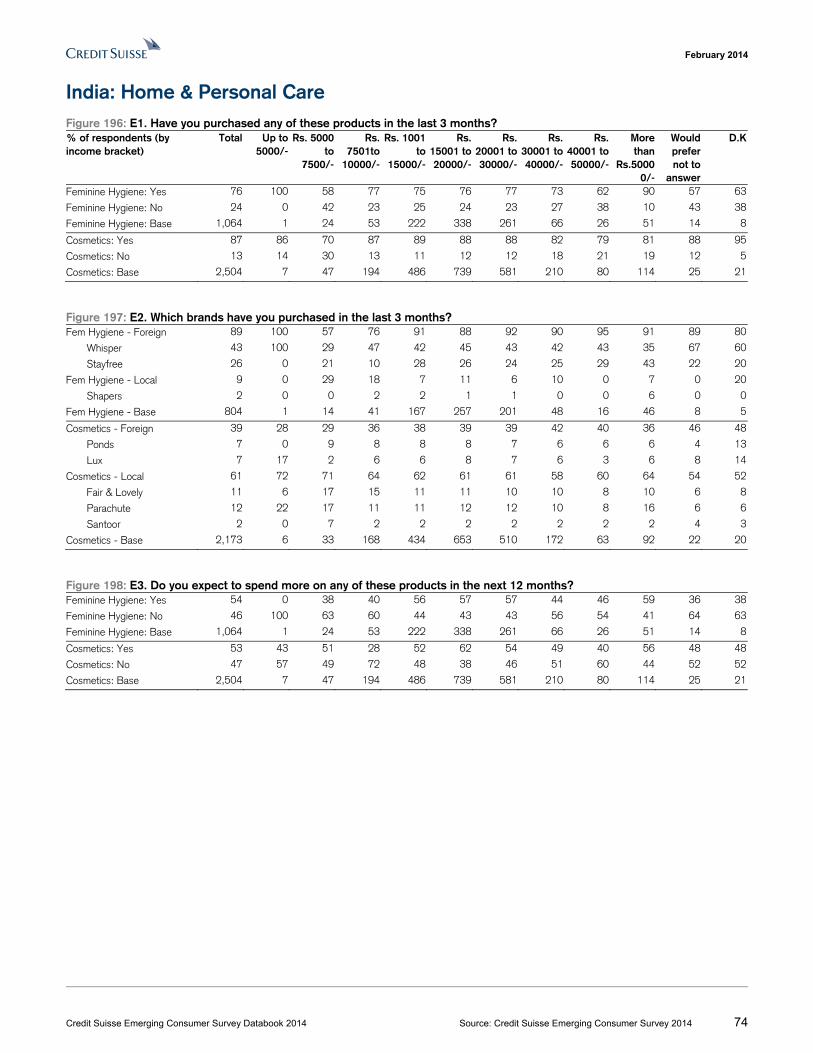
February 2014
Credit Suisse Emerging Consumer Survey Databook 2014 Source: Credit Suisse Emerging Consumer Survey 2014 74
India: Home & Personal Care Figure 196: E1. Have you purchased any of these products in the last 3 months? % of respondents (by income bracket)
Total Up to 5000/-
Rs. 5000 to
7500/-
Rs. 7501to
10000/-
Rs. 1001 to
15000/-
Rs. 15001 to 20000/-
Rs. 20001 to 30000/-
Rs. 30001 to 40000/-
Rs. 40001 to 50000/-
More than
Rs.50000/-
Would prefer not to
answer
D.K
Feminine Hygiene: Yes 76 100 58 77 75 76 77 73 62 90 57 63
Feminine Hygiene: No 24 0 42 23 25 24 23 27 38 10 43 38
Feminine Hygiene: Base 1,064 1 24 53 222 338 261 66 26 51 14 8
Cosmetics: Yes 87 86 70 87 89 88 88 82 79 81 88 95
Cosmetics: No 13 14 30 13 11 12 12 18 21 19 12 5
Cosmetics: Base 2,504 7 47 194 486 739 581 210 80 114 25 21
Figure 197: E2. Which brands have you purchased in the last 3 months? Fem Hygiene - Foreign 89 100 57 76 91 88 92 90 95 91 89 80
Whisper 43 100 29 47 42 45 43 42 43 35 67 60
Stayfree 26 0 21 10 28 26 24 25 29 43 22 20
Fem Hygiene - Local 9 0 29 18 7 11 6 10 0 7 0 20
Shapers 2 0 0 2 2 1 1 0 0 6 0 0
Fem Hygiene - Base 804 1 14 41 167 257 201 48 16 46 8 5
Cosmetics - Foreign 39 28 29 36 38 39 39 42 40 36 46 48
Ponds 7 0 9 8 8 8 7 6 6 6 4 13
Lux 7 17 2 6 6 8 7 6 3 6 8 14
Cosmetics - Local 61 72 71 64 62 61 61 58 60 64 54 52
Fair & Lovely 11 6 17 15 11 11 10 10 8 10 6 8
Parachute 12 22 17 11 11 12 12 10 8 16 6 6
Santoor 2 0 7 2 2 2 2 2 2 2 4 3
Cosmetics - Base 2,173 6 33 168 434 653 510 172 63 92 22 20
Figure 198: E3. Do you expect to spend more on any of these products in the next 12 months? Feminine Hygiene: Yes 54 0 38 40 56 57 57 44 46 59 36 38
Feminine Hygiene: No 46 100 63 60 44 43 43 56 54 41 64 63
Feminine Hygiene: Base 1,064 1 24 53 222 338 261 66 26 51 14 8
Cosmetics: Yes 53 43 51 28 52 62 54 49 40 56 48 48
Cosmetics: No 47 57 49 72 48 38 46 51 60 44 52 52
Cosmetics: Base 2,504 7 47 194 486 739 581 210 80 114 25 21
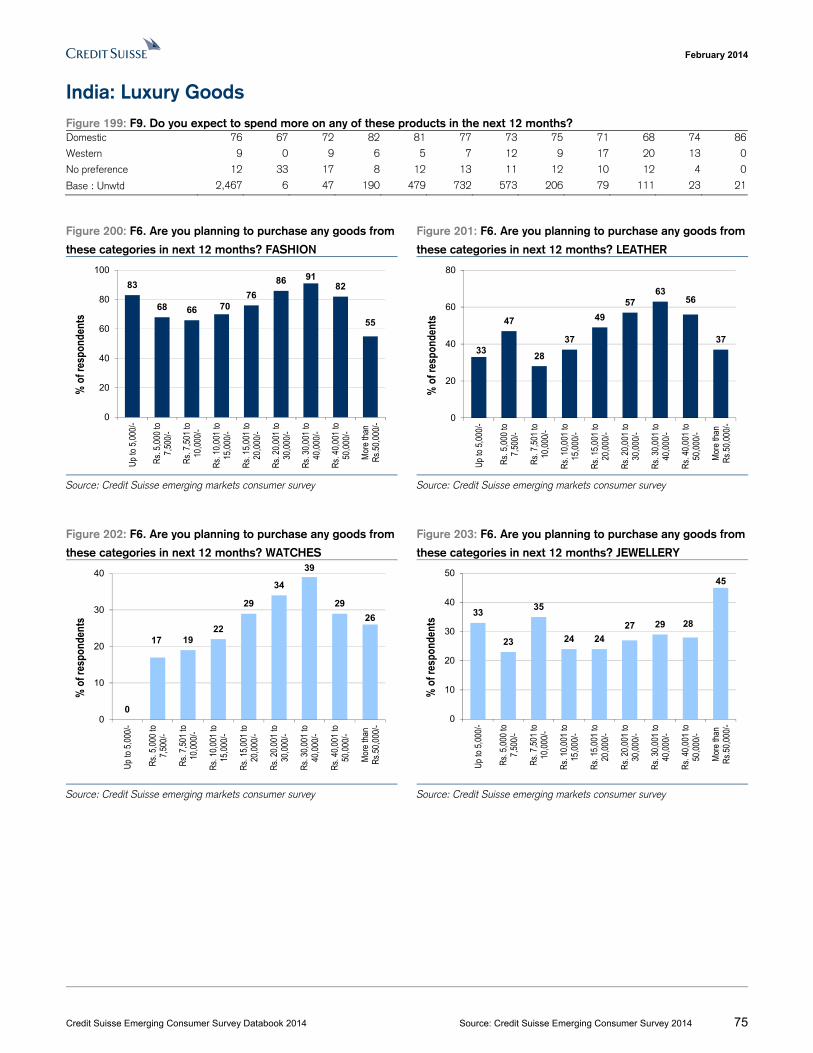
February 2014
Credit Suisse Emerging Consumer Survey Databook 2014 Source: Credit Suisse Emerging Consumer Survey 2014 75
India: Luxury Goods Figure 199: F9. Do you expect to spend more on any of these products in the next 12 months? Domestic 76 67 72 82 81 77 73 75 71 68 74 86
Western 9 0 9 6 5 7 12 9 17 20 13 0
No preference 12 33 17 8 12 13 11 12 10 12 4 0
Base : Unwtd 2,467 6 47 190 479 732 573 206 79 111 23 21
Figure 200: F6. Are you planning to purchase any goods from
these categories in next 12 months? FASHION
Figure 201: F6. Are you planning to purchase any goods from
these categories in next 12 months? LEATHER
Source: Credit Suisse emerging markets consumer survey Source: Credit Suisse emerging markets consumer survey
Figure 202: F6. Are you planning to purchase any goods from
these categories in next 12 months? WATCHES
Figure 203: F6. Are you planning to purchase any goods from
these categories in next 12 months? JEWELLERY
Source: Credit Suisse emerging markets consumer survey Source: Credit Suisse emerging markets consumer survey
83
68 66 7076
86 9182
55
0
20
40
60
80
100
Up
to 5
,000
/-
Rs.
5,0
00 to
7,50
0/-
Rs.
7,5
01 to
10,0
00/-
Rs.
10,
001
to15
,000
/-
Rs.
15,
001
to20
,000
/-
Rs.
20,
001
to30
,000
/-
Rs.
30,
001
to40
,000
/-
Rs.
40,
001
to50
,000
/-
Mor
e th
anR
s.50
,000
/-
% o
f res
pond
ents
33
47
28
37
49
5763
56
37
0
20
40
60
80
Up
to 5
,000
/-
Rs.
5,0
00 to
7,50
0/-
Rs.
7,5
01 to
10,0
00/-
Rs.
10,
001
to15
,000
/-
Rs.
15,
001
to20
,000
/-
Rs.
20,
001
to30
,000
/-
Rs.
30,
001
to40
,000
/-
Rs.
40,
001
to50
,000
/-
Mor
e th
anR
s.50
,000
/-
% o
f res
pond
ents
0
17 1922
29
34
39
29
26
0
10
20
30
40
Up
to 5
,000
/-
Rs.
5,0
00 to
7,50
0/-
Rs.
7,5
01 to
10,0
00/-
Rs.
10,
001
to15
,000
/-
Rs.
15,
001
to20
,000
/-
Rs.
20,
001
to30
,000
/-
Rs.
30,
001
to40
,000
/-
Rs.
40,
001
to50
,000
/-
Mor
e th
anR
s.50
,000
/-
% o
f res
pond
ents
33
23
35
24 24
27 29 28
45
0
10
20
30
40
50
Up
to 5
,000
/-
Rs.
5,0
00 to
7,50
0/-
Rs.
7,5
01 to
10,0
00/-
Rs.
10,
001
to15
,000
/-
Rs.
15,
001
to20
,000
/-
Rs.
20,
001
to30
,000
/-
Rs.
30,
001
to40
,000
/-
Rs.
40,
001
to50
,000
/-
Mor
e th
anR
s.50
,000
/-
% o
f res
pond
ents
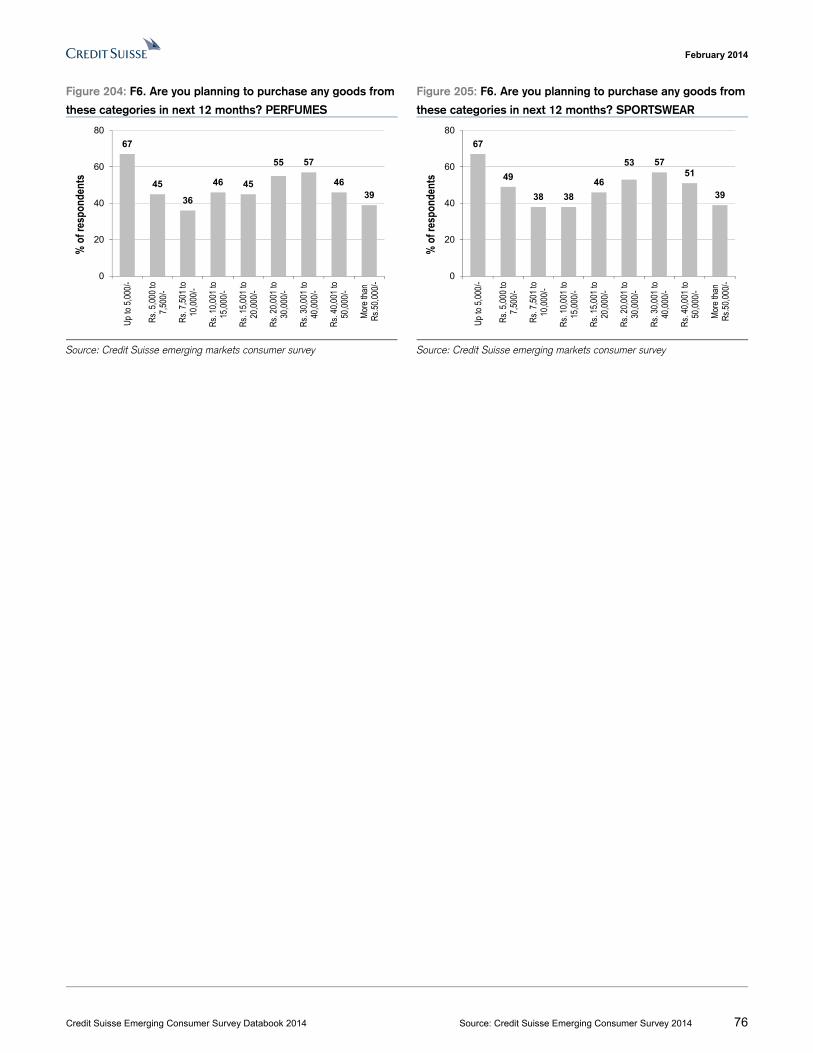
February 2014
Credit Suisse Emerging Consumer Survey Databook 2014 Source: Credit Suisse Emerging Consumer Survey 2014 76
Figure 204: F6. Are you planning to purchase any goods from
these categories in next 12 months? PERFUMES
Figure 205: F6. Are you planning to purchase any goods from
these categories in next 12 months? SPORTSWEAR
Source: Credit Suisse emerging markets consumer survey Source: Credit Suisse emerging markets consumer survey
67
45
36
46 45
55 57
4639
0
20
40
60
80U
p to
5,0
00/-
Rs.
5,0
00 to
7,50
0/-
Rs.
7,5
01 to
10,0
00/-
Rs.
10,
001
to15
,000
/-
Rs.
15,
001
to20
,000
/-
Rs.
20,
001
to30
,000
/-
Rs.
30,
001
to40
,000
/-
Rs.
40,
001
to50
,000
/-
Mor
e th
anR
s.50
,000
/-
% o
f res
pond
ents
67
49
38 38
46
53 5751
39
0
20
40
60
80
Up
to 5
,000
/-
Rs.
5,0
00 to
7,50
0/-
Rs.
7,5
01 to
10,0
00/-
Rs.
10,
001
to15
,000
/-
Rs.
15,
001
to20
,000
/-
Rs.
20,
001
to30
,000
/-
Rs.
30,
001
to40
,000
/-
Rs.
40,
001
to50
,000
/-
Mor
e th
anR
s.50
,000
/-
% o
f res
pond
ents
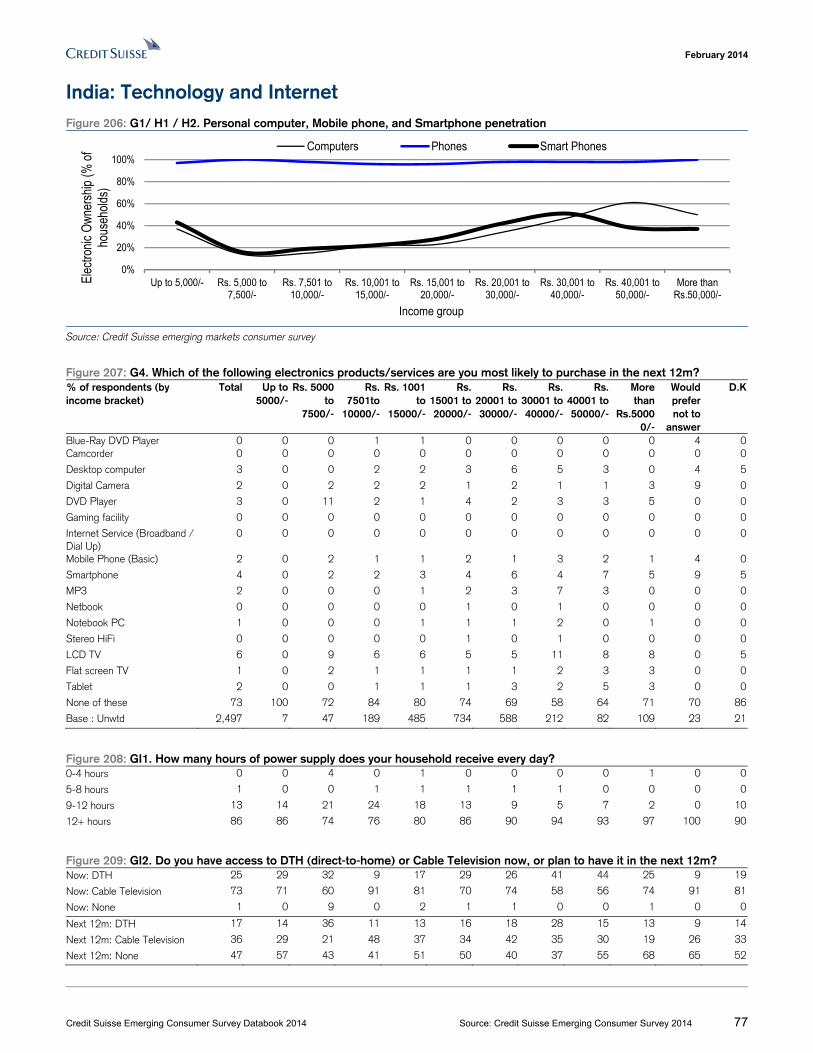
February 2014
Credit Suisse Emerging Consumer Survey Databook 2014 Source: Credit Suisse Emerging Consumer Survey 2014 77
India: Technology and Internet Figure 206: G1/ H1 / H2. Personal computer, Mobile phone, and Smartphone penetration
Source: Credit Suisse emerging markets consumer survey
Figure 207: G4. Which of the following electronics products/services are you most likely to purchase in the next 12m? % of respondents (by income bracket)
Total Up to 5000/-
Rs. 5000 to
7500/-
Rs. 7501to
10000/-
Rs. 1001 to
15000/-
Rs. 15001 to 20000/-
Rs. 20001 to 30000/-
Rs. 30001 to 40000/-
Rs. 40001 to 50000/-
More than
Rs.50000/-
Would prefer not to
answer
D.K
Blue-Ray DVD Player 0 0 0 1 1 0 0 0 0 0 4 0Camcorder 0 0 0 0 0 0 0 0 0 0 0 0
Desktop computer 3 0 0 2 2 3 6 5 3 0 4 5
Digital Camera 2 0 2 2 2 1 2 1 1 3 9 0
DVD Player 3 0 11 2 1 4 2 3 3 5 0 0
Gaming facility 0 0 0 0 0 0 0 0 0 0 0 0
Internet Service (Broadband / Dial Up)
0 0 0 0 0 0 0 0 0 0 0 0
Mobile Phone (Basic) 2 0 2 1 1 2 1 3 2 1 4 0
Smartphone 4 0 2 2 3 4 6 4 7 5 9 5
MP3 2 0 0 0 1 2 3 7 3 0 0 0
Netbook 0 0 0 0 0 1 0 1 0 0 0 0
Notebook PC 1 0 0 0 1 1 1 2 0 1 0 0
Stereo HiFi 0 0 0 0 0 1 0 1 0 0 0 0
LCD TV 6 0 9 6 6 5 5 11 8 8 0 5
Flat screen TV 1 0 2 1 1 1 1 2 3 3 0 0
Tablet 2 0 0 1 1 1 3 2 5 3 0 0
None of these 73 100 72 84 80 74 69 58 64 71 70 86
Base : Unwtd 2,497 7 47 189 485 734 588 212 82 109 23 21
Figure 208: GI1. How many hours of power supply does your household receive every day? 0-4 hours 0 0 4 0 1 0 0 0 0 1 0 0
5-8 hours 1 0 0 1 1 1 1 1 0 0 0 0
9-12 hours 13 14 21 24 18 13 9 5 7 2 0 10
12+ hours 86 86 74 76 80 86 90 94 93 97 100 90
Figure 209: GI2. Do you have access to DTH (direct-to-home) or Cable Television now, or plan to have it in the next 12m? Now: DTH 25 29 32 9 17 29 26 41 44 25 9 19
Now: Cable Television 73 71 60 91 81 70 74 58 56 74 91 81
Now: None 1 0 9 0 2 1 1 0 0 1 0 0
Next 12m: DTH 17 14 36 11 13 16 18 28 15 13 9 14
Next 12m: Cable Television 36 29 21 48 37 34 42 35 30 19 26 33
Next 12m: None 47 57 43 41 51 50 40 37 55 68 65 52
0%
20%
40%
60%
80%
100%
Up to 5,000/- Rs. 5,000 to7,500/-
Rs. 7,501 to10,000/-
Rs. 10,001 to15,000/-
Rs. 15,001 to20,000/-
Rs. 20,001 to30,000/-
Rs. 30,001 to40,000/-
Rs. 40,001 to50,000/-
More thanRs.50,000/-
Elec
troni
c O
wner
ship
(% o
f ho
useh
olds
)
Computers Phones Smart Phones
Income group
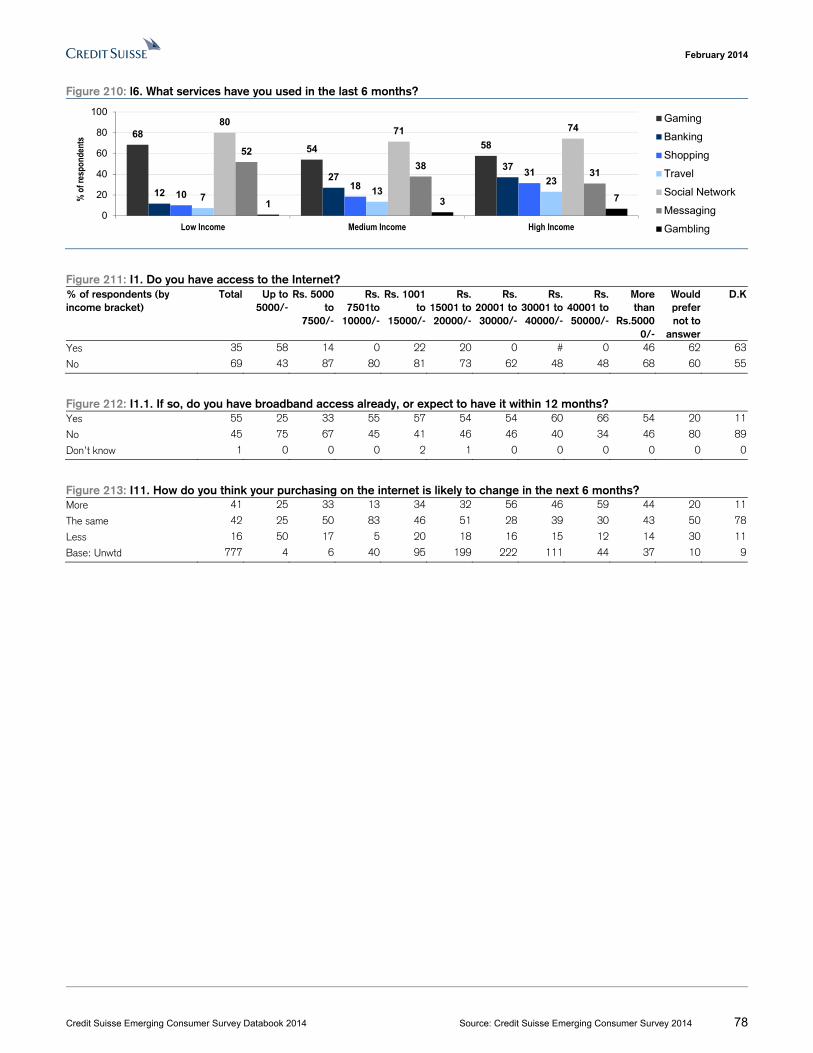
February 2014
Credit Suisse Emerging Consumer Survey Databook 2014 Source: Credit Suisse Emerging Consumer Survey 2014 78
Figure 210: l6. What services have you used in the last 6 months?
Figure 211: I1. Do you have access to the Internet? % of respondents (by income bracket)
Total Up to 5000/-
Rs. 5000 to
7500/-
Rs. 7501to
10000/-
Rs. 1001 to
15000/-
Rs. 15001 to 20000/-
Rs. 20001 to 30000/-
Rs. 30001 to 40000/-
Rs. 40001 to 50000/-
More than
Rs.50000/-
Would prefer not to
answer
D.K
Yes 35 58 14 0 22 20 0 # 0 46 62 63
No 69 43 87 80 81 73 62 48 48 68 60 55
Figure 212: I1.1. If so, do you have broadband access already, or expect to have it within 12 months? Yes 55 25 33 55 57 54 54 60 66 54 20 11
No 45 75 67 45 41 46 46 40 34 46 80 89
Don’t know 1 0 0 0 2 1 0 0 0 0 0 0
Figure 213: I11. How do you think your purchasing on the internet is likely to change in the next 6 months? More 41 25 33 13 34 32 56 46 59 44 20 11
The same 42 25 50 83 46 51 28 39 30 43 50 78
Less 16 50 17 5 20 18 16 15 12 14 30 11
Base: Unwtd 777 4 6 40 95 199 222 111 44 37 10 9
68
54 58
12
2737
1018
31
713
23
8071 74
52
3831
1 3 7
0
20
40
60
80
100
Low Income Medium Income High Income
% o
f res
pond
ents
Gaming
Banking
Shopping
Travel
Social Network
Messaging
Gambling
February 2014
Credit Suisse Emerging Consumer Survey Databook 2014 Source: Credit Suisse Emerging Consumer Survey 2014 79
India: Telecommunications Figure 214: H1. Do you currently own and use a handset for personal use? % of respondents (by income bracket)
Total Up to 5000/-
Rs. 5000 to
7500/-
Rs. 7501to
10000/-
Rs. 1001 to
15000/-
Rs. 15001 to 20000/-
Rs. 20001 to 30000/-
Rs. 30001 to 40000/-
Rs. 40001 to 50000/-
More than
Rs.50000/-
Would prefer not to
answer
D.K
Yes, I own and pay for it 83 86 84 84 81 80 87 89 95 83 71 80Yes, my employer pays 10 0 4 7 12 13 7 5 4 10 13 20Yes, somebody else pays 4 14 9 6 4 5 4 3 1 4 4 0No, I do not own one 3 0 2 4 4 2 2 2 0 3 13 0Base : Unwtd 2,519 7 45 196 500 744 583 204 84 112 24 20
Figure 215: H3. What brand is your current mobile handset? Foreign 87 97 87 89 83 86 89 94 86 88 84 86
Nokia 55 72 61 60 57 54 53 59 38 51 59 53
Samsung 23 25 20 19 21 23 24 24 32 27 17 27
Local 10 0 9 8 14 10 8 4 13 8 13 7
Base 2395 36 51 190 491 677 498 195 72 91 64 30
Figure 216: H11. Do you plan to upgrade to a Smartphone in the next 12 months? Yes 27 0 33 13 19 24 33 50 29 50 12 0
No 73 100 67 87 81 76 67 50 71 50 88 100
Figure 217: H12. Which brand of Smartphone handset will you buy? Foreign 87 86 79 92 88 88 87 93 88 97 97 85
Nokia 47 29 39 55 50 48 42 48 48 46 48 50
Samsung 31 29 36 24 30 30 36 36 30 39 29 20
Local 8 0 15 9 8 7 12 9 11 4 5 15
Base 2,454 7 44 189 482 728 571 199 84 109 21 20
Figure 218: H13. Is your next handset likely to be a 3G handset? Yes 42 100 0 19 27 35 56 71 59 21 22 75
No 49 0 75 57 56 59 39 23 27 73 67 25
Don’t Know 9 0 25 24 17 7 5 6 14 6 11 0
Base 594 1 4 37 88 150 165 66 22 48 9 4
Figure 219: H8. How much do you spend, on average, on mobile telephone bills per month?
Source: Credit Suisse emerging markets consumer survey
4357
4732 25 20 21 21
4327
30
34 4039
21 19 41
714
21 2023
24 2923
8
9 11 7
3 1024 20 21
0%
20%
40%
60%
80%
100%
Up to 5,000/- Rs. 5,000 to7,500/-
Rs. 7,501 to10,000/-
Rs. 10,001 to15,000/-
Rs. 15,001 to20,000/-
Rs. 20,001 to30,000/-
Rs. 30,001 to40,000/-
Rs. 40,001 to50,000/-
More thanRs.50,000/-
% o
f res
pond
ents
Up to Rs. 200/- Rs. 201 to 300/- Rs. 301 to 500/- Rs. 501 to 750/- More than Rs. 751/-
February 2014
Credit Suisse Emerging Consumer Survey Databook 2014 Source: Credit Suisse Emerging Consumer Survey 2014 80
India: Travel Figure 220: J1/J6. Have you been / Are you planning to go on holiday in the last / next 12 months?
Source: Credit Suisse emerging markets consumer survey
Figure 221: J2. Where did you go on your last holiday? % of respondents (by income bracket)
Total Up to 5000/-
Rs. 5000 to
7500/-
Rs. 7501to
10000/-
Rs. 1001 to
15000/-
Rs. 15001 to 20000/-
Rs. 20001 to 30000/-
Rs. 30001 to 40000/-
Rs. 40001 to 50000/-
More than
Rs.50000/-
Would prefer not to
answer
D.K
At home 25 0 73 48 36 25 24 19 11 5 14 25Elsewhere in the country 73 100 27 50 63 75 74 78 83 95 86 75
International Destination 1 0 0 3 1 1 1 3 6 0 0 0
Base : Unwtd 1,075 1 11 40 170 321 298 115 36 57 14 12
Figure 222: J4. What was the main form of transport that you used to reach your holiday destination? Car 18 0 0 14 13 10 20 18 41 39 17 44
Bus 34 0 67 43 32 41 35 16 16 39 33 33
Train 44 100 33 43 53 45 42 59 31 20 50 11
Ship 1 0 0 0 1 1 0 0 0 2 0 0
Aeroplane 2 0 0 0 0 1 3 5 13 0 0 11
Other 1 0 0 0 1 1 0 1 0 0 0 0
Base : Unwtd 801 1 3 21 109 242 225 93 32 54 12 9
Figure 223: J7. Where are you planning to go for your next holiday? At home 23 0 62 43 38 18 22 16 10 9 0 40
Elsewhere in the country 75 100 38 52 62 81 76 80 79 91 100 60
International Destination. 2 0 0 5 1 1 2 4 10 0 0 0
Base : Unwtd 1,012 1 13 42 164 311 276 122 39 23 11 10
1423 21
3443
5054
4149
14
2722
3342
46
57
45
20
0
15
30
45
60
Up to 5,000/- Rs. 5,000 to7,500/-
Rs. 7,501 to10,000/-
Rs. 10,001 to15,000/-
Rs. 15,001 to20,000/-
Rs. 20,001 to30,000/-
Rs. 30,001 to40,000/-
Rs. 40,001 to50,000/-
More thanRs.50,000/-
% o
f hou
seho
lds h
olid
ayin
g
Income Bracket
Taken holiday in the last 12 months Planning to take holiday in the next 12 months
February 2014
Credit Suisse Emerging Consumer Survey Databook 2014 Source: Credit Suisse Emerging Consumer Survey 2014 81
India: Property Figure 224: K1. Do you or your family live in your own property? % of respondents (by income bracket)
Total Up to 5000/-
Rs. 5000 to
7500/-
Rs. 7501to
10000/-
Rs. 1001 to
15000/-
Rs. 15001 to 20000/-
Rs. 20001 to 30000/-
Rs. 30001 to 40000/-
Rs. 40001 to 50000/-
More than
Rs.50000/-
Would prefer not to
answer
D.K
Yes 73 86 65 73 70 72 76 78 84 68 76 65
No 27 14 35 27 30 28 24 22 16 32 24 35
Base : Unwtd 2,520 7 46 197 498 745 585 208 82 107 25 20
Figure 225: K2. If you do not own your own property, on what terms do you occupy the property? Rented 86 100 100 92 89 89 79 67 92 100 83 86
Allocated 11 0 0 6 8 9 18 33 0 0 17 14
Others 2 0 0 2 2 2 3 0 0 0 0 0
Base : Unwtd 676 1 16 53 148 210 143 45 13 34 6 7
Figure 226: K6. If you are planning to purchase a property in the next 2 years, what is the main motivation for doing so? Upgrade 20 0 14 35 19 17 18 19 47 0 0 25
First-time home buyer 21 0 29 6 17 25 18 22 20 45 50 25
Investment 35 0 29 41 43 29 35 44 27 27 0 25
Change of location 11 0 29 6 11 14 12 4 0 18 0 0
Base : Unwtd 301 0 7 17 53 83 82 27 15 11 2 4
Figure 227: K9. How, if at all, do you expect local property prices to change in the next 12 months? Increase 69 85 65 54 65 71 73 65 70 70 88 70
About the same 19 0 22 29 22 18 16 22 10 11 0 15
Decrease 4 14 2 4 5 5 3 4 6 3 0 0
Base : Unwtd 2,520 7 46 197 498 745 585 208 82 107 25 20
Figure 228: K10. How much of your total wealth is made up of property? Below 25% 23 29 24 20 21 24 25 19 11 31 20 1025% - 50% 36 14 48 51 40 37 30 35 24 31 32 4551% - 75% 15 14 7 12 15 15 17 16 12 13 8 1576% - 95% 7 0 7 3 3 8 8 11 10 6 12 0Above 95% 6 0 0 1 7 6 4 6 23 7 0 5Don't know 14 43 15 13 13 11 16 13 20 13 28 25Base : Unwtd 2,520 7 46 197 498 745 585 208 82 107 25 20
Figure 229: K5. Do you or your household intend to purchase a property in the next 2 years?
Source: Credit Suisse emerging markets consumer survey
015 9 11 11 14 13 18 10
10085 91 89 89 86 87 82 90
0%
20%
40%
60%
80%
100%
Up to 5,000/- Rs. 5,000 to7,500/-
Rs. 7,501 to10,000/-
Rs. 10,001 to15,000/-
Rs. 15,001 to20,000/-
Rs. 20,001 to30,000/-
Rs. 30,001 to40,000/-
Rs. 40,001 to50,000/-
More thanRs.50,000/-
% o
f re
sp
on
de
nts
No
Yes
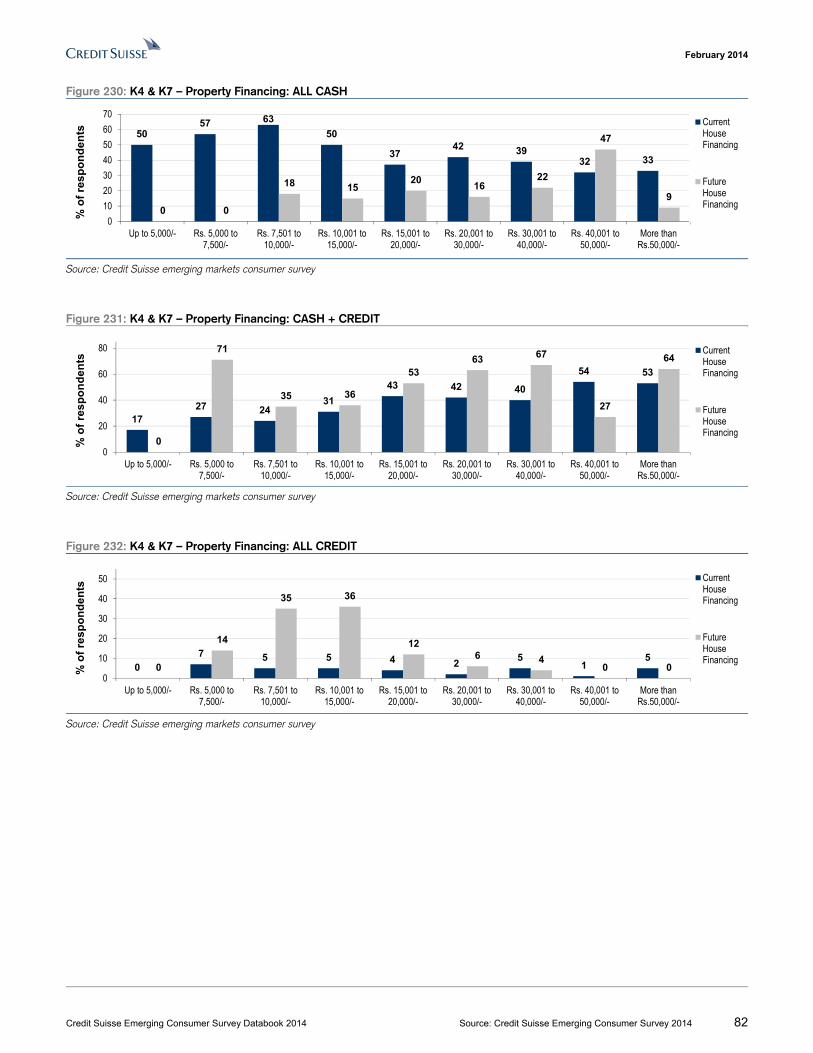
February 2014
Credit Suisse Emerging Consumer Survey Databook 2014 Source: Credit Suisse Emerging Consumer Survey 2014 82
Figure 230: K4 & K7 – Property Financing: ALL CASH
Source: Credit Suisse emerging markets consumer survey
Figure 231: K4 & K7 – Property Financing: CASH + CREDIT
Source: Credit Suisse emerging markets consumer survey
Figure 232: K4 & K7 – Property Financing: ALL CREDIT
Source: Credit Suisse emerging markets consumer survey
5057 63
50
3742 39
32 33
0 0
18 1520
1622
47
9
0
10
20
30
40
50
60
70
Up to 5,000/- Rs. 5,000 to7,500/-
Rs. 7,501 to10,000/-
Rs. 10,001 to15,000/-
Rs. 15,001 to20,000/-
Rs. 20,001 to30,000/-
Rs. 30,001 to40,000/-
Rs. 40,001 to50,000/-
More thanRs.50,000/-
% o
f re
sp
on
de
nts
CurrentHouseFinancing
FutureHouseFinancing
1727 24
31
43 42 40
54 53
0
71
35 36
5363 67
27
64
0
20
40
60
80
Up to 5,000/- Rs. 5,000 to7,500/-
Rs. 7,501 to10,000/-
Rs. 10,001 to15,000/-
Rs. 15,001 to20,000/-
Rs. 20,001 to30,000/-
Rs. 30,001 to40,000/-
Rs. 40,001 to50,000/-
More thanRs.50,000/-
% o
f re
sp
on
de
nts
CurrentHouseFinancing
FutureHouseFinancing
0
7 5 5 4 25
15
0
14
35 36
126 4
0 00
10
20
30
40
50
Up to 5,000/- Rs. 5,000 to7,500/-
Rs. 7,501 to10,000/-
Rs. 10,001 to15,000/-
Rs. 15,001 to20,000/-
Rs. 20,001 to30,000/-
Rs. 30,001 to40,000/-
Rs. 40,001 to50,000/-
More thanRs.50,000/-
% o
f re
sp
on
de
nts
CurrentHouseFinancing
FutureHouseFinancing
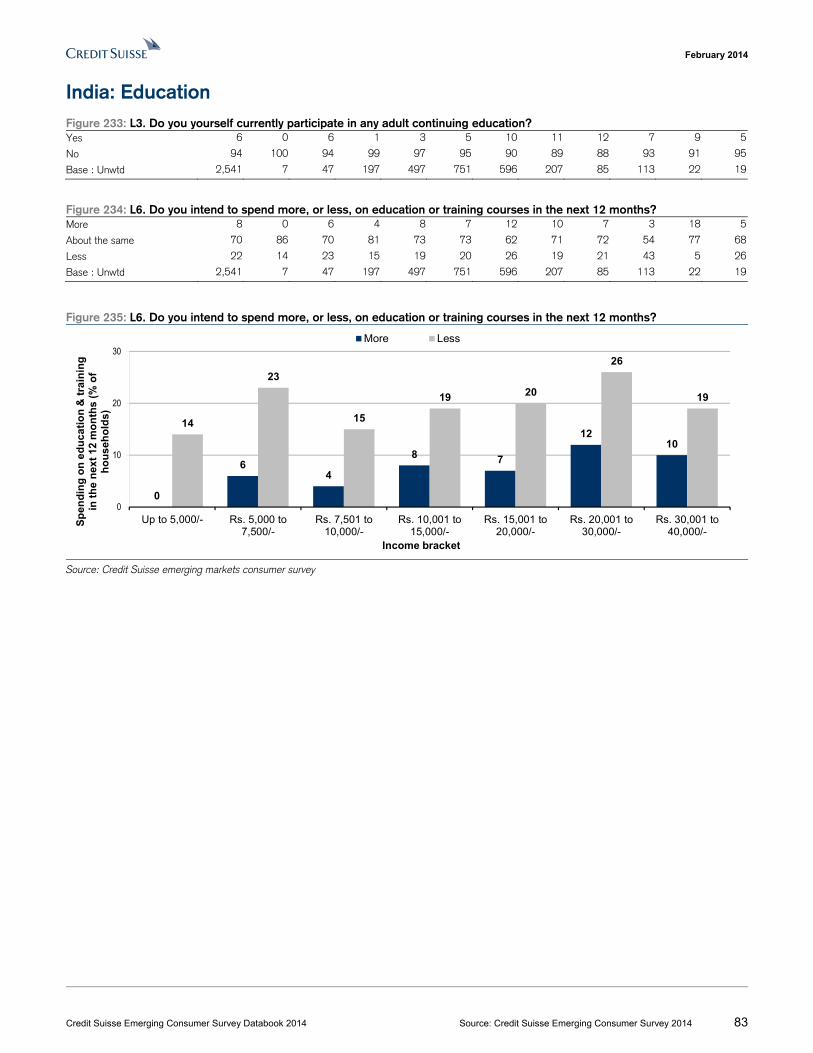
February 2014
Credit Suisse Emerging Consumer Survey Databook 2014 Source: Credit Suisse Emerging Consumer Survey 2014 83
India: Education Figure 233: L3. Do you yourself currently participate in any adult continuing education? Yes 6 0 6 1 3 5 10 11 12 7 9 5
No 94 100 94 99 97 95 90 89 88 93 91 95
Base : Unwtd 2,541 7 47 197 497 751 596 207 85 113 22 19
Figure 234: L6. Do you intend to spend more, or less, on education or training courses in the next 12 months? More 8 0 6 4 8 7 12 10 7 3 18 5
About the same 70 86 70 81 73 73 62 71 72 54 77 68
Less 22 14 23 15 19 20 26 19 21 43 5 26
Base : Unwtd 2,541 7 47 197 497 751 596 207 85 113 22 19
Figure 235: L6. Do you intend to spend more, or less, on education or training courses in the next 12 months?
Source: Credit Suisse emerging markets consumer survey
0
64
8 7
1210
14
23
15
19 20
26
19
0
10
20
30
Up to 5,000/- Rs. 5,000 to7,500/-
Rs. 7,501 to10,000/-
Rs. 10,001 to15,000/-
Rs. 15,001 to20,000/-
Rs. 20,001 to30,000/-
Rs. 30,001 to40,000/-
Sp
end
ing
on
ed
uca
tio
n &
tra
inin
g
in t
he
nex
t 12
mo
nth
s (
% o
f h
ou
seh
old
s)
Income bracket
More Less
February 2014
Credit Suisse Emerging Consumer Survey Databook 2014 Source: Credit Suisse Emerging Consumer Survey 2014 84
India: Healthcare Figure 236: M1. Does your household have access to free or partially-free health care from the State? % of respondents (by income bracket)
Total Up to 5000/-
Rs. 5000 to
7500/-
Rs. 7501to
10000/-
Rs. 1001 to
15000/-
Rs. 15001 to 20000/-
Rs. 20001 to 30000/-
Rs. 30001 to 40000/-
Rs. 40001 to 50000/-
More than
Rs.50000/-
Would prefer not to
answer
D.K
Yes 16 29 13 10 14 13 18 23 23 20 35 6No 84 71 87 90 86 87 82 77 77 80 65 94
Base : Unwtd 2,508 7 47 197 491 736 593 208 83 105 23 18
Figure 237: M2. What services, if any, could you get free from the state? Hospital 87 36 71 89 88 85 88 93 89 100 89 83
Emergency Room 29 14 21 21 34 34 28 37 31 13 20 25
Prescriptions 36 86 54 33 43 33 37 41 40 17 11 25
Vaccinations 29 14 21 30 23 22 32 37 43 83 16 8
Diagnostic tests 14 14 13 14 14 10 15 24 31 11 13 8
Base : Unwtd 1044 14 24 96 206 267 207 92 35 46 45 12
Figure 238: M8. Is anyone in your household a regular purchaser of medicines (more than one item per month)? Yes 26 0 19 13 26 26 27 25 40 17 61 28No 74 100 81 87 74 74 73 75 60 83 39 72
Base : Unwtd 2,508 7 47 197 491 736 593 208 83 105 23 18
igure 239: M12. Thinking now about everyone in your household, would you expect to be spending more or less on medicines
over the next 12 months? More 18 0 17 9 16 18 21 22 20 12 61 28
Same 61 71 45 75 65 65 55 56 58 55 30 67
Less 20 29 38 16 19 16 24 23 22 32 9 6
Base : Unwtd 2,508 7 47 197 491 736 593 208 83 105 23 18
Figure 240: M13. How much extra would you be willing to pay for an international medicine brand, rather than a locally produced product? Won’t pay extra 49 100 70 41 45 56 47 46 46 46 39 67
1-10% extra 44 0 30 56 48 39 44 40 45 46 52 33
11-20% extra 6 0 0 3 6 5 7 13 10 9 9 0
21-30% extra 1 0 0 1 0 0 1 1 0 0 0 0
more than 30% extra 0 0 0 0 0 0 1 0 0 0 0 0
Base : Unwtd 2,508 7 47 197 491 736 593 208 83 105 23 18
Figure 241: M14. Do you trust local brands as much as international brands on efficacy and safety? Only efficacy 38 43 21 57 46 37 34 32 23 29 17 22Only safety 6 14 4 4 6 6 8 5 7 10 0 6Both 53 43 66 36 44 54 56 59 69 61 78 61Neither 1 0 2 1 1 1 1 1 1 0 4 6
Base : Unwtd 2,508 7 47 197 491 736 593 208 83 105 23 18
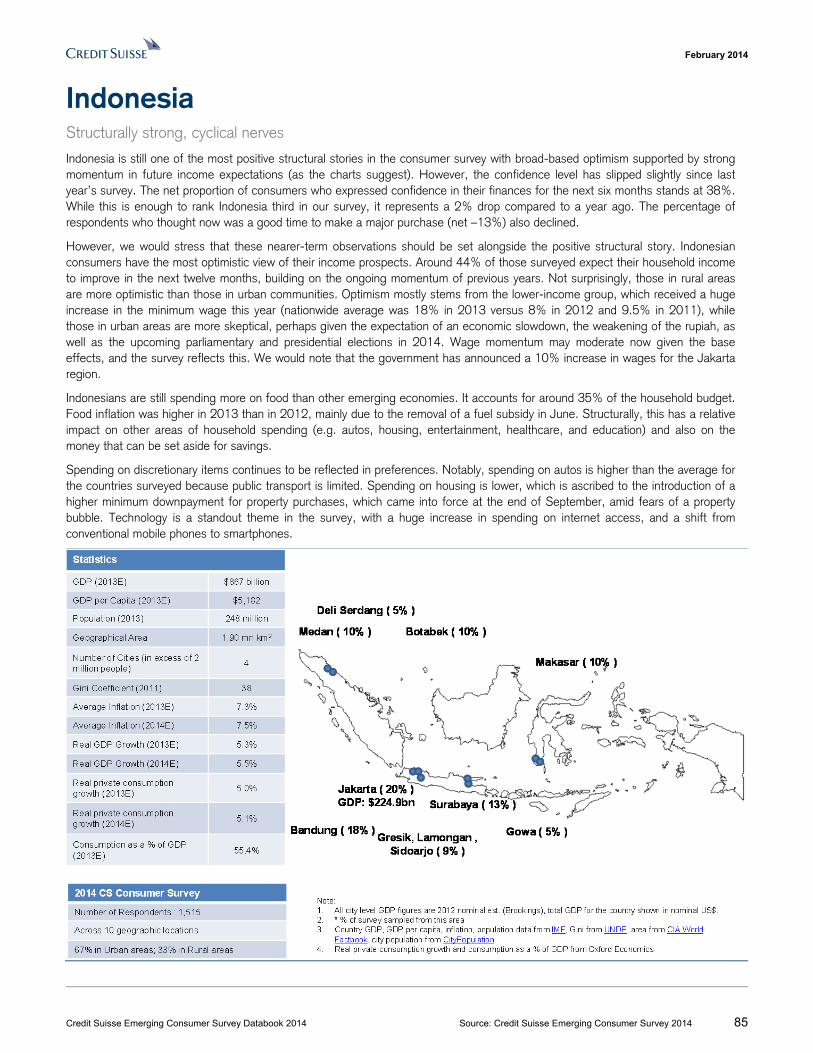
February 2014
Credit Suisse Emerging Consumer Survey Databook 2014 Source: Credit Suisse Emerging Consumer Survey 2014 85
Indonesia Structurally strong, cyclical nerves
Indonesia is still one of the most positive structural stories in the consumer survey with broad-based optimism supported by strong momentum in future income expectations (as the charts suggest). However, the confidence level has slipped slightly since last year’s survey. The net proportion of consumers who expressed confidence in their finances for the next six months stands at 38%. While this is enough to rank Indonesia third in our survey, it represents a 2% drop compared to a year ago. The percentage of respondents who thought now was a good time to make a major purchase (net –13%) also declined.
However, we would stress that these nearer-term observations should be set alongside the positive structural story. Indonesian consumers have the most optimistic view of their income prospects. Around 44% of those surveyed expect their household income to improve in the next twelve months, building on the ongoing momentum of previous years. Not surprisingly, those in rural areas are more optimistic than those in urban communities. Optimism mostly stems from the lower-income group, which received a huge increase in the minimum wage this year (nationwide average was 18% in 2013 versus 8% in 2012 and 9.5% in 2011), while those in urban areas are more skeptical, perhaps given the expectation of an economic slowdown, the weakening of the rupiah, as well as the upcoming parliamentary and presidential elections in 2014. Wage momentum may moderate now given the base effects, and the survey reflects this. We would note that the government has announced a 10% increase in wages for the Jakarta region.
Indonesians are still spending more on food than other emerging economies. It accounts for around 35% of the household budget. Food inflation was higher in 2013 than in 2012, mainly due to the removal of a fuel subsidy in June. Structurally, this has a relative impact on other areas of household spending (e.g. autos, housing, entertainment, healthcare, and education) and also on the money that can be set aside for savings.
Spending on discretionary items continues to be reflected in preferences. Notably, spending on autos is higher than the average for the countries surveyed because public transport is limited. Spending on housing is lower, which is ascribed to the introduction of a higher minimum downpayment for property purchases, which came into force at the end of September, amid fears of a property bubble. Technology is a standout theme in the survey, with a huge increase in spending on internet access, and a shift from conventional mobile phones to smartphones.
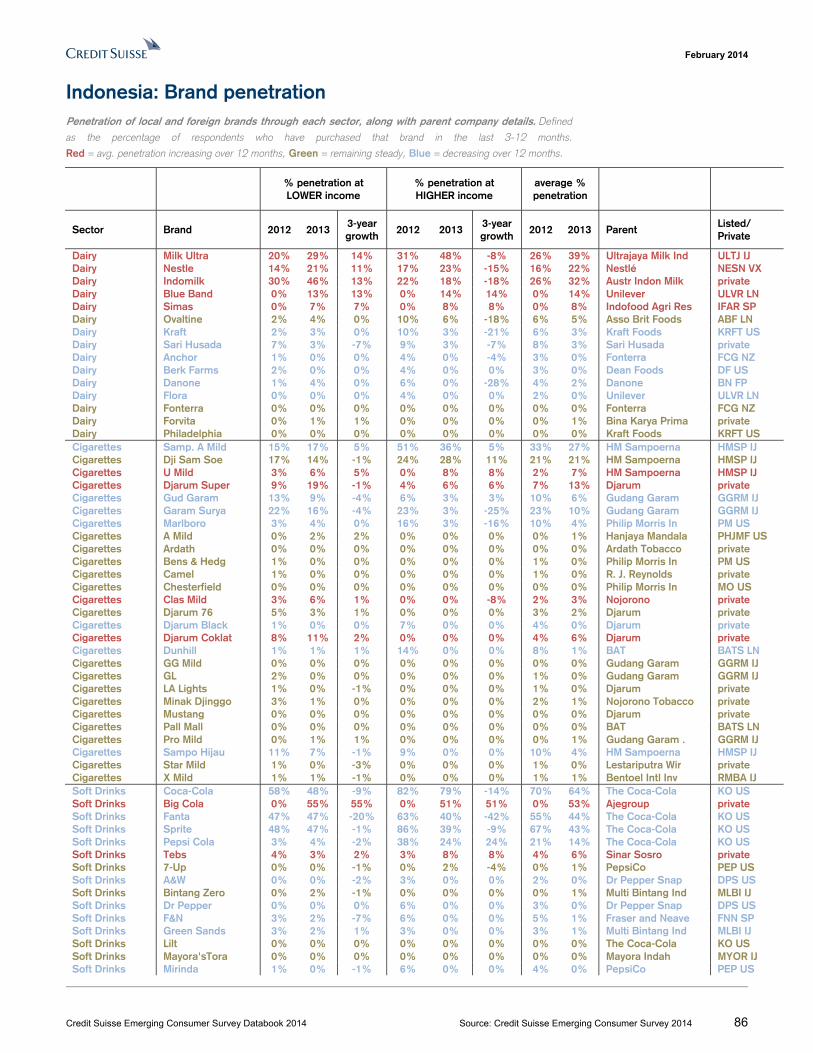
February 2014
Credit Suisse Emerging Consumer Survey Databook 2014 Source: Credit Suisse Emerging Consumer Survey 2014 86
Indonesia: Brand penetration Penetration of local and foreign brands through each sector, along with parent company details. Defined
as the percentage of respondents who have purchased that brand in the last 3-12 months.
Red = avg. penetration increasing over 12 months, Green = remaining steady, Blue = decreasing over 12 months.
% penetration at LOWER income
% penetration at HIGHER income
average % penetration
Sector Brand 2012 2013 3-year growth
2012 2013 3-year growth
2012 2013 Parent Listed/ Private
Dairy Milk Ultra 20% 29% 14% 31% 48% -8% 26% 39% Ultrajaya Milk Ind ULTJ IJ Dairy Nestle 14% 21% 11% 17% 23% -15% 16% 22% Nestlé NESN VX Dairy Indomilk 30% 46% 13% 22% 18% -18% 26% 32% Austr Indon Milk private Dairy Blue Band 0% 13% 13% 0% 14% 14% 0% 14% Unilever ULVR LN Dairy Simas 0% 7% 7% 0% 8% 8% 0% 8% Indofood Agri Res IFAR SP Dairy Ovaltine 2% 4% 0% 10% 6% -18% 6% 5% Asso Brit Foods ABF LN Dairy Kraft 2% 3% 0% 10% 3% -21% 6% 3% Kraft Foods KRFT US Dairy Sari Husada 7% 3% -7% 9% 3% -7% 8% 3% Sari Husada private Dairy Anchor 1% 0% 0% 4% 0% -4% 3% 0% Fonterra FCG NZ Dairy Berk Farms 2% 0% 0% 4% 0% 0% 3% 0% Dean Foods DF US Dairy Danone 1% 4% 0% 6% 0% -28% 4% 2% Danone BN FP Dairy Flora 0% 0% 0% 4% 0% 0% 2% 0% Unilever ULVR LN Dairy Fonterra 0% 0% 0% 0% 0% 0% 0% 0% Fonterra FCG NZ Dairy Forvita 0% 1% 1% 0% 0% 0% 0% 1% Bina Karya Prima private Dairy Philadelphia 0% 0% 0% 0% 0% 0% 0% 0% Kraft Foods KRFT US Cigarettes Samp. A Mild 15% 17% 5% 51% 36% 5% 33% 27% HM Sampoerna HMSP IJ Cigarettes Dji Sam Soe 17% 14% -1% 24% 28% 11% 21% 21% HM Sampoerna HMSP IJ Cigarettes U Mild 3% 6% 5% 0% 8% 8% 2% 7% HM Sampoerna HMSP IJ Cigarettes Djarum Super 9% 19% -1% 4% 6% 6% 7% 13% Djarum private Cigarettes Gud Garam 13% 9% -4% 6% 3% 3% 10% 6% Gudang Garam GGRM IJ Cigarettes Garam Surya 22% 16% -4% 23% 3% -25% 23% 10% Gudang Garam GGRM IJ Cigarettes Marlboro 3% 4% 0% 16% 3% -16% 10% 4% Philip Morris In PM US Cigarettes A Mild 0% 2% 2% 0% 0% 0% 0% 1% Hanjaya Mandala PHJMF US Cigarettes Ardath 0% 0% 0% 0% 0% 0% 0% 0% Ardath Tobacco private Cigarettes Bens & Hedg 1% 0% 0% 0% 0% 0% 1% 0% Philip Morris In PM US Cigarettes Camel 1% 0% 0% 0% 0% 0% 1% 0% R. J. Reynolds private Cigarettes Chesterfield 0% 0% 0% 0% 0% 0% 0% 0% Philip Morris In MO US Cigarettes Clas Mild 3% 6% 1% 0% 0% -8% 2% 3% Nojorono private Cigarettes Djarum 76 5% 3% 1% 0% 0% 0% 3% 2% Djarum private Cigarettes Djarum Black 1% 0% 0% 7% 0% 0% 4% 0% Djarum private Cigarettes Djarum Coklat 8% 11% 2% 0% 0% 0% 4% 6% Djarum private Cigarettes Dunhill 1% 1% 1% 14% 0% 0% 8% 1% BAT BATS LN Cigarettes GG Mild 0% 0% 0% 0% 0% 0% 0% 0% Gudang Garam GGRM IJ Cigarettes GL 2% 0% 0% 0% 0% 0% 1% 0% Gudang Garam GGRM IJ Cigarettes LA Lights 1% 0% -1% 0% 0% 0% 1% 0% Djarum private Cigarettes Minak Djinggo 3% 1% 0% 0% 0% 0% 2% 1% Nojorono Tobacco private Cigarettes Mustang 0% 0% 0% 0% 0% 0% 0% 0% Djarum private Cigarettes Pall Mall 0% 0% 0% 0% 0% 0% 0% 0% BAT BATS LN Cigarettes Pro Mild 0% 1% 1% 0% 0% 0% 0% 1% Gudang Garam . GGRM IJ Cigarettes Sampo Hijau 11% 7% -1% 9% 0% 0% 10% 4% HM Sampoerna HMSP IJ Cigarettes Star Mild 1% 0% -3% 0% 0% 0% 1% 0% Lestariputra Wir private Cigarettes X Mild 1% 1% -1% 0% 0% 0% 1% 1% Bentoel Intl Inv RMBA IJ Soft Drinks Coca-Cola 58% 48% -9% 82% 79% -14% 70% 64% The Coca-Cola KO US Soft Drinks Big Cola 0% 55% 55% 0% 51% 51% 0% 53% Ajegroup private Soft Drinks Fanta 47% 47% -20% 63% 40% -42% 55% 44% The Coca-Cola KO US Soft Drinks Sprite 48% 47% -1% 86% 39% -9% 67% 43% The Coca-Cola KO US Soft Drinks Pepsi Cola 3% 4% -2% 38% 24% 24% 21% 14% The Coca-Cola KO US Soft Drinks Tebs 4% 3% 2% 3% 8% 8% 4% 6% Sinar Sosro private Soft Drinks 7-Up 0% 0% -1% 0% 2% -4% 0% 1% PepsiCo PEP US Soft Drinks A&W 0% 0% -2% 3% 0% 0% 2% 0% Dr Pepper Snap DPS US Soft Drinks Bintang Zero 0% 2% -1% 0% 0% 0% 0% 1% Multi Bintang Ind MLBI IJ Soft Drinks Dr Pepper 0% 0% 0% 6% 0% 0% 3% 0% Dr Pepper Snap DPS US Soft Drinks F&N 3% 2% -7% 6% 0% 0% 5% 1% Fraser and Neave FNN SP Soft Drinks Green Sands 3% 2% 1% 3% 0% 0% 3% 1% Multi Bintang Ind MLBI IJ Soft Drinks Lilt 0% 0% 0% 0% 0% 0% 0% 0% The Coca-Cola KO US Soft Drinks Mayora'sTora 0% 0% 0% 0% 0% 0% 0% 0% Mayora Indah MYOR IJ Soft Drinks Mirinda 1% 0% -1% 6% 0% 0% 4% 0% PepsiCo PEP US
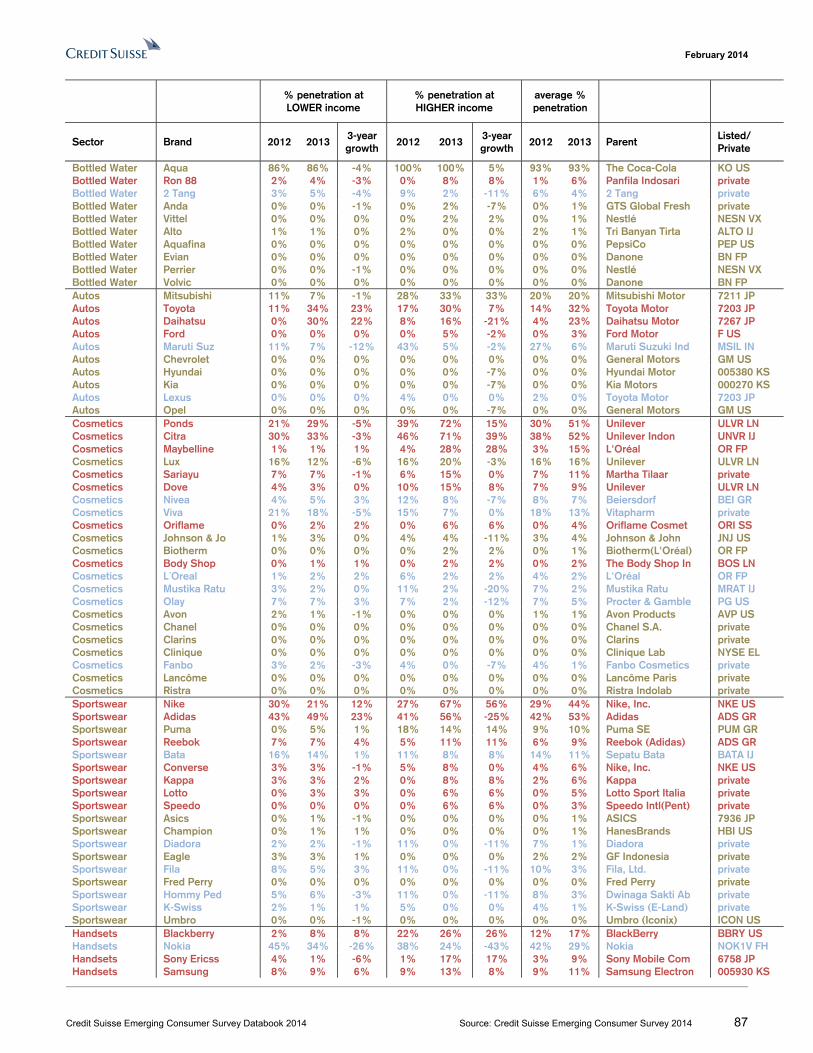
February 2014
Credit Suisse Emerging Consumer Survey Databook 2014 Source: Credit Suisse Emerging Consumer Survey 2014 87
% penetration at LOWER income
% penetration at HIGHER income
average % penetration
Sector Brand 2012 2013 3-year growth
2012 2013 3-year growth
2012 2013 Parent Listed/ Private
Bottled Water Aqua 86% 86% -4% 100% 100% 5% 93% 93% The Coca-Cola KO US Bottled Water Ron 88 2% 4% -3% 0% 8% 8% 1% 6% Panfila Indosari private Bottled Water 2 Tang 3% 5% -4% 9% 2% -11% 6% 4% 2 Tang private Bottled Water Anda 0% 0% -1% 0% 2% -7% 0% 1% GTS Global Fresh private Bottled Water Vittel 0% 0% 0% 0% 2% 2% 0% 1% Nestlé NESN VX Bottled Water Alto 1% 1% 0% 2% 0% 0% 2% 1% Tri Banyan Tirta ALTO IJ Bottled Water Aquafina 0% 0% 0% 0% 0% 0% 0% 0% PepsiCo PEP US Bottled Water Evian 0% 0% 0% 0% 0% 0% 0% 0% Danone BN FP Bottled Water Perrier 0% 0% -1% 0% 0% 0% 0% 0% Nestlé NESN VX Bottled Water Volvic 0% 0% 0% 0% 0% 0% 0% 0% Danone BN FP Autos Mitsubishi 11% 7% -1% 28% 33% 33% 20% 20% Mitsubishi Motor 7211 JP Autos Toyota 11% 34% 23% 17% 30% 7% 14% 32% Toyota Motor 7203 JP Autos Daihatsu 0% 30% 22% 8% 16% -21% 4% 23% Daihatsu Motor 7267 JP Autos Ford 0% 0% 0% 0% 5% -2% 0% 3% Ford Motor F US Autos Maruti Suz 11% 7% -12% 43% 5% -2% 27% 6% Maruti Suzuki Ind MSIL IN Autos Chevrolet 0% 0% 0% 0% 0% 0% 0% 0% General Motors GM US Autos Hyundai 0% 0% 0% 0% 0% -7% 0% 0% Hyundai Motor 005380 KS Autos Kia 0% 0% 0% 0% 0% -7% 0% 0% Kia Motors 000270 KS Autos Lexus 0% 0% 0% 4% 0% 0% 2% 0% Toyota Motor 7203 JP Autos Opel 0% 0% 0% 0% 0% -7% 0% 0% General Motors GM US Cosmetics Ponds 21% 29% -5% 39% 72% 15% 30% 51% Unilever ULVR LN Cosmetics Citra 30% 33% -3% 46% 71% 39% 38% 52% Unilever Indon UNVR IJ Cosmetics Maybelline 1% 1% 1% 4% 28% 28% 3% 15% L'Oréal OR FP Cosmetics Lux 16% 12% -6% 16% 20% -3% 16% 16% Unilever ULVR LN Cosmetics Sariayu 7% 7% -1% 6% 15% 0% 7% 11% Martha Tilaar private Cosmetics Dove 4% 3% 0% 10% 15% 8% 7% 9% Unilever ULVR LN Cosmetics Nivea 4% 5% 3% 12% 8% -7% 8% 7% Beiersdorf BEI GR Cosmetics Viva 21% 18% -5% 15% 7% 0% 18% 13% Vitapharm private Cosmetics Oriflame 0% 2% 2% 0% 6% 6% 0% 4% Oriflame Cosmet ORI SS Cosmetics Johnson & Jo 1% 3% 0% 4% 4% -11% 3% 4% Johnson & John JNJ US Cosmetics Biotherm 0% 0% 0% 0% 2% 2% 0% 1% Biotherm(L'Oréal) OR FP Cosmetics Body Shop 0% 1% 1% 0% 2% 2% 0% 2% The Body Shop In BOS LN Cosmetics L´Oreal 1% 2% 2% 6% 2% 2% 4% 2% L'Oréal OR FP Cosmetics Mustika Ratu 3% 2% 0% 11% 2% -20% 7% 2% Mustika Ratu MRAT IJ Cosmetics Olay 7% 7% 3% 7% 2% -12% 7% 5% Procter & Gamble PG US Cosmetics Avon 2% 1% -1% 0% 0% 0% 1% 1% Avon Products AVP US Cosmetics Chanel 0% 0% 0% 0% 0% 0% 0% 0% Chanel S.A. private Cosmetics Clarins 0% 0% 0% 0% 0% 0% 0% 0% Clarins private Cosmetics Clinique 0% 0% 0% 0% 0% 0% 0% 0% Clinique Lab NYSE EL Cosmetics Fanbo 3% 2% -3% 4% 0% -7% 4% 1% Fanbo Cosmetics private Cosmetics Lancôme 0% 0% 0% 0% 0% 0% 0% 0% Lancôme Paris private Cosmetics Ristra 0% 0% 0% 0% 0% 0% 0% 0% Ristra Indolab private Sportswear Nike 30% 21% 12% 27% 67% 56% 29% 44% Nike, Inc. NKE US Sportswear Adidas 43% 49% 23% 41% 56% -25% 42% 53% Adidas ADS GR Sportswear Puma 0% 5% 1% 18% 14% 14% 9% 10% Puma SE PUM GR Sportswear Reebok 7% 7% 4% 5% 11% 11% 6% 9% Reebok (Adidas) ADS GR Sportswear Bata 16% 14% 1% 11% 8% 8% 14% 11% Sepatu Bata BATA IJ Sportswear Converse 3% 3% -1% 5% 8% 0% 4% 6% Nike, Inc. NKE US Sportswear Kappa 3% 3% 2% 0% 8% 8% 2% 6% Kappa private Sportswear Lotto 0% 3% 3% 0% 6% 6% 0% 5% Lotto Sport Italia private Sportswear Speedo 0% 0% 0% 0% 6% 6% 0% 3% Speedo Intl(Pent) private Sportswear Asics 0% 1% -1% 0% 0% 0% 0% 1% ASICS 7936 JP Sportswear Champion 0% 1% 1% 0% 0% 0% 0% 1% HanesBrands HBI US Sportswear Diadora 2% 2% -1% 11% 0% -11% 7% 1% Diadora private Sportswear Eagle 3% 3% 1% 0% 0% 0% 2% 2% GF Indonesia private Sportswear Fila 8% 5% 3% 11% 0% -11% 10% 3% Fila, Ltd. private Sportswear Fred Perry 0% 0% 0% 0% 0% 0% 0% 0% Fred Perry private Sportswear Hommy Ped 5% 6% -3% 11% 0% -11% 8% 3% Dwinaga Sakti Ab private Sportswear K-Swiss 2% 1% 1% 5% 0% 0% 4% 1% K-Swiss (E-Land) private Sportswear Umbro 0% 0% -1% 0% 0% 0% 0% 0% Umbro (Iconix) ICON US Handsets Blackberry 2% 8% 8% 22% 26% 26% 12% 17% BlackBerry BBRY US Handsets Nokia 45% 34% -26% 38% 24% -43% 42% 29% Nokia NOK1V FH Handsets Sony Ericss 4% 1% -6% 1% 17% 17% 3% 9% Sony Mobile Com 6758 JP Handsets Samsung 8% 9% 6% 9% 13% 8% 9% 11% Samsung Electron 005930 KS
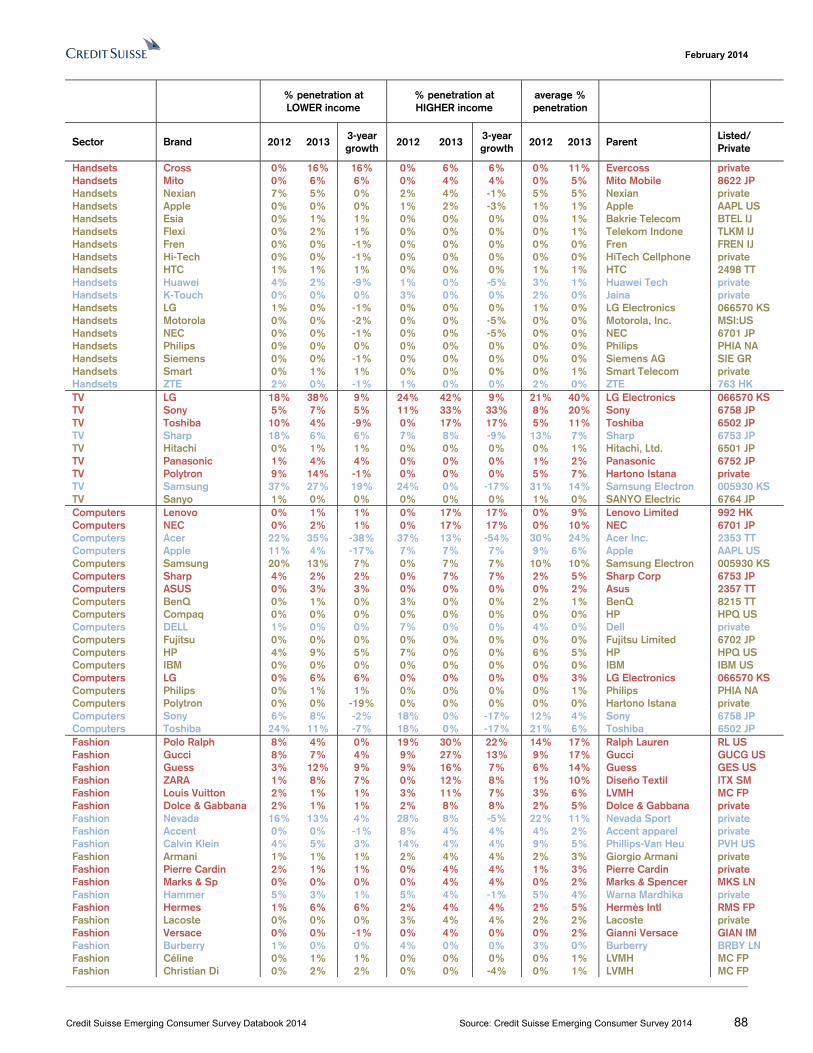
February 2014
Credit Suisse Emerging Consumer Survey Databook 2014 Source: Credit Suisse Emerging Consumer Survey 2014 88
% penetration at LOWER income
% penetration at HIGHER income
average % penetration
Sector Brand 2012 2013 3-year growth
2012 2013 3-year growth
2012 2013 Parent Listed/ Private
Handsets Cross 0% 16% 16% 0% 6% 6% 0% 11% Evercoss private Handsets Mito 0% 6% 6% 0% 4% 4% 0% 5% Mito Mobile 8622 JP Handsets Nexian 7% 5% 0% 2% 4% -1% 5% 5% Nexian private Handsets Apple 0% 0% 0% 1% 2% -3% 1% 1% Apple AAPL US Handsets Esia 0% 1% 1% 0% 0% 0% 0% 1% Bakrie Telecom BTEL IJ Handsets Flexi 0% 2% 1% 0% 0% 0% 0% 1% Telekom Indone TLKM IJ Handsets Fren 0% 0% -1% 0% 0% 0% 0% 0% Fren FREN IJ Handsets Hi-Tech 0% 0% -1% 0% 0% 0% 0% 0% HiTech Cellphone private Handsets HTC 1% 1% 1% 0% 0% 0% 1% 1% HTC 2498 TT Handsets Huawei 4% 2% -9% 1% 0% -5% 3% 1% Huawei Tech private Handsets K-Touch 0% 0% 0% 3% 0% 0% 2% 0% Jaina private Handsets LG 1% 0% -1% 0% 0% 0% 1% 0% LG Electronics 066570 KS Handsets Motorola 0% 0% -2% 0% 0% -5% 0% 0% Motorola, Inc. MSI:US Handsets NEC 0% 0% -1% 0% 0% -5% 0% 0% NEC 6701 JP Handsets Philips 0% 0% 0% 0% 0% 0% 0% 0% Philips PHIA NA Handsets Siemens 0% 0% -1% 0% 0% 0% 0% 0% Siemens AG SIE GR Handsets Smart 0% 1% 1% 0% 0% 0% 0% 1% Smart Telecom private Handsets ZTE 2% 0% -1% 1% 0% 0% 2% 0% ZTE 763 HK TV LG 18% 38% 9% 24% 42% 9% 21% 40% LG Electronics 066570 KS TV Sony 5% 7% 5% 11% 33% 33% 8% 20% Sony 6758 JP TV Toshiba 10% 4% -9% 0% 17% 17% 5% 11% Toshiba 6502 JP TV Sharp 18% 6% 6% 7% 8% -9% 13% 7% Sharp 6753 JP TV Hitachi 0% 1% 1% 0% 0% 0% 0% 1% Hitachi, Ltd. 6501 JP TV Panasonic 1% 4% 4% 0% 0% 0% 1% 2% Panasonic 6752 JP TV Polytron 9% 14% -1% 0% 0% 0% 5% 7% Hartono Istana private TV Samsung 37% 27% 19% 24% 0% -17% 31% 14% Samsung Electron 005930 KS TV Sanyo 1% 0% 0% 0% 0% 0% 1% 0% SANYO Electric 6764 JP Computers Lenovo 0% 1% 1% 0% 17% 17% 0% 9% Lenovo Limited 992 HK Computers NEC 0% 2% 1% 0% 17% 17% 0% 10% NEC 6701 JP Computers Acer 22% 35% -38% 37% 13% -54% 30% 24% Acer Inc. 2353 TT Computers Apple 11% 4% -17% 7% 7% 7% 9% 6% Apple AAPL US Computers Samsung 20% 13% 7% 0% 7% 7% 10% 10% Samsung Electron 005930 KS Computers Sharp 4% 2% 2% 0% 7% 7% 2% 5% Sharp Corp 6753 JP Computers ASUS 0% 3% 3% 0% 0% 0% 0% 2% Asus 2357 TT Computers BenQ 0% 1% 0% 3% 0% 0% 2% 1% BenQ 8215 TT Computers Compaq 0% 0% 0% 0% 0% 0% 0% 0% HP HPQ US Computers DELL 1% 0% 0% 7% 0% 0% 4% 0% Dell private Computers Fujitsu 0% 0% 0% 0% 0% 0% 0% 0% Fujitsu Limited 6702 JP Computers HP 4% 9% 5% 7% 0% 0% 6% 5% HP HPQ US Computers IBM 0% 0% 0% 0% 0% 0% 0% 0% IBM IBM US Computers LG 0% 6% 6% 0% 0% 0% 0% 3% LG Electronics 066570 KS Computers Philips 0% 1% 1% 0% 0% 0% 0% 1% Philips PHIA NA Computers Polytron 0% 0% -19% 0% 0% 0% 0% 0% Hartono Istana private Computers Sony 6% 8% -2% 18% 0% -17% 12% 4% Sony 6758 JP Computers Toshiba 24% 11% -7% 18% 0% -17% 21% 6% Toshiba 6502 JP Fashion Polo Ralph 8% 4% 0% 19% 30% 22% 14% 17% Ralph Lauren RL US Fashion Gucci 8% 7% 4% 9% 27% 13% 9% 17% Gucci GUCG US Fashion Guess 3% 12% 9% 9% 16% 7% 6% 14% Guess GES US Fashion ZARA 1% 8% 7% 0% 12% 8% 1% 10% Diseño Textil ITX SM Fashion Louis Vuitton 2% 1% 1% 3% 11% 7% 3% 6% LVMH MC FP Fashion Dolce & Gabbana 2% 1% 1% 2% 8% 8% 2% 5% Dolce & Gabbana private Fashion Nevada 16% 13% 4% 28% 8% -5% 22% 11% Nevada Sport private Fashion Accent 0% 0% -1% 8% 4% 4% 4% 2% Accent apparel private Fashion Calvin Klein 4% 5% 3% 14% 4% 4% 9% 5% Phillips-Van Heu PVH US Fashion Armani 1% 1% 1% 2% 4% 4% 2% 3% Giorgio Armani private Fashion Pierre Cardin 2% 1% 1% 0% 4% 4% 1% 3% Pierre Cardin private Fashion Marks & Sp 0% 0% 0% 0% 4% 4% 0% 2% Marks & Spencer MKS LN Fashion Hammer 5% 3% 1% 5% 4% -1% 5% 4% Warna Mardhika private Fashion Hermes 1% 6% 6% 2% 4% 4% 2% 5% Hermès Intl RMS FP Fashion Lacoste 0% 0% 0% 3% 4% 4% 2% 2% Lacoste private Fashion Versace 0% 0% -1% 0% 4% 0% 0% 2% Gianni Versace GIAN IM Fashion Burberry 1% 0% 0% 4% 0% 0% 3% 0% Burberry BRBY LN Fashion Céline 0% 1% 1% 0% 0% 0% 0% 1% LVMH MC FP Fashion Christian Di 0% 2% 2% 0% 0% -4% 0% 1% LVMH MC FP
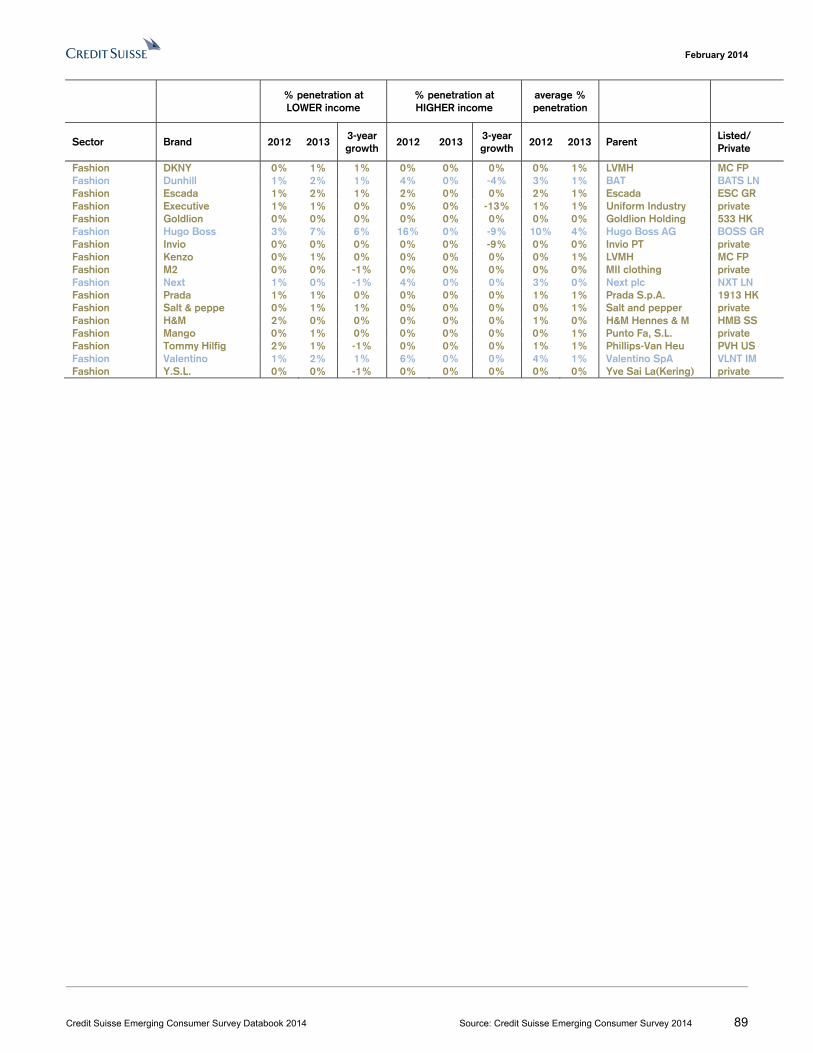
February 2014
Credit Suisse Emerging Consumer Survey Databook 2014 Source: Credit Suisse Emerging Consumer Survey 2014 89
% penetration at LOWER income
% penetration at HIGHER income
average % penetration
Sector Brand 2012 2013 3-year growth
2012 2013 3-year growth
2012 2013 Parent Listed/ Private
Fashion DKNY 0% 1% 1% 0% 0% 0% 0% 1% LVMH MC FP Fashion Dunhill 1% 2% 1% 4% 0% -4% 3% 1% BAT BATS LN Fashion Escada 1% 2% 1% 2% 0% 0% 2% 1% Escada ESC GR Fashion Executive 1% 1% 0% 0% 0% -13% 1% 1% Uniform Industry private Fashion Goldlion 0% 0% 0% 0% 0% 0% 0% 0% Goldlion Holding 533 HK Fashion Hugo Boss 3% 7% 6% 16% 0% -9% 10% 4% Hugo Boss AG BOSS GR Fashion Invio 0% 0% 0% 0% 0% -9% 0% 0% Invio PT private Fashion Kenzo 0% 1% 0% 0% 0% 0% 0% 1% LVMH MC FP Fashion M2 0% 0% -1% 0% 0% 0% 0% 0% MII clothing private Fashion Next 1% 0% -1% 4% 0% 0% 3% 0% Next plc NXT LN Fashion Prada 1% 1% 0% 0% 0% 0% 1% 1% Prada S.p.A. 1913 HK Fashion Salt & peppe 0% 1% 1% 0% 0% 0% 0% 1% Salt and pepper private Fashion H&M 2% 0% 0% 0% 0% 0% 1% 0% H&M Hennes & M HMB SS Fashion Mango 0% 1% 0% 0% 0% 0% 0% 1% Punto Fa, S.L. private Fashion Tommy Hilfig 2% 1% -1% 0% 0% 0% 1% 1% Phillips-Van Heu PVH US Fashion Valentino 1% 2% 1% 6% 0% 0% 4% 1% Valentino SpA VLNT IM Fashion Y.S.L. 0% 0% -1% 0% 0% 0% 0% 0% Yve Sai La(Kering) private
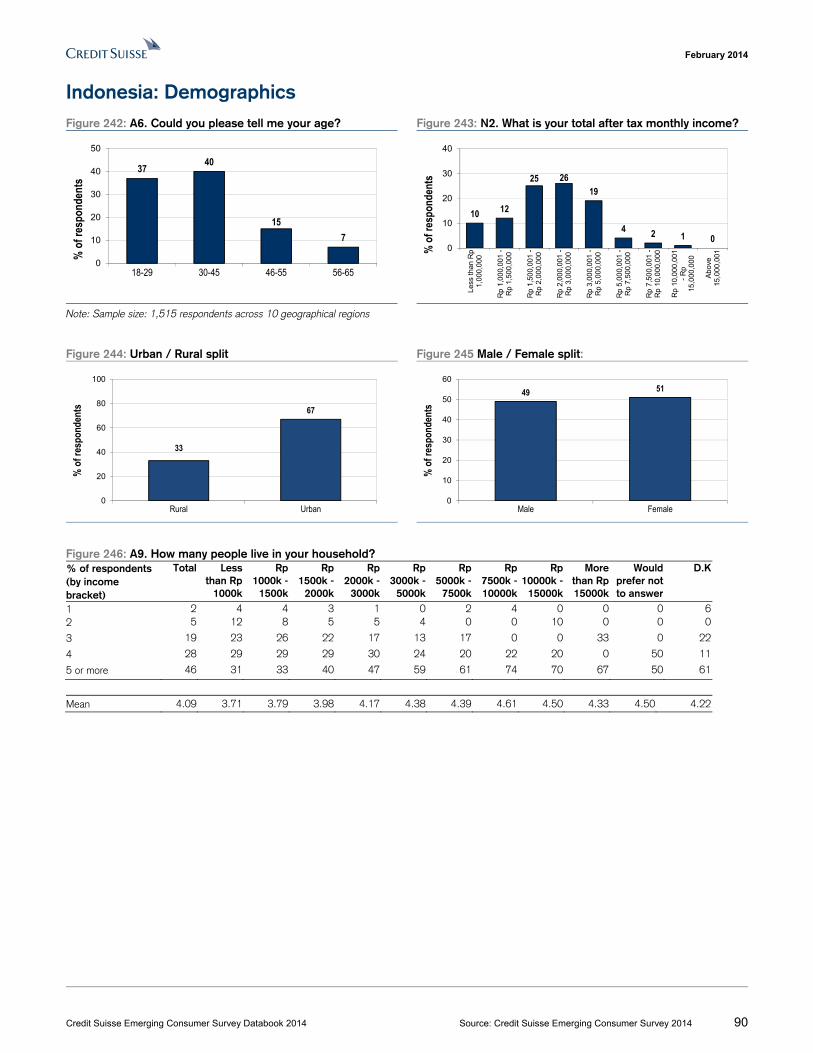
February 2014
Credit Suisse Emerging Consumer Survey Databook 2014 Source: Credit Suisse Emerging Consumer Survey 2014 90
Indonesia: Demographics Figure 242: A6. Could you please tell me your age? Figure 243: N2. What is your total after tax monthly income?
Note: Sample size: 1,515 respondents across 10 geographical regions
Figure 244: Urban / Rural split Figure 245 Male / Female split:
Figure 246: A9. How many people live in your household? % of respondents (by income bracket)
Total Less than Rp
1000k
Rp 1000k -
1500k
Rp 1500k -
2000k
Rp 2000k -
3000k
Rp 3000k -
5000k
Rp 5000k -
7500k
Rp 7500k -10000k
Rp 10000k -
15000k
More than Rp 15000k
Would prefer not to answer
D.K
1 2 4 4 3 1 0 2 4 0 0 0 62 5 12 8 5 5 4 0 0 10 0 0 0
3 19 23 26 22 17 13 17 0 0 33 0 22
4 28 29 29 29 30 24 20 22 20 0 50 11
5 or more 46 31 33 40 47 59 61 74 70 67 50 61
Mean 4.09 3.71 3.79 3.98 4.17 4.38 4.39 4.61 4.50 4.33 4.50 4.22
37 40
157
0
10
20
30
40
50
18-29 30-45 46-55 56-65
% o
f res
pond
ents
10 12
25 2619
4 2 1 00
10
20
30
40
Less
than
Rp
1,00
0,0
00
Rp
1,00
0,00
1 -
Rp
1,50
0,00
0
Rp
1,50
0,00
1 -
Rp
2,00
0,00
0
Rp
2,00
0,00
1 -
Rp
3,00
0,00
0
Rp
3,00
0,00
1 -
Rp
5,00
0,00
0
Rp
5,00
0,00
1 -
Rp
7,50
0,00
0
Rp
7,50
0,00
1 -
Rp
10,0
00,0
00
Rp
10,0
00,0
01-
Rp
15,0
00,0
00
Ab
ove
15,0
00,0
01
% o
f res
pond
ents
33
67
0
20
40
60
80
100
Rural Urban
% o
f res
pond
ents
49 51
0
10
20
30
40
50
60
Male Female
% o
f res
pond
ents
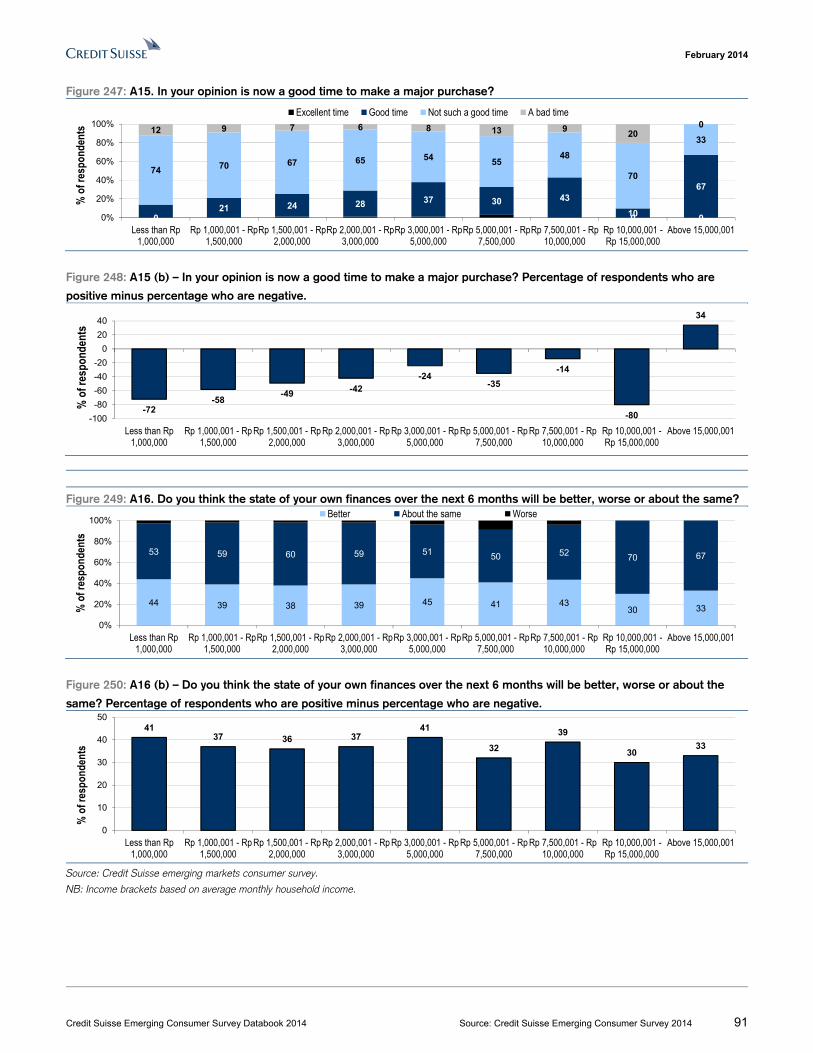
February 2014
Credit Suisse Emerging Consumer Survey Databook 2014 Source: Credit Suisse Emerging Consumer Survey 2014 91
Figure 247: A15. In your opinion is now a good time to make a major purchase?
Figure 248: A15 (b) – In your opinion is now a good time to make a major purchase? Percentage of respondents who are
positive minus percentage who are negative.
Figure 249: A16. Do you think the state of your own finances over the next 6 months will be better, worse or about the same?
Figure 250: A16 (b) – Do you think the state of your own finances over the next 6 months will be better, worse or about the
same? Percentage of respondents who are positive minus percentage who are negative.
Source: Credit Suisse emerging markets consumer survey.
NB: Income brackets based on average monthly household income.
0 0 021 24 28 37 30 43
10
67
74 70 67 65 54 5548
70
3312 9 7 6 8 13 9
200
0%
20%
40%
60%
80%
100%
Less than Rp1,000,000
Rp 1,000,001 - Rp1,500,000
Rp 1,500,001 - Rp2,000,000
Rp 2,000,001 - Rp3,000,000
Rp 3,000,001 - Rp5,000,000
Rp 5,000,001 - Rp7,500,000
Rp 7,500,001 - Rp10,000,000
Rp 10,000,001 -Rp 15,000,000
Above 15,000,001
% o
f res
pond
ents
Excellent time Good time Not such a good time A bad time
-72-58
-49 -42
-24-35
-14
-80
34
-100
-80
-60
-40
-20
0
20
40
Less than Rp1,000,000
Rp 1,000,001 - Rp1,500,000
Rp 1,500,001 - Rp2,000,000
Rp 2,000,001 - Rp3,000,000
Rp 3,000,001 - Rp5,000,000
Rp 5,000,001 - Rp7,500,000
Rp 7,500,001 - Rp10,000,000
Rp 10,000,001 -Rp 15,000,000
Above 15,000,001
% o
f res
pond
ents
44 39 38 39 45 41 4330 33
53 59 60 59 51 50 52 70 67
0%
20%
40%
60%
80%
100%
Less than Rp1,000,000
Rp 1,000,001 - Rp1,500,000
Rp 1,500,001 - Rp2,000,000
Rp 2,000,001 - Rp3,000,000
Rp 3,000,001 - Rp5,000,000
Rp 5,000,001 - Rp7,500,000
Rp 7,500,001 - Rp10,000,000
Rp 10,000,001 -Rp 15,000,000
Above 15,000,001
% o
f res
pond
ents
Better About the same Worse
4137 36 37
41
32
39
3033
0
10
20
30
40
50
Less than Rp1,000,000
Rp 1,000,001 - Rp1,500,000
Rp 1,500,001 - Rp2,000,000
Rp 2,000,001 - Rp3,000,000
Rp 3,000,001 - Rp5,000,000
Rp 5,000,001 - Rp7,500,000
Rp 7,500,001 - Rp10,000,000
Rp 10,000,001 -Rp 15,000,000
Above 15,000,001
% o
f res
pond
ents
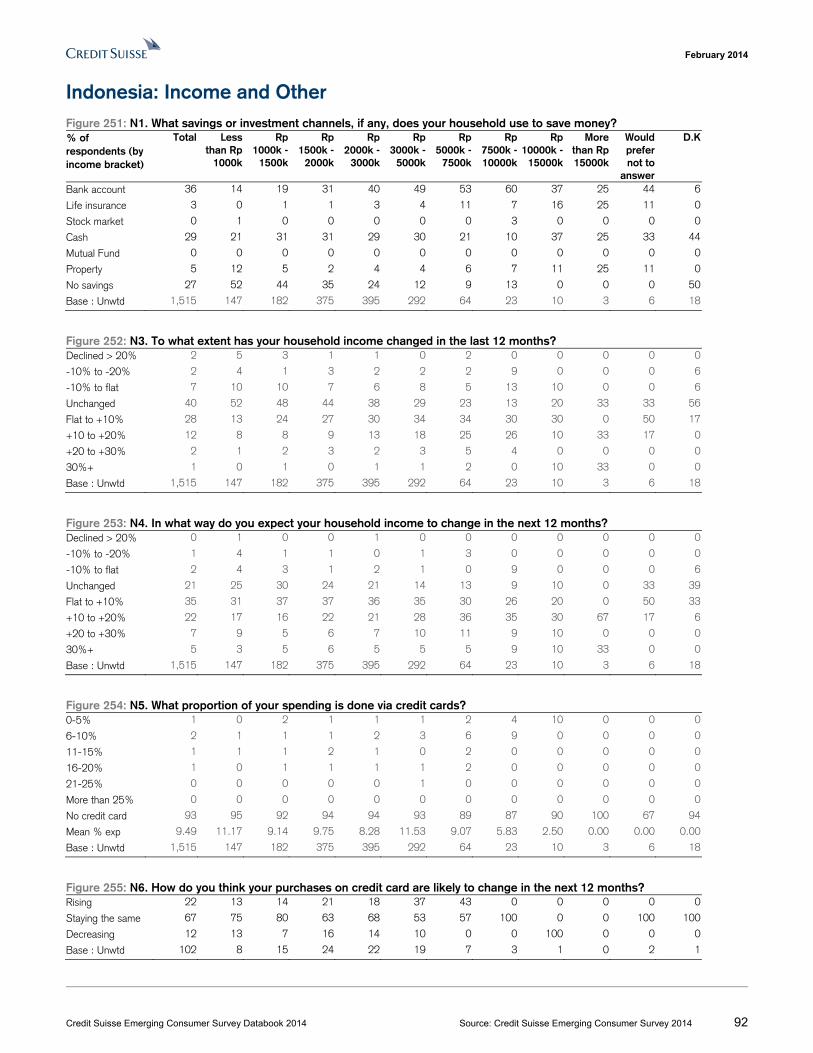
February 2014
Credit Suisse Emerging Consumer Survey Databook 2014 Source: Credit Suisse Emerging Consumer Survey 2014 92
Indonesia: Income and Other Figure 251: N1. What savings or investment channels, if any, does your household use to save money? % of respondents (by income bracket)
Total Less than Rp
1000k
Rp 1000k -
1500k
Rp 1500k -
2000k
Rp 2000k -
3000k
Rp 3000k -
5000k
Rp 5000k -
7500k
Rp 7500k -10000k
Rp 10000k -
15000k
More than Rp 15000k
Would prefer not to
answer
D.K
Bank account 36 14 19 31 40 49 53 60 37 25 44 6
Life insurance 3 0 1 1 3 4 11 7 16 25 11 0
Stock market 0 1 0 0 0 0 0 3 0 0 0 0
Cash 29 21 31 31 29 30 21 10 37 25 33 44
Mutual Fund 0 0 0 0 0 0 0 0 0 0 0 0
Property 5 12 5 2 4 4 6 7 11 25 11 0
No savings 27 52 44 35 24 12 9 13 0 0 0 50
Base : Unwtd 1,515 147 182 375 395 292 64 23 10 3 6 18
Figure 252: N3. To what extent has your household income changed in the last 12 months? Declined > 20% 2 5 3 1 1 0 2 0 0 0 0 0
-10% to -20% 2 4 1 3 2 2 2 9 0 0 0 6
-10% to flat 7 10 10 7 6 8 5 13 10 0 0 6
Unchanged 40 52 48 44 38 29 23 13 20 33 33 56
Flat to +10% 28 13 24 27 30 34 34 30 30 0 50 17
+10 to +20% 12 8 8 9 13 18 25 26 10 33 17 0
+20 to +30% 2 1 2 3 2 3 5 4 0 0 0 0
30%+ 1 0 1 0 1 1 2 0 10 33 0 0
Base : Unwtd 1,515 147 182 375 395 292 64 23 10 3 6 18
Figure 253: N4. In what way do you expect your household income to change in the next 12 months? Declined > 20% 0 1 0 0 1 0 0 0 0 0 0 0
-10% to -20% 1 4 1 1 0 1 3 0 0 0 0 0
-10% to flat 2 4 3 1 2 1 0 9 0 0 0 6
Unchanged 21 25 30 24 21 14 13 9 10 0 33 39
Flat to +10% 35 31 37 37 36 35 30 26 20 0 50 33
+10 to +20% 22 17 16 22 21 28 36 35 30 67 17 6
+20 to +30% 7 9 5 6 7 10 11 9 10 0 0 0
30%+ 5 3 5 6 5 5 5 9 10 33 0 0
Base : Unwtd 1,515 147 182 375 395 292 64 23 10 3 6 18
Figure 254: N5. What proportion of your spending is done via credit cards? 0-5% 1 0 2 1 1 1 2 4 10 0 0 0
6-10% 2 1 1 1 2 3 6 9 0 0 0 0
11-15% 1 1 1 2 1 0 2 0 0 0 0 0
16-20% 1 0 1 1 1 1 2 0 0 0 0 0
21-25% 0 0 0 0 0 1 0 0 0 0 0 0
More than 25% 0 0 0 0 0 0 0 0 0 0 0 0
No credit card 93 95 92 94 94 93 89 87 90 100 67 94
Mean % exp 9.49 11.17 9.14 9.75 8.28 11.53 9.07 5.83 2.50 0.00 0.00 0.00
Base : Unwtd 1,515 147 182 375 395 292 64 23 10 3 6 18
Figure 255: N6. How do you think your purchases on credit card are likely to change in the next 12 months? Rising 22 13 14 21 18 37 43 0 0 0 0 0
Staying the same 67 75 80 63 68 53 57 100 0 0 100 100
Decreasing 12 13 7 16 14 10 0 0 100 0 0 0
Base : Unwtd 102 8 15 24 22 19 7 3 1 0 2 1
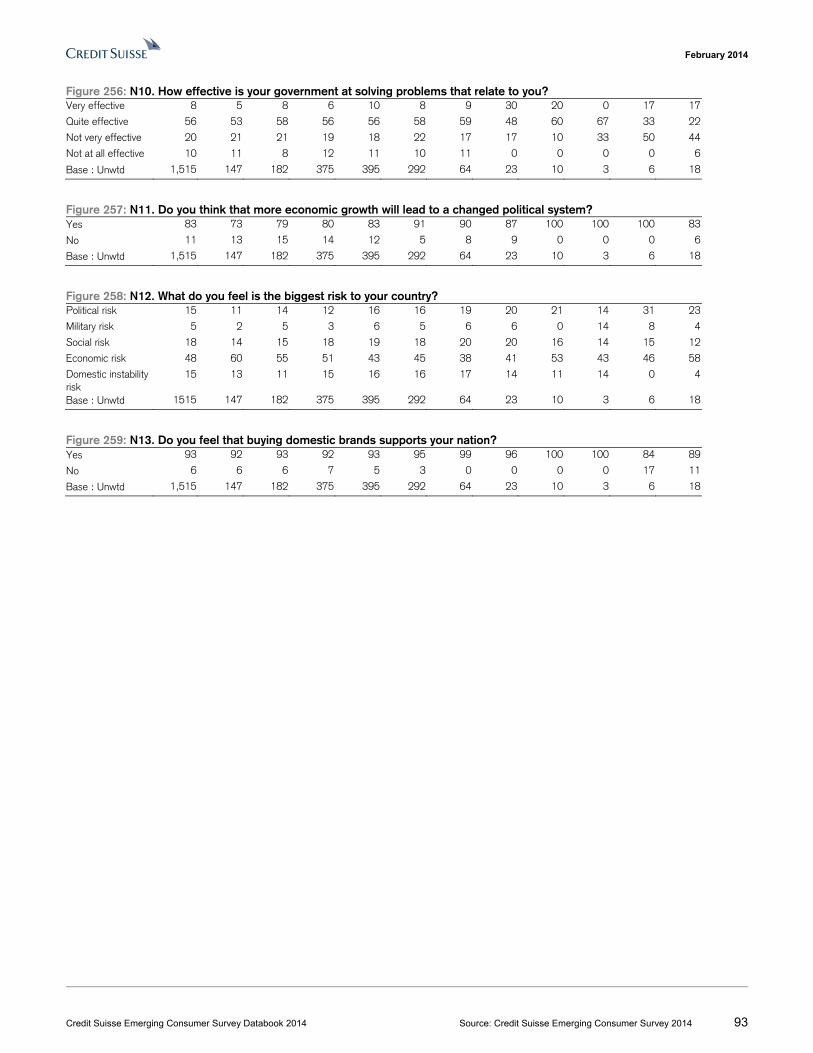
February 2014
Credit Suisse Emerging Consumer Survey Databook 2014 Source: Credit Suisse Emerging Consumer Survey 2014 93
Figure 256: N10. How effective is your government at solving problems that relate to you? Very effective 8 5 8 6 10 8 9 30 20 0 17 17
Quite effective 56 53 58 56 56 58 59 48 60 67 33 22
Not very effective 20 21 21 19 18 22 17 17 10 33 50 44
Not at all effective 10 11 8 12 11 10 11 0 0 0 0 6
Base : Unwtd 1,515 147 182 375 395 292 64 23 10 3 6 18
Figure 257: N11. Do you think that more economic growth will lead to a changed political system? Yes 83 73 79 80 83 91 90 87 100 100 100 83
No 11 13 15 14 12 5 8 9 0 0 0 6
Base : Unwtd 1,515 147 182 375 395 292 64 23 10 3 6 18
Figure 258: N12. What do you feel is the biggest risk to your country? Political risk 15 11 14 12 16 16 19 20 21 14 31 23
Military risk 5 2 5 3 6 5 6 6 0 14 8 4
Social risk 18 14 15 18 19 18 20 20 16 14 15 12
Economic risk 48 60 55 51 43 45 38 41 53 43 46 58
Domestic instability risk
15 13 11 15 16 16 17 14 11 14 0 4
Base : Unwtd 1515 147 182 375 395 292 64 23 10 3 6 18
Figure 259: N13. Do you feel that buying domestic brands supports your nation? Yes 93 92 93 92 93 95 99 96 100 100 84 89
No 6 6 6 7 5 3 0 0 0 0 17 11
Base : Unwtd 1,515 147 182 375 395 292 64 23 10 3 6 18
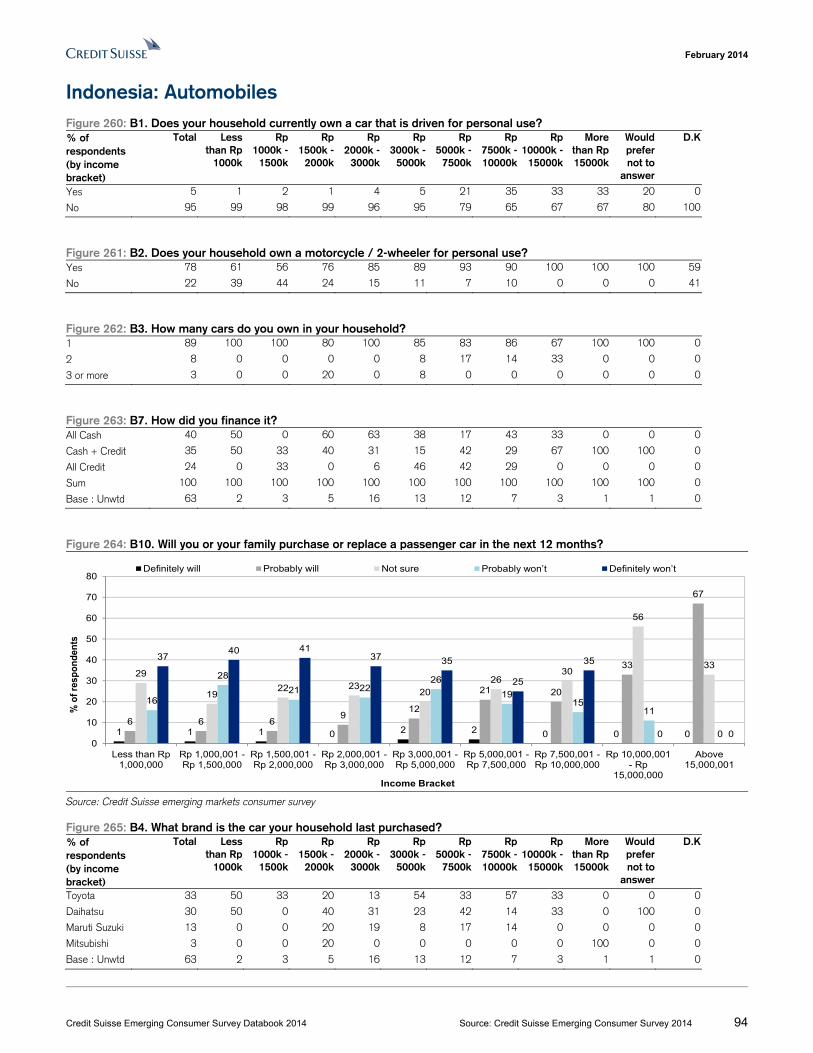
February 2014
Credit Suisse Emerging Consumer Survey Databook 2014 Source: Credit Suisse Emerging Consumer Survey 2014 94
Indonesia: Automobiles Figure 260: B1. Does your household currently own a car that is driven for personal use? % of respondents (by income bracket)
Total Less than Rp
1000k
Rp 1000k -
1500k
Rp 1500k -
2000k
Rp 2000k -
3000k
Rp 3000k -
5000k
Rp 5000k -
7500k
Rp 7500k -10000k
Rp 10000k -
15000k
More than Rp 15000k
Would prefer not to
answer
D.K
Yes 5 1 2 1 4 5 21 35 33 33 20 0
No 95 99 98 99 96 95 79 65 67 67 80 100
Figure 261: B2. Does your household own a motorcycle / 2-wheeler for personal use? Yes 78 61 56 76 85 89 93 90 100 100 100 59
No 22 39 44 24 15 11 7 10 0 0 0 41
Figure 262: B3. How many cars do you own in your household? 1 89 100 100 80 100 85 83 86 67 100 100 0
2 8 0 0 0 0 8 17 14 33 0 0 0
3 or more 3 0 0 20 0 8 0 0 0 0 0 0
Figure 263: B7. How did you finance it? All Cash 40 50 0 60 63 38 17 43 33 0 0 0
Cash + Credit 35 50 33 40 31 15 42 29 67 100 100 0
All Credit 24 0 33 0 6 46 42 29 0 0 0 0
Sum 100 100 100 100 100 100 100 100 100 100 100 0
Base : Unwtd 63 2 3 5 16 13 12 7 3 1 1 0
Figure 264: B10. Will you or your family purchase or replace a passenger car in the next 12 months?
Source: Credit Suisse emerging markets consumer survey
Figure 265: B4. What brand is the car your household last purchased? % of respondents (by income bracket)
Total Less than Rp
1000k
Rp 1000k -
1500k
Rp 1500k -
2000k
Rp 2000k -
3000k
Rp 3000k -
5000k
Rp 5000k -
7500k
Rp 7500k -10000k
Rp 10000k -
15000k
More than Rp 15000k
Would prefer not to
answer
D.K
Toyota 33 50 33 20 13 54 33 57 33 0 0 0
Daihatsu 30 50 0 40 31 23 42 14 33 0 100 0
Maruti Suzuki 13 0 0 20 19 8 17 14 0 0 0 0
Mitsubishi 3 0 0 20 0 0 0 0 0 100 0 0
Base : Unwtd 63 2 3 5 16 13 12 7 3 1 1 0
1 1 1 0 2 2 0 0 06 6 6
912
21 20
33
67
29
1922 23
2026
30
56
33
16
28
21 2226
1915
11
0
3740 41
37 35
25
35
0 00
10
20
30
40
50
60
70
80
Less than Rp1,000,000
Rp 1,000,001 -Rp 1,500,000
Rp 1,500,001 -Rp 2,000,000
Rp 2,000,001 -Rp 3,000,000
Rp 3,000,001 -Rp 5,000,000
Rp 5,000,001 -Rp 7,500,000
Rp 7,500,001 -Rp 10,000,000
Rp 10,000,001- Rp
15,000,000
Above15,000,001
% o
f res
po
nd
ents
Income Bracket
Definitely will Probably will Not sure Probably won’t Definitely won’t
February 2014
Credit Suisse Emerging Consumer Survey Databook 2014 Source: Credit Suisse Emerging Consumer Survey 2014 95
Figure 266: B16. How do you plan to finance the upcoming car purchase? All Cash 40 67 25 45 52 31 31 50 0 0 50 0
Cash + Credit 41 33 58 50 33 44 31 50 33 50 0 0
All Credit 17 0 8 0 15 22 38 0 67 50 50 0
D.K. 2 0 8 5 0 3 0 0 0 0 0 0
Base : Unwtd 136 9 12 22 33 36 13 4 3 2 2 0
Figure 267: B17. How much do you plan to spend on the car you or your household is planning to purchase? Upto Rp 100m 26 22 17 36 33 22 8 25 33 0 50 0
Rp 100m - 200m 53 56 58 36 52 61 54 50 67 50 50 0
Rp 200m - 300m 12 22 8 9 12 6 23 25 0 50 0 0
Rp 300m - 400m 4 0 0 9 3 3 15 0 0 0 0 0
More than Rp 400m 1 0 8 0 0 3 0 0 0 0 0 0
Base : Unwtd 136 9 12 22 33 36 13 4 3 2 2 0
Figure 268: B15. Which car brand are you most likely purchase? Local 6 0 0 0 8 10 13 0 33 0 0 0
Foreign 87 100 83 92 89 83 80 100 67 75 100 0
Toyota 26 44 25 15 36 25 20 29 0 0 50 0
Honda 19 33 25 15 19 20 27 14 0 0 0 0
Daihatsu 13 11 0 19 11 15 7 29 33 0 0 0
Base : Unwtd 136 9 12 22 33 36 13 4 3 2 2 0
February 2014
Credit Suisse Emerging Consumer Survey Databook 2014 Source: Credit Suisse Emerging Consumer Survey 2014 96
Indonesia: Food & Beverage Figure 269: C1. Have you purchased any of these products in the last 3 months? % of respondents (by income bracket)
Total Less than Rp
1000k
Rp 1000k -
1500k
Rp 1500k -
2000k
Rp 2000k -
3000k
Rp 3000k -
5000k
Rp 5000k -
7500k
Rp 7500k -10000k
Rp 10000k -
15000k
More than Rp 15000k
Would prefer not to
answer
D.K
Drinks: Yes 75 61 67 73 81 83 83 93 67 100 100 67
Drinks: No 25 39 33 27 19 17 17 7 33 0 0 33
Drinks: Base 1,106 131 153 290 263 187 42 15 6 2 5 12
Noodles: Yes 97 95 99 97 97 97 90 93 83 50 100 100
Noodles: No 3 5 1 3 3 3 10 7 17 50 0 0
Noodles: Base 1,106 131 153 290 263 187 42 15 6 2 5 12
Bottled Water: Yes 92 82 92 90 94 96 98 100 100 100 100 83
Bottled Water: No 8 18 8 10 6 4 2 0 0 0 0 17
Bottled Water:Base 1,106 131 153 290 263 187 42 15 6 2 5 12
Cigarettes: Yes 54 44 52 55 54 55 57 80 67 50 60 42
Cigarettes: No 46 56 48 45 46 45 43 20 33 50 40 58
Cigarettes: Base 1,106 131 153 290 263 187 42 15 6 2 5 12
Dairy: Yes 72 62 67 70 76 77 81 73 67 100 100 75
Dairy: No 28 38 33 30 24 23 19 27 33 0 0 25
Dairy: Base 1,106 131 153 290 263 187 42 15 6 2 5 12
Figure 270: C2. Which brands of the following have you purchased in the last 3 months? Drinks - Foreign 93 95 95 94 92 90 89 97 91 100 93 100
Fanta 22 23 20 23 22 23 23 27 18 0 14 13
Coca-Cola 24 18 22 26 24 23 25 32 18 50 29 19
Drinks - Local 7 5 5 6 8 10 11 3 9 0 7 0
Tebs 2 1 1 2 2 2 4 0 9 0 0 0
Drinks - Base 832 80 103 212 214 155 35 14 4 2 5 8
Noodles - Foreign 0 0 0 0 0 0 0 0 0 0 0 0
Noodles - Local 100 100 100 100 100 100 100 100 100 100 100 100
Indomie 39 38 38 40 39 38 37 36 31 100 20 25
Mie Sedap 31 36 38 32 28 25 27 15 25 0 40 50
Supermi 7 4 4 6 9 7 11 12 6 0 0 0
Sarimi 7 10 8 8 6 7 4 9 19 0 10 0
Noodles - Base 1,068 124 151 280 256 182 38 14 5 1 5 12
Water - Foreign 58 57 59 57 59 59 57 64 50 40 100 91
Aqua 58 57 59 56 59 58 57 60 50 40 100 91
Water - Local 41 42 41 43 41 41 42 36 50 60 0 9
Club 12 18 11 14 12 10 17 12 8 0 0 0
Vit 10 5 9 11 10 13 11 8 17 20 0 0
Water - Base 1,018 108 141 262 248 180 41 15 6 2 5 10
Cigarettes - Foreign 7 5 1 6 7 11 13 5 0 0 0 0
Cigarettes - Local 93 95 99 94 92 89 87 95 100 100 100 100
Dji Sam Soe 13 8 11 14 12 13 16 21 33 0 0 0
Sampoerna 16 12 10 17 16 18 18 37 33 0 33 33
Garam Surya 14 12 11 14 11 18 21 5 0 0 67 17
Djarum Super 12 16 15 13 12 9 3 11 0 0 0 0
Cigarettes - Base 592 58 80 159 143 103 24 12 4 1 3 5
Dairy - Foreign 24 29 22 22 25 24 23 34 25 0 0 0
Nestle 11 13 10 12 11 9 9 17 13 0 0 0
Dairy - Local 76 71 78 78 75 76 77 66 75 100 100 100
Frissian Flag 23 22 24 23 23 21 22 7 38 0 50 50
Indomilk 24 24 24 26 24 22 17 21 0 0 25 25
Dairy - Base 794 81 103 202 199 144 34 11 4 2 5 9
February 2014
Credit Suisse Emerging Consumer Survey Databook 2014 Source: Credit Suisse Emerging Consumer Survey 2014 97
Figure 271: C3. Do you expect to spend more on any of these products in the next 12 months? % of respondents (by income bracket)
Total Less than Rp
1000k
Rp 1000k -
1500k
Rp 1500k -
2000k
Rp 2000k -
3000k
Rp 3000k -
5000k
Rp 5000k -
7500k
Rp 7500k -10000k
Rp 10000k -
15000k
More than Rp 15000k
Would prefer not to
answer
D.K
Drinks: Yes 33 36 29 30 36 31 48 13 33 50 60 33
Drinks: No 67 64 71 70 64 69 52 87 67 50 40 67
Drinks: Base 1,106 131 153 290 263 187 42 15 6 2 5 12
Noodles: Yes 52 62 48 51 53 49 55 40 33 50 60 42
Noodles: No 48 38 52 49 47 51 45 60 67 50 40 58
Noodles: Base 1,106 131 153 290 263 187 42 15 6 2 5 12
Water: Yes 51 48 44 46 53 57 71 53 50 100 60 42
Water: No 49 52 56 54 47 43 29 47 50 0 40 58
Water: Base 1,106 131 153 290 263 187 42 15 6 2 5 12
Cigarettes: Yes 26 31 25 26 24 25 38 20 33 50 40 17
Cigarettes: No 74 69 75 74 76 75 62 80 67 50 60 83
Cigarettes: Base 1,106 131 153 290 263 187 42 15 6 2 5 12
Dairy: Yes 41 35 35 38 42 47 62 53 33 100 60 25
Dairy: No 59 65 65 62 58 53 38 47 67 0 40 75
Dairy: Base 1,106 131 153 290 263 187 42 15 6 2 5 12
Figure 272: C4. What % of your diet is made up of meat? 0% 8 11 10 7 9 4 5 0 0 0 0 25
0-5% 57 53 65 58 57 51 57 40 50 0 80 58
6-15% 24 26 18 25 22 27 19 40 17 50 0 8
16-25% 5 2 3 5 6 9 10 7 0 0 0 0
More than 25% 4 2 1 2 4 5 7 13 33 50 0 0
Figure 273: C6. What level of inflation have you seen over the past 12 months on basic food and drink? Below 1% 7 5 5 8 6 5 12 7 33 0 0 0
1-3% 23 20 27 20 27 21 31 7 0 0 40 25
3-5% 23 27 27 22 19 20 24 47 17 0 20 8
5-7% 13 11 14 14 14 12 14 7 33 50 0 8
7-10% 8 5 5 9 10 12 10 13 0 50 0 0
Above 10% 7 2 5 8 6 10 7 20 17 0 0 0
Haven’t noticed any
6 8 3 5 6 8 0 0 0 0 20 8
D.K. 13 22 15 14 10 11 2 0 0 0 20 50
Base : Unwtd 1,106 131 153 290 263 187 42 15 6 2 5 12
Figure 274: C7. How sensitive are you to rising food and drink prices generally? Very sensitive 51 61 51 54 49 42 40 67 67 50 80 67
Somewhat sensitive
41 32 43 39 44 43 50 33 17 50 20 33
Somewhat not sensitive
6 5 3 6 5 10 7 0 17 0 0 0
Not at all sensitive
2 2 3 1 2 4 2 0 0 0 0 0
Base : Unwtd 1,106 131 153 290 263 187 42 15 6 2 5 12
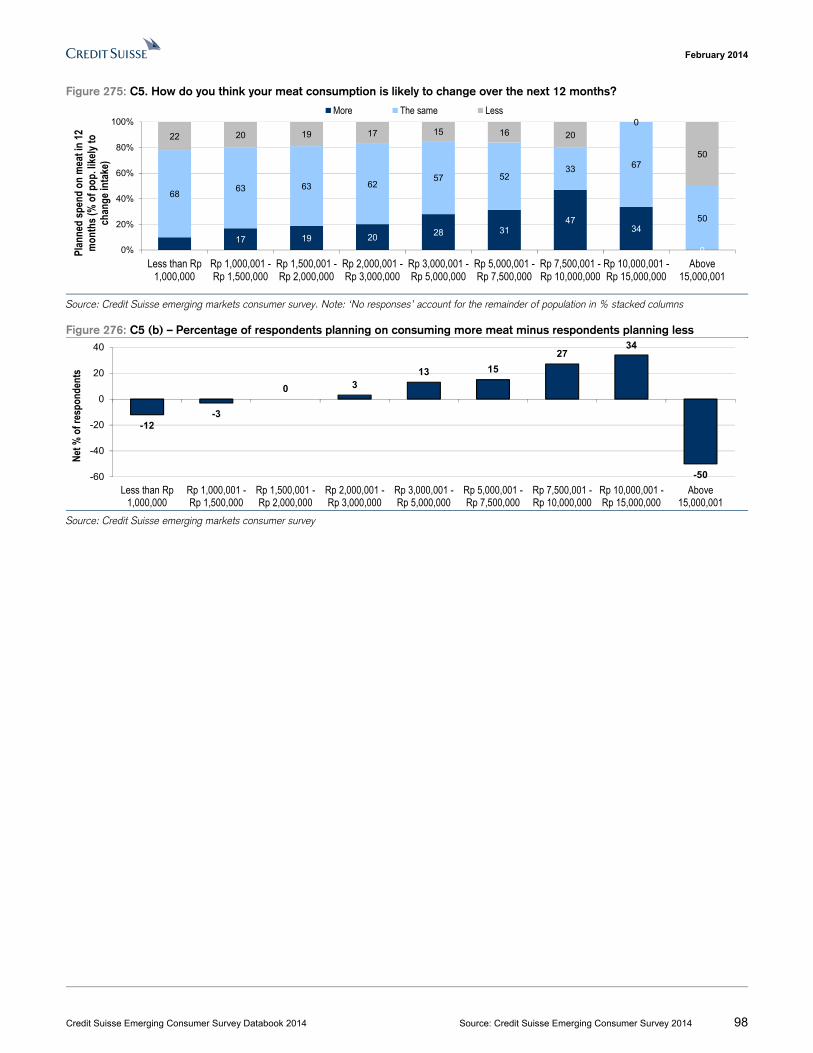
February 2014
Credit Suisse Emerging Consumer Survey Databook 2014 Source: Credit Suisse Emerging Consumer Survey 2014 98
Figure 275: C5. How do you think your meat consumption is likely to change over the next 12 months?
Source: Credit Suisse emerging markets consumer survey. Note: ‘No responses’ account for the remainder of population in % stacked columns
Figure 276: C5 (b) – Percentage of respondents planning on consuming more meat minus respondents planning less
Source: Credit Suisse emerging markets consumer survey
17 19 20 28 3147
34
0
6863 63 62
57 5233 67
50
22 20 19 17 15 16 20
0
50
0%
20%
40%
60%
80%
100%
Less than Rp1,000,000
Rp 1,000,001 -Rp 1,500,000
Rp 1,500,001 -Rp 2,000,000
Rp 2,000,001 -Rp 3,000,000
Rp 3,000,001 -Rp 5,000,000
Rp 5,000,001 -Rp 7,500,000
Rp 7,500,001 -Rp 10,000,000
Rp 10,000,001 -Rp 15,000,000
Above15,000,001
Plan
ned
spen
d on
mea
t in
12
mon
ths (
% o
f pop
. like
ly to
ch
ange
inta
ke)
More The same Less
-12-3
0 313 15
2734
-50-60
-40
-20
0
20
40
Less than Rp1,000,000
Rp 1,000,001 -Rp 1,500,000
Rp 1,500,001 -Rp 2,000,000
Rp 2,000,001 -Rp 3,000,000
Rp 3,000,001 -Rp 5,000,000
Rp 5,000,001 -Rp 7,500,000
Rp 7,500,001 -Rp 10,000,000
Rp 10,000,001 -Rp 15,000,000
Above15,000,001
Net %
of r
espo
nden
ts
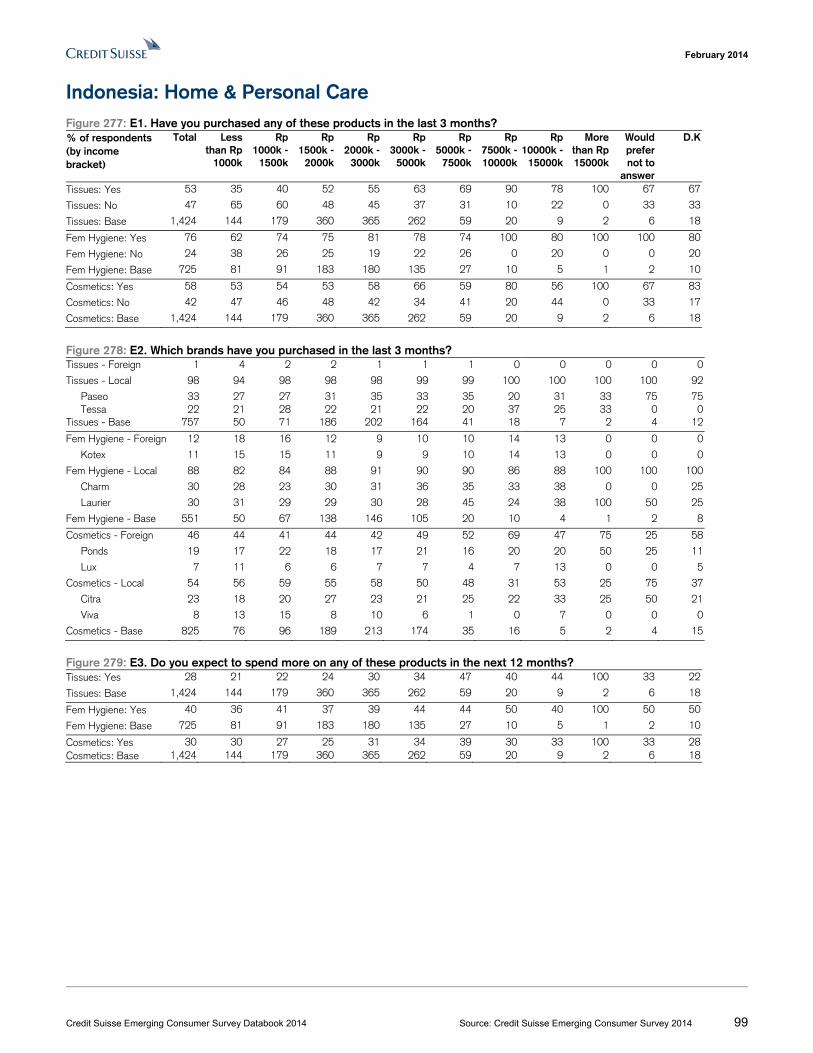
February 2014
Credit Suisse Emerging Consumer Survey Databook 2014 Source: Credit Suisse Emerging Consumer Survey 2014 99
Indonesia: Home & Personal Care Figure 277: E1. Have you purchased any of these products in the last 3 months? % of respondents (by income bracket)
Total Less than Rp
1000k
Rp 1000k -
1500k
Rp 1500k -
2000k
Rp 2000k -
3000k
Rp 3000k -
5000k
Rp 5000k -
7500k
Rp 7500k -10000k
Rp 10000k -
15000k
More than Rp 15000k
Would prefer not to
answer
D.K
Tissues: Yes 53 35 40 52 55 63 69 90 78 100 67 67
Tissues: No 47 65 60 48 45 37 31 10 22 0 33 33
Tissues: Base 1,424 144 179 360 365 262 59 20 9 2 6 18
Fem Hygiene: Yes 76 62 74 75 81 78 74 100 80 100 100 80
Fem Hygiene: No 24 38 26 25 19 22 26 0 20 0 0 20
Fem Hygiene: Base 725 81 91 183 180 135 27 10 5 1 2 10
Cosmetics: Yes 58 53 54 53 58 66 59 80 56 100 67 83
Cosmetics: No 42 47 46 48 42 34 41 20 44 0 33 17
Cosmetics: Base 1,424 144 179 360 365 262 59 20 9 2 6 18
Figure 278: E2. Which brands have you purchased in the last 3 months? Tissues - Foreign 1 4 2 2 1 1 1 0 0 0 0 0
Tissues - Local 98 94 98 98 98 99 99 100 100 100 100 92
Paseo 33 27 27 31 35 33 35 20 31 33 75 75 Tessa 22 21 28 22 21 22 20 37 25 33 0 0Tissues - Base 757 50 71 186 202 164 41 18 7 2 4 12
Fem Hygiene - Foreign 12 18 16 12 9 10 10 14 13 0 0 0
Kotex 11 15 15 11 9 9 10 14 13 0 0 0
Fem Hygiene - Local 88 82 84 88 91 90 90 86 88 100 100 100
Charm 30 28 23 30 31 36 35 33 38 0 0 25
Laurier 30 31 29 29 30 28 45 24 38 100 50 25
Fem Hygiene - Base 551 50 67 138 146 105 20 10 4 1 2 8
Cosmetics - Foreign 46 44 41 44 42 49 52 69 47 75 25 58
Ponds 19 17 22 18 17 21 16 20 20 50 25 11
Lux 7 11 6 6 7 7 4 7 13 0 0 5
Cosmetics - Local 54 56 59 55 58 50 48 31 53 25 75 37
Citra 23 18 20 27 23 21 25 22 33 25 50 21
Viva 8 13 15 8 10 6 1 0 7 0 0 0
Cosmetics - Base 825 76 96 189 213 174 35 16 5 2 4 15
Figure 279: E3. Do you expect to spend more on any of these products in the next 12 months? Tissues: Yes 28 21 22 24 30 34 47 40 44 100 33 22
Tissues: Base 1,424 144 179 360 365 262 59 20 9 2 6 18
Fem Hygiene: Yes 40 36 41 37 39 44 44 50 40 100 50 50
Fem Hygiene: Base 725 81 91 183 180 135 27 10 5 1 2 10
Cosmetics: Yes 30 30 27 25 31 34 39 30 33 100 33 28Cosmetics: Base 1,424 144 179 360 365 262 59 20 9 2 6 18
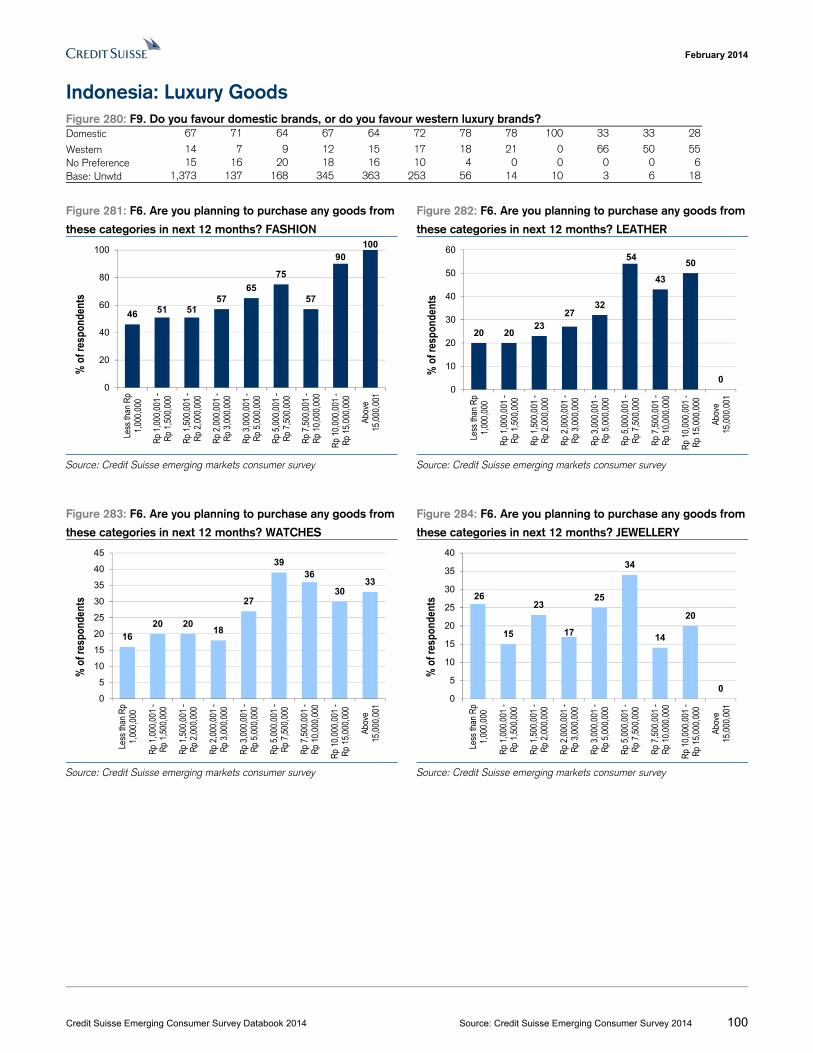
February 2014
Credit Suisse Emerging Consumer Survey Databook 2014 Source: Credit Suisse Emerging Consumer Survey 2014 100
Indonesia: Luxury Goods Figure 280: F9. Do you favour domestic brands, or do you favour western luxury brands? Domestic 67 71 64 67 64 72 78 78 100 33 33 28
Western 14 7 9 12 15 17 18 21 0 66 50 55No Preference 15 16 20 18 16 10 4 0 0 0 0 6Base: Unwtd 1,373 137 168 345 363 253 56 14 10 3 6 18
Figure 281: F6. Are you planning to purchase any goods from
these categories in next 12 months? FASHION
Figure 282: F6. Are you planning to purchase any goods from
these categories in next 12 months? LEATHER
Source: Credit Suisse emerging markets consumer survey Source: Credit Suisse emerging markets consumer survey
Figure 283: F6. Are you planning to purchase any goods from
these categories in next 12 months? WATCHES
Figure 284: F6. Are you planning to purchase any goods from
these categories in next 12 months? JEWELLERY
Source: Credit Suisse emerging markets consumer survey Source: Credit Suisse emerging markets consumer survey
46 51 5157
65
75
57
90100
0
20
40
60
80
100
Less
than
Rp
1,00
0,00
0
Rp
1,00
0,00
1 -
Rp
1,50
0,00
0
Rp
1,50
0,00
1 -
Rp
2,00
0,00
0
Rp
2,00
0,00
1 -
Rp
3,00
0,00
0
Rp
3,00
0,00
1 -
Rp
5,00
0,00
0
Rp
5,00
0,00
1 -
Rp
7,50
0,00
0
Rp
7,50
0,00
1 -
Rp
10,0
00,0
00
Rp
10,0
00,0
01 -
Rp
15,0
00,0
00
Abov
e15
,000
,001
% o
f res
pond
ents
20 2023
2732
54
43
50
00
10
20
30
40
50
60
Less
than
Rp
1,00
0,00
0
Rp
1,00
0,00
1 -
Rp
1,50
0,00
0
Rp
1,50
0,00
1 -
Rp
2,00
0,00
0
Rp
2,00
0,00
1 -
Rp
3,00
0,00
0
Rp
3,00
0,00
1 -
Rp
5,00
0,00
0
Rp
5,00
0,00
1 -
Rp
7,50
0,00
0
Rp
7,50
0,00
1 -
Rp
10,0
00,0
00
Rp
10,0
00,0
01 -
Rp
15,0
00,0
00
Abov
e15
,000
,001
% o
f res
pond
ents
1620 20
18
27
3936
3033
0
5
10
15
20
25
30
35
40
45
Less
than
Rp
1,00
0,00
0
Rp
1,00
0,00
1 -
Rp
1,50
0,00
0
Rp
1,50
0,00
1 -
Rp
2,00
0,00
0
Rp
2,00
0,00
1 -
Rp
3,00
0,00
0
Rp
3,00
0,00
1 -
Rp
5,00
0,00
0
Rp
5,00
0,00
1 -
Rp
7,50
0,00
0
Rp
7,50
0,00
1 -
Rp
10,0
00,0
00
Rp
10,0
00,0
01 -
Rp
15,0
00,0
00
Abov
e15
,000
,001
% o
f res
pond
ents 26
15
23
17
25
34
14
20
00
5
10
15
20
25
30
35
40
Less
than
Rp
1,00
0,00
0
Rp
1,00
0,00
1 -
Rp
1,50
0,00
0
Rp
1,50
0,00
1 -
Rp
2,00
0,00
0
Rp
2,00
0,00
1 -
Rp
3,00
0,00
0
Rp
3,00
0,00
1 -
Rp
5,00
0,00
0
Rp
5,00
0,00
1 -
Rp
7,50
0,00
0
Rp
7,50
0,00
1 -
Rp
10,0
00,0
00
Rp
10,0
00,0
01 -
Rp
15,0
00,0
00
Abov
e15
,000
,001
% o
f res
pond
ents
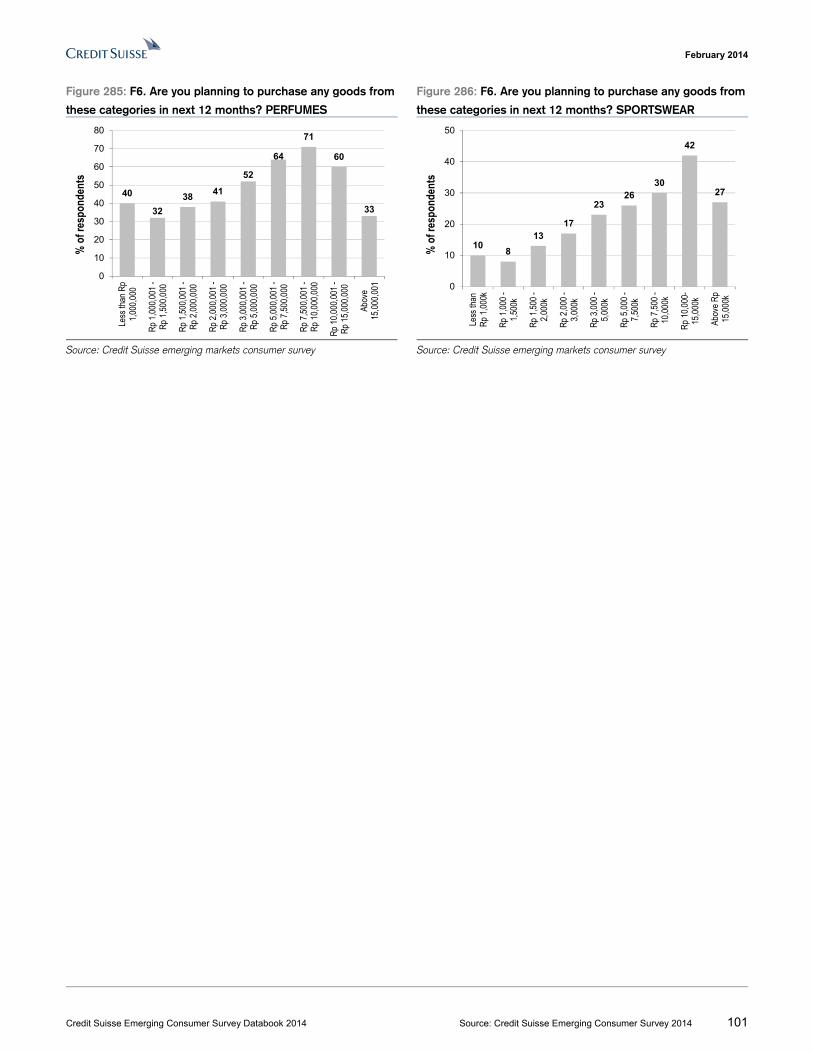
February 2014
Credit Suisse Emerging Consumer Survey Databook 2014 Source: Credit Suisse Emerging Consumer Survey 2014 101
Figure 285: F6. Are you planning to purchase any goods from
these categories in next 12 months? PERFUMES
Figure 286: F6. Are you planning to purchase any goods from
these categories in next 12 months? SPORTSWEAR
Source: Credit Suisse emerging markets consumer survey Source: Credit Suisse emerging markets consumer survey
40
32
3841
52
64
71
60
33
0
10
20
30
40
50
60
70
80Le
ss th
an R
p1,
000,
000
Rp
1,00
0,00
1 -
Rp
1,50
0,00
0
Rp
1,50
0,00
1 -
Rp
2,00
0,00
0
Rp
2,00
0,00
1 -
Rp
3,00
0,00
0
Rp
3,00
0,00
1 -
Rp
5,00
0,00
0
Rp
5,00
0,00
1 -
Rp
7,50
0,00
0
Rp
7,50
0,00
1 -
Rp
10,0
00,0
00
Rp
10,0
00,0
01 -
Rp
15,0
00,0
00
Abov
e15
,000
,001
% o
f res
pond
ents
108
1317
2326
30
42
27
0
10
20
30
40
50
Less
than
Rp
1,00
0k
Rp
1,00
0 -
1,50
0k
Rp
1,50
0 -
2,00
0k
Rp
2,00
0 -
3,00
0k
Rp
3,00
0 -
5,00
0k
Rp
5,00
0 -
7,50
0k
Rp
7,50
0 -
10,0
00k
Rp
10,0
00-
15,0
00k
Abov
e R
p15
,000
k
% o
f res
pond
ents
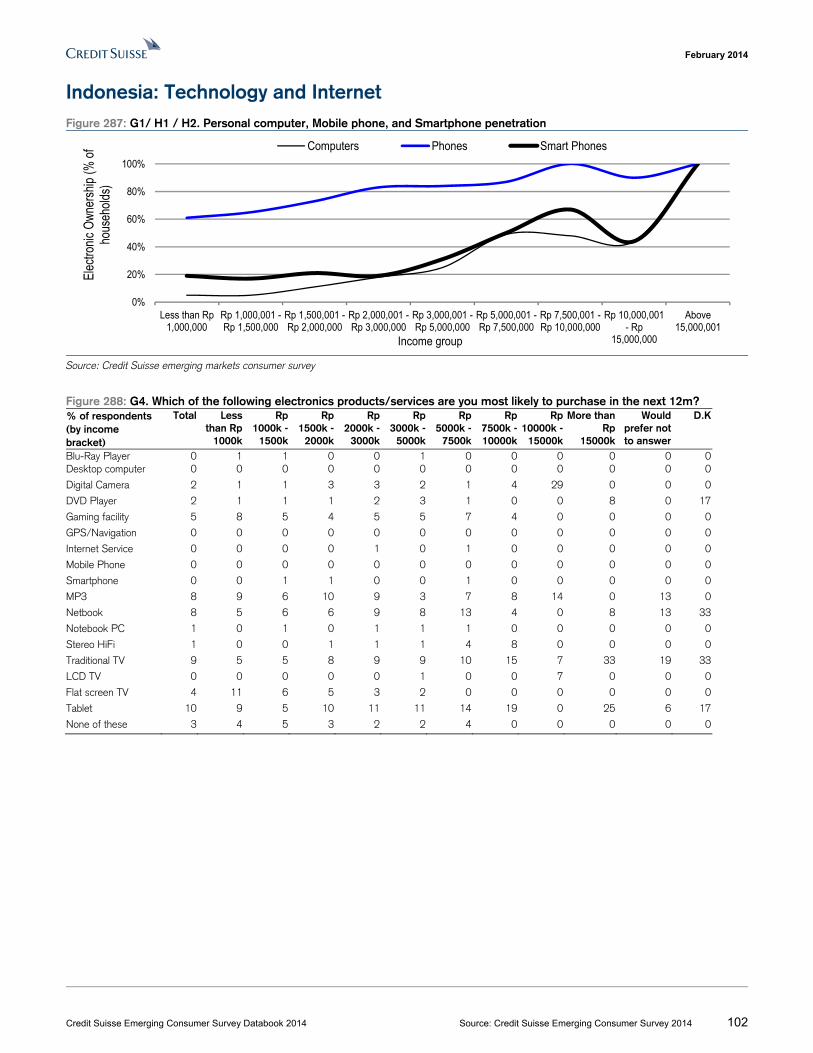
February 2014
Credit Suisse Emerging Consumer Survey Databook 2014 Source: Credit Suisse Emerging Consumer Survey 2014 102
Indonesia: Technology and Internet Figure 287: G1/ H1 / H2. Personal computer, Mobile phone, and Smartphone penetration
Source: Credit Suisse emerging markets consumer survey
Figure 288: G4. Which of the following electronics products/services are you most likely to purchase in the next 12m? % of respondents (by income bracket)
Total Less than Rp
1000k
Rp 1000k -
1500k
Rp 1500k -
2000k
Rp 2000k -
3000k
Rp 3000k -
5000k
Rp 5000k -
7500k
Rp 7500k -10000k
Rp 10000k -
15000k
More than Rp
15000k
Would prefer not to answer
D.K
Blu-Ray Player 0 1 1 0 0 1 0 0 0 0 0 0Desktop computer 0 0 0 0 0 0 0 0 0 0 0 0
Digital Camera 2 1 1 3 3 2 1 4 29 0 0 0
DVD Player 2 1 1 1 2 3 1 0 0 8 0 17
Gaming facility 5 8 5 4 5 5 7 4 0 0 0 0
GPS/Navigation 0 0 0 0 0 0 0 0 0 0 0 0
Internet Service 0 0 0 0 1 0 1 0 0 0 0 0
Mobile Phone 0 0 0 0 0 0 0 0 0 0 0 0
Smartphone 0 0 1 1 0 0 1 0 0 0 0 0
MP3 8 9 6 10 9 3 7 8 14 0 13 0
Netbook 8 5 6 6 9 8 13 4 0 8 13 33
Notebook PC 1 0 1 0 1 1 1 0 0 0 0 0
Stereo HiFi 1 0 0 1 1 1 4 8 0 0 0 0
Traditional TV 9 5 5 8 9 9 10 15 7 33 19 33
LCD TV 0 0 0 0 0 1 0 0 7 0 0 0
Flat screen TV 4 11 6 5 3 2 0 0 0 0 0 0
Tablet 10 9 5 10 11 11 14 19 0 25 6 17
None of these 3 4 5 3 2 2 4 0 0 0 0 0
0%
20%
40%
60%
80%
100%
Less than Rp1,000,000
Rp 1,000,001 -Rp 1,500,000
Rp 1,500,001 -Rp 2,000,000
Rp 2,000,001 -Rp 3,000,000
Rp 3,000,001 -Rp 5,000,000
Rp 5,000,001 -Rp 7,500,000
Rp 7,500,001 -Rp 10,000,000
Rp 10,000,001- Rp
15,000,000
Above15,000,001
Elec
troni
c O
wner
ship
(% o
f ho
useh
olds
)
Computers Phones Smart Phones
Income group
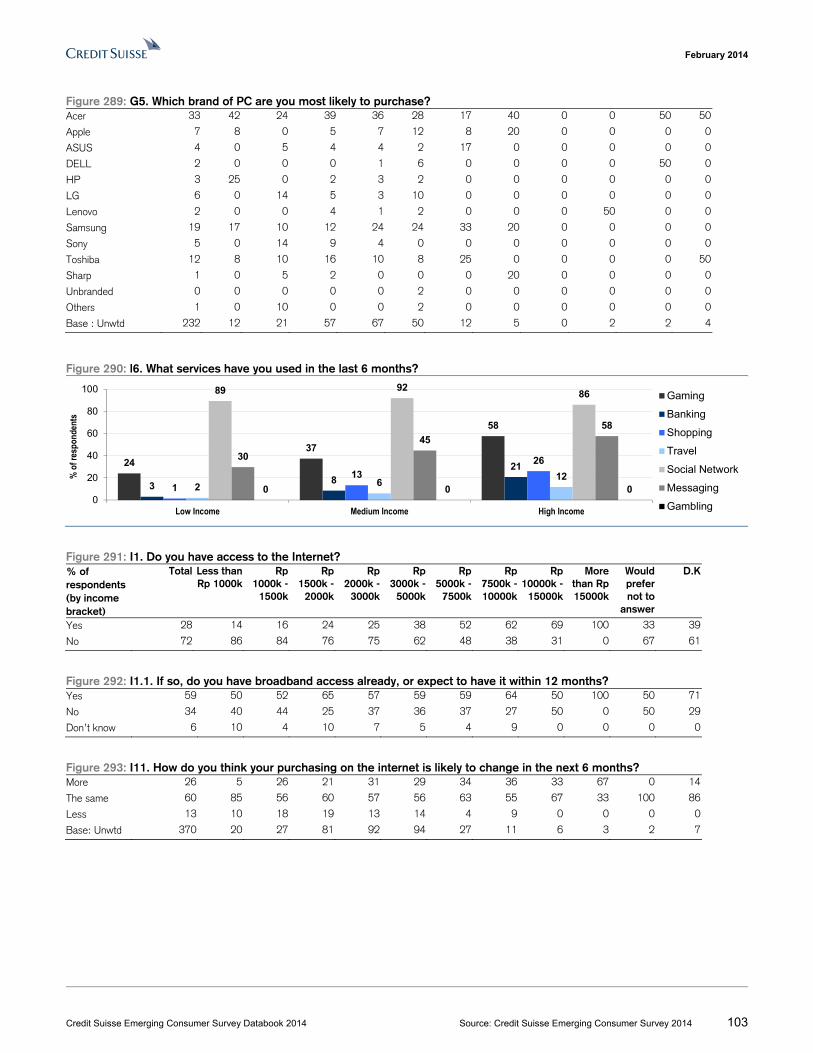
February 2014
Credit Suisse Emerging Consumer Survey Databook 2014 Source: Credit Suisse Emerging Consumer Survey 2014 103
Figure 289: G5. Which brand of PC are you most likely to purchase? Acer 33 42 24 39 36 28 17 40 0 0 50 50
Apple 7 8 0 5 7 12 8 20 0 0 0 0
ASUS 4 0 5 4 4 2 17 0 0 0 0 0
DELL 2 0 0 0 1 6 0 0 0 0 50 0
HP 3 25 0 2 3 2 0 0 0 0 0 0
LG 6 0 14 5 3 10 0 0 0 0 0 0
Lenovo 2 0 0 4 1 2 0 0 0 50 0 0
Samsung 19 17 10 12 24 24 33 20 0 0 0 0
Sony 5 0 14 9 4 0 0 0 0 0 0 0
Toshiba 12 8 10 16 10 8 25 0 0 0 0 50
Sharp 1 0 5 2 0 0 0 20 0 0 0 0
Unbranded 0 0 0 0 0 2 0 0 0 0 0 0
Others 1 0 10 0 0 2 0 0 0 0 0 0
Base : Unwtd 232 12 21 57 67 50 12 5 0 2 2 4
Figure 290: l6. What services have you used in the last 6 months?
Figure 291: I1. Do you have access to the Internet? % of respondents (by income bracket)
Total Less than Rp 1000k
Rp 1000k -
1500k
Rp 1500k -
2000k
Rp 2000k -
3000k
Rp 3000k -
5000k
Rp 5000k -
7500k
Rp 7500k -10000k
Rp 10000k -
15000k
More than Rp 15000k
Would prefer not to
answer
D.K
Yes 28 14 16 24 25 38 52 62 69 100 33 39
No 72 86 84 76 75 62 48 38 31 0 67 61
Figure 292: I1.1. If so, do you have broadband access already, or expect to have it within 12 months? Yes 59 50 52 65 57 59 59 64 50 100 50 71
No 34 40 44 25 37 36 37 27 50 0 50 29
Don’t know 6 10 4 10 7 5 4 9 0 0 0 0
Figure 293: I11. How do you think your purchasing on the internet is likely to change in the next 6 months? More 26 5 26 21 31 29 34 36 33 67 0 14
The same 60 85 56 60 57 56 63 55 67 33 100 86
Less 13 10 18 19 13 14 4 9 0 0 0 0
Base: Unwtd 370 20 27 81 92 94 27 11 6 3 2 7
24
37
58
38
21
113
26
2 612
89 9286
30
45
58
0 0 00
20
40
60
80
100
Low Income Medium Income High Income
% o
f res
pond
ents
Gaming
Banking
Shopping
Travel
Social Network
Messaging
Gambling
February 2014
Credit Suisse Emerging Consumer Survey Databook 2014 Source: Credit Suisse Emerging Consumer Survey 2014 104
Indonesia: Telecommunications Figure 294: H1. Do you currently own and use a handset for personal use? % of respondents (by income bracket)
Total Less than Rp
1000k
Rp 1000k -
1500k
Rp 1500k -
2000k
Rp 2000k -
3000k
Rp 3000k -
5000k
Rp 5000k -
7500k
Rp 7500k -10000k
Rp 10000k -
15000k
More than Rp 15000k
Would prefer not to
answer
D.K
Yes, I pay for it 70 51 57 67 75 76 85 100 80 50 100 72
Yes, employer pays 0 0 1 1 1 0 0 0 0 0 0 0
Yes, somebody else pays
7 10 7 5 7 8 2 0 10 50 0 11
No, I do not 23 39 35 27 17 16 13 0 10 0 0 17
Base : Unwtd 1,463 147 176 368 383 275 60 18 10 2 6 18
Figure 295: H3. What brand is your current mobile handset? Foreign 59 64 47 57 64 63 81 79 66 100 50 34
Nokia 33 42 29 30 40 29 29 28 44 0 33 20
Blackberry 11 8 6 11 7 16 31 28 0 50 17 7
Local 38 35 55 41 36 36 20 23 33 0 50 67
Base 1,125 89 115 269 318 232 52 18 9 2 6 15
Figure 296: H11. Do you plan to upgrade to a Smartphone in the next 12 months? Yes 52 38 40 45 54 64 59 44 67 33 80 0
No 48 63 60 55 46 36 41 56 33 67 20 100
Figure 297: H12. Which brand of Smartphone handset will you buy? Foreign 80 72 78 82 81 87 97 83 83 100 100 89
Nokia 33 29 42 39 31 30 29 17 33 50 100 22
Blackberry 22 23 20 23 24 18 23 25 50 0 0 56
Local 8 11 15 10 9 7 0 16 0 0 0 11
Don’t Know 9 16 6 9 13 6 3 0 17 0 0 0
Base 735 70 83 182 193 146 31 12 6 2 1 9
Figure 298: H13. Is your next handset likely to be a 3G handset? Yes 37 39 27 34 37 40 52 83 67 100 0 11
No 54 51 61 54 56 54 42 17 33 0 100 89
Don’t Know 8 10 12 12 6 6 6 0 0 0 0 0
Base 735 70 83 182 193 146 31 12 6 2 1 9
Figure 299: H8. How much do you spend, on average, on mobile telephone bills per month?
Source: Credit Suisse emerging markets consumer survey
7860
49 4631
2133
0
2036
43 43
48
4239
33
0
3 6 817
21
28
67
0
150 0
100
1 0 0 0 0
0%
20%
40%
60%
80%
100%
Less than Rp1,000,000
Rp 1,000,001 -Rp 1,500,000
Rp 1,500,001 -Rp 2,000,000
Rp 2,000,001 -Rp 3,000,000
Rp 3,000,001 -Rp 5,000,000
Rp 5,000,001 -Rp 7,500,000
Rp 7,500,001 -Rp 10,000,000
Rp 10,000,001 -Rp 15,000,000
Above15,000,001
% o
f res
pond
ents
Less than Rp 50,000 (50,000) Rp 50,001 – Rp 100,000 (75,000) Rp 100,001 – Rp 200,000 (150,000)Rp 200,001 – Rp 500,000 (350,000) More than Rp 500,000 (500,000)
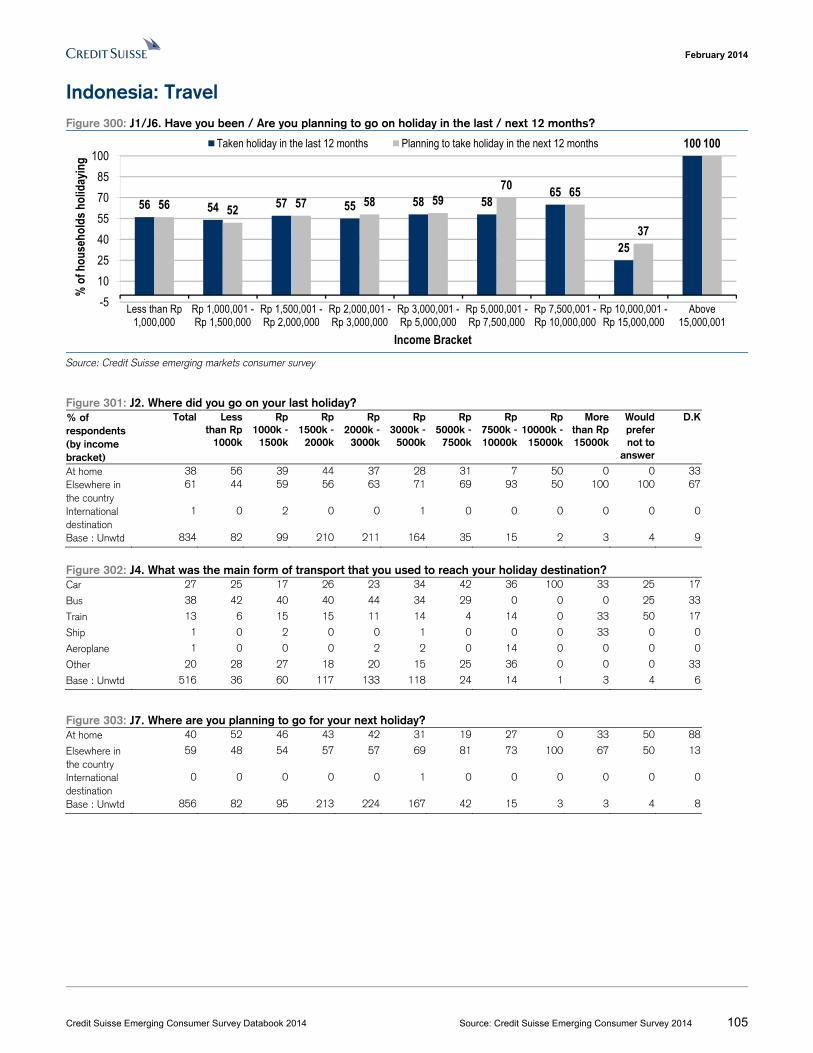
February 2014
Credit Suisse Emerging Consumer Survey Databook 2014 Source: Credit Suisse Emerging Consumer Survey 2014 105
Indonesia: Travel Figure 300: J1/J6. Have you been / Are you planning to go on holiday in the last / next 12 months?
Source: Credit Suisse emerging markets consumer survey
Figure 301: J2. Where did you go on your last holiday? % of respondents (by income bracket)
Total Less than Rp
1000k
Rp 1000k -
1500k
Rp 1500k -
2000k
Rp 2000k -
3000k
Rp 3000k -
5000k
Rp 5000k -
7500k
Rp 7500k -10000k
Rp 10000k -
15000k
More than Rp 15000k
Would prefer not to
answer
D.K
At home 38 56 39 44 37 28 31 7 50 0 0 33Elsewhere in the country
61 44 59 56 63 71 69 93 50 100 100 67
International destination
1 0 2 0 0 1 0 0 0 0 0 0
Base : Unwtd 834 82 99 210 211 164 35 15 2 3 4 9
Figure 302: J4. What was the main form of transport that you used to reach your holiday destination? Car 27 25 17 26 23 34 42 36 100 33 25 17
Bus 38 42 40 40 44 34 29 0 0 0 25 33
Train 13 6 15 15 11 14 4 14 0 33 50 17
Ship 1 0 2 0 0 1 0 0 0 33 0 0
Aeroplane 1 0 0 0 2 2 0 14 0 0 0 0
Other 20 28 27 18 20 15 25 36 0 0 0 33
Base : Unwtd 516 36 60 117 133 118 24 14 1 3 4 6
Figure 303: J7. Where are you planning to go for your next holiday? At home 40 52 46 43 42 31 19 27 0 33 50 88
Elsewhere in the country
59 48 54 57 57 69 81 73 100 67 50 13
International destination
0 0 0 0 0 1 0 0 0 0 0 0
Base : Unwtd 856 82 95 213 224 167 42 15 3 3 4 8
56 54 57 55 58 5865
25
100
56 52 57 58 5970 65
37
100
-5
10
25
40
55
70
85
100
Less than Rp1,000,000
Rp 1,000,001 -Rp 1,500,000
Rp 1,500,001 -Rp 2,000,000
Rp 2,000,001 -Rp 3,000,000
Rp 3,000,001 -Rp 5,000,000
Rp 5,000,001 -Rp 7,500,000
Rp 7,500,001 -Rp 10,000,000
Rp 10,000,001 -Rp 15,000,000
Above15,000,001
% o
f hou
seho
lds h
olid
ayin
g
Income Bracket
Taken holiday in the last 12 months Planning to take holiday in the next 12 months
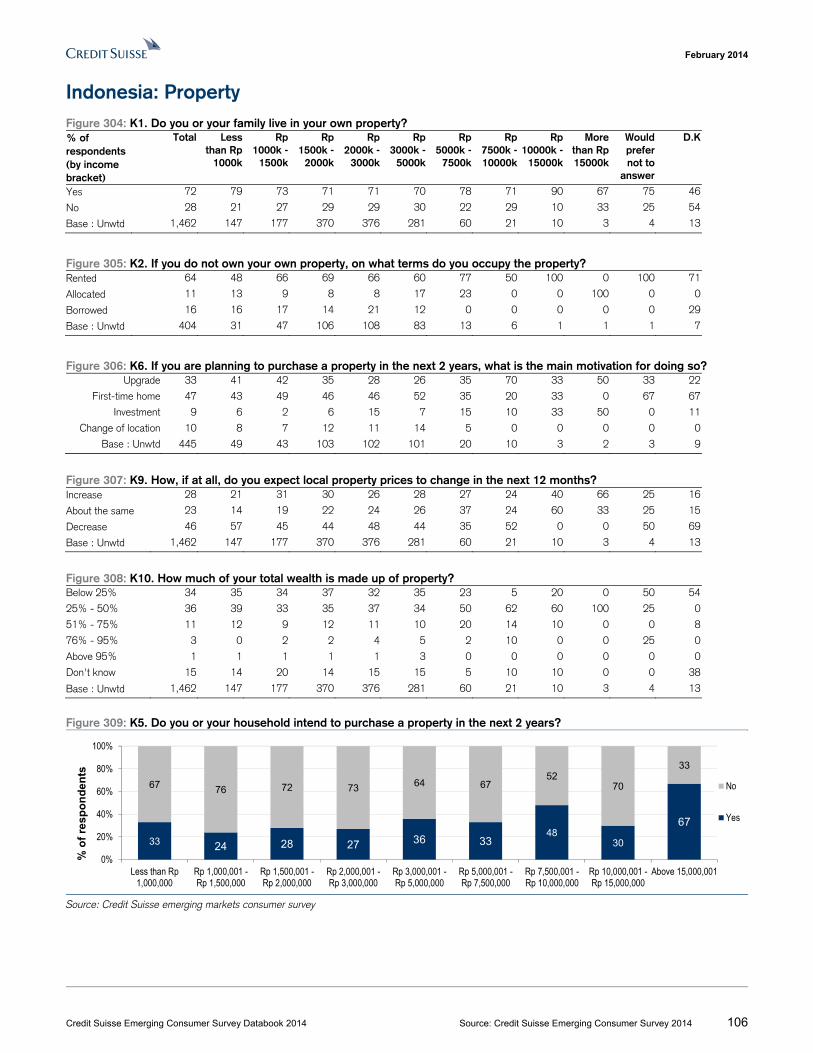
February 2014
Credit Suisse Emerging Consumer Survey Databook 2014 Source: Credit Suisse Emerging Consumer Survey 2014 106
Indonesia: Property Figure 304: K1. Do you or your family live in your own property? % of respondents (by income bracket)
Total Less than Rp
1000k
Rp 1000k -
1500k
Rp 1500k -
2000k
Rp 2000k -
3000k
Rp 3000k -
5000k
Rp 5000k -
7500k
Rp 7500k -10000k
Rp 10000k -
15000k
More than Rp 15000k
Would prefer not to
answer
D.K
Yes 72 79 73 71 71 70 78 71 90 67 75 46
No 28 21 27 29 29 30 22 29 10 33 25 54
Base : Unwtd 1,462 147 177 370 376 281 60 21 10 3 4 13
Figure 305: K2. If you do not own your own property, on what terms do you occupy the property? Rented 64 48 66 69 66 60 77 50 100 0 100 71
Allocated 11 13 9 8 8 17 23 0 0 100 0 0
Borrowed 16 16 17 14 21 12 0 0 0 0 0 29
Base : Unwtd 404 31 47 106 108 83 13 6 1 1 1 7
Figure 306: K6. If you are planning to purchase a property in the next 2 years, what is the main motivation for doing so? Upgrade 33 41 42 35 28 26 35 70 33 50 33 22
First-time home 47 43 49 46 46 52 35 20 33 0 67 67
Investment 9 6 2 6 15 7 15 10 33 50 0 11
Change of location 10 8 7 12 11 14 5 0 0 0 0 0
Base : Unwtd 445 49 43 103 102 101 20 10 3 2 3 9
Figure 307: K9. How, if at all, do you expect local property prices to change in the next 12 months? Increase 28 21 31 30 26 28 27 24 40 66 25 16
About the same 23 14 19 22 24 26 37 24 60 33 25 15
Decrease 46 57 45 44 48 44 35 52 0 0 50 69
Base : Unwtd 1,462 147 177 370 376 281 60 21 10 3 4 13
Figure 308: K10. How much of your total wealth is made up of property? Below 25% 34 35 34 37 32 35 23 5 20 0 50 54
25% - 50% 36 39 33 35 37 34 50 62 60 100 25 0
51% - 75% 11 12 9 12 11 10 20 14 10 0 0 8
76% - 95% 3 0 2 2 4 5 2 10 0 0 25 0
Above 95% 1 1 1 1 1 3 0 0 0 0 0 0
Don't know 15 14 20 14 15 15 5 10 10 0 0 38
Base : Unwtd 1,462 147 177 370 376 281 60 21 10 3 4 13
Figure 309: K5. Do you or your household intend to purchase a property in the next 2 years?
Source: Credit Suisse emerging markets consumer survey
33 24 28 27 36 3348
30
67
67 76 72 73 64 6752
70
33
0%
20%
40%
60%
80%
100%
Less than Rp1,000,000
Rp 1,000,001 -Rp 1,500,000
Rp 1,500,001 -Rp 2,000,000
Rp 2,000,001 -Rp 3,000,000
Rp 3,000,001 -Rp 5,000,000
Rp 5,000,001 -Rp 7,500,000
Rp 7,500,001 -Rp 10,000,000
Rp 10,000,001 -Rp 15,000,000
Above 15,000,001
% o
f re
sp
on
de
nts
No
Yes
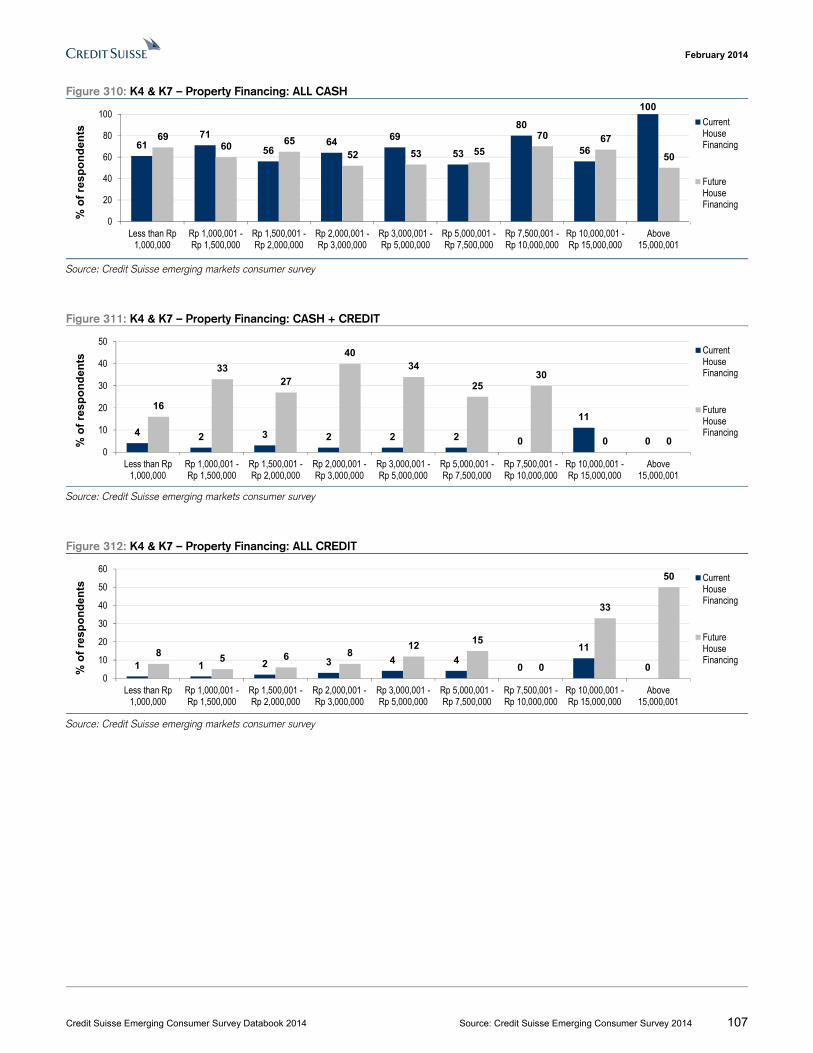
February 2014
Credit Suisse Emerging Consumer Survey Databook 2014 Source: Credit Suisse Emerging Consumer Survey 2014 107
Figure 310: K4 & K7 – Property Financing: ALL CASH
Source: Credit Suisse emerging markets consumer survey
Figure 311: K4 & K7 – Property Financing: CASH + CREDIT
Source: Credit Suisse emerging markets consumer survey
Figure 312: K4 & K7 – Property Financing: ALL CREDIT
Source: Credit Suisse emerging markets consumer survey
6171
5664 69
53
80
56
100
6960 65
52 53 55
70 67
50
0
20
40
60
80
100
Less than Rp1,000,000
Rp 1,000,001 -Rp 1,500,000
Rp 1,500,001 -Rp 2,000,000
Rp 2,000,001 -Rp 3,000,000
Rp 3,000,001 -Rp 5,000,000
Rp 5,000,001 -Rp 7,500,000
Rp 7,500,001 -Rp 10,000,000
Rp 10,000,001 -Rp 15,000,000
Above15,000,001
% o
f re
sp
on
de
nts
CurrentHouseFinancing
FutureHouseFinancing
4 2 3 2 2 2 0
11
0
16
3327
4034
2530
0 00
10
20
30
40
50
Less than Rp1,000,000
Rp 1,000,001 -Rp 1,500,000
Rp 1,500,001 -Rp 2,000,000
Rp 2,000,001 -Rp 3,000,000
Rp 3,000,001 -Rp 5,000,000
Rp 5,000,001 -Rp 7,500,000
Rp 7,500,001 -Rp 10,000,000
Rp 10,000,001 -Rp 15,000,000
Above15,000,001
% o
f re
sp
on
de
nts
CurrentHouseFinancing
FutureHouseFinancing
1 1 2 3 4 40
11
0
8 5 6 812 15
0
33
50
0
10
20
30
40
50
60
Less than Rp1,000,000
Rp 1,000,001 -Rp 1,500,000
Rp 1,500,001 -Rp 2,000,000
Rp 2,000,001 -Rp 3,000,000
Rp 3,000,001 -Rp 5,000,000
Rp 5,000,001 -Rp 7,500,000
Rp 7,500,001 -Rp 10,000,000
Rp 10,000,001 -Rp 15,000,000
Above15,000,001
% o
f re
sp
on
de
nts
CurrentHouseFinancing
FutureHouseFinancing
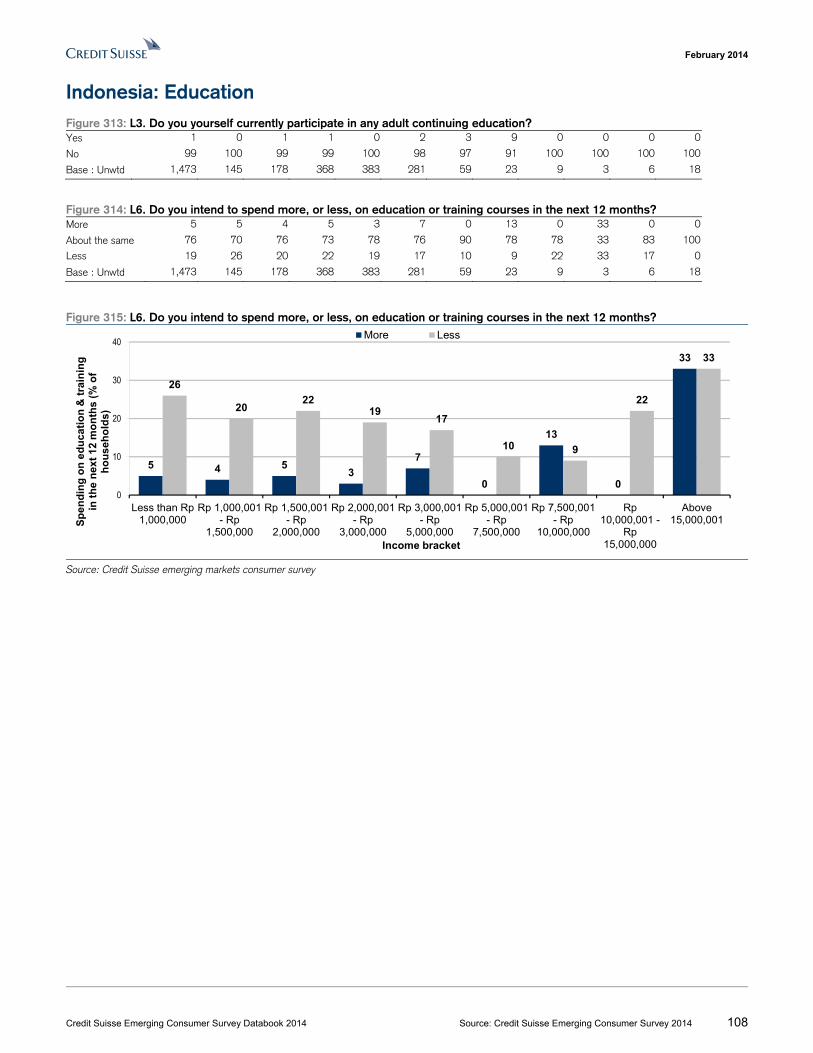
February 2014
Credit Suisse Emerging Consumer Survey Databook 2014 Source: Credit Suisse Emerging Consumer Survey 2014 108
Indonesia: Education Figure 313: L3. Do you yourself currently participate in any adult continuing education? Yes 1 0 1 1 0 2 3 9 0 0 0 0
No 99 100 99 99 100 98 97 91 100 100 100 100
Base : Unwtd 1,473 145 178 368 383 281 59 23 9 3 6 18
Figure 314: L6. Do you intend to spend more, or less, on education or training courses in the next 12 months? More 5 5 4 5 3 7 0 13 0 33 0 0
About the same 76 70 76 73 78 76 90 78 78 33 83 100
Less 19 26 20 22 19 17 10 9 22 33 17 0
Base : Unwtd 1,473 145 178 368 383 281 59 23 9 3 6 18
Figure 315: L6. Do you intend to spend more, or less, on education or training courses in the next 12 months?
Source: Credit Suisse emerging markets consumer survey
5 4 53
7
0
13
0
33
26
2022
1917
10 9
22
33
0
10
20
30
40
Less than Rp1,000,000
Rp 1,000,001- Rp
1,500,000
Rp 1,500,001- Rp
2,000,000
Rp 2,000,001- Rp
3,000,000
Rp 3,000,001- Rp
5,000,000
Rp 5,000,001- Rp
7,500,000
Rp 7,500,001- Rp
10,000,000
Rp10,000,001 -
Rp15,000,000
Above15,000,001S
pe
nd
ing
on
ed
uca
tio
n &
tra
inin
g
in t
he
nex
t 1
2 m
on
ths
(% o
f h
ou
seh
old
s)
Income bracket
More Less
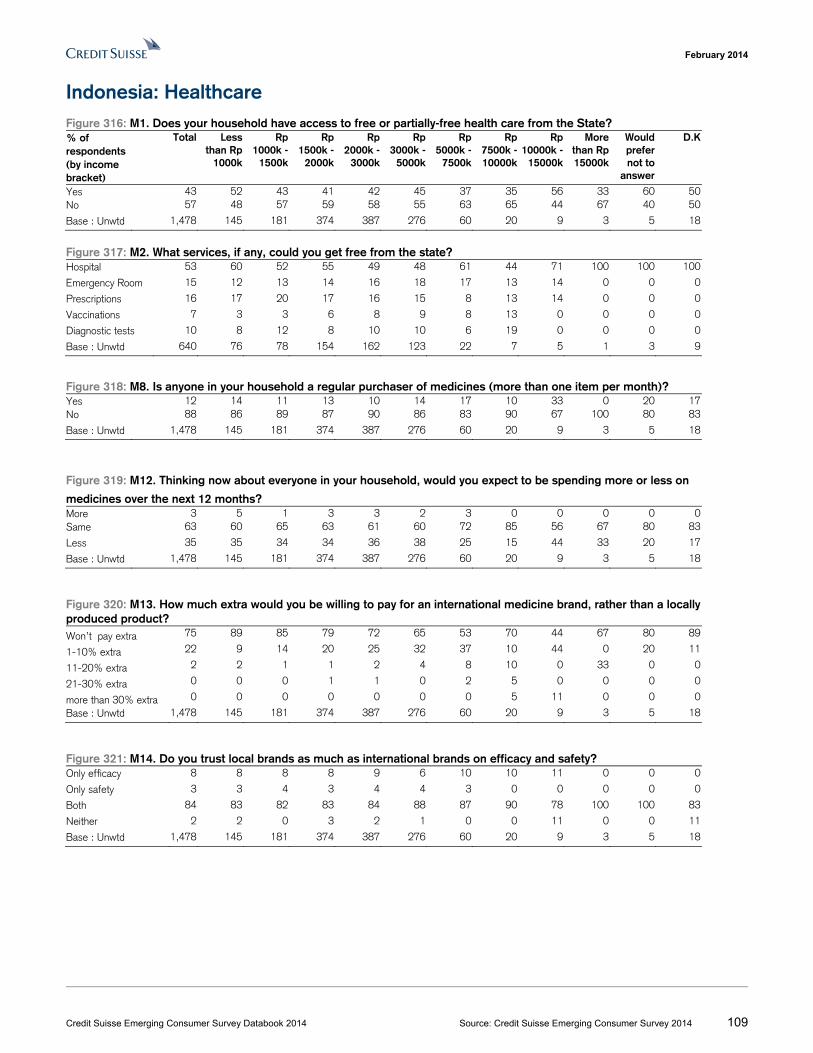
February 2014
Credit Suisse Emerging Consumer Survey Databook 2014 Source: Credit Suisse Emerging Consumer Survey 2014 109
Indonesia: Healthcare Figure 316: M1. Does your household have access to free or partially-free health care from the State? % of respondents (by income bracket)
Total Less than Rp
1000k
Rp 1000k -
1500k
Rp 1500k -
2000k
Rp 2000k -
3000k
Rp 3000k -
5000k
Rp 5000k -
7500k
Rp 7500k -10000k
Rp 10000k -
15000k
More than Rp 15000k
Would prefer not to
answer
D.K
Yes 43 52 43 41 42 45 37 35 56 33 60 50No 57 48 57 59 58 55 63 65 44 67 40 50
Base : Unwtd 1,478 145 181 374 387 276 60 20 9 3 5 18
Figure 317: M2. What services, if any, could you get free from the state? Hospital 53 60 52 55 49 48 61 44 71 100 100 100
Emergency Room 15 12 13 14 16 18 17 13 14 0 0 0
Prescriptions 16 17 20 17 16 15 8 13 14 0 0 0
Vaccinations 7 3 3 6 8 9 8 13 0 0 0 0
Diagnostic tests 10 8 12 8 10 10 6 19 0 0 0 0
Base : Unwtd 640 76 78 154 162 123 22 7 5 1 3 9
Figure 318: M8. Is anyone in your household a regular purchaser of medicines (more than one item per month)? Yes 12 14 11 13 10 14 17 10 33 0 20 17No 88 86 89 87 90 86 83 90 67 100 80 83
Base : Unwtd 1,478 145 181 374 387 276 60 20 9 3 5 18
Figure 319: M12. Thinking now about everyone in your household, would you expect to be spending more or less on
medicines over the next 12 months? More 3 5 1 3 3 2 3 0 0 0 0 0Same 63 60 65 63 61 60 72 85 56 67 80 83
Less 35 35 34 34 36 38 25 15 44 33 20 17
Base : Unwtd 1,478 145 181 374 387 276 60 20 9 3 5 18
Figure 320: M13. How much extra would you be willing to pay for an international medicine brand, rather than a locally produced product? Won’t pay extra 75 89 85 79 72 65 53 70 44 67 80 89
1-10% extra 22 9 14 20 25 32 37 10 44 0 20 11
11-20% extra 2 2 1 1 2 4 8 10 0 33 0 0
21-30% extra 0 0 0 1 1 0 2 5 0 0 0 0
more than 30% extra 0 0 0 0 0 0 0 5 11 0 0 0
Base : Unwtd 1,478 145 181 374 387 276 60 20 9 3 5 18
Figure 321: M14. Do you trust local brands as much as international brands on efficacy and safety? Only efficacy 8 8 8 8 9 6 10 10 11 0 0 0
Only safety 3 3 4 3 4 4 3 0 0 0 0 0
Both 84 83 82 83 84 88 87 90 78 100 100 83
Neither 2 2 0 3 2 1 0 0 11 0 0 11
Base : Unwtd 1,478 145 181 374 387 276 60 20 9 3 5 18
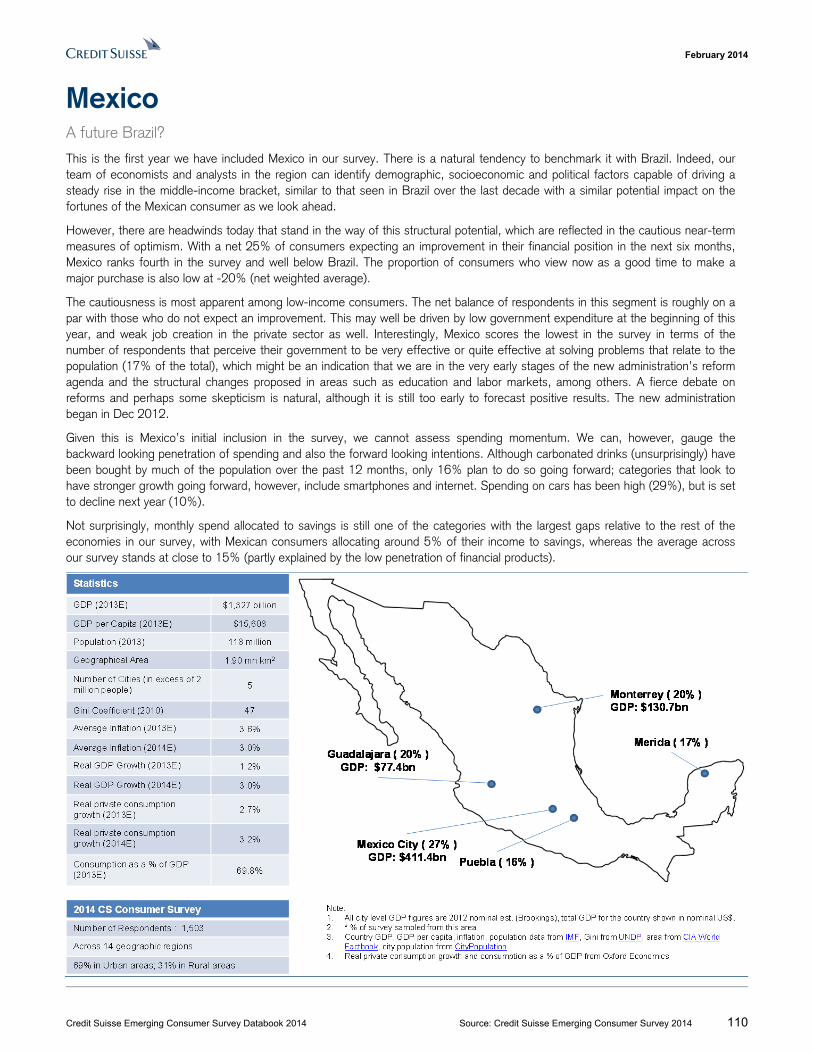
February 2014
Credit Suisse Emerging Consumer Survey Databook 2014 Source: Credit Suisse Emerging Consumer Survey 2014 110
Mexico A future Brazil?
This is the first year we have included Mexico in our survey. There is a natural tendency to benchmark it with Brazil. Indeed, our team of economists and analysts in the region can identify demographic, socioeconomic and political factors capable of driving a steady rise in the middle-income bracket, similar to that seen in Brazil over the last decade with a similar potential impact on the fortunes of the Mexican consumer as we look ahead.
However, there are headwinds today that stand in the way of this structural potential, which are reflected in the cautious near-term measures of optimism. With a net 25% of consumers expecting an improvement in their financial position in the next six months, Mexico ranks fourth in the survey and well below Brazil. The proportion of consumers who view now as a good time to make a major purchase is also low at -20% (net weighted average).
The cautiousness is most apparent among low-income consumers. The net balance of respondents in this segment is roughly on a par with those who do not expect an improvement. This may well be driven by low government expenditure at the beginning of this year, and weak job creation in the private sector as well. Interestingly, Mexico scores the lowest in the survey in terms of the number of respondents that perceive their government to be very effective or quite effective at solving problems that relate to the population (17% of the total), which might be an indication that we are in the very early stages of the new administration’s reform agenda and the structural changes proposed in areas such as education and labor markets, among others. A fierce debate on reforms and perhaps some skepticism is natural, although it is still too early to forecast positive results. The new administration began in Dec 2012.
Given this is Mexico’s initial inclusion in the survey, we cannot assess spending momentum. We can, however, gauge the backward looking penetration of spending and also the forward looking intentions. Although carbonated drinks (unsurprisingly) have been bought by much of the population over the past 12 months, only 16% plan to do so going forward; categories that look to have stronger growth going forward, however, include smartphones and internet. Spending on cars has been high (29%), but is set to decline next year (10%).
Not surprisingly, monthly spend allocated to savings is still one of the categories with the largest gaps relative to the rest of the economies in our survey, with Mexican consumers allocating around 5% of their income to savings, whereas the average across our survey stands at close to 15% (partly explained by the low penetration of financial products).
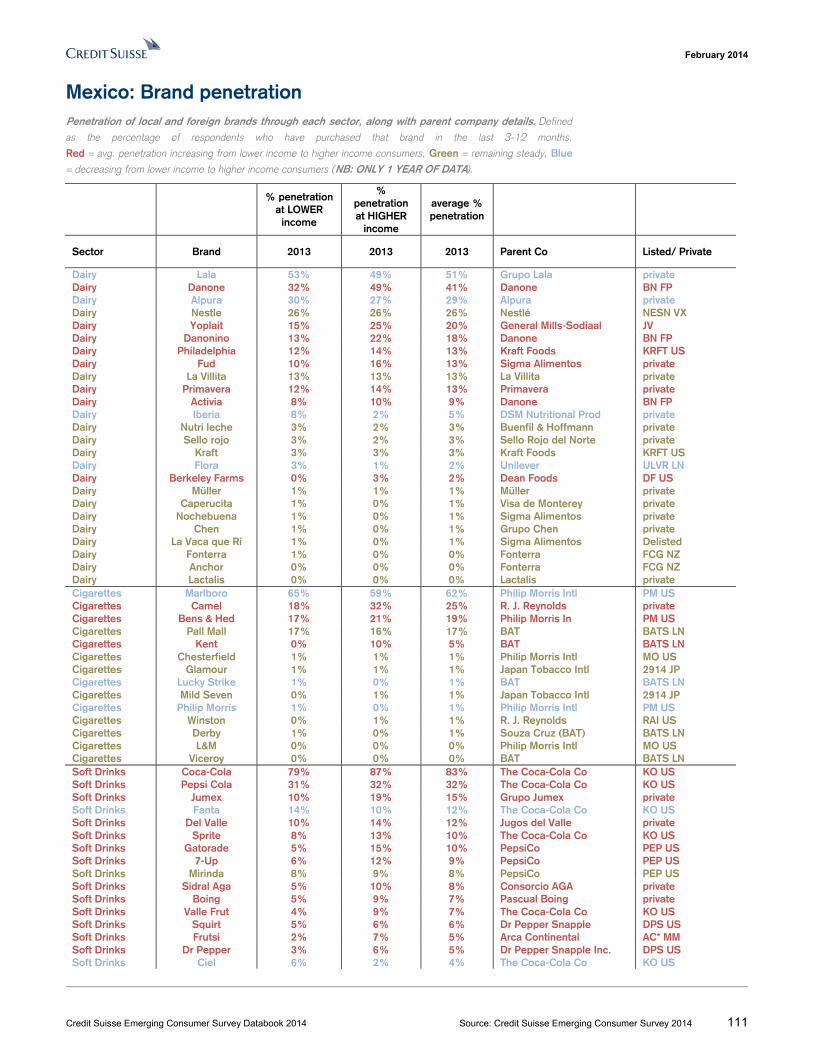
February 2014
Credit Suisse Emerging Consumer Survey Databook 2014 Source: Credit Suisse Emerging Consumer Survey 2014 111
Mexico: Brand penetration Penetration of local and foreign brands through each sector, along with parent company details. Defined
as the percentage of respondents who have purchased that brand in the last 3-12 months.
Red = avg. penetration increasing from lower income to higher income consumers, Green = remaining steady, Blue
= decreasing from lower income to higher income consumers (NB: ONLY 1 YEAR OF DATA).
% penetration
at LOWER income
% penetration at HIGHER
income
average % penetration
Sector Brand 2013 2013 2013 Parent Co Listed/ Private
Dairy Lala 53% 49% 51% Grupo Lala private Dairy Danone 32% 49% 41% Danone BN FP Dairy Alpura 30% 27% 29% Alpura private Dairy Nestle 26% 26% 26% Nestlé NESN VX Dairy Yoplait 15% 25% 20% General Mills-Sodiaal JV Dairy Danonino 13% 22% 18% Danone BN FP Dairy Philadelphia 12% 14% 13% Kraft Foods KRFT US Dairy Fud 10% 16% 13% Sigma Alimentos private Dairy La Villita 13% 13% 13% La Villita private Dairy Primavera 12% 14% 13% Primavera private Dairy Activia 8% 10% 9% Danone BN FP Dairy Iberia 8% 2% 5% DSM Nutritional Prod private Dairy Nutri leche 3% 2% 3% Buenfil & Hoffmann private Dairy Sello rojo 3% 2% 3% Sello Rojo del Norte private Dairy Kraft 3% 3% 3% Kraft Foods KRFT US Dairy Flora 3% 1% 2% Unilever ULVR LN Dairy Berkeley Farms 0% 3% 2% Dean Foods DF US Dairy Müller 1% 1% 1% Müller private Dairy Caperucita 1% 0% 1% Visa de Monterey private Dairy Nochebuena 1% 0% 1% Sigma Alimentos private Dairy Chen 1% 0% 1% Grupo Chen private Dairy La Vaca que Ri 1% 0% 1% Sigma Alimentos Delisted Dairy Fonterra 1% 0% 0% Fonterra FCG NZ Dairy Anchor 0% 0% 0% Fonterra FCG NZ Dairy Lactalis 0% 0% 0% Lactalis private Cigarettes Marlboro 65% 59% 62% Philip Morris Intl PM US Cigarettes Camel 18% 32% 25% R. J. Reynolds private Cigarettes Bens & Hed 17% 21% 19% Philip Morris In PM US Cigarettes Pall Mall 17% 16% 17% BAT BATS LN Cigarettes Kent 0% 10% 5% BAT BATS LN Cigarettes Chesterfield 1% 1% 1% Philip Morris Intl MO US Cigarettes Glamour 1% 1% 1% Japan Tobacco Intl 2914 JP Cigarettes Lucky Strike 1% 0% 1% BAT BATS LN Cigarettes Mild Seven 0% 1% 1% Japan Tobacco Intl 2914 JP Cigarettes Philip Morris 1% 0% 1% Philip Morris Intl PM US Cigarettes Winston 0% 1% 1% R. J. Reynolds RAI US Cigarettes Derby 1% 0% 1% Souza Cruz (BAT) BATS LN Cigarettes L&M 0% 0% 0% Philip Morris Intl MO US Cigarettes Viceroy 0% 0% 0% BAT BATS LN Soft Drinks Coca-Cola 79% 87% 83% The Coca-Cola Co KO US Soft Drinks Pepsi Cola 31% 32% 32% The Coca-Cola Co KO US Soft Drinks Jumex 10% 19% 15% Grupo Jumex private Soft Drinks Fanta 14% 10% 12% The Coca-Cola Co KO US Soft Drinks Del Valle 10% 14% 12% Jugos del Valle private Soft Drinks Sprite 8% 13% 10% The Coca-Cola Co KO US Soft Drinks Gatorade 5% 15% 10% PepsiCo PEP US Soft Drinks 7-Up 6% 12% 9% PepsiCo PEP US Soft Drinks Mirinda 8% 9% 8% PepsiCo PEP US Soft Drinks Sidral Aga 5% 10% 8% Consorcio AGA private Soft Drinks Boing 5% 9% 7% Pascual Boing private Soft Drinks Valle Frut 4% 9% 7% The Coca-Cola Co KO US Soft Drinks Squirt 5% 6% 6% Dr Pepper Snapple DPS US Soft Drinks Frutsi 2% 7% 5% Arca Continental AC* MM Soft Drinks Dr Pepper 3% 6% 5% Dr Pepper Snapple Inc. DPS US Soft Drinks Ciel 6% 2% 4% The Coca-Cola Co KO US
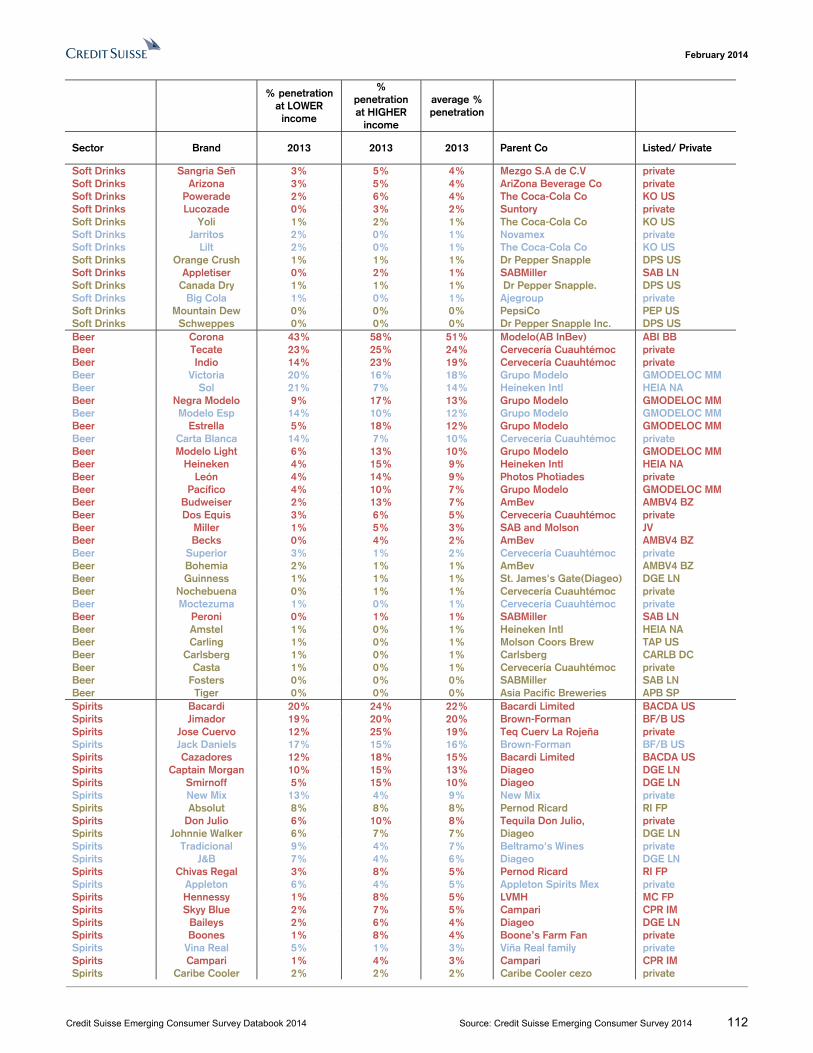
February 2014
Credit Suisse Emerging Consumer Survey Databook 2014 Source: Credit Suisse Emerging Consumer Survey 2014 112
% penetration
at LOWER income
% penetration at HIGHER
income
average % penetration
Sector Brand 2013 2013 2013 Parent Co Listed/ Private
Soft Drinks Sangria Señ 3% 5% 4% Mezgo S.A de C.V private Soft Drinks Arizona 3% 5% 4% AriZona Beverage Co private Soft Drinks Powerade 2% 6% 4% The Coca-Cola Co KO US Soft Drinks Lucozade 0% 3% 2% Suntory private Soft Drinks Yoli 1% 2% 1% The Coca-Cola Co KO US Soft Drinks Jarritos 2% 0% 1% Novamex private Soft Drinks Lilt 2% 0% 1% The Coca-Cola Co KO US Soft Drinks Orange Crush 1% 1% 1% Dr Pepper Snapple DPS US Soft Drinks Appletiser 0% 2% 1% SABMiller SAB LN Soft Drinks Canada Dry 1% 1% 1% Dr Pepper Snapple. DPS US Soft Drinks Big Cola 1% 0% 1% Ajegroup private Soft Drinks Mountain Dew 0% 0% 0% PepsiCo PEP US Soft Drinks Schweppes 0% 0% 0% Dr Pepper Snapple Inc. DPS US Beer Corona 43% 58% 51% Modelo(AB InBev) ABI BB Beer Tecate 23% 25% 24% Cervecería Cuauhtémoc private Beer Indio 14% 23% 19% Cervecería Cuauhtémoc private Beer Victoria 20% 16% 18% Grupo Modelo GMODELOC MM Beer Sol 21% 7% 14% Heineken Intl HEIA NA Beer Negra Modelo 9% 17% 13% Grupo Modelo GMODELOC MM Beer Modelo Esp 14% 10% 12% Grupo Modelo GMODELOC MM Beer Estrella 5% 18% 12% Grupo Modelo GMODELOC MM Beer Carta Blanca 14% 7% 10% Cervecería Cuauhtémoc private Beer Modelo Light 6% 13% 10% Grupo Modelo GMODELOC MM Beer Heineken 4% 15% 9% Heineken Intl HEIA NA Beer León 4% 14% 9% Photos Photiades private Beer Pacífico 4% 10% 7% Grupo Modelo GMODELOC MM Beer Budweiser 2% 13% 7% AmBev AMBV4 BZ Beer Dos Equis 3% 6% 5% Cervecería Cuauhtémoc private Beer Miller 1% 5% 3% SAB and Molson JV Beer Becks 0% 4% 2% AmBev AMBV4 BZ Beer Superior 3% 1% 2% Cervecería Cuauhtémoc private Beer Bohemia 2% 1% 1% AmBev AMBV4 BZ Beer Guinness 1% 1% 1% St. James's Gate(Diageo) DGE LN Beer Nochebuena 0% 1% 1% Cervecería Cuauhtémoc private Beer Moctezuma 1% 0% 1% Cervecería Cuauhtémoc private Beer Peroni 0% 1% 1% SABMiller SAB LN Beer Amstel 1% 0% 1% Heineken Intl HEIA NA Beer Carling 1% 0% 1% Molson Coors Brew TAP US Beer Carlsberg 1% 0% 1% Carlsberg CARLB DC Beer Casta 1% 0% 1% Cervecería Cuauhtémoc private Beer Fosters 0% 0% 0% SABMiller SAB LN Beer Tiger 0% 0% 0% Asia Pacific Breweries APB SP Spirits Bacardi 20% 24% 22% Bacardi Limited BACDA US Spirits Jimador 19% 20% 20% Brown-Forman BF/B US Spirits Jose Cuervo 12% 25% 19% Teq Cuerv La Rojeña private Spirits Jack Daniels 17% 15% 16% Brown-Forman BF/B US Spirits Cazadores 12% 18% 15% Bacardi Limited BACDA US Spirits Captain Morgan 10% 15% 13% Diageo DGE LN Spirits Smirnoff 5% 15% 10% Diageo DGE LN Spirits New Mix 13% 4% 9% New Mix private Spirits Absolut 8% 8% 8% Pernod Ricard RI FP Spirits Don Julio 6% 10% 8% Tequila Don Julio, private Spirits Johnnie Walker 6% 7% 7% Diageo DGE LN Spirits Tradicional 9% 4% 7% Beltramo's Wines private Spirits J&B 7% 4% 6% Diageo DGE LN Spirits Chivas Regal 3% 8% 5% Pernod Ricard RI FP Spirits Appleton 6% 4% 5% Appleton Spirits Mex private Spirits Hennessy 1% 8% 5% LVMH MC FP Spirits Skyy Blue 2% 7% 5% Campari CPR IM Spirits Baileys 2% 6% 4% Diageo DGE LN Spirits Boones 1% 8% 4% Boone’s Farm Fan private Spirits Vina Real 5% 1% 3% Viña Real family private Spirits Campari 1% 4% 3% Campari CPR IM Spirits Caribe Cooler 2% 2% 2% Caribe Cooler cezo private
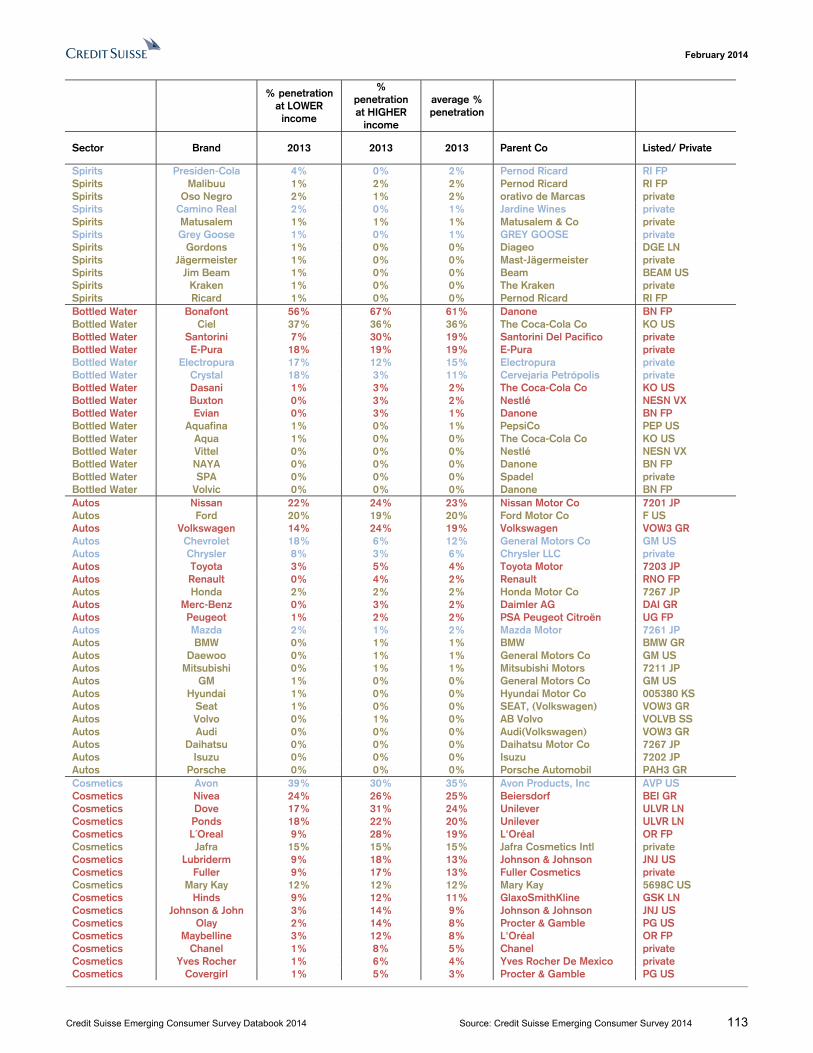
February 2014
Credit Suisse Emerging Consumer Survey Databook 2014 Source: Credit Suisse Emerging Consumer Survey 2014 113
% penetration
at LOWER income
% penetration at HIGHER
income
average % penetration
Sector Brand 2013 2013 2013 Parent Co Listed/ Private
Spirits Presiden-Cola 4% 0% 2% Pernod Ricard RI FP Spirits Malibuu 1% 2% 2% Pernod Ricard RI FP Spirits Oso Negro 2% 1% 2% orativo de Marcas private Spirits Camino Real 2% 0% 1% Jardine Wines private Spirits Matusalem 1% 1% 1% Matusalem & Co private Spirits Grey Goose 1% 0% 1% GREY GOOSE private Spirits Gordons 1% 0% 0% Diageo DGE LN Spirits Jägermeister 1% 0% 0% Mast-Jägermeister private Spirits Jim Beam 1% 0% 0% Beam BEAM US Spirits Kraken 1% 0% 0% The Kraken private Spirits Ricard 1% 0% 0% Pernod Ricard RI FP Bottled Water Bonafont 56% 67% 61% Danone BN FP Bottled Water Ciel 37% 36% 36% The Coca-Cola Co KO US Bottled Water Santorini 7% 30% 19% Santorini Del Pacifico private Bottled Water E-Pura 18% 19% 19% E-Pura private Bottled Water Electropura 17% 12% 15% Electropura private Bottled Water Crystal 18% 3% 11% Cervejaria Petrópolis private Bottled Water Dasani 1% 3% 2% The Coca-Cola Co KO US Bottled Water Buxton 0% 3% 2% Nestlé NESN VX Bottled Water Evian 0% 3% 1% Danone BN FP Bottled Water Aquafina 1% 0% 1% PepsiCo PEP US Bottled Water Aqua 1% 0% 0% The Coca-Cola Co KO US Bottled Water Vittel 0% 0% 0% Nestlé NESN VX Bottled Water NAYA 0% 0% 0% Danone BN FP Bottled Water SPA 0% 0% 0% Spadel private Bottled Water Volvic 0% 0% 0% Danone BN FP Autos Nissan 22% 24% 23% Nissan Motor Co 7201 JP Autos Ford 20% 19% 20% Ford Motor Co F US Autos Volkswagen 14% 24% 19% Volkswagen VOW3 GR Autos Chevrolet 18% 6% 12% General Motors Co GM US Autos Chrysler 8% 3% 6% Chrysler LLC private Autos Toyota 3% 5% 4% Toyota Motor 7203 JP Autos Renault 0% 4% 2% Renault RNO FP Autos Honda 2% 2% 2% Honda Motor Co 7267 JP Autos Merc-Benz 0% 3% 2% Daimler AG DAI GR Autos Peugeot 1% 2% 2% PSA Peugeot Citroën UG FP Autos Mazda 2% 1% 2% Mazda Motor 7261 JP Autos BMW 0% 1% 1% BMW BMW GR Autos Daewoo 0% 1% 1% General Motors Co GM US Autos Mitsubishi 0% 1% 1% Mitsubishi Motors 7211 JP Autos GM 1% 0% 0% General Motors Co GM US Autos Hyundai 1% 0% 0% Hyundai Motor Co 005380 KS Autos Seat 1% 0% 0% SEAT, (Volkswagen) VOW3 GR Autos Volvo 0% 1% 0% AB Volvo VOLVB SS Autos Audi 0% 0% 0% Audi(Volkswagen) VOW3 GR Autos Daihatsu 0% 0% 0% Daihatsu Motor Co 7267 JP Autos Isuzu 0% 0% 0% Isuzu 7202 JP Autos Porsche 0% 0% 0% Porsche Automobil PAH3 GR Cosmetics Avon 39% 30% 35% Avon Products, Inc AVP US Cosmetics Nivea 24% 26% 25% Beiersdorf BEI GR Cosmetics Dove 17% 31% 24% Unilever ULVR LN Cosmetics Ponds 18% 22% 20% Unilever ULVR LN Cosmetics L´Oreal 9% 28% 19% L'Oréal OR FP Cosmetics Jafra 15% 15% 15% Jafra Cosmetics Intl private Cosmetics Lubriderm 9% 18% 13% Johnson & Johnson JNJ US Cosmetics Fuller 9% 17% 13% Fuller Cosmetics private Cosmetics Mary Kay 12% 12% 12% Mary Kay 5698C US Cosmetics Hinds 9% 12% 11% GlaxoSmithKline GSK LN Cosmetics Johnson & John 3% 14% 9% Johnson & Johnson JNJ US Cosmetics Olay 2% 14% 8% Procter & Gamble PG US Cosmetics Maybelline 3% 12% 8% L'Oréal OR FP Cosmetics Chanel 1% 8% 5% Chanel private Cosmetics Yves Rocher 1% 6% 4% Yves Rocher De Mexico private Cosmetics Covergirl 1% 5% 3% Procter & Gamble PG US
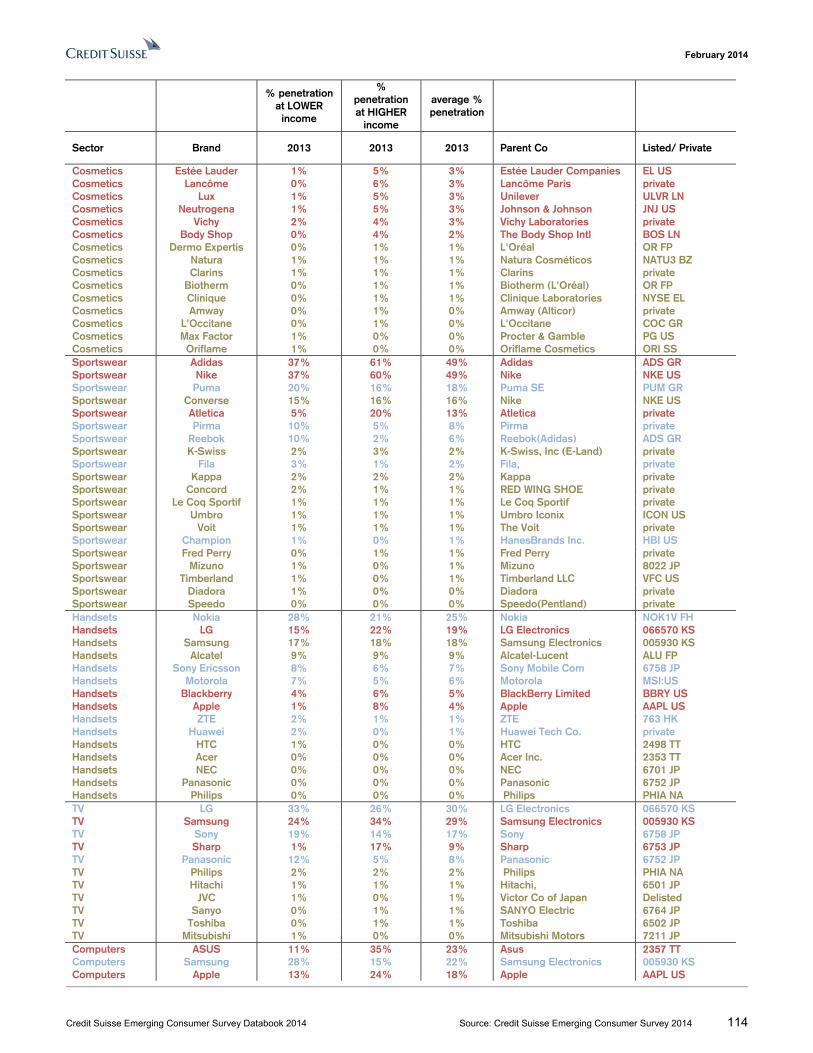
February 2014
Credit Suisse Emerging Consumer Survey Databook 2014 Source: Credit Suisse Emerging Consumer Survey 2014 114
% penetration
at LOWER income
% penetration at HIGHER
income
average % penetration
Sector Brand 2013 2013 2013 Parent Co Listed/ Private
Cosmetics Estée Lauder 1% 5% 3% Estée Lauder Companies EL US Cosmetics Lancôme 0% 6% 3% Lancôme Paris private Cosmetics Lux 1% 5% 3% Unilever ULVR LN Cosmetics Neutrogena 1% 5% 3% Johnson & Johnson JNJ US Cosmetics Vichy 2% 4% 3% Vichy Laboratories private Cosmetics Body Shop 0% 4% 2% The Body Shop Intl BOS LN Cosmetics Dermo Expertis 0% 1% 1% L'Oréal OR FP Cosmetics Natura 1% 1% 1% Natura Cosméticos NATU3 BZ Cosmetics Clarins 1% 1% 1% Clarins private Cosmetics Biotherm 0% 1% 1% Biotherm (L'Oréal) OR FP Cosmetics Clinique 0% 1% 1% Clinique Laboratories NYSE EL Cosmetics Amway 0% 1% 0% Amway (Alticor) private Cosmetics L’Occitane 0% 1% 0% L'Occitane COC GR Cosmetics Max Factor 1% 0% 0% Procter & Gamble PG US Cosmetics Oriflame 1% 0% 0% Oriflame Cosmetics ORI SS Sportswear Adidas 37% 61% 49% Adidas ADS GR Sportswear Nike 37% 60% 49% Nike NKE US Sportswear Puma 20% 16% 18% Puma SE PUM GR Sportswear Converse 15% 16% 16% Nike NKE US Sportswear Atletica 5% 20% 13% Atletica private Sportswear Pirma 10% 5% 8% Pirma private Sportswear Reebok 10% 2% 6% Reebok(Adidas) ADS GR Sportswear K-Swiss 2% 3% 2% K-Swiss, Inc (E-Land) private Sportswear Fila 3% 1% 2% Fila, private Sportswear Kappa 2% 2% 2% Kappa private Sportswear Concord 2% 1% 1% RED WING SHOE private Sportswear Le Coq Sportif 1% 1% 1% Le Coq Sportif private Sportswear Umbro 1% 1% 1% Umbro Iconix ICON US Sportswear Voit 1% 1% 1% The Voit private Sportswear Champion 1% 0% 1% HanesBrands Inc. HBI US Sportswear Fred Perry 0% 1% 1% Fred Perry private Sportswear Mizuno 1% 0% 1% Mizuno 8022 JP Sportswear Timberland 1% 0% 1% Timberland LLC VFC US Sportswear Diadora 1% 0% 0% Diadora private Sportswear Speedo 0% 0% 0% Speedo(Pentland) private Handsets Nokia 28% 21% 25% Nokia NOK1V FH Handsets LG 15% 22% 19% LG Electronics 066570 KS Handsets Samsung 17% 18% 18% Samsung Electronics 005930 KS Handsets Alcatel 9% 9% 9% Alcatel-Lucent ALU FP Handsets Sony Ericsson 8% 6% 7% Sony Mobile Com 6758 JP Handsets Motorola 7% 5% 6% Motorola MSI:US Handsets Blackberry 4% 6% 5% BlackBerry Limited BBRY US Handsets Apple 1% 8% 4% Apple AAPL US Handsets ZTE 2% 1% 1% ZTE 763 HK Handsets Huawei 2% 0% 1% Huawei Tech Co. private Handsets HTC 1% 0% 0% HTC 2498 TT Handsets Acer 0% 0% 0% Acer Inc. 2353 TT Handsets NEC 0% 0% 0% NEC 6701 JP Handsets Panasonic 0% 0% 0% Panasonic 6752 JP Handsets Philips 0% 0% 0% Philips PHIA NA TV LG 33% 26% 30% LG Electronics 066570 KS TV Samsung 24% 34% 29% Samsung Electronics 005930 KS TV Sony 19% 14% 17% Sony 6758 JP TV Sharp 1% 17% 9% Sharp 6753 JP TV Panasonic 12% 5% 8% Panasonic 6752 JP TV Philips 2% 2% 2% Philips PHIA NA TV Hitachi 1% 1% 1% Hitachi, 6501 JP TV JVC 1% 0% 1% Victor Co of Japan Delisted TV Sanyo 0% 1% 1% SANYO Electric 6764 JP TV Toshiba 0% 1% 1% Toshiba 6502 JP TV Mitsubishi 1% 0% 0% Mitsubishi Motors 7211 JP Computers ASUS 11% 35% 23% Asus 2357 TT Computers Samsung 28% 15% 22% Samsung Electronics 005930 KS Computers Apple 13% 24% 18% Apple AAPL US
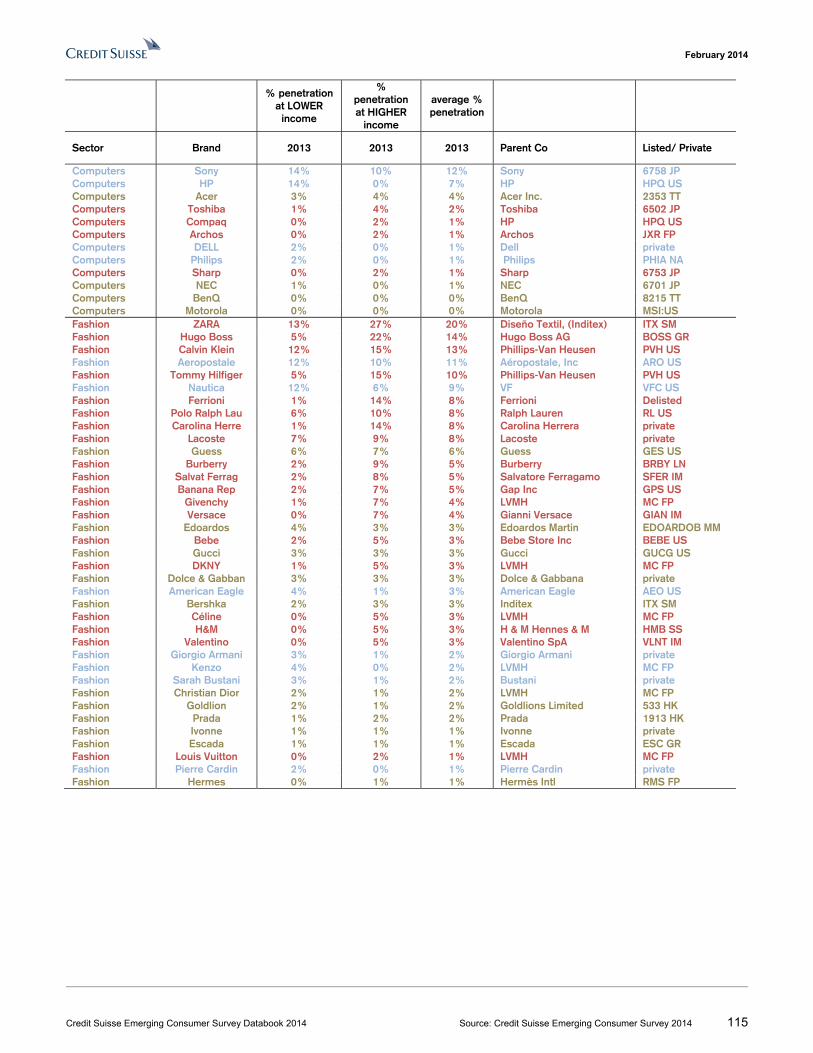
February 2014
Credit Suisse Emerging Consumer Survey Databook 2014 Source: Credit Suisse Emerging Consumer Survey 2014 115
% penetration
at LOWER income
% penetration at HIGHER
income
average % penetration
Sector Brand 2013 2013 2013 Parent Co Listed/ Private
Computers Sony 14% 10% 12% Sony 6758 JP Computers HP 14% 0% 7% HP HPQ US Computers Acer 3% 4% 4% Acer Inc. 2353 TT Computers Toshiba 1% 4% 2% Toshiba 6502 JP Computers Compaq 0% 2% 1% HP HPQ US Computers Archos 0% 2% 1% Archos JXR FP Computers DELL 2% 0% 1% Dell private Computers Philips 2% 0% 1% Philips PHIA NA Computers Sharp 0% 2% 1% Sharp 6753 JP Computers NEC 1% 0% 1% NEC 6701 JP Computers BenQ 0% 0% 0% BenQ 8215 TT Computers Motorola 0% 0% 0% Motorola MSI:US Fashion ZARA 13% 27% 20% Diseño Textil, (Inditex) ITX SM Fashion Hugo Boss 5% 22% 14% Hugo Boss AG BOSS GR Fashion Calvin Klein 12% 15% 13% Phillips-Van Heusen PVH US Fashion Aeropostale 12% 10% 11% Aéropostale, Inc ARO US Fashion Tommy Hilfiger 5% 15% 10% Phillips-Van Heusen PVH US Fashion Nautica 12% 6% 9% VF VFC US Fashion Ferrioni 1% 14% 8% Ferrioni Delisted Fashion Polo Ralph Lau 6% 10% 8% Ralph Lauren RL US Fashion Carolina Herre 1% 14% 8% Carolina Herrera private Fashion Lacoste 7% 9% 8% Lacoste private Fashion Guess 6% 7% 6% Guess GES US Fashion Burberry 2% 9% 5% Burberry BRBY LN Fashion Salvat Ferrag 2% 8% 5% Salvatore Ferragamo SFER IM Fashion Banana Rep 2% 7% 5% Gap Inc GPS US Fashion Givenchy 1% 7% 4% LVMH MC FP Fashion Versace 0% 7% 4% Gianni Versace GIAN IM Fashion Edoardos 4% 3% 3% Edoardos Martin EDOARDOB MM Fashion Bebe 2% 5% 3% Bebe Store Inc BEBE US Fashion Gucci 3% 3% 3% Gucci GUCG US Fashion DKNY 1% 5% 3% LVMH MC FP Fashion Dolce & Gabban 3% 3% 3% Dolce & Gabbana private Fashion American Eagle 4% 1% 3% American Eagle AEO US Fashion Bershka 2% 3% 3% Inditex ITX SM Fashion Céline 0% 5% 3% LVMH MC FP Fashion H&M 0% 5% 3% H & M Hennes & M HMB SS Fashion Valentino 0% 5% 3% Valentino SpA VLNT IM Fashion Giorgio Armani 3% 1% 2% Giorgio Armani private Fashion Kenzo 4% 0% 2% LVMH MC FP Fashion Sarah Bustani 3% 1% 2% Bustani private Fashion Christian Dior 2% 1% 2% LVMH MC FP Fashion Goldlion 2% 1% 2% Goldlions Limited 533 HK Fashion Prada 1% 2% 2% Prada 1913 HK Fashion Ivonne 1% 1% 1% Ivonne private Fashion Escada 1% 1% 1% Escada ESC GR Fashion Louis Vuitton 0% 2% 1% LVMH MC FP Fashion Pierre Cardin 2% 0% 1% Pierre Cardin private Fashion Hermes 0% 1% 1% Hermès Intl RMS FP
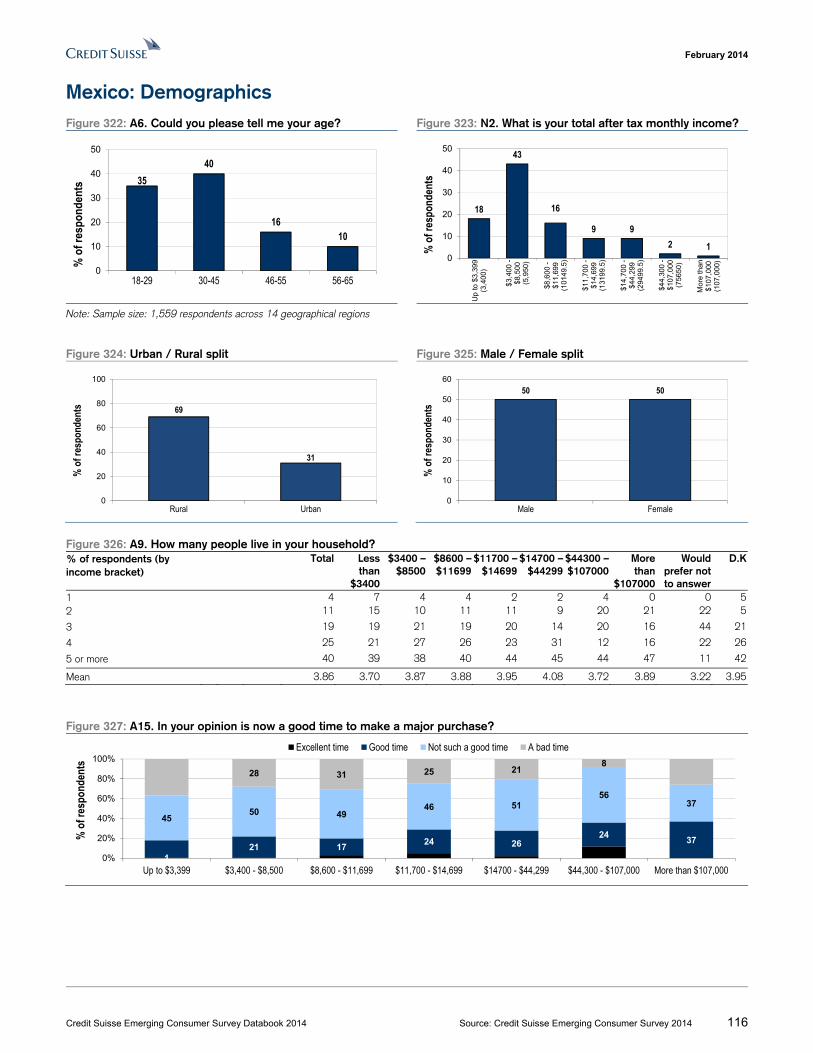
February 2014
Credit Suisse Emerging Consumer Survey Databook 2014 Source: Credit Suisse Emerging Consumer Survey 2014 116
Mexico: Demographics Figure 322: A6. Could you please tell me your age? Figure 323: N2. What is your total after tax monthly income?
Note: Sample size: 1,559 respondents across 14 geographical regions
Figure 324: Urban / Rural split Figure 325: Male / Female split
Figure 326: A9. How many people live in your household? % of respondents (by income bracket)
Total Less than
$3400
$3400 –$8500
$8600 –$11699
$11700 –$14699
$14700 –$44299
$44300 – $107000
More than
$107000
Would prefer not to answer
D.K
1 4 7 4 4 2 2 4 0 0 52 11 15 10 11 11 9 20 21 22 5
3 19 19 21 19 20 14 20 16 44 21
4 25 21 27 26 23 31 12 16 22 26
5 or more 40 39 38 40 44 45 44 47 11 42
Mean 3.86 3.70 3.87 3.88 3.95 4.08 3.72 3.89 3.22 3.95
Figure 327: A15. In your opinion is now a good time to make a major purchase?
3540
1610
0
10
20
30
40
50
18-29 30-45 46-55 56-65
% o
f res
pond
ents
18
43
16
9 92 1
0
10
20
30
40
50
Up
to $
3,39
9(3
,400
)
$3,4
00 -
$8,5
00(5
,950
)
$8,6
00 -
$11,
699
(101
49.
5)
$11,
700
-$1
4,69
9(1
319
9.5)
$14,
700
-$4
4,29
9(2
949
9.5)
$44,
300
-$1
07,0
00(7
565
0)
Mor
e th
an$1
07,0
00(1
07,0
00)
% o
f res
pond
ents
69
31
0
20
40
60
80
100
Rural Urban
% o
f res
pond
ents
50 50
0
10
20
30
40
50
60
Male Female
% o
f res
pond
ents
121 17
24 2624
37
4550 49
46 5156
37
28 31 25 218
0%
20%
40%
60%
80%
100%
Up to $3,399 $3,400 - $8,500 $8,600 - $11,699 $11,700 - $14,699 $14700 - $44,299 $44,300 - $107,000 More than $107,000
% o
f res
pond
ents
Excellent time Good time Not such a good time A bad time
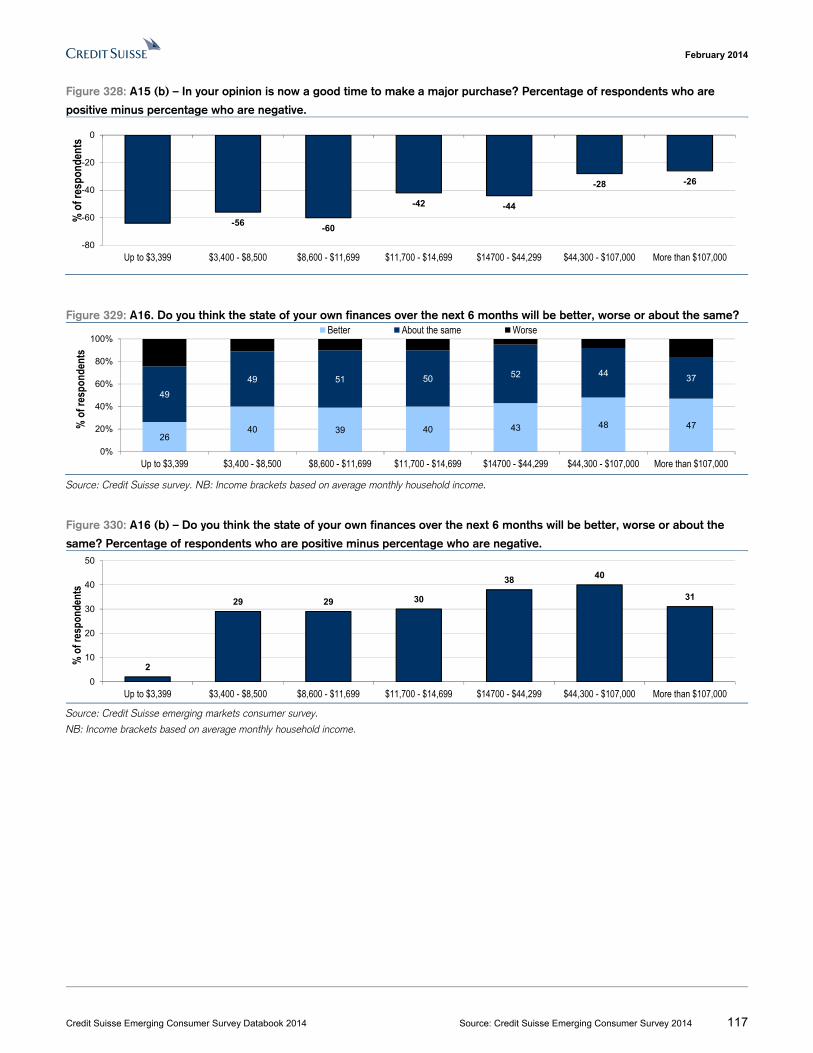
February 2014
Credit Suisse Emerging Consumer Survey Databook 2014 Source: Credit Suisse Emerging Consumer Survey 2014 117
Figure 328: A15 (b) – In your opinion is now a good time to make a major purchase? Percentage of respondents who are
positive minus percentage who are negative.
Figure 329: A16. Do you think the state of your own finances over the next 6 months will be better, worse or about the same?
Source: Credit Suisse survey. NB: Income brackets based on average monthly household income.
Figure 330: A16 (b) – Do you think the state of your own finances over the next 6 months will be better, worse or about the
same? Percentage of respondents who are positive minus percentage who are negative.
Source: Credit Suisse emerging markets consumer survey.
NB: Income brackets based on average monthly household income.
-56-60
-42 -44
-28 -26
-80
-60
-40
-20
0
Up to $3,399 $3,400 - $8,500 $8,600 - $11,699 $11,700 - $14,699 $14700 - $44,299 $44,300 - $107,000 More than $107,000
% o
f res
pond
ents
2640 39 40 43 48 47
49
49 51 50 52 4437
0%
20%
40%
60%
80%
100%
Up to $3,399 $3,400 - $8,500 $8,600 - $11,699 $11,700 - $14,699 $14700 - $44,299 $44,300 - $107,000 More than $107,000
% o
f res
pond
ents
Better About the same Worse
2
29 29 30
38 40
31
0
10
20
30
40
50
Up to $3,399 $3,400 - $8,500 $8,600 - $11,699 $11,700 - $14,699 $14700 - $44,299 $44,300 - $107,000 More than $107,000
% o
f res
pond
ents
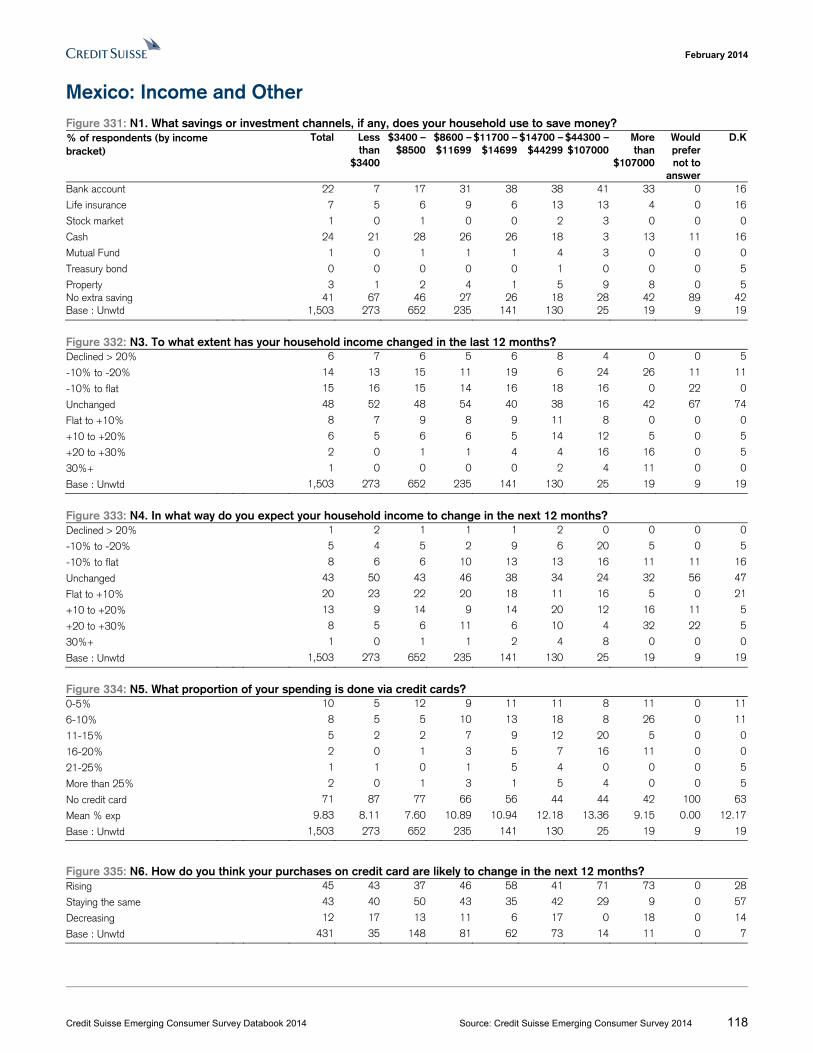
February 2014
Credit Suisse Emerging Consumer Survey Databook 2014 Source: Credit Suisse Emerging Consumer Survey 2014 118
Mexico: Income and Other Figure 331: N1. What savings or investment channels, if any, does your household use to save money? % of respondents (by income bracket)
Total Less than
$3400
$3400 –$8500
$8600 –$11699
$11700 –$14699
$14700 –$44299
$44300 – $107000
More than
$107000
Would prefer not to
answer
D.K
Bank account 22 7 17 31 38 38 41 33 0 16
Life insurance 7 5 6 9 6 13 13 4 0 16
Stock market 1 0 1 0 0 2 3 0 0 0
Cash 24 21 28 26 26 18 3 13 11 16
Mutual Fund 1 0 1 1 1 4 3 0 0 0
Treasury bond 0 0 0 0 0 1 0 0 0 5
Property 3 1 2 4 1 5 9 8 0 5No extra saving 41 67 46 27 26 18 28 42 89 42Base : Unwtd 1,503 273 652 235 141 130 25 19 9 19
Figure 332: N3. To what extent has your household income changed in the last 12 months? Declined > 20% 6 7 6 5 6 8 4 0 0 5
-10% to -20% 14 13 15 11 19 6 24 26 11 11
-10% to flat 15 16 15 14 16 18 16 0 22 0
Unchanged 48 52 48 54 40 38 16 42 67 74
Flat to +10% 8 7 9 8 9 11 8 0 0 0
+10 to +20% 6 5 6 6 5 14 12 5 0 5
+20 to +30% 2 0 1 1 4 4 16 16 0 5
30%+ 1 0 0 0 0 2 4 11 0 0
Base : Unwtd 1,503 273 652 235 141 130 25 19 9 19
Figure 333: N4. In what way do you expect your household income to change in the next 12 months? Declined > 20% 1 2 1 1 1 2 0 0 0 0
-10% to -20% 5 4 5 2 9 6 20 5 0 5
-10% to flat 8 6 6 10 13 13 16 11 11 16
Unchanged 43 50 43 46 38 34 24 32 56 47
Flat to +10% 20 23 22 20 18 11 16 5 0 21
+10 to +20% 13 9 14 9 14 20 12 16 11 5
+20 to +30% 8 5 6 11 6 10 4 32 22 5
30%+ 1 0 1 1 2 4 8 0 0 0
Base : Unwtd 1,503 273 652 235 141 130 25 19 9 19
Figure 334: N5. What proportion of your spending is done via credit cards? 0-5% 10 5 12 9 11 11 8 11 0 11
6-10% 8 5 5 10 13 18 8 26 0 11
11-15% 5 2 2 7 9 12 20 5 0 0
16-20% 2 0 1 3 5 7 16 11 0 0
21-25% 1 1 0 1 5 4 0 0 0 5
More than 25% 2 0 1 3 1 5 4 0 0 5
No credit card 71 87 77 66 56 44 44 42 100 63
Mean % exp 9.83 8.11 7.60 10.89 10.94 12.18 13.36 9.15 0.00 12.17
Base : Unwtd 1,503 273 652 235 141 130 25 19 9 19
Figure 335: N6. How do you think your purchases on credit card are likely to change in the next 12 months? Rising 45 43 37 46 58 41 71 73 0 28
Staying the same 43 40 50 43 35 42 29 9 0 57
Decreasing 12 17 13 11 6 17 0 18 0 14
Base : Unwtd 431 35 148 81 62 73 14 11 0 7
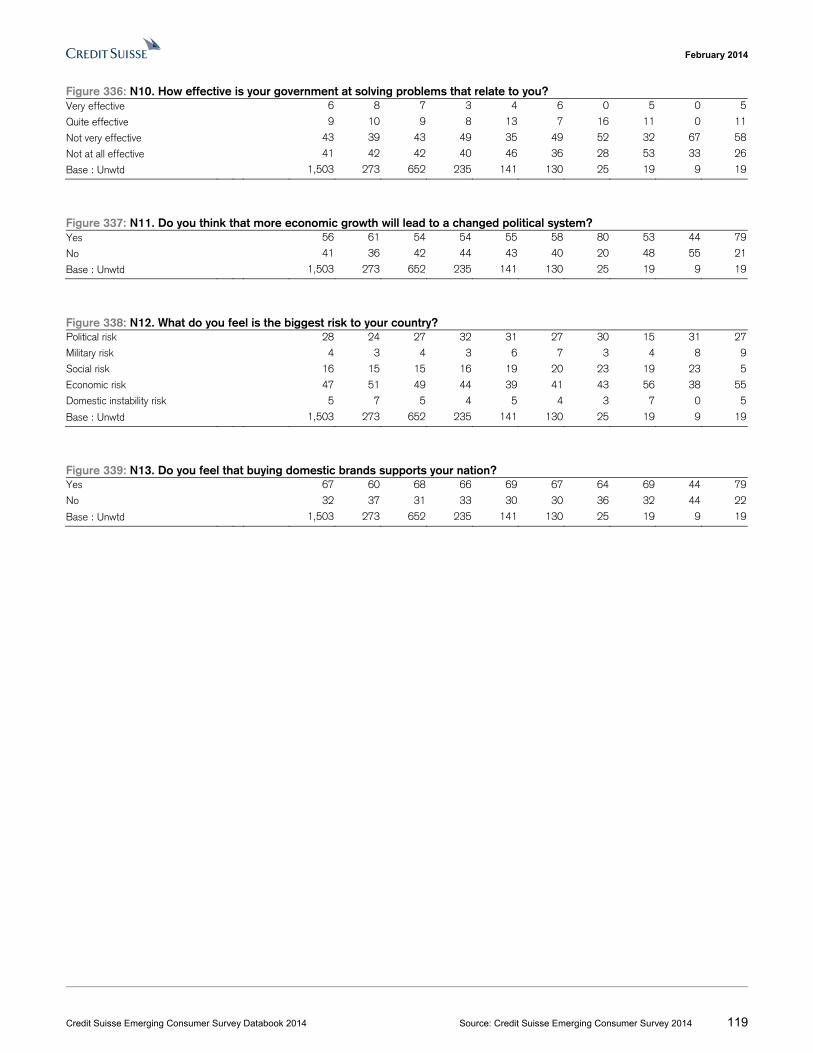
February 2014
Credit Suisse Emerging Consumer Survey Databook 2014 Source: Credit Suisse Emerging Consumer Survey 2014 119
Figure 336: N10. How effective is your government at solving problems that relate to you? Very effective 6 8 7 3 4 6 0 5 0 5
Quite effective 9 10 9 8 13 7 16 11 0 11
Not very effective 43 39 43 49 35 49 52 32 67 58
Not at all effective 41 42 42 40 46 36 28 53 33 26
Base : Unwtd 1,503 273 652 235 141 130 25 19 9 19
Figure 337: N11. Do you think that more economic growth will lead to a changed political system? Yes 56 61 54 54 55 58 80 53 44 79
No 41 36 42 44 43 40 20 48 55 21
Base : Unwtd 1,503 273 652 235 141 130 25 19 9 19
Figure 338: N12. What do you feel is the biggest risk to your country? Political risk 28 24 27 32 31 27 30 15 31 27
Military risk 4 3 4 3 6 7 3 4 8 9
Social risk 16 15 15 16 19 20 23 19 23 5
Economic risk 47 51 49 44 39 41 43 56 38 55
Domestic instability risk 5 7 5 4 5 4 3 7 0 5
Base : Unwtd 1,503 273 652 235 141 130 25 19 9 19
Figure 339: N13. Do you feel that buying domestic brands supports your nation? Yes 67 60 68 66 69 67 64 69 44 79
No 32 37 31 33 30 30 36 32 44 22
Base : Unwtd 1,503 273 652 235 141 130 25 19 9 19
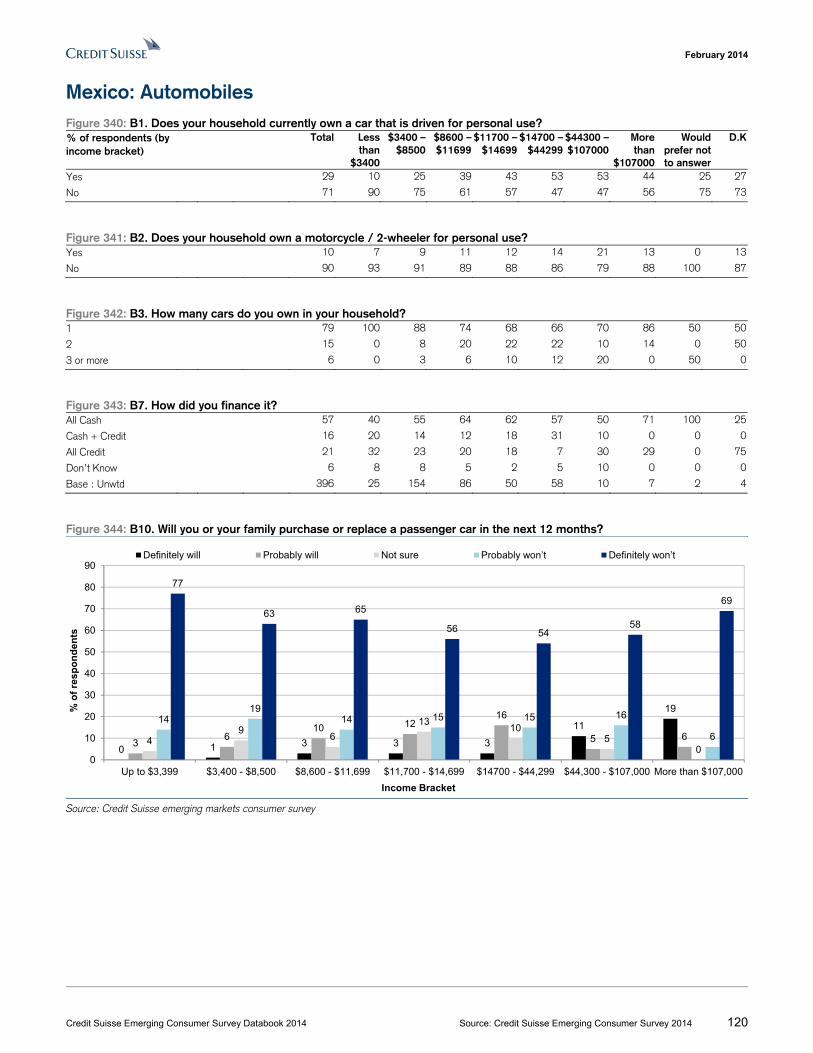
February 2014
Credit Suisse Emerging Consumer Survey Databook 2014 Source: Credit Suisse Emerging Consumer Survey 2014 120
Mexico: Automobiles Figure 340: B1. Does your household currently own a car that is driven for personal use? % of respondents (by income bracket)
Total Less than
$3400
$3400 –$8500
$8600 –$11699
$11700 –$14699
$14700 –$44299
$44300 – $107000
More than
$107000
Would prefer not to answer
D.K
Yes 29 10 25 39 43 53 53 44 25 27
No 71 90 75 61 57 47 47 56 75 73
Figure 341: B2. Does your household own a motorcycle / 2-wheeler for personal use? Yes 10 7 9 11 12 14 21 13 0 13
No 90 93 91 89 88 86 79 88 100 87
Figure 342: B3. How many cars do you own in your household? 1 79 100 88 74 68 66 70 86 50 50
2 15 0 8 20 22 22 10 14 0 50
3 or more 6 0 3 6 10 12 20 0 50 0
Figure 343: B7. How did you finance it? All Cash 57 40 55 64 62 57 50 71 100 25
Cash + Credit 16 20 14 12 18 31 10 0 0 0
All Credit 21 32 23 20 18 7 30 29 0 75
Don’t Know 6 8 8 5 2 5 10 0 0 0
Base : Unwtd 396 25 154 86 50 58 10 7 2 4
Figure 344: B10. Will you or your family purchase or replace a passenger car in the next 12 months?
Source: Credit Suisse emerging markets consumer survey
0 1 3 3 3
11
19
36
10 1216
5 649
6
1310
50
1419
14 15 15 16
6
77
63 65
56 5458
69
0
10
20
30
40
50
60
70
80
90
Up to $3,399 $3,400 - $8,500 $8,600 - $11,699 $11,700 - $14,699 $14700 - $44,299 $44,300 - $107,000 More than $107,000
% o
f re
sp
on
den
ts
Income Bracket
Definitely will Probably will Not sure Probably won’t Definitely won’t
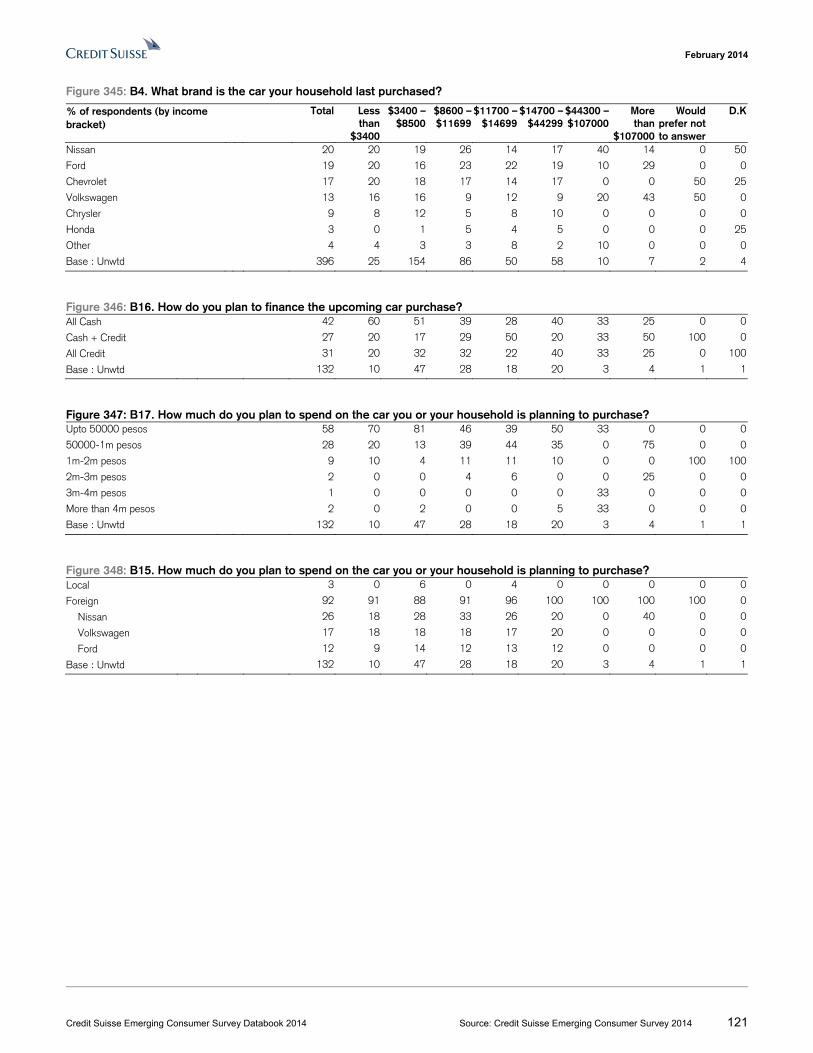
February 2014
Credit Suisse Emerging Consumer Survey Databook 2014 Source: Credit Suisse Emerging Consumer Survey 2014 121
Figure 345: B4. What brand is the car your household last purchased?
Nissan 20 20 19 26 14 17 40 14 0 50
Ford 19 20 16 23 22 19 10 29 0 0
Chevrolet 17 20 18 17 14 17 0 0 50 25
Volkswagen 13 16 16 9 12 9 20 43 50 0
Chrysler 9 8 12 5 8 10 0 0 0 0
Honda 3 0 1 5 4 5 0 0 0 25
Other 4 4 3 3 8 2 10 0 0 0
Base : Unwtd 396 25 154 86 50 58 10 7 2 4
Figure 346: B16. How do you plan to finance the upcoming car purchase? All Cash 42 60 51 39 28 40 33 25 0 0
Cash + Credit 27 20 17 29 50 20 33 50 100 0
All Credit 31 20 32 32 22 40 33 25 0 100
Base : Unwtd 132 10 47 28 18 20 3 4 1 1
Figure 347: B17. How much do you plan to spend on the car you or your household is planning to purchase? Upto 50000 pesos 58 70 81 46 39 50 33 0 0 0
50000-1m pesos 28 20 13 39 44 35 0 75 0 0
1m-2m pesos 9 10 4 11 11 10 0 0 100 100
2m-3m pesos 2 0 0 4 6 0 0 25 0 0
3m-4m pesos 1 0 0 0 0 0 33 0 0 0
More than 4m pesos 2 0 2 0 0 5 33 0 0 0
Base : Unwtd 132 10 47 28 18 20 3 4 1 1
Figure 348: B15. How much do you plan to spend on the car you or your household is planning to purchase? Local 3 0 6 0 4 0 0 0 0 0
Foreign 92 91 88 91 96 100 100 100 100 0
Nissan 26 18 28 33 26 20 0 40 0 0
Volkswagen 17 18 18 18 17 20 0 0 0 0
Ford 12 9 14 12 13 12 0 0 0 0
Base : Unwtd 132 10 47 28 18 20 3 4 1 1
% of respondents (by income bracket)
Total Less than
$3400
$3400 –$8500
$8600 –$11699
$11700 –$14699
$14700 –$44299
$44300 – $107000
More than
$107000
Wouldprefer not to answer
D.K
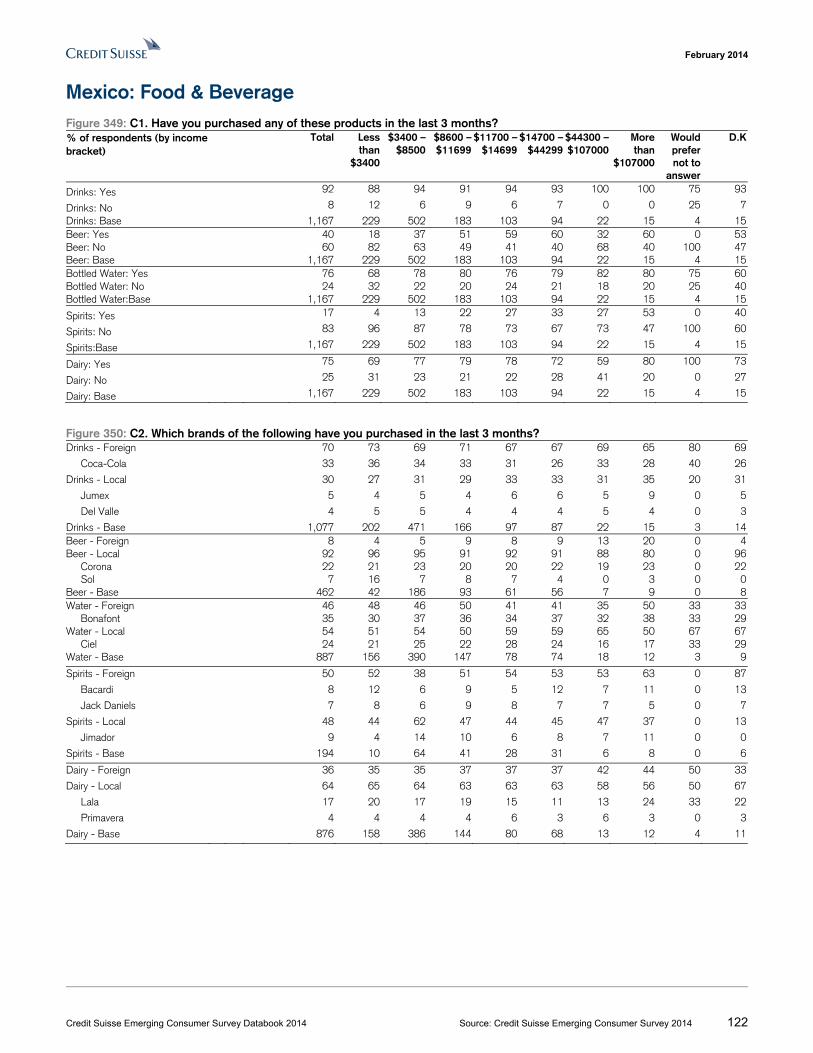
February 2014
Credit Suisse Emerging Consumer Survey Databook 2014 Source: Credit Suisse Emerging Consumer Survey 2014 122
Mexico: Food & Beverage Figure 349: C1. Have you purchased any of these products in the last 3 months? % of respondents (by income bracket)
Total Less than
$3400
$3400 –$8500
$8600 –$11699
$11700 –$14699
$14700 –$44299
$44300 – $107000
More than
$107000
Would prefer not to
answer
D.K
Drinks: Yes 92 88 94 91 94 93 100 100 75 93
Drinks: No 8 12 6 9 6 7 0 0 25 7
Drinks: Base 1,167 229 502 183 103 94 22 15 4 15Beer: Yes 40 18 37 51 59 60 32 60 0 53Beer: No 60 82 63 49 41 40 68 40 100 47Beer: Base 1,167 229 502 183 103 94 22 15 4 15Bottled Water: Yes 76 68 78 80 76 79 82 80 75 60Bottled Water: No 24 32 22 20 24 21 18 20 25 40Bottled Water:Base 1,167 229 502 183 103 94 22 15 4 15
Spirits: Yes 17 4 13 22 27 33 27 53 0 40
Spirits: No 83 96 87 78 73 67 73 47 100 60
Spirits:Base 1,167 229 502 183 103 94 22 15 4 15
Dairy: Yes 75 69 77 79 78 72 59 80 100 73
Dairy: No 25 31 23 21 22 28 41 20 0 27
Dairy: Base 1,167 229 502 183 103 94 22 15 4 15
Figure 350: C2. Which brands of the following have you purchased in the last 3 months? Drinks - Foreign 70 73 69 71 67 67 69 65 80 69
Coca-Cola 33 36 34 33 31 26 33 28 40 26
Drinks - Local 30 27 31 29 33 33 31 35 20 31
Jumex 5 4 5 4 6 6 5 9 0 5
Del Valle 4 5 5 4 4 4 5 4 0 3
Drinks - Base 1,077 202 471 166 97 87 22 15 3 14Beer - Foreign 8 4 5 9 8 9 13 20 0 4Beer - Local 92 96 95 91 92 91 88 80 0 96 Corona 22 21 23 20 20 22 19 23 0 22 Sol 7 16 7 8 7 4 0 3 0 0Beer - Base 462 42 186 93 61 56 7 9 0 8Water - Foreign 46 48 46 50 41 41 35 50 33 33 Bonafont 35 30 37 36 34 37 32 38 33 29Water - Local 54 51 54 50 59 59 65 50 67 67 Ciel 24 21 25 22 28 24 16 17 33 29Water - Base 887 156 390 147 78 74 18 12 3 9
Spirits - Foreign 50 52 38 51 54 53 53 63 0 87
Bacardi 8 12 6 9 5 12 7 11 0 13
Jack Daniels 7 8 6 9 8 7 7 5 0 7
Spirits - Local 48 44 62 47 44 45 47 37 0 13
Jimador 9 4 14 10 6 8 7 11 0 0
Spirits - Base 194 10 64 41 28 31 6 8 0 6
Dairy - Foreign 36 35 35 37 37 37 42 44 50 33
Dairy - Local 64 65 64 63 63 63 58 56 50 67
Lala 17 20 17 19 15 11 13 24 33 22
Primavera 4 4 4 4 6 3 6 3 0 3
Dairy - Base 876 158 386 144 80 68 13 12 4 11
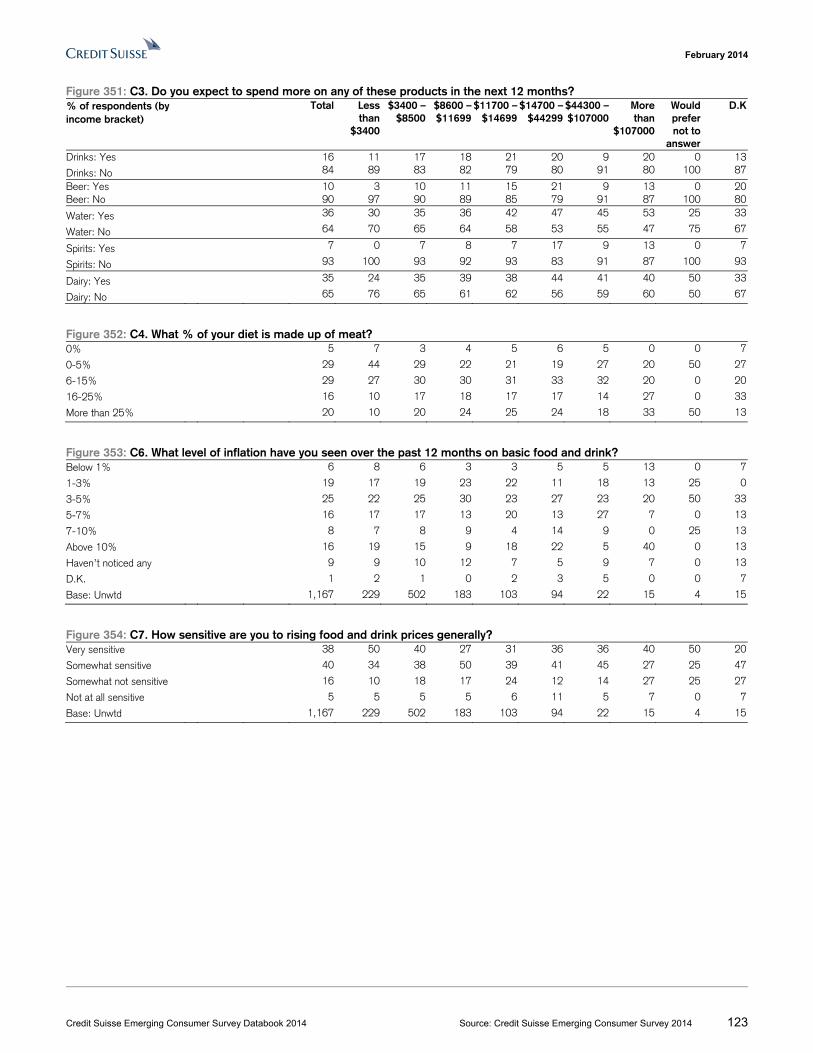
February 2014
Credit Suisse Emerging Consumer Survey Databook 2014 Source: Credit Suisse Emerging Consumer Survey 2014 123
Figure 351: C3. Do you expect to spend more on any of these products in the next 12 months? % of respondents (by income bracket)
Total Less than
$3400
$3400 –$8500
$8600 –$11699
$11700 –$14699
$14700 –$44299
$44300 – $107000
More than
$107000
Would prefer not to
answer
D.K
Drinks: Yes 16 11 17 18 21 20 9 20 0 13
Drinks: No 84 89 83 82 79 80 91 80 100 87
Beer: Yes 10 3 10 11 15 21 9 13 0 20Beer: No 90 97 90 89 85 79 91 87 100 80
Water: Yes 36 30 35 36 42 47 45 53 25 33
Water: No 64 70 65 64 58 53 55 47 75 67
Spirits: Yes 7 0 7 8 7 17 9 13 0 7
Spirits: No 93 100 93 92 93 83 91 87 100 93
Dairy: Yes 35 24 35 39 38 44 41 40 50 33
Dairy: No 65 76 65 61 62 56 59 60 50 67
Figure 352: C4. What % of your diet is made up of meat? 0% 5 7 3 4 5 6 5 0 0 7
0-5% 29 44 29 22 21 19 27 20 50 27
6-15% 29 27 30 30 31 33 32 20 0 20
16-25% 16 10 17 18 17 17 14 27 0 33
More than 25% 20 10 20 24 25 24 18 33 50 13
Figure 353: C6. What level of inflation have you seen over the past 12 months on basic food and drink? Below 1% 6 8 6 3 3 5 5 13 0 7
1-3% 19 17 19 23 22 11 18 13 25 0
3-5% 25 22 25 30 23 27 23 20 50 33
5-7% 16 17 17 13 20 13 27 7 0 13
7-10% 8 7 8 9 4 14 9 0 25 13
Above 10% 16 19 15 9 18 22 5 40 0 13
Haven’t noticed any 9 9 10 12 7 5 9 7 0 13
D.K. 1 2 1 0 2 3 5 0 0 7
Base: Unwtd 1,167 229 502 183 103 94 22 15 4 15
Figure 354: C7. How sensitive are you to rising food and drink prices generally? Very sensitive 38 50 40 27 31 36 36 40 50 20
Somewhat sensitive 40 34 38 50 39 41 45 27 25 47
Somewhat not sensitive 16 10 18 17 24 12 14 27 25 27
Not at all sensitive 5 5 5 5 6 11 5 7 0 7
Base: Unwtd 1,167 229 502 183 103 94 22 15 4 15
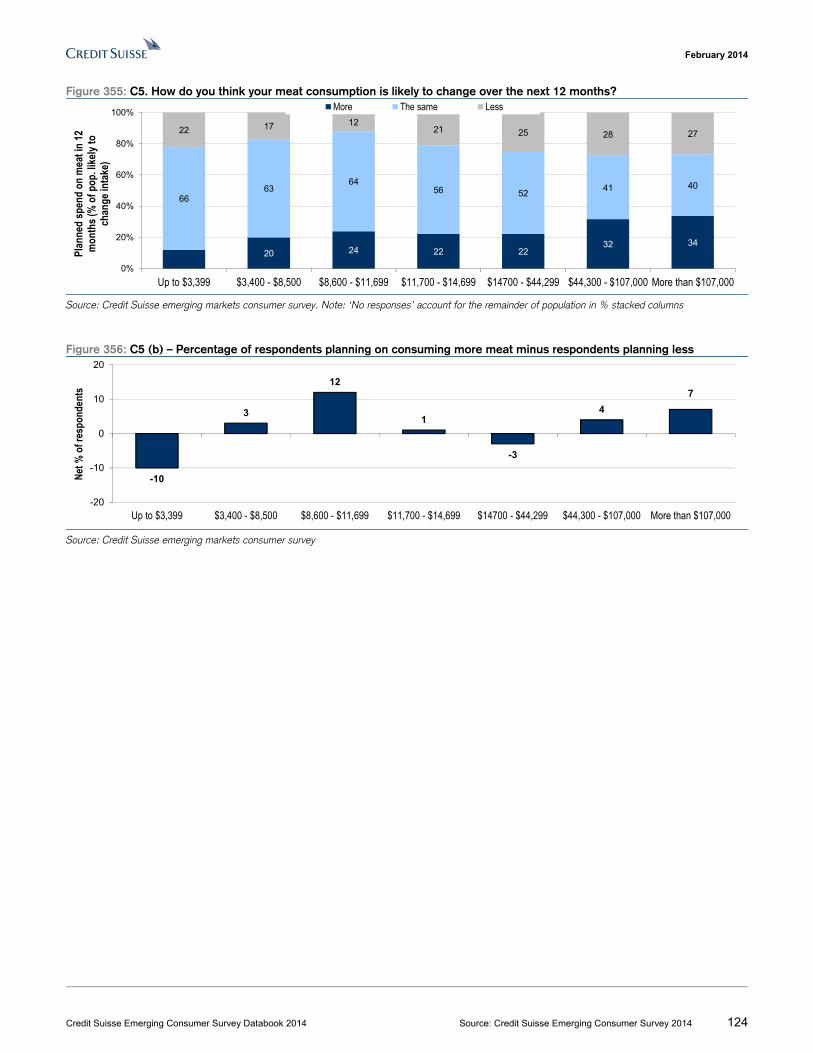
February 2014
Credit Suisse Emerging Consumer Survey Databook 2014 Source: Credit Suisse Emerging Consumer Survey 2014 124
Figure 355: C5. How do you think your meat consumption is likely to change over the next 12 months?
Source: Credit Suisse emerging markets consumer survey. Note: ‘No responses’ account for the remainder of population in % stacked columns
Figure 356: C5 (b) – Percentage of respondents planning on consuming more meat minus respondents planning less
Source: Credit Suisse emerging markets consumer survey
20 24 22 2232 34
6663
6456 52
41 40
22 17 1221 25 28 27
0%
20%
40%
60%
80%
100%
Up to $3,399 $3,400 - $8,500 $8,600 - $11,699 $11,700 - $14,699 $14700 - $44,299 $44,300 - $107,000 More than $107,000
Plan
ned
spen
d on
mea
t in
12
mon
ths (
% o
f pop
. like
ly to
ch
ange
inta
ke)
More The same Less
-10
3
12
1
-3
4
7
-20
-10
0
10
20
Up to $3,399 $3,400 - $8,500 $8,600 - $11,699 $11,700 - $14,699 $14700 - $44,299 $44,300 - $107,000 More than $107,000
Net %
of r
espo
nden
ts
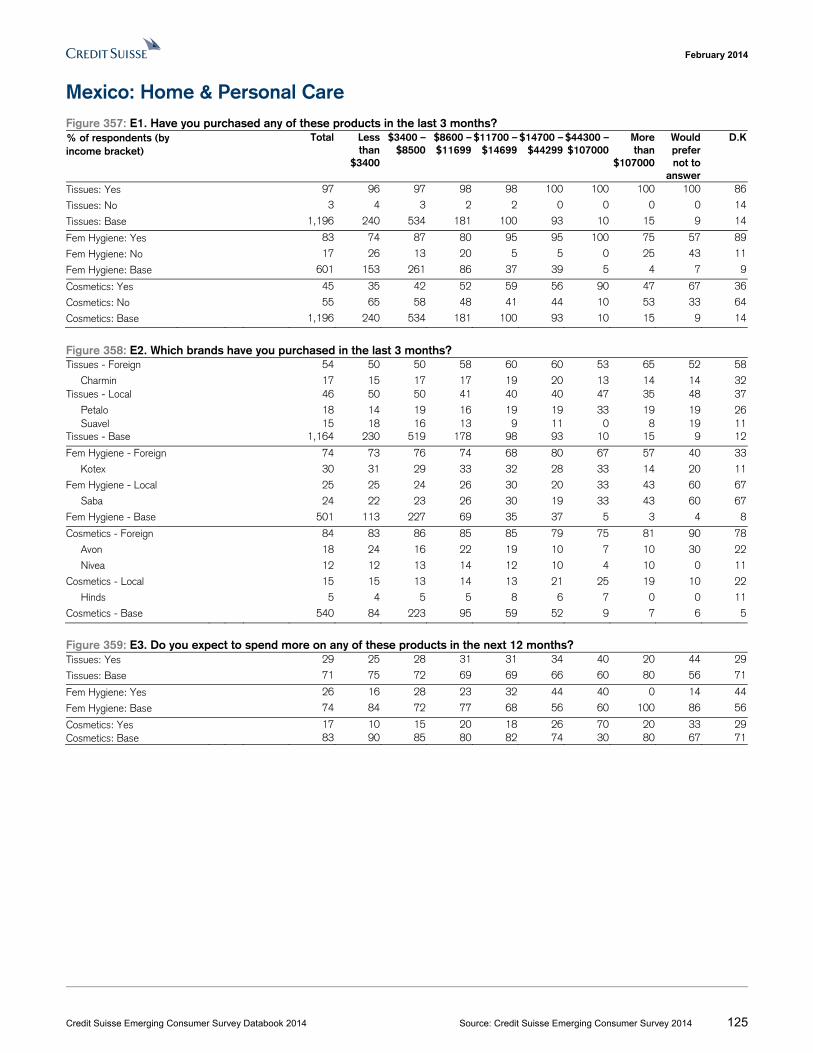
February 2014
Credit Suisse Emerging Consumer Survey Databook 2014 Source: Credit Suisse Emerging Consumer Survey 2014 125
Mexico: Home & Personal Care Figure 357: E1. Have you purchased any of these products in the last 3 months? % of respondents (by income bracket)
Total Less than
$3400
$3400 –$8500
$8600 –$11699
$11700 –$14699
$14700 –$44299
$44300 – $107000
More than
$107000
Would prefer not to
answer
D.K
Tissues: Yes 97 96 97 98 98 100 100 100 100 86
Tissues: No 3 4 3 2 2 0 0 0 0 14
Tissues: Base 1,196 240 534 181 100 93 10 15 9 14
Fem Hygiene: Yes 83 74 87 80 95 95 100 75 57 89
Fem Hygiene: No 17 26 13 20 5 5 0 25 43 11
Fem Hygiene: Base 601 153 261 86 37 39 5 4 7 9
Cosmetics: Yes 45 35 42 52 59 56 90 47 67 36
Cosmetics: No 55 65 58 48 41 44 10 53 33 64
Cosmetics: Base 1,196 240 534 181 100 93 10 15 9 14
Figure 358: E2. Which brands have you purchased in the last 3 months? Tissues - Foreign 54 50 50 58 60 60 53 65 52 58
Charmin 17 15 17 17 19 20 13 14 14 32Tissues - Local 46 50 50 41 40 40 47 35 48 37
Petalo 18 14 19 16 19 19 33 19 19 26 Suavel 15 18 16 13 9 11 0 8 19 11Tissues - Base 1,164 230 519 178 98 93 10 15 9 12
Fem Hygiene - Foreign 74 73 76 74 68 80 67 57 40 33
Kotex 30 31 29 33 32 28 33 14 20 11
Fem Hygiene - Local 25 25 24 26 30 20 33 43 60 67
Saba 24 22 23 26 30 19 33 43 60 67
Fem Hygiene - Base 501 113 227 69 35 37 5 3 4 8
Cosmetics - Foreign 84 83 86 85 85 79 75 81 90 78
Avon 18 24 16 22 19 10 7 10 30 22
Nivea 12 12 13 14 12 10 4 10 0 11
Cosmetics - Local 15 15 13 14 13 21 25 19 10 22
Hinds 5 4 5 5 8 6 7 0 0 11
Cosmetics - Base 540 84 223 95 59 52 9 7 6 5
Figure 359: E3. Do you expect to spend more on any of these products in the next 12 months? Tissues: Yes 29 25 28 31 31 34 40 20 44 29
Tissues: Base 71 75 72 69 69 66 60 80 56 71
Fem Hygiene: Yes 26 16 28 23 32 44 40 0 14 44
Fem Hygiene: Base 74 84 72 77 68 56 60 100 86 56
Cosmetics: Yes 17 10 15 20 18 26 70 20 33 29Cosmetics: Base 83 90 85 80 82 74 30 80 67 71
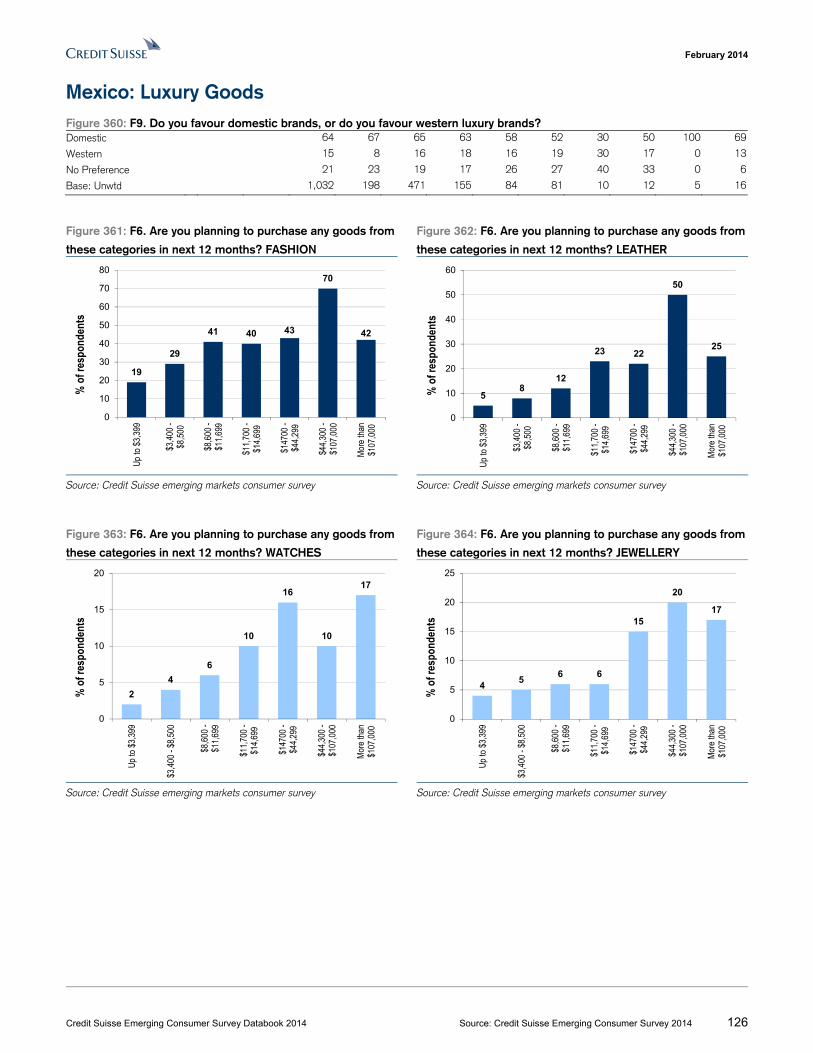
February 2014
Credit Suisse Emerging Consumer Survey Databook 2014 Source: Credit Suisse Emerging Consumer Survey 2014 126
Mexico: Luxury Goods Figure 360: F9. Do you favour domestic brands, or do you favour western luxury brands? Domestic 64 67 65 63 58 52 30 50 100 69
Western 15 8 16 18 16 19 30 17 0 13
No Preference 21 23 19 17 26 27 40 33 0 6
Base: Unwtd 1,032 198 471 155 84 81 10 12 5 16
Figure 361: F6. Are you planning to purchase any goods from
these categories in next 12 months? FASHION
Figure 362: F6. Are you planning to purchase any goods from
these categories in next 12 months? LEATHER
Source: Credit Suisse emerging markets consumer survey Source: Credit Suisse emerging markets consumer survey
Figure 363: F6. Are you planning to purchase any goods from
these categories in next 12 months? WATCHES
Figure 364: F6. Are you planning to purchase any goods from
these categories in next 12 months? JEWELLERY
Source: Credit Suisse emerging markets consumer survey Source: Credit Suisse emerging markets consumer survey
19
29
41 40 43
70
42
0
10
20
30
40
50
60
70
80
Up
to $
3,39
9
$3,4
00 -
$8,5
00
$8,6
00 -
$11,
699
$11,
700
-$1
4,69
9
$147
00 -
$44,
299
$44,
300
-$1
07,0
00
Mor
e th
an$1
07,0
00
% o
f res
pond
ents
58
12
23 22
50
25
0
10
20
30
40
50
60
Up
to $
3,39
9
$3,4
00 -
$8,5
00
$8,6
00 -
$11,
699
$11,
700
-$1
4,69
9
$147
00 -
$44,
299
$44,
300
-$1
07,0
00
Mor
e th
an$1
07,0
00
% o
f res
pond
ents
2
4
6
10
16
10
17
0
5
10
15
20
Up
to $
3,39
9
$3,4
00 -
$8,5
00
$8,6
00 -
$11,
699
$11,
700
-$1
4,69
9
$147
00 -
$44,
299
$44,
300
-$1
07,0
00
Mor
e th
an$1
07,0
00
% o
f res
pond
ents
45
6 6
15
20
17
0
5
10
15
20
25
Up
to $
3,39
9
$3,4
00 -
$8,5
00
$8,6
00 -
$11,
699
$11,
700
-$1
4,69
9
$147
00 -
$44,
299
$44,
300
-$1
07,0
00
Mor
e th
an$1
07,0
00
% o
f res
pond
ents
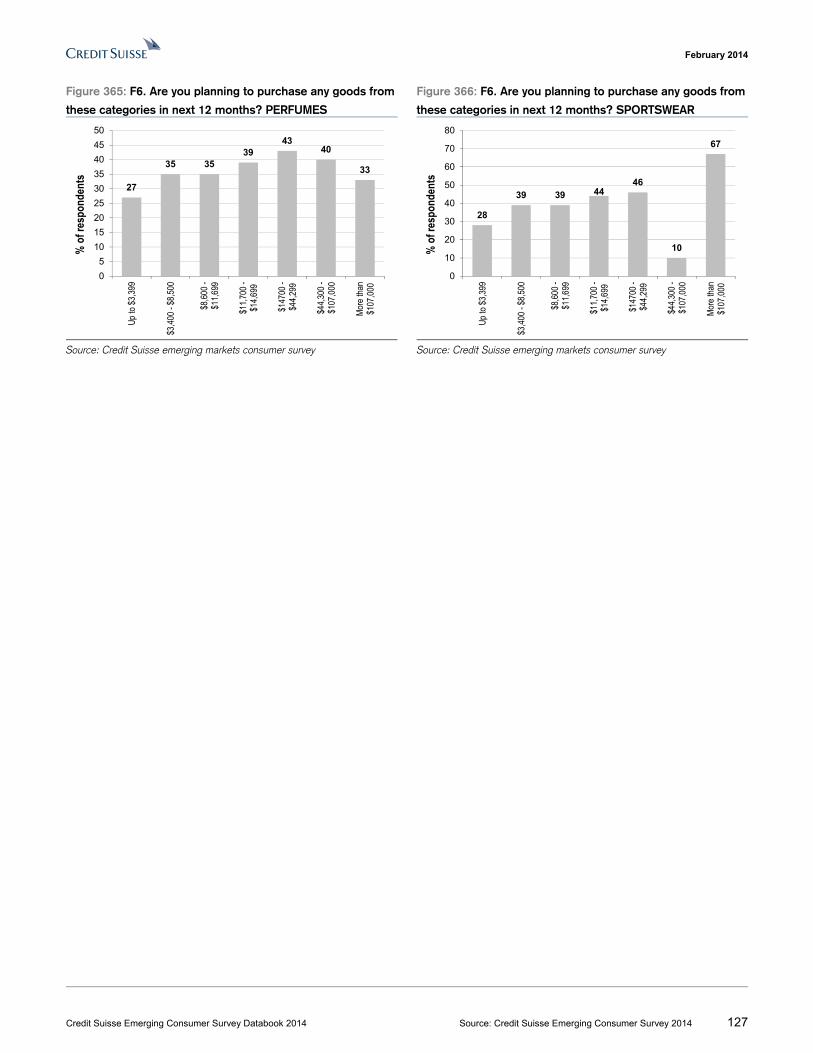
February 2014
Credit Suisse Emerging Consumer Survey Databook 2014 Source: Credit Suisse Emerging Consumer Survey 2014 127
Figure 365: F6. Are you planning to purchase any goods from
these categories in next 12 months? PERFUMES
Figure 366: F6. Are you planning to purchase any goods from
these categories in next 12 months? SPORTSWEAR
Source: Credit Suisse emerging markets consumer survey Source: Credit Suisse emerging markets consumer survey
27
35 3539
4340
33
0
5
10
15
20
25
30
35
40
45
50U
p to
$3,
399
$3,4
00 -
$8,5
00
$8,6
00 -
$11,
699
$11,
700
-$1
4,69
9
$147
00 -
$44,
299
$44,
300
-$1
07,0
00
Mor
e th
an$1
07,0
00
% o
f res
pond
ents
28
39 39 4446
10
67
0
10
20
30
40
50
60
70
80
Up
to $
3,39
9
$3,4
00 -
$8,5
00
$8,6
00 -
$11,
699
$11,
700
-$1
4,69
9
$147
00 -
$44,
299
$44,
300
-$1
07,0
00
Mor
e th
an$1
07,0
00
% o
f res
pond
ents
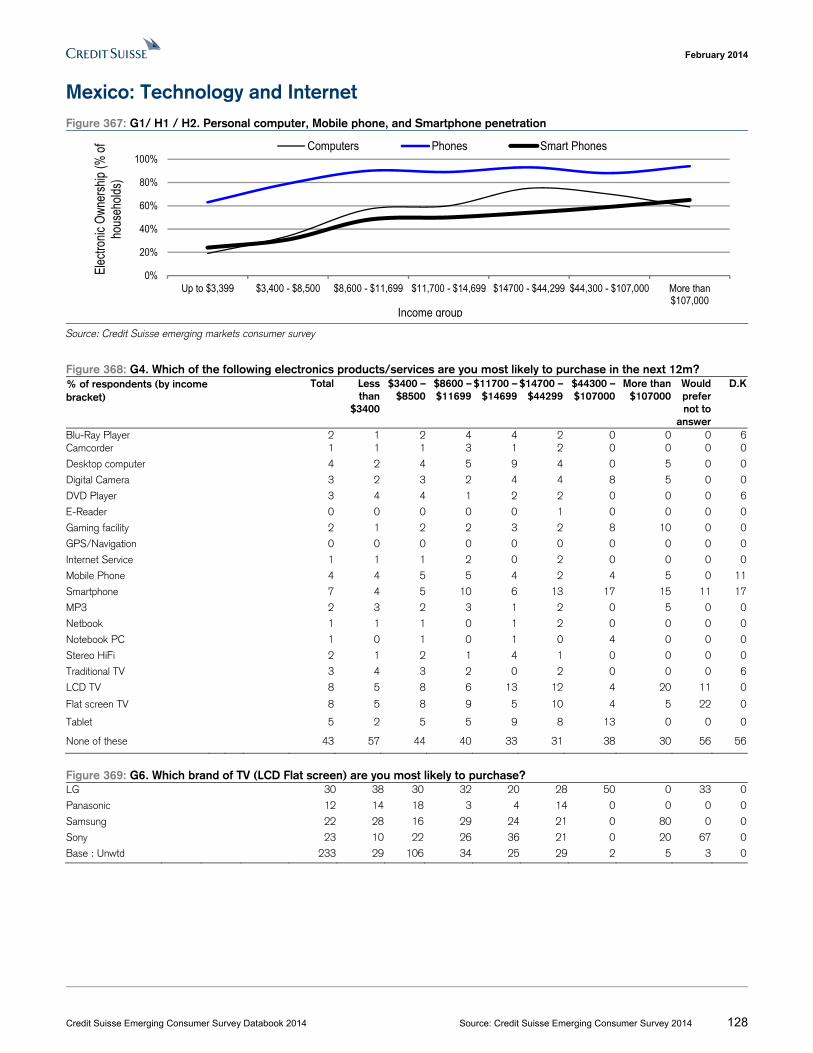
February 2014
Credit Suisse Emerging Consumer Survey Databook 2014 Source: Credit Suisse Emerging Consumer Survey 2014 128
Mexico: Technology and Internet Figure 367: G1/ H1 / H2. Personal computer, Mobile phone, and Smartphone penetration
Source: Credit Suisse emerging markets consumer survey
Figure 368: G4. Which of the following electronics products/services are you most likely to purchase in the next 12m? % of respondents (by income bracket)
Total Less than
$3400
$3400 –$8500
$8600 –$11699
$11700 –$14699
$14700 –$44299
$44300 – $107000
More than $107000
Would prefer not to
answer
D.K
Blu-Ray Player 2 1 2 4 4 2 0 0 0 6Camcorder 1 1 1 3 1 2 0 0 0 0
Desktop computer 4 2 4 5 9 4 0 5 0 0
Digital Camera 3 2 3 2 4 4 8 5 0 0
DVD Player 3 4 4 1 2 2 0 0 0 6
E-Reader 0 0 0 0 0 1 0 0 0 0
Gaming facility 2 1 2 2 3 2 8 10 0 0
GPS/Navigation 0 0 0 0 0 0 0 0 0 0
Internet Service 1 1 1 2 0 2 0 0 0 0
Mobile Phone 4 4 5 5 4 2 4 5 0 11
Smartphone 7 4 5 10 6 13 17 15 11 17
MP3 2 3 2 3 1 2 0 5 0 0
Netbook 1 1 1 0 1 2 0 0 0 0
Notebook PC 1 0 1 0 1 0 4 0 0 0
Stereo HiFi 2 1 2 1 4 1 0 0 0 0
Traditional TV 3 4 3 2 0 2 0 0 0 6
LCD TV 8 5 8 6 13 12 4 20 11 0
Flat screen TV 8 5 8 9 5 10 4 5 22 0
Tablet 5 2 5 5 9 8 13 0 0 0
None of these 43 57 44 40 33 31 38 30 56 56
Figure 369: G6. Which brand of TV (LCD Flat screen) are you most likely to purchase? LG 30 38 30 32 20 28 50 0 33 0
Panasonic 12 14 18 3 4 14 0 0 0 0
Samsung 22 28 16 29 24 21 0 80 0 0
Sony 23 10 22 26 36 21 0 20 67 0
Base : Unwtd 233 29 106 34 25 29 2 5 3 0
0%
20%
40%
60%
80%
100%
Up to $3,399 $3,400 - $8,500 $8,600 - $11,699 $11,700 - $14,699 $14700 - $44,299 $44,300 - $107,000 More than$107,000
Elec
troni
c O
wner
ship
(% o
f ho
useh
olds
)
Computers Phones Smart Phones
Income group
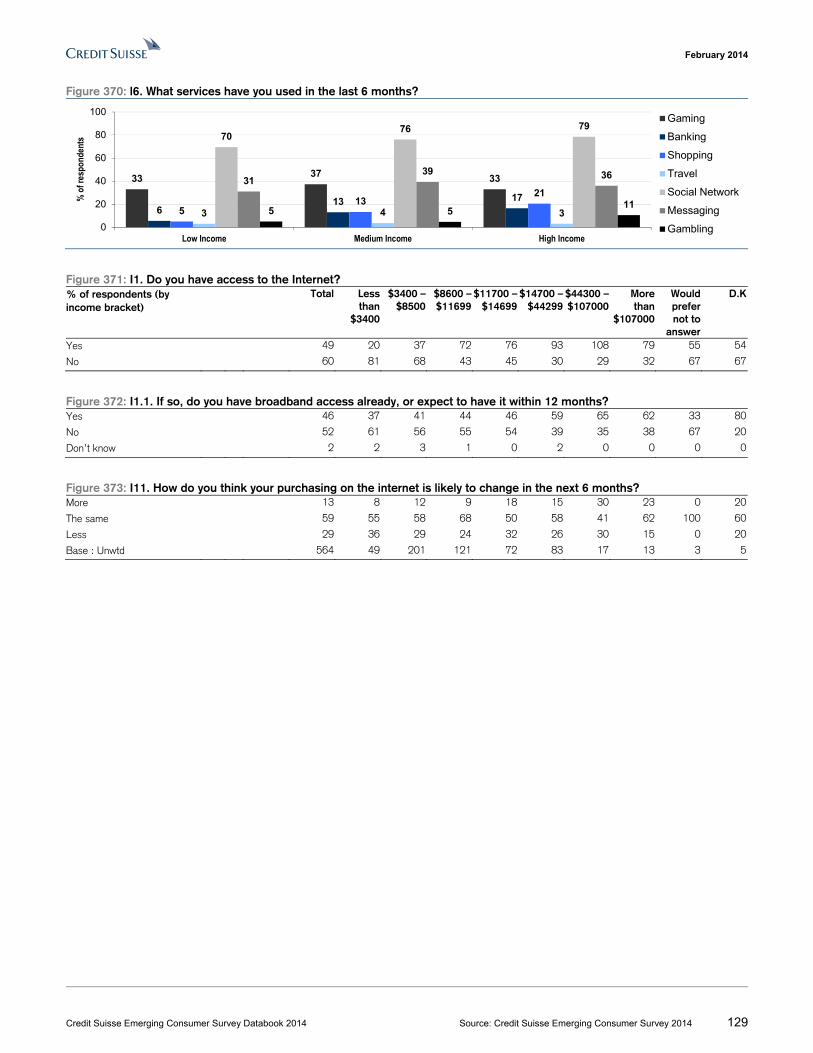
February 2014
Credit Suisse Emerging Consumer Survey Databook 2014 Source: Credit Suisse Emerging Consumer Survey 2014 129
Figure 370: l6. What services have you used in the last 6 months?
Figure 371: I1. Do you have access to the Internet? % of respondents (by income bracket)
Total Less than
$3400
$3400 –$8500
$8600 –$11699
$11700 –$14699
$14700 –$44299
$44300 – $107000
More than
$107000
Would prefer not to
answer
D.K
Yes 49 20 37 72 76 93 108 79 55 54
No 60 81 68 43 45 30 29 32 67 67
Figure 372: I1.1. If so, do you have broadband access already, or expect to have it within 12 months? Yes 46 37 41 44 46 59 65 62 33 80
No 52 61 56 55 54 39 35 38 67 20
Don’t know 2 2 3 1 0 2 0 0 0 0
Figure 373: I11. How do you think your purchasing on the internet is likely to change in the next 6 months? More 13 8 12 9 18 15 30 23 0 20
The same 59 55 58 68 50 58 41 62 100 60
Less 29 36 29 24 32 26 30 15 0 20
Base : Unwtd 564 49 201 121 72 83 17 13 3 5
33 37 33
613 17
513
21
3 4 3
7076 79
3139 36
5 511
0
20
40
60
80
100
Low Income Medium Income High Income
% o
f res
pond
ents
Gaming
Banking
Shopping
Travel
Social Network
Messaging
Gambling
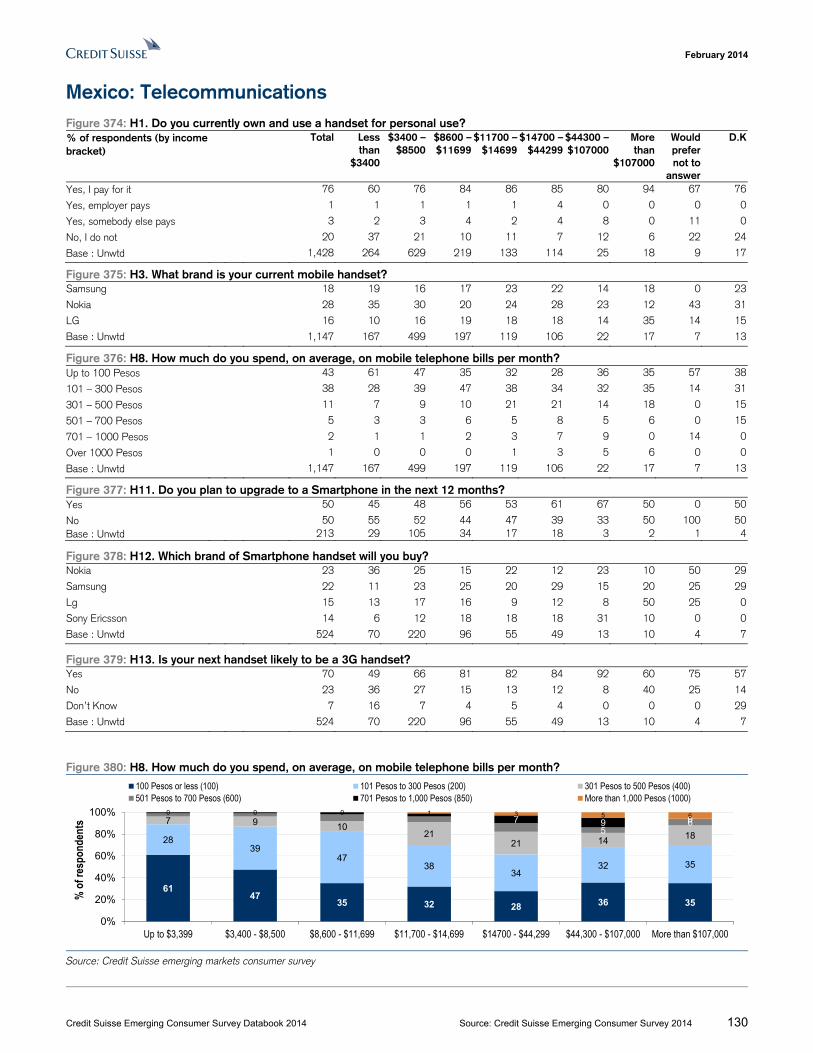
February 2014
Credit Suisse Emerging Consumer Survey Databook 2014 Source: Credit Suisse Emerging Consumer Survey 2014 130
Mexico: Telecommunications Figure 374: H1. Do you currently own and use a handset for personal use? % of respondents (by income bracket)
Total Less than
$3400
$3400 –$8500
$8600 –$11699
$11700 –$14699
$14700 –$44299
$44300 – $107000
More than
$107000
Would prefer not to
answer
D.K
Yes, I pay for it 76 60 76 84 86 85 80 94 67 76
Yes, employer pays 1 1 1 1 1 4 0 0 0 0
Yes, somebody else pays 3 2 3 4 2 4 8 0 11 0
No, I do not 20 37 21 10 11 7 12 6 22 24
Base : Unwtd 1,428 264 629 219 133 114 25 18 9 17
Figure 375: H3. What brand is your current mobile handset? Samsung 18 19 16 17 23 22 14 18 0 23
Nokia 28 35 30 20 24 28 23 12 43 31
LG 16 10 16 19 18 18 14 35 14 15
Base : Unwtd 1,147 167 499 197 119 106 22 17 7 13
Figure 376: H8. How much do you spend, on average, on mobile telephone bills per month? Up to 100 Pesos 43 61 47 35 32 28 36 35 57 38
101 – 300 Pesos 38 28 39 47 38 34 32 35 14 31
301 – 500 Pesos 11 7 9 10 21 21 14 18 0 15
501 – 700 Pesos 5 3 3 6 5 8 5 6 0 15
701 – 1000 Pesos 2 1 1 2 3 7 9 0 14 0
Over 1000 Pesos 1 0 0 0 1 3 5 6 0 0
Base : Unwtd 1,147 167 499 197 119 106 22 17 7 13
Figure 377: H11. Do you plan to upgrade to a Smartphone in the next 12 months? Yes 50 45 48 56 53 61 67 50 0 50
No 50 55 52 44 47 39 33 50 100 50Base : Unwtd 213 29 105 34 17 18 3 2 1 4
Figure 378: H12. Which brand of Smartphone handset will you buy? Nokia 23 36 25 15 22 12 23 10 50 29
Samsung 22 11 23 25 20 29 15 20 25 29
Lg 15 13 17 16 9 12 8 50 25 0
Sony Ericsson 14 6 12 18 18 18 31 10 0 0
Base : Unwtd 524 70 220 96 55 49 13 10 4 7
Figure 379: H13. Is your next handset likely to be a 3G handset? Yes 70 49 66 81 82 84 92 60 75 57
No 23 36 27 15 13 12 8 40 25 14
Don’t Know 7 16 7 4 5 4 0 0 0 29
Base : Unwtd 524 70 220 96 55 49 13 10 4 7
Figure 380: H8. How much do you spend, on average, on mobile telephone bills per month?
Source: Credit Suisse emerging markets consumer survey
6147
35 32 28 36 35
2839
4738
3432 35
7 9 1021
21 14 18567 9 0
0 0 0 1 3 5 6
0%
20%
40%
60%
80%
100%
Up to $3,399 $3,400 - $8,500 $8,600 - $11,699 $11,700 - $14,699 $14700 - $44,299 $44,300 - $107,000 More than $107,000
% o
f res
pond
ents
100 Pesos or less (100) 101 Pesos to 300 Pesos (200) 301 Pesos to 500 Pesos (400)501 Pesos to 700 Pesos (600) 701 Pesos to 1,000 Pesos (850) More than 1,000 Pesos (1000)
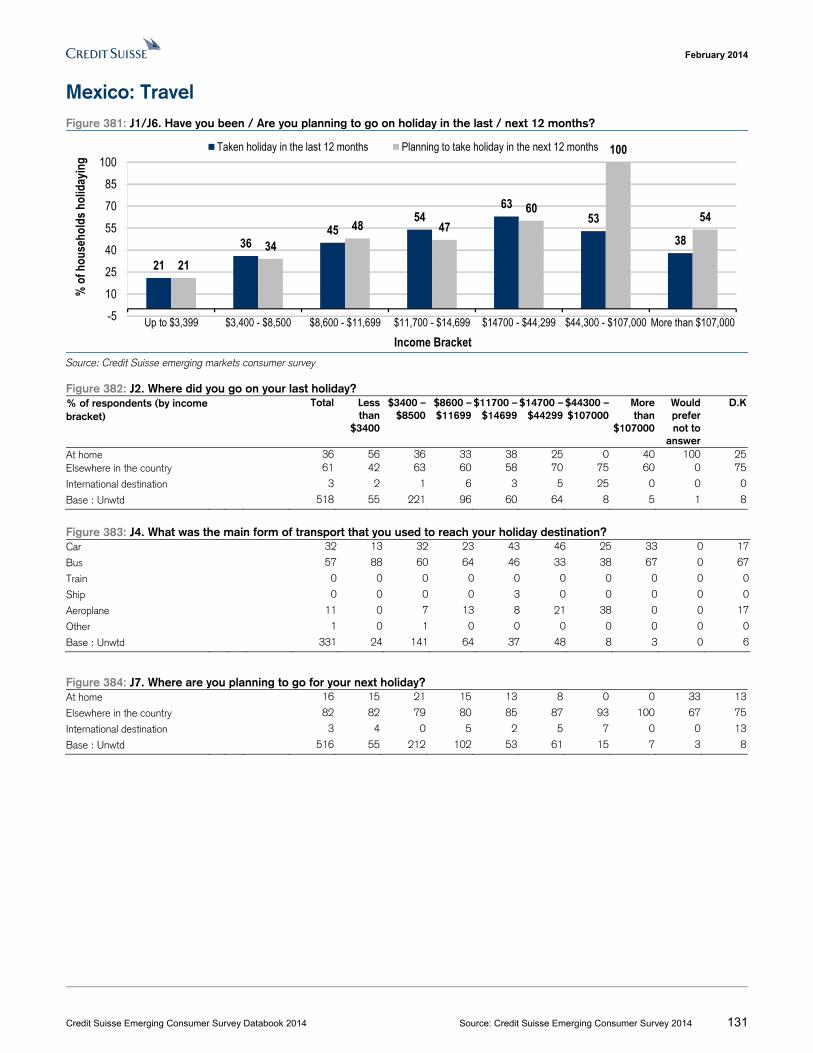
February 2014
Credit Suisse Emerging Consumer Survey Databook 2014 Source: Credit Suisse Emerging Consumer Survey 2014 131
Mexico: Travel Figure 381: J1/J6. Have you been / Are you planning to go on holiday in the last / next 12 months?
Source: Credit Suisse emerging markets consumer survey
Figure 382: J2. Where did you go on your last holiday? % of respondents (by income bracket)
Total Less than
$3400
$3400 –$8500
$8600 –$11699
$11700 –$14699
$14700 –$44299
$44300 – $107000
More than
$107000
Would prefer not to
answer
D.K
At home 36 56 36 33 38 25 0 40 100 25Elsewhere in the country 61 42 63 60 58 70 75 60 0 75
International destination 3 2 1 6 3 5 25 0 0 0
Base : Unwtd 518 55 221 96 60 64 8 5 1 8
Figure 383: J4. What was the main form of transport that you used to reach your holiday destination? Car 32 13 32 23 43 46 25 33 0 17
Bus 57 88 60 64 46 33 38 67 0 67
Train 0 0 0 0 0 0 0 0 0 0
Ship 0 0 0 0 3 0 0 0 0 0
Aeroplane 11 0 7 13 8 21 38 0 0 17
Other 1 0 1 0 0 0 0 0 0 0
Base : Unwtd 331 24 141 64 37 48 8 3 0 6
Figure 384: J7. Where are you planning to go for your next holiday? At home 16 15 21 15 13 8 0 0 33 13
Elsewhere in the country 82 82 79 80 85 87 93 100 67 75
International destination 3 4 0 5 2 5 7 0 0 13
Base : Unwtd 516 55 212 102 53 61 15 7 3 8
2136
4554
6353
38
2134
48 4760
100
54
-5
10
25
40
55
70
85
100
Up to $3,399 $3,400 - $8,500 $8,600 - $11,699 $11,700 - $14,699 $14700 - $44,299 $44,300 - $107,000 More than $107,000
% o
f hou
seho
lds h
olid
ayin
g
Income Bracket
Taken holiday in the last 12 months Planning to take holiday in the next 12 months
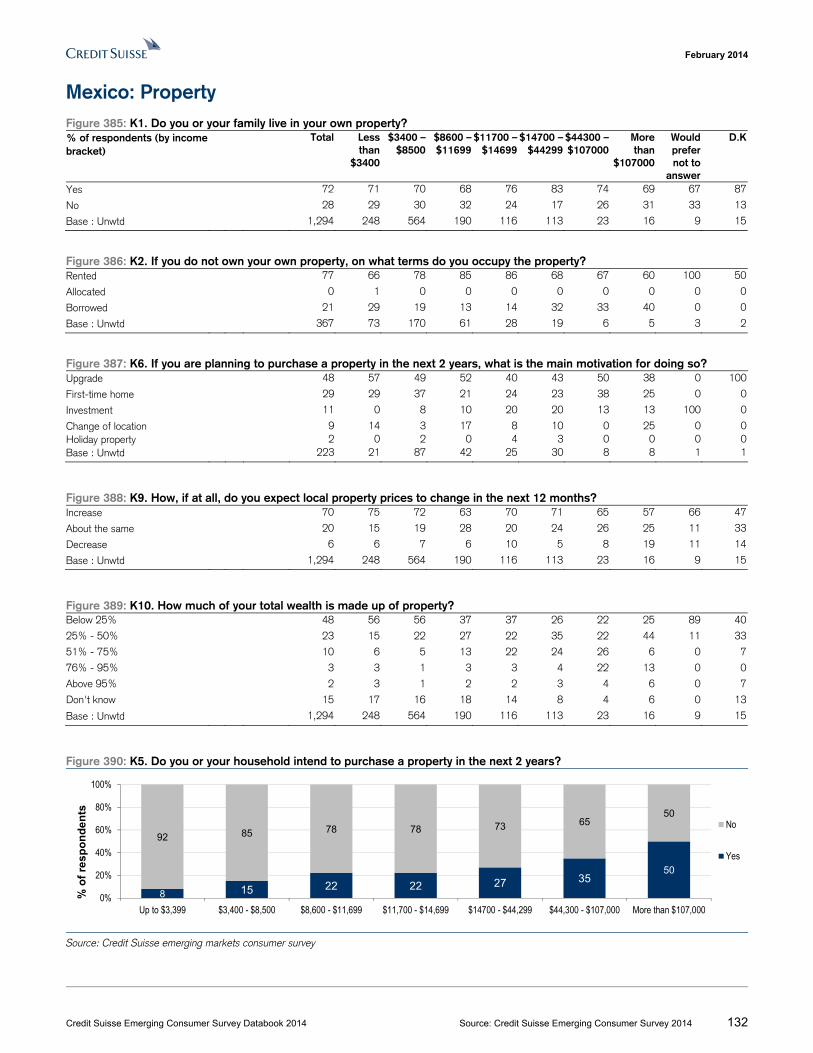
February 2014
Credit Suisse Emerging Consumer Survey Databook 2014 Source: Credit Suisse Emerging Consumer Survey 2014 132
Mexico: Property Figure 385: K1. Do you or your family live in your own property? % of respondents (by income bracket)
Total Less than
$3400
$3400 –$8500
$8600 –$11699
$11700 –$14699
$14700 –$44299
$44300 – $107000
More than
$107000
Would prefer not to
answer
D.K
Yes 72 71 70 68 76 83 74 69 67 87
No 28 29 30 32 24 17 26 31 33 13
Base : Unwtd 1,294 248 564 190 116 113 23 16 9 15
Figure 386: K2. If you do not own your own property, on what terms do you occupy the property? Rented 77 66 78 85 86 68 67 60 100 50
Allocated 0 1 0 0 0 0 0 0 0 0
Borrowed 21 29 19 13 14 32 33 40 0 0
Base : Unwtd 367 73 170 61 28 19 6 5 3 2
Figure 387: K6. If you are planning to purchase a property in the next 2 years, what is the main motivation for doing so? Upgrade 48 57 49 52 40 43 50 38 0 100
First-time home 29 29 37 21 24 23 38 25 0 0
Investment 11 0 8 10 20 20 13 13 100 0
Change of location 9 14 3 17 8 10 0 25 0 0Holiday property 2 0 2 0 4 3 0 0 0 0Base : Unwtd 223 21 87 42 25 30 8 8 1 1
Figure 388: K9. How, if at all, do you expect local property prices to change in the next 12 months? Increase 70 75 72 63 70 71 65 57 66 47
About the same 20 15 19 28 20 24 26 25 11 33
Decrease 6 6 7 6 10 5 8 19 11 14
Base : Unwtd 1,294 248 564 190 116 113 23 16 9 15
Figure 389: K10. How much of your total wealth is made up of property? Below 25% 48 56 56 37 37 26 22 25 89 40
25% - 50% 23 15 22 27 22 35 22 44 11 33
51% - 75% 10 6 5 13 22 24 26 6 0 7
76% - 95% 3 3 1 3 3 4 22 13 0 0
Above 95% 2 3 1 2 2 3 4 6 0 7
Don't know 15 17 16 18 14 8 4 6 0 13
Base : Unwtd 1,294 248 564 190 116 113 23 16 9 15
Figure 390: K5. Do you or your household intend to purchase a property in the next 2 years?
Source: Credit Suisse emerging markets consumer survey
8 15 22 22 27 3550
92 85 78 78 73 6550
0%
20%
40%
60%
80%
100%
Up to $3,399 $3,400 - $8,500 $8,600 - $11,699 $11,700 - $14,699 $14700 - $44,299 $44,300 - $107,000 More than $107,000
% o
f re
sp
on
de
nts
No
Yes
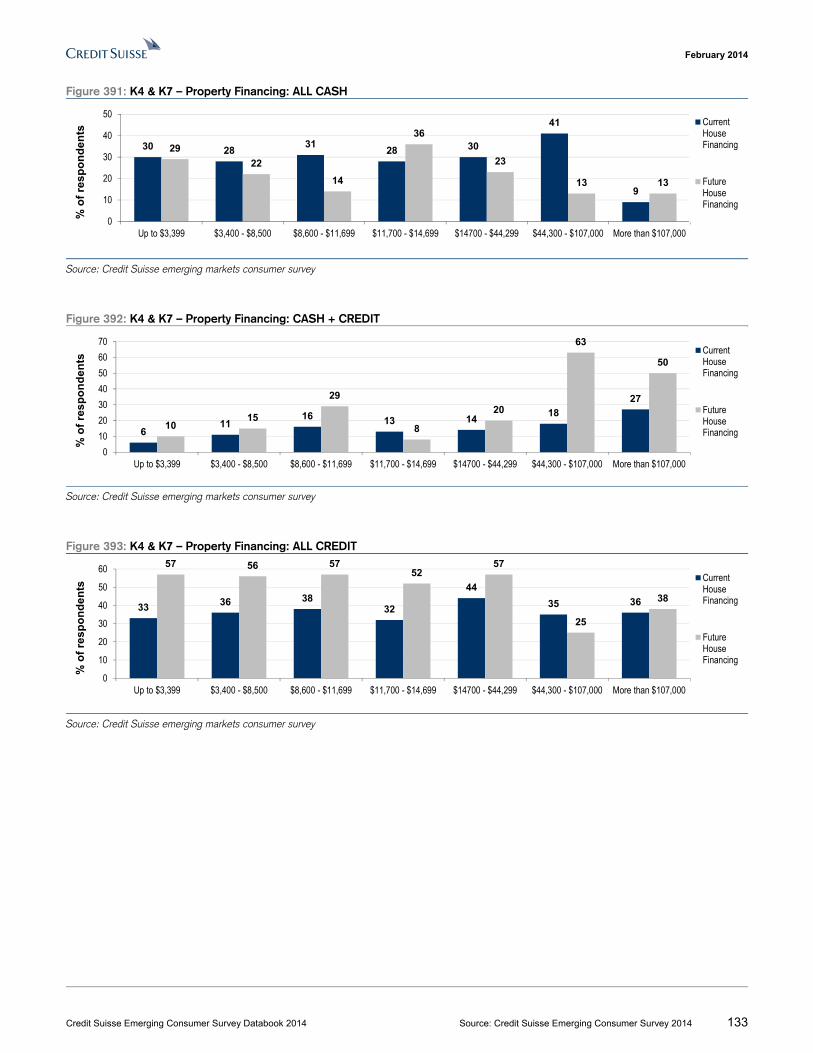
February 2014
Credit Suisse Emerging Consumer Survey Databook 2014 Source: Credit Suisse Emerging Consumer Survey 2014 133
Figure 391: K4 & K7 – Property Financing: ALL CASH
Source: Credit Suisse emerging markets consumer survey
Figure 392: K4 & K7 – Property Financing: CASH + CREDIT
Source: Credit Suisse emerging markets consumer survey
Figure 393: K4 & K7 – Property Financing: ALL CREDIT
Source: Credit Suisse emerging markets consumer survey
30 2831
28 30
41
9
29
22
14
36
23
13 13
0
10
20
30
40
50
Up to $3,399 $3,400 - $8,500 $8,600 - $11,699 $11,700 - $14,699 $14700 - $44,299 $44,300 - $107,000 More than $107,000
% o
f re
sp
on
de
nts
CurrentHouseFinancing
FutureHouseFinancing
611
16 13 1418
27
1015
29
8
20
63
50
0
10
20
30
40
50
60
70
Up to $3,399 $3,400 - $8,500 $8,600 - $11,699 $11,700 - $14,699 $14700 - $44,299 $44,300 - $107,000 More than $107,000
% o
f re
sp
on
de
nts
CurrentHouseFinancing
FutureHouseFinancing
33 36 3832
44
35 36
57 56 5752
57
25
38
0
10
20
30
40
50
60
Up to $3,399 $3,400 - $8,500 $8,600 - $11,699 $11,700 - $14,699 $14700 - $44,299 $44,300 - $107,000 More than $107,000
% o
f re
sp
on
de
nts
CurrentHouseFinancing
FutureHouseFinancing
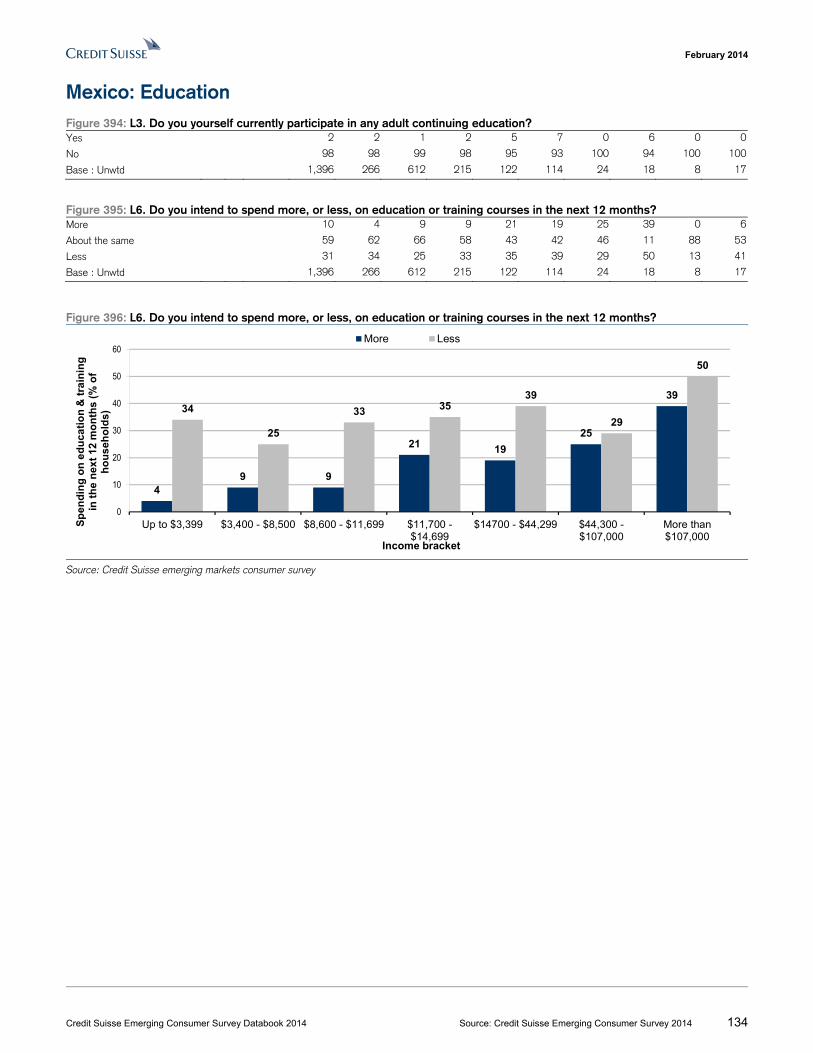
February 2014
Credit Suisse Emerging Consumer Survey Databook 2014 Source: Credit Suisse Emerging Consumer Survey 2014 134
Mexico: Education Figure 394: L3. Do you yourself currently participate in any adult continuing education? Yes 2 2 1 2 5 7 0 6 0 0
No 98 98 99 98 95 93 100 94 100 100
Base : Unwtd 1,396 266 612 215 122 114 24 18 8 17
Figure 395: L6. Do you intend to spend more, or less, on education or training courses in the next 12 months? More 10 4 9 9 21 19 25 39 0 6
About the same 59 62 66 58 43 42 46 11 88 53
Less 31 34 25 33 35 39 29 50 13 41
Base : Unwtd 1,396 266 612 215 122 114 24 18 8 17
Figure 396: L6. Do you intend to spend more, or less, on education or training courses in the next 12 months?
Source: Credit Suisse emerging markets consumer survey
49 9
21 19
25
3934
25
33 3539
29
50
0
10
20
30
40
50
60
Up to $3,399 $3,400 - $8,500 $8,600 - $11,699 $11,700 -$14,699
$14700 - $44,299 $44,300 -$107,000
More than$107,000
Sp
end
ing
on
ed
uca
tio
n &
tra
inin
g
in t
he
nex
t 12
mo
nth
s (
% o
f h
ou
seh
old
s)
Income bracket
More Less
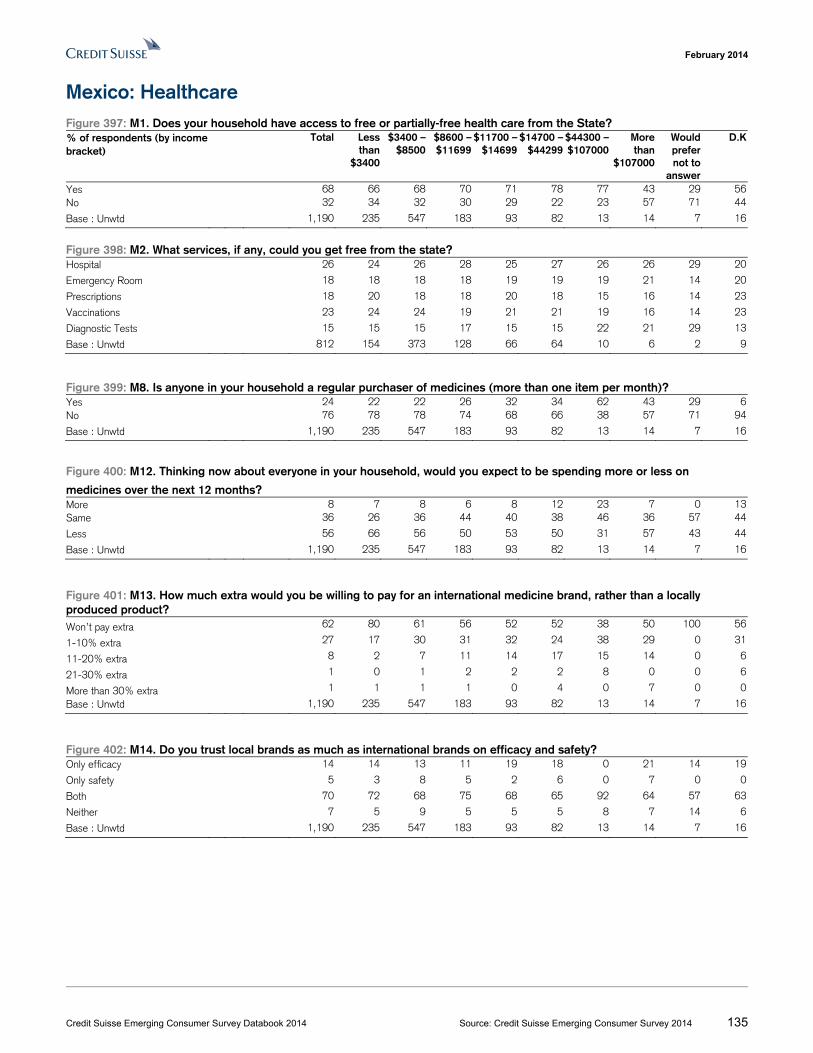
February 2014
Credit Suisse Emerging Consumer Survey Databook 2014 Source: Credit Suisse Emerging Consumer Survey 2014 135
Mexico: Healthcare Figure 397: M1. Does your household have access to free or partially-free health care from the State? % of respondents (by income bracket)
Total Less than
$3400
$3400 –$8500
$8600 –$11699
$11700 –$14699
$14700 –$44299
$44300 – $107000
More than
$107000
Would prefer not to
answer
D.K
Yes 68 66 68 70 71 78 77 43 29 56No 32 34 32 30 29 22 23 57 71 44
Base : Unwtd 1,190 235 547 183 93 82 13 14 7 16
Figure 398: M2. What services, if any, could you get free from the state? Hospital 26 24 26 28 25 27 26 26 29 20
Emergency Room 18 18 18 18 19 19 19 21 14 20
Prescriptions 18 20 18 18 20 18 15 16 14 23
Vaccinations 23 24 24 19 21 21 19 16 14 23
Diagnostic Tests 15 15 15 17 15 15 22 21 29 13
Base : Unwtd 812 154 373 128 66 64 10 6 2 9
Figure 399: M8. Is anyone in your household a regular purchaser of medicines (more than one item per month)? Yes 24 22 22 26 32 34 62 43 29 6No 76 78 78 74 68 66 38 57 71 94
Base : Unwtd 1,190 235 547 183 93 82 13 14 7 16
Figure 400: M12. Thinking now about everyone in your household, would you expect to be spending more or less on
medicines over the next 12 months? More 8 7 8 6 8 12 23 7 0 13Same 36 26 36 44 40 38 46 36 57 44
Less 56 66 56 50 53 50 31 57 43 44
Base : Unwtd 1,190 235 547 183 93 82 13 14 7 16
Figure 401: M13. How much extra would you be willing to pay for an international medicine brand, rather than a locally produced product? Won’t pay extra 62 80 61 56 52 52 38 50 100 56
1-10% extra 27 17 30 31 32 24 38 29 0 31
11-20% extra 8 2 7 11 14 17 15 14 0 6
21-30% extra 1 0 1 2 2 2 8 0 0 6
More than 30% extra 1 1 1 1 0 4 0 7 0 0
Base : Unwtd 1,190 235 547 183 93 82 13 14 7 16
Figure 402: M14. Do you trust local brands as much as international brands on efficacy and safety? Only efficacy 14 14 13 11 19 18 0 21 14 19
Only safety 5 3 8 5 2 6 0 7 0 0
Both 70 72 68 75 68 65 92 64 57 63
Neither 7 5 9 5 5 5 8 7 14 6
Base : Unwtd 1,190 235 547 183 93 82 13 14 7 16
February 2014
Credit Suisse Emerging Consumer Survey Databook 2014 Source: Credit Suisse Emerging Consumer Survey 2014 136
Russia Haves and have-nots
Although Russia exhibits the greatest structural weakness in consumption among the BRICS countries, it has demonstrated some improvement in expectations this year. Alongside South Africa, Russia is the only other country surveyed in which personal finance expectations have strengthened relative to last year. Going forward, we expect a strong performance in a number of discretionary areas. We expect this to be driven entirely by the higher income bracket, as we note that a further divergence between rich and poor is taking place. We note a 5% drop in lower income earners expecting an improvement in their personal finances since the last survey.
The net percentage of people expecting an improvement versus a deterioration in their own financial position rose marginally from 16% last year to 18% this year. Although positive in its own right, on an absolute basis, this degree of optimism continues to be far lower than that seen in Brazil, China and Indonesia (with readings of 64%, 42% and 37%, respectively). On average, income growth expectations grew marginally this year, with nominal growth of around 2.3% (from 1.9%). Again, the richest expect the biggest growth, with about 4% nominal growth estimated for this year. However, with projected inflation above these levels – Credit Suisse forecasts 6.7% for 2013 – we believe any income growth will be negative in real terms, even for the wealthiest end of the spectrum.
Internet access and smartphone spending have shown the greatest momentum relative to other sectors, each having grown more than 10% in 2013. On the ground, an almost complete 3G network, growing 4G network, and declining handset prices should all support further growth in smartphone penetration and the data market. Categories geared to the poorer consumer such as beer, dairy and carbonated drinks largely showed insignificant increases, while those areas related to higherincome individuals (e.g. autos, computers and holidays) have seen at least 5% growth over 2013. Alcoholic consumption failed to drop significantly despite regulatory changes aimed at decreasing consumption - a ban on advertisements and an excise tax increase. Forecast alcohol consumption over the next year registers a small increase, even in the face of further excise growth. Our analysts suggest beer companies will need to raise prices by 5%, and spirit companies by 10%, to offset this.
On average, savings represent a little less than 8% of monthly spending – 3% shy of the survey average. Sophisticated investment vehicles – such as the stock market or mutual funds – remain insignificant. Given the large number of high net worth individuals, however, we firmly suggest wealth accumulation is biased towards the rich.
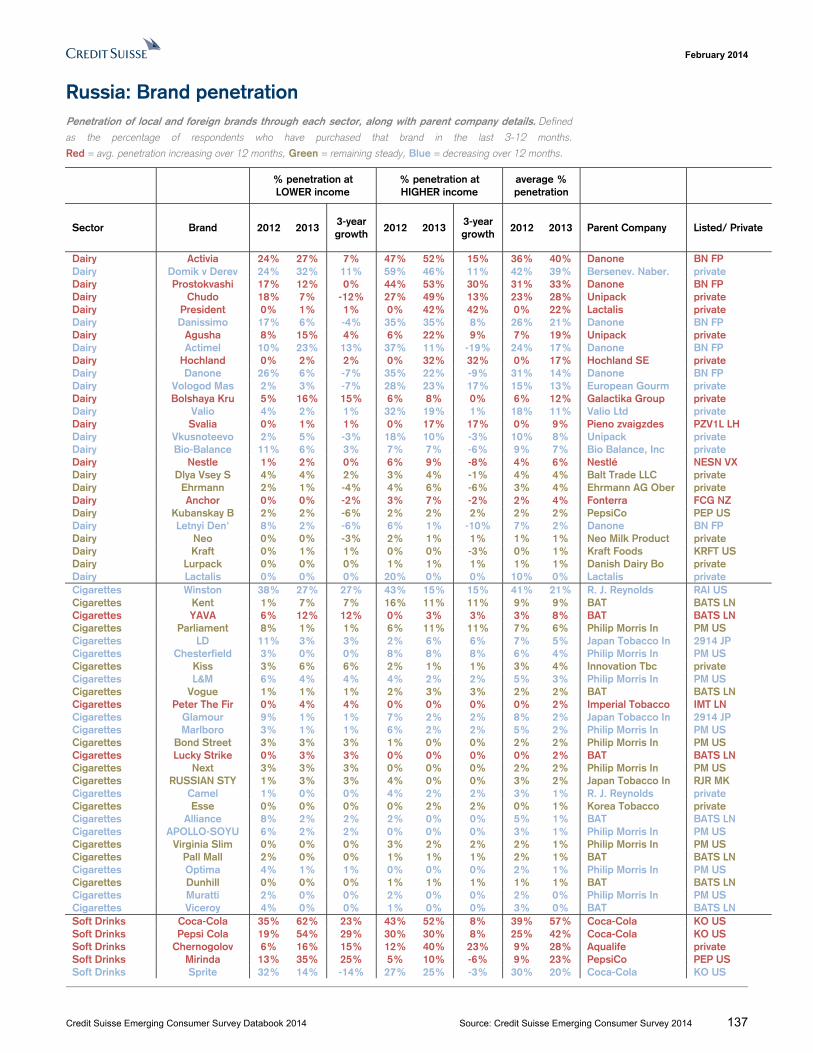
February 2014
Credit Suisse Emerging Consumer Survey Databook 2014 Source: Credit Suisse Emerging Consumer Survey 2014 137
Russia: Brand penetration Penetration of local and foreign brands through each sector, along with parent company details. Defined
as the percentage of respondents who have purchased that brand in the last 3-12 months.
Red = avg. penetration increasing over 12 months, Green = remaining steady, Blue = decreasing over 12 months.
% penetration at LOWER income
% penetration at HIGHER income
average % penetration
Sector Brand 2012 2013 3-year growth
2012 2013 3-year growth
2012 2013 Parent Company Listed/ Private
Dairy Activia 24% 27% 7% 47% 52% 15% 36% 40% Danone BN FP Dairy Domik v Derev 24% 32% 11% 59% 46% 11% 42% 39% Bersenev. Naber. private Dairy Prostokvashi 17% 12% 0% 44% 53% 30% 31% 33% Danone BN FP Dairy Chudo 18% 7% -12% 27% 49% 13% 23% 28% Unipack private Dairy President 0% 1% 1% 0% 42% 42% 0% 22% Lactalis private Dairy Danissimo 17% 6% -4% 35% 35% 8% 26% 21% Danone BN FP Dairy Agusha 8% 15% 4% 6% 22% 9% 7% 19% Unipack private Dairy Actimel 10% 23% 13% 37% 11% -19% 24% 17% Danone BN FP Dairy Hochland 0% 2% 2% 0% 32% 32% 0% 17% Hochland SE private Dairy Danone 26% 6% -7% 35% 22% -9% 31% 14% Danone BN FP Dairy Vologod Mas 2% 3% -7% 28% 23% 17% 15% 13% European Gourm private Dairy Bolshaya Kru 5% 16% 15% 6% 8% 0% 6% 12% Galactika Group private Dairy Valio 4% 2% 1% 32% 19% 1% 18% 11% Valio Ltd private Dairy Svalia 0% 1% 1% 0% 17% 17% 0% 9% Pieno zvaigzdes PZV1L LH Dairy Vkusnoteevo 2% 5% -3% 18% 10% -3% 10% 8% Unipack private Dairy Bio-Balance 11% 6% 3% 7% 7% -6% 9% 7% Bio Balance, Inc private Dairy Nestle 1% 2% 0% 6% 9% -8% 4% 6% Nestlé NESN VX Dairy Dlya Vsey S 4% 4% 2% 3% 4% -1% 4% 4% Balt Trade LLC private Dairy Ehrmann 2% 1% -4% 4% 6% -6% 3% 4% Ehrmann AG Ober private Dairy Anchor 0% 0% -2% 3% 7% -2% 2% 4% Fonterra FCG NZ Dairy Kubanskay B 2% 2% -6% 2% 2% 2% 2% 2% PepsiCo PEP US Dairy Letnyi Den' 8% 2% -6% 6% 1% -10% 7% 2% Danone BN FP Dairy Neo 0% 0% -3% 2% 1% 1% 1% 1% Neo Milk Product private Dairy Kraft 0% 1% 1% 0% 0% -3% 0% 1% Kraft Foods KRFT US Dairy Lurpack 0% 0% 0% 1% 1% 1% 1% 1% Danish Dairy Bo private Dairy Lactalis 0% 0% 0% 20% 0% 0% 10% 0% Lactalis private Cigarettes Winston 38% 27% 27% 43% 15% 15% 41% 21% R. J. Reynolds RAI US Cigarettes Kent 1% 7% 7% 16% 11% 11% 9% 9% BAT BATS LN Cigarettes YAVA 6% 12% 12% 0% 3% 3% 3% 8% BAT BATS LN Cigarettes Parliament 8% 1% 1% 6% 11% 11% 7% 6% Philip Morris In PM US Cigarettes LD 11% 3% 3% 2% 6% 6% 7% 5% Japan Tobacco In 2914 JP Cigarettes Chesterfield 3% 0% 0% 8% 8% 8% 6% 4% Philip Morris In PM US Cigarettes Kiss 3% 6% 6% 2% 1% 1% 3% 4% Innovation Tbc private Cigarettes L&M 6% 4% 4% 4% 2% 2% 5% 3% Philip Morris In PM US Cigarettes Vogue 1% 1% 1% 2% 3% 3% 2% 2% BAT BATS LN Cigarettes Peter The Fir 0% 4% 4% 0% 0% 0% 0% 2% Imperial Tobacco IMT LN Cigarettes Glamour 9% 1% 1% 7% 2% 2% 8% 2% Japan Tobacco In 2914 JP Cigarettes Marlboro 3% 1% 1% 6% 2% 2% 5% 2% Philip Morris In PM US Cigarettes Bond Street 3% 3% 3% 1% 0% 0% 2% 2% Philip Morris In PM US Cigarettes Lucky Strike 0% 3% 3% 0% 0% 0% 0% 2% BAT BATS LN Cigarettes Next 3% 3% 3% 0% 0% 0% 2% 2% Philip Morris In PM US Cigarettes RUSSIAN STY 1% 3% 3% 4% 0% 0% 3% 2% Japan Tobacco In RJR MK Cigarettes Camel 1% 0% 0% 4% 2% 2% 3% 1% R. J. Reynolds private Cigarettes Esse 0% 0% 0% 0% 2% 2% 0% 1% Korea Tobacco private Cigarettes Alliance 8% 2% 2% 2% 0% 0% 5% 1% BAT BATS LN Cigarettes APOLLO-SOYU 6% 2% 2% 0% 0% 0% 3% 1% Philip Morris In PM US Cigarettes Virginia Slim 0% 0% 0% 3% 2% 2% 2% 1% Philip Morris In PM US Cigarettes Pall Mall 2% 0% 0% 1% 1% 1% 2% 1% BAT BATS LN Cigarettes Optima 4% 1% 1% 0% 0% 0% 2% 1% Philip Morris In PM US Cigarettes Dunhill 0% 0% 0% 1% 1% 1% 1% 1% BAT BATS LN Cigarettes Muratti 2% 0% 0% 2% 0% 0% 2% 0% Philip Morris In PM US Cigarettes Viceroy 4% 0% 0% 1% 0% 0% 3% 0% BAT BATS LN Soft Drinks Coca-Cola 35% 62% 23% 43% 52% 8% 39% 57% Coca-Cola KO US Soft Drinks Pepsi Cola 19% 54% 29% 30% 30% 8% 25% 42% Coca-Cola KO US Soft Drinks Chernogolov 6% 16% 15% 12% 40% 23% 9% 28% Aqualife private Soft Drinks Mirinda 13% 35% 25% 5% 10% -6% 9% 23% PepsiCo PEP US Soft Drinks Sprite 32% 14% -14% 27% 25% -3% 30% 20% Coca-Cola KO US
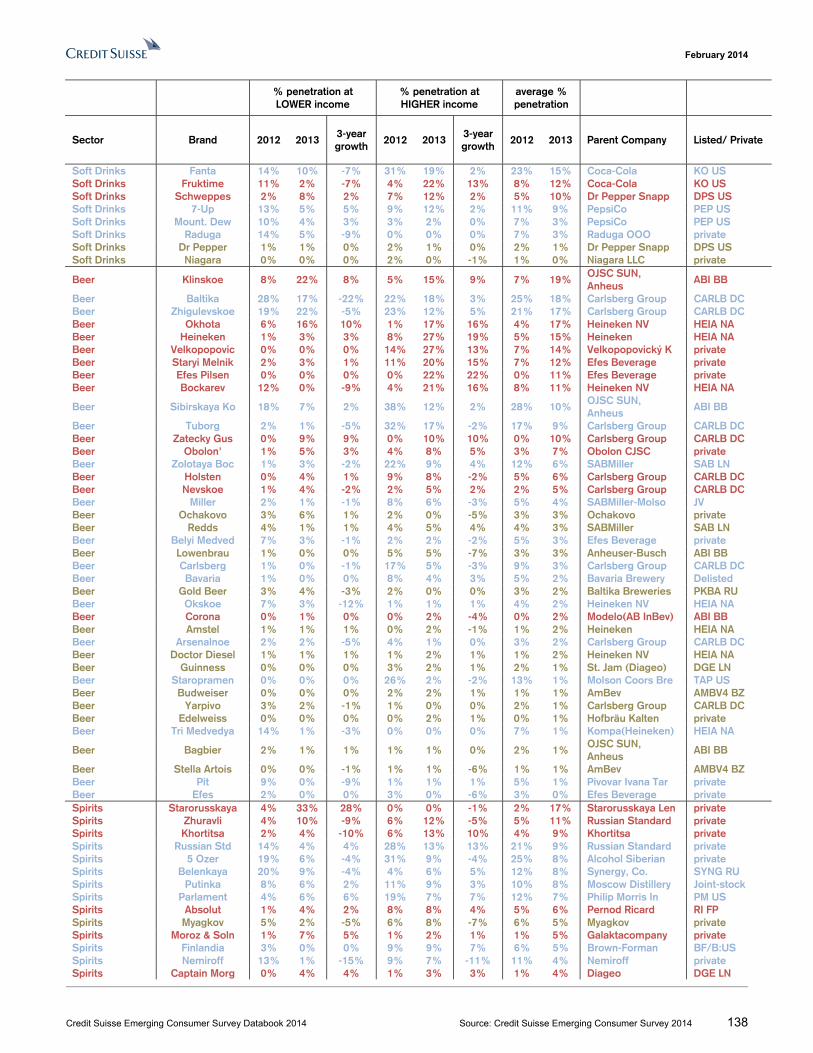
February 2014
Credit Suisse Emerging Consumer Survey Databook 2014 Source: Credit Suisse Emerging Consumer Survey 2014 138
% penetration at LOWER income
% penetration at HIGHER income
average % penetration
Sector Brand 2012 2013 3-year growth
2012 2013 3-year growth
2012 2013 Parent Company Listed/ Private
Soft Drinks Fanta 14% 10% -7% 31% 19% 2% 23% 15% Coca-Cola KO US Soft Drinks Fruktime 11% 2% -7% 4% 22% 13% 8% 12% Coca-Cola KO US Soft Drinks Schweppes 2% 8% 2% 7% 12% 2% 5% 10% Dr Pepper Snapp DPS US Soft Drinks 7-Up 13% 5% 5% 9% 12% 2% 11% 9% PepsiCo PEP US Soft Drinks Mount. Dew 10% 4% 3% 3% 2% 0% 7% 3% PepsiCo PEP US Soft Drinks Raduga 14% 5% -9% 0% 0% 0% 7% 3% Raduga OOO private Soft Drinks Dr Pepper 1% 1% 0% 2% 1% 0% 2% 1% Dr Pepper Snapp DPS US Soft Drinks Niagara 0% 0% 0% 2% 0% -1% 1% 0% Niagara LLC private
Beer Klinskoe 8% 22% 8% 5% 15% 9% 7% 19% OJSC SUN, Anheus
ABI BB
Beer Baltika 28% 17% -22% 22% 18% 3% 25% 18% Carlsberg Group CARLB DC Beer Zhigulevskoe 19% 22% -5% 23% 12% 5% 21% 17% Carlsberg Group CARLB DC Beer Okhota 6% 16% 10% 1% 17% 16% 4% 17% Heineken NV HEIA NA Beer Heineken 1% 3% 3% 8% 27% 19% 5% 15% Heineken HEIA NA Beer Velkopopovic 0% 0% 0% 14% 27% 13% 7% 14% Velkopopovický K private Beer Staryi Melnik 2% 3% 1% 11% 20% 15% 7% 12% Efes Beverage private Beer Efes Pilsen 0% 0% 0% 0% 22% 22% 0% 11% Efes Beverage private Beer Bockarev 12% 0% -9% 4% 21% 16% 8% 11% Heineken NV HEIA NA
Beer Sibirskaya Ko 18% 7% 2% 38% 12% 2% 28% 10% OJSC SUN, Anheus
ABI BB
Beer Tuborg 2% 1% -5% 32% 17% -2% 17% 9% Carlsberg Group CARLB DC Beer Zatecky Gus 0% 9% 9% 0% 10% 10% 0% 10% Carlsberg Group CARLB DC Beer Obolon' 1% 5% 3% 4% 8% 5% 3% 7% Obolon CJSC private Beer Zolotaya Boc 1% 3% -2% 22% 9% 4% 12% 6% SABMiller SAB LN Beer Holsten 0% 4% 1% 9% 8% -2% 5% 6% Carlsberg Group CARLB DC Beer Nevskoe 1% 4% -2% 2% 5% 2% 2% 5% Carlsberg Group CARLB DC Beer Miller 2% 1% -1% 8% 6% -3% 5% 4% SABMiller-Molso JV Beer Ochakovo 3% 6% 1% 2% 0% -5% 3% 3% Ochakovo private Beer Redds 4% 1% 1% 4% 5% 4% 4% 3% SABMiller SAB LN Beer Belyi Medved 7% 3% -1% 2% 2% -2% 5% 3% Efes Beverage private Beer Lowenbrau 1% 0% 0% 5% 5% -7% 3% 3% Anheuser-Busch ABI BB Beer Carlsberg 1% 0% -1% 17% 5% -3% 9% 3% Carlsberg Group CARLB DC Beer Bavaria 1% 0% 0% 8% 4% 3% 5% 2% Bavaria Brewery Delisted Beer Gold Beer 3% 4% -3% 2% 0% 0% 3% 2% Baltika Breweries PKBA RU Beer Okskoe 7% 3% -12% 1% 1% 1% 4% 2% Heineken NV HEIA NA Beer Corona 0% 1% 0% 0% 2% -4% 0% 2% Modelo(AB InBev) ABI BB Beer Amstel 1% 1% 1% 0% 2% -1% 1% 2% Heineken HEIA NA Beer Arsenalnoe 2% 2% -5% 4% 1% 0% 3% 2% Carlsberg Group CARLB DC Beer Doctor Diesel 1% 1% 1% 1% 2% 1% 1% 2% Heineken NV HEIA NA Beer Guinness 0% 0% 0% 3% 2% 1% 2% 1% St. Jam (Diageo) DGE LN Beer Staropramen 0% 0% 0% 26% 2% -2% 13% 1% Molson Coors Bre TAP US Beer Budweiser 0% 0% 0% 2% 2% 1% 1% 1% AmBev AMBV4 BZ Beer Yarpivo 3% 2% -1% 1% 0% 0% 2% 1% Carlsberg Group CARLB DC Beer Edelweiss 0% 0% 0% 0% 2% 1% 0% 1% Hofbräu Kalten private Beer Tri Medvedya 14% 1% -3% 0% 0% 0% 7% 1% Kompa(Heineken) HEIA NA
Beer Bagbier 2% 1% 1% 1% 1% 0% 2% 1% OJSC SUN, Anheus
ABI BB
Beer Stella Artois 0% 0% -1% 1% 1% -6% 1% 1% AmBev AMBV4 BZ Beer Pit 9% 0% -9% 1% 1% 1% 5% 1% Pivovar Ivana Tar private Beer Efes 2% 0% 0% 3% 0% -6% 3% 0% Efes Beverage private Spirits Starorusskaya 4% 33% 28% 0% 0% -1% 2% 17% Starorusskaya Len private Spirits Zhuravli 4% 10% -9% 6% 12% -5% 5% 11% Russian Standard private Spirits Khortitsa 2% 4% -10% 6% 13% 10% 4% 9% Khortitsa private Spirits Russian Std 14% 4% 4% 28% 13% 13% 21% 9% Russian Standard private Spirits 5 Ozer 19% 6% -4% 31% 9% -4% 25% 8% Alcohol Siberian private Spirits Belenkaya 20% 9% -4% 4% 6% 5% 12% 8% Synergy, Co. SYNG RU Spirits Putinka 8% 6% 2% 11% 9% 3% 10% 8% Moscow Distillery Joint-stock Spirits Parlament 4% 6% 6% 19% 7% 7% 12% 7% Philip Morris In PM US Spirits Absolut 1% 4% 2% 8% 8% 4% 5% 6% Pernod Ricard RI FP Spirits Myagkov 5% 2% -5% 6% 8% -7% 6% 5% Myagkov private Spirits Moroz & Soln 1% 7% 5% 1% 2% 1% 1% 5% Galaktacompany private Spirits Finlandia 3% 0% 0% 9% 9% 7% 6% 5% Brown-Forman BF/B:US Spirits Nemiroff 13% 1% -15% 9% 7% -11% 11% 4% Nemiroff private Spirits Captain Morg 0% 4% 4% 1% 3% 3% 1% 4% Diageo DGE LN
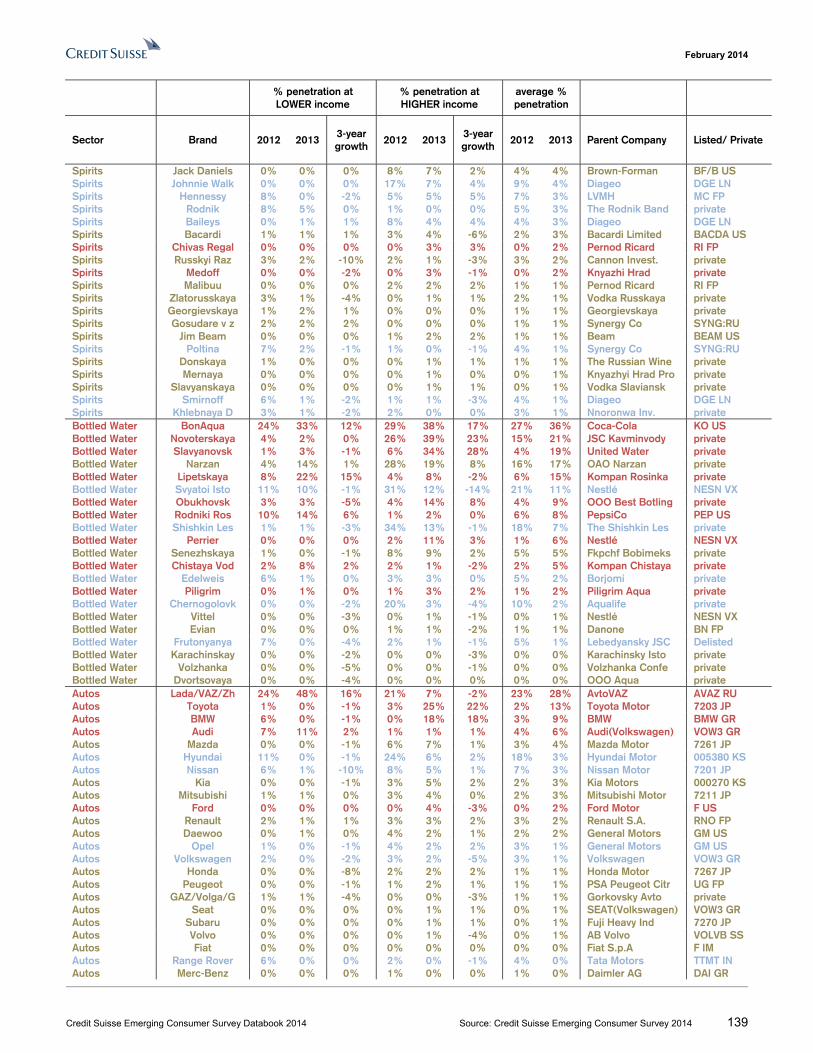
February 2014
Credit Suisse Emerging Consumer Survey Databook 2014 Source: Credit Suisse Emerging Consumer Survey 2014 139
% penetration at LOWER income
% penetration at HIGHER income
average % penetration
Sector Brand 2012 2013 3-year growth
2012 2013 3-year growth
2012 2013 Parent Company Listed/ Private
Spirits Jack Daniels 0% 0% 0% 8% 7% 2% 4% 4% Brown-Forman BF/B US Spirits Johnnie Walk 0% 0% 0% 17% 7% 4% 9% 4% Diageo DGE LN Spirits Hennessy 8% 0% -2% 5% 5% 5% 7% 3% LVMH MC FP Spirits Rodnik 8% 5% 0% 1% 0% 0% 5% 3% The Rodnik Band private Spirits Baileys 0% 1% 1% 8% 4% 4% 4% 3% Diageo DGE LN Spirits Bacardi 1% 1% 1% 3% 4% -6% 2% 3% Bacardi Limited BACDA US Spirits Chivas Regal 0% 0% 0% 0% 3% 3% 0% 2% Pernod Ricard RI FP Spirits Russkyi Raz 3% 2% -10% 2% 1% -3% 3% 2% Cannon Invest. private Spirits Medoff 0% 0% -2% 0% 3% -1% 0% 2% Knyazhi Hrad private Spirits Malibuu 0% 0% 0% 2% 2% 2% 1% 1% Pernod Ricard RI FP Spirits Zlatorusskaya 3% 1% -4% 0% 1% 1% 2% 1% Vodka Russkaya private Spirits Georgievskaya 1% 2% 1% 0% 0% 0% 1% 1% Georgievskaya private Spirits Gosudare v z 2% 2% 2% 0% 0% 0% 1% 1% Synergy Co SYNG:RU Spirits Jim Beam 0% 0% 0% 1% 2% 2% 1% 1% Beam BEAM US Spirits Poltina 7% 2% -1% 1% 0% -1% 4% 1% Synergy Co SYNG:RU Spirits Donskaya 1% 0% 0% 0% 1% 1% 1% 1% The Russian Wine private Spirits Mernaya 0% 0% 0% 0% 1% 0% 0% 1% Knyazhyi Hrad Pro private Spirits Slavyanskaya 0% 0% 0% 0% 1% 1% 0% 1% Vodka Slaviansk private Spirits Smirnoff 6% 1% -2% 1% 1% -3% 4% 1% Diageo DGE LN Spirits Khlebnaya D 3% 1% -2% 2% 0% 0% 3% 1% Nnoronwa Inv. private Bottled Water BonAqua 24% 33% 12% 29% 38% 17% 27% 36% Coca-Cola KO US Bottled Water Novoterskaya 4% 2% 0% 26% 39% 23% 15% 21% JSC Kavminvody private Bottled Water Slavyanovsk 1% 3% -1% 6% 34% 28% 4% 19% United Water private Bottled Water Narzan 4% 14% 1% 28% 19% 8% 16% 17% OAO Narzan private Bottled Water Lipetskaya 8% 22% 15% 4% 8% -2% 6% 15% Kompan Rosinka private Bottled Water Svyatoi Isto 11% 10% -1% 31% 12% -14% 21% 11% Nestlé NESN VX Bottled Water Obukhovsk 3% 3% -5% 4% 14% 8% 4% 9% OOO Best Botling private Bottled Water Rodniki Ros 10% 14% 6% 1% 2% 0% 6% 8% PepsiCo PEP US Bottled Water Shishkin Les 1% 1% -3% 34% 13% -1% 18% 7% The Shishkin Les private Bottled Water Perrier 0% 0% 0% 2% 11% 3% 1% 6% Nestlé NESN VX Bottled Water Senezhskaya 1% 0% -1% 8% 9% 2% 5% 5% Fkpchf Bobimeks private Bottled Water Chistaya Vod 2% 8% 2% 2% 1% -2% 2% 5% Kompan Chistaya private Bottled Water Edelweis 6% 1% 0% 3% 3% 0% 5% 2% Borjomi private Bottled Water Piligrim 0% 1% 0% 1% 3% 2% 1% 2% Piligrim Aqua private Bottled Water Chernogolovk 0% 0% -2% 20% 3% -4% 10% 2% Aqualife private Bottled Water Vittel 0% 0% -3% 0% 1% -1% 0% 1% Nestlé NESN VX Bottled Water Evian 0% 0% 0% 1% 1% -2% 1% 1% Danone BN FP Bottled Water Frutonyanya 7% 0% -4% 2% 1% -1% 5% 1% Lebedyansky JSC Delisted Bottled Water Karachinskay 0% 0% -2% 0% 0% -3% 0% 0% Karachinsky Isto private Bottled Water Volzhanka 0% 0% -5% 0% 0% -1% 0% 0% Volzhanka Confe private Bottled Water Dvortsovaya 0% 0% -4% 0% 0% 0% 0% 0% OOO Aqua private Autos Lada/VAZ/Zh 24% 48% 16% 21% 7% -2% 23% 28% AvtoVAZ AVAZ RU Autos Toyota 1% 0% -1% 3% 25% 22% 2% 13% Toyota Motor 7203 JP Autos BMW 6% 0% -1% 0% 18% 18% 3% 9% BMW BMW GR Autos Audi 7% 11% 2% 1% 1% 1% 4% 6% Audi(Volkswagen) VOW3 GR Autos Mazda 0% 0% -1% 6% 7% 1% 3% 4% Mazda Motor 7261 JP Autos Hyundai 11% 0% -1% 24% 6% 2% 18% 3% Hyundai Motor 005380 KS Autos Nissan 6% 1% -10% 8% 5% 1% 7% 3% Nissan Motor 7201 JP Autos Kia 0% 0% -1% 3% 5% 2% 2% 3% Kia Motors 000270 KS Autos Mitsubishi 1% 1% 0% 3% 4% 0% 2% 3% Mitsubishi Motor 7211 JP Autos Ford 0% 0% 0% 0% 4% -3% 0% 2% Ford Motor F US Autos Renault 2% 1% 1% 3% 3% 2% 3% 2% Renault S.A. RNO FP Autos Daewoo 0% 1% 0% 4% 2% 1% 2% 2% General Motors GM US Autos Opel 1% 0% -1% 4% 2% 2% 3% 1% General Motors GM US Autos Volkswagen 2% 0% -2% 3% 2% -5% 3% 1% Volkswagen VOW3 GR Autos Honda 0% 0% -8% 2% 2% 2% 1% 1% Honda Motor 7267 JP Autos Peugeot 0% 0% -1% 1% 2% 1% 1% 1% PSA Peugeot Citr UG FP Autos GAZ/Volga/G 1% 1% -4% 0% 0% -3% 1% 1% Gorkovsky Avto private Autos Seat 0% 0% 0% 0% 1% 1% 0% 1% SEAT(Volkswagen) VOW3 GR Autos Subaru 0% 0% 0% 0% 1% 1% 0% 1% Fuji Heavy Ind 7270 JP Autos Volvo 0% 0% 0% 0% 1% -4% 0% 1% AB Volvo VOLVB SS Autos Fiat 0% 0% 0% 0% 0% 0% 0% 0% Fiat S.p.A F IM Autos Range Rover 6% 0% 0% 2% 0% -1% 4% 0% Tata Motors TTMT IN Autos Merc-Benz 0% 0% 0% 1% 0% 0% 1% 0% Daimler AG DAI GR
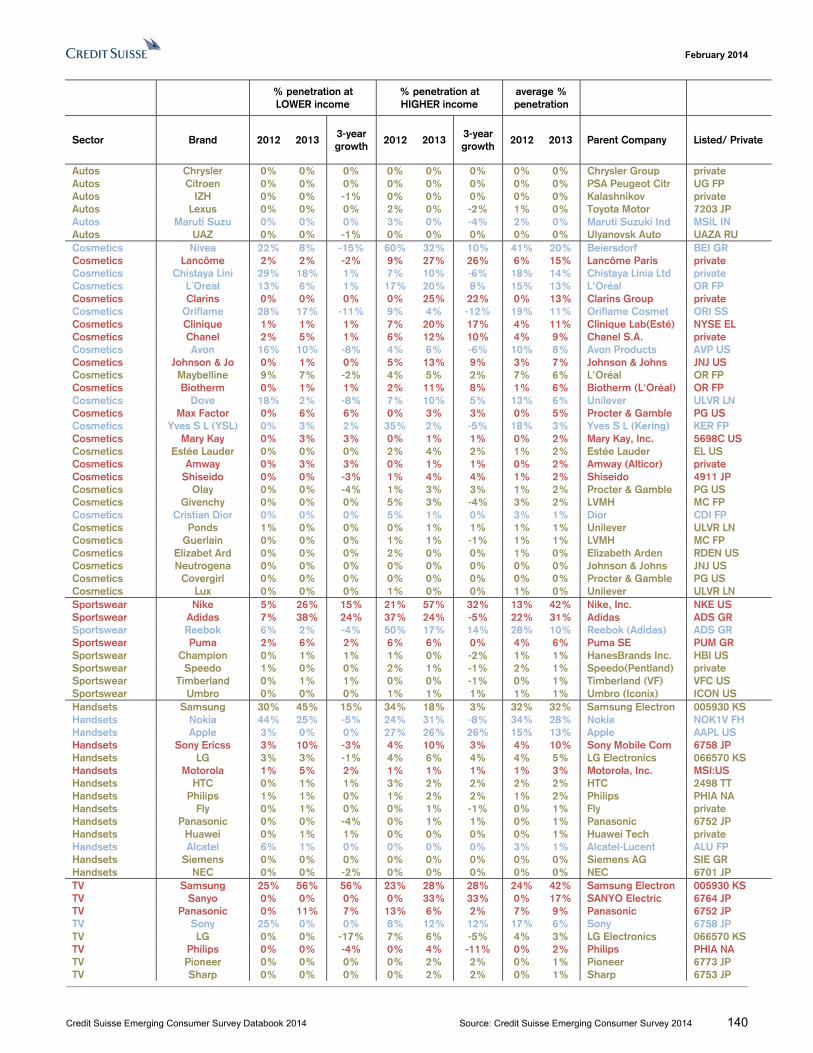
February 2014
Credit Suisse Emerging Consumer Survey Databook 2014 Source: Credit Suisse Emerging Consumer Survey 2014 140
% penetration at LOWER income
% penetration at HIGHER income
average % penetration
Sector Brand 2012 2013 3-year growth
2012 2013 3-year growth
2012 2013 Parent Company Listed/ Private
Autos Chrysler 0% 0% 0% 0% 0% 0% 0% 0% Chrysler Group private Autos Citroen 0% 0% 0% 0% 0% 0% 0% 0% PSA Peugeot Citr UG FP Autos IZH 0% 0% -1% 0% 0% 0% 0% 0% Kalashnikov private Autos Lexus 0% 0% 0% 2% 0% -2% 1% 0% Toyota Motor 7203 JP Autos Maruti Suzu 0% 0% 0% 3% 0% -4% 2% 0% Maruti Suzuki Ind MSIL IN Autos UAZ 0% 0% -1% 0% 0% 0% 0% 0% Ulyanovsk Auto UAZA RU Cosmetics Nivea 22% 8% -15% 60% 32% 10% 41% 20% Beiersdorf BEI GR Cosmetics Lancôme 2% 2% -2% 9% 27% 26% 6% 15% Lancôme Paris private Cosmetics Chistaya Lini 29% 18% 1% 7% 10% -6% 18% 14% Chistaya Linia Ltd private Cosmetics L´Oreal 13% 6% 1% 17% 20% 8% 15% 13% L'Oréal OR FP Cosmetics Clarins 0% 0% 0% 0% 25% 22% 0% 13% Clarins Group private Cosmetics Oriflame 28% 17% -11% 9% 4% -12% 19% 11% Oriflame Cosmet ORI SS Cosmetics Clinique 1% 1% 1% 7% 20% 17% 4% 11% Clinique Lab(Esté) NYSE EL Cosmetics Chanel 2% 5% 1% 6% 12% 10% 4% 9% Chanel S.A. private Cosmetics Avon 16% 10% -8% 4% 6% -6% 10% 8% Avon Products AVP US Cosmetics Johnson & Jo 0% 1% 0% 5% 13% 9% 3% 7% Johnson & Johns JNJ US Cosmetics Maybelline 9% 7% -2% 4% 5% 2% 7% 6% L'Oréal OR FP Cosmetics Biotherm 0% 1% 1% 2% 11% 8% 1% 6% Biotherm (L'Oréal) OR FP Cosmetics Dove 18% 2% -8% 7% 10% 5% 13% 6% Unilever ULVR LN Cosmetics Max Factor 0% 6% 6% 0% 3% 3% 0% 5% Procter & Gamble PG US Cosmetics Yves S L (YSL) 0% 3% 2% 35% 2% -5% 18% 3% Yves S L (Kering) KER FP Cosmetics Mary Kay 0% 3% 3% 0% 1% 1% 0% 2% Mary Kay, Inc. 5698C US Cosmetics Estée Lauder 0% 0% 0% 2% 4% 2% 1% 2% Estée Lauder EL US Cosmetics Amway 0% 3% 3% 0% 1% 1% 0% 2% Amway (Alticor) private Cosmetics Shiseido 0% 0% -3% 1% 4% 4% 1% 2% Shiseido 4911 JP Cosmetics Olay 0% 0% -4% 1% 3% 3% 1% 2% Procter & Gamble PG US Cosmetics Givenchy 0% 0% 0% 5% 3% -4% 3% 2% LVMH MC FP Cosmetics Cristian Dior 0% 0% 0% 5% 1% 0% 3% 1% Dior CDI FP Cosmetics Ponds 1% 0% 0% 0% 1% 1% 1% 1% Unilever ULVR LN Cosmetics Guerlain 0% 0% 0% 1% 1% -1% 1% 1% LVMH MC FP Cosmetics Elizabet Ard 0% 0% 0% 2% 0% 0% 1% 0% Elizabeth Arden RDEN US Cosmetics Neutrogena 0% 0% 0% 0% 0% 0% 0% 0% Johnson & Johns JNJ US Cosmetics Covergirl 0% 0% 0% 0% 0% 0% 0% 0% Procter & Gamble PG US Cosmetics Lux 0% 0% 0% 1% 0% 0% 1% 0% Unilever ULVR LN Sportswear Nike 5% 26% 15% 21% 57% 32% 13% 42% Nike, Inc. NKE US Sportswear Adidas 7% 38% 24% 37% 24% -5% 22% 31% Adidas ADS GR Sportswear Reebok 6% 2% -4% 50% 17% 14% 28% 10% Reebok (Adidas) ADS GR Sportswear Puma 2% 6% 2% 6% 6% 0% 4% 6% Puma SE PUM GR Sportswear Champion 0% 1% 1% 1% 0% -2% 1% 1% HanesBrands Inc. HBI US Sportswear Speedo 1% 0% 0% 2% 1% -1% 2% 1% Speedo(Pentland) private Sportswear Timberland 0% 1% 1% 0% 0% -1% 0% 1% Timberland (VF) VFC US Sportswear Umbro 0% 0% 0% 1% 1% 1% 1% 1% Umbro (Iconix) ICON US Handsets Samsung 30% 45% 15% 34% 18% 3% 32% 32% Samsung Electron 005930 KS Handsets Nokia 44% 25% -5% 24% 31% -8% 34% 28% Nokia NOK1V FH Handsets Apple 3% 0% 0% 27% 26% 26% 15% 13% Apple AAPL US Handsets Sony Ericss 3% 10% -3% 4% 10% 3% 4% 10% Sony Mobile Com 6758 JP Handsets LG 3% 3% -1% 4% 6% 4% 4% 5% LG Electronics 066570 KS Handsets Motorola 1% 5% 2% 1% 1% 1% 1% 3% Motorola, Inc. MSI:US Handsets HTC 0% 1% 1% 3% 2% 2% 2% 2% HTC 2498 TT Handsets Philips 1% 1% 0% 1% 2% 2% 1% 2% Philips PHIA NA Handsets Fly 0% 1% 0% 0% 1% -1% 0% 1% Fly private Handsets Panasonic 0% 0% -4% 0% 1% 1% 0% 1% Panasonic 6752 JP Handsets Huawei 0% 1% 1% 0% 0% 0% 0% 1% Huawei Tech private Handsets Alcatel 6% 1% 0% 0% 0% 0% 3% 1% Alcatel-Lucent ALU FP Handsets Siemens 0% 0% 0% 0% 0% 0% 0% 0% Siemens AG SIE GR Handsets NEC 0% 0% -2% 0% 0% 0% 0% 0% NEC 6701 JP TV Samsung 25% 56% 56% 23% 28% 28% 24% 42% Samsung Electron 005930 KS TV Sanyo 0% 0% 0% 0% 33% 33% 0% 17% SANYO Electric 6764 JP TV Panasonic 0% 11% 7% 13% 6% 2% 7% 9% Panasonic 6752 JP TV Sony 25% 0% 0% 8% 12% 12% 17% 6% Sony 6758 JP TV LG 0% 0% -17% 7% 6% -5% 4% 3% LG Electronics 066570 KS TV Philips 0% 0% -4% 0% 4% -11% 0% 2% Philips PHIA NA TV Pioneer 0% 0% 0% 0% 2% 2% 0% 1% Pioneer 6773 JP TV Sharp 0% 0% 0% 0% 2% 2% 0% 1% Sharp 6753 JP
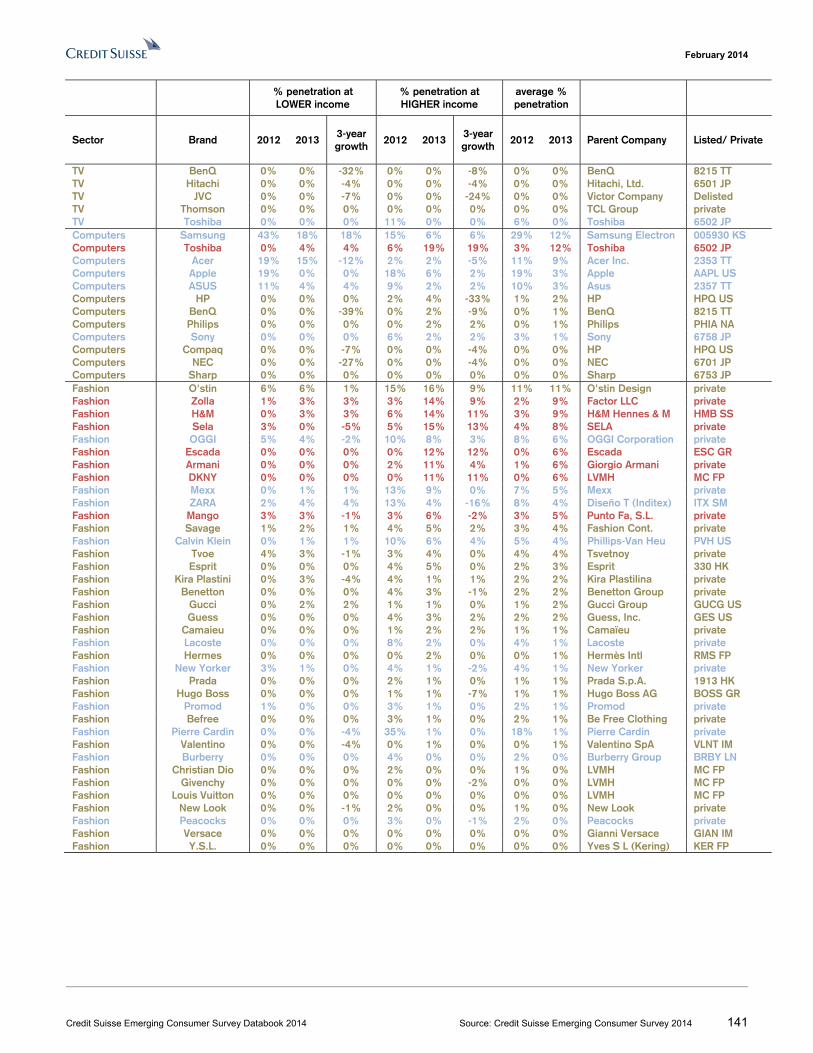
February 2014
Credit Suisse Emerging Consumer Survey Databook 2014 Source: Credit Suisse Emerging Consumer Survey 2014 141
% penetration at LOWER income
% penetration at HIGHER income
average % penetration
Sector Brand 2012 2013 3-year growth
2012 2013 3-year growth
2012 2013 Parent Company Listed/ Private
TV BenQ 0% 0% -32% 0% 0% -8% 0% 0% BenQ 8215 TT TV Hitachi 0% 0% -4% 0% 0% -4% 0% 0% Hitachi, Ltd. 6501 JP TV JVC 0% 0% -7% 0% 0% -24% 0% 0% Victor Company Delisted TV Thomson 0% 0% 0% 0% 0% 0% 0% 0% TCL Group private TV Toshiba 0% 0% 0% 11% 0% 0% 6% 0% Toshiba 6502 JP Computers Samsung 43% 18% 18% 15% 6% 6% 29% 12% Samsung Electron 005930 KS Computers Toshiba 0% 4% 4% 6% 19% 19% 3% 12% Toshiba 6502 JP Computers Acer 19% 15% -12% 2% 2% -5% 11% 9% Acer Inc. 2353 TT Computers Apple 19% 0% 0% 18% 6% 2% 19% 3% Apple AAPL US Computers ASUS 11% 4% 4% 9% 2% 2% 10% 3% Asus 2357 TT Computers HP 0% 0% 0% 2% 4% -33% 1% 2% HP HPQ US Computers BenQ 0% 0% -39% 0% 2% -9% 0% 1% BenQ 8215 TT Computers Philips 0% 0% 0% 0% 2% 2% 0% 1% Philips PHIA NA Computers Sony 0% 0% 0% 6% 2% 2% 3% 1% Sony 6758 JP Computers Compaq 0% 0% -7% 0% 0% -4% 0% 0% HP HPQ US Computers NEC 0% 0% -27% 0% 0% -4% 0% 0% NEC 6701 JP Computers Sharp 0% 0% 0% 0% 0% 0% 0% 0% Sharp 6753 JP Fashion O'stin 6% 6% 1% 15% 16% 9% 11% 11% O'stin Design private Fashion Zolla 1% 3% 3% 3% 14% 9% 2% 9% Factor LLC private Fashion H&M 0% 3% 3% 6% 14% 11% 3% 9% H&M Hennes & M HMB SS Fashion Sela 3% 0% -5% 5% 15% 13% 4% 8% SELA private Fashion OGGI 5% 4% -2% 10% 8% 3% 8% 6% OGGI Corporation private Fashion Escada 0% 0% 0% 0% 12% 12% 0% 6% Escada ESC GR Fashion Armani 0% 0% 0% 2% 11% 4% 1% 6% Giorgio Armani private Fashion DKNY 0% 0% 0% 0% 11% 11% 0% 6% LVMH MC FP Fashion Mexx 0% 1% 1% 13% 9% 0% 7% 5% Mexx private Fashion ZARA 2% 4% 4% 13% 4% -16% 8% 4% Diseño T (Inditex) ITX SM Fashion Mango 3% 3% -1% 3% 6% -2% 3% 5% Punto Fa, S.L. private Fashion Savage 1% 2% 1% 4% 5% 2% 3% 4% Fashion Cont. private Fashion Calvin Klein 0% 1% 1% 10% 6% 4% 5% 4% Phillips-Van Heu PVH US Fashion Tvoe 4% 3% -1% 3% 4% 0% 4% 4% Tsvetnoy private Fashion Esprit 0% 0% 0% 4% 5% 0% 2% 3% Esprit 330 HK Fashion Kira Plastini 0% 3% -4% 4% 1% 1% 2% 2% Kira Plastilina private Fashion Benetton 0% 0% 0% 4% 3% -1% 2% 2% Benetton Group private Fashion Gucci 0% 2% 2% 1% 1% 0% 1% 2% Gucci Group GUCG US Fashion Guess 0% 0% 0% 4% 3% 2% 2% 2% Guess, Inc. GES US Fashion Camaieu 0% 0% 0% 1% 2% 2% 1% 1% Camaïeu private Fashion Lacoste 0% 0% 0% 8% 2% 0% 4% 1% Lacoste private Fashion Hermes 0% 0% 0% 0% 2% 0% 0% 1% Hermès Intl RMS FP Fashion New Yorker 3% 1% 0% 4% 1% -2% 4% 1% New Yorker private Fashion Prada 0% 0% 0% 2% 1% 0% 1% 1% Prada S.p.A. 1913 HK Fashion Hugo Boss 0% 0% 0% 1% 1% -7% 1% 1% Hugo Boss AG BOSS GR Fashion Promod 1% 0% 0% 3% 1% 0% 2% 1% Promod private Fashion Befree 0% 0% 0% 3% 1% 0% 2% 1% Be Free Clothing private Fashion Pierre Cardin 0% 0% -4% 35% 1% 0% 18% 1% Pierre Cardin private Fashion Valentino 0% 0% -4% 0% 1% 0% 0% 1% Valentino SpA VLNT IM Fashion Burberry 0% 0% 0% 4% 0% 0% 2% 0% Burberry Group BRBY LN Fashion Christian Dio 0% 0% 0% 2% 0% 0% 1% 0% LVMH MC FP Fashion Givenchy 0% 0% 0% 0% 0% -2% 0% 0% LVMH MC FP Fashion Louis Vuitton 0% 0% 0% 0% 0% 0% 0% 0% LVMH MC FP Fashion New Look 0% 0% -1% 2% 0% 0% 1% 0% New Look private Fashion Peacocks 0% 0% 0% 3% 0% -1% 2% 0% Peacocks private Fashion Versace 0% 0% 0% 0% 0% 0% 0% 0% Gianni Versace GIAN IM Fashion Y.S.L. 0% 0% 0% 0% 0% 0% 0% 0% Yves S L (Kering) KER FP
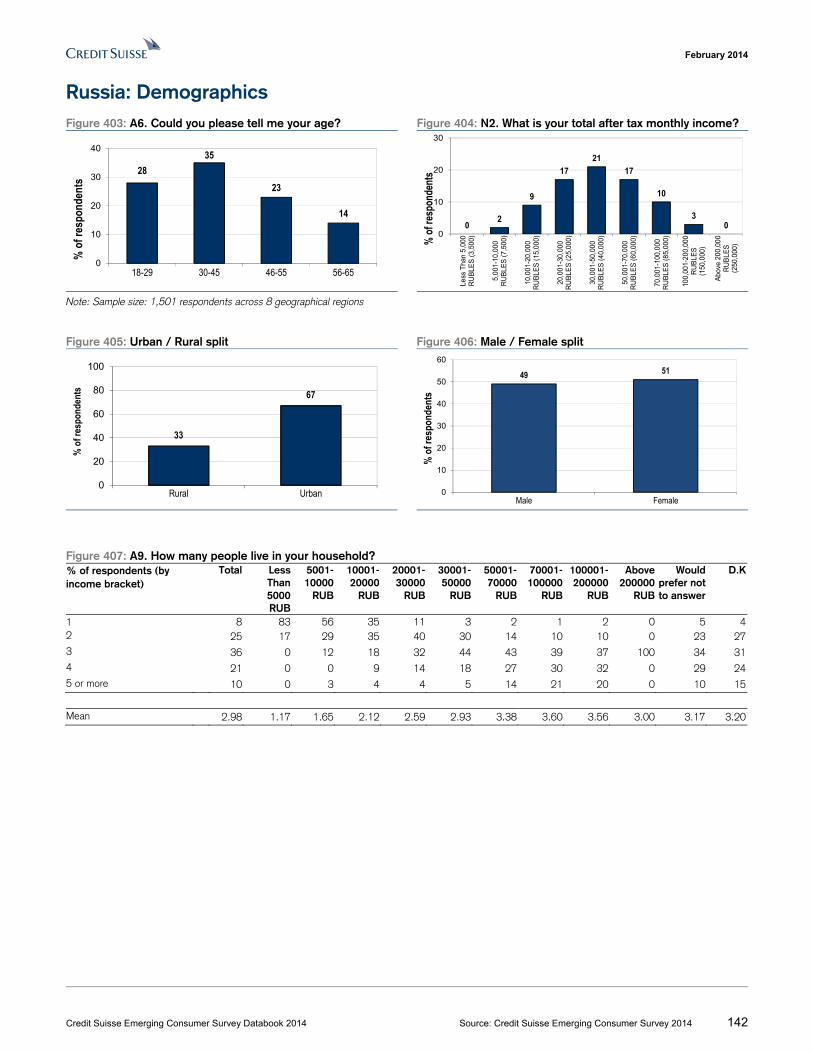
February 2014
Credit Suisse Emerging Consumer Survey Databook 2014 Source: Credit Suisse Emerging Consumer Survey 2014 142
Russia: Demographics Figure 403: A6. Could you please tell me your age? Figure 404: N2. What is your total after tax monthly income?
Note: Sample size: 1,501 respondents across 8 geographical regions
Figure 405: Urban / Rural split Figure 406: Male / Female split
Figure 407: A9. How many people live in your household? % of respondents (by income bracket)
Total Less Than 5000 RUB
5001-10000
RUB
10001-20000
RUB
20001-30000
RUB
30001-50000
RUB
50001-70000
RUB
70001-100000
RUB
100001-200000
RUB
Above 200000
RUB
Would prefer not to answer
D.K
1 8 83 56 35 11 3 2 1 2 0 5 42 25 17 29 35 40 30 14 10 10 0 23 273 36 0 12 18 32 44 43 39 37 100 34 314 21 0 0 9 14 18 27 30 32 0 29 245 or more 10 0 3 4 4 5 14 21 20 0 10 15
Mean 2.98 1.17 1.65 2.12 2.59 2.93 3.38 3.60 3.56 3.00 3.17 3.20
2835
23
14
0
10
20
30
40
18-29 30-45 46-55 56-65
% o
f res
pond
ents
02
9
1721
17
10
30
0
10
20
30
Less
Tha
n 5,
000
RU
BLE
S (3
,500
)
5,00
1-10
,000
RU
BLE
S (7
,500
)
10,0
01-2
0,00
0R
UB
LES
(15,
000)
20,0
01-3
0,00
0R
UB
LES
(25,
000)
30,0
01-5
0,00
0R
UB
LES
(40,
000)
50,0
01-7
0,00
0R
UB
LES
(60,
000)
70,0
01-1
00,0
00R
UB
LES
(85,
000)
100,
001-
200,
000
RU
BLE
S(1
50,0
00)
Abo
ve 2
00,0
00R
UB
LES
(250
,000
)% of
resp
onde
nts
33
67
0
20
40
60
80
100
Rural Urban
% o
f res
pond
ents
49 51
0
10
20
30
40
50
60
Male Female
% o
f res
pond
ents
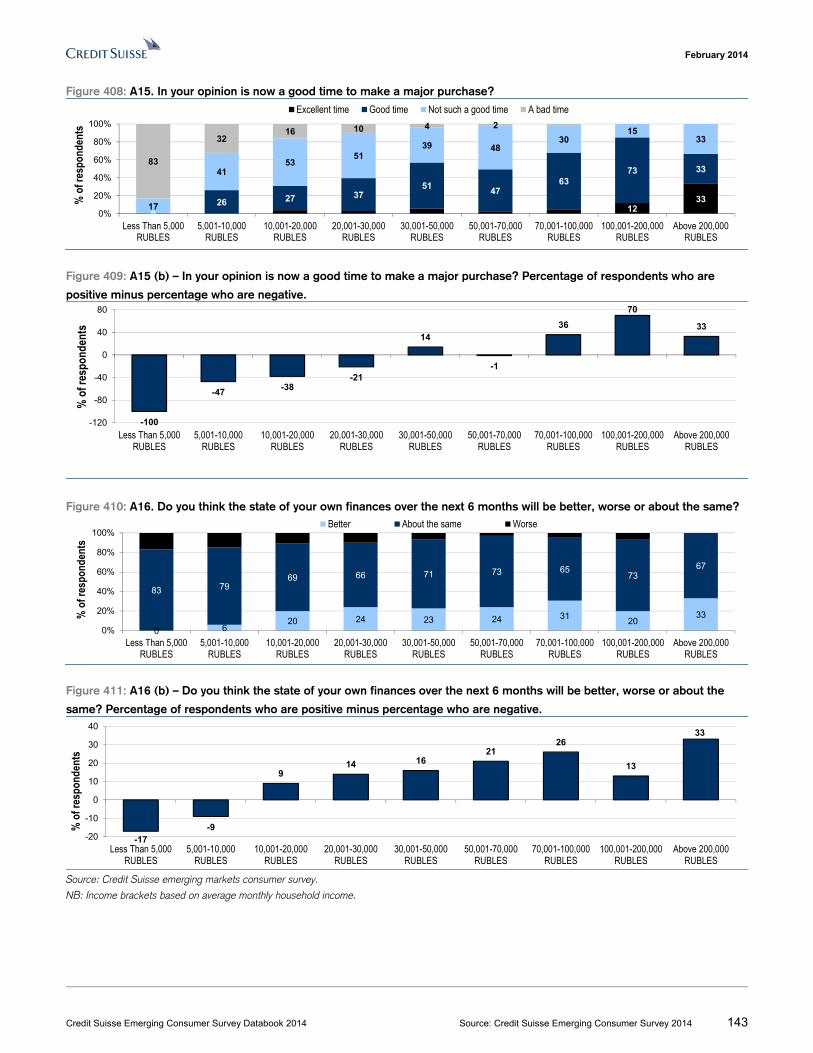
February 2014
Credit Suisse Emerging Consumer Survey Databook 2014 Source: Credit Suisse Emerging Consumer Survey 2014 143
Figure 408: A15. In your opinion is now a good time to make a major purchase?
Figure 409: A15 (b) – In your opinion is now a good time to make a major purchase? Percentage of respondents who are
positive minus percentage who are negative.
Figure 410: A16. Do you think the state of your own finances over the next 6 months will be better, worse or about the same?
Figure 411: A16 (b) – Do you think the state of your own finances over the next 6 months will be better, worse or about the
same? Percentage of respondents who are positive minus percentage who are negative.
Source: Credit Suisse emerging markets consumer survey.
NB: Income brackets based on average monthly household income.
012
3326 27 3751
4763
73 33
17
4153
5139 48
3015
33
83
3216 10 4 2
0%
20%
40%
60%
80%
100%
Less Than 5,000RUBLES
5,001-10,000RUBLES
10,001-20,000RUBLES
20,001-30,000RUBLES
30,001-50,000RUBLES
50,001-70,000RUBLES
70,001-100,000RUBLES
100,001-200,000RUBLES
Above 200,000RUBLES
% o
f res
pond
ents
Excellent time Good time Not such a good time A bad time
-100
-47-38
-21
14
-1
36
70
33
-120
-80
-40
0
40
80
Less Than 5,000RUBLES
5,001-10,000RUBLES
10,001-20,000RUBLES
20,001-30,000RUBLES
30,001-50,000RUBLES
50,001-70,000RUBLES
70,001-100,000RUBLES
100,001-200,000RUBLES
Above 200,000RUBLES
% o
f res
pond
ents
0 620 24 23 24 31
2033
83 7969 66 71 73 65
7367
0%
20%
40%
60%
80%
100%
Less Than 5,000RUBLES
5,001-10,000RUBLES
10,001-20,000RUBLES
20,001-30,000RUBLES
30,001-50,000RUBLES
50,001-70,000RUBLES
70,001-100,000RUBLES
100,001-200,000RUBLES
Above 200,000RUBLES
% o
f res
pond
ents
Better About the same Worse
-17-9
914 16
2126
13
33
-20
-10
0
10
20
30
40
Less Than 5,000RUBLES
5,001-10,000RUBLES
10,001-20,000RUBLES
20,001-30,000RUBLES
30,001-50,000RUBLES
50,001-70,000RUBLES
70,001-100,000RUBLES
100,001-200,000RUBLES
Above 200,000RUBLES
% o
f res
pond
ents
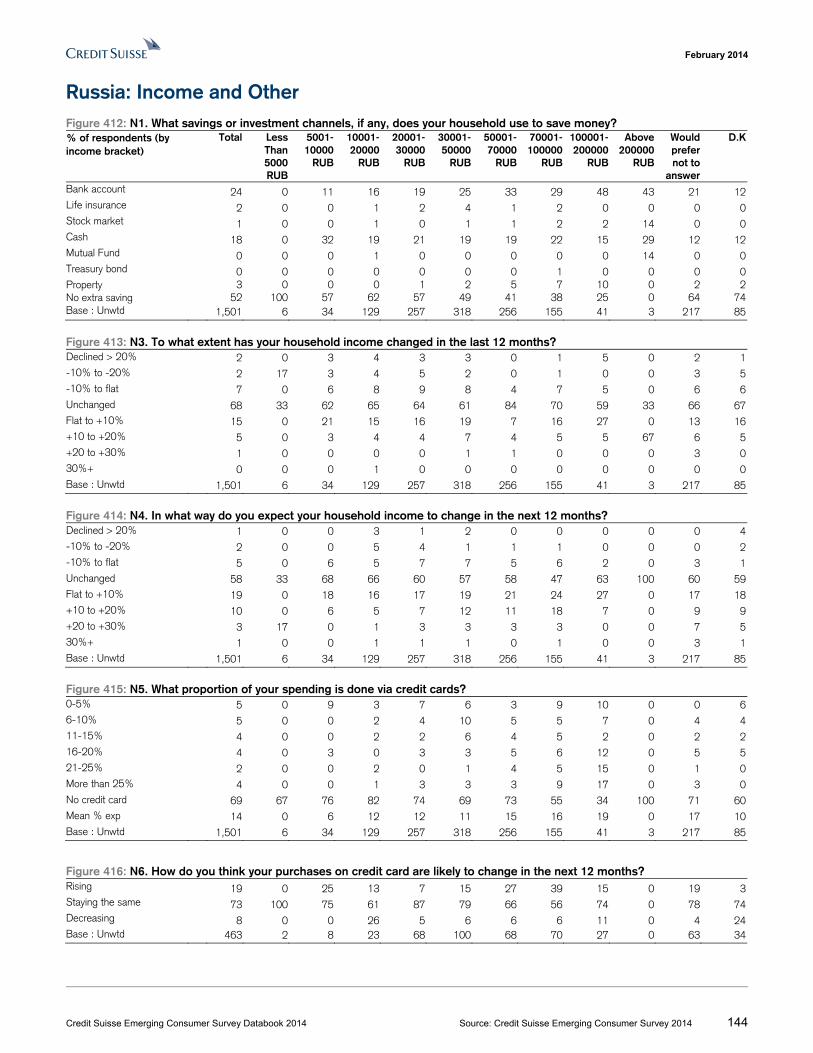
February 2014
Credit Suisse Emerging Consumer Survey Databook 2014 Source: Credit Suisse Emerging Consumer Survey 2014 144
Russia: Income and Other Figure 412: N1. What savings or investment channels, if any, does your household use to save money? % of respondents (by income bracket)
Total Less Than 5000 RUB
5001-10000
RUB
10001-20000
RUB
20001-30000
RUB
30001-50000
RUB
50001-70000
RUB
70001-100000
RUB
100001-200000
RUB
Above 200000
RUB
Would prefer not to
answer
D.K
Bank account 24 0 11 16 19 25 33 29 48 43 21 12Life insurance 2 0 0 1 2 4 1 2 0 0 0 0Stock market 1 0 0 1 0 1 1 2 2 14 0 0Cash 18 0 32 19 21 19 19 22 15 29 12 12Mutual Fund 0 0 0 1 0 0 0 0 0 14 0 0Treasury bond 0 0 0 0 0 0 0 1 0 0 0 0Property 3 0 0 0 1 2 5 7 10 0 2 2No extra saving 52 100 57 62 57 49 41 38 25 0 64 74Base : Unwtd 1,501 6 34 129 257 318 256 155 41 3 217 85
Figure 413: N3. To what extent has your household income changed in the last 12 months? Declined > 20% 2 0 3 4 3 3 0 1 5 0 2 1-10% to -20% 2 17 3 4 5 2 0 1 0 0 3 5-10% to flat 7 0 6 8 9 8 4 7 5 0 6 6Unchanged 68 33 62 65 64 61 84 70 59 33 66 67Flat to +10% 15 0 21 15 16 19 7 16 27 0 13 16+10 to +20% 5 0 3 4 4 7 4 5 5 67 6 5+20 to +30% 1 0 0 0 0 1 1 0 0 0 3 030%+ 0 0 0 1 0 0 0 0 0 0 0 0Base : Unwtd 1,501 6 34 129 257 318 256 155 41 3 217 85
Figure 414: N4. In what way do you expect your household income to change in the next 12 months? Declined > 20% 1 0 0 3 1 2 0 0 0 0 0 4-10% to -20% 2 0 0 5 4 1 1 1 0 0 0 2-10% to flat 5 0 6 5 7 7 5 6 2 0 3 1Unchanged 58 33 68 66 60 57 58 47 63 100 60 59Flat to +10% 19 0 18 16 17 19 21 24 27 0 17 18+10 to +20% 10 0 6 5 7 12 11 18 7 0 9 9+20 to +30% 3 17 0 1 3 3 3 3 0 0 7 530%+ 1 0 0 1 1 1 0 1 0 0 3 1Base : Unwtd 1,501 6 34 129 257 318 256 155 41 3 217 85
Figure 415: N5. What proportion of your spending is done via credit cards? 0-5% 5 0 9 3 7 6 3 9 10 0 0 66-10% 5 0 0 2 4 10 5 5 7 0 4 411-15% 4 0 0 2 2 6 4 5 2 0 2 216-20% 4 0 3 0 3 3 5 6 12 0 5 521-25% 2 0 0 2 0 1 4 5 15 0 1 0More than 25% 4 0 0 1 3 3 3 9 17 0 3 0No credit card 69 67 76 82 74 69 73 55 34 100 71 60Mean % exp 14 0 6 12 12 11 15 16 19 0 17 10Base : Unwtd 1,501 6 34 129 257 318 256 155 41 3 217 85
Figure 416: N6. How do you think your purchases on credit card are likely to change in the next 12 months? Rising 19 0 25 13 7 15 27 39 15 0 19 3Staying the same 73 100 75 61 87 79 66 56 74 0 78 74Decreasing 8 0 0 26 5 6 6 6 11 0 4 24Base : Unwtd 463 2 8 23 68 100 68 70 27 0 63 34
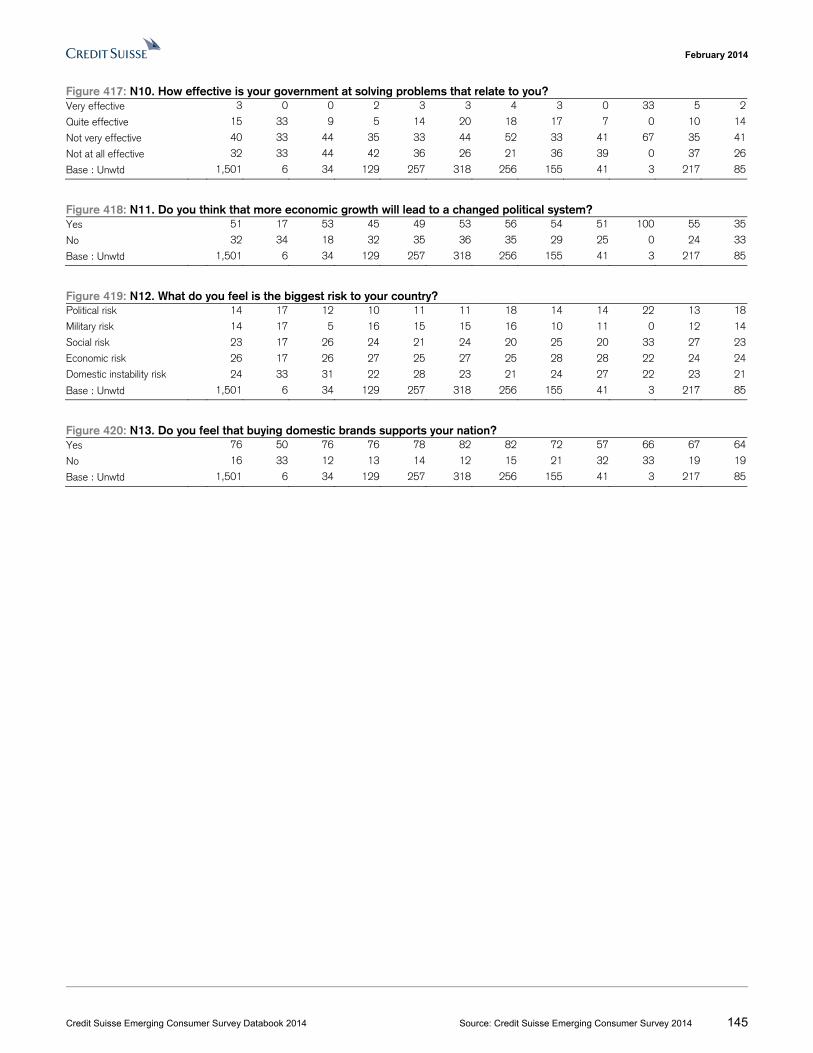
February 2014
Credit Suisse Emerging Consumer Survey Databook 2014 Source: Credit Suisse Emerging Consumer Survey 2014 145
Figure 417: N10. How effective is your government at solving problems that relate to you? Very effective 3 0 0 2 3 3 4 3 0 33 5 2
Quite effective 15 33 9 5 14 20 18 17 7 0 10 14
Not very effective 40 33 44 35 33 44 52 33 41 67 35 41
Not at all effective 32 33 44 42 36 26 21 36 39 0 37 26
Base : Unwtd 1,501 6 34 129 257 318 256 155 41 3 217 85
Figure 418: N11. Do you think that more economic growth will lead to a changed political system? Yes 51 17 53 45 49 53 56 54 51 100 55 35
No 32 34 18 32 35 36 35 29 25 0 24 33
Base : Unwtd 1,501 6 34 129 257 318 256 155 41 3 217 85
Figure 419: N12. What do you feel is the biggest risk to your country? Political risk 14 17 12 10 11 11 18 14 14 22 13 18
Military risk 14 17 5 16 15 15 16 10 11 0 12 14
Social risk 23 17 26 24 21 24 20 25 20 33 27 23
Economic risk 26 17 26 27 25 27 25 28 28 22 24 24
Domestic instability risk 24 33 31 22 28 23 21 24 27 22 23 21
Base : Unwtd 1,501 6 34 129 257 318 256 155 41 3 217 85
Figure 420: N13. Do you feel that buying domestic brands supports your nation? Yes 76 50 76 76 78 82 82 72 57 66 67 64
No 16 33 12 13 14 12 15 21 32 33 19 19
Base : Unwtd 1,501 6 34 129 257 318 256 155 41 3 217 85
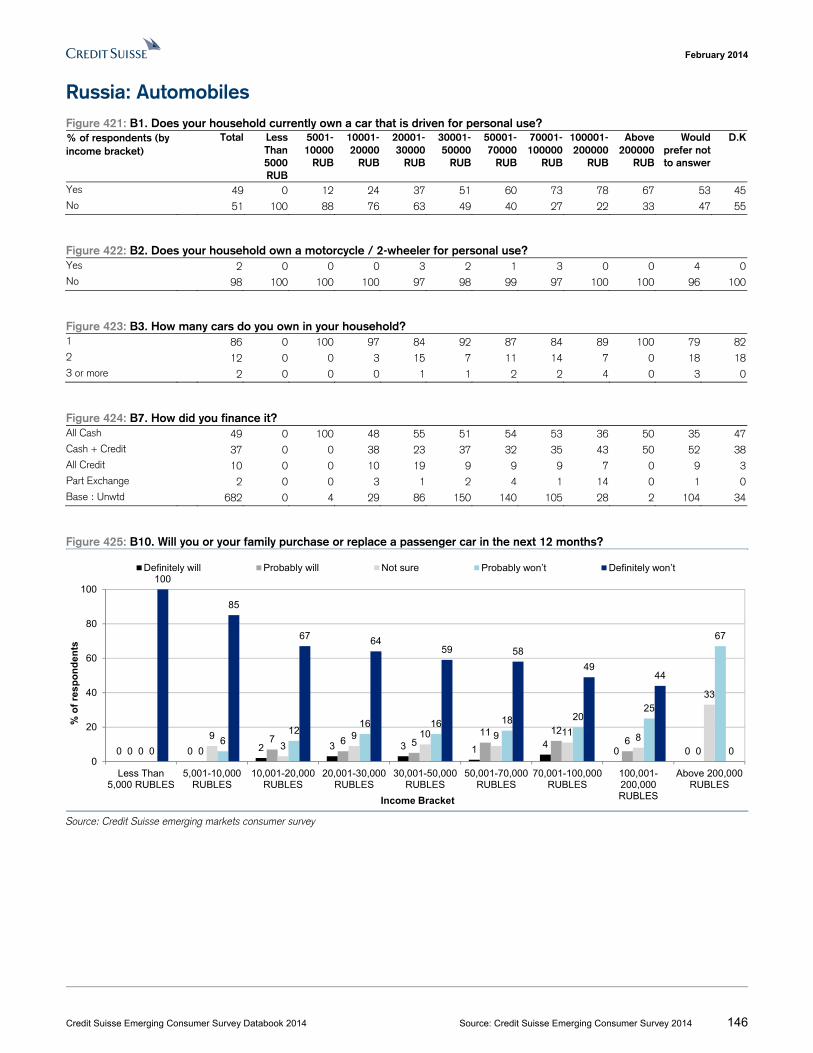
February 2014
Credit Suisse Emerging Consumer Survey Databook 2014 Source: Credit Suisse Emerging Consumer Survey 2014 146
Russia: Automobiles Figure 421: B1. Does your household currently own a car that is driven for personal use? % of respondents (by income bracket)
Total Less Than 5000 RUB
5001-10000
RUB
10001-20000
RUB
20001-30000
RUB
30001-50000
RUB
50001-70000
RUB
70001-100000
RUB
100001-200000
RUB
Above 200000
RUB
Would prefer not to answer
D.K
Yes 49 0 12 24 37 51 60 73 78 67 53 45No 51 100 88 76 63 49 40 27 22 33 47 55
Figure 422: B2. Does your household own a motorcycle / 2-wheeler for personal use? Yes 2 0 0 0 3 2 1 3 0 0 4 0No 98 100 100 100 97 98 99 97 100 100 96 100
Figure 423: B3. How many cars do you own in your household? 1 86 0 100 97 84 92 87 84 89 100 79 822 12 0 0 3 15 7 11 14 7 0 18 183 or more 2 0 0 0 1 1 2 2 4 0 3 0
Figure 424: B7. How did you finance it? All Cash 49 0 100 48 55 51 54 53 36 50 35 47Cash + Credit 37 0 0 38 23 37 32 35 43 50 52 38All Credit 10 0 0 10 19 9 9 9 7 0 9 3Part Exchange 2 0 0 3 1 2 4 1 14 0 1 0Base : Unwtd 682 0 4 29 86 150 140 105 28 2 104 34
Figure 425: B10. Will you or your family purchase or replace a passenger car in the next 12 months?
Source: Credit Suisse emerging markets consumer survey
0 0 2 3 3 1 40 00 0
7 6 511 12
600
93
9 10 9 11 8
33
06
1216 16 18 20
25
67
100
85
67 6459 58
4944
00
20
40
60
80
100
Less Than5,000 RUBLES
5,001-10,000RUBLES
10,001-20,000RUBLES
20,001-30,000RUBLES
30,001-50,000RUBLES
50,001-70,000RUBLES
70,001-100,000RUBLES
100,001-200,000RUBLES
Above 200,000RUBLES
% o
f re
sp
on
den
ts
Income Bracket
Definitely will Probably will Not sure Probably won’t Definitely won’t
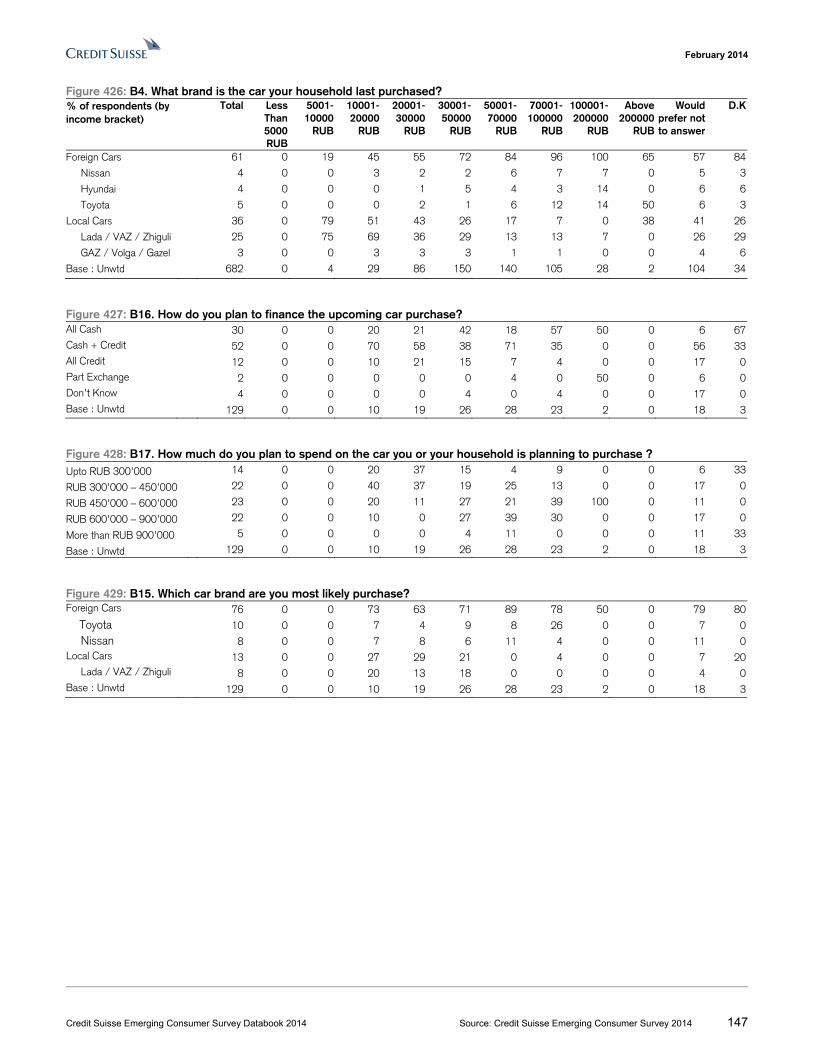
February 2014
Credit Suisse Emerging Consumer Survey Databook 2014 Source: Credit Suisse Emerging Consumer Survey 2014 147
Figure 426: B4. What brand is the car your household last purchased? % of respondents (by income bracket)
Total Less Than 5000 RUB
5001-10000
RUB
10001-20000
RUB
20001-30000
RUB
30001-50000
RUB
50001-70000
RUB
70001-100000
RUB
100001-200000
RUB
Above 200000
RUB
Would prefer not to answer
D.K
Foreign Cars 61 0 19 45 55 72 84 96 100 65 57 84
Nissan 4 0 0 3 2 2 6 7 7 0 5 3
Hyundai 4 0 0 0 1 5 4 3 14 0 6 6
Toyota 5 0 0 0 2 1 6 12 14 50 6 3
Local Cars 36 0 79 51 43 26 17 7 0 38 41 26
Lada / VAZ / Zhiguli 25 0 75 69 36 29 13 13 7 0 26 29
GAZ / Volga / Gazel 3 0 0 3 3 3 1 1 0 0 4 6
Base : Unwtd 682 0 4 29 86 150 140 105 28 2 104 34
Figure 427: B16. How do you plan to finance the upcoming car purchase? All Cash 30 0 0 20 21 42 18 57 50 0 6 67Cash + Credit 52 0 0 70 58 38 71 35 0 0 56 33All Credit 12 0 0 10 21 15 7 4 0 0 17 0Part Exchange 2 0 0 0 0 0 4 0 50 0 6 0Don’t Know 4 0 0 0 0 4 0 4 0 0 17 0Base : Unwtd 129 0 0 10 19 26 28 23 2 0 18 3
Figure 428: B17. How much do you plan to spend on the car you or your household is planning to purchase ? Upto RUB 300’000 14 0 0 20 37 15 4 9 0 0 6 33
RUB 300’000 – 450’000 22 0 0 40 37 19 25 13 0 0 17 0
RUB 450’000 – 600’000 23 0 0 20 11 27 21 39 100 0 11 0
RUB 600’000 – 900’000 22 0 0 10 0 27 39 30 0 0 17 0
More than RUB 900’000 5 0 0 0 0 4 11 0 0 0 11 33
Base : Unwtd 129 0 0 10 19 26 28 23 2 0 18 3
Figure 429: B15. Which car brand are you most likely purchase? Foreign Cars 76 0 0 73 63 71 89 78 50 0 79 80 Toyota 10 0 0 7 4 9 8 26 0 0 7 0 Nissan 8 0 0 7 8 6 11 4 0 0 11 0Local Cars 13 0 0 27 29 21 0 4 0 0 7 20 Lada / VAZ / Zhiguli 8 0 0 20 13 18 0 0 0 0 4 0Base : Unwtd 129 0 0 10 19 26 28 23 2 0 18 3
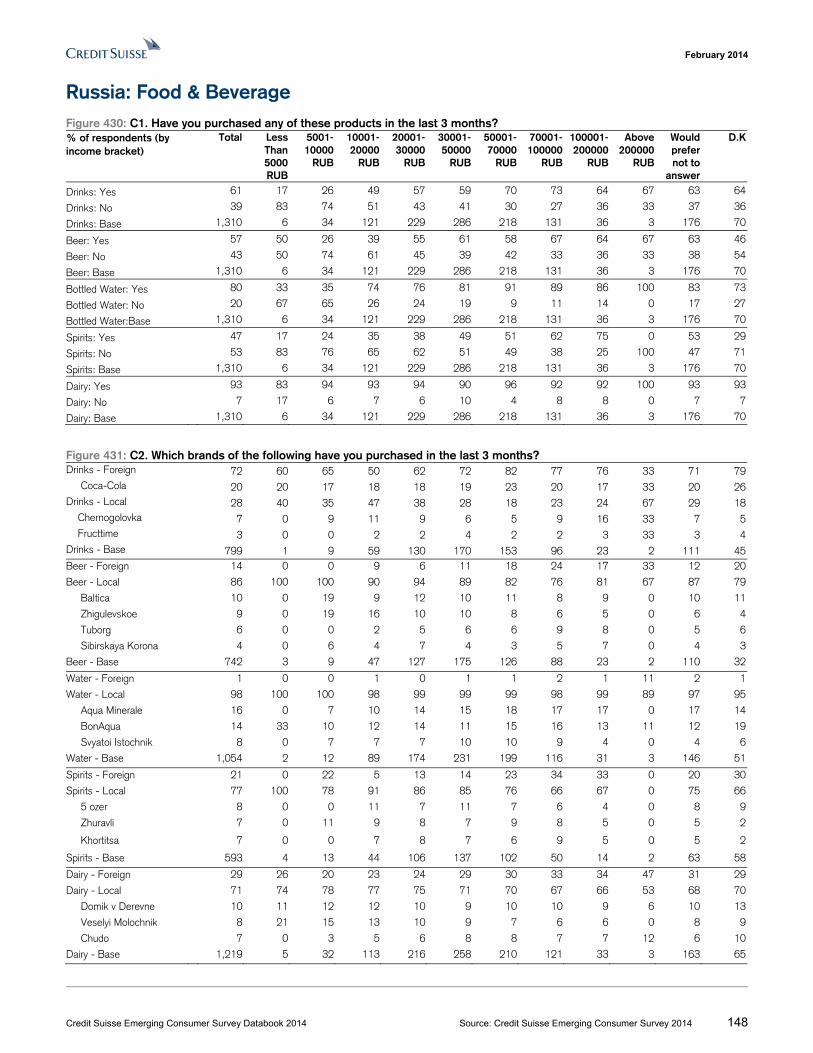
February 2014
Credit Suisse Emerging Consumer Survey Databook 2014 Source: Credit Suisse Emerging Consumer Survey 2014 148
Russia: Food & Beverage Figure 430: C1. Have you purchased any of these products in the last 3 months? % of respondents (by income bracket)
Total Less Than 5000 RUB
5001-10000
RUB
10001-20000
RUB
20001-30000
RUB
30001-50000
RUB
50001-70000
RUB
70001-100000
RUB
100001-200000
RUB
Above 200000
RUB
Would prefer not to
answer
D.K
Drinks: Yes 61 17 26 49 57 59 70 73 64 67 63 64
Drinks: No 39 83 74 51 43 41 30 27 36 33 37 36
Drinks: Base 1,310 6 34 121 229 286 218 131 36 3 176 70
Beer: Yes 57 50 26 39 55 61 58 67 64 67 63 46
Beer: No 43 50 74 61 45 39 42 33 36 33 38 54
Beer: Base 1,310 6 34 121 229 286 218 131 36 3 176 70
Bottled Water: Yes 80 33 35 74 76 81 91 89 86 100 83 73
Bottled Water: No 20 67 65 26 24 19 9 11 14 0 17 27
Bottled Water:Base 1,310 6 34 121 229 286 218 131 36 3 176 70
Spirits: Yes 47 17 24 35 38 49 51 62 75 0 53 29
Spirits: No 53 83 76 65 62 51 49 38 25 100 47 71
Spirits: Base 1,310 6 34 121 229 286 218 131 36 3 176 70
Dairy: Yes 93 83 94 93 94 90 96 92 92 100 93 93
Dairy: No 7 17 6 7 6 10 4 8 8 0 7 7
Dairy: Base 1,310 6 34 121 229 286 218 131 36 3 176 70
Figure 431: C2. Which brands of the following have you purchased in the last 3 months? Drinks - Foreign 72 60 65 50 62 72 82 77 76 33 71 79 Coca-Cola 20 20 17 18 18 19 23 20 17 33 20 26Drinks - Local 28 40 35 47 38 28 18 23 24 67 29 18 Chernogolovka 7 0 9 11 9 6 5 9 16 33 7 5 Fructtime 3 0 0 2 2 4 2 2 3 33 3 4Drinks - Base 799 1 9 59 130 170 153 96 23 2 111 45Beer - Foreign 14 0 0 9 6 11 18 24 17 33 12 20
Beer - Local 86 100 100 90 94 89 82 76 81 67 87 79
Baltica 10 0 19 9 12 10 11 8 9 0 10 11
Zhigulevskoe 9 0 19 16 10 10 8 6 5 0 6 4
Tuborg 6 0 0 2 5 6 6 9 8 0 5 6
Sibirskaya Korona 4 0 6 4 7 4 3 5 7 0 4 3
Beer - Base 742 3 9 47 127 175 126 88 23 2 110 32
Water - Foreign 1 0 0 1 0 1 1 2 1 11 2 1
Water - Local 98 100 100 98 99 99 99 98 99 89 97 95
Aqua Minerale 16 0 7 10 14 15 18 17 17 0 17 14
BonAqua 14 33 10 12 14 11 15 16 13 11 12 19
Svyatoi Istochnik 8 0 7 7 7 10 10 9 4 0 4 6
Water - Base 1,054 2 12 89 174 231 199 116 31 3 146 51
Spirits - Foreign 21 0 22 5 13 14 23 34 33 0 20 30
Spirits - Local 77 100 78 91 86 85 76 66 67 0 75 66
5 ozer 8 0 0 11 7 11 7 6 4 0 8 9
Zhuravli 7 0 11 9 8 7 9 8 5 0 5 2
Khortitsa 7 0 0 7 8 7 6 9 5 0 5 2
Spirits - Base 593 4 13 44 106 137 102 50 14 2 63 58
Dairy - Foreign 29 26 20 23 24 29 30 33 34 47 31 29
Dairy - Local 71 74 78 77 75 71 70 67 66 53 68 70
Domik v Derevne 10 11 12 12 10 9 10 10 9 6 10 13
Veselyi Molochnik 8 21 15 13 10 9 7 6 6 0 8 9
Chudo 7 0 3 5 6 8 8 7 7 12 6 10
Dairy - Base 1,219 5 32 113 216 258 210 121 33 3 163 65
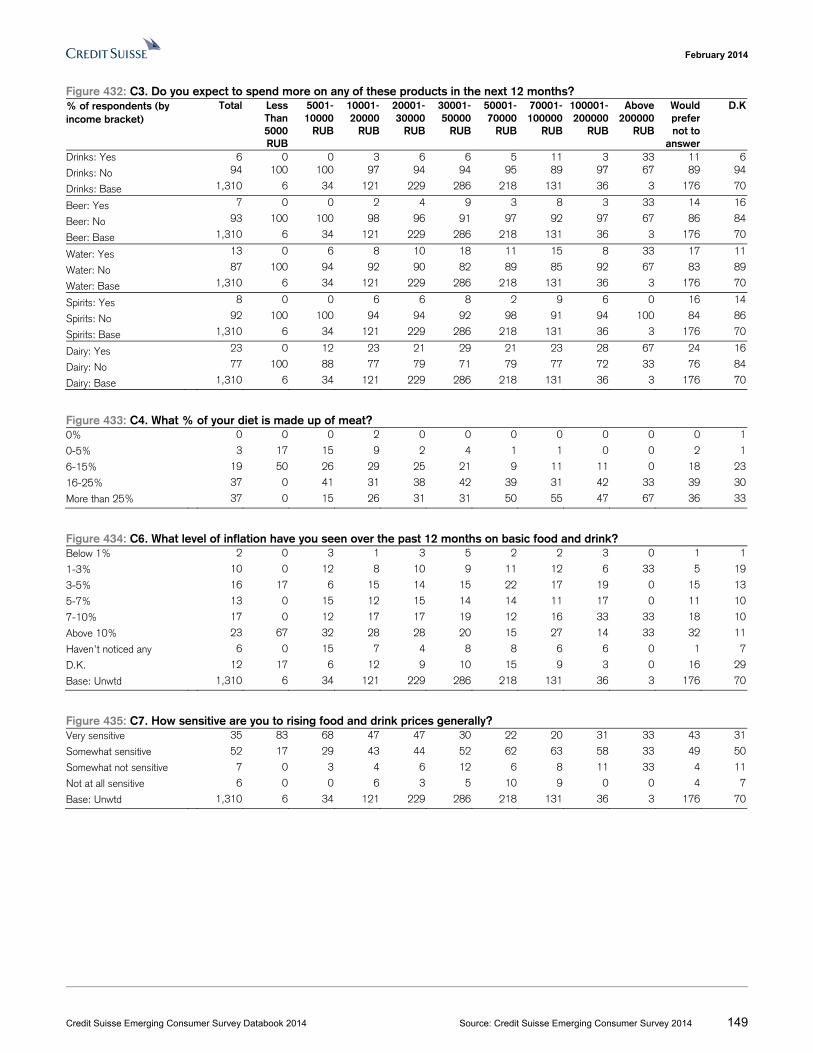
February 2014
Credit Suisse Emerging Consumer Survey Databook 2014 Source: Credit Suisse Emerging Consumer Survey 2014 149
Figure 432: C3. Do you expect to spend more on any of these products in the next 12 months? % of respondents (by income bracket)
Total Less Than 5000 RUB
5001-10000
RUB
10001-20000
RUB
20001-30000
RUB
30001-50000
RUB
50001-70000
RUB
70001-100000
RUB
100001-200000
RUB
Above 200000
RUB
Would prefer not to
answer
D.K
Drinks: Yes 6 0 0 3 6 6 5 11 3 33 11 6
Drinks: No 94 100 100 97 94 94 95 89 97 67 89 94
Drinks: Base 1,310 6 34 121 229 286 218 131 36 3 176 70
Beer: Yes 7 0 0 2 4 9 3 8 3 33 14 16
Beer: No 93 100 100 98 96 91 97 92 97 67 86 84
Beer: Base 1,310 6 34 121 229 286 218 131 36 3 176 70
Water: Yes 13 0 6 8 10 18 11 15 8 33 17 11
Water: No 87 100 94 92 90 82 89 85 92 67 83 89
Water: Base 1,310 6 34 121 229 286 218 131 36 3 176 70
Spirits: Yes 8 0 0 6 6 8 2 9 6 0 16 14
Spirits: No 92 100 100 94 94 92 98 91 94 100 84 86
Spirits: Base 1,310 6 34 121 229 286 218 131 36 3 176 70
Dairy: Yes 23 0 12 23 21 29 21 23 28 67 24 16
Dairy: No 77 100 88 77 79 71 79 77 72 33 76 84
Dairy: Base 1,310 6 34 121 229 286 218 131 36 3 176 70
Figure 433: C4. What % of your diet is made up of meat? 0% 0 0 0 2 0 0 0 0 0 0 0 1
0-5% 3 17 15 9 2 4 1 1 0 0 2 1
6-15% 19 50 26 29 25 21 9 11 11 0 18 23
16-25% 37 0 41 31 38 42 39 31 42 33 39 30
More than 25% 37 0 15 26 31 31 50 55 47 67 36 33
Figure 434: C6. What level of inflation have you seen over the past 12 months on basic food and drink? Below 1% 2 0 3 1 3 5 2 2 3 0 1 1
1-3% 10 0 12 8 10 9 11 12 6 33 5 19
3-5% 16 17 6 15 14 15 22 17 19 0 15 13
5-7% 13 0 15 12 15 14 14 11 17 0 11 10
7-10% 17 0 12 17 17 19 12 16 33 33 18 10
Above 10% 23 67 32 28 28 20 15 27 14 33 32 11
Haven’t noticed any 6 0 15 7 4 8 8 6 6 0 1 7
D.K. 12 17 6 12 9 10 15 9 3 0 16 29
Base: Unwtd 1,310 6 34 121 229 286 218 131 36 3 176 70
Figure 435: C7. How sensitive are you to rising food and drink prices generally? Very sensitive 35 83 68 47 47 30 22 20 31 33 43 31
Somewhat sensitive 52 17 29 43 44 52 62 63 58 33 49 50
Somewhat not sensitive 7 0 3 4 6 12 6 8 11 33 4 11
Not at all sensitive 6 0 0 6 3 5 10 9 0 0 4 7
Base: Unwtd 1,310 6 34 121 229 286 218 131 36 3 176 70
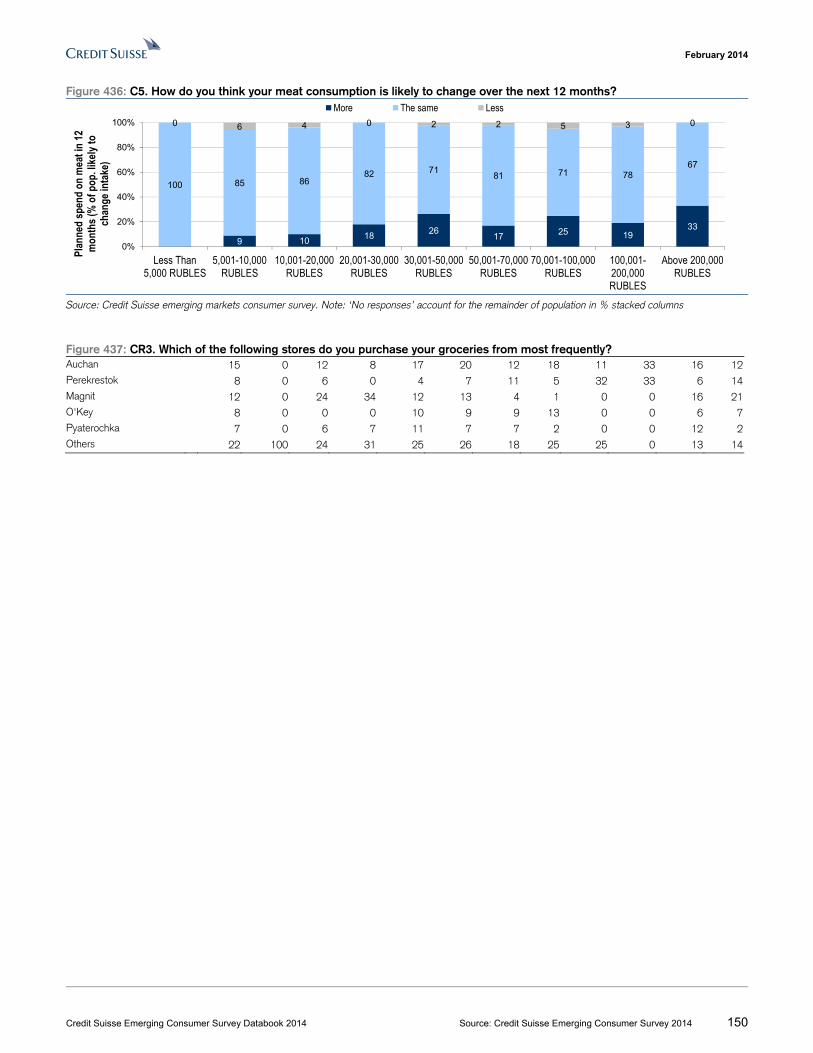
February 2014
Credit Suisse Emerging Consumer Survey Databook 2014 Source: Credit Suisse Emerging Consumer Survey 2014 150
Figure 436: C5. How do you think your meat consumption is likely to change over the next 12 months?
Source: Credit Suisse emerging markets consumer survey. Note: ‘No responses’ account for the remainder of population in % stacked columns
Figure 437: CR3. Which of the following stores do you purchase your groceries from most frequently? Auchan 15 0 12 8 17 20 12 18 11 33 16 12Perekrestok 8 0 6 0 4 7 11 5 32 33 6 14Magnit 12 0 24 34 12 13 4 1 0 0 16 21O'Key 8 0 0 0 10 9 9 13 0 0 6 7Pyaterochka 7 0 6 7 11 7 7 2 0 0 12 2Others 22 100 24 31 25 26 18 25 25 0 13 14
9 1018
2617 25 19
33
100 85 8682 71
81 71 7867
0 6 4 0 2 2 5 3 0
0%
20%
40%
60%
80%
100%
Less Than5,000 RUBLES
5,001-10,000RUBLES
10,001-20,000RUBLES
20,001-30,000RUBLES
30,001-50,000RUBLES
50,001-70,000RUBLES
70,001-100,000RUBLES
100,001-200,000RUBLES
Above 200,000RUBLES
Plan
ned
spen
d on
mea
t in
12
mon
ths (
% o
f pop
. like
ly to
ch
ange
inta
ke)
More The same Less
February 2014
Credit Suisse Emerging Consumer Survey Databook 2014 Source: Credit Suisse Emerging Consumer Survey 2014 151
Russia: Home & Personal Care Figure 438: E1. Have you purchased any of these products in the last 3 months? % of respondents (by income bracket)
Total Less Than 5000 RUB
5001-10000
RUB
10001-20000
RUB
20001-30000
RUB
30001-50000
RUB
50001-70000
RUB
70001-100000
RUB
100001-200000
RUB
Above 200000
RUB
Would prefer not to
answer
D.K
Tissues: Yes 81 33 82 88 86 82 83 80 85 100 81 55Tissues: No 19 67 18 12 14 18 17 20 15 0 19 45Tissues: Base 1,416 6 33 124 248 306 243 144 39 3 196 74Fem Hygiene: Yes 89 0 72 75 90 88 90 94 100 100 93 93Fem Hygiene: No 11 0 28 25 10 12 10 6 0 0 7 7Fem Hygiene: Base 717 0 25 68 135 158 124 64 18 2 94 29Cosmetics: Yes 58 17 42 47 60 58 60 63 67 100 57 55Cosmetics: No 42 83 58 53 40 42 40 38 33 0 43 45Cosmetics: Base 1,416 6 33 124 248 306 243 144 39 3 196 74
Figure 439: E2. Which brands have you purchased in the last 3 months? Tissues - Foreign 5 0 0 4 2 6 9 6 5 25 3 7
Tissues - Local 91 100 97 88 94 92 90 93 95 75 90 77
56 Metres 12 0 16 18 15 11 8 6 4 25 18 8 Myakgiy znak 13 0 21 8 15 11 13 17 16 0 10 13Tissues - Base 1,154 2 27 109 214 250 202 115 33 3 158 41
Fem Hygiene - Foreign 49 0 26 43 42 50 56 56 63 75 41 58
Always 19 0 11 14 15 21 20 21 26 50 17 27
Fem Hygiene - Local 50 0 74 51 56 50 43 44 37 25 58 38
Naturella 14 0 11 11 15 16 14 11 9 0 16 13
Libresse 8 0 4 6 9 6 10 13 11 25 7 9
Fem Hygiene - Base 636 0 18 51 122 139 112 60 18 2 87 27
Cosmetics - Foreign 56 0 57 27 47 53 62 71 71 89 50 68
Nivea 15 0 7 6 18 16 14 19 25 0 15 14
Avon 7 0 7 9 8 8 6 8 0 0 6 9
Cosmetics - Local 42 100 36 69 52 44 37 27 27 11 46 27
Oriflame 9 0 11 17 13 11 5 4 2 0 13 11
Chistaya Liniya 13 0 7 23 16 16 11 7 7 0 12 6
Cosmetics - Base 817 1 14 58 150 176 147 90 26 3 111 41
Figure 440: E3. Do you expect to spend more on any of these products in the next 12 months? Tissues: Yes 9 0 6 6 7 12 8 10 5 67 13 8Tissues: No 91 100 94 94 93 88 92 90 95 33 87 92Tissues: Base 1,416 6 33 124 248 306 243 144 39 3 196 74Fem Hygiene: Yes 11 0 12 9 6 16 8 13 11 50 12 10Fem Hygiene: No 89 0 88 91 94 84 92 88 89 50 88 90Fem Hygiene: Base 717 0 25 68 135 158 124 64 18 2 94 29Cosmetics: Yes 11 0 3 7 9 15 7 13 10 33 13 9Cosmetics: No 89 100 97 93 91 85 93 88 90 67 87 91Cosmetics: Base 1,416 6 33 124 248 306 243 144 39 3 196 74
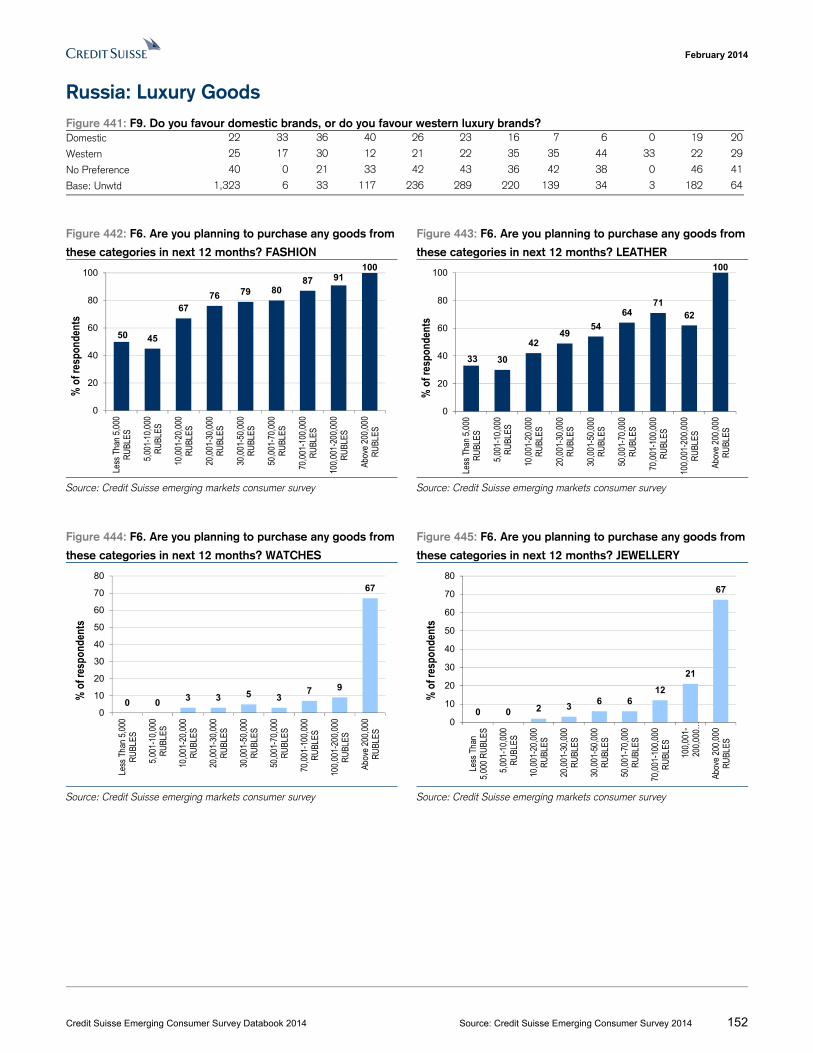
February 2014
Credit Suisse Emerging Consumer Survey Databook 2014 Source: Credit Suisse Emerging Consumer Survey 2014 152
Russia: Luxury Goods Figure 441: F9. Do you favour domestic brands, or do you favour western luxury brands? Domestic 22 33 36 40 26 23 16 7 6 0 19 20
Western 25 17 30 12 21 22 35 35 44 33 22 29
No Preference 40 0 21 33 42 43 36 42 38 0 46 41
Base: Unwtd 1,323 6 33 117 236 289 220 139 34 3 182 64
Figure 442: F6. Are you planning to purchase any goods from
these categories in next 12 months? FASHION
Figure 443: F6. Are you planning to purchase any goods from
these categories in next 12 months? LEATHER
Source: Credit Suisse emerging markets consumer survey Source: Credit Suisse emerging markets consumer survey
Figure 444: F6. Are you planning to purchase any goods from
these categories in next 12 months? WATCHES
Figure 445: F6. Are you planning to purchase any goods from
these categories in next 12 months? JEWELLERY
Source: Credit Suisse emerging markets consumer survey Source: Credit Suisse emerging markets consumer survey
50 45
6776 79 80
87 91100
0
20
40
60
80
100
Less
Tha
n 5,
000
RU
BLES
5,00
1-10
,000
RU
BLES
10,0
01-2
0,00
0R
UBL
ES
20,0
01-3
0,00
0R
UBL
ES
30,0
01-5
0,00
0R
UBL
ES
50,0
01-7
0,00
0R
UBL
ES
70,0
01-1
00,0
00R
UBL
ES
100,
001-
200,
000
RU
BLES
Abov
e 20
0,00
0R
UBL
ES
% o
f res
pond
ents
33 30
4249
54
6471
62
100
0
20
40
60
80
100
Less
Tha
n 5,
000
RU
BLES
5,00
1-10
,000
RU
BLES
10,0
01-2
0,00
0R
UBL
ES
20,0
01-3
0,00
0R
UBL
ES
30,0
01-5
0,00
0R
UBL
ES
50,0
01-7
0,00
0R
UBL
ES
70,0
01-1
00,0
00R
UBL
ES
100,
001-
200,
000
RU
BLES
Abov
e 20
0,00
0R
UBL
ES
% o
f res
pond
ents
0 0 3 3 5 37 9
67
0
10
20
30
40
50
60
70
80
Less
Tha
n 5,
000
RU
BLES
5,00
1-10
,000
RU
BLES
10,0
01-2
0,00
0R
UBL
ES
20,0
01-3
0,00
0R
UBL
ES
30,0
01-5
0,00
0R
UBL
ES
50,0
01-7
0,00
0R
UBL
ES
70,0
01-1
00,0
00R
UBL
ES
100,
001-
200,
000
RU
BLES
Abov
e 20
0,00
0R
UBL
ES
% o
f res
pond
ents
0 0 2 36 6
12
21
67
0
10
20
30
40
50
60
70
80
Less
Tha
n5,
000
RU
BLES
5,00
1-10
,000
RU
BLES
10,0
01-2
0,00
0R
UBL
ES
20,0
01-3
0,00
0R
UBL
ES
30,0
01-5
0,00
0R
UBL
ES
50,0
01-7
0,00
0R
UBL
ES
70,0
01-1
00,0
00R
UBL
ES
100,
001-
200,
000…
Abov
e 20
0,00
0R
UBL
ES
% o
f res
pond
ents
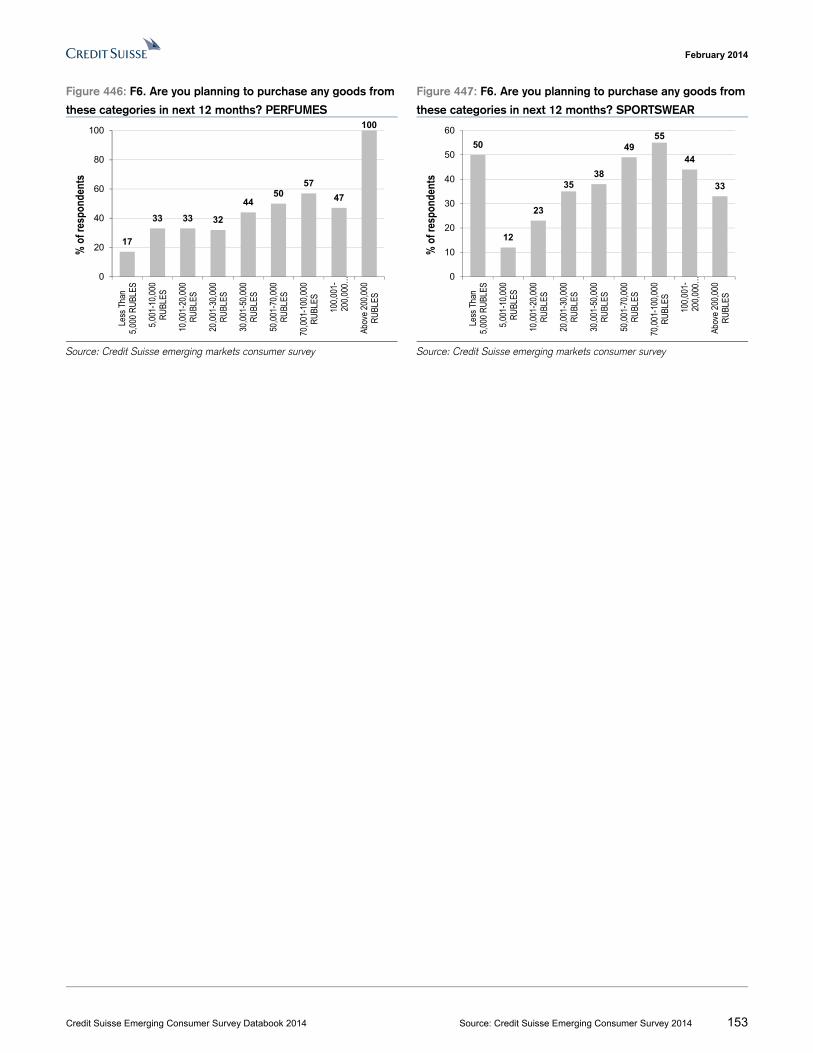
February 2014
Credit Suisse Emerging Consumer Survey Databook 2014 Source: Credit Suisse Emerging Consumer Survey 2014 153
Figure 446: F6. Are you planning to purchase any goods from
these categories in next 12 months? PERFUMES
Figure 447: F6. Are you planning to purchase any goods from
these categories in next 12 months? SPORTSWEAR
Source: Credit Suisse emerging markets consumer survey Source: Credit Suisse emerging markets consumer survey
17
33 33 32
4450
57
47
100
0
20
40
60
80
100Le
ss T
han
5,00
0 R
UBL
ES
5,00
1-10
,000
RU
BLES
10,0
01-2
0,00
0R
UBL
ES
20,0
01-3
0,00
0R
UBL
ES
30,0
01-5
0,00
0R
UBL
ES
50,0
01-7
0,00
0R
UBL
ES
70,0
01-1
00,0
00R
UBL
ES
100,
001-
200,
000…
Abov
e 20
0,00
0R
UBL
ES
% o
f res
pond
ents
50
12
23
3538
4955
44
33
0
10
20
30
40
50
60
Less
Tha
n5,
000
RU
BLES
5,00
1-10
,000
RU
BLES
10,0
01-2
0,00
0R
UBL
ES
20,0
01-3
0,00
0R
UBL
ES
30,0
01-5
0,00
0R
UBL
ES
50,0
01-7
0,00
0R
UBL
ES
70,0
01-1
00,0
00R
UBL
ES
100,
001-
200,
000…
Abov
e 20
0,00
0R
UBL
ES
% o
f res
pond
ents
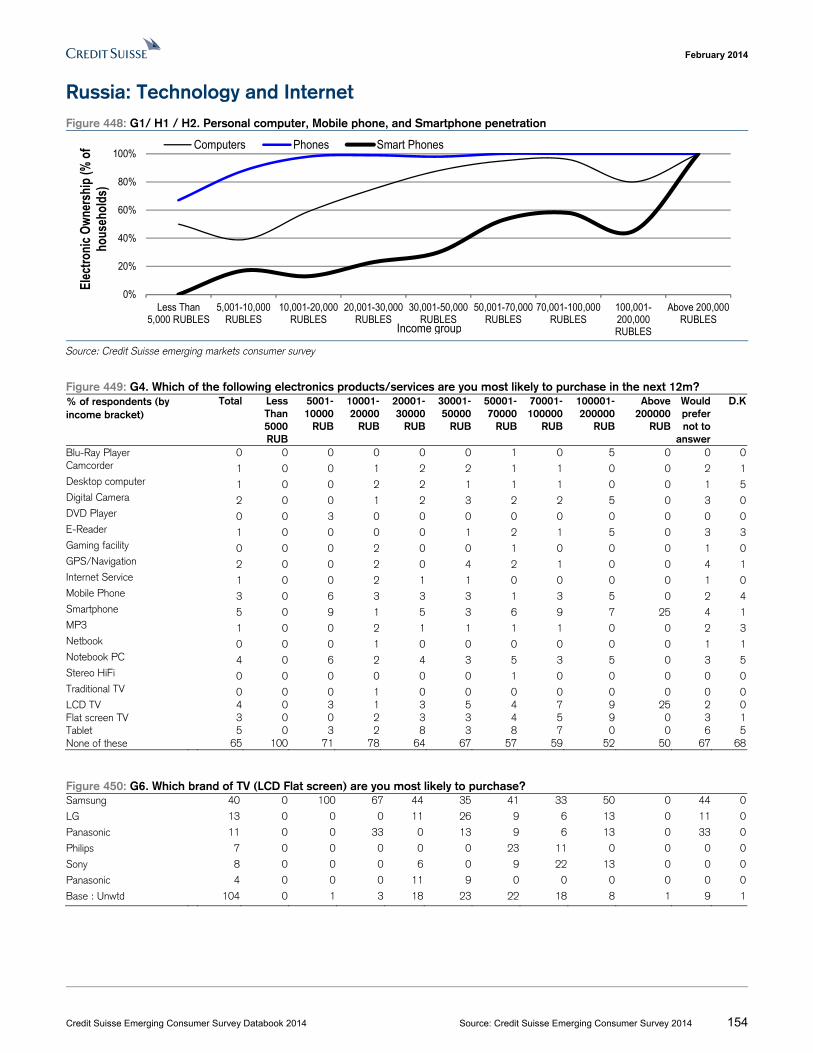
February 2014
Credit Suisse Emerging Consumer Survey Databook 2014 Source: Credit Suisse Emerging Consumer Survey 2014 154
Russia: Technology and Internet Figure 448: G1/ H1 / H2. Personal computer, Mobile phone, and Smartphone penetration
Source: Credit Suisse emerging markets consumer survey
Figure 449: G4. Which of the following electronics products/services are you most likely to purchase in the next 12m? % of respondents (by income bracket)
Total Less Than 5000 RUB
5001-10000
RUB
10001-20000
RUB
20001-30000
RUB
30001-50000
RUB
50001-70000
RUB
70001-100000
RUB
100001-200000
RUB
Above 200000
RUB
Would prefer not to
answer
D.K
Blu-Ray Player 0 0 0 0 0 0 1 0 5 0 0 0Camcorder 1 0 0 1 2 2 1 1 0 0 2 1Desktop computer 1 0 0 2 2 1 1 1 0 0 1 5Digital Camera 2 0 0 1 2 3 2 2 5 0 3 0DVD Player 0 0 3 0 0 0 0 0 0 0 0 0E-Reader 1 0 0 0 0 1 2 1 5 0 3 3Gaming facility 0 0 0 2 0 0 1 0 0 0 1 0GPS/Navigation 2 0 0 2 0 4 2 1 0 0 4 1Internet Service 1 0 0 2 1 1 0 0 0 0 1 0Mobile Phone 3 0 6 3 3 3 1 3 5 0 2 4Smartphone 5 0 9 1 5 3 6 9 7 25 4 1MP3 1 0 0 2 1 1 1 1 0 0 2 3Netbook 0 0 0 1 0 0 0 0 0 0 1 1Notebook PC 4 0 6 2 4 3 5 3 5 0 3 5Stereo HiFi 0 0 0 0 0 0 1 0 0 0 0 0Traditional TV 0 0 0 1 0 0 0 0 0 0 0 0LCD TV 4 0 3 1 3 5 4 7 9 25 2 0Flat screen TV 3 0 0 2 3 3 4 5 9 0 3 1Tablet 5 0 3 2 8 3 8 7 0 0 6 5None of these 65 100 71 78 64 67 57 59 52 50 67 68 Figure 450: G6. Which brand of TV (LCD Flat screen) are you most likely to purchase? Samsung 40 0 100 67 44 35 41 33 50 0 44 0
LG 13 0 0 0 11 26 9 6 13 0 11 0
Panasonic 11 0 0 33 0 13 9 6 13 0 33 0
Philips 7 0 0 0 0 0 23 11 0 0 0 0
Sony 8 0 0 0 6 0 9 22 13 0 0 0
Panasonic 4 0 0 0 11 9 0 0 0 0 0 0
Base : Unwtd 104 0 1 3 18 23 22 18 8 1 9 1
0%
20%
40%
60%
80%
100%
Less Than5,000 RUBLES
5,001-10,000RUBLES
10,001-20,000RUBLES
20,001-30,000RUBLES
30,001-50,000RUBLES
50,001-70,000RUBLES
70,001-100,000RUBLES
100,001-200,000RUBLES
Above 200,000RUBLES
Elec
tronic
Own
ersh
ip (%
of
hous
ehold
s)
Computers Phones Smart Phones
Income group
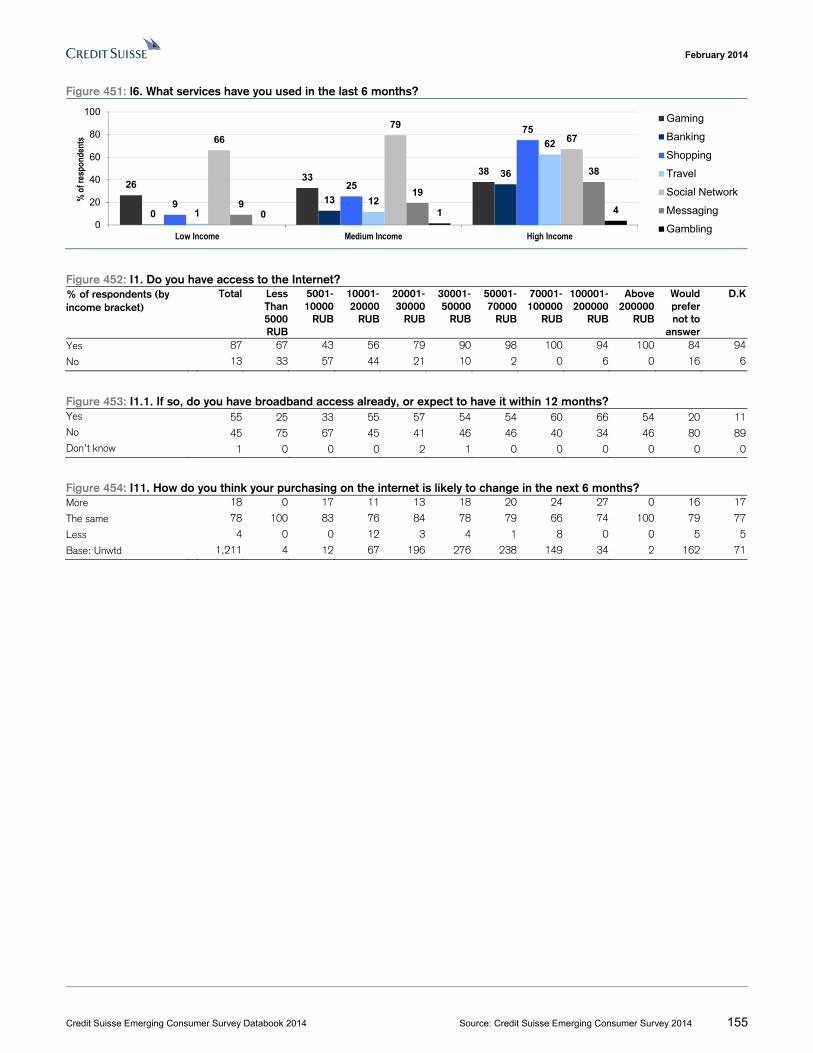
February 2014
Credit Suisse Emerging Consumer Survey Databook 2014 Source: Credit Suisse Emerging Consumer Survey 2014 155
Figure 451: l6. What services have you used in the last 6 months?
Figure 452: I1. Do you have access to the Internet? % of respondents (by income bracket)
Total Less Than 5000 RUB
5001-10000
RUB
10001-20000
RUB
20001-30000
RUB
30001-50000
RUB
50001-70000
RUB
70001-100000
RUB
100001-200000
RUB
Above 200000
RUB
Would prefer not to
answer
D.K
Yes 87 67 43 56 79 90 98 100 94 100 84 94
No 13 33 57 44 21 10 2 0 6 0 16 6
Figure 453: I1.1. If so, do you have broadband access already, or expect to have it within 12 months? Yes 55 25 33 55 57 54 54 60 66 54 20 11No 45 75 67 45 41 46 46 40 34 46 80 89Don’t know 1 0 0 0 2 1 0 0 0 0 0 0
Figure 454: I11. How do you think your purchasing on the internet is likely to change in the next 6 months? More 18 0 17 11 13 18 20 24 27 0 16 17
The same 78 100 83 76 84 78 79 66 74 100 79 77
Less 4 0 0 12 3 4 1 8 0 0 5 5
Base: Unwtd 1,211 4 12 67 196 276 238 149 34 2 162 71
2633
38
0
13
36
9
25
75
112
6266
79
67
919
38
0 1 4
0
20
40
60
80
100
Low Income Medium Income High Income
% o
f res
pond
ents
Gaming
Banking
Shopping
Travel
Social Network
Messaging
Gambling
February 2014
Credit Suisse Emerging Consumer Survey Databook 2014 Source: Credit Suisse Emerging Consumer Survey 2014 156
Russia: Telecommunications Figure 455: H1. Do you currently own and use a handset for personal use? % of respondents (by income bracket)
Total Less Than 5000 RUB
5001-10000
RUB
10001-20000
RUB
20001-30000
RUB
30001-50000
RUB
50001-70000
RUB
70001-100000
RUB
100001-200000
RUB
Above 200000
RUB
Would prefer not to
answer
D.K
Yes, I pay for it 95 67 76 92 96 94 99 97 100 100 93 96
Yes, employer pays 1 0 0 1 0 2 0 1 0 0 3 0
Yes, somebody else pays 3 0 12 5 2 3 1 2 0 0 3 4
No, I do not 1 33 12 2 1 2 0 0 0 0 1 0
Base : Unwtd 1,433 6 33 125 248 312 247 149 38 3 200 72
Figure 456: H3. What brand is your current mobile handset? Nokia 31 25 21 30 33 32 28 32 29 33 34
Samsung 38 50 48 38 44 38 40 30 24 0 32
Sony Ericsson 6 25 3 2 3 6 7 10 21 0 6
Base 1,414 4 29 122 245 307 247 149 38 3 198
Figure 457: H11. Do you plan to upgrade to a Smartphone in the next 12 months? Yes 31 100 0 22 29 29 24 38 45 0 34 50
No 69 0 100 78 71 71 76 62 55 0 66 50Base : Unwtd 290 1 1 18 56 76 50 29 11 0 38 10 Figure 458: H12. Which brand of Smartphone handset will you buy? Nokia 22 0 0 13 30 22 18 21 35 0 20 18
Samsung 27 0 0 35 23 31 33 29 15 0 20 14
Apple 11 0 0 4 8 9 14 16 10 100 9 5
Sony Ericsson 4 0 0 4 3 4 6 4 10 0 0 0
Base 509 1 4 23 77 113 102 70 20 2 75 22
Figure 459: H13. Is your next handset likely to be a 3G handset? Yes 43 0 25 26 40 40 58 51 50 100 31 32
No 9 0 0 22 13 7 12 13 15 0 0 0
Don’t Know 48 100 75 52 47 53 30 36 35 0 69 68
Base 509 1 4 23 77 113 102 70 20 2 75 22
Figure 460: H8. How much do you spend, on average, on mobile telephone bills per month?
Source: Credit Suisse emerging markets consumer survey
100 9783 88
7764
4637
0 014 11
1931
4242
67
3 2 2 3 4 1018
00 1 3 00 0 0 0 0
0%
20%
40%
60%
80%
100%
Less Than 5,000RUBLES
5,001-10,000RUBLES
10,001-20,000RUBLES
20,001-30,000RUBLES
30,001-50,000RUBLES
50,001-70,000RUBLES
70,001-100,000RUBLES
100,001-200,000RUBLES
Above 200,000RUBLES
% o
f res
pond
ents
Up to 600 RUBLES 601-1,200 RUBLES 1,201-2,000 RUBLES 2,001-3,000 RUBLES More than 3,000 RUBLES
February 2014
Credit Suisse Emerging Consumer Survey Databook 2014 Source: Credit Suisse Emerging Consumer Survey 2014 157
Russia: Travel Figure 461: J1/J6. Have you been / Are you planning to go on holiday in the last / next 12 months?
Source: Credit Suisse emerging markets consumer survey
Figure 462: J2. Where did you go on your last holiday? % of respondents (by income bracket)
Total Less Than 5000 RUB
5001-10000
RUB
10001-20000
RUB
20001-30000
RUB
30001-50000
RUB
50001-70000
RUB
70001-100000
RUB
100001-200000
RUB
Above 200000
RUB
Would prefer not to
answer
D.K
At home 37 0 43 57 47 44 28 22 19 0 39 43Elsewhere in the country 39 100 57 25 36 38 42 39 36 0 42 39
International destination 25 0 0 18 17 18 31 39 44 100 19 18
Base : Unwtd 948 1 7 51 128 217 202 118 36 3 134 51
Figure 463: J4. What was the main form of transport that you used to reach your holiday destination? Car 27 0 50 32 26 25 32 24 24 0 26 17
Bus 7 0 0 14 15 4 5 7 0 0 9 17
Train 32 0 50 32 31 43 29 22 17 0 35 38
Ship 0 100 0 0 0 0 0 0 0 0 0 0
Aeroplane 33 0 0 18 26 27 33 48 59 100 29 28
Other 1 0 0 5 1 0 0 0 0 0 1 0
Base : Unwtd 598 1 4 22 68 122 146 92 29 3 82 29
Figure 464: J7. Where are you planning to go for your next holiday? At home 26 25 40 45 32 25 20 16 12 0 31 37
Elsewhere in the country 47 75 60 34 51 56 49 39 32 0 42 44
International destination 27 0 0 21 17 19 31 45 56 100 28 19
Base : Unwtd 1,003 4 10 56 134 232 205 129 34 3 144 52
17 21
4050
7079 78
92100
67
3044
53
7481 85 87
100
0
20
40
60
80
100
Less Than5,000 RUBLES
5,001-10,000RUBLES
10,001-20,000RUBLES
20,001-30,000RUBLES
30,001-50,000RUBLES
50,001-70,000RUBLES
70,001-100,000RUBLES
100,001-200,000RUBLES
Above 200,000RUBLES
% o
f hou
seho
lds h
olid
ayin
g
Income Bracket
Taken holiday in the last 12 months Planning to take holiday in the next 12 months
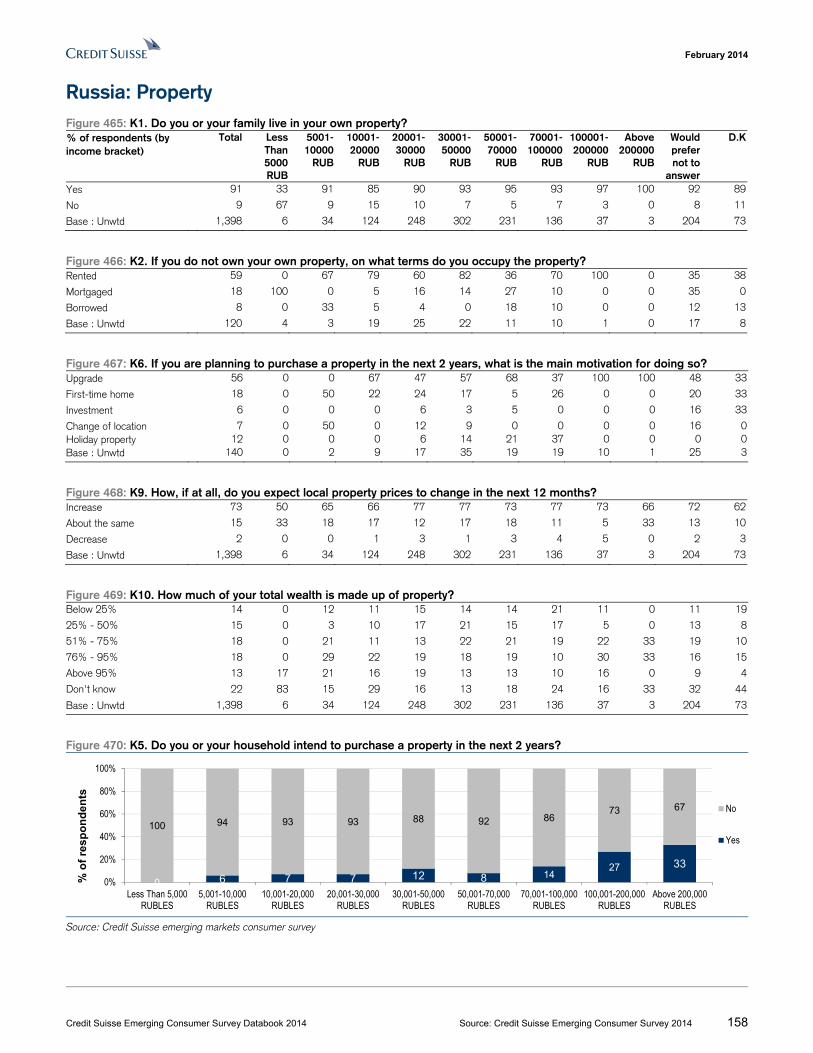
February 2014
Credit Suisse Emerging Consumer Survey Databook 2014 Source: Credit Suisse Emerging Consumer Survey 2014 158
Russia: Property Figure 465: K1. Do you or your family live in your own property? % of respondents (by income bracket)
Total Less Than 5000 RUB
5001-10000
RUB
10001-20000
RUB
20001-30000
RUB
30001-50000
RUB
50001-70000
RUB
70001-100000
RUB
100001-200000
RUB
Above 200000
RUB
Would prefer not to
answer
D.K
Yes 91 33 91 85 90 93 95 93 97 100 92 89
No 9 67 9 15 10 7 5 7 3 0 8 11
Base : Unwtd 1,398 6 34 124 248 302 231 136 37 3 204 73
Figure 466: K2. If you do not own your own property, on what terms do you occupy the property? Rented 59 0 67 79 60 82 36 70 100 0 35 38
Mortgaged 18 100 0 5 16 14 27 10 0 0 35 0
Borrowed 8 0 33 5 4 0 18 10 0 0 12 13
Base : Unwtd 120 4 3 19 25 22 11 10 1 0 17 8
Figure 467: K6. If you are planning to purchase a property in the next 2 years, what is the main motivation for doing so? Upgrade 56 0 0 67 47 57 68 37 100 100 48 33
First-time home 18 0 50 22 24 17 5 26 0 0 20 33
Investment 6 0 0 0 6 3 5 0 0 0 16 33
Change of location 7 0 50 0 12 9 0 0 0 0 16 0Holiday property 12 0 0 0 6 14 21 37 0 0 0 0Base : Unwtd 140 0 2 9 17 35 19 19 10 1 25 3
Figure 468: K9. How, if at all, do you expect local property prices to change in the next 12 months? Increase 73 50 65 66 77 77 73 77 73 66 72 62
About the same 15 33 18 17 12 17 18 11 5 33 13 10
Decrease 2 0 0 1 3 1 3 4 5 0 2 3
Base : Unwtd 1,398 6 34 124 248 302 231 136 37 3 204 73
Figure 469: K10. How much of your total wealth is made up of property? Below 25% 14 0 12 11 15 14 14 21 11 0 11 19
25% - 50% 15 0 3 10 17 21 15 17 5 0 13 8
51% - 75% 18 0 21 11 13 22 21 19 22 33 19 10
76% - 95% 18 0 29 22 19 18 19 10 30 33 16 15
Above 95% 13 17 21 16 19 13 13 10 16 0 9 4
Don't know 22 83 15 29 16 13 18 24 16 33 32 44
Base : Unwtd 1,398 6 34 124 248 302 231 136 37 3 204 73
Figure 470: K5. Do you or your household intend to purchase a property in the next 2 years?
Source: Credit Suisse emerging markets consumer survey
0 6 7 7 12 8 1427 33
100 94 93 93 88 92 8673 67
0%
20%
40%
60%
80%
100%
Less Than 5,000RUBLES
5,001-10,000RUBLES
10,001-20,000RUBLES
20,001-30,000RUBLES
30,001-50,000RUBLES
50,001-70,000RUBLES
70,001-100,000RUBLES
100,001-200,000RUBLES
Above 200,000RUBLES
% o
f re
sp
on
de
nts
No
Yes
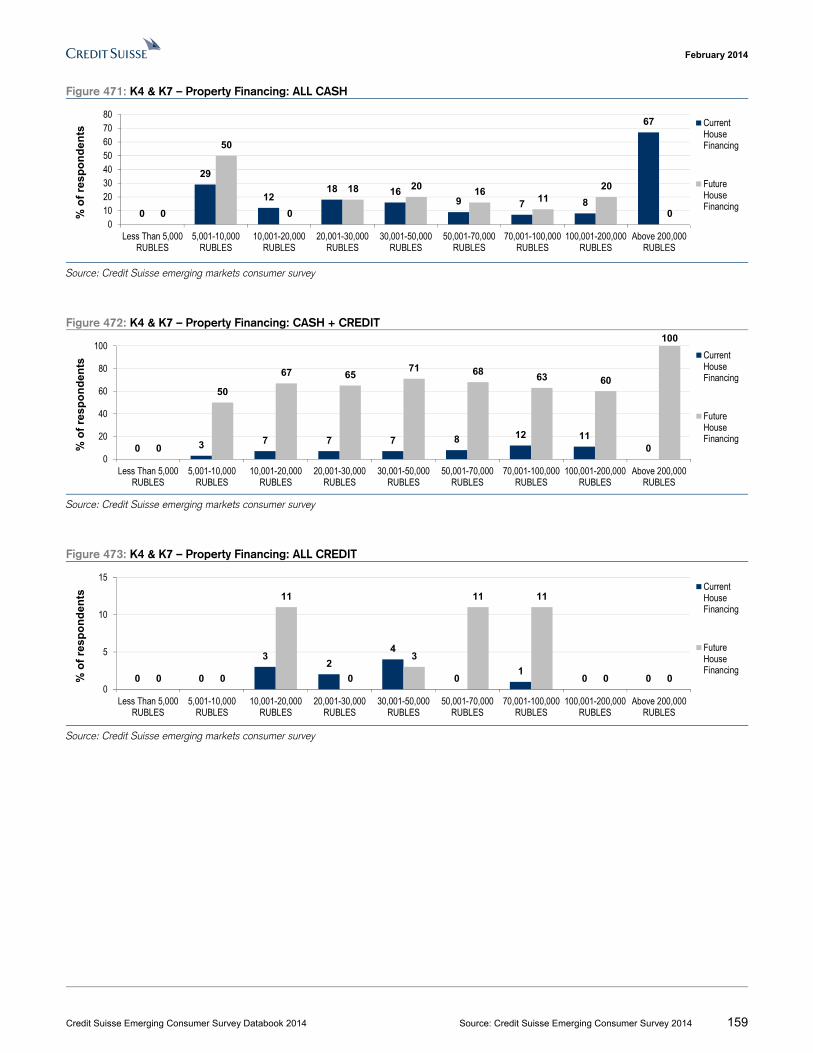
February 2014
Credit Suisse Emerging Consumer Survey Databook 2014 Source: Credit Suisse Emerging Consumer Survey 2014 159
Figure 471: K4 & K7 – Property Financing: ALL CASH
Source: Credit Suisse emerging markets consumer survey
Figure 472: K4 & K7 – Property Financing: CASH + CREDIT
Source: Credit Suisse emerging markets consumer survey
Figure 473: K4 & K7 – Property Financing: ALL CREDIT
Source: Credit Suisse emerging markets consumer survey
0
29
1218 16
9 7 8
67
0
50
0
18 20 1611
20
00
1020304050607080
Less Than 5,000RUBLES
5,001-10,000RUBLES
10,001-20,000RUBLES
20,001-30,000RUBLES
30,001-50,000RUBLES
50,001-70,000RUBLES
70,001-100,000RUBLES
100,001-200,000RUBLES
Above 200,000RUBLES
% o
f re
spo
nd
ents
CurrentHouseFinancing
FutureHouseFinancing
0 3 7 7 7 8 12 1100
50
67 6571 68
63 60
100
0
20
40
60
80
100
Less Than 5,000RUBLES
5,001-10,000RUBLES
10,001-20,000RUBLES
20,001-30,000RUBLES
30,001-50,000RUBLES
50,001-70,000RUBLES
70,001-100,000RUBLES
100,001-200,000RUBLES
Above 200,000RUBLES
% o
f re
spo
nd
ents
CurrentHouseFinancing
FutureHouseFinancing
0 0
32
4
01
0 00 0
11
0
3
11 11
0 00
5
10
15
Less Than 5,000RUBLES
5,001-10,000RUBLES
10,001-20,000RUBLES
20,001-30,000RUBLES
30,001-50,000RUBLES
50,001-70,000RUBLES
70,001-100,000RUBLES
100,001-200,000RUBLES
Above 200,000RUBLES
% o
f re
spo
nd
ents
CurrentHouseFinancing
FutureHouseFinancing
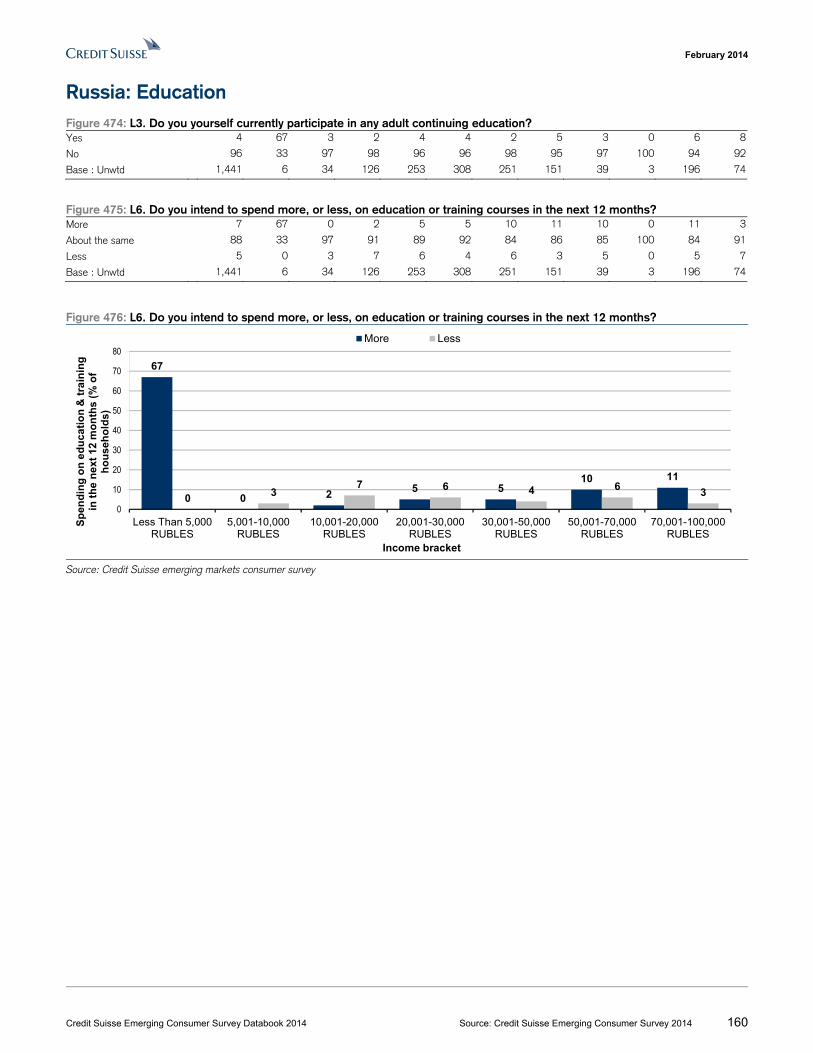
February 2014
Credit Suisse Emerging Consumer Survey Databook 2014 Source: Credit Suisse Emerging Consumer Survey 2014 160
Russia: Education Figure 474: L3. Do you yourself currently participate in any adult continuing education? Yes 4 67 3 2 4 4 2 5 3 0 6 8
No 96 33 97 98 96 96 98 95 97 100 94 92
Base : Unwtd 1,441 6 34 126 253 308 251 151 39 3 196 74
Figure 475: L6. Do you intend to spend more, or less, on education or training courses in the next 12 months? More 7 67 0 2 5 5 10 11 10 0 11 3
About the same 88 33 97 91 89 92 84 86 85 100 84 91
Less 5 0 3 7 6 4 6 3 5 0 5 7
Base : Unwtd 1,441 6 34 126 253 308 251 151 39 3 196 74
Figure 476: L6. Do you intend to spend more, or less, on education or training courses in the next 12 months?
Source: Credit Suisse emerging markets consumer survey
67
0 2 5 510 11
0 37 6 4 6
3
0
10
20
30
40
50
60
70
80
Less Than 5,000RUBLES
5,001-10,000RUBLES
10,001-20,000RUBLES
20,001-30,000RUBLES
30,001-50,000RUBLES
50,001-70,000RUBLES
70,001-100,000RUBLES
Sp
end
ing
on
ed
uca
tio
n &
tra
inin
g
in t
he
ne
xt 1
2 m
on
ths
(%
of
ho
use
ho
lds)
Income bracket
More Less
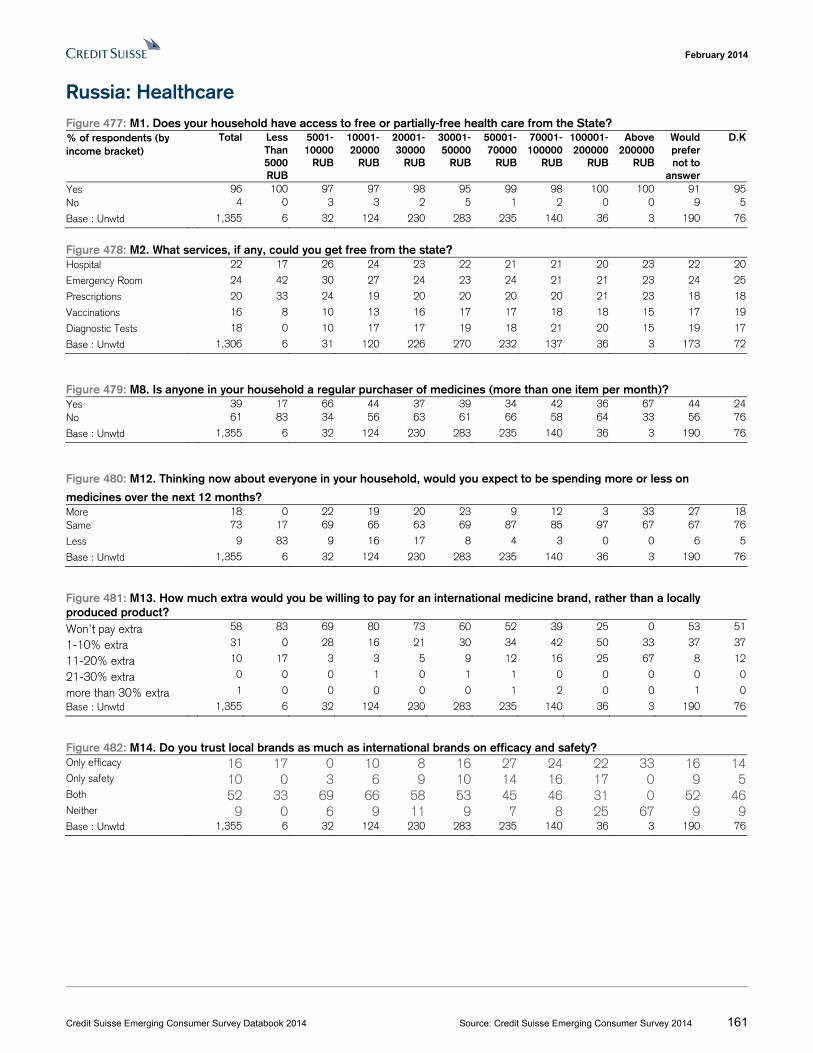
February 2014
Credit Suisse Emerging Consumer Survey Databook 2014 Source: Credit Suisse Emerging Consumer Survey 2014 161
Russia: Healthcare Figure 477: M1. Does your household have access to free or partially-free health care from the State? % of respondents (by income bracket)
Total Less Than 5000 RUB
5001-10000
RUB
10001-20000
RUB
20001-30000
RUB
30001-50000
RUB
50001-70000
RUB
70001-100000
RUB
100001-200000
RUB
Above 200000
RUB
Would prefer not to
answer
D.K
Yes 96 100 97 97 98 95 99 98 100 100 91 95No 4 0 3 3 2 5 1 2 0 0 9 5
Base : Unwtd 1,355 6 32 124 230 283 235 140 36 3 190 76
Figure 478: M2. What services, if any, could you get free from the state? Hospital 22 17 26 24 23 22 21 21 20 23 22 20
Emergency Room 24 42 30 27 24 23 24 21 21 23 24 25
Prescriptions 20 33 24 19 20 20 20 20 21 23 18 18
Vaccinations 16 8 10 13 16 17 17 18 18 15 17 19
Diagnostic Tests 18 0 10 17 17 19 18 21 20 15 19 17
Base : Unwtd 1,306 6 31 120 226 270 232 137 36 3 173 72
Figure 479: M8. Is anyone in your household a regular purchaser of medicines (more than one item per month)? Yes 39 17 66 44 37 39 34 42 36 67 44 24No 61 83 34 56 63 61 66 58 64 33 56 76
Base : Unwtd 1,355 6 32 124 230 283 235 140 36 3 190 76
Figure 480: M12. Thinking now about everyone in your household, would you expect to be spending more or less on
medicines over the next 12 months? More 18 0 22 19 20 23 9 12 3 33 27 18Same 73 17 69 65 63 69 87 85 97 67 67 76
Less 9 83 9 16 17 8 4 3 0 0 6 5
Base : Unwtd 1,355 6 32 124 230 283 235 140 36 3 190 76
Figure 481: M13. How much extra would you be willing to pay for an international medicine brand, rather than a locally produced product? Won’t pay extra 58 83 69 80 73 60 52 39 25 0 53 51
1-10% extra 31 0 28 16 21 30 34 42 50 33 37 37
11-20% extra 10 17 3 3 5 9 12 16 25 67 8 12
21-30% extra 0 0 0 1 0 1 1 0 0 0 0 0
more than 30% extra 1 0 0 0 0 0 1 2 0 0 1 0
Base : Unwtd 1,355 6 32 124 230 283 235 140 36 3 190 76
Figure 482: M14. Do you trust local brands as much as international brands on efficacy and safety? Only efficacy 16 17 0 10 8 16 27 24 22 33 16 14Only safety 10 0 3 6 9 10 14 16 17 0 9 5Both 52 33 69 66 58 53 45 46 31 0 52 46Neither 9 0 6 9 11 9 7 8 25 67 9 9Base : Unwtd 1,355 6 32 124 230 283 235 140 36 3 190 76
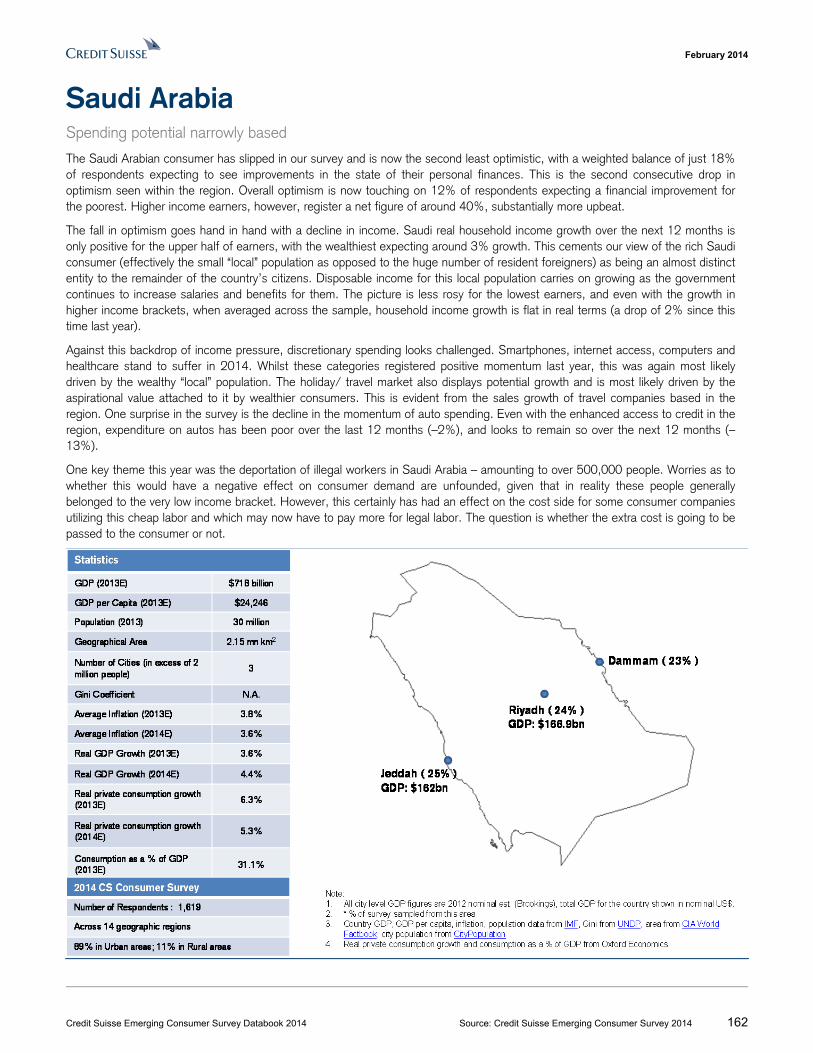
February 2014
Credit Suisse Emerging Consumer Survey Databook 2014 Source: Credit Suisse Emerging Consumer Survey 2014 162
Saudi Arabia Spending potential narrowly based
The Saudi Arabian consumer has slipped in our survey and is now the second least optimistic, with a weighted balance of just 18% of respondents expecting to see improvements in the state of their personal finances. This is the second consecutive drop in optimism seen within the region. Overall optimism is now touching on 12% of respondents expecting a financial improvement for the poorest. Higher income earners, however, register a net figure of around 40%, substantially more upbeat.
The fall in optimism goes hand in hand with a decline in income. Saudi real household income growth over the next 12 months is only positive for the upper half of earners, with the wealthiest expecting around 3% growth. This cements our view of the rich Saudi consumer (effectively the small “local” population as opposed to the huge number of resident foreigners) as being an almost distinct entity to the remainder of the country’s citizens. Disposable income for this local population carries on growing as the government continues to increase salaries and benefits for them. The picture is less rosy for the lowest earners, and even with the growth in higher income brackets, when averaged across the sample, household income growth is flat in real terms (a drop of 2% since this time last year).
Against this backdrop of income pressure, discretionary spending looks challenged. Smartphones, internet access, computers and healthcare stand to suffer in 2014. Whilst these categories registered positive momentum last year, this was again most likely driven by the wealthy “local” population. The holiday/ travel market also displays potential growth and is most likely driven by the aspirational value attached to it by wealthier consumers. This is evident from the sales growth of travel companies based in the region. One surprise in the survey is the decline in the momentum of auto spending. Even with the enhanced access to credit in the region, expenditure on autos has been poor over the last 12 months (–2%), and looks to remain so over the next 12 months (–13%).
One key theme this year was the deportation of illegal workers in Saudi Arabia – amounting to over 500,000 people. Worries as to whether this would have a negative effect on consumer demand are unfounded, given that in reality these people generally belonged to the very low income bracket. However, this certainly has had an effect on the cost side for some consumer companies utilizing this cheap labor and which may now have to pay more for legal labor. The question is whether the extra cost is going to be passed to the consumer or not.
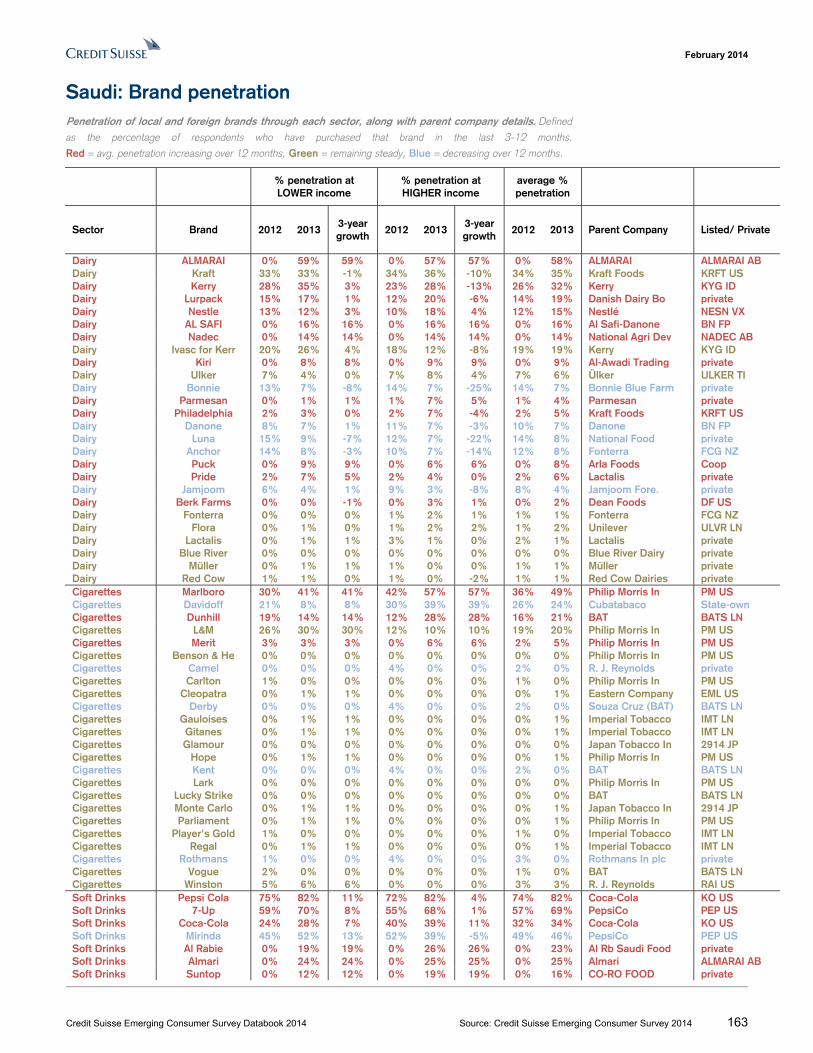
February 2014
Credit Suisse Emerging Consumer Survey Databook 2014 Source: Credit Suisse Emerging Consumer Survey 2014 163
Saudi: Brand penetration Penetration of local and foreign brands through each sector, along with parent company details. Defined
as the percentage of respondents who have purchased that brand in the last 3-12 months.
Red = avg. penetration increasing over 12 months, Green = remaining steady, Blue = decreasing over 12 months.
% penetration at LOWER income
% penetration at HIGHER income
average % penetration
Sector Brand 2012 2013 3-year growth
2012 2013 3-year growth
2012 2013 Parent Company Listed/ Private
Dairy ALMARAI 0% 59% 59% 0% 57% 57% 0% 58% ALMARAI ALMARAI AB Dairy Kraft 33% 33% -1% 34% 36% -10% 34% 35% Kraft Foods KRFT US Dairy Kerry 28% 35% 3% 23% 28% -13% 26% 32% Kerry KYG ID Dairy Lurpack 15% 17% 1% 12% 20% -6% 14% 19% Danish Dairy Bo private Dairy Nestle 13% 12% 3% 10% 18% 4% 12% 15% Nestlé NESN VX Dairy AL SAFI 0% 16% 16% 0% 16% 16% 0% 16% Al Safi-Danone BN FP Dairy Nadec 0% 14% 14% 0% 14% 14% 0% 14% National Agri Dev NADEC AB Dairy Ivasc for Kerr 20% 26% 4% 18% 12% -8% 19% 19% Kerry KYG ID Dairy Kiri 0% 8% 8% 0% 9% 9% 0% 9% Al-Awadi Trading private Dairy Ulker 7% 4% 0% 7% 8% 4% 7% 6% Ülker ULKER TI Dairy Bonnie 13% 7% -8% 14% 7% -25% 14% 7% Bonnie Blue Farm private Dairy Parmesan 0% 1% 1% 1% 7% 5% 1% 4% Parmesan private Dairy Philadelphia 2% 3% 0% 2% 7% -4% 2% 5% Kraft Foods KRFT US Dairy Danone 8% 7% 1% 11% 7% -3% 10% 7% Danone BN FP Dairy Luna 15% 9% -7% 12% 7% -22% 14% 8% National Food private Dairy Anchor 14% 8% -3% 10% 7% -14% 12% 8% Fonterra FCG NZ Dairy Puck 0% 9% 9% 0% 6% 6% 0% 8% Arla Foods Coop Dairy Pride 2% 7% 5% 2% 4% 0% 2% 6% Lactalis private Dairy Jamjoom 6% 4% 1% 9% 3% -8% 8% 4% Jamjoom Fore. private Dairy Berk Farms 0% 0% -1% 0% 3% 1% 0% 2% Dean Foods DF US Dairy Fonterra 0% 0% 0% 1% 2% 1% 1% 1% Fonterra FCG NZ Dairy Flora 0% 1% 0% 1% 2% 2% 1% 2% Unilever ULVR LN Dairy Lactalis 0% 1% 1% 3% 1% 0% 2% 1% Lactalis private Dairy Blue River 0% 0% 0% 0% 0% 0% 0% 0% Blue River Dairy private Dairy Müller 0% 1% 1% 1% 0% 0% 1% 1% Müller private Dairy Red Cow 1% 1% 0% 1% 0% -2% 1% 1% Red Cow Dairies private Cigarettes Marlboro 30% 41% 41% 42% 57% 57% 36% 49% Philip Morris In PM US Cigarettes Davidoff 21% 8% 8% 30% 39% 39% 26% 24% Cubatabaco State-own Cigarettes Dunhill 19% 14% 14% 12% 28% 28% 16% 21% BAT BATS LN Cigarettes L&M 26% 30% 30% 12% 10% 10% 19% 20% Philip Morris In PM US Cigarettes Merit 3% 3% 3% 0% 6% 6% 2% 5% Philip Morris In PM US Cigarettes Benson & He 0% 0% 0% 0% 0% 0% 0% 0% Philip Morris In PM US Cigarettes Camel 0% 0% 0% 4% 0% 0% 2% 0% R. J. Reynolds private Cigarettes Carlton 1% 0% 0% 0% 0% 0% 1% 0% Philip Morris In PM US Cigarettes Cleopatra 0% 1% 1% 0% 0% 0% 0% 1% Eastern Company EML US Cigarettes Derby 0% 0% 0% 4% 0% 0% 2% 0% Souza Cruz (BAT) BATS LN Cigarettes Gauloises 0% 1% 1% 0% 0% 0% 0% 1% Imperial Tobacco IMT LN Cigarettes Gitanes 0% 1% 1% 0% 0% 0% 0% 1% Imperial Tobacco IMT LN Cigarettes Glamour 0% 0% 0% 0% 0% 0% 0% 0% Japan Tobacco In 2914 JP Cigarettes Hope 0% 1% 1% 0% 0% 0% 0% 1% Philip Morris In PM US Cigarettes Kent 0% 0% 0% 4% 0% 0% 2% 0% BAT BATS LN Cigarettes Lark 0% 0% 0% 0% 0% 0% 0% 0% Philip Morris In PM US Cigarettes Lucky Strike 0% 0% 0% 0% 0% 0% 0% 0% BAT BATS LN Cigarettes Monte Carlo 0% 1% 1% 0% 0% 0% 0% 1% Japan Tobacco In 2914 JP Cigarettes Parliament 0% 1% 1% 0% 0% 0% 0% 1% Philip Morris In PM US Cigarettes Player's Gold 1% 0% 0% 0% 0% 0% 1% 0% Imperial Tobacco IMT LN Cigarettes Regal 0% 1% 1% 0% 0% 0% 0% 1% Imperial Tobacco IMT LN Cigarettes Rothmans 1% 0% 0% 4% 0% 0% 3% 0% Rothmans In plc private Cigarettes Vogue 2% 0% 0% 0% 0% 0% 1% 0% BAT BATS LN Cigarettes Winston 5% 6% 6% 0% 0% 0% 3% 3% R. J. Reynolds RAI US Soft Drinks Pepsi Cola 75% 82% 11% 72% 82% 4% 74% 82% Coca-Cola KO US Soft Drinks 7-Up 59% 70% 8% 55% 68% 1% 57% 69% PepsiCo PEP US Soft Drinks Coca-Cola 24% 28% 7% 40% 39% 11% 32% 34% Coca-Cola KO US Soft Drinks Mirinda 45% 52% 13% 52% 39% -5% 49% 46% PepsiCo PEP US Soft Drinks Al Rabie 0% 19% 19% 0% 26% 26% 0% 23% Al Rb Saudi Food private Soft Drinks Almari 0% 24% 24% 0% 25% 25% 0% 25% Almari ALMARAI AB Soft Drinks Suntop 0% 12% 12% 0% 19% 19% 0% 16% CO-RO FOOD private
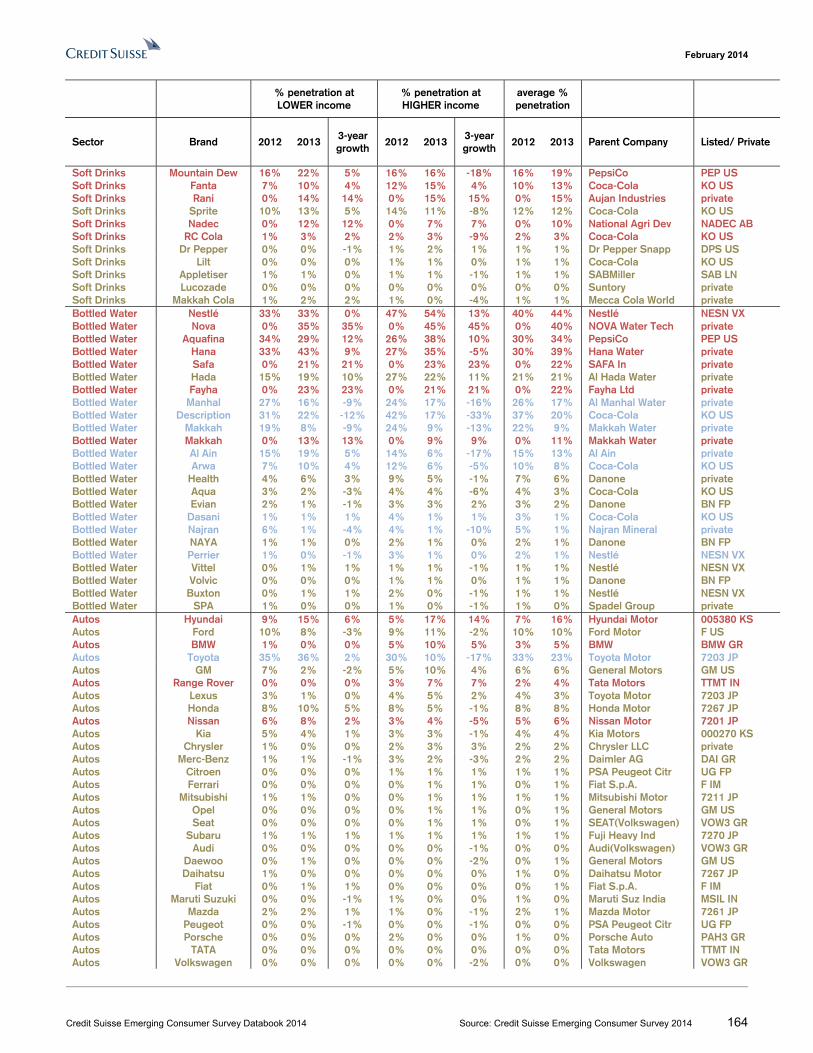
February 2014
Credit Suisse Emerging Consumer Survey Databook 2014 Source: Credit Suisse Emerging Consumer Survey 2014 164
% penetration at LOWER income
% penetration at HIGHER income
average % penetration
Sector Brand 2012 2013 3-year growth
2012 2013 3-year growth
2012 2013 Parent Company Listed/ Private
Soft Drinks Mountain Dew 16% 22% 5% 16% 16% -18% 16% 19% PepsiCo PEP US Soft Drinks Fanta 7% 10% 4% 12% 15% 4% 10% 13% Coca-Cola KO US Soft Drinks Rani 0% 14% 14% 0% 15% 15% 0% 15% Aujan Industries private Soft Drinks Sprite 10% 13% 5% 14% 11% -8% 12% 12% Coca-Cola KO US Soft Drinks Nadec 0% 12% 12% 0% 7% 7% 0% 10% National Agri Dev NADEC AB Soft Drinks RC Cola 1% 3% 2% 2% 3% -9% 2% 3% Coca-Cola KO US Soft Drinks Dr Pepper 0% 0% -1% 1% 2% 1% 1% 1% Dr Pepper Snapp DPS US Soft Drinks Lilt 0% 0% 0% 1% 1% 0% 1% 1% Coca-Cola KO US Soft Drinks Appletiser 1% 1% 0% 1% 1% -1% 1% 1% SABMiller SAB LN Soft Drinks Lucozade 0% 0% 0% 0% 0% 0% 0% 0% Suntory private Soft Drinks Makkah Cola 1% 2% 2% 1% 0% -4% 1% 1% Mecca Cola World private Bottled Water Nestlé 33% 33% 0% 47% 54% 13% 40% 44% Nestlé NESN VX Bottled Water Nova 0% 35% 35% 0% 45% 45% 0% 40% NOVA Water Tech private Bottled Water Aquafina 34% 29% 12% 26% 38% 10% 30% 34% PepsiCo PEP US Bottled Water Hana 33% 43% 9% 27% 35% -5% 30% 39% Hana Water private Bottled Water Safa 0% 21% 21% 0% 23% 23% 0% 22% SAFA In private Bottled Water Hada 15% 19% 10% 27% 22% 11% 21% 21% Al Hada Water private Bottled Water Fayha 0% 23% 23% 0% 21% 21% 0% 22% Fayha Ltd private Bottled Water Manhal 27% 16% -9% 24% 17% -16% 26% 17% Al Manhal Water private Bottled Water Description 31% 22% -12% 42% 17% -33% 37% 20% Coca-Cola KO US Bottled Water Makkah 19% 8% -9% 24% 9% -13% 22% 9% Makkah Water private Bottled Water Makkah 0% 13% 13% 0% 9% 9% 0% 11% Makkah Water private Bottled Water Al Ain 15% 19% 5% 14% 6% -17% 15% 13% Al Ain private Bottled Water Arwa 7% 10% 4% 12% 6% -5% 10% 8% Coca-Cola KO US Bottled Water Health 4% 6% 3% 9% 5% -1% 7% 6% Danone private Bottled Water Aqua 3% 2% -3% 4% 4% -6% 4% 3% Coca-Cola KO US Bottled Water Evian 2% 1% -1% 3% 3% 2% 3% 2% Danone BN FP Bottled Water Dasani 1% 1% 1% 4% 1% 1% 3% 1% Coca-Cola KO US Bottled Water Najran 6% 1% -4% 4% 1% -10% 5% 1% Najran Mineral private Bottled Water NAYA 1% 1% 0% 2% 1% 0% 2% 1% Danone BN FP Bottled Water Perrier 1% 0% -1% 3% 1% 0% 2% 1% Nestlé NESN VX Bottled Water Vittel 0% 1% 1% 1% 1% -1% 1% 1% Nestlé NESN VX Bottled Water Volvic 0% 0% 0% 1% 1% 0% 1% 1% Danone BN FP Bottled Water Buxton 0% 1% 1% 2% 0% -1% 1% 1% Nestlé NESN VX Bottled Water SPA 1% 0% 0% 1% 0% -1% 1% 0% Spadel Group private Autos Hyundai 9% 15% 6% 5% 17% 14% 7% 16% Hyundai Motor 005380 KS Autos Ford 10% 8% -3% 9% 11% -2% 10% 10% Ford Motor F US Autos BMW 1% 0% 0% 5% 10% 5% 3% 5% BMW BMW GR Autos Toyota 35% 36% 2% 30% 10% -17% 33% 23% Toyota Motor 7203 JP Autos GM 7% 2% -2% 5% 10% 4% 6% 6% General Motors GM US Autos Range Rover 0% 0% 0% 3% 7% 7% 2% 4% Tata Motors TTMT IN Autos Lexus 3% 1% 0% 4% 5% 2% 4% 3% Toyota Motor 7203 JP Autos Honda 8% 10% 5% 8% 5% -1% 8% 8% Honda Motor 7267 JP Autos Nissan 6% 8% 2% 3% 4% -5% 5% 6% Nissan Motor 7201 JP Autos Kia 5% 4% 1% 3% 3% -1% 4% 4% Kia Motors 000270 KS Autos Chrysler 1% 0% 0% 2% 3% 3% 2% 2% Chrysler LLC private Autos Merc-Benz 1% 1% -1% 3% 2% -3% 2% 2% Daimler AG DAI GR Autos Citroen 0% 0% 0% 1% 1% 1% 1% 1% PSA Peugeot Citr UG FP Autos Ferrari 0% 0% 0% 0% 1% 1% 0% 1% Fiat S.p.A. F IM Autos Mitsubishi 1% 1% 0% 0% 1% 1% 1% 1% Mitsubishi Motor 7211 JP Autos Opel 0% 0% 0% 0% 1% 1% 0% 1% General Motors GM US Autos Seat 0% 0% 0% 0% 1% 1% 0% 1% SEAT(Volkswagen) VOW3 GR Autos Subaru 1% 1% 1% 1% 1% 1% 1% 1% Fuji Heavy Ind 7270 JP Autos Audi 0% 0% 0% 0% 0% -1% 0% 0% Audi(Volkswagen) VOW3 GR Autos Daewoo 0% 1% 0% 0% 0% -2% 0% 1% General Motors GM US Autos Daihatsu 1% 0% 0% 0% 0% 0% 1% 0% Daihatsu Motor 7267 JP Autos Fiat 0% 1% 1% 0% 0% 0% 0% 1% Fiat S.p.A. F IM Autos Maruti Suzuki 0% 0% -1% 1% 0% 0% 1% 0% Maruti Suz India MSIL IN Autos Mazda 2% 2% 1% 1% 0% -1% 2% 1% Mazda Motor 7261 JP Autos Peugeot 0% 0% -1% 0% 0% -1% 0% 0% PSA Peugeot Citr UG FP Autos Porsche 0% 0% 0% 2% 0% 0% 1% 0% Porsche Auto PAH3 GR Autos TATA 0% 0% 0% 0% 0% 0% 0% 0% Tata Motors TTMT IN Autos Volkswagen 0% 0% 0% 0% 0% -2% 0% 0% Volkswagen VOW3 GR
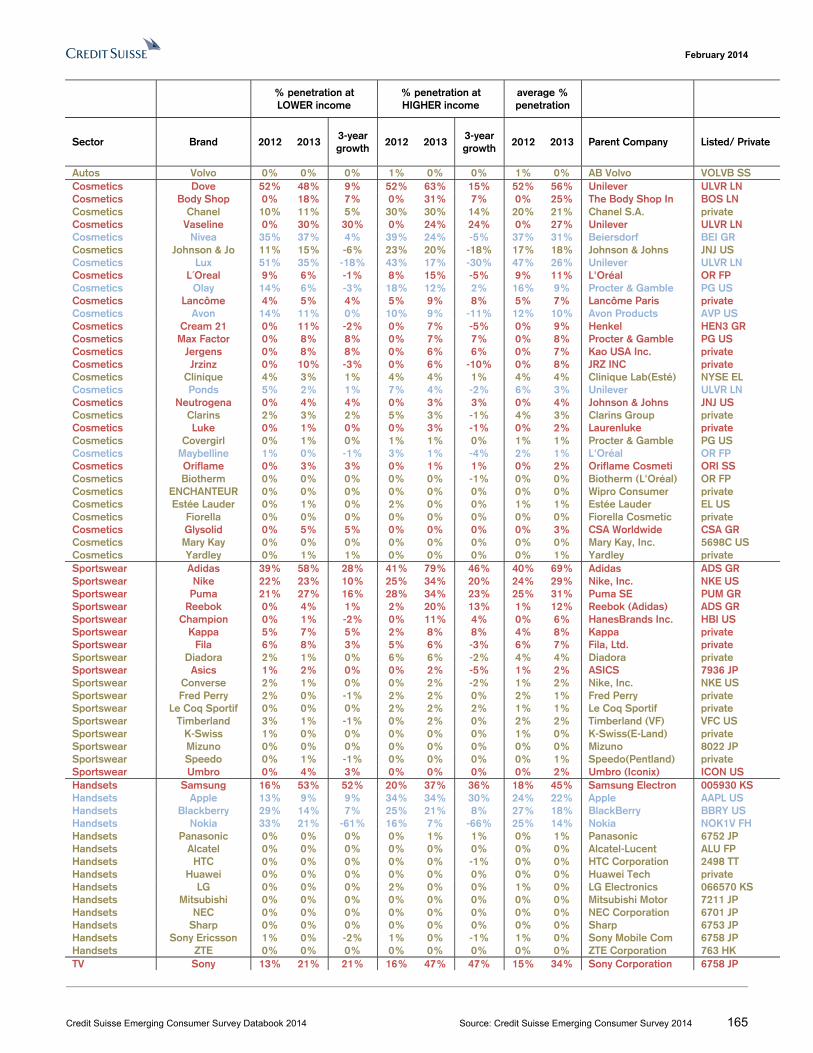
February 2014
Credit Suisse Emerging Consumer Survey Databook 2014 Source: Credit Suisse Emerging Consumer Survey 2014 165
% penetration at LOWER income
% penetration at HIGHER income
average % penetration
Sector Brand 2012 2013 3-year growth
2012 2013 3-year growth
2012 2013 Parent Company Listed/ Private
Autos Volvo 0% 0% 0% 1% 0% 0% 1% 0% AB Volvo VOLVB SS Cosmetics Dove 52% 48% 9% 52% 63% 15% 52% 56% Unilever ULVR LN Cosmetics Body Shop 0% 18% 7% 0% 31% 7% 0% 25% The Body Shop In BOS LN Cosmetics Chanel 10% 11% 5% 30% 30% 14% 20% 21% Chanel S.A. private Cosmetics Vaseline 0% 30% 30% 0% 24% 24% 0% 27% Unilever ULVR LN Cosmetics Nivea 35% 37% 4% 39% 24% -5% 37% 31% Beiersdorf BEI GR Cosmetics Johnson & Jo 11% 15% -6% 23% 20% -18% 17% 18% Johnson & Johns JNJ US Cosmetics Lux 51% 35% -18% 43% 17% -30% 47% 26% Unilever ULVR LN Cosmetics L´Oreal 9% 6% -1% 8% 15% -5% 9% 11% L'Oréal OR FP Cosmetics Olay 14% 6% -3% 18% 12% 2% 16% 9% Procter & Gamble PG US Cosmetics Lancôme 4% 5% 4% 5% 9% 8% 5% 7% Lancôme Paris private Cosmetics Avon 14% 11% 0% 10% 9% -11% 12% 10% Avon Products AVP US Cosmetics Cream 21 0% 11% -2% 0% 7% -5% 0% 9% Henkel HEN3 GR Cosmetics Max Factor 0% 8% 8% 0% 7% 7% 0% 8% Procter & Gamble PG US Cosmetics Jergens 0% 8% 8% 0% 6% 6% 0% 7% Kao USA Inc. private Cosmetics Jrzinz 0% 10% -3% 0% 6% -10% 0% 8% JRZ INC private Cosmetics Clinique 4% 3% 1% 4% 4% 1% 4% 4% Clinique Lab(Esté) NYSE EL Cosmetics Ponds 5% 2% 1% 7% 4% -2% 6% 3% Unilever ULVR LN Cosmetics Neutrogena 0% 4% 4% 0% 3% 3% 0% 4% Johnson & Johns JNJ US Cosmetics Clarins 2% 3% 2% 5% 3% -1% 4% 3% Clarins Group private Cosmetics Luke 0% 1% 0% 0% 3% -1% 0% 2% Laurenluke private Cosmetics Covergirl 0% 1% 0% 1% 1% 0% 1% 1% Procter & Gamble PG US Cosmetics Maybelline 1% 0% -1% 3% 1% -4% 2% 1% L'Oréal OR FP Cosmetics Oriflame 0% 3% 3% 0% 1% 1% 0% 2% Oriflame Cosmeti ORI SS Cosmetics Biotherm 0% 0% 0% 0% 0% -1% 0% 0% Biotherm (L'Oréal) OR FP Cosmetics ENCHANTEUR 0% 0% 0% 0% 0% 0% 0% 0% Wipro Consumer private Cosmetics Estée Lauder 0% 1% 0% 2% 0% 0% 1% 1% Estée Lauder EL US Cosmetics Fiorella 0% 0% 0% 0% 0% 0% 0% 0% Fiorella Cosmetic private Cosmetics Glysolid 0% 5% 5% 0% 0% 0% 0% 3% CSA Worldwide CSA GR Cosmetics Mary Kay 0% 0% 0% 0% 0% 0% 0% 0% Mary Kay, Inc. 5698C US Cosmetics Yardley 0% 1% 1% 0% 0% 0% 0% 1% Yardley private Sportswear Adidas 39% 58% 28% 41% 79% 46% 40% 69% Adidas ADS GR Sportswear Nike 22% 23% 10% 25% 34% 20% 24% 29% Nike, Inc. NKE US Sportswear Puma 21% 27% 16% 28% 34% 23% 25% 31% Puma SE PUM GR Sportswear Reebok 0% 4% 1% 2% 20% 13% 1% 12% Reebok (Adidas) ADS GR Sportswear Champion 0% 1% -2% 0% 11% 4% 0% 6% HanesBrands Inc. HBI US Sportswear Kappa 5% 7% 5% 2% 8% 8% 4% 8% Kappa private Sportswear Fila 6% 8% 3% 5% 6% -3% 6% 7% Fila, Ltd. private Sportswear Diadora 2% 1% 0% 6% 6% -2% 4% 4% Diadora private Sportswear Asics 1% 2% 0% 0% 2% -5% 1% 2% ASICS 7936 JP Sportswear Converse 2% 1% 0% 0% 2% -2% 1% 2% Nike, Inc. NKE US Sportswear Fred Perry 2% 0% -1% 2% 2% 0% 2% 1% Fred Perry private Sportswear Le Coq Sportif 0% 0% 0% 2% 2% 2% 1% 1% Le Coq Sportif private Sportswear Timberland 3% 1% -1% 0% 2% 0% 2% 2% Timberland (VF) VFC US Sportswear K-Swiss 1% 0% 0% 0% 0% 0% 1% 0% K-Swiss(E-Land) private Sportswear Mizuno 0% 0% 0% 0% 0% 0% 0% 0% Mizuno 8022 JP Sportswear Speedo 0% 1% -1% 0% 0% 0% 0% 1% Speedo(Pentland) private Sportswear Umbro 0% 4% 3% 0% 0% 0% 0% 2% Umbro (Iconix) ICON US Handsets Samsung 16% 53% 52% 20% 37% 36% 18% 45% Samsung Electron 005930 KS Handsets Apple 13% 9% 9% 34% 34% 30% 24% 22% Apple AAPL US Handsets Blackberry 29% 14% 7% 25% 21% 8% 27% 18% BlackBerry BBRY US Handsets Nokia 33% 21% -61% 16% 7% -66% 25% 14% Nokia NOK1V FH Handsets Panasonic 0% 0% 0% 0% 1% 1% 0% 1% Panasonic 6752 JP Handsets Alcatel 0% 0% 0% 0% 0% 0% 0% 0% Alcatel-Lucent ALU FP Handsets HTC 0% 0% 0% 0% 0% -1% 0% 0% HTC Corporation 2498 TT Handsets Huawei 0% 0% 0% 0% 0% 0% 0% 0% Huawei Tech private Handsets LG 0% 0% 0% 2% 0% 0% 1% 0% LG Electronics 066570 KS Handsets Mitsubishi 0% 0% 0% 0% 0% 0% 0% 0% Mitsubishi Motor 7211 JP Handsets NEC 0% 0% 0% 0% 0% 0% 0% 0% NEC Corporation 6701 JP Handsets Sharp 0% 0% 0% 0% 0% 0% 0% 0% Sharp 6753 JP Handsets Sony Ericsson 1% 0% -2% 1% 0% -1% 1% 0% Sony Mobile Com 6758 JP Handsets ZTE 0% 0% 0% 0% 0% 0% 0% 0% ZTE Corporation 763 HK TV Sony 13% 21% 21% 16% 47% 47% 15% 34% Sony Corporation 6758 JP
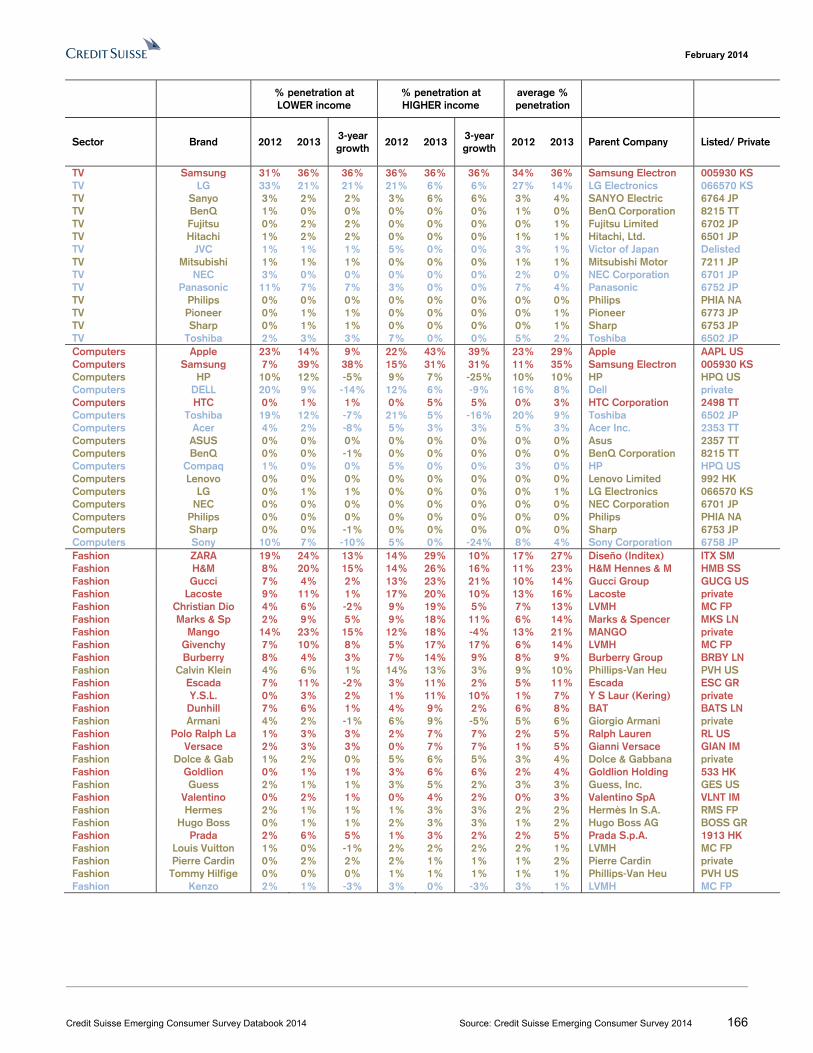
February 2014
Credit Suisse Emerging Consumer Survey Databook 2014 Source: Credit Suisse Emerging Consumer Survey 2014 166
% penetration at LOWER income
% penetration at HIGHER income
average % penetration
Sector Brand 2012 2013 3-year growth
2012 2013 3-year growth
2012 2013 Parent Company Listed/ Private
TV Samsung 31% 36% 36% 36% 36% 36% 34% 36% Samsung Electron 005930 KS TV LG 33% 21% 21% 21% 6% 6% 27% 14% LG Electronics 066570 KS TV Sanyo 3% 2% 2% 3% 6% 6% 3% 4% SANYO Electric 6764 JP TV BenQ 1% 0% 0% 0% 0% 0% 1% 0% BenQ Corporation 8215 TT TV Fujitsu 0% 2% 2% 0% 0% 0% 0% 1% Fujitsu Limited 6702 JP TV Hitachi 1% 2% 2% 0% 0% 0% 1% 1% Hitachi, Ltd. 6501 JP TV JVC 1% 1% 1% 5% 0% 0% 3% 1% Victor of Japan Delisted TV Mitsubishi 1% 1% 1% 0% 0% 0% 1% 1% Mitsubishi Motor 7211 JP TV NEC 3% 0% 0% 0% 0% 0% 2% 0% NEC Corporation 6701 JP TV Panasonic 11% 7% 7% 3% 0% 0% 7% 4% Panasonic 6752 JP TV Philips 0% 0% 0% 0% 0% 0% 0% 0% Philips PHIA NA TV Pioneer 0% 1% 1% 0% 0% 0% 0% 1% Pioneer 6773 JP TV Sharp 0% 1% 1% 0% 0% 0% 0% 1% Sharp 6753 JP TV Toshiba 2% 3% 3% 7% 0% 0% 5% 2% Toshiba 6502 JP Computers Apple 23% 14% 9% 22% 43% 39% 23% 29% Apple AAPL US Computers Samsung 7% 39% 38% 15% 31% 31% 11% 35% Samsung Electron 005930 KS Computers HP 10% 12% -5% 9% 7% -25% 10% 10% HP HPQ US Computers DELL 20% 9% -14% 12% 6% -9% 16% 8% Dell private Computers HTC 0% 1% 1% 0% 5% 5% 0% 3% HTC Corporation 2498 TT Computers Toshiba 19% 12% -7% 21% 5% -16% 20% 9% Toshiba 6502 JP Computers Acer 4% 2% -8% 5% 3% 3% 5% 3% Acer Inc. 2353 TT Computers ASUS 0% 0% 0% 0% 0% 0% 0% 0% Asus 2357 TT Computers BenQ 0% 0% -1% 0% 0% 0% 0% 0% BenQ Corporation 8215 TT Computers Compaq 1% 0% 0% 5% 0% 0% 3% 0% HP HPQ US Computers Lenovo 0% 0% 0% 0% 0% 0% 0% 0% Lenovo Limited 992 HK Computers LG 0% 1% 1% 0% 0% 0% 0% 1% LG Electronics 066570 KS Computers NEC 0% 0% 0% 0% 0% 0% 0% 0% NEC Corporation 6701 JP Computers Philips 0% 0% 0% 0% 0% 0% 0% 0% Philips PHIA NA Computers Sharp 0% 0% -1% 0% 0% 0% 0% 0% Sharp 6753 JP Computers Sony 10% 7% -10% 5% 0% -24% 8% 4% Sony Corporation 6758 JP Fashion ZARA 19% 24% 13% 14% 29% 10% 17% 27% Diseño (Inditex) ITX SM Fashion H&M 8% 20% 15% 14% 26% 16% 11% 23% H&M Hennes & M HMB SS Fashion Gucci 7% 4% 2% 13% 23% 21% 10% 14% Gucci Group GUCG US Fashion Lacoste 9% 11% 1% 17% 20% 10% 13% 16% Lacoste private Fashion Christian Dio 4% 6% -2% 9% 19% 5% 7% 13% LVMH MC FP Fashion Marks & Sp 2% 9% 5% 9% 18% 11% 6% 14% Marks & Spencer MKS LN Fashion Mango 14% 23% 15% 12% 18% -4% 13% 21% MANGO private Fashion Givenchy 7% 10% 8% 5% 17% 17% 6% 14% LVMH MC FP Fashion Burberry 8% 4% 3% 7% 14% 9% 8% 9% Burberry Group BRBY LN Fashion Calvin Klein 4% 6% 1% 14% 13% 3% 9% 10% Phillips-Van Heu PVH US Fashion Escada 7% 11% -2% 3% 11% 2% 5% 11% Escada ESC GR Fashion Y.S.L. 0% 3% 2% 1% 11% 10% 1% 7% Y S Laur (Kering) private Fashion Dunhill 7% 6% 1% 4% 9% 2% 6% 8% BAT BATS LN Fashion Armani 4% 2% -1% 6% 9% -5% 5% 6% Giorgio Armani private Fashion Polo Ralph La 1% 3% 3% 2% 7% 7% 2% 5% Ralph Lauren RL US Fashion Versace 2% 3% 3% 0% 7% 7% 1% 5% Gianni Versace GIAN IM Fashion Dolce & Gab 1% 2% 0% 5% 6% 5% 3% 4% Dolce & Gabbana private Fashion Goldlion 0% 1% 1% 3% 6% 6% 2% 4% Goldlion Holding 533 HK Fashion Guess 2% 1% 1% 3% 5% 2% 3% 3% Guess, Inc. GES US Fashion Valentino 0% 2% 1% 0% 4% 2% 0% 3% Valentino SpA VLNT IM Fashion Hermes 2% 1% 1% 1% 3% 3% 2% 2% Hermès In S.A. RMS FP Fashion Hugo Boss 0% 1% 1% 2% 3% 3% 1% 2% Hugo Boss AG BOSS GR Fashion Prada 2% 6% 5% 1% 3% 2% 2% 5% Prada S.p.A. 1913 HK Fashion Louis Vuitton 1% 0% -1% 2% 2% 2% 2% 1% LVMH MC FP Fashion Pierre Cardin 0% 2% 2% 2% 1% 1% 1% 2% Pierre Cardin private Fashion Tommy Hilfige 0% 0% 0% 1% 1% 1% 1% 1% Phillips-Van Heu PVH US Fashion Kenzo 2% 1% -3% 3% 0% -3% 3% 1% LVMH MC FP
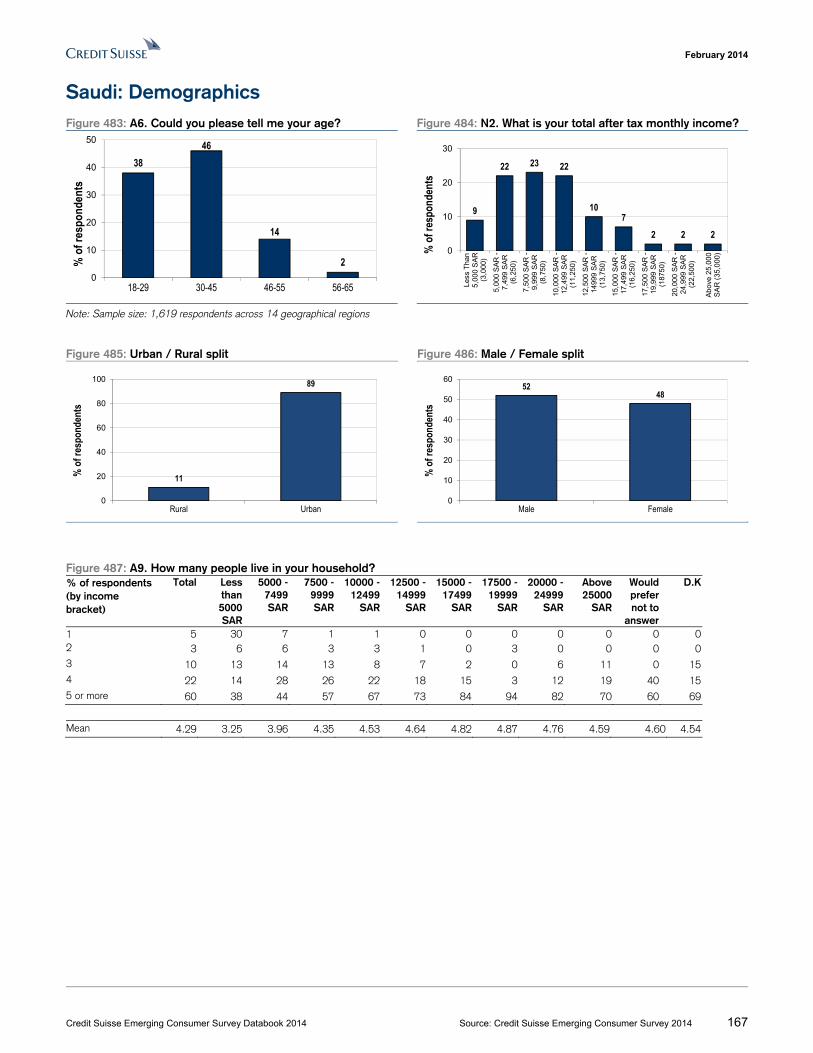
February 2014
Credit Suisse Emerging Consumer Survey Databook 2014 Source: Credit Suisse Emerging Consumer Survey 2014 167
Saudi: Demographics Figure 483: A6. Could you please tell me your age? Figure 484: N2. What is your total after tax monthly income?
Note: Sample size: 1,619 respondents across 14 geographical regions
Figure 485: Urban / Rural split Figure 486: Male / Female split
Figure 487: A9. How many people live in your household? % of respondents (by income bracket)
Total Less than 5000 SAR
5000 - 7499 SAR
7500 -9999 SAR
10000 -12499
SAR
12500 -14999
SAR
15000 -17499
SAR
17500 -19999
SAR
20000 -24999
SAR
Above 25000
SAR
Would prefer not to
answer
D.K
1 5 30 7 1 1 0 0 0 0 0 0 02 3 6 6 3 3 1 0 3 0 0 0 03 10 13 14 13 8 7 2 0 6 11 0 154 22 14 28 26 22 18 15 3 12 19 40 155 or more 60 38 44 57 67 73 84 94 82 70 60 69
Mean 4.29 3.25 3.96 4.35 4.53 4.64 4.82 4.87 4.76 4.59 4.60 4.54
3846
14
20
10
20
30
40
50
18-29 30-45 46-55 56-65
% o
f res
pond
ents
9
22 23 22
107
2 2 20
10
20
30
Less
Tha
n5,
000
SA
R(3
,000
)
5,00
0 S
AR
-7,
499
SA
R(6
,250
)
7,50
0 S
AR
-9,
999
SA
R(8
,750
)
10,0
00 S
AR
-12
,499
SA
R(1
1,25
0)
12,5
00 S
AR
-14
999
SA
R(1
3,75
0)
15,0
00 S
AR
-17
,499
SA
R(1
6,25
0)
17,5
00 S
AR
-19
,999
SA
R(1
875
0)
20,0
00 S
AR
-24
,999
SA
R(2
2,50
0)
Ab
ove
25,0
00S
AR
(35
,000
)% o
f res
pond
ents
11
89
0
20
40
60
80
100
Rural Urban
% o
f res
pond
ents
5248
0
10
20
30
40
50
60
Male Female
% o
f res
pond
ents
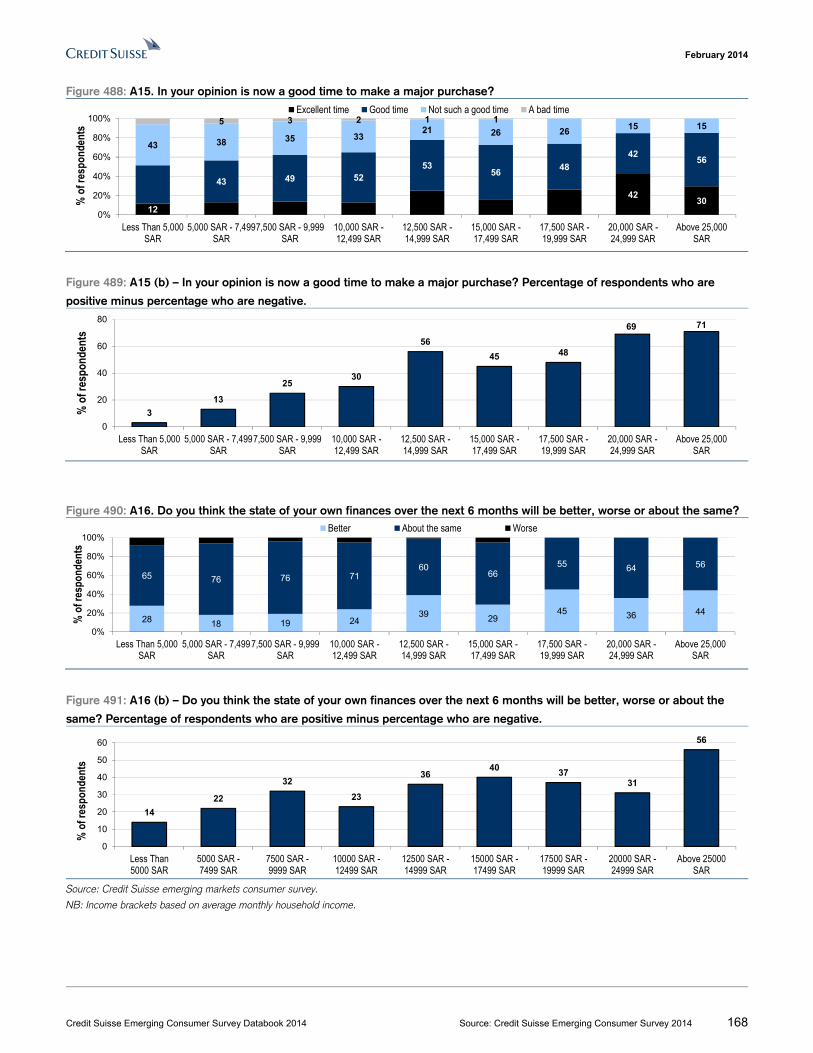
February 2014
Credit Suisse Emerging Consumer Survey Databook 2014 Source: Credit Suisse Emerging Consumer Survey 2014 168
Figure 488: A15. In your opinion is now a good time to make a major purchase?
Figure 489: A15 (b) – In your opinion is now a good time to make a major purchase? Percentage of respondents who are
positive minus percentage who are negative.
Figure 490: A16. Do you think the state of your own finances over the next 6 months will be better, worse or about the same?
Figure 491: A16 (b) – Do you think the state of your own finances over the next 6 months will be better, worse or about the
same? Percentage of respondents who are positive minus percentage who are negative.
Source: Credit Suisse emerging markets consumer survey.
NB: Income brackets based on average monthly household income.
12
4230
43 49 5253
5648
4256
43 38 35 3321 26 26
15 155 3 2 1 1
0%
20%
40%
60%
80%
100%
Less Than 5,000SAR
5,000 SAR - 7,499SAR
7,500 SAR - 9,999SAR
10,000 SAR -12,499 SAR
12,500 SAR -14,999 SAR
15,000 SAR -17,499 SAR
17,500 SAR -19,999 SAR
20,000 SAR -24,999 SAR
Above 25,000SAR
% o
f res
pond
ents
Excellent time Good time Not such a good time A bad time
3
13
2530
56
45 48
69 71
0
20
40
60
80
Less Than 5,000SAR
5,000 SAR - 7,499SAR
7,500 SAR - 9,999SAR
10,000 SAR -12,499 SAR
12,500 SAR -14,999 SAR
15,000 SAR -17,499 SAR
17,500 SAR -19,999 SAR
20,000 SAR -24,999 SAR
Above 25,000SAR
% o
f res
pond
ents
28 18 19 2439 29
45 36 44
65 76 76 7160
6655 64 56
0%
20%
40%
60%
80%
100%
Less Than 5,000SAR
5,000 SAR - 7,499SAR
7,500 SAR - 9,999SAR
10,000 SAR -12,499 SAR
12,500 SAR -14,999 SAR
15,000 SAR -17,499 SAR
17,500 SAR -19,999 SAR
20,000 SAR -24,999 SAR
Above 25,000SAR
% o
f res
pond
ents
Better About the same Worse
14
22
32
23
3640
3731
56
0
10
20
30
40
50
60
Less Than5000 SAR
5000 SAR -7499 SAR
7500 SAR -9999 SAR
10000 SAR -12499 SAR
12500 SAR -14999 SAR
15000 SAR -17499 SAR
17500 SAR -19999 SAR
20000 SAR -24999 SAR
Above 25000SAR
% o
f res
pond
ents
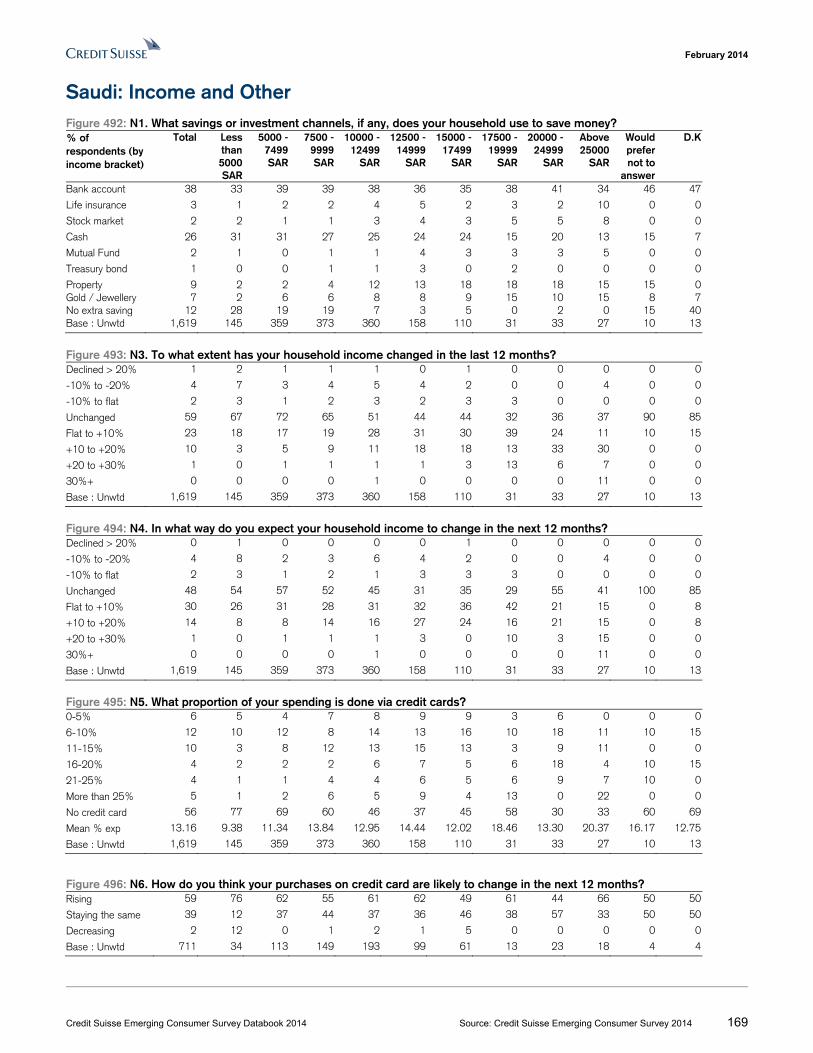
February 2014
Credit Suisse Emerging Consumer Survey Databook 2014 Source: Credit Suisse Emerging Consumer Survey 2014 169
Saudi: Income and Other Figure 492: N1. What savings or investment channels, if any, does your household use to save money? % of respondents (by income bracket)
Total Less than 5000 SAR
5000 - 7499 SAR
7500 -9999 SAR
10000 -12499
SAR
12500 -14999
SAR
15000 -17499
SAR
17500 -19999
SAR
20000 -24999
SAR
Above 25000
SAR
Would prefer not to
answer
D.K
Bank account 38 33 39 39 38 36 35 38 41 34 46 47
Life insurance 3 1 2 2 4 5 2 3 2 10 0 0
Stock market 2 2 1 1 3 4 3 5 5 8 0 0
Cash 26 31 31 27 25 24 24 15 20 13 15 7
Mutual Fund 2 1 0 1 1 4 3 3 3 5 0 0
Treasury bond 1 0 0 1 1 3 0 2 0 0 0 0
Property 9 2 2 4 12 13 18 18 18 15 15 0Gold / Jewellery 7 2 6 6 8 8 9 15 10 15 8 7No extra saving 12 28 19 19 7 3 5 0 2 0 15 40Base : Unwtd 1,619 145 359 373 360 158 110 31 33 27 10 13
Figure 493: N3. To what extent has your household income changed in the last 12 months? Declined > 20% 1 2 1 1 1 0 1 0 0 0 0 0
-10% to -20% 4 7 3 4 5 4 2 0 0 4 0 0
-10% to flat 2 3 1 2 3 2 3 3 0 0 0 0
Unchanged 59 67 72 65 51 44 44 32 36 37 90 85
Flat to +10% 23 18 17 19 28 31 30 39 24 11 10 15
+10 to +20% 10 3 5 9 11 18 18 13 33 30 0 0
+20 to +30% 1 0 1 1 1 1 3 13 6 7 0 0
30%+ 0 0 0 0 1 0 0 0 0 11 0 0
Base : Unwtd 1,619 145 359 373 360 158 110 31 33 27 10 13
Figure 494: N4. In what way do you expect your household income to change in the next 12 months? Declined > 20% 0 1 0 0 0 0 1 0 0 0 0 0
-10% to -20% 4 8 2 3 6 4 2 0 0 4 0 0
-10% to flat 2 3 1 2 1 3 3 3 0 0 0 0
Unchanged 48 54 57 52 45 31 35 29 55 41 100 85
Flat to +10% 30 26 31 28 31 32 36 42 21 15 0 8
+10 to +20% 14 8 8 14 16 27 24 16 21 15 0 8
+20 to +30% 1 0 1 1 1 3 0 10 3 15 0 0
30%+ 0 0 0 0 1 0 0 0 0 11 0 0
Base : Unwtd 1,619 145 359 373 360 158 110 31 33 27 10 13
Figure 495: N5. What proportion of your spending is done via credit cards? 0-5% 6 5 4 7 8 9 9 3 6 0 0 0
6-10% 12 10 12 8 14 13 16 10 18 11 10 15
11-15% 10 3 8 12 13 15 13 3 9 11 0 0
16-20% 4 2 2 2 6 7 5 6 18 4 10 15
21-25% 4 1 1 4 4 6 5 6 9 7 10 0
More than 25% 5 1 2 6 5 9 4 13 0 22 0 0
No credit card 56 77 69 60 46 37 45 58 30 33 60 69
Mean % exp 13.16 9.38 11.34 13.84 12.95 14.44 12.02 18.46 13.30 20.37 16.17 12.75
Base : Unwtd 1,619 145 359 373 360 158 110 31 33 27 10 13
Figure 496: N6. How do you think your purchases on credit card are likely to change in the next 12 months? Rising 59 76 62 55 61 62 49 61 44 66 50 50
Staying the same 39 12 37 44 37 36 46 38 57 33 50 50
Decreasing 2 12 0 1 2 1 5 0 0 0 0 0
Base : Unwtd 711 34 113 149 193 99 61 13 23 18 4 4
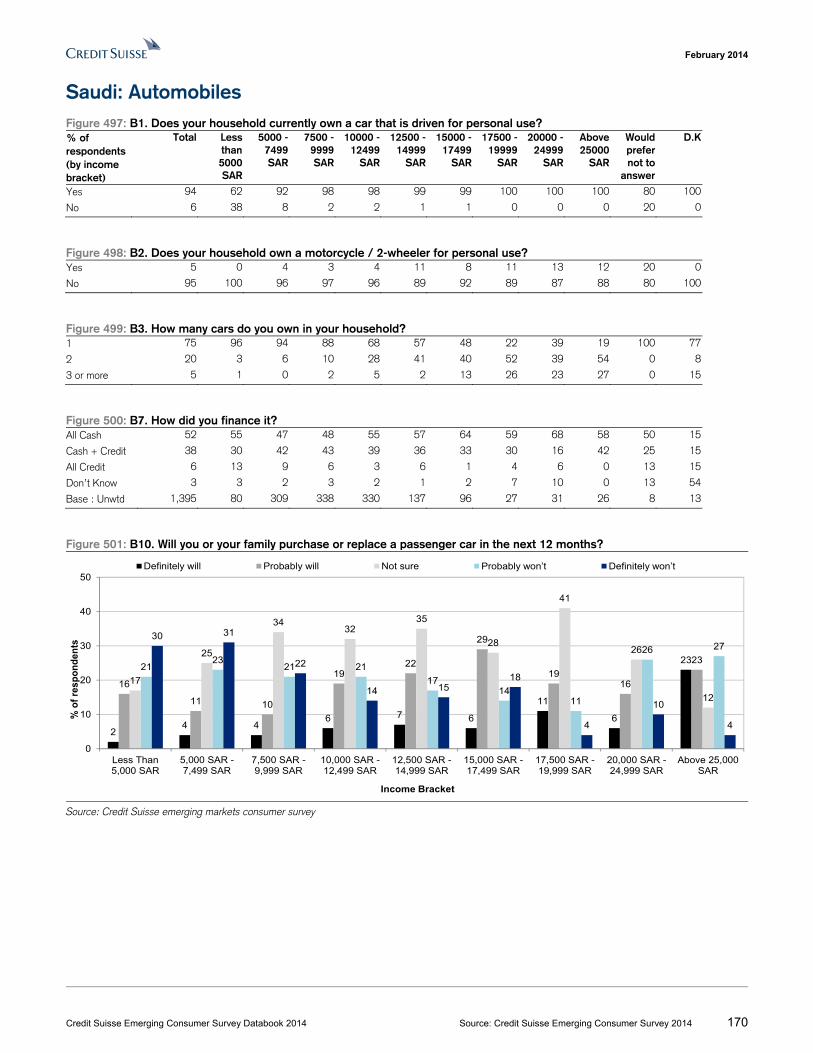
February 2014
Credit Suisse Emerging Consumer Survey Databook 2014 Source: Credit Suisse Emerging Consumer Survey 2014 170
Saudi: Automobiles Figure 497: B1. Does your household currently own a car that is driven for personal use? % of respondents (by income bracket)
Total Less than 5000 SAR
5000 - 7499 SAR
7500 -9999 SAR
10000 -12499
SAR
12500 -14999
SAR
15000 -17499
SAR
17500 -19999
SAR
20000 -24999
SAR
Above 25000
SAR
Would prefer not to
answer
D.K
Yes 94 62 92 98 98 99 99 100 100 100 80 100
No 6 38 8 2 2 1 1 0 0 0 20 0
Figure 498: B2. Does your household own a motorcycle / 2-wheeler for personal use? Yes 5 0 4 3 4 11 8 11 13 12 20 0
No 95 100 96 97 96 89 92 89 87 88 80 100
Figure 499: B3. How many cars do you own in your household? 1 75 96 94 88 68 57 48 22 39 19 100 77
2 20 3 6 10 28 41 40 52 39 54 0 8
3 or more 5 1 0 2 5 2 13 26 23 27 0 15
Figure 500: B7. How did you finance it? All Cash 52 55 47 48 55 57 64 59 68 58 50 15
Cash + Credit 38 30 42 43 39 36 33 30 16 42 25 15
All Credit 6 13 9 6 3 6 1 4 6 0 13 15
Don’t Know 3 3 2 3 2 1 2 7 10 0 13 54
Base : Unwtd 1,395 80 309 338 330 137 96 27 31 26 8 13
Figure 501: B10. Will you or your family purchase or replace a passenger car in the next 12 months?
Source: Credit Suisse emerging markets consumer survey
24 4
6 7 6
11
6
23
16
11 10
1922
29
1916
23
17
25
3432
35
28
41
26
12
2123
21 21
1714
11
26 2730 31
22
14 1518
4
10
4
0
10
20
30
40
50
Less Than5,000 SAR
5,000 SAR -7,499 SAR
7,500 SAR -9,999 SAR
10,000 SAR -12,499 SAR
12,500 SAR -14,999 SAR
15,000 SAR -17,499 SAR
17,500 SAR -19,999 SAR
20,000 SAR -24,999 SAR
Above 25,000SAR
% o
f re
spo
nd
ents
Income Bracket
Definitely will Probably will Not sure Probably won’t Definitely won’t
February 2014
Credit Suisse Emerging Consumer Survey Databook 2014 Source: Credit Suisse Emerging Consumer Survey 2014 171
Figure 502: B4. What brand is the car your household last purchased? % of respondents (by income bracket)
Total Less than 5000 SAR
5000 - 7499 SAR
7500 -9999 SAR
10000 -12499
SAR
12500 -14999
SAR
15000 -17499
SAR
17500 -19999
SAR
20000 -24999
SAR
Above 25000
SAR
Would prefer not to
answer
D.K
Toyota 34 36 38 33 38 30 32 7 19 4 38 38
Hyundai 13 15 14 17 8 11 7 15 23 12 0 8
Ford 9 9 6 8 10 16 16 19 10 4 13 0
Honda 9 9 13 8 10 9 8 0 10 4 0 0
Nissan 7 11 6 8 6 6 4 4 3 4 0 0
Kia 4 1 5 5 5 1 3 7 3 0 0 8
Other 7 6 7 7 7 5 3 4 6 8 38 8
Base : Unwtd 1,395 80 309 338 330 137 96 27 31 26 8 13
Figure 503: B16. How do you plan to finance the upcoming car purchase? All Cash 32 22 14 26 30 43 38 75 71 58 0 0
Cash + Credit 58 65 66 68 61 53 50 13 14 42 100 0
All Credit 8 13 16 4 7 3 9 13 0 0 0 0
Don’t Know 3 0 4 2 2 3 3 0 14 0 0 0
Base : Unwtd 307 23 50 47 84 40 34 8 7 12 2 0
Figure 504: B17. How much do you plan to spend on the car you or your household is planning to purchase ? Up to 40000 SAR 7 35 10 4 6 3 0 0 0 0 0 0
40001 - 50000 SAR 5 17 10 2 5 0 6 0 0 0 0 0
50001 - 60000 SAR 9 13 18 11 6 8 9 0 0 0 0 0
60001 - 70000 SAR 14 4 14 30 14 10 15 13 0 0 0 0
70001 - 80000 SAR 14 9 20 6 14 28 9 0 0 25 0 0
80001 - 90000 SAR 12 0 8 13 18 15 9 13 29 0 0 0
90001 - 100000 SAR 9 0 0 9 11 18 21 13 14 0 0 0
More than 100000 SAR
18 0 6 9 21 13 26 50 57 75 0 0
Base : Unwtd 307 23 50 47 84 40 34 8 7 12 2 0
Figure 505: B15. Which car brand are you most likely purchase? Local 5 0 7 6 5 4 3 0 10 5 0 0
Foreign 92 96 88 86 92 92 97 100 90 95 100 0
Toyota 30 35 44 43 32 17 13 13 30 5 33 0
Hyundai 9 19 10 12 9 4 10 13 0 0 0 0
Ford 9 12 3 6 13 8 8 25 10 5 0 0
Base : Unwtd 307 23 50 47 84 40 34 8 7 12 2 0
February 2014
Credit Suisse Emerging Consumer Survey Databook 2014 Source: Credit Suisse Emerging Consumer Survey 2014 172
Saudi: Food & Beverage Figure 506: C1. Have you purchased any of these products in the last 3 months? % of respondents (by income bracket)
Total Less than 5000 SAR
5000 - 7499 SAR
7500 -9999 SAR
10000 -12499
SAR
12500 -14999
SAR
15000 -17499
SAR
17500 -19999
SAR
20000 -24999
SAR
Above 25000
SAR
Would prefer not to
answer
D.K
Drinks: Yes 97 96 97 97 98 98 95 96 100 92 100 100
Drinks: No 3 4 3 3 2 2 5 4 0 8 0 0
Drinks: Base 1,524 129 339 357 341 143 105 28 33 26 10 13
Bottled Water: Yes 100 100 99 100 100 100 100 100 100 96 100 100
Bottled Water: No 0 0 1 0 0 0 0 0 0 4 0 0
Bottled Water:Base 1,524 129 339 357 341 143 105 28 33 26 10 13
Dairy: Yes 98 98 98 98 99 99 95 100 100 85 100 100
Dairy: No 2 2 2 2 1 1 5 0 0 15 0 0
Dairy: Base 1,524 129 339 357 341 143 105 28 33 26 10 13
Figure 507: C2. Which brands of the following have you purchased in the last 3 months? Drinks - Foreign 78 74 79 80 78 74 80 81 73 82 71 59
Pepsi Cola 21 22 21 22 20 18 20 20 24 19 20 17
7-Up 18 19 19 18 18 16 18 18 16 18 22 14
Drinks - Local 22 26 21 20 22 26 20 19 27 18 29 41
Almarai 6 7 6 6 6 7 6 6 6 8 12 14
Al Rabie 5 6 4 5 5 6 5 6 8 6 7 19
Drinks - Base 1,480 124 328 348 333 140 100 27 33 24 10 13
Water - Foreign 24 15 22 25 27 28 22 32 29 30 9 26
Nestle 11 8 11 12 11 11 10 20 13 15 6 16
Aquafina 9 6 10 10 10 9 9 10 14 10 3 9
Water - Local 76 85 78 75 73 72 78 64 71 70 91 72
Hana 12 16 12 11 11 10 11 13 8 10 21 7
Nova 11 10 10 12 11 10 12 10 11 20 21 12
Fayha 7 8 7 6 6 6 8 3 6 10 9 2
Water - Base 1,519 129 337 356 340 143 105 28 33 25 10 13
Dairy - Foreign 33 23 32 33 34 35 38 33 26 41 25 46
Dairy - Local 67 77 68 67 66 65 62 67 74 59 75 54
Almarai 13 14 12 14 12 12 10 19 14 8 13 9
Net 8 8 7 9 8 8 5 5 8 6 10 6
Pasture 7 8 8 7 7 6 6 6 6 8 10 6
Dairy - Base 1,495 127 333 351 337 141 100 28 33 22 10 13
Figure 508: C3. Do you expect to spend more on any of these products in the next 12 months? Drinks: Yes 54 70 49 54 53 57 59 64 64 54 30 15
Drinks: No 46 30 51 46 47 43 41 36 36 46 70 85
Drinks: Base 1,524 129 339 357 341 143 105 28 33 26 10 13
Water: Yes 55 71 48 54 55 57 64 64 55 54 30 15
Water: No 45 29 52 46 45 43 36 36 45 46 70 85
Water: Base 1,524 129 339 357 341 143 105 28 33 26 10 13
Dairy: Yes 61 73 54 61 65 63 69 68 58 38 30 15
Dairy: No 39 27 46 39 35 37 31 32 42 62 70 85
Dairy: Base 1,524 129 339 357 341 143 105 28 33 26 10 13
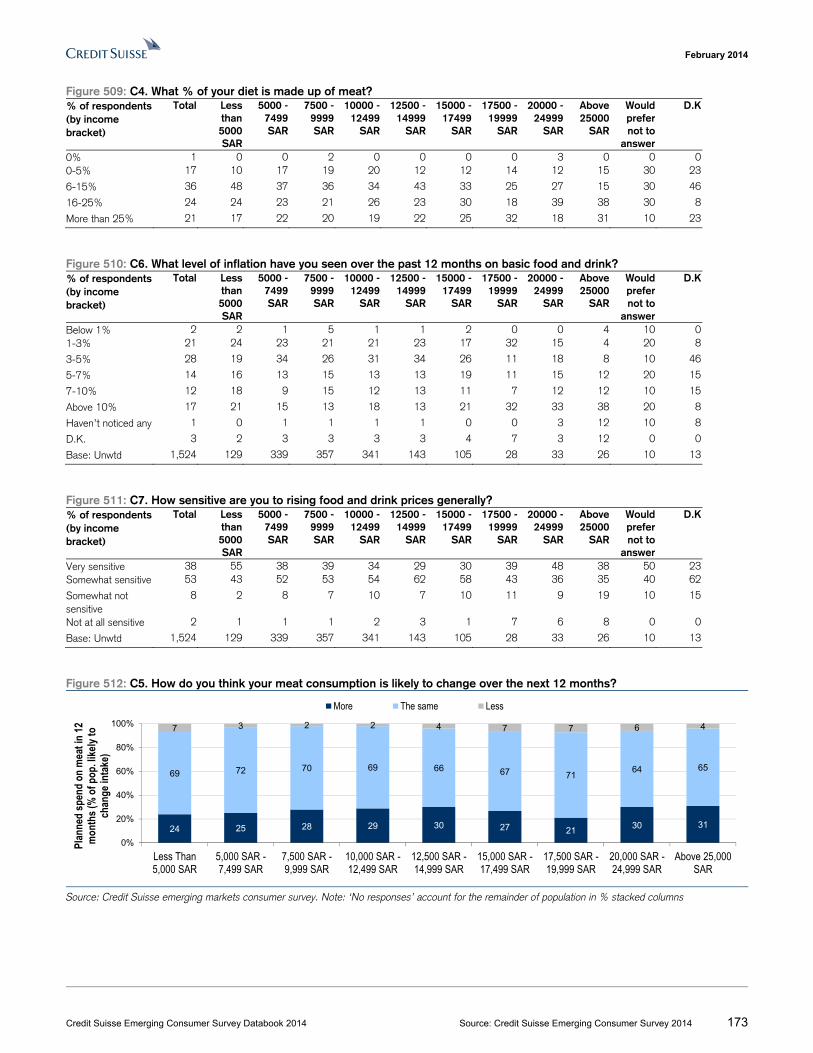
February 2014
Credit Suisse Emerging Consumer Survey Databook 2014 Source: Credit Suisse Emerging Consumer Survey 2014 173
Figure 509: C4. What % of your diet is made up of meat? % of respondents (by income bracket)
Total Less than 5000 SAR
5000 - 7499 SAR
7500 -9999 SAR
10000 -12499
SAR
12500 -14999
SAR
15000 -17499
SAR
17500 -19999
SAR
20000 -24999
SAR
Above 25000
SAR
Would prefer not to
answer
D.K
0% 1 0 0 2 0 0 0 0 3 0 0 00-5% 17 10 17 19 20 12 12 14 12 15 30 23
6-15% 36 48 37 36 34 43 33 25 27 15 30 46
16-25% 24 24 23 21 26 23 30 18 39 38 30 8
More than 25% 21 17 22 20 19 22 25 32 18 31 10 23
Figure 510: C6. What level of inflation have you seen over the past 12 months on basic food and drink? % of respondents (by income bracket)
Total Less than 5000 SAR
5000 - 7499 SAR
7500 -9999 SAR
10000 -12499
SAR
12500 -14999
SAR
15000 -17499
SAR
17500 -19999
SAR
20000 -24999
SAR
Above 25000
SAR
Would prefer not to
answer
D.K
Below 1% 2 2 1 5 1 1 2 0 0 4 10 01-3% 21 24 23 21 21 23 17 32 15 4 20 8
3-5% 28 19 34 26 31 34 26 11 18 8 10 46
5-7% 14 16 13 15 13 13 19 11 15 12 20 15
7-10% 12 18 9 15 12 13 11 7 12 12 10 15
Above 10% 17 21 15 13 18 13 21 32 33 38 20 8
Haven’t noticed any 1 0 1 1 1 1 0 0 3 12 10 8
D.K. 3 2 3 3 3 3 4 7 3 12 0 0
Base: Unwtd 1,524 129 339 357 341 143 105 28 33 26 10 13
Figure 511: C7. How sensitive are you to rising food and drink prices generally? % of respondents (by income bracket)
Total Less than 5000 SAR
5000 - 7499 SAR
7500 -9999 SAR
10000 -12499
SAR
12500 -14999
SAR
15000 -17499
SAR
17500 -19999
SAR
20000 -24999
SAR
Above 25000
SAR
Would prefer not to
answer
D.K
Very sensitive 38 55 38 39 34 29 30 39 48 38 50 23Somewhat sensitive 53 43 52 53 54 62 58 43 36 35 40 62
Somewhat not sensitive
8 2 8 7 10 7 10 11 9 19 10 15
Not at all sensitive 2 1 1 1 2 3 1 7 6 8 0 0
Base: Unwtd 1,524 129 339 357 341 143 105 28 33 26 10 13
Figure 512: C5. How do you think your meat consumption is likely to change over the next 12 months?
Source: Credit Suisse emerging markets consumer survey. Note: ‘No responses’ account for the remainder of population in % stacked columns
24 25 28 29 30 27 2130 31
69 72 70 69 66 67 7164 65
7 3 2 2 4 7 7 6 4
0%
20%
40%
60%
80%
100%
Less Than5,000 SAR
5,000 SAR -7,499 SAR
7,500 SAR -9,999 SAR
10,000 SAR -12,499 SAR
12,500 SAR -14,999 SAR
15,000 SAR -17,499 SAR
17,500 SAR -19,999 SAR
20,000 SAR -24,999 SAR
Above 25,000SAR
Plan
ned
spen
d on
mea
t in
12
mon
ths (
% o
f pop
. like
ly to
ch
ange
inta
ke)
More The same Less
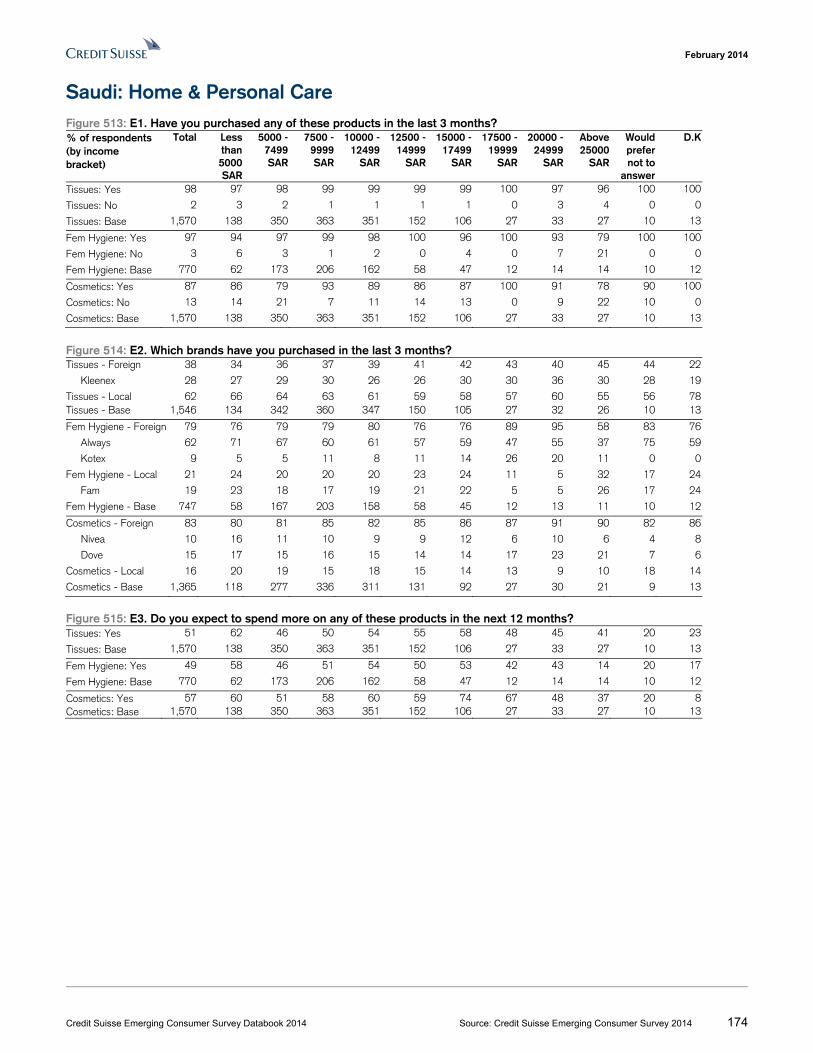
February 2014
Credit Suisse Emerging Consumer Survey Databook 2014 Source: Credit Suisse Emerging Consumer Survey 2014 174
Saudi: Home & Personal Care Figure 513: E1. Have you purchased any of these products in the last 3 months? % of respondents (by income bracket)
Total Less than 5000 SAR
5000 - 7499 SAR
7500 -9999 SAR
10000 -12499
SAR
12500 -14999
SAR
15000 -17499
SAR
17500 -19999
SAR
20000 -24999
SAR
Above 25000
SAR
Would prefer not to
answer
D.K
Tissues: Yes 98 97 98 99 99 99 99 100 97 96 100 100
Tissues: No 2 3 2 1 1 1 1 0 3 4 0 0
Tissues: Base 1,570 138 350 363 351 152 106 27 33 27 10 13
Fem Hygiene: Yes 97 94 97 99 98 100 96 100 93 79 100 100
Fem Hygiene: No 3 6 3 1 2 0 4 0 7 21 0 0
Fem Hygiene: Base 770 62 173 206 162 58 47 12 14 14 10 12
Cosmetics: Yes 87 86 79 93 89 86 87 100 91 78 90 100
Cosmetics: No 13 14 21 7 11 14 13 0 9 22 10 0
Cosmetics: Base 1,570 138 350 363 351 152 106 27 33 27 10 13
Figure 514: E2. Which brands have you purchased in the last 3 months? Tissues - Foreign 38 34 36 37 39 41 42 43 40 45 44 22
Kleenex 28 27 29 30 26 26 30 30 36 30 28 19
Tissues - Local 62 66 64 63 61 59 58 57 60 55 56 78Tissues - Base 1,546 134 342 360 347 150 105 27 32 26 10 13
Fem Hygiene - Foreign 79 76 79 79 80 76 76 89 95 58 83 76
Always 62 71 67 60 61 57 59 47 55 37 75 59
Kotex 9 5 5 11 8 11 14 26 20 11 0 0
Fem Hygiene - Local 21 24 20 20 20 23 24 11 5 32 17 24
Fam 19 23 18 17 19 21 22 5 5 26 17 24
Fem Hygiene - Base 747 58 167 203 158 58 45 12 13 11 10 12
Cosmetics - Foreign 83 80 81 85 82 85 86 87 91 90 82 86
Nivea 10 16 11 10 9 9 12 6 10 6 4 8
Dove 15 17 15 16 15 14 14 17 23 21 7 6
Cosmetics - Local 16 20 19 15 18 15 14 13 9 10 18 14
Cosmetics - Base 1,365 118 277 336 311 131 92 27 30 21 9 13
Figure 515: E3. Do you expect to spend more on any of these products in the next 12 months? Tissues: Yes 51 62 46 50 54 55 58 48 45 41 20 23
Tissues: Base 1,570 138 350 363 351 152 106 27 33 27 10 13
Fem Hygiene: Yes 49 58 46 51 54 50 53 42 43 14 20 17
Fem Hygiene: Base 770 62 173 206 162 58 47 12 14 14 10 12
Cosmetics: Yes 57 60 51 58 60 59 74 67 48 37 20 8Cosmetics: Base 1,570 138 350 363 351 152 106 27 33 27 10 13
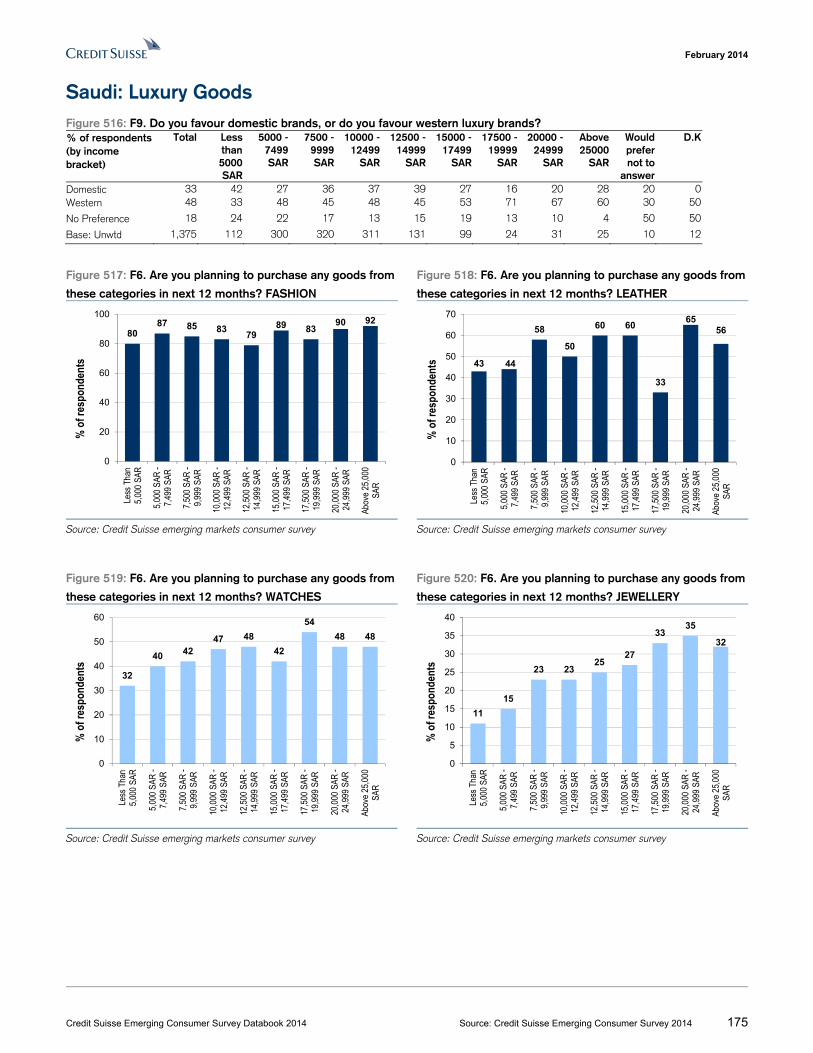
February 2014
Credit Suisse Emerging Consumer Survey Databook 2014 Source: Credit Suisse Emerging Consumer Survey 2014 175
Saudi: Luxury Goods Figure 516: F9. Do you favour domestic brands, or do you favour western luxury brands? % of respondents (by income bracket)
Total Less than 5000 SAR
5000 - 7499 SAR
7500 -9999 SAR
10000 -12499
SAR
12500 -14999
SAR
15000 -17499
SAR
17500 -19999
SAR
20000 -24999
SAR
Above 25000
SAR
Would prefer not to
answer
D.K
Domestic 33 42 27 36 37 39 27 16 20 28 20 0Western 48 33 48 45 48 45 53 71 67 60 30 50
No Preference 18 24 22 17 13 15 19 13 10 4 50 50
Base: Unwtd 1,375 112 300 320 311 131 99 24 31 25 10 12
Figure 517: F6. Are you planning to purchase any goods from
these categories in next 12 months? FASHION
Figure 518: F6. Are you planning to purchase any goods from
these categories in next 12 months? LEATHER
Source: Credit Suisse emerging markets consumer survey Source: Credit Suisse emerging markets consumer survey
Figure 519: F6. Are you planning to purchase any goods from
these categories in next 12 months? WATCHES
Figure 520: F6. Are you planning to purchase any goods from
these categories in next 12 months? JEWELLERY
Source: Credit Suisse emerging markets consumer survey Source: Credit Suisse emerging markets consumer survey
8087 85 83
7989 83
90 92
0
20
40
60
80
100
Less
Tha
n5,
000
SAR
5,00
0 SA
R -
7,49
9 SA
R
7,50
0 SA
R -
9,99
9 SA
R
10,0
00 S
AR -
12,4
99 S
AR
12,5
00 S
AR -
14,9
99 S
AR
15,0
00 S
AR -
17,4
99 S
AR
17,5
00 S
AR -
19,9
99 S
AR
20,0
00 S
AR -
24,9
99 S
AR
Abov
e 25
,000
SAR
% o
f res
pond
ents 43 44
58
50
60 60
33
6556
0
10
20
30
40
50
60
70
Less
Tha
n5,
000
SAR
5,00
0 SA
R -
7,49
9 SA
R
7,50
0 SA
R -
9,99
9 SA
R
10,0
00 S
AR -
12,4
99 S
AR
12,5
00 S
AR -
14,9
99 S
AR
15,0
00 S
AR -
17,4
99 S
AR
17,5
00 S
AR -
19,9
99 S
AR
20,0
00 S
AR -
24,9
99 S
AR
Abov
e 25
,000
SAR
% o
f res
pond
ents
32
40 4247 48
42
54
48 48
0
10
20
30
40
50
60
Less
Tha
n5,
000
SAR
5,00
0 SA
R -
7,49
9 SA
R
7,50
0 SA
R -
9,99
9 SA
R
10,0
00 S
AR -
12,4
99 S
AR
12,5
00 S
AR -
14,9
99 S
AR
15,0
00 S
AR -
17,4
99 S
AR
17,5
00 S
AR -
19,9
99 S
AR
20,0
00 S
AR -
24,9
99 S
AR
Abov
e 25
,000
SAR
% o
f res
pond
ents
11
15
23 2325
27
3335
32
0
5
10
15
20
25
30
35
40
Less
Tha
n5,
000
SAR
5,00
0 SA
R -
7,49
9 SA
R
7,50
0 SA
R -
9,99
9 SA
R
10,0
00 S
AR -
12,4
99 S
AR
12,5
00 S
AR -
14,9
99 S
AR
15,0
00 S
AR -
17,4
99 S
AR
17,5
00 S
AR -
19,9
99 S
AR
20,0
00 S
AR -
24,9
99 S
AR
Abov
e 25
,000
SAR
% o
f res
pond
ents
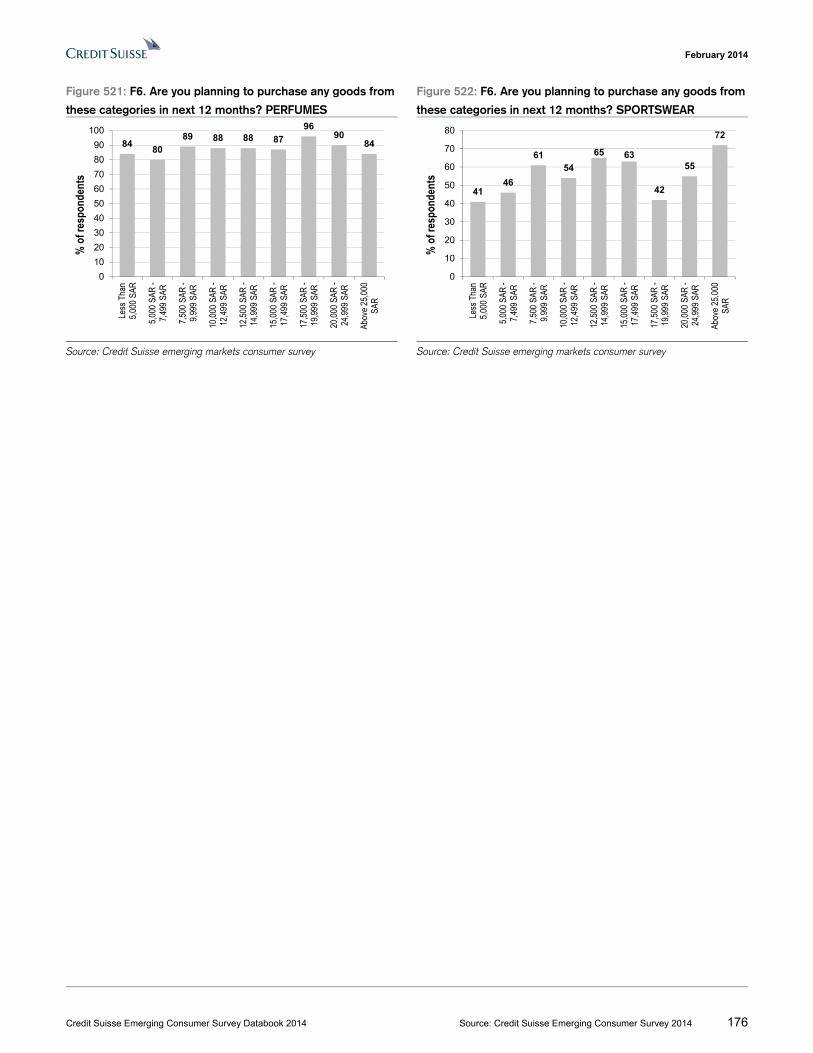
February 2014
Credit Suisse Emerging Consumer Survey Databook 2014 Source: Credit Suisse Emerging Consumer Survey 2014 176
Figure 521: F6. Are you planning to purchase any goods from
these categories in next 12 months? PERFUMES
Figure 522: F6. Are you planning to purchase any goods from
these categories in next 12 months? SPORTSWEAR
Source: Credit Suisse emerging markets consumer survey Source: Credit Suisse emerging markets consumer survey
8480
89 88 88 87
9690
84
0
10
20
30
40
50
60
70
80
90
100Le
ss T
han
5,00
0 SA
R
5,00
0 SA
R -
7,49
9 SA
R
7,50
0 SA
R -
9,99
9 SA
R
10,0
00 S
AR -
12,4
99 S
AR
12,5
00 S
AR -
14,9
99 S
AR
15,0
00 S
AR -
17,4
99 S
AR
17,5
00 S
AR -
19,9
99 S
AR
20,0
00 S
AR -
24,9
99 S
AR
Abov
e 25
,000
SAR
% o
f res
pond
ents
4146
6154
65 63
42
55
72
0
10
20
30
40
50
60
70
80
Less
Tha
n5,
000
SAR
5,00
0 SA
R -
7,49
9 SA
R
7,50
0 SA
R -
9,99
9 SA
R
10,0
00 S
AR -
12,4
99 S
AR
12,5
00 S
AR -
14,9
99 S
AR
15,0
00 S
AR -
17,4
99 S
AR
17,5
00 S
AR -
19,9
99 S
AR
20,0
00 S
AR -
24,9
99 S
AR
Abov
e 25
,000
SAR
% o
f res
pond
ents
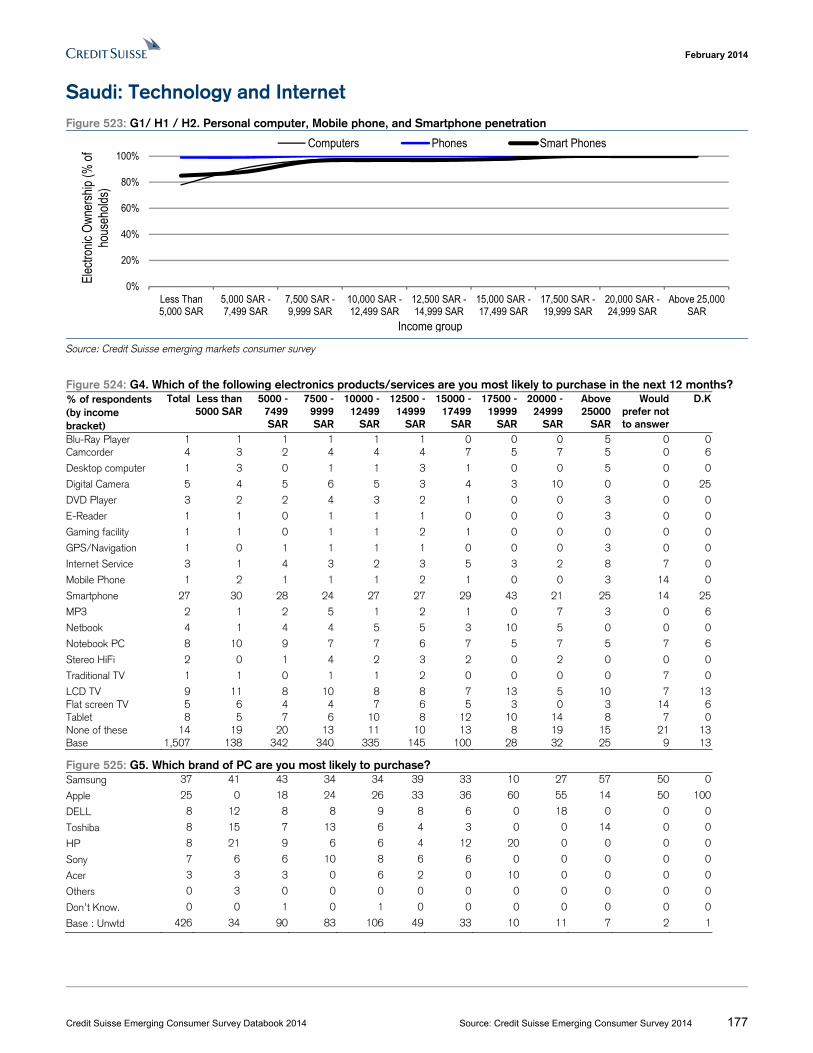
February 2014
Credit Suisse Emerging Consumer Survey Databook 2014 Source: Credit Suisse Emerging Consumer Survey 2014 177
Saudi: Technology and Internet Figure 523: G1/ H1 / H2. Personal computer, Mobile phone, and Smartphone penetration
Source: Credit Suisse emerging markets consumer survey
Figure 524: G4. Which of the following electronics products/services are you most likely to purchase in the next 12 months? % of respondents (by income bracket)
Total Less than 5000 SAR
5000 - 7499 SAR
7500 -9999 SAR
10000 -12499
SAR
12500 -14999
SAR
15000 -17499
SAR
17500 -19999
SAR
20000 -24999
SAR
Above 25000
SAR
Would prefer not to answer
D.K
Blu-Ray Player 1 1 1 1 1 1 0 0 0 5 0 0Camcorder 4 3 2 4 4 4 7 5 7 5 0 6
Desktop computer 1 3 0 1 1 3 1 0 0 5 0 0
Digital Camera 5 4 5 6 5 3 4 3 10 0 0 25
DVD Player 3 2 2 4 3 2 1 0 0 3 0 0
E-Reader 1 1 0 1 1 1 0 0 0 3 0 0
Gaming facility 1 1 0 1 1 2 1 0 0 0 0 0
GPS/Navigation 1 0 1 1 1 1 0 0 0 3 0 0
Internet Service 3 1 4 3 2 3 5 3 2 8 7 0
Mobile Phone 1 2 1 1 1 2 1 0 0 3 14 0
Smartphone 27 30 28 24 27 27 29 43 21 25 14 25
MP3 2 1 2 5 1 2 1 0 7 3 0 6
Netbook 4 1 4 4 5 5 3 10 5 0 0 0
Notebook PC 8 10 9 7 7 6 7 5 7 5 7 6
Stereo HiFi 2 0 1 4 2 3 2 0 2 0 0 0
Traditional TV 1 1 0 1 1 2 0 0 0 0 7 0
LCD TV 9 11 8 10 8 8 7 13 5 10 7 13Flat screen TV 5 6 4 4 7 6 5 3 0 3 14 6Tablet 8 5 7 6 10 8 12 10 14 8 7 0None of these 14 19 20 13 11 10 13 8 19 15 21 13Base 1,507 138 342 340 335 145 100 28 32 25 9 13
Figure 525: G5. Which brand of PC are you most likely to purchase? Samsung 37 41 43 34 34 39 33 10 27 57 50 0
Apple 25 0 18 24 26 33 36 60 55 14 50 100
DELL 8 12 8 8 9 8 6 0 18 0 0 0
Toshiba 8 15 7 13 6 4 3 0 0 14 0 0
HP 8 21 9 6 6 4 12 20 0 0 0 0
Sony 7 6 6 10 8 6 6 0 0 0 0 0
Acer 3 3 3 0 6 2 0 10 0 0 0 0
Others 0 3 0 0 0 0 0 0 0 0 0 0
Don’t Know. 0 0 1 0 1 0 0 0 0 0 0 0
Base : Unwtd 426 34 90 83 106 49 33 10 11 7 2 1
0%
20%
40%
60%
80%
100%
Less Than5,000 SAR
5,000 SAR -7,499 SAR
7,500 SAR -9,999 SAR
10,000 SAR -12,499 SAR
12,500 SAR -14,999 SAR
15,000 SAR -17,499 SAR
17,500 SAR -19,999 SAR
20,000 SAR -24,999 SAR
Above 25,000SAR
Elec
troni
c O
wner
ship
(% o
f ho
useh
olds
)
Computers Phones Smart Phones
Income group
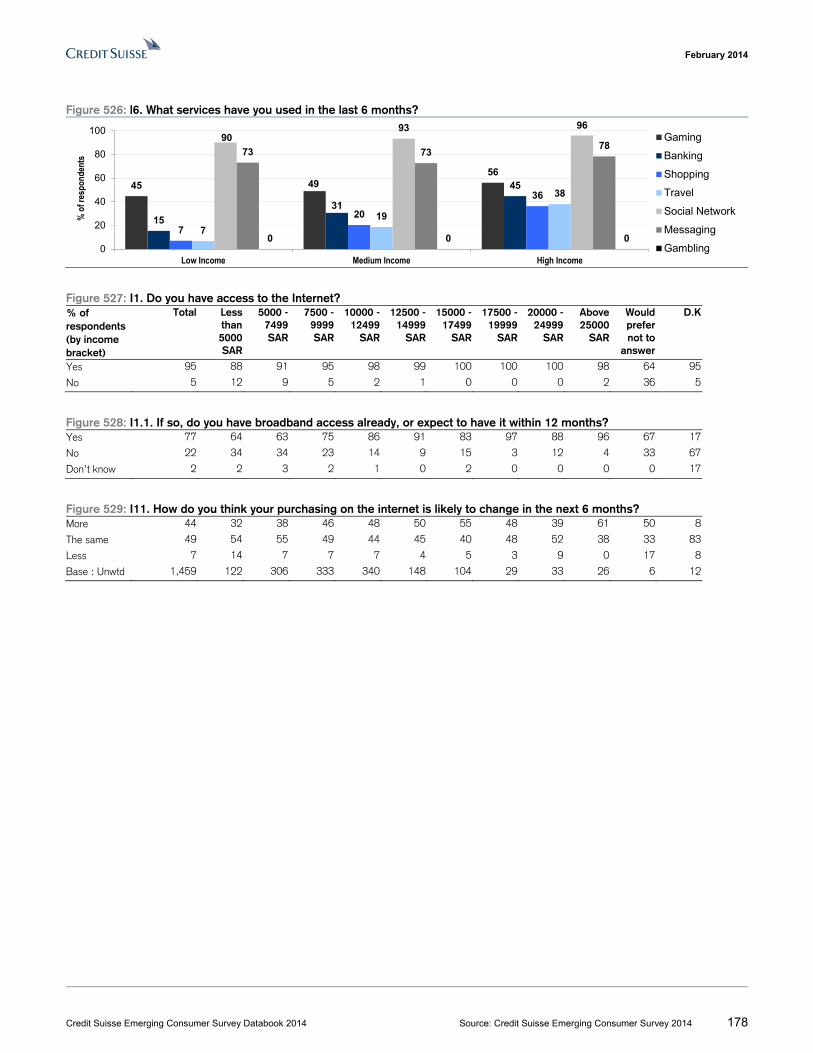
February 2014
Credit Suisse Emerging Consumer Survey Databook 2014 Source: Credit Suisse Emerging Consumer Survey 2014 178
Figure 526: l6. What services have you used in the last 6 months?
Figure 527: I1. Do you have access to the Internet? % of respondents (by income bracket)
Total Less than 5000 SAR
5000 - 7499 SAR
7500 -9999 SAR
10000 -12499
SAR
12500 -14999
SAR
15000 -17499
SAR
17500 -19999
SAR
20000 -24999
SAR
Above 25000
SAR
Would prefer not to
answer
D.K
Yes 95 88 91 95 98 99 100 100 100 98 64 95
No 5 12 9 5 2 1 0 0 0 2 36 5
Figure 528: I1.1. If so, do you have broadband access already, or expect to have it within 12 months? Yes 77 64 63 75 86 91 83 97 88 96 67 17
No 22 34 34 23 14 9 15 3 12 4 33 67
Don’t know 2 2 3 2 1 0 2 0 0 0 0 17
Figure 529: I11. How do you think your purchasing on the internet is likely to change in the next 6 months? More 44 32 38 46 48 50 55 48 39 61 50 8
The same 49 54 55 49 44 45 40 48 52 38 33 83
Less 7 14 7 7 7 4 5 3 9 0 17 8
Base : Unwtd 1,459 122 306 333 340 148 104 29 33 26 6 12
45 4956
15
31
45
7
20
36
7
19
38
9093 96
73 7378
0 0 00
20
40
60
80
100
Low Income Medium Income High Income
% o
f res
pond
ents
Gaming
Banking
Shopping
Travel
Social Network
Messaging
Gambling
February 2014
Credit Suisse Emerging Consumer Survey Databook 2014 Source: Credit Suisse Emerging Consumer Survey 2014 179
Saudi: Telecommunications Figure 530: H1. Do you currently own and use a handset for personal use? % of respondents (by income bracket)
Total Less than 5000 SAR
5000 - 7499 SAR
7500 -9999 SAR
10000 -12499
SAR
12500 -14999
SAR
15000 -17499
SAR
17500 -19999
SAR
20000 -24999
SAR
Above 25000
SAR
Would prefer not to
answer
D.K
Yes, I pay for it 81 85 81 75 85 87 78 72 90 83 89 31
Yes, employer pays 1 1 0 2 3 2 2 4 0 0 0 0
Yes, somebody else pays
17 13 18 23 12 11 20 24 10 17 0 69
No, I do not 0 1 1 0 0 0 0 0 0 0 11 0
Base : Unwtd 1,509 137 343 348 335 144 102 25 30 23 9 13
Figure 531: H3. What brand is your current mobile handset? Samsung 51 54 47 58 52 49 40 24 40 48 50 38
Apple 17 3 12 12 20 26 33 48 40 13 13 15
Blackberry 16 9 16 18 17 13 19 24 17 22 25 38
Base : Unwtd 1,504 136 341 347 335 144 102 25 30 23 8 13
Figure 532: H11. Do you plan to upgrade to a Smartphone in the next 12 months? Yes 64 93 58 69 50 40 0 0 0 0 100 0
No 36 7 42 31 50 60 100 0 0 0 0 0Base : Unwtd 77 15 33 13 8 5 2 0 0 0 1 0 Figure 533: H12. Which brand of Smartphone handset will you buy? Samsung 57 69 64 60 55 45 40 50 56 41 57 22
Apple 26 15 22 22 29 38 40 39 30 27 14 33
Blackberry 8 4 7 9 8 7 7 6 4 18 0 33
Nokia 3 3 4 4 3 3 1 0 0 9 0 0
Others 1 4 1 1 2 0 2 0 0 0 0 0
Base : Unwtd 1,329 113 289 307 307 136 94 18 27 22 7 9
Figure 534: H13. Is your next handset likely to be a 3G handset? Yes 78 76 76 72 82 86 81 89 93 86 86 67
No 11 9 11 17 8 7 12 11 7 14 14 22
Don’t Know 10 15 13 11 10 7 7 0 0 0 0 11
Base : Unwtd 1,329 113 289 307 307 136 94 18 27 22 7 9
Figure 535: : H8. How much do you spend, on average, on mobile telephone bills per month?
Source: Credit Suisse emerging markets consumer survey
6 1 0 1 0 1 0 3
2216 12 10
3 6 12 130
2523 21
19 16 4 3
0
20
4
23
9
29
20
28
17
9
510
12 14 10
25
20
13
9
4 512 10 12 14
32 27
74
0%
20%
40%
60%
80%
100%
Less Than 5,000SAR
5,000 SAR -7,499 SAR
7,500 SAR -9,999 SAR
10,000 SAR -12,499 SAR
12,500 SAR -14,999 SAR
15,000 SAR -17,499 SAR
17,500 SAR -19,999 SAR
20,000 SAR -24,999 SAR
Above 25,000SAR
% o
f res
pond
ents
Less than SAR 50 (50) SR 50 - 100 (75) SR 101 – 150 (125) SR 151 – 200 (175) SR 201 -250 (225) SR 251 – 300 (275) SR 301 + (300)
February 2014
Credit Suisse Emerging Consumer Survey Databook 2014 Source: Credit Suisse Emerging Consumer Survey 2014 180
Saudi: Travel Figure 536: J1/J6. Have you been / Are you planning to go on holiday in the last / next 12 months?
Source: Credit Suisse emerging markets consumer survey
Figure 537: J2. Where did you go on your last holiday? % of respondents (by income bracket)
Total Less than 5000 SAR
5000 - 7499 SAR
7500 -9999 SAR
10000 -12499
SAR
12500 -14999
SAR
15000 -17499
SAR
17500 -19999
SAR
20000 -24999
SAR
Above 25000
SAR
Would prefer not to
answer
D.K
At home 21 19 29 18 15 20 20 14 20 26 0 67Elsewhere in the country
54 29 36 60 65 68 64 41 32 39 33 25
International destination
26 52 35 22 19 12 15 45 48 35 67 8
Base : Unwtd 1,084 75 221 243 252 124 84 22 25 23 3 12
Figure 538: J4. What was the main form of transport that you used to reach your holiday destination? Car 58 28 46 59 69 73 73 32 20 35 67 75
Bus 3 7 5 3 3 2 0 0 0 0 0 0
Train 0 0 0 0 0 0 0 0 0 0 0 0
Ship 0 0 1 0 0 0 0 0 0 0 0 0
Aeroplane 39 66 48 38 28 25 27 68 80 65 33 25
Base : Unwtd 861 61 158 199 214 99 67 19 20 17 3 4
Figure 539: J7. Where are you planning to go for your next holiday? At home 17 18 23 15 12 16 13 0 13 21 0 75
Elsewhere in the country
55 21 43 62 66 70 64 59 50 46 50 17
International destination
28 61 34 23 22 14 23 41 38 33 50 8
Base : Unwtd 1,142 94 248 254 255 121 84 22 24 24 4 12
5263 69 73
86 8176 78
85
65 71 72 7483 81
76 7589
0
15
30
45
60
75
90
105
Less Than5,000 SAR
5,000 SAR -7,499 SAR
7,500 SAR -9,999 SAR
10,000 SAR -12,499 SAR
12,500 SAR -14,999 SAR
15,000 SAR -17,499 SAR
17,500 SAR -19,999 SAR
20,000 SAR -24,999 SAR
Above 25,000SAR
% o
f hou
seho
lds h
olid
ayin
g
Income Bracket
Taken holiday in the last 12 months Planning to take holiday in the next 12 months
February 2014
Credit Suisse Emerging Consumer Survey Databook 2014 Source: Credit Suisse Emerging Consumer Survey 2014 181
Saudi: Property Figure 540: K1. Do you or your family live in your own property? % of respondents (by income bracket)
Total Less than 5000 SAR
5000 - 7499 SAR
7500 -9999 SAR
10000 -12499
SAR
12500 -14999
SAR
15000 -17499
SAR
17500 -19999
SAR
20000 -24999
SAR
Above 25000
SAR
Would prefer not to
answer
D.K
Yes 47 6 23 39 66 74 82 86 85 96 56 23
No 53 94 77 61 34 26 18 14 15 4 44 77
Base : Unwtd 1,379 125 325 321 293 129 93 22 26 23 9 13
Figure 541: K2. If you do not own your own property, on what terms do you occupy the property? Rented 96 93 96 96 98 97 94 100 100 100 100 90
Allocated 4 5 4 4 2 3 6 0 0 0 0 10
Base : Unwtd 734 117 249 196 99 34 17 3 4 1 4 10
Figure 542: K6. If you are planning to purchase a property in the next 2 years, what is the main motivation for doing so? Upgrade 37 10 19 38 36 50 46 33 0 70 50 0
First-time home 29 80 38 35 33 22 8 17 17 0 0 0
Investment 18 10 19 8 19 22 23 17 67 20 0 0
Change of location 8 0 8 10 9 3 12 17 0 0 0 0
Base : Unwtd 234 10 26 48 64 36 26 6 6 10 2 0
Figure 543: K9. How, if at all, do you expect local property prices to change in the next 12 months? Increase 76 70 78 72 77 78 76 86 77 87 67 84
About the same 19 21 17 24 18 17 14 9 23 13 22 8
Decrease 3 3 3 3 5 4 9 0 0 0 0 0
Base : Unwtd 1,379 125 325 321 293 129 93 22 26 23 9 13
Figure 544: K10. How much of your total wealth is made up of property? Below 25% 34 36 39 36 32 23 37 27 19 22 22 23
25% - 50% 35 25 29 31 40 50 37 32 54 35 11 31
51% - 75% 9 4 5 10 14 11 10 9 15 13 11 8
76% - 95% 1 0 1 2 1 1 1 9 4 9 0 0
Above 95% 1 1 1 2 1 0 0 0 0 13 0 0
Don't know 20 34 24 20 13 16 16 23 8 9 56 38
Base : Unwtd 1,379 125 325 321 293 129 93 22 26 23 9 13
Figure 545: K5. Do you or your household intend to purchase a property in the next 2 years?
Source: Credit Suisse emerging markets consumer survey
8 8 15 22 28 28 27 2343
92 92 85 78 72 72 73 7757
0%
20%
40%
60%
80%
100%
Less Than 5,000SAR
5,000 SAR -7,499 SAR
7,500 SAR -9,999 SAR
10,000 SAR -12,499 SAR
12,500 SAR -14,999 SAR
15,000 SAR -17,499 SAR
17,500 SAR -19,999 SAR
20,000 SAR -24,999 SAR
Above 25,000SAR
% o
f re
sp
on
de
nts
No
Yes
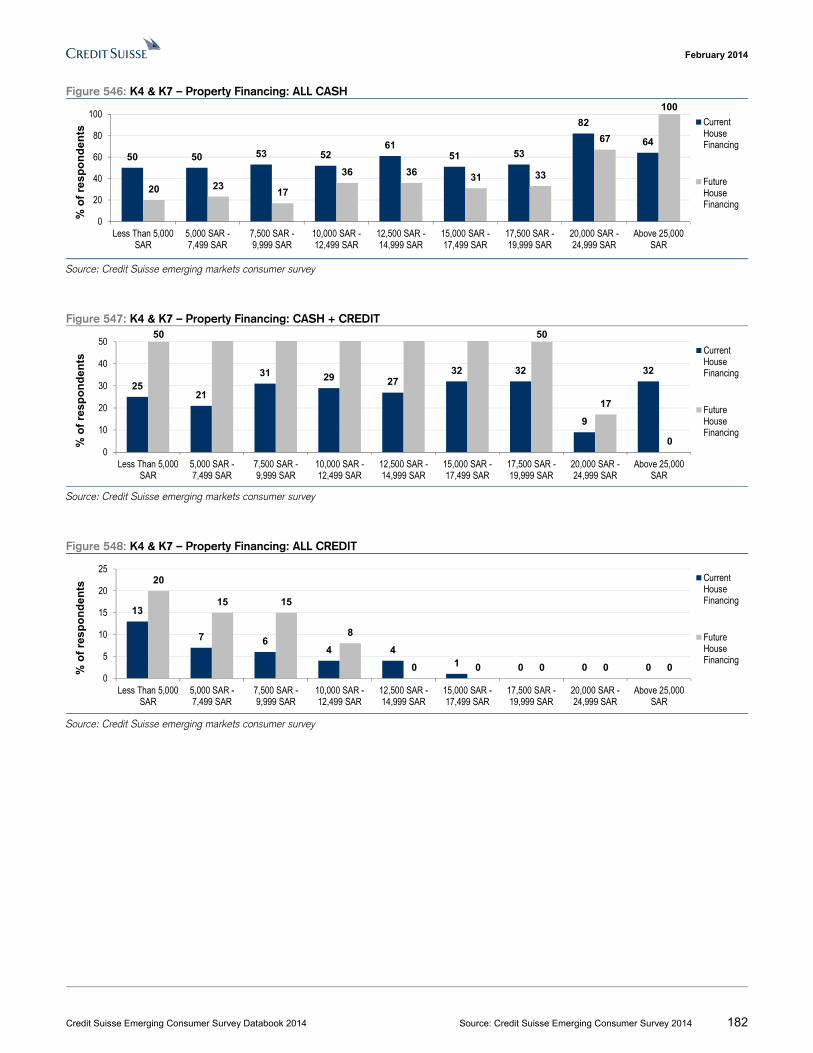
February 2014
Credit Suisse Emerging Consumer Survey Databook 2014 Source: Credit Suisse Emerging Consumer Survey 2014 182
Figure 546: K4 & K7 – Property Financing: ALL CASH
Source: Credit Suisse emerging markets consumer survey
Figure 547: K4 & K7 – Property Financing: CASH + CREDIT
Source: Credit Suisse emerging markets consumer survey
Figure 548: K4 & K7 – Property Financing: ALL CREDIT
Source: Credit Suisse emerging markets consumer survey
50 50 53 5261
51 53
82
64
20 2317
36 36 31 33
67
100
0
20
40
60
80
100
Less Than 5,000SAR
5,000 SAR -7,499 SAR
7,500 SAR -9,999 SAR
10,000 SAR -12,499 SAR
12,500 SAR -14,999 SAR
15,000 SAR -17,499 SAR
17,500 SAR -19,999 SAR
20,000 SAR -24,999 SAR
Above 25,000SAR
% o
f re
spo
nd
ents
CurrentHouseFinancing
FutureHouseFinancing
2521
31 29 2732 32
9
32
50 50
17
00
10
20
30
40
50
Less Than 5,000SAR
5,000 SAR -7,499 SAR
7,500 SAR -9,999 SAR
10,000 SAR -12,499 SAR
12,500 SAR -14,999 SAR
15,000 SAR -17,499 SAR
17,500 SAR -19,999 SAR
20,000 SAR -24,999 SAR
Above 25,000SAR
% o
f re
sp
on
de
nts
CurrentHouseFinancing
FutureHouseFinancing
13
7 64 4
1 0 0 0
20
15 15
8
0 0 0 0 00
5
10
15
20
25
Less Than 5,000SAR
5,000 SAR -7,499 SAR
7,500 SAR -9,999 SAR
10,000 SAR -12,499 SAR
12,500 SAR -14,999 SAR
15,000 SAR -17,499 SAR
17,500 SAR -19,999 SAR
20,000 SAR -24,999 SAR
Above 25,000SAR
% o
f re
sp
on
den
ts
CurrentHouseFinancing
FutureHouseFinancing
February 2014
Credit Suisse Emerging Consumer Survey Databook 2014 Source: Credit Suisse Emerging Consumer Survey 2014 183
Saudi: Education Figure 549: L3. Do you yourself currently participate in any adult continuing education? Yes 7 1 3 4 11 18 11 8 10 24 0 0
No 93 99 97 96 89 82 89 92 90 76 100 100
Base : Unwtd 1,464 135 336 345 329 126 91 25 29 25 10 13
Figure 550: L6. Do you intend to spend more, or less, on education or training courses in the next 12 months? More 5 5 2 3 5 10 8 12 24 32 10 8
About the same 77 73 78 79 79 81 77 80 69 64 60 31
Less 17 21 20 18 16 9 15 8 7 4 30 62
Base : Unwtd 1,464 135 336 345 329 126 91 25 29 25 10 13
Figure 551: L6. Do you intend to spend more, or less, on education or training courses in the next 12 months?
Source: Credit Suisse emerging markets consumer survey
52 3
5
108
12
24
32
21 2018
16
9
15
8 74
0
10
20
30
40
Less Than5,000 SAR
5,000 SAR -7,499 SAR
7,500 SAR -9,999 SAR
10,000 SAR -12,499 SAR
12,500 SAR -14,999 SAR
15,000 SAR -17,499 SAR
17,500 SAR -19,999 SAR
20,000 SAR -24,999 SAR
Above 25,000SAR
Sp
en
din
g o
n e
du
cat
ion
& t
rain
ing
in
th
e n
ext
12
mo
nth
s (%
of
ho
us
eho
lds)
Income bracket
More Less
February 2014
Credit Suisse Emerging Consumer Survey Databook 2014 Source: Credit Suisse Emerging Consumer Survey 2014 184
Saudi: Healthcare Figure 552: M1. Does your household have access to free or partially-free health care from the State? % of respondents (by income bracket)
Total Less than 5000 SAR
5000 - 7499 SAR
7500 -9999 SAR
10000 -12499
SAR
12500 -14999
SAR
15000 -17499
SAR
17500 -19999
SAR
20000 -24999
SAR
Above 25000
SAR
Would prefer not to
answer
D.K
Yes 63 34 46 63 75 81 81 79 81 87 40 54No 37 66 54 37 25 19 19 21 19 13 60 46
Base : Unwtd 1,449 132 324 340 319 140 88 28 32 23 10 13
Figure 553: M2. What services, if any, could you get free from the state? Hospital 98 98 98 99 97 99 99 100 100 100 100 94
Emergency Room 69 60 66 69 67 60 77 76 68 83 56 86
Prescriptions 77 69 77 75 74 69 82 76 87 78 78 86
Vaccinations 80 74 76 79 81 81 81 94 74 78 72 89
Diagnostic tests 78 60 75 81 74 72 85 97 94 78 72 78
Base : Unwtd 882 42 177 170 113 94 98 33 31 23 18 83
Figure 554: M8. Is anyone in your household a regular purchaser of medicines (more than one item per month)? Yes 21 22 16 18 18 34 27 25 31 39 20 23No 79 78 84 82 82 66 73 75 69 61 80 77
Base : Unwtd 1,449 132 324 340 319 140 88 28 32 23 10 13
Figure 555: M12. Thinking now about everyone in your household, would you expect to be spending more or less on
medicines over the next 12 months? More 8 10 6 6 7 11 11 7 25 26 10 0Same 79 77 77 77 81 84 84 82 69 74 70 46
Less 13 13 16 17 13 5 5 11 6 0 20 54
Base : Unwtd 1,449 132 324 340 319 140 88 28 32 23 10 13
Figure 556: M13. How much extra would you be willing to pay for an international medicine brand, rather than a locally produced product? Won’t pay extra 33 48 36 36 29 16 35 21 22 9 50 38
1-10% extra 48 42 49 46 52 59 43 39 44 35 40 38
11-20% extra 15 8 13 16 15 21 19 18 25 26 10 15
21-30% extra 3 1 2 2 4 4 1 11 6 4 0 0
more than 30% extra 1 1 0 0 0 0 1 11 3 26 0 8
Base : Unwtd 1,449 132 324 340 319 140 88 28 32 23 10 13
Figure 557: M14. Do you trust local brands as much as international brands on efficacy and safety? Only efficacy 22 12 17 23 27 26 19 18 28 9 50 31
Only safety 21 18 21 18 21 19 28 32 31 35 20 23
Both 51 62 52 53 48 52 47 36 34 39 20 38
Neither 5 6 8 4 5 1 6 14 3 4 0 0
Base : Unwtd 1,449 132 324 340 319 140 88 28 32 23 10 13
February 2014
Credit Suisse Emerging Consumer Survey Databook 2014 Source: Credit Suisse Emerging Consumer Survey 2014 185
South Africa Contrasting fortunes
This is the second year in which South Africa is featured in our survey. Consumer optimism levels in South Africa have gone up relative to last year, but with high income earners entirely driving this momentum.
Consumers, on a net weighted-average calculation, expect their financial prospects to improve by 28% over the next six months, compared to 26% in the previous survey. Similarly, high earners expect a 35% improvement. Low income earners, however, continue to expect their financial prospects to deteriorate, but by an even greater amount than in the previous survey – those earning around ZAR 1,500/month expect a sizeable 31% drop in the state of their upcoming personal finances. This is likely a reflection of an economy that, despite creating jobs, has not done so at a pace sufficient to absorb all new job entrants at the low end.With inflation expected to average 5.7% in 2014, all consumers except the very poor, should benefit from an increase in real income growth. Tellingly, South African consumers registered the highest expectation of forward inflation in our survey (a net balance of 74% of respondents expecting it to be higher than last year).
With regards to spending, activity has been supported in most categories over the last year. A large percentage of the expected increase in income looks likely to be spent on essentials such as housing (with net +4% expecting to increase spending over the next year), utilities and food, which together account for approximately 40% of monthly spending. Expenditure in these areas has been driven higher by large increases in administered prices (electricity, fuel, municipal taxes, etc.) in recent years. Other essential spending, notably on dairy and carbonated drinks, looks better than the survey average.
Discretionary spending, again driven in most part by the upper end of income earners, was robust. Consumption of smartphones, holidays and autos was strong over the last 12 months – with around net +5% of respondents increasing spend in each area – and looks resilient going forward. Internet penetration, an aspect we pointed to last year as being necessary to support wider growth in the discretionary space, has shown the highest level of growth of all categories (+17% increasing spend).
Lastly, South Africans continue to save less than their peers, although there has been some improvement over the past year. Savings continued to be held in transaction-type facilities, but the profile has changed somewhat. Deposits at banks accounted for 60% of total savings vs. 90% a year ago. Cash holdings account for 20% vs. 10% a year ago.
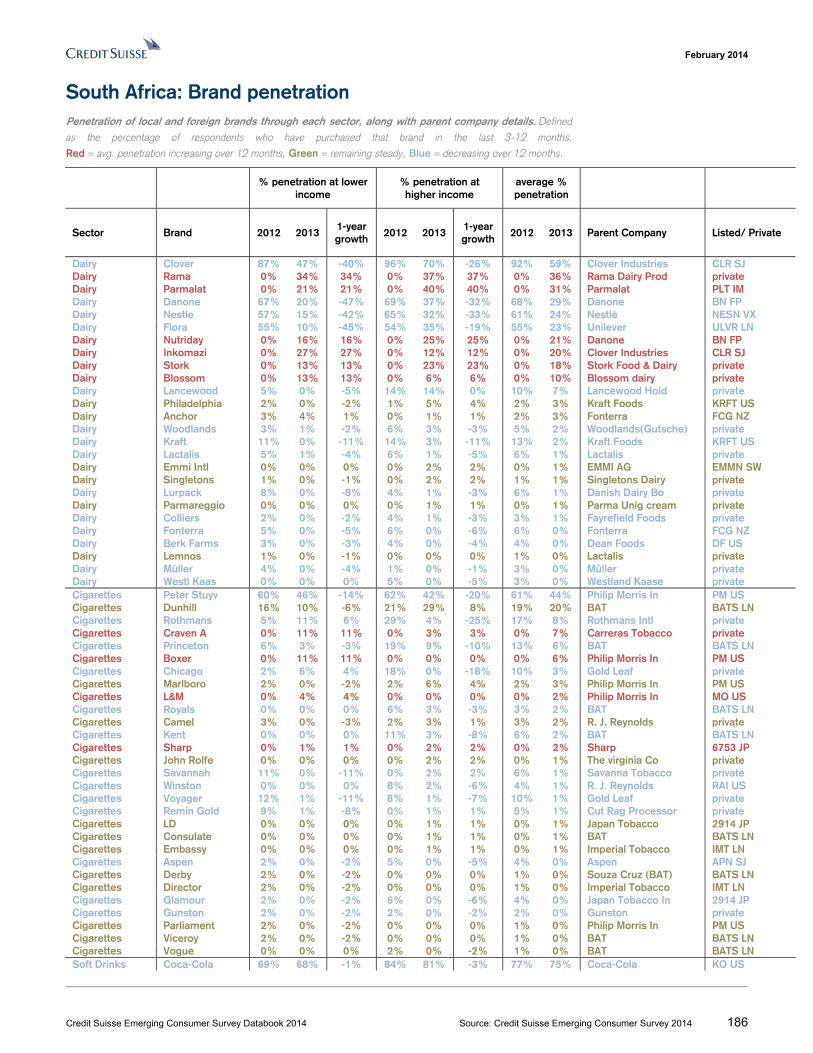
February 2014
Credit Suisse Emerging Consumer Survey Databook 2014 Source: Credit Suisse Emerging Consumer Survey 2014 186
South Africa: Brand penetration Penetration of local and foreign brands through each sector, along with parent company details. Defined
as the percentage of respondents who have purchased that brand in the last 3-12 months.
Red = avg. penetration increasing over 12 months, Green = remaining steady, Blue = decreasing over 12 months.
% penetration at lower
income % penetration at higher income
average % penetration
Sector Brand 2012 2013 1-year growth
2012 2013 1-year growth
2012 2013 Parent Company Listed/ Private
Dairy Clover 87% 47% -40% 96% 70% -26% 92% 59% Clover Industries CLR SJ Dairy Rama 0% 34% 34% 0% 37% 37% 0% 36% Rama Dairy Prod private Dairy Parmalat 0% 21% 21% 0% 40% 40% 0% 31% Parmalat PLT IM Dairy Danone 67% 20% -47% 69% 37% -32% 68% 29% Danone BN FP Dairy Nestle 57% 15% -42% 65% 32% -33% 61% 24% Nestlé NESN VX Dairy Flora 55% 10% -45% 54% 35% -19% 55% 23% Unilever ULVR LN Dairy Nutriday 0% 16% 16% 0% 25% 25% 0% 21% Danone BN FP Dairy Inkomazi 0% 27% 27% 0% 12% 12% 0% 20% Clover Industries CLR SJ Dairy Stork 0% 13% 13% 0% 23% 23% 0% 18% Stork Food & Dairy private Dairy Blossom 0% 13% 13% 0% 6% 6% 0% 10% Blossom dairy private Dairy Lancewood 5% 0% -5% 14% 14% 0% 10% 7% Lancewood Hold private Dairy Philadelphia 2% 0% -2% 1% 5% 4% 2% 3% Kraft Foods KRFT US Dairy Anchor 3% 4% 1% 0% 1% 1% 2% 3% Fonterra FCG NZ Dairy Woodlands 3% 1% -2% 6% 3% -3% 5% 2% Woodlands(Gutsche) private Dairy Kraft 11% 0% -11% 14% 3% -11% 13% 2% Kraft Foods KRFT US Dairy Lactalis 5% 1% -4% 6% 1% -5% 6% 1% Lactalis private Dairy Emmi Intl 0% 0% 0% 0% 2% 2% 0% 1% EMMI AG EMMN SW Dairy Singletons 1% 0% -1% 0% 2% 2% 1% 1% Singletons Dairy private Dairy Lurpack 8% 0% -8% 4% 1% -3% 6% 1% Danish Dairy Bo private Dairy Parmareggio 0% 0% 0% 0% 1% 1% 0% 1% Parma Unig cream private Dairy Colliers 2% 0% -2% 4% 1% -3% 3% 1% Fayrefield Foods private Dairy Fonterra 5% 0% -5% 6% 0% -6% 6% 0% Fonterra FCG NZ Dairy Berk Farms 3% 0% -3% 4% 0% -4% 4% 0% Dean Foods DF US Dairy Lemnos 1% 0% -1% 0% 0% 0% 1% 0% Lactalis private Dairy Müller 4% 0% -4% 1% 0% -1% 3% 0% Müller private Dairy Westl Kaas 0% 0% 0% 5% 0% -5% 3% 0% Westland Kaase private Cigarettes Peter Stuyv 60% 46% -14% 62% 42% -20% 61% 44% Philip Morris In PM US Cigarettes Dunhill 16% 10% -6% 21% 29% 8% 19% 20% BAT BATS LN Cigarettes Rothmans 5% 11% 6% 29% 4% -25% 17% 8% Rothmans Intl private Cigarettes Craven A 0% 11% 11% 0% 3% 3% 0% 7% Carreras Tobacco private Cigarettes Princeton 6% 3% -3% 19% 9% -10% 13% 6% BAT BATS LN Cigarettes Boxer 0% 11% 11% 0% 0% 0% 0% 6% Philip Morris In PM US Cigarettes Chicago 2% 6% 4% 18% 0% -18% 10% 3% Gold Leaf private Cigarettes Marlboro 2% 0% -2% 2% 6% 4% 2% 3% Philip Morris In PM US Cigarettes L&M 0% 4% 4% 0% 0% 0% 0% 2% Philip Morris In MO US Cigarettes Royals 0% 0% 0% 6% 3% -3% 3% 2% BAT BATS LN Cigarettes Camel 3% 0% -3% 2% 3% 1% 3% 2% R. J. Reynolds private Cigarettes Kent 0% 0% 0% 11% 3% -8% 6% 2% BAT BATS LN Cigarettes Sharp 0% 1% 1% 0% 2% 2% 0% 2% Sharp 6753 JP Cigarettes John Rolfe 0% 0% 0% 0% 2% 2% 0% 1% The virginia Co private Cigarettes Savannah 11% 0% -11% 0% 2% 2% 6% 1% Savanna Tobacco private Cigarettes Winston 0% 0% 0% 8% 2% -6% 4% 1% R. J. Reynolds RAI US Cigarettes Voyager 12% 1% -11% 8% 1% -7% 10% 1% Gold Leaf private Cigarettes Remin Gold 9% 1% -8% 0% 1% 1% 5% 1% Cut Rag Processor private Cigarettes LD 0% 0% 0% 0% 1% 1% 0% 1% Japan Tobacco 2914 JP Cigarettes Consulate 0% 0% 0% 0% 1% 1% 0% 1% BAT BATS LN Cigarettes Embassy 0% 0% 0% 0% 1% 1% 0% 1% Imperial Tobacco IMT LN Cigarettes Aspen 2% 0% -2% 5% 0% -5% 4% 0% Aspen APN SJ Cigarettes Derby 2% 0% -2% 0% 0% 0% 1% 0% Souza Cruz (BAT) BATS LN Cigarettes Director 2% 0% -2% 0% 0% 0% 1% 0% Imperial Tobacco IMT LN Cigarettes Glamour 2% 0% -2% 6% 0% -6% 4% 0% Japan Tobacco In 2914 JP Cigarettes Gunston 2% 0% -2% 2% 0% -2% 2% 0% Gunston private Cigarettes Parliament 2% 0% -2% 0% 0% 0% 1% 0% Philip Morris In PM US Cigarettes Viceroy 2% 0% -2% 0% 0% 0% 1% 0% BAT BATS LN Cigarettes Vogue 0% 0% 0% 2% 0% -2% 1% 0% BAT BATS LN Soft Drinks Coca-Cola 69% 68% -1% 84% 81% -3% 77% 75% Coca-Cola KO US
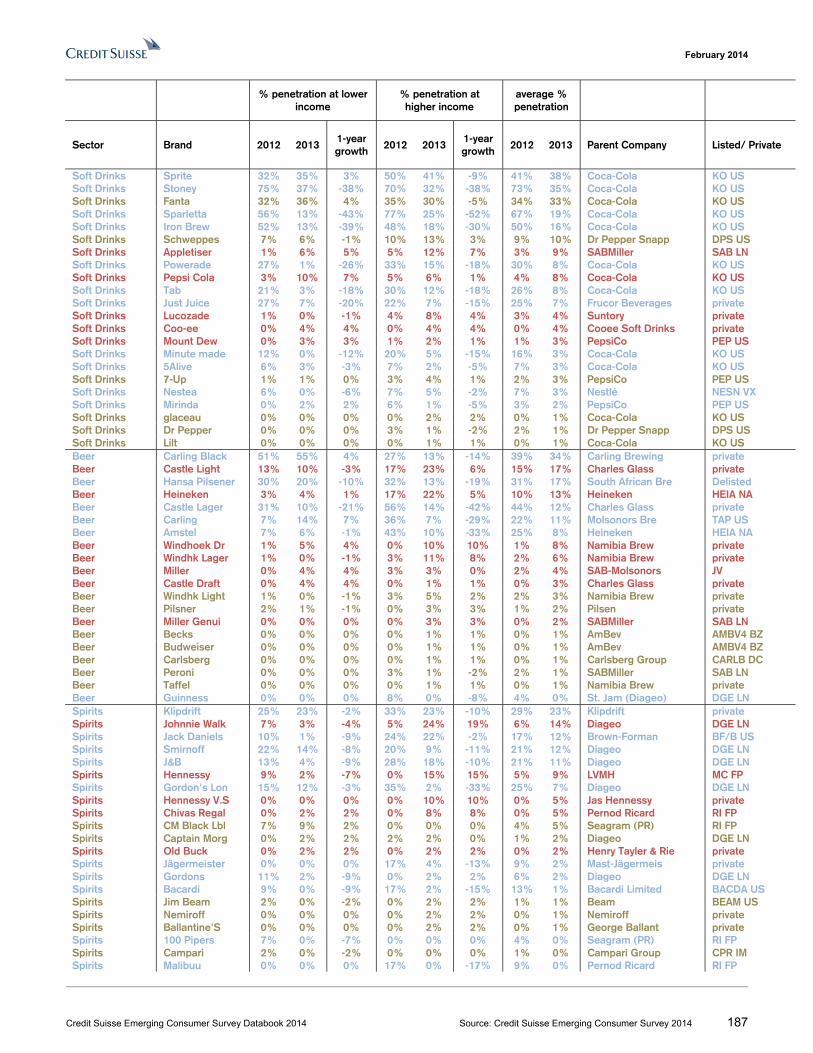
February 2014
Credit Suisse Emerging Consumer Survey Databook 2014 Source: Credit Suisse Emerging Consumer Survey 2014 187
% penetration at lower
income % penetration at higher income
average % penetration
Sector Brand 2012 2013 1-year growth
2012 2013 1-year growth
2012 2013 Parent Company Listed/ Private
Soft Drinks Sprite 32% 35% 3% 50% 41% -9% 41% 38% Coca-Cola KO US Soft Drinks Stoney 75% 37% -38% 70% 32% -38% 73% 35% Coca-Cola KO US Soft Drinks Fanta 32% 36% 4% 35% 30% -5% 34% 33% Coca-Cola KO US Soft Drinks Sparletta 56% 13% -43% 77% 25% -52% 67% 19% Coca-Cola KO US Soft Drinks Iron Brew 52% 13% -39% 48% 18% -30% 50% 16% Coca-Cola KO US Soft Drinks Schweppes 7% 6% -1% 10% 13% 3% 9% 10% Dr Pepper Snapp DPS US Soft Drinks Appletiser 1% 6% 5% 5% 12% 7% 3% 9% SABMiller SAB LN Soft Drinks Powerade 27% 1% -26% 33% 15% -18% 30% 8% Coca-Cola KO US Soft Drinks Pepsi Cola 3% 10% 7% 5% 6% 1% 4% 8% Coca-Cola KO US Soft Drinks Tab 21% 3% -18% 30% 12% -18% 26% 8% Coca-Cola KO US Soft Drinks Just Juice 27% 7% -20% 22% 7% -15% 25% 7% Frucor Beverages private Soft Drinks Lucozade 1% 0% -1% 4% 8% 4% 3% 4% Suntory private Soft Drinks Coo-ee 0% 4% 4% 0% 4% 4% 0% 4% Cooee Soft Drinks private Soft Drinks Mount Dew 0% 3% 3% 1% 2% 1% 1% 3% PepsiCo PEP US Soft Drinks Minute made 12% 0% -12% 20% 5% -15% 16% 3% Coca-Cola KO US Soft Drinks 5Alive 6% 3% -3% 7% 2% -5% 7% 3% Coca-Cola KO US Soft Drinks 7-Up 1% 1% 0% 3% 4% 1% 2% 3% PepsiCo PEP US Soft Drinks Nestea 6% 0% -6% 7% 5% -2% 7% 3% Nestlé NESN VX Soft Drinks Mirinda 0% 2% 2% 6% 1% -5% 3% 2% PepsiCo PEP US Soft Drinks glaceau 0% 0% 0% 0% 2% 2% 0% 1% Coca-Cola KO US Soft Drinks Dr Pepper 0% 0% 0% 3% 1% -2% 2% 1% Dr Pepper Snapp DPS US Soft Drinks Lilt 0% 0% 0% 0% 1% 1% 0% 1% Coca-Cola KO US Beer Carling Black 51% 55% 4% 27% 13% -14% 39% 34% Carling Brewing private Beer Castle Light 13% 10% -3% 17% 23% 6% 15% 17% Charles Glass private Beer Hansa Pilsener 30% 20% -10% 32% 13% -19% 31% 17% South African Bre Delisted Beer Heineken 3% 4% 1% 17% 22% 5% 10% 13% Heineken HEIA NA Beer Castle Lager 31% 10% -21% 56% 14% -42% 44% 12% Charles Glass private Beer Carling 7% 14% 7% 36% 7% -29% 22% 11% Molsonors Bre TAP US Beer Amstel 7% 6% -1% 43% 10% -33% 25% 8% Heineken HEIA NA Beer Windhoek Dr 1% 5% 4% 0% 10% 10% 1% 8% Namibia Brew private Beer Windhk Lager 1% 0% -1% 3% 11% 8% 2% 6% Namibia Brew private Beer Miller 0% 4% 4% 3% 3% 0% 2% 4% SAB-Molsonors JV Beer Castle Draft 0% 4% 4% 0% 1% 1% 0% 3% Charles Glass private Beer Windhk Light 1% 0% -1% 3% 5% 2% 2% 3% Namibia Brew private Beer Pilsner 2% 1% -1% 0% 3% 3% 1% 2% Pilsen private Beer Miller Genui 0% 0% 0% 0% 3% 3% 0% 2% SABMiller SAB LN Beer Becks 0% 0% 0% 0% 1% 1% 0% 1% AmBev AMBV4 BZ Beer Budweiser 0% 0% 0% 0% 1% 1% 0% 1% AmBev AMBV4 BZ Beer Carlsberg 0% 0% 0% 0% 1% 1% 0% 1% Carlsberg Group CARLB DC Beer Peroni 0% 0% 0% 3% 1% -2% 2% 1% SABMiller SAB LN Beer Taffel 0% 0% 0% 0% 1% 1% 0% 1% Namibia Brew private Beer Guinness 0% 0% 0% 8% 0% -8% 4% 0% St. Jam (Diageo) DGE LN Spirits Klipdrift 25% 23% -2% 33% 23% -10% 29% 23% Klipdrift private Spirits Johnnie Walk 7% 3% -4% 5% 24% 19% 6% 14% Diageo DGE LN Spirits Jack Daniels 10% 1% -9% 24% 22% -2% 17% 12% Brown-Forman BF/B US Spirits Smirnoff 22% 14% -8% 20% 9% -11% 21% 12% Diageo DGE LN Spirits J&B 13% 4% -9% 28% 18% -10% 21% 11% Diageo DGE LN Spirits Hennessy 9% 2% -7% 0% 15% 15% 5% 9% LVMH MC FP Spirits Gordon's Lon 15% 12% -3% 35% 2% -33% 25% 7% Diageo DGE LN Spirits Hennessy V.S 0% 0% 0% 0% 10% 10% 0% 5% Jas Hennessy private Spirits Chivas Regal 0% 2% 2% 0% 8% 8% 0% 5% Pernod Ricard RI FP Spirits CM Black Lbl 7% 9% 2% 0% 0% 0% 4% 5% Seagram (PR) RI FP Spirits Captain Morg 0% 2% 2% 2% 2% 0% 1% 2% Diageo DGE LN Spirits Old Buck 0% 2% 2% 0% 2% 2% 0% 2% Henry Tayler & Rie private Spirits Jägermeister 0% 0% 0% 17% 4% -13% 9% 2% Mast-Jägermeis private Spirits Gordons 11% 2% -9% 0% 2% 2% 6% 2% Diageo DGE LN Spirits Bacardi 9% 0% -9% 17% 2% -15% 13% 1% Bacardi Limited BACDA US Spirits Jim Beam 2% 0% -2% 0% 2% 2% 1% 1% Beam BEAM US Spirits Nemiroff 0% 0% 0% 0% 2% 2% 0% 1% Nemiroff private Spirits Ballantine'S 0% 0% 0% 0% 2% 2% 0% 1% George Ballant private Spirits 100 Pipers 7% 0% -7% 0% 0% 0% 4% 0% Seagram (PR) RI FP Spirits Campari 2% 0% -2% 0% 0% 0% 1% 0% Campari Group CPR IM Spirits Malibuu 0% 0% 0% 17% 0% -17% 9% 0% Pernod Ricard RI FP
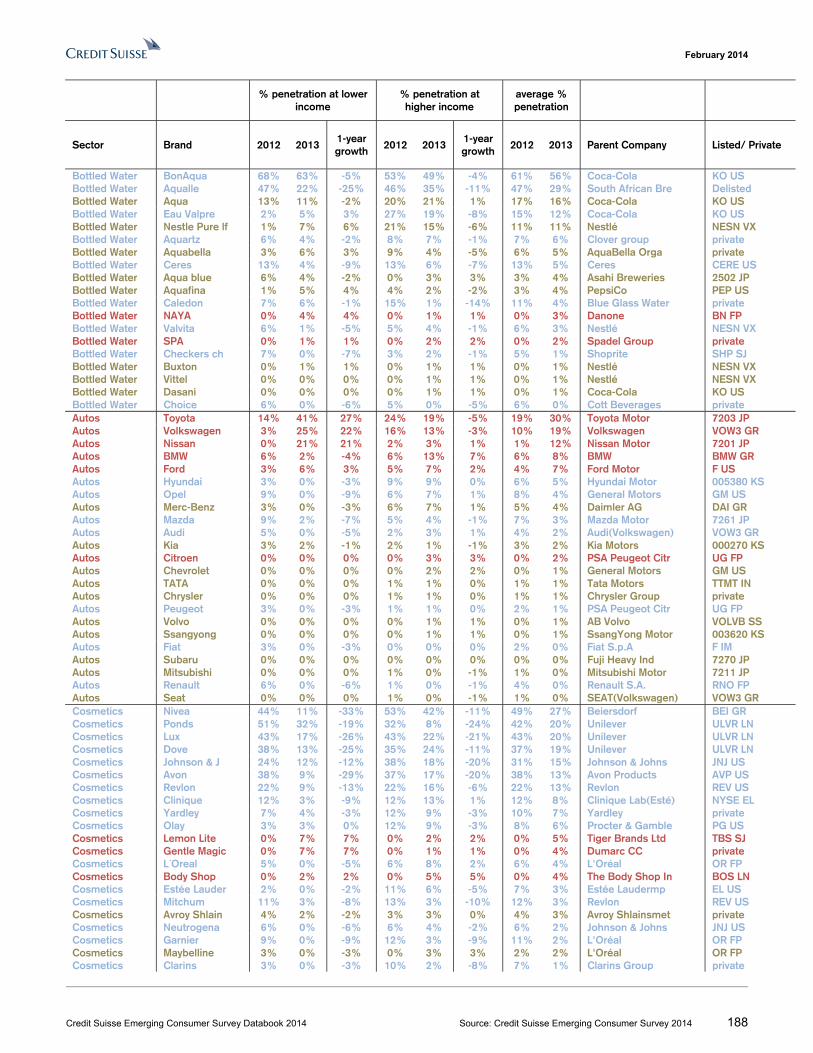
February 2014
Credit Suisse Emerging Consumer Survey Databook 2014 Source: Credit Suisse Emerging Consumer Survey 2014 188
% penetration at lower
income % penetration at higher income
average % penetration
Sector Brand 2012 2013 1-year growth
2012 2013 1-year growth
2012 2013 Parent Company Listed/ Private
Bottled Water BonAqua 68% 63% -5% 53% 49% -4% 61% 56% Coca-Cola KO US Bottled Water Aqualle 47% 22% -25% 46% 35% -11% 47% 29% South African Bre Delisted Bottled Water Aqua 13% 11% -2% 20% 21% 1% 17% 16% Coca-Cola KO US Bottled Water Eau Valpre 2% 5% 3% 27% 19% -8% 15% 12% Coca-Cola KO US Bottled Water Nestle Pure lf 1% 7% 6% 21% 15% -6% 11% 11% Nestlé NESN VX Bottled Water Aquartz 6% 4% -2% 8% 7% -1% 7% 6% Clover group private Bottled Water Aquabella 3% 6% 3% 9% 4% -5% 6% 5% AquaBella Orga private Bottled Water Ceres 13% 4% -9% 13% 6% -7% 13% 5% Ceres CERE US Bottled Water Aqua blue 6% 4% -2% 0% 3% 3% 3% 4% Asahi Breweries 2502 JP Bottled Water Aquafina 1% 5% 4% 4% 2% -2% 3% 4% PepsiCo PEP US Bottled Water Caledon 7% 6% -1% 15% 1% -14% 11% 4% Blue Glass Water private Bottled Water NAYA 0% 4% 4% 0% 1% 1% 0% 3% Danone BN FP Bottled Water Valvita 6% 1% -5% 5% 4% -1% 6% 3% Nestlé NESN VX Bottled Water SPA 0% 1% 1% 0% 2% 2% 0% 2% Spadel Group private Bottled Water Checkers ch 7% 0% -7% 3% 2% -1% 5% 1% Shoprite SHP SJ Bottled Water Buxton 0% 1% 1% 0% 1% 1% 0% 1% Nestlé NESN VX Bottled Water Vittel 0% 0% 0% 0% 1% 1% 0% 1% Nestlé NESN VX Bottled Water Dasani 0% 0% 0% 0% 1% 1% 0% 1% Coca-Cola KO US Bottled Water Choice 6% 0% -6% 5% 0% -5% 6% 0% Cott Beverages private Autos Toyota 14% 41% 27% 24% 19% -5% 19% 30% Toyota Motor 7203 JP Autos Volkswagen 3% 25% 22% 16% 13% -3% 10% 19% Volkswagen VOW3 GR Autos Nissan 0% 21% 21% 2% 3% 1% 1% 12% Nissan Motor 7201 JP Autos BMW 6% 2% -4% 6% 13% 7% 6% 8% BMW BMW GR Autos Ford 3% 6% 3% 5% 7% 2% 4% 7% Ford Motor F US Autos Hyundai 3% 0% -3% 9% 9% 0% 6% 5% Hyundai Motor 005380 KS Autos Opel 9% 0% -9% 6% 7% 1% 8% 4% General Motors GM US Autos Merc-Benz 3% 0% -3% 6% 7% 1% 5% 4% Daimler AG DAI GR Autos Mazda 9% 2% -7% 5% 4% -1% 7% 3% Mazda Motor 7261 JP Autos Audi 5% 0% -5% 2% 3% 1% 4% 2% Audi(Volkswagen) VOW3 GR Autos Kia 3% 2% -1% 2% 1% -1% 3% 2% Kia Motors 000270 KS Autos Citroen 0% 0% 0% 0% 3% 3% 0% 2% PSA Peugeot Citr UG FP Autos Chevrolet 0% 0% 0% 0% 2% 2% 0% 1% General Motors GM US Autos TATA 0% 0% 0% 1% 1% 0% 1% 1% Tata Motors TTMT IN Autos Chrysler 0% 0% 0% 1% 1% 0% 1% 1% Chrysler Group private Autos Peugeot 3% 0% -3% 1% 1% 0% 2% 1% PSA Peugeot Citr UG FP Autos Volvo 0% 0% 0% 0% 1% 1% 0% 1% AB Volvo VOLVB SS Autos Ssangyong 0% 0% 0% 0% 1% 1% 0% 1% SsangYong Motor 003620 KS Autos Fiat 3% 0% -3% 0% 0% 0% 2% 0% Fiat S.p.A F IM Autos Subaru 0% 0% 0% 0% 0% 0% 0% 0% Fuji Heavy Ind 7270 JP Autos Mitsubishi 0% 0% 0% 1% 0% -1% 1% 0% Mitsubishi Motor 7211 JP Autos Renault 6% 0% -6% 1% 0% -1% 4% 0% Renault S.A. RNO FP Autos Seat 0% 0% 0% 1% 0% -1% 1% 0% SEAT(Volkswagen) VOW3 GR Cosmetics Nivea 44% 11% -33% 53% 42% -11% 49% 27% Beiersdorf BEI GR Cosmetics Ponds 51% 32% -19% 32% 8% -24% 42% 20% Unilever ULVR LN Cosmetics Lux 43% 17% -26% 43% 22% -21% 43% 20% Unilever ULVR LN Cosmetics Dove 38% 13% -25% 35% 24% -11% 37% 19% Unilever ULVR LN Cosmetics Johnson & J 24% 12% -12% 38% 18% -20% 31% 15% Johnson & Johns JNJ US Cosmetics Avon 38% 9% -29% 37% 17% -20% 38% 13% Avon Products AVP US Cosmetics Revlon 22% 9% -13% 22% 16% -6% 22% 13% Revlon REV US Cosmetics Clinique 12% 3% -9% 12% 13% 1% 12% 8% Clinique Lab(Esté) NYSE EL Cosmetics Yardley 7% 4% -3% 12% 9% -3% 10% 7% Yardley private Cosmetics Olay 3% 3% 0% 12% 9% -3% 8% 6% Procter & Gamble PG US Cosmetics Lemon Lite 0% 7% 7% 0% 2% 2% 0% 5% Tiger Brands Ltd TBS SJ Cosmetics Gentle Magic 0% 7% 7% 0% 1% 1% 0% 4% Dumarc CC private Cosmetics L´Oreal 5% 0% -5% 6% 8% 2% 6% 4% L'Oréal OR FP Cosmetics Body Shop 0% 2% 2% 0% 5% 5% 0% 4% The Body Shop In BOS LN Cosmetics Estée Lauder 2% 0% -2% 11% 6% -5% 7% 3% Estée Laudermp EL US Cosmetics Mitchum 11% 3% -8% 13% 3% -10% 12% 3% Revlon REV US Cosmetics Avroy Shlain 4% 2% -2% 3% 3% 0% 4% 3% Avroy Shlainsmet private Cosmetics Neutrogena 6% 0% -6% 6% 4% -2% 6% 2% Johnson & Johns JNJ US Cosmetics Garnier 9% 0% -9% 12% 3% -9% 11% 2% L'Oréal OR FP Cosmetics Maybelline 3% 0% -3% 0% 3% 3% 2% 2% L'Oréal OR FP Cosmetics Clarins 3% 0% -3% 10% 2% -8% 7% 1% Clarins Group private
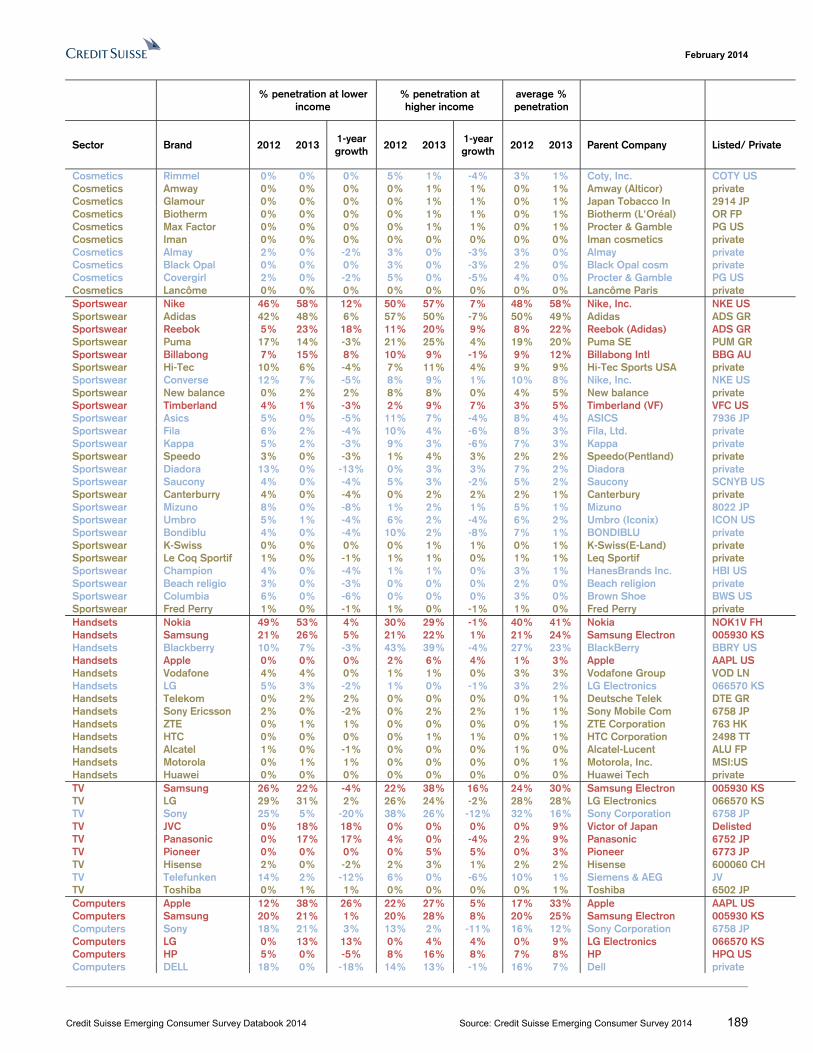
February 2014
Credit Suisse Emerging Consumer Survey Databook 2014 Source: Credit Suisse Emerging Consumer Survey 2014 189
% penetration at lower
income % penetration at higher income
average % penetration
Sector Brand 2012 2013 1-year growth
2012 2013 1-year growth
2012 2013 Parent Company Listed/ Private
Cosmetics Rimmel 0% 0% 0% 5% 1% -4% 3% 1% Coty, Inc. COTY US Cosmetics Amway 0% 0% 0% 0% 1% 1% 0% 1% Amway (Alticor) private Cosmetics Glamour 0% 0% 0% 0% 1% 1% 0% 1% Japan Tobacco In 2914 JP Cosmetics Biotherm 0% 0% 0% 0% 1% 1% 0% 1% Biotherm (L'Oréal) OR FP Cosmetics Max Factor 0% 0% 0% 0% 1% 1% 0% 1% Procter & Gamble PG US Cosmetics Iman 0% 0% 0% 0% 0% 0% 0% 0% Iman cosmetics private Cosmetics Almay 2% 0% -2% 3% 0% -3% 3% 0% Almay private Cosmetics Black Opal 0% 0% 0% 3% 0% -3% 2% 0% Black Opal cosm private Cosmetics Covergirl 2% 0% -2% 5% 0% -5% 4% 0% Procter & Gamble PG US Cosmetics Lancôme 0% 0% 0% 0% 0% 0% 0% 0% Lancôme Paris private Sportswear Nike 46% 58% 12% 50% 57% 7% 48% 58% Nike, Inc. NKE US Sportswear Adidas 42% 48% 6% 57% 50% -7% 50% 49% Adidas ADS GR Sportswear Reebok 5% 23% 18% 11% 20% 9% 8% 22% Reebok (Adidas) ADS GR Sportswear Puma 17% 14% -3% 21% 25% 4% 19% 20% Puma SE PUM GR Sportswear Billabong 7% 15% 8% 10% 9% -1% 9% 12% Billabong Intl BBG AU Sportswear Hi-Tec 10% 6% -4% 7% 11% 4% 9% 9% Hi-Tec Sports USA private Sportswear Converse 12% 7% -5% 8% 9% 1% 10% 8% Nike, Inc. NKE US Sportswear New balance 0% 2% 2% 8% 8% 0% 4% 5% New balance private Sportswear Timberland 4% 1% -3% 2% 9% 7% 3% 5% Timberland (VF) VFC US Sportswear Asics 5% 0% -5% 11% 7% -4% 8% 4% ASICS 7936 JP Sportswear Fila 6% 2% -4% 10% 4% -6% 8% 3% Fila, Ltd. private Sportswear Kappa 5% 2% -3% 9% 3% -6% 7% 3% Kappa private Sportswear Speedo 3% 0% -3% 1% 4% 3% 2% 2% Speedo(Pentland) private Sportswear Diadora 13% 0% -13% 0% 3% 3% 7% 2% Diadora private Sportswear Saucony 4% 0% -4% 5% 3% -2% 5% 2% Saucony SCNYB US Sportswear Canterburry 4% 0% -4% 0% 2% 2% 2% 1% Canterbury private Sportswear Mizuno 8% 0% -8% 1% 2% 1% 5% 1% Mizuno 8022 JP Sportswear Umbro 5% 1% -4% 6% 2% -4% 6% 2% Umbro (Iconix) ICON US Sportswear Bondiblu 4% 0% -4% 10% 2% -8% 7% 1% BONDIBLU private Sportswear K-Swiss 0% 0% 0% 0% 1% 1% 0% 1% K-Swiss(E-Land) private Sportswear Le Coq Sportif 1% 0% -1% 1% 1% 0% 1% 1% Leq Sportif private Sportswear Champion 4% 0% -4% 1% 1% 0% 3% 1% HanesBrands Inc. HBI US Sportswear Beach religio 3% 0% -3% 0% 0% 0% 2% 0% Beach religion private Sportswear Columbia 6% 0% -6% 0% 0% 0% 3% 0% Brown Shoe BWS US Sportswear Fred Perry 1% 0% -1% 1% 0% -1% 1% 0% Fred Perry private Handsets Nokia 49% 53% 4% 30% 29% -1% 40% 41% Nokia NOK1V FH Handsets Samsung 21% 26% 5% 21% 22% 1% 21% 24% Samsung Electron 005930 KS Handsets Blackberry 10% 7% -3% 43% 39% -4% 27% 23% BlackBerry BBRY US Handsets Apple 0% 0% 0% 2% 6% 4% 1% 3% Apple AAPL US Handsets Vodafone 4% 4% 0% 1% 1% 0% 3% 3% Vodafone Group VOD LN Handsets LG 5% 3% -2% 1% 0% -1% 3% 2% LG Electronics 066570 KS Handsets Telekom 0% 2% 2% 0% 0% 0% 0% 1% Deutsche Telek DTE GR Handsets Sony Ericsson 2% 0% -2% 0% 2% 2% 1% 1% Sony Mobile Com 6758 JP Handsets ZTE 0% 1% 1% 0% 0% 0% 0% 1% ZTE Corporation 763 HK Handsets HTC 0% 0% 0% 0% 1% 1% 0% 1% HTC Corporation 2498 TT Handsets Alcatel 1% 0% -1% 0% 0% 0% 1% 0% Alcatel-Lucent ALU FP Handsets Motorola 0% 1% 1% 0% 0% 0% 0% 1% Motorola, Inc. MSI:US Handsets Huawei 0% 0% 0% 0% 0% 0% 0% 0% Huawei Tech private TV Samsung 26% 22% -4% 22% 38% 16% 24% 30% Samsung Electron 005930 KS TV LG 29% 31% 2% 26% 24% -2% 28% 28% LG Electronics 066570 KS TV Sony 25% 5% -20% 38% 26% -12% 32% 16% Sony Corporation 6758 JP TV JVC 0% 18% 18% 0% 0% 0% 0% 9% Victor of Japan Delisted TV Panasonic 0% 17% 17% 4% 0% -4% 2% 9% Panasonic 6752 JP TV Pioneer 0% 0% 0% 0% 5% 5% 0% 3% Pioneer 6773 JP TV Hisense 2% 0% -2% 2% 3% 1% 2% 2% Hisense 600060 CH TV Telefunken 14% 2% -12% 6% 0% -6% 10% 1% Siemens & AEG JV TV Toshiba 0% 1% 1% 0% 0% 0% 0% 1% Toshiba 6502 JP Computers Apple 12% 38% 26% 22% 27% 5% 17% 33% Apple AAPL US Computers Samsung 20% 21% 1% 20% 28% 8% 20% 25% Samsung Electron 005930 KS Computers Sony 18% 21% 3% 13% 2% -11% 16% 12% Sony Corporation 6758 JP Computers LG 0% 13% 13% 0% 4% 4% 0% 9% LG Electronics 066570 KS Computers HP 5% 0% -5% 8% 16% 8% 7% 8% HP HPQ US Computers DELL 18% 0% -18% 14% 13% -1% 16% 7% Dell private
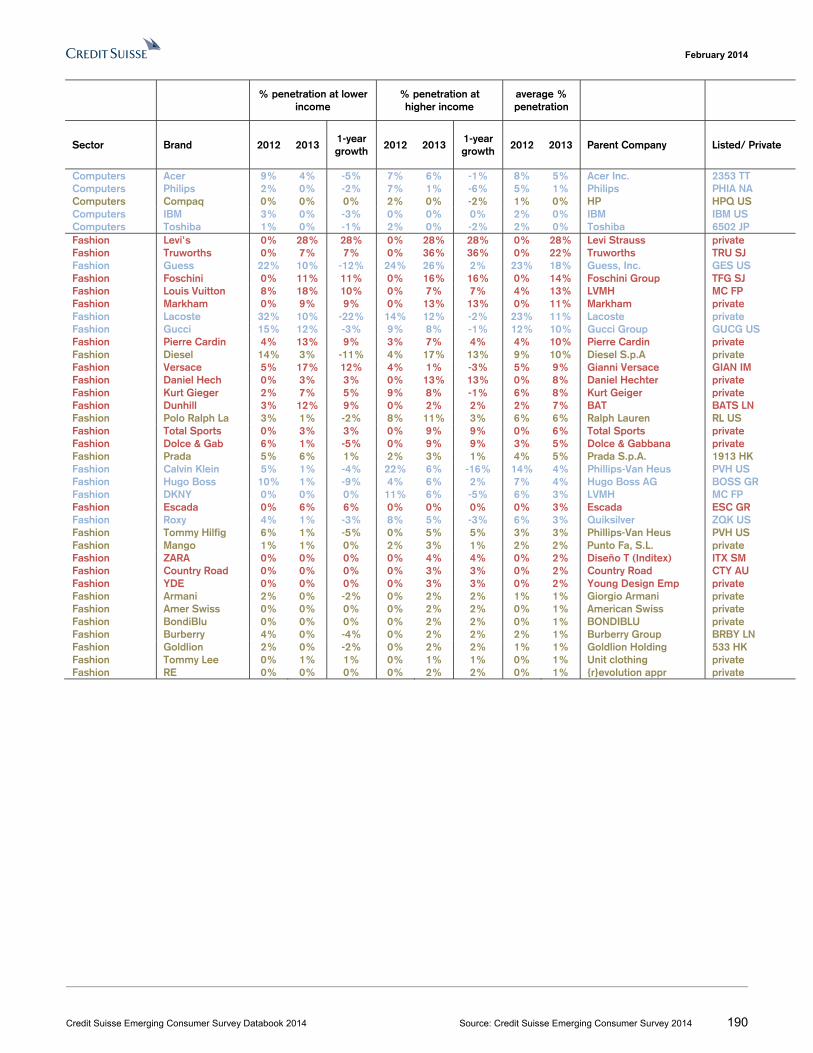
February 2014
Credit Suisse Emerging Consumer Survey Databook 2014 Source: Credit Suisse Emerging Consumer Survey 2014 190
% penetration at lower
income % penetration at higher income
average % penetration
Sector Brand 2012 2013 1-year growth
2012 2013 1-year growth
2012 2013 Parent Company Listed/ Private
Computers Acer 9% 4% -5% 7% 6% -1% 8% 5% Acer Inc. 2353 TT Computers Philips 2% 0% -2% 7% 1% -6% 5% 1% Philips PHIA NA Computers Compaq 0% 0% 0% 2% 0% -2% 1% 0% HP HPQ US Computers IBM 3% 0% -3% 0% 0% 0% 2% 0% IBM IBM US Computers Toshiba 1% 0% -1% 2% 0% -2% 2% 0% Toshiba 6502 JP Fashion Levi's 0% 28% 28% 0% 28% 28% 0% 28% Levi Strauss private Fashion Truworths 0% 7% 7% 0% 36% 36% 0% 22% Truworths TRU SJ Fashion Guess 22% 10% -12% 24% 26% 2% 23% 18% Guess, Inc. GES US Fashion Foschini 0% 11% 11% 0% 16% 16% 0% 14% Foschini Group TFG SJ Fashion Louis Vuitton 8% 18% 10% 0% 7% 7% 4% 13% LVMH MC FP Fashion Markham 0% 9% 9% 0% 13% 13% 0% 11% Markham private Fashion Lacoste 32% 10% -22% 14% 12% -2% 23% 11% Lacoste private Fashion Gucci 15% 12% -3% 9% 8% -1% 12% 10% Gucci Group GUCG US Fashion Pierre Cardin 4% 13% 9% 3% 7% 4% 4% 10% Pierre Cardin private Fashion Diesel 14% 3% -11% 4% 17% 13% 9% 10% Diesel S.p.A private Fashion Versace 5% 17% 12% 4% 1% -3% 5% 9% Gianni Versace GIAN IM Fashion Daniel Hech 0% 3% 3% 0% 13% 13% 0% 8% Daniel Hechter private Fashion Kurt Gieger 2% 7% 5% 9% 8% -1% 6% 8% Kurt Geiger private Fashion Dunhill 3% 12% 9% 0% 2% 2% 2% 7% BAT BATS LN Fashion Polo Ralph La 3% 1% -2% 8% 11% 3% 6% 6% Ralph Lauren RL US Fashion Total Sports 0% 3% 3% 0% 9% 9% 0% 6% Total Sports private Fashion Dolce & Gab 6% 1% -5% 0% 9% 9% 3% 5% Dolce & Gabbana private Fashion Prada 5% 6% 1% 2% 3% 1% 4% 5% Prada S.p.A. 1913 HK Fashion Calvin Klein 5% 1% -4% 22% 6% -16% 14% 4% Phillips-Van Heus PVH US Fashion Hugo Boss 10% 1% -9% 4% 6% 2% 7% 4% Hugo Boss AG BOSS GR Fashion DKNY 0% 0% 0% 11% 6% -5% 6% 3% LVMH MC FP Fashion Escada 0% 6% 6% 0% 0% 0% 0% 3% Escada ESC GR Fashion Roxy 4% 1% -3% 8% 5% -3% 6% 3% Quiksilver ZQK US Fashion Tommy Hilfig 6% 1% -5% 0% 5% 5% 3% 3% Phillips-Van Heus PVH US Fashion Mango 1% 1% 0% 2% 3% 1% 2% 2% Punto Fa, S.L. private Fashion ZARA 0% 0% 0% 0% 4% 4% 0% 2% Diseño T (Inditex) ITX SM Fashion Country Road 0% 0% 0% 0% 3% 3% 0% 2% Country Road CTY AU Fashion YDE 0% 0% 0% 0% 3% 3% 0% 2% Young Design Emp private Fashion Armani 2% 0% -2% 0% 2% 2% 1% 1% Giorgio Armani private Fashion Amer Swiss 0% 0% 0% 0% 2% 2% 0% 1% American Swiss private Fashion BondiBlu 0% 0% 0% 0% 2% 2% 0% 1% BONDIBLU private Fashion Burberry 4% 0% -4% 0% 2% 2% 2% 1% Burberry Group BRBY LN Fashion Goldlion 2% 0% -2% 0% 2% 2% 1% 1% Goldlion Holding 533 HK Fashion Tommy Lee 0% 1% 1% 0% 1% 1% 0% 1% Unit clothing private Fashion RE 0% 0% 0% 0% 2% 2% 0% 1% {r}evolution appr private
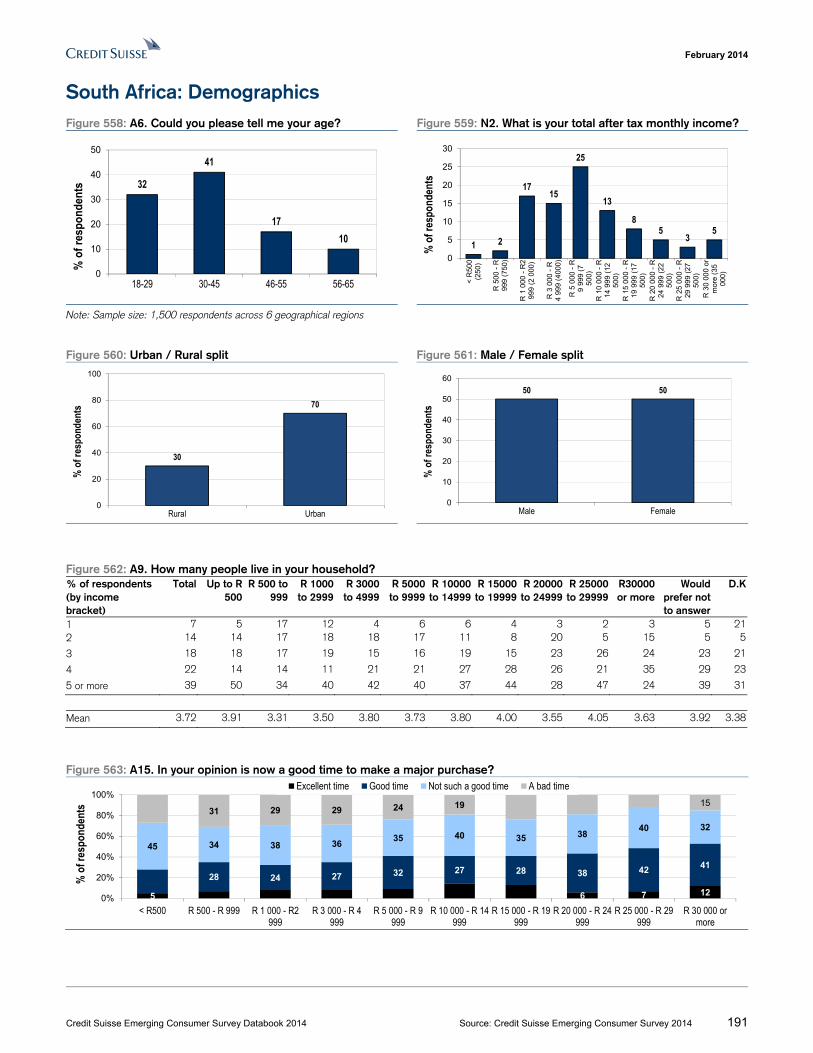
February 2014
Credit Suisse Emerging Consumer Survey Databook 2014 Source: Credit Suisse Emerging Consumer Survey 2014 191
South Africa: Demographics Figure 558: A6. Could you please tell me your age? Figure 559: N2. What is your total after tax monthly income?
Note: Sample size: 1,500 respondents across 6 geographical regions
Figure 560: Urban / Rural split Figure 561: Male / Female split
Figure 562: A9. How many people live in your household? % of respondents (by income bracket)
Total Up to R 500
R 500 to 999
R 1000 to 2999
R 3000 to 4999
R 5000 to 9999
R 10000 to 14999
R 15000 to 19999
R 20000 to 24999
R 25000 to 29999
R30000 or more
Would prefer not to answer
D.K
1 7 5 17 12 4 6 6 4 3 2 3 5 212 14 14 17 18 18 17 11 8 20 5 15 5 5
3 18 18 17 19 15 16 19 15 23 26 24 23 21
4 22 14 14 11 21 21 27 28 26 21 35 29 23
5 or more 39 50 34 40 42 40 37 44 28 47 24 39 31
Mean 3.72 3.91 3.31 3.50 3.80 3.73 3.80 4.00 3.55 4.05 3.63 3.92 3.38
Figure 563: A15. In your opinion is now a good time to make a major purchase?
32
41
1710
0
10
20
30
40
50
18-29 30-45 46-55 56-65
% o
f res
pond
ents
1 2
1715
25
13
85
35
0
5
10
15
20
25
30
< R
500
(250
)
R 5
00 -
R99
9 (7
50)
R 1
000
- R
299
9 (2
000
)
R 3
000
- R
4 99
9 (4
000)
R 5
000
- R
9 99
9 (7
500)
R 1
0 00
0 -
R14
999
(12
500)
R 1
5 00
0 -
R19
999
(17
500)
R 2
0 00
0 -
R24
999
(22
500)
R 2
5 00
0 -
R29
999
(27
500)
R 3
0 00
0 or
mor
e (3
500
0)
% o
f res
pond
ents
30
70
0
20
40
60
80
100
Rural Urban
% o
f res
pond
ents
50 50
0
10
20
30
40
50
60
Male Female
% o
f res
pond
ents
5 6 7 12
28 24 27 32 27 28 38 42 41
45 34 38 3635 40 35 38
40 32
31 29 29 24 19 15
0%
20%
40%
60%
80%
100%
< R500 R 500 - R 999 R 1 000 - R2999
R 3 000 - R 4999
R 5 000 - R 9999
R 10 000 - R 14999
R 15 000 - R 19999
R 20 000 - R 24999
R 25 000 - R 29999
R 30 000 ormore
% o
f res
pond
ents
Excellent time Good time Not such a good time A bad time
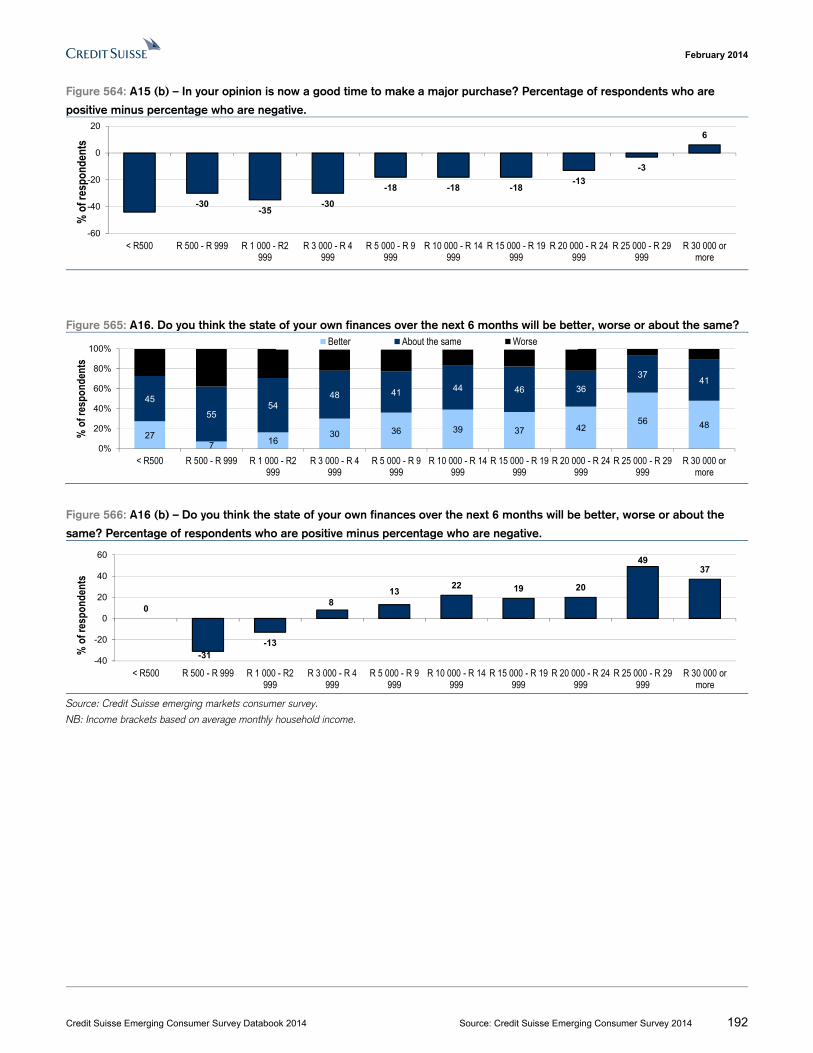
February 2014
Credit Suisse Emerging Consumer Survey Databook 2014 Source: Credit Suisse Emerging Consumer Survey 2014 192
Figure 564: A15 (b) – In your opinion is now a good time to make a major purchase? Percentage of respondents who are
positive minus percentage who are negative.
Figure 565: A16. Do you think the state of your own finances over the next 6 months will be better, worse or about the same?
Figure 566: A16 (b) – Do you think the state of your own finances over the next 6 months will be better, worse or about the
same? Percentage of respondents who are positive minus percentage who are negative.
Source: Credit Suisse emerging markets consumer survey.
NB: Income brackets based on average monthly household income.
-30-35
-30
-18 -18 -18-13
-3
6
-60
-40
-20
0
20
< R500 R 500 - R 999 R 1 000 - R2999
R 3 000 - R 4999
R 5 000 - R 9999
R 10 000 - R 14999
R 15 000 - R 19999
R 20 000 - R 24999
R 25 000 - R 29999
R 30 000 ormore
% o
f res
pond
ents
277 16
30 36 39 37 4256 48
45
5554
48 41 44 46 36
3741
0%
20%
40%
60%
80%
100%
< R500 R 500 - R 999 R 1 000 - R2999
R 3 000 - R 4999
R 5 000 - R 9999
R 10 000 - R 14999
R 15 000 - R 19999
R 20 000 - R 24999
R 25 000 - R 29999
R 30 000 ormore
% o
f res
pond
ents
Better About the same Worse
0
-31-13
813
22 19 20
4937
-40
-20
0
20
40
60
< R500 R 500 - R 999 R 1 000 - R2999
R 3 000 - R 4999
R 5 000 - R 9999
R 10 000 - R 14999
R 15 000 - R 19999
R 20 000 - R 24999
R 25 000 - R 29999
R 30 000 ormore
% o
f res
pond
ents
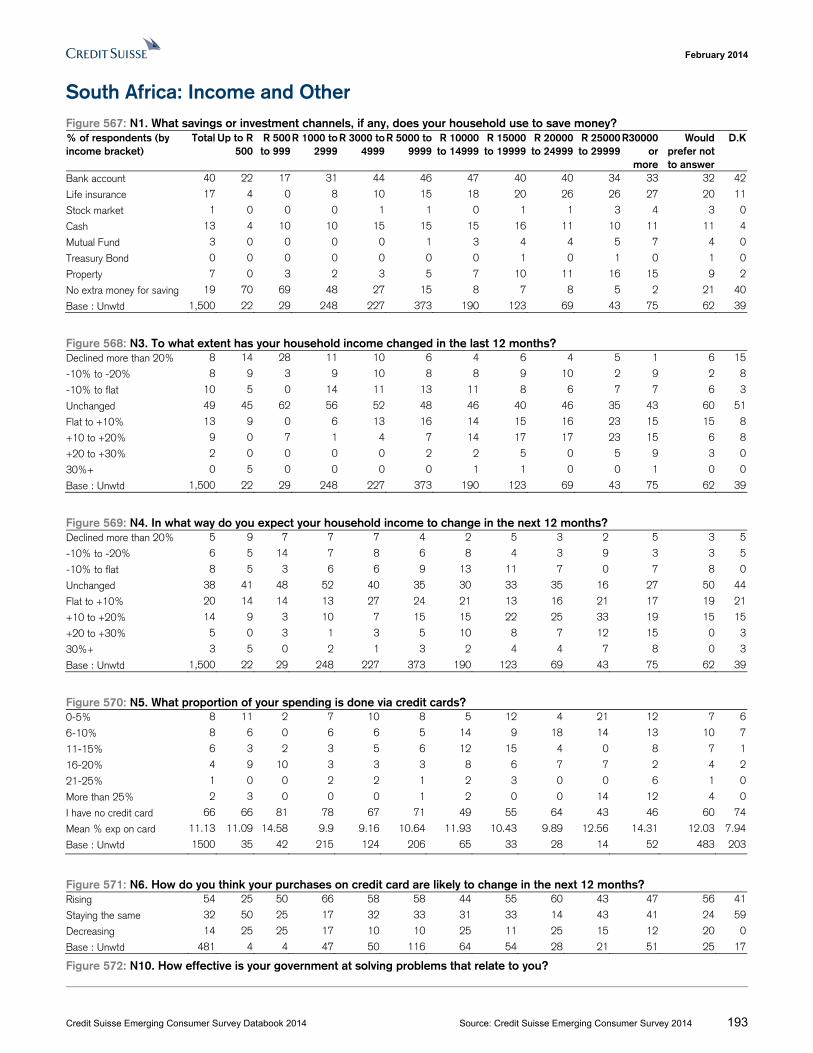
February 2014
Credit Suisse Emerging Consumer Survey Databook 2014 Source: Credit Suisse Emerging Consumer Survey 2014 193
South Africa: Income and Other Figure 567: N1. What savings or investment channels, if any, does your household use to save money? % of respondents (by income bracket)
Total Up to R 500
R 500 to 999
R 1000 to 2999
R 3000 to 4999
R 5000 to 9999
R 10000 to 14999
R 15000 to 19999
R 20000 to 24999
R 25000 to 29999
R30000 or
more
Would prefer not to answer
D.K
Bank account 40 22 17 31 44 46 47 40 40 34 33 32 42
Life insurance 17 4 0 8 10 15 18 20 26 26 27 20 11
Stock market 1 0 0 0 1 1 0 1 1 3 4 3 0
Cash 13 4 10 10 15 15 15 16 11 10 11 11 4
Mutual Fund 3 0 0 0 0 1 3 4 4 5 7 4 0
Treasury Bond 0 0 0 0 0 0 0 1 0 1 0 1 0
Property 7 0 3 2 3 5 7 10 11 16 15 9 2
No extra money for saving 19 70 69 48 27 15 8 7 8 5 2 21 40
Base : Unwtd 1,500 22 29 248 227 373 190 123 69 43 75 62 39
Figure 568: N3. To what extent has your household income changed in the last 12 months? Declined more than 20% 8 14 28 11 10 6 4 6 4 5 1 6 15
-10% to -20% 8 9 3 9 10 8 8 9 10 2 9 2 8
-10% to flat 10 5 0 14 11 13 11 8 6 7 7 6 3
Unchanged 49 45 62 56 52 48 46 40 46 35 43 60 51
Flat to +10% 13 9 0 6 13 16 14 15 16 23 15 15 8
+10 to +20% 9 0 7 1 4 7 14 17 17 23 15 6 8
+20 to +30% 2 0 0 0 0 2 2 5 0 5 9 3 0
30%+ 0 5 0 0 0 0 1 1 0 0 1 0 0
Base : Unwtd 1,500 22 29 248 227 373 190 123 69 43 75 62 39
Figure 569: N4. In what way do you expect your household income to change in the next 12 months? Declined more than 20% 5 9 7 7 7 4 2 5 3 2 5 3 5
-10% to -20% 6 5 14 7 8 6 8 4 3 9 3 3 5
-10% to flat 8 5 3 6 6 9 13 11 7 0 7 8 0
Unchanged 38 41 48 52 40 35 30 33 35 16 27 50 44
Flat to +10% 20 14 14 13 27 24 21 13 16 21 17 19 21
+10 to +20% 14 9 3 10 7 15 15 22 25 33 19 15 15
+20 to +30% 5 0 3 1 3 5 10 8 7 12 15 0 3
30%+ 3 5 0 2 1 3 2 4 4 7 8 0 3
Base : Unwtd 1,500 22 29 248 227 373 190 123 69 43 75 62 39
Figure 570: N5. What proportion of your spending is done via credit cards? 0-5% 8 11 2 7 10 8 5 12 4 21 12 7 6
6-10% 8 6 0 6 6 5 14 9 18 14 13 10 7
11-15% 6 3 2 3 5 6 12 15 4 0 8 7 1
16-20% 4 9 10 3 3 3 8 6 7 7 2 4 2
21-25% 1 0 0 2 2 1 2 3 0 0 6 1 0
More than 25% 2 3 0 0 0 1 2 0 0 14 12 4 0
I have no credit card 66 66 81 78 67 71 49 55 64 43 46 60 74
Mean % exp on card 11.13 11.09 14.58 9.9 9.16 10.64 11.93 10.43 9.89 12.56 14.31 12.03 7.94
Base : Unwtd 1500 35 42 215 124 206 65 33 28 14 52 483 203
Figure 571: N6. How do you think your purchases on credit card are likely to change in the next 12 months? Rising 54 25 50 66 58 58 44 55 60 43 47 56 41
Staying the same 32 50 25 17 32 33 31 33 14 43 41 24 59
Decreasing 14 25 25 17 10 10 25 11 25 15 12 20 0
Base : Unwtd 481 4 4 47 50 116 64 54 28 21 51 25 17
Figure 572: N10. How effective is your government at solving problems that relate to you?
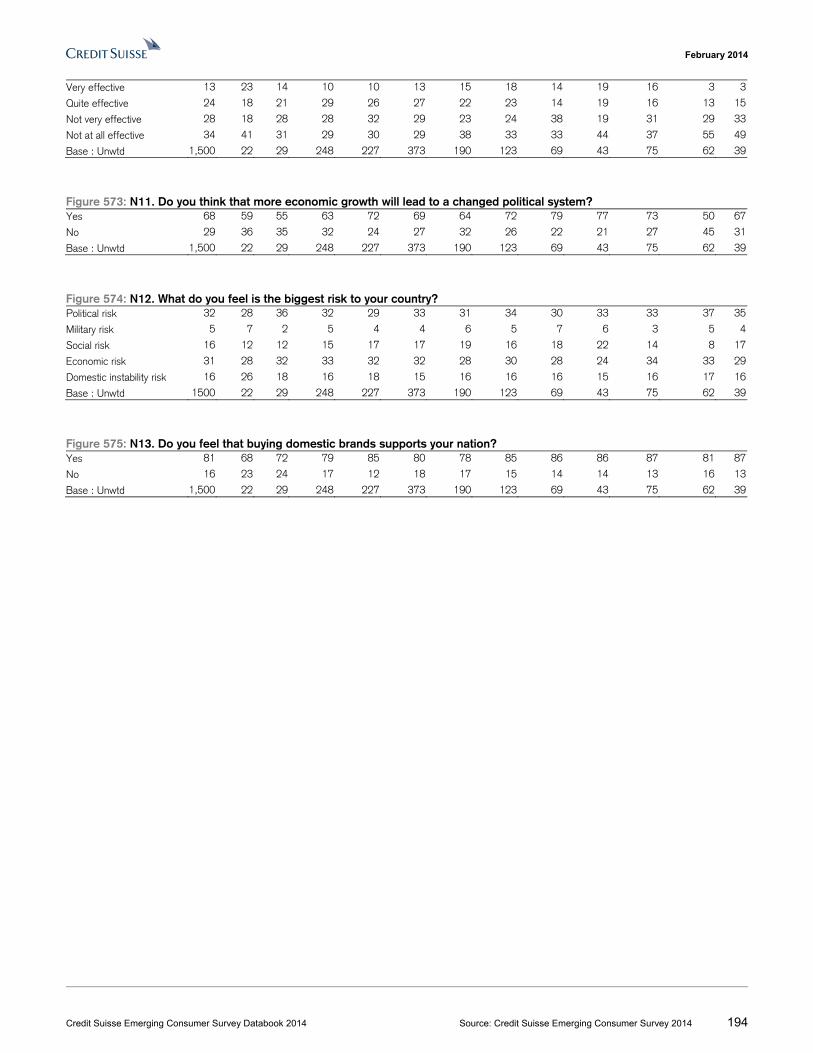
February 2014
Credit Suisse Emerging Consumer Survey Databook 2014 Source: Credit Suisse Emerging Consumer Survey 2014 194
Very effective 13 23 14 10 10 13 15 18 14 19 16 3 3
Quite effective 24 18 21 29 26 27 22 23 14 19 16 13 15
Not very effective 28 18 28 28 32 29 23 24 38 19 31 29 33
Not at all effective 34 41 31 29 30 29 38 33 33 44 37 55 49
Base : Unwtd 1,500 22 29 248 227 373 190 123 69 43 75 62 39
Figure 573: N11. Do you think that more economic growth will lead to a changed political system? Yes 68 59 55 63 72 69 64 72 79 77 73 50 67
No 29 36 35 32 24 27 32 26 22 21 27 45 31
Base : Unwtd 1,500 22 29 248 227 373 190 123 69 43 75 62 39
Figure 574: N12. What do you feel is the biggest risk to your country? Political risk 32 28 36 32 29 33 31 34 30 33 33 37 35
Military risk 5 7 2 5 4 4 6 5 7 6 3 5 4
Social risk 16 12 12 15 17 17 19 16 18 22 14 8 17
Economic risk 31 28 32 33 32 32 28 30 28 24 34 33 29
Domestic instability risk 16 26 18 16 18 15 16 16 16 15 16 17 16
Base : Unwtd 1500 22 29 248 227 373 190 123 69 43 75 62 39
Figure 575: N13. Do you feel that buying domestic brands supports your nation? Yes 81 68 72 79 85 80 78 85 86 86 87 81 87
No 16 23 24 17 12 18 17 15 14 14 13 16 13
Base : Unwtd 1,500 22 29 248 227 373 190 123 69 43 75 62 39
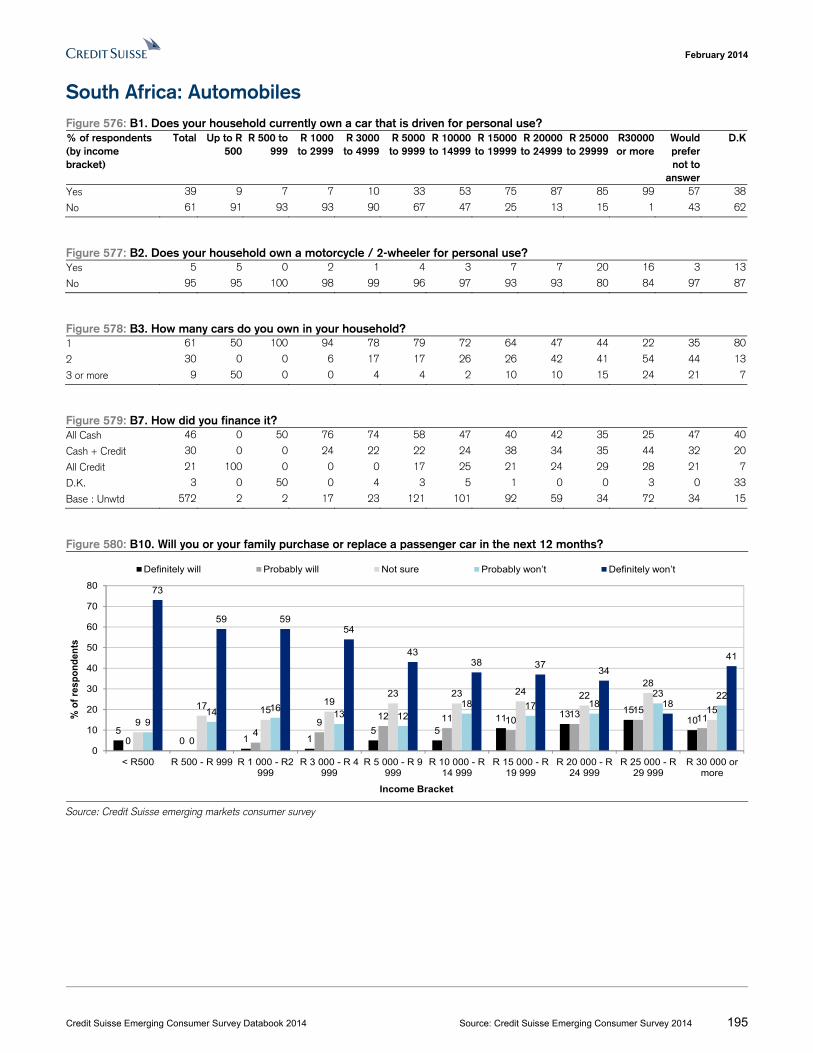
February 2014
Credit Suisse Emerging Consumer Survey Databook 2014 Source: Credit Suisse Emerging Consumer Survey 2014 195
South Africa: Automobiles Figure 576: B1. Does your household currently own a car that is driven for personal use? % of respondents (by income bracket)
Total Up to R 500
R 500 to 999
R 1000 to 2999
R 3000 to 4999
R 5000 to 9999
R 10000 to 14999
R 15000 to 19999
R 20000 to 24999
R 25000 to 29999
R30000 or more
Would prefer not to
answer
D.K
Yes 39 9 7 7 10 33 53 75 87 85 99 57 38
No 61 91 93 93 90 67 47 25 13 15 1 43 62
Figure 577: B2. Does your household own a motorcycle / 2-wheeler for personal use? Yes 5 5 0 2 1 4 3 7 7 20 16 3 13
No 95 95 100 98 99 96 97 93 93 80 84 97 87
Figure 578: B3. How many cars do you own in your household? 1 61 50 100 94 78 79 72 64 47 44 22 35 80
2 30 0 0 6 17 17 26 26 42 41 54 44 13
3 or more 9 50 0 0 4 4 2 10 10 15 24 21 7
Figure 579: B7. How did you finance it? All Cash 46 0 50 76 74 58 47 40 42 35 25 47 40
Cash + Credit 30 0 0 24 22 22 24 38 34 35 44 32 20
All Credit 21 100 0 0 0 17 25 21 24 29 28 21 7
D.K. 3 0 50 0 4 3 5 1 0 0 3 0 33
Base : Unwtd 572 2 2 17 23 121 101 92 59 34 72 34 15
Figure 580: B10. Will you or your family purchase or replace a passenger car in the next 12 months?
Source: Credit Suisse emerging markets consumer survey
50 1 1
5 511 13 15
10
0 04
912 11 10
13 15119
17 1519
23 23 24 2228
159
14 1613 12
18 17 1823 22
73
59 5954
4338 37
34
18
41
0
10
20
30
40
50
60
70
80
< R500 R 500 - R 999 R 1 000 - R2999
R 3 000 - R 4999
R 5 000 - R 9999
R 10 000 - R14 999
R 15 000 - R19 999
R 20 000 - R24 999
R 25 000 - R29 999
R 30 000 ormore
% o
f re
spo
nd
ents
Income Bracket
Definitely will Probably will Not sure Probably won’t Definitely won’t
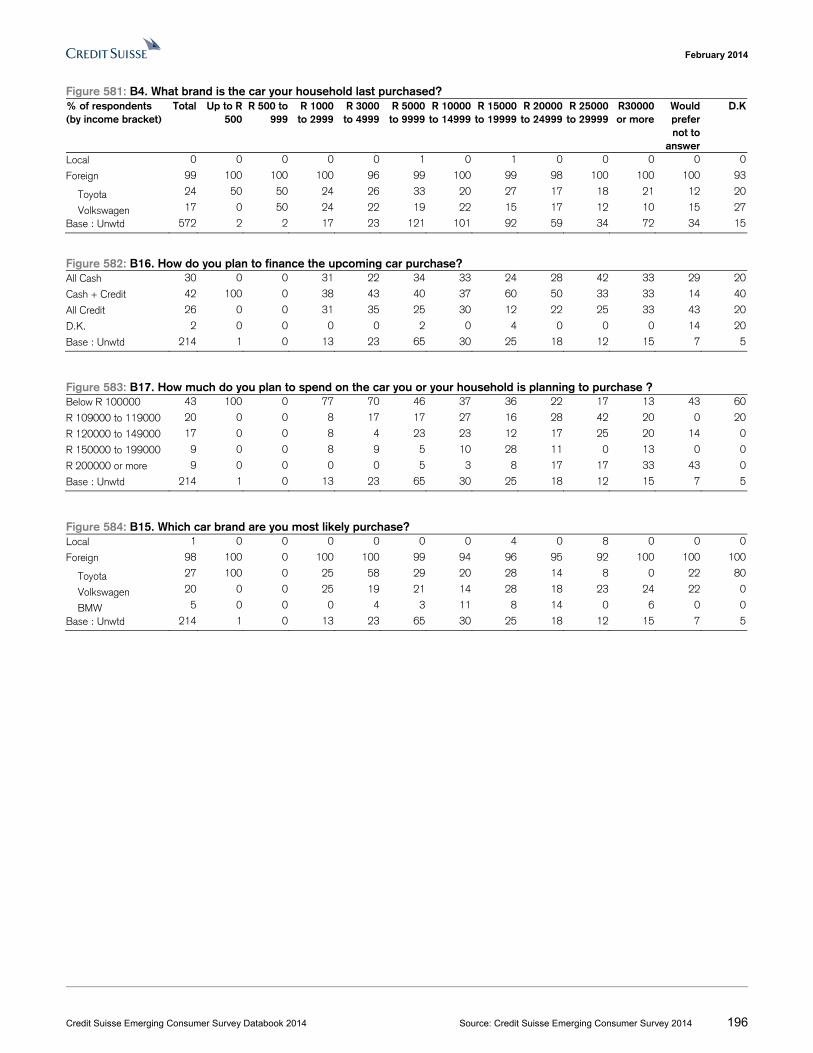
February 2014
Credit Suisse Emerging Consumer Survey Databook 2014 Source: Credit Suisse Emerging Consumer Survey 2014 196
Figure 581: B4. What brand is the car your household last purchased? % of respondents (by income bracket)
Total Up to R 500
R 500 to 999
R 1000 to 2999
R 3000 to 4999
R 5000 to 9999
R 10000 to 14999
R 15000 to 19999
R 20000 to 24999
R 25000 to 29999
R30000 or more
Would prefer not to
answer
D.K
Local 0 0 0 0 0 1 0 1 0 0 0 0 0
Foreign 99 100 100 100 96 99 100 99 98 100 100 100 93
Toyota 24 50 50 24 26 33 20 27 17 18 21 12 20
Volkswagen 17 0 50 24 22 19 22 15 17 12 10 15 27
Base : Unwtd 572 2 2 17 23 121 101 92 59 34 72 34 15
Figure 582: B16. How do you plan to finance the upcoming car purchase? All Cash 30 0 0 31 22 34 33 24 28 42 33 29 20
Cash + Credit 42 100 0 38 43 40 37 60 50 33 33 14 40
All Credit 26 0 0 31 35 25 30 12 22 25 33 43 20
D.K. 2 0 0 0 0 2 0 4 0 0 0 14 20
Base : Unwtd 214 1 0 13 23 65 30 25 18 12 15 7 5
Figure 583: B17. How much do you plan to spend on the car you or your household is planning to purchase ? Below R 100000 43 100 0 77 70 46 37 36 22 17 13 43 60
R 109000 to 119000 20 0 0 8 17 17 27 16 28 42 20 0 20
R 120000 to 149000 17 0 0 8 4 23 23 12 17 25 20 14 0
R 150000 to 199000 9 0 0 8 9 5 10 28 11 0 13 0 0
R 200000 or more 9 0 0 0 0 5 3 8 17 17 33 43 0
Base : Unwtd 214 1 0 13 23 65 30 25 18 12 15 7 5
Figure 584: B15. Which car brand are you most likely purchase? Local 1 0 0 0 0 0 0 4 0 8 0 0 0
Foreign 98 100 0 100 100 99 94 96 95 92 100 100 100
Toyota 27 100 0 25 58 29 20 28 14 8 0 22 80
Volkswagen 20 0 0 25 19 21 14 28 18 23 24 22 0
BMW 5 0 0 0 4 3 11 8 14 0 6 0 0
Base : Unwtd 214 1 0 13 23 65 30 25 18 12 15 7 5
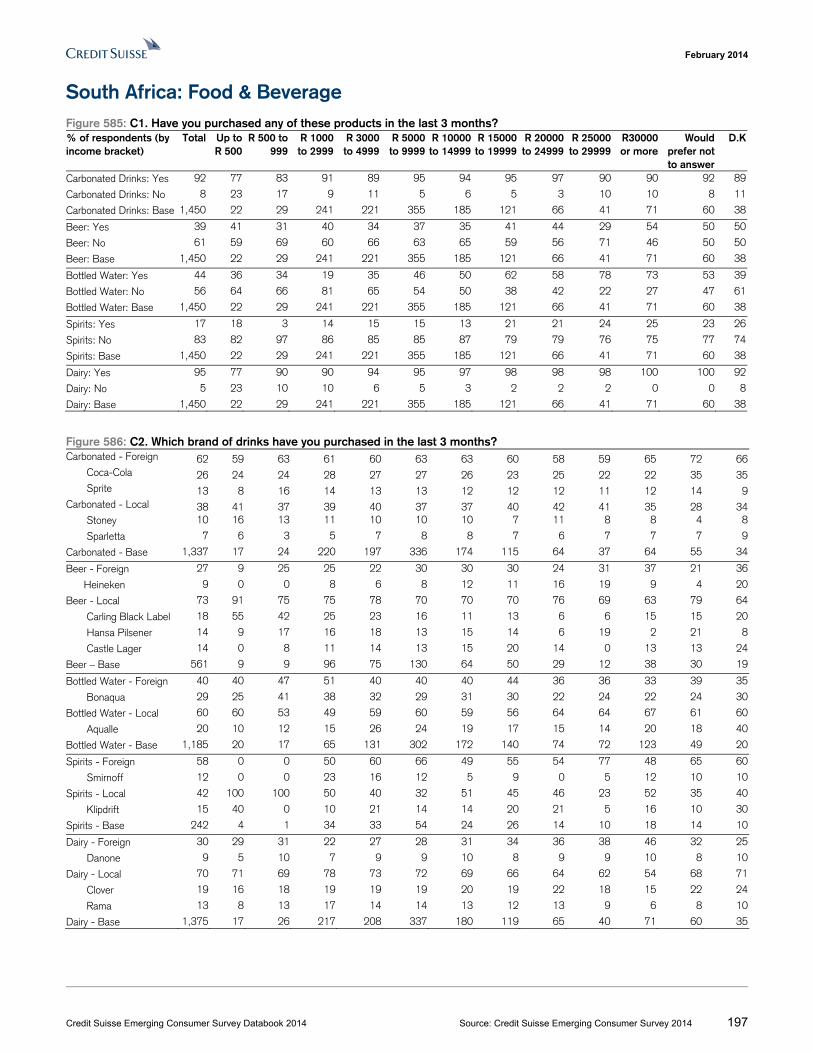
February 2014
Credit Suisse Emerging Consumer Survey Databook 2014 Source: Credit Suisse Emerging Consumer Survey 2014 197
South Africa: Food & Beverage Figure 585: C1. Have you purchased any of these products in the last 3 months? % of respondents (by income bracket)
Total Up to R 500
R 500 to 999
R 1000 to 2999
R 3000 to 4999
R 5000 to 9999
R 10000 to 14999
R 15000 to 19999
R 20000 to 24999
R 25000 to 29999
R30000 or more
Would prefer not to answer
D.K
Carbonated Drinks: Yes 92 77 83 91 89 95 94 95 97 90 90 92 89
Carbonated Drinks: No 8 23 17 9 11 5 6 5 3 10 10 8 11
Carbonated Drinks: Base 1,450 22 29 241 221 355 185 121 66 41 71 60 38
Beer: Yes 39 41 31 40 34 37 35 41 44 29 54 50 50
Beer: No 61 59 69 60 66 63 65 59 56 71 46 50 50
Beer: Base 1,450 22 29 241 221 355 185 121 66 41 71 60 38
Bottled Water: Yes 44 36 34 19 35 46 50 62 58 78 73 53 39
Bottled Water: No 56 64 66 81 65 54 50 38 42 22 27 47 61
Bottled Water: Base 1,450 22 29 241 221 355 185 121 66 41 71 60 38
Spirits: Yes 17 18 3 14 15 15 13 21 21 24 25 23 26
Spirits: No 83 82 97 86 85 85 87 79 79 76 75 77 74
Spirits: Base 1,450 22 29 241 221 355 185 121 66 41 71 60 38
Dairy: Yes 95 77 90 90 94 95 97 98 98 98 100 100 92
Dairy: No 5 23 10 10 6 5 3 2 2 2 0 0 8
Dairy: Base 1,450 22 29 241 221 355 185 121 66 41 71 60 38
Figure 586: C2. Which brand of drinks have you purchased in the last 3 months? Carbonated - Foreign 62 59 63 61 60 63 63 60 58 59 65 72 66 Coca-Cola 26 24 24 28 27 27 26 23 25 22 22 35 35 Sprite 13 8 16 14 13 13 12 12 12 11 12 14 9Carbonated - Local 38 41 37 39 40 37 37 40 42 41 35 28 34 Stoney 10 16 13 11 10 10 10 7 11 8 8 4 8
Sparletta 7 6 3 5 7 8 8 7 6 7 7 7 9
Carbonated - Base 1,337 17 24 220 197 336 174 115 64 37 64 55 34
Beer - Foreign 27 9 25 25 22 30 30 30 24 31 37 21 36
Heineken 9 0 0 8 6 8 12 11 16 19 9 4 20
Beer - Local 73 91 75 75 78 70 70 70 76 69 63 79 64
Carling Black Label 18 55 42 25 23 16 11 13 6 6 15 15 20
Hansa Pilsener 14 9 17 16 18 13 15 14 6 19 2 21 8
Castle Lager 14 0 8 11 14 13 15 20 14 0 13 13 24
Beer – Base 561 9 9 96 75 130 64 50 29 12 38 30 19
Bottled Water - Foreign 40 40 47 51 40 40 40 44 36 36 33 39 35
Bonaqua 29 25 41 38 32 29 31 30 22 24 22 24 30
Bottled Water - Local 60 60 53 49 59 60 59 56 64 64 67 61 60
Aqualle 20 10 12 15 26 24 19 17 15 14 20 18 40
Bottled Water - Base 1,185 20 17 65 131 302 172 140 74 72 123 49 20
Spirits - Foreign 58 0 0 50 60 66 49 55 54 77 48 65 60
Smirnoff 12 0 0 23 16 12 5 9 0 5 12 10 10
Spirits - Local 42 100 100 50 40 32 51 45 46 23 52 35 40
Klipdrift 15 40 0 10 21 14 14 20 21 5 16 10 30
Spirits - Base 242 4 1 34 33 54 24 26 14 10 18 14 10
Dairy - Foreign 30 29 31 22 27 28 31 34 36 38 46 32 25
Danone 9 5 10 7 9 9 10 8 9 9 10 8 10
Dairy - Local 70 71 69 78 73 72 69 66 64 62 54 68 71
Clover 19 16 18 19 19 19 20 19 22 18 15 22 24
Rama 13 8 13 17 14 14 13 12 13 9 6 8 10
Dairy - Base 1,375 17 26 217 208 337 180 119 65 40 71 60 35
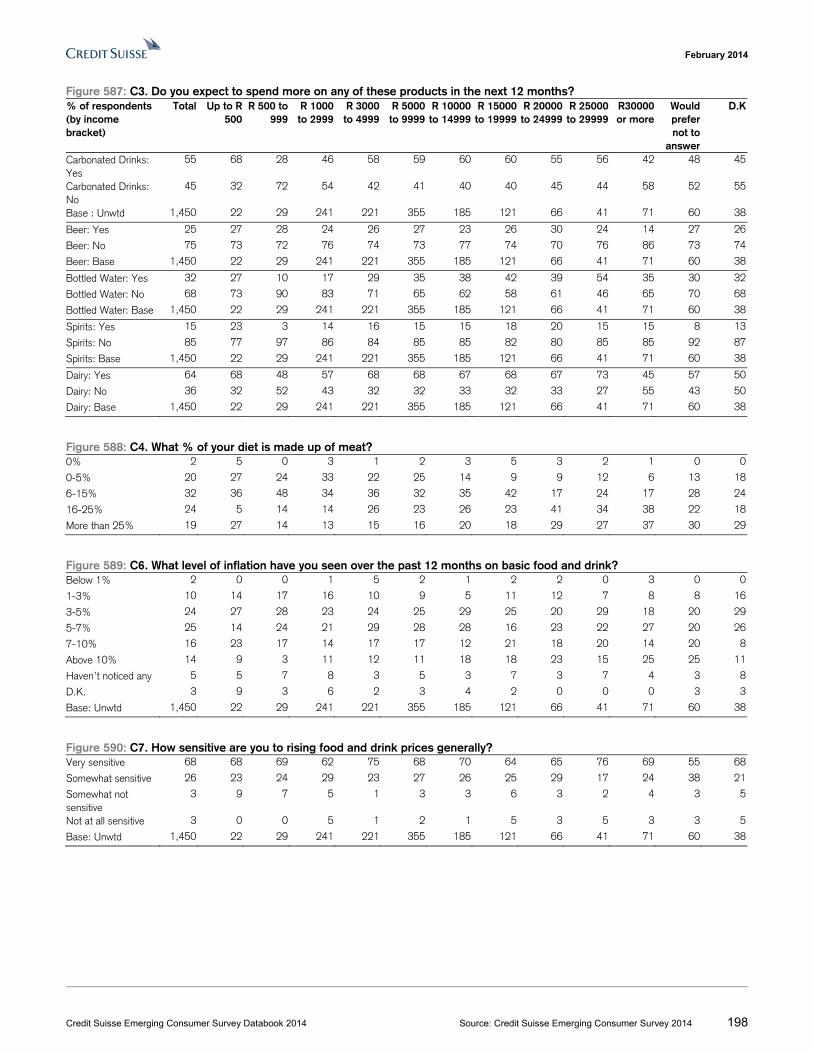
February 2014
Credit Suisse Emerging Consumer Survey Databook 2014 Source: Credit Suisse Emerging Consumer Survey 2014 198
Figure 587: C3. Do you expect to spend more on any of these products in the next 12 months? % of respondents (by income bracket)
Total Up to R 500
R 500 to 999
R 1000 to 2999
R 3000 to 4999
R 5000 to 9999
R 10000 to 14999
R 15000 to 19999
R 20000 to 24999
R 25000 to 29999
R30000 or more
Would prefer not to
answer
D.K
Carbonated Drinks: Yes
55 68 28 46 58 59 60 60 55 56 42 48 45
Carbonated Drinks: No
45 32 72 54 42 41 40 40 45 44 58 52 55
Base : Unwtd 1,450 22 29 241 221 355 185 121 66 41 71 60 38
Beer: Yes 25 27 28 24 26 27 23 26 30 24 14 27 26
Beer: No 75 73 72 76 74 73 77 74 70 76 86 73 74
Beer: Base 1,450 22 29 241 221 355 185 121 66 41 71 60 38
Bottled Water: Yes 32 27 10 17 29 35 38 42 39 54 35 30 32
Bottled Water: No 68 73 90 83 71 65 62 58 61 46 65 70 68
Bottled Water: Base 1,450 22 29 241 221 355 185 121 66 41 71 60 38
Spirits: Yes 15 23 3 14 16 15 15 18 20 15 15 8 13
Spirits: No 85 77 97 86 84 85 85 82 80 85 85 92 87
Spirits: Base 1,450 22 29 241 221 355 185 121 66 41 71 60 38
Dairy: Yes 64 68 48 57 68 68 67 68 67 73 45 57 50
Dairy: No 36 32 52 43 32 32 33 32 33 27 55 43 50
Dairy: Base 1,450 22 29 241 221 355 185 121 66 41 71 60 38
Figure 588: C4. What % of your diet is made up of meat? 0% 2 5 0 3 1 2 3 5 3 2 1 0 0
0-5% 20 27 24 33 22 25 14 9 9 12 6 13 18
6-15% 32 36 48 34 36 32 35 42 17 24 17 28 24
16-25% 24 5 14 14 26 23 26 23 41 34 38 22 18
More than 25% 19 27 14 13 15 16 20 18 29 27 37 30 29
Figure 589: C6. What level of inflation have you seen over the past 12 months on basic food and drink? Below 1% 2 0 0 1 5 2 1 2 2 0 3 0 0
1-3% 10 14 17 16 10 9 5 11 12 7 8 8 16
3-5% 24 27 28 23 24 25 29 25 20 29 18 20 29
5-7% 25 14 24 21 29 28 28 16 23 22 27 20 26
7-10% 16 23 17 14 17 17 12 21 18 20 14 20 8
Above 10% 14 9 3 11 12 11 18 18 23 15 25 25 11
Haven’t noticed any 5 5 7 8 3 5 3 7 3 7 4 3 8
D.K. 3 9 3 6 2 3 4 2 0 0 0 3 3
Base: Unwtd 1,450 22 29 241 221 355 185 121 66 41 71 60 38
Figure 590: C7. How sensitive are you to rising food and drink prices generally? Very sensitive 68 68 69 62 75 68 70 64 65 76 69 55 68
Somewhat sensitive 26 23 24 29 23 27 26 25 29 17 24 38 21
Somewhat not sensitive
3 9 7 5 1 3 3 6 3 2 4 3 5
Not at all sensitive 3 0 0 5 1 2 1 5 3 5 3 3 5
Base: Unwtd 1,450 22 29 241 221 355 185 121 66 41 71 60 38
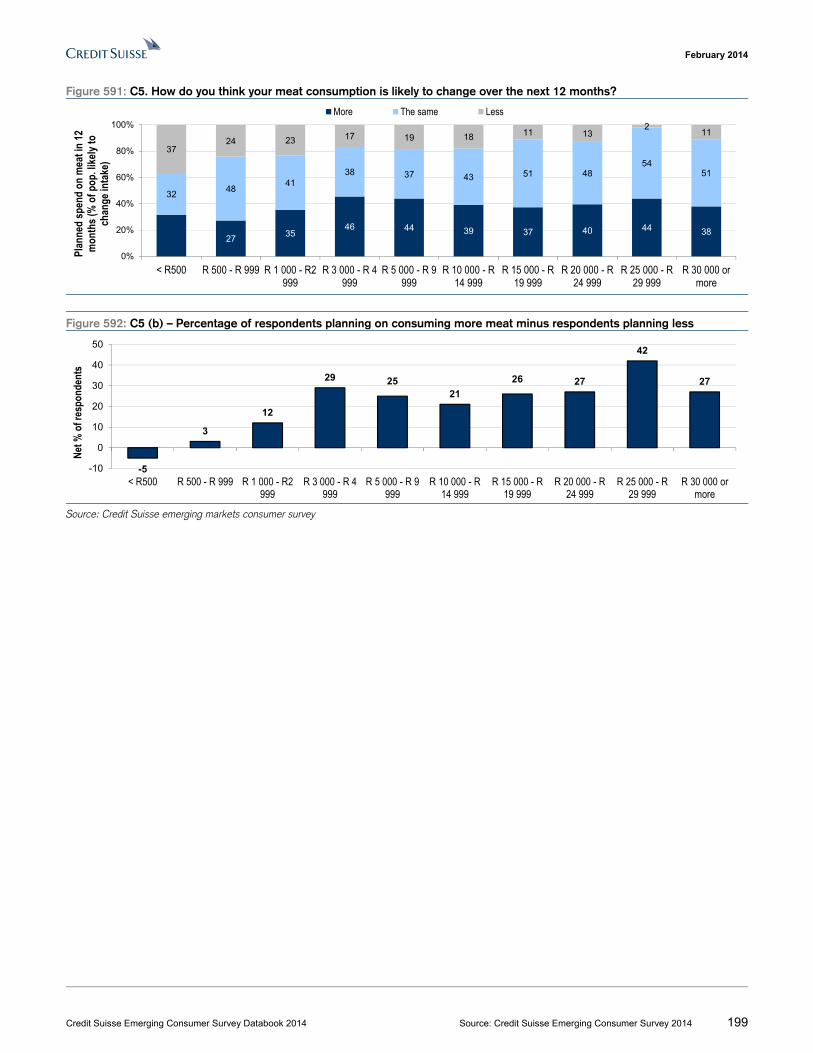
February 2014
Credit Suisse Emerging Consumer Survey Databook 2014 Source: Credit Suisse Emerging Consumer Survey 2014 199
Figure 591: C5. How do you think your meat consumption is likely to change over the next 12 months?
Figure 592: C5 (b) – Percentage of respondents planning on consuming more meat minus respondents planning less
Source: Credit Suisse emerging markets consumer survey
2735
46 44 39 37 40 44 38
3248
4138 37 43 51 48
5451
3724 23 17 19 18 11 13
211
0%
20%
40%
60%
80%
100%
< R500 R 500 - R 999 R 1 000 - R2999
R 3 000 - R 4999
R 5 000 - R 9999
R 10 000 - R14 999
R 15 000 - R19 999
R 20 000 - R24 999
R 25 000 - R29 999
R 30 000 ormore
Plan
ned
spen
d on
mea
t in
12
mon
ths (
% o
f pop
. like
ly to
ch
ange
inta
ke)
More The same Less
-5
3
12
29 2521
26 27
42
27
-10
0
10
20
30
40
50
< R500 R 500 - R 999 R 1 000 - R2999
R 3 000 - R 4999
R 5 000 - R 9999
R 10 000 - R14 999
R 15 000 - R19 999
R 20 000 - R24 999
R 25 000 - R29 999
R 30 000 ormore
Net %
of r
espo
nden
ts
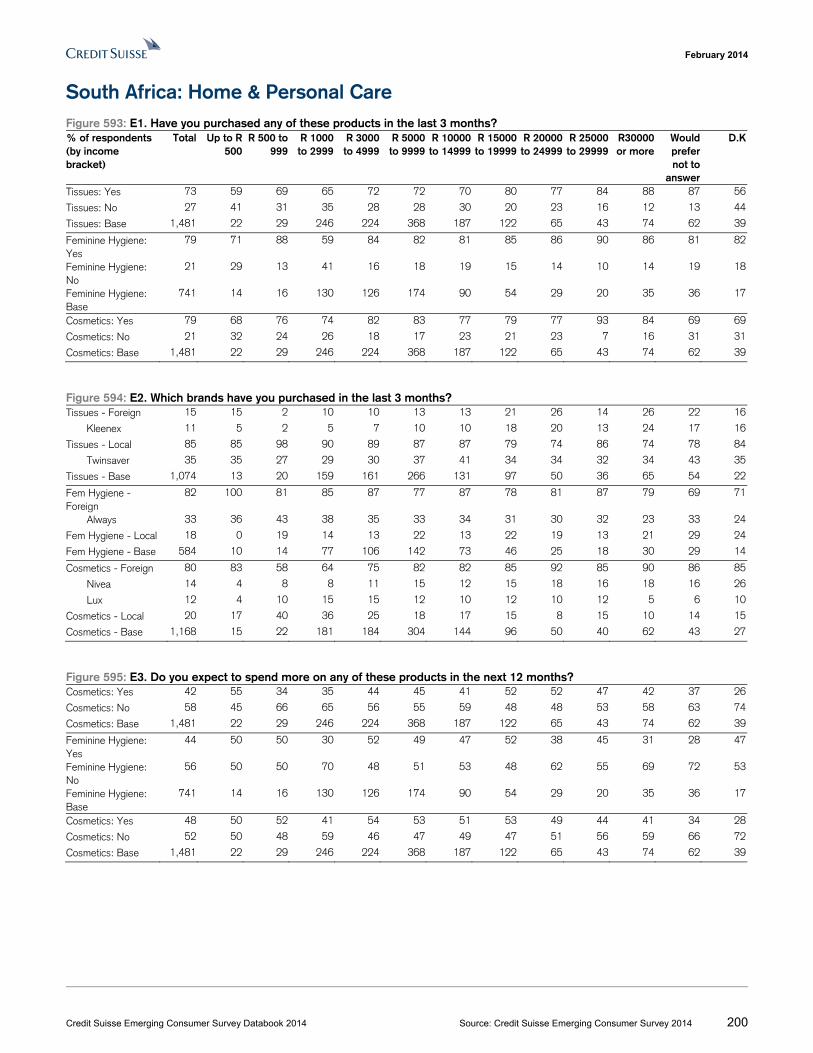
February 2014
Credit Suisse Emerging Consumer Survey Databook 2014 Source: Credit Suisse Emerging Consumer Survey 2014 200
South Africa: Home & Personal Care Figure 593: E1. Have you purchased any of these products in the last 3 months? % of respondents (by income bracket)
Total Up to R 500
R 500 to 999
R 1000 to 2999
R 3000 to 4999
R 5000 to 9999
R 10000 to 14999
R 15000 to 19999
R 20000 to 24999
R 25000 to 29999
R30000or more
Would prefer not to
answer
D.K
Tissues: Yes 73 59 69 65 72 72 70 80 77 84 88 87 56
Tissues: No 27 41 31 35 28 28 30 20 23 16 12 13 44
Tissues: Base 1,481 22 29 246 224 368 187 122 65 43 74 62 39
Feminine Hygiene: Yes
79 71 88 59 84 82 81 85 86 90 86 81 82
Feminine Hygiene: No
21 29 13 41 16 18 19 15 14 10 14 19 18
Feminine Hygiene: Base
741 14 16 130 126 174 90 54 29 20 35 36 17
Cosmetics: Yes 79 68 76 74 82 83 77 79 77 93 84 69 69
Cosmetics: No 21 32 24 26 18 17 23 21 23 7 16 31 31
Cosmetics: Base 1,481 22 29 246 224 368 187 122 65 43 74 62 39
Figure 594: E2. Which brands have you purchased in the last 3 months? Tissues - Foreign 15 15 2 10 10 13 13 21 26 14 26 22 16
Kleenex 11 5 2 5 7 10 10 18 20 13 24 17 16
Tissues - Local 85 85 98 90 89 87 87 79 74 86 74 78 84
Twinsaver 35 35 27 29 30 37 41 34 34 32 34 43 35
Tissues - Base 1,074 13 20 159 161 266 131 97 50 36 65 54 22
Fem Hygiene - Foreign
82 100 81 85 87 77 87 78 81 87 79 69 71
Always 33 36 43 38 35 33 34 31 30 32 23 33 24
Fem Hygiene - Local 18 0 19 14 13 22 13 22 19 13 21 29 24
Fem Hygiene - Base 584 10 14 77 106 142 73 46 25 18 30 29 14
Cosmetics - Foreign 80 83 58 64 75 82 82 85 92 85 90 86 85
Nivea 14 4 8 8 11 15 12 15 18 16 18 16 26
Lux 12 4 10 15 15 12 10 12 10 12 5 6 10
Cosmetics - Local 20 17 40 36 25 18 17 15 8 15 10 14 15
Cosmetics - Base 1,168 15 22 181 184 304 144 96 50 40 62 43 27
Figure 595: E3. Do you expect to spend more on any of these products in the next 12 months? Cosmetics: Yes 42 55 34 35 44 45 41 52 52 47 42 37 26
Cosmetics: No 58 45 66 65 56 55 59 48 48 53 58 63 74
Cosmetics: Base 1,481 22 29 246 224 368 187 122 65 43 74 62 39
Feminine Hygiene: Yes
44 50 50 30 52 49 47 52 38 45 31 28 47
Feminine Hygiene: No
56 50 50 70 48 51 53 48 62 55 69 72 53
Feminine Hygiene: Base
741 14 16 130 126 174 90 54 29 20 35 36 17
Cosmetics: Yes 48 50 52 41 54 53 51 53 49 44 41 34 28
Cosmetics: No 52 50 48 59 46 47 49 47 51 56 59 66 72
Cosmetics: Base 1,481 22 29 246 224 368 187 122 65 43 74 62 39
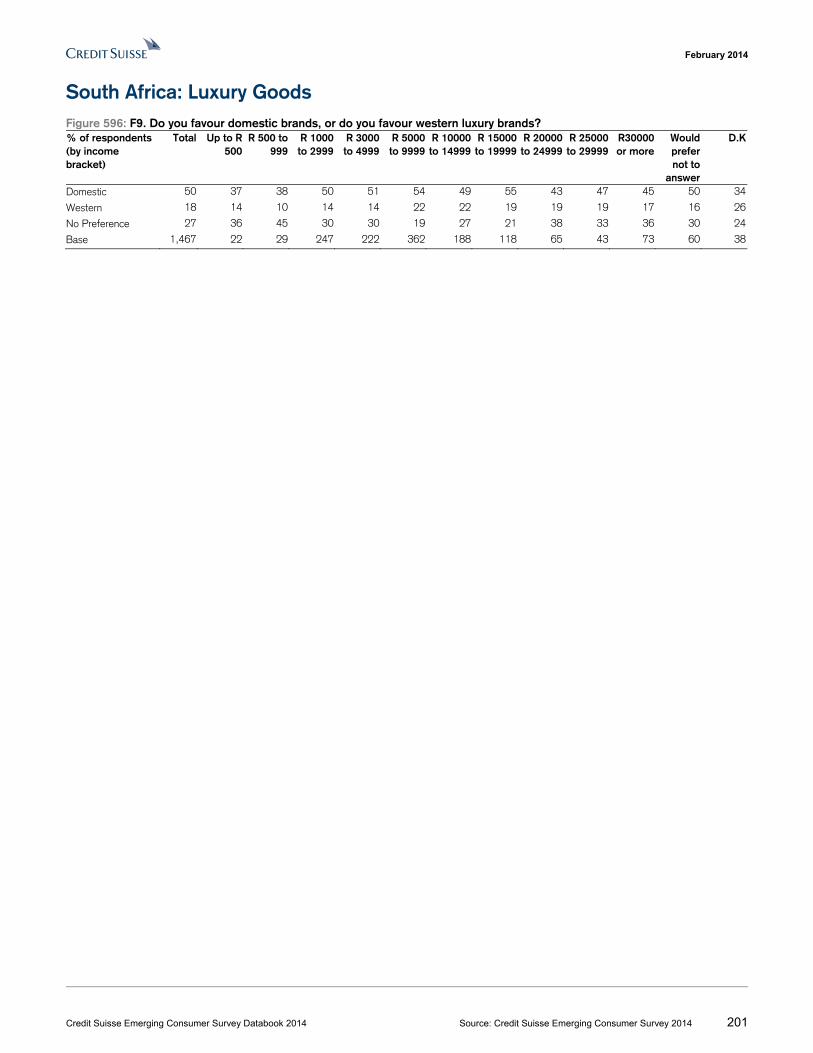
February 2014
Credit Suisse Emerging Consumer Survey Databook 2014 Source: Credit Suisse Emerging Consumer Survey 2014 201
South Africa: Luxury Goods Figure 596: F9. Do you favour domestic brands, or do you favour western luxury brands? % of respondents (by income bracket)
Total Up to R 500
R 500 to 999
R 1000 to 2999
R 3000 to 4999
R 5000 to 9999
R 10000 to 14999
R 15000 to 19999
R 20000 to 24999
R 25000 to 29999
R30000 or more
Would prefer not to
answer
D.K
Domestic 50 37 38 50 51 54 49 55 43 47 45 50 34
Western 18 14 10 14 14 22 22 19 19 19 17 16 26
No Preference 27 36 45 30 30 19 27 21 38 33 36 30 24
Base 1,467 22 29 247 222 362 188 118 65 43 73 60 38
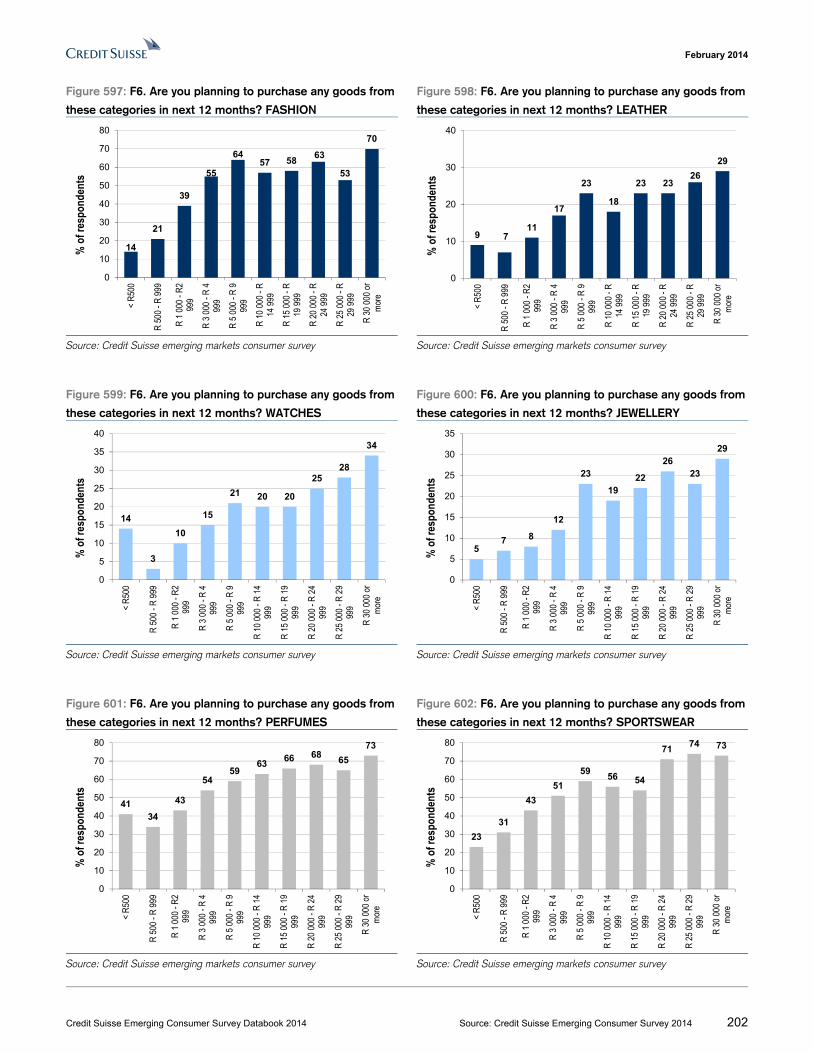
February 2014
Credit Suisse Emerging Consumer Survey Databook 2014 Source: Credit Suisse Emerging Consumer Survey 2014 202
Figure 597: F6. Are you planning to purchase any goods from
these categories in next 12 months? FASHION
Figure 598: F6. Are you planning to purchase any goods from
these categories in next 12 months? LEATHER
Source: Credit Suisse emerging markets consumer survey Source: Credit Suisse emerging markets consumer survey
Figure 599: F6. Are you planning to purchase any goods from
these categories in next 12 months? WATCHES
Figure 600: F6. Are you planning to purchase any goods from
these categories in next 12 months? JEWELLERY
Source: Credit Suisse emerging markets consumer survey Source: Credit Suisse emerging markets consumer survey
Figure 601: F6. Are you planning to purchase any goods from
these categories in next 12 months? PERFUMES
Figure 602: F6. Are you planning to purchase any goods from
these categories in next 12 months? SPORTSWEAR
Source: Credit Suisse emerging markets consumer survey Source: Credit Suisse emerging markets consumer survey
14
21
39
55
6457 58
63
53
70
0
10
20
30
40
50
60
70
80<
R50
0
R 5
00 -
R 9
99
R 1
000
- R
299
9
R 3
000
- R
499
9
R 5
000
- R
999
9
R 1
0 00
0 - R
14 9
99
R 1
5 00
0 - R
19 9
99
R 2
0 00
0 - R
24 9
99
R 2
5 00
0 - R
29 9
99
R 3
0 00
0 or
mor
e
% o
f res
pond
ents
9 711
17
23
18
23 2326
29
0
10
20
30
40
< R
500
R 5
00 -
R 9
99
R 1
000
- R
299
9
R 3
000
- R
499
9
R 5
000
- R
999
9
R 1
0 00
0 - R
14 9
99
R 1
5 00
0 - R
19 9
99
R 2
0 00
0 - R
24 9
99
R 2
5 00
0 - R
29 9
99
R 3
0 00
0 or
mor
e
% o
f res
pond
ents
14
3
10
15
21 20 20
2528
34
0
5
10
15
20
25
30
35
40
< R
500
R 5
00 -
R 9
99
R 1
000
- R
299
9
R 3
000
- R
499
9
R 5
000
- R
999
9
R 1
0 00
0 - R
14
999
R 1
5 00
0 - R
19
999
R 2
0 00
0 - R
24
999
R 2
5 00
0 - R
29
999
R 3
0 00
0 or
mor
e
% o
f res
pond
ents
57 8
12
23
1922
2623
29
0
5
10
15
20
25
30
35
< R
500
R 5
00 -
R 9
99
R 1
000
- R
299
9
R 3
000
- R
499
9
R 5
000
- R
999
9
R 1
0 00
0 - R
14
999
R 1
5 00
0 - R
19
999
R 2
0 00
0 - R
24
999
R 2
5 00
0 - R
29
999
R 3
0 00
0 or
mor
e
% o
f res
pond
ents
4134
43
5459
6366 68
65
73
0
10
20
30
40
50
60
70
80
< R
500
R 5
00 -
R 9
99
R 1
000
- R
299
9
R 3
000
- R
499
9
R 5
000
- R
999
9
R 1
0 00
0 - R
14
999
R 1
5 00
0 - R
19
999
R 2
0 00
0 - R
24
999
R 2
5 00
0 - R
29
999
R 3
0 00
0 or
mor
e
% o
f res
pond
ents
23
31
43
51
5956 54
7174 73
0
10
20
30
40
50
60
70
80
< R
500
R 5
00 -
R 9
99
R 1
000
- R
299
9
R 3
000
- R
499
9
R 5
000
- R
999
9
R 1
0 00
0 - R
14
999
R 1
5 00
0 - R
19
999
R 2
0 00
0 - R
24
999
R 2
5 00
0 - R
29
999
R 3
0 00
0 or
mor
e
% o
f res
pond
ents
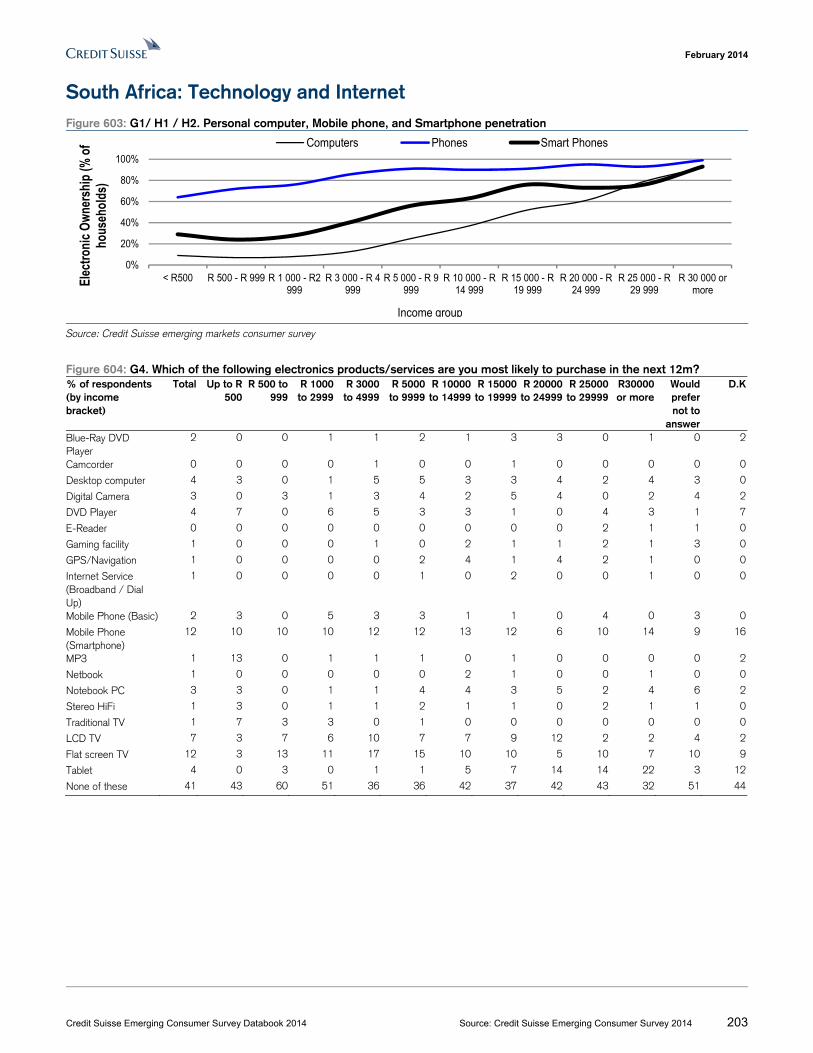
February 2014
Credit Suisse Emerging Consumer Survey Databook 2014 Source: Credit Suisse Emerging Consumer Survey 2014 203
South Africa: Technology and Internet Figure 603: G1/ H1 / H2. Personal computer, Mobile phone, and Smartphone penetration
Source: Credit Suisse emerging markets consumer survey
Figure 604: G4. Which of the following electronics products/services are you most likely to purchase in the next 12m? % of respondents (by income bracket)
Total Up to R 500
R 500 to 999
R 1000 to 2999
R 3000 to 4999
R 5000 to 9999
R 10000 to 14999
R 15000 to 19999
R 20000 to 24999
R 25000 to 29999
R30000 or more
Would prefer not to
answer
D.K
Blue-Ray DVD Player
2 0 0 1 1 2 1 3 3 0 1 0 2
Camcorder 0 0 0 0 1 0 0 1 0 0 0 0 0
Desktop computer 4 3 0 1 5 5 3 3 4 2 4 3 0
Digital Camera 3 0 3 1 3 4 2 5 4 0 2 4 2
DVD Player 4 7 0 6 5 3 3 1 0 4 3 1 7
E-Reader 0 0 0 0 0 0 0 0 0 2 1 1 0
Gaming facility 1 0 0 0 1 0 2 1 1 2 1 3 0
GPS/Navigation 1 0 0 0 0 2 4 1 4 2 1 0 0
Internet Service (Broadband / Dial Up)
1 0 0 0 0 1 0 2 0 0 1 0 0
Mobile Phone (Basic) 2 3 0 5 3 3 1 1 0 4 0 3 0
Mobile Phone (Smartphone)
12 10 10 10 12 12 13 12 6 10 14 9 16
MP3 1 13 0 1 1 1 0 1 0 0 0 0 2
Netbook 1 0 0 0 0 0 2 1 0 0 1 0 0
Notebook PC 3 3 0 1 1 4 4 3 5 2 4 6 2
Stereo HiFi 1 3 0 1 1 2 1 1 0 2 1 1 0
Traditional TV 1 7 3 3 0 1 0 0 0 0 0 0 0
LCD TV 7 3 7 6 10 7 7 9 12 2 2 4 2
Flat screen TV 12 3 13 11 17 15 10 10 5 10 7 10 9
Tablet 4 0 3 0 1 1 5 7 14 14 22 3 12
None of these 41 43 60 51 36 36 42 37 42 43 32 51 44
0%
20%
40%
60%
80%
100%
< R500 R 500 - R 999 R 1 000 - R2999
R 3 000 - R 4999
R 5 000 - R 9999
R 10 000 - R14 999
R 15 000 - R19 999
R 20 000 - R24 999
R 25 000 - R29 999
R 30 000 ormore
Elec
tronic
Own
ersh
ip (%
of
hous
ehold
s)
Computers Phones Smart Phones
Income group
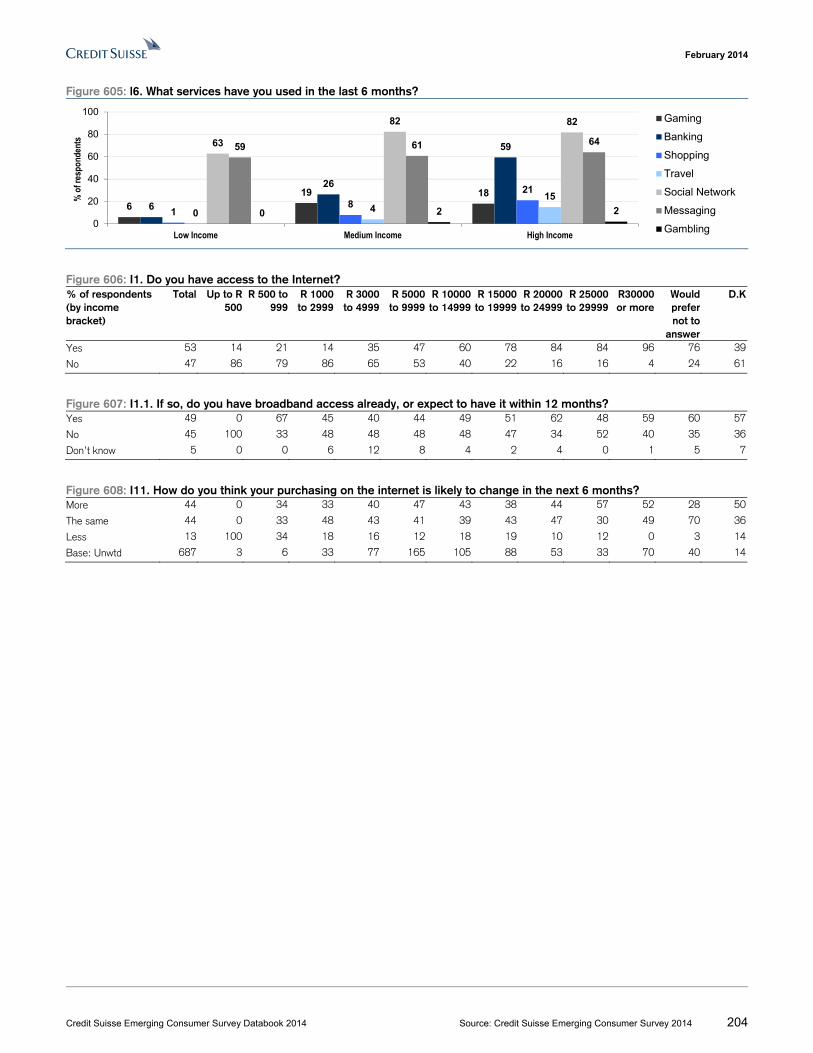
February 2014
Credit Suisse Emerging Consumer Survey Databook 2014 Source: Credit Suisse Emerging Consumer Survey 2014 204
Figure 605: l6. What services have you used in the last 6 months?
Figure 606: I1. Do you have access to the Internet? % of respondents (by income bracket)
Total Up to R 500
R 500 to 999
R 1000 to 2999
R 3000 to 4999
R 5000 to 9999
R 10000 to 14999
R 15000 to 19999
R 20000 to 24999
R 25000 to 29999
R30000 or more
Would prefer not to
answer
D.K
Yes 53 14 21 14 35 47 60 78 84 84 96 76 39
No 47 86 79 86 65 53 40 22 16 16 4 24 61
Figure 607: I1.1. If so, do you have broadband access already, or expect to have it within 12 months? Yes 49 0 67 45 40 44 49 51 62 48 59 60 57
No 45 100 33 48 48 48 48 47 34 52 40 35 36
Don’t know 5 0 0 6 12 8 4 2 4 0 1 5 7
Figure 608: I11. How do you think your purchasing on the internet is likely to change in the next 6 months? More 44 0 34 33 40 47 43 38 44 57 52 28 50
The same 44 0 33 48 43 41 39 43 47 30 49 70 36
Less 13 100 34 18 16 12 18 19 10 12 0 3 14
Base: Unwtd 687 3 6 33 77 165 105 88 53 33 70 40 14
6
19 186
26
59
18
21
0 415
63
82 82
59 61 64
0 2 20
20
40
60
80
100
Low Income Medium Income High Income
% o
f res
pond
ents
Gaming
Banking
Shopping
Travel
Social Network
Messaging
Gambling
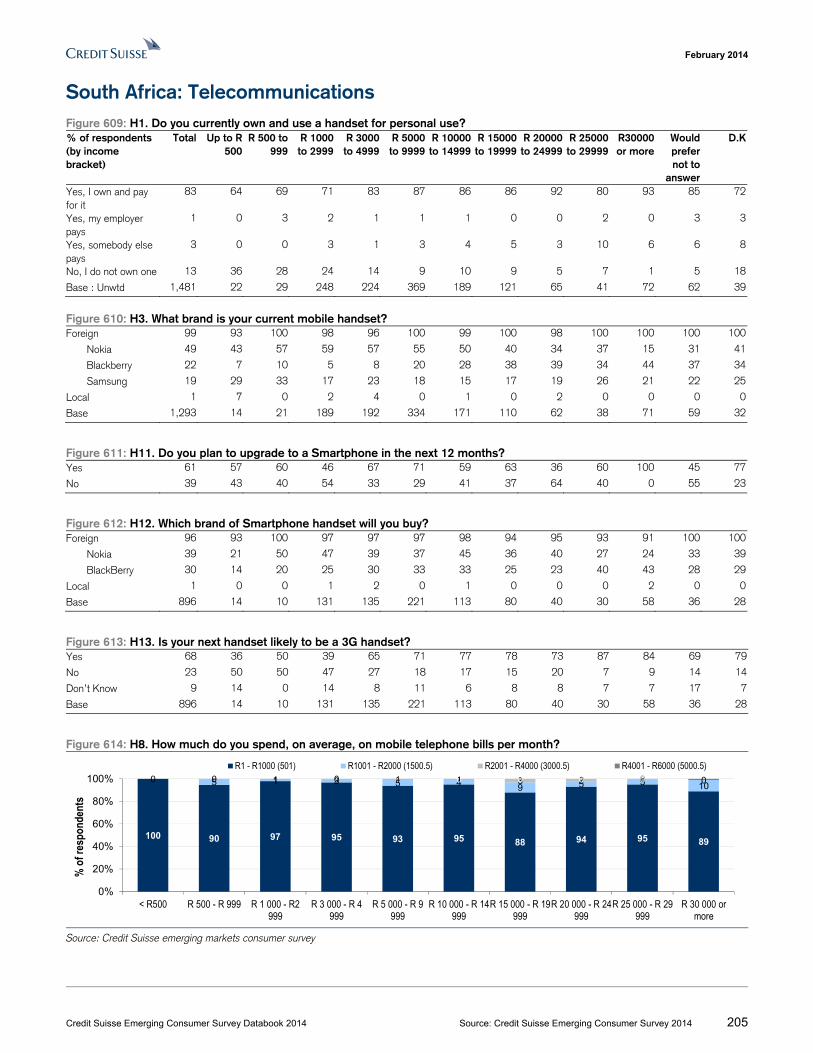
February 2014
Credit Suisse Emerging Consumer Survey Databook 2014 Source: Credit Suisse Emerging Consumer Survey 2014 205
South Africa: Telecommunications Figure 609: H1. Do you currently own and use a handset for personal use? % of respondents (by income bracket)
Total Up to R 500
R 500 to 999
R 1000 to 2999
R 3000 to 4999
R 5000 to 9999
R 10000 to 14999
R 15000 to 19999
R 20000 to 24999
R 25000 to 29999
R30000 or more
Would prefer not to
answer
D.K
Yes, I own and pay for it
83 64 69 71 83 87 86 86 92 80 93 85 72
Yes, my employer pays
1 0 3 2 1 1 1 0 0 2 0 3 3
Yes, somebody else pays
3 0 0 3 1 3 4 5 3 10 6 6 8
No, I do not own one 13 36 28 24 14 9 10 9 5 7 1 5 18
Base : Unwtd 1,481 22 29 248 224 369 189 121 65 41 72 62 39
Figure 610: H3. What brand is your current mobile handset? Foreign 99 93 100 98 96 100 99 100 98 100 100 100 100
Nokia 49 43 57 59 57 55 50 40 34 37 15 31 41
Blackberry 22 7 10 5 8 20 28 38 39 34 44 37 34
Samsung 19 29 33 17 23 18 15 17 19 26 21 22 25
Local 1 7 0 2 4 0 1 0 2 0 0 0 0
Base 1,293 14 21 189 192 334 171 110 62 38 71 59 32
Figure 611: H11. Do you plan to upgrade to a Smartphone in the next 12 months? Yes 61 57 60 46 67 71 59 63 36 60 100 45 77
No 39 43 40 54 33 29 41 37 64 40 0 55 23
Figure 612: H12. Which brand of Smartphone handset will you buy? Foreign 96 93 100 97 97 97 98 94 95 93 91 100 100
Nokia 39 21 50 47 39 37 45 36 40 27 24 33 39
BlackBerry 30 14 20 25 30 33 33 25 23 40 43 28 29
Local 1 0 0 1 2 0 1 0 0 0 2 0 0
Base 896 14 10 131 135 221 113 80 40 30 58 36 28
Figure 613: H13. Is your next handset likely to be a 3G handset? Yes 68 36 50 39 65 71 77 78 73 87 84 69 79
No 23 50 50 47 27 18 17 15 20 7 9 14 14
Don’t Know 9 14 0 14 8 11 6 8 8 7 7 17 7
Base 896 14 10 131 135 221 113 80 40 30 58 36 28
Figure 614: H8. How much do you spend, on average, on mobile telephone bills per month?
Source: Credit Suisse emerging markets consumer survey
100 90 97 95 93 95 88 94 95 89
0 5 1 3 5 4 9 5 5 100 1 0 1 1 3 2 0 00 0 0 0
0%
20%
40%
60%
80%
100%
< R500 R 500 - R 999 R 1 000 - R2999
R 3 000 - R 4999
R 5 000 - R 9999
R 10 000 - R 14999
R 15 000 - R 19999
R 20 000 - R 24999
R 25 000 - R 29999
R 30 000 ormore
% o
f res
pond
ents
R1 - R1000 (501) R1001 - R2000 (1500.5) R2001 - R4000 (3000.5) R4001 - R6000 (5000.5)
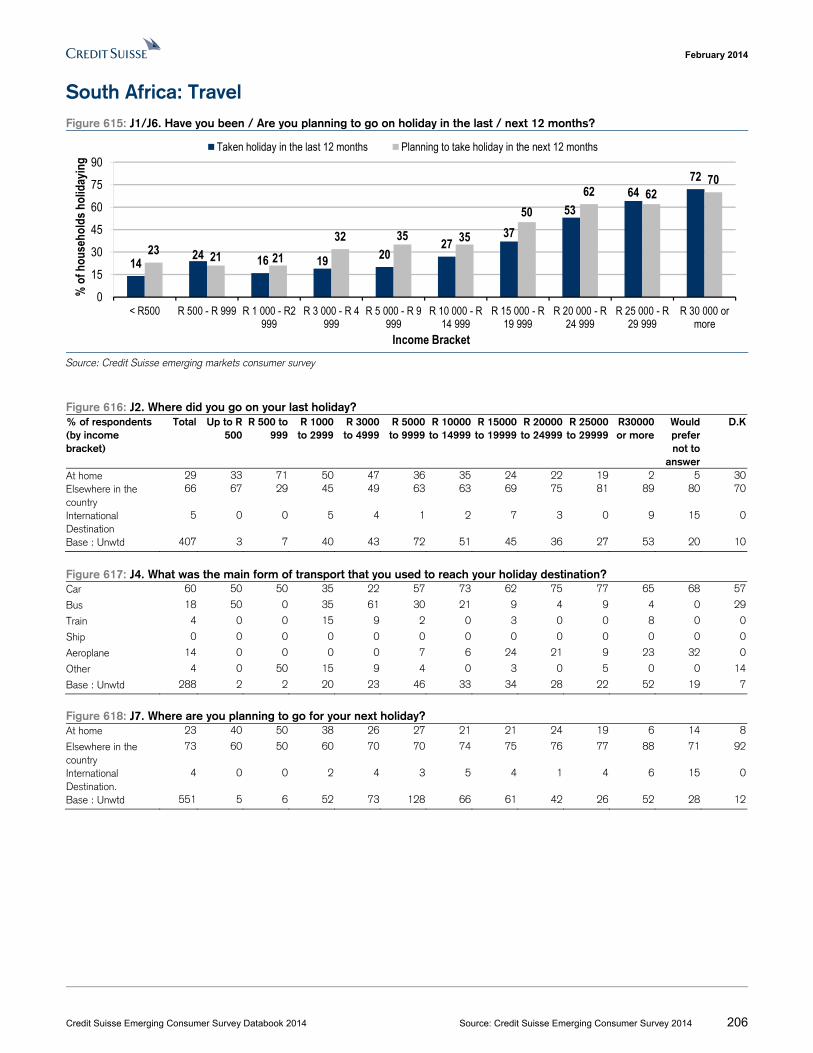
February 2014
Credit Suisse Emerging Consumer Survey Databook 2014 Source: Credit Suisse Emerging Consumer Survey 2014 206
South Africa: Travel Figure 615: J1/J6. Have you been / Are you planning to go on holiday in the last / next 12 months?
Source: Credit Suisse emerging markets consumer survey
Figure 616: J2. Where did you go on your last holiday? % of respondents (by income bracket)
Total Up to R 500
R 500 to 999
R 1000 to 2999
R 3000 to 4999
R 5000 to 9999
R 10000 to 14999
R 15000 to 19999
R 20000 to 24999
R 25000 to 29999
R30000 or more
Would prefer not to
answer
D.K
At home 29 33 71 50 47 36 35 24 22 19 2 5 30Elsewhere in the country
66 67 29 45 49 63 63 69 75 81 89 80 70
International Destination
5 0 0 5 4 1 2 7 3 0 9 15 0
Base : Unwtd 407 3 7 40 43 72 51 45 36 27 53 20 10
Figure 617: J4. What was the main form of transport that you used to reach your holiday destination? Car 60 50 50 35 22 57 73 62 75 77 65 68 57
Bus 18 50 0 35 61 30 21 9 4 9 4 0 29
Train 4 0 0 15 9 2 0 3 0 0 8 0 0
Ship 0 0 0 0 0 0 0 0 0 0 0 0 0
Aeroplane 14 0 0 0 0 7 6 24 21 9 23 32 0
Other 4 0 50 15 9 4 0 3 0 5 0 0 14
Base : Unwtd 288 2 2 20 23 46 33 34 28 22 52 19 7
Figure 618: J7. Where are you planning to go for your next holiday? At home 23 40 50 38 26 27 21 21 24 19 6 14 8
Elsewhere in the country
73 60 50 60 70 70 74 75 76 77 88 71 92
International Destination.
4 0 0 2 4 3 5 4 1 4 6 15 0
Base : Unwtd 551 5 6 52 73 128 66 61 42 26 52 28 12
14 24 16 19 2027
37
5364
72
23 21 2132 35 35
5062 62
70
0
15
30
45
60
75
90
< R500 R 500 - R 999 R 1 000 - R2999
R 3 000 - R 4999
R 5 000 - R 9999
R 10 000 - R14 999
R 15 000 - R19 999
R 20 000 - R24 999
R 25 000 - R29 999
R 30 000 ormore
% o
f hou
seho
lds h
olid
ayin
g
Income Bracket
Taken holiday in the last 12 months Planning to take holiday in the next 12 months
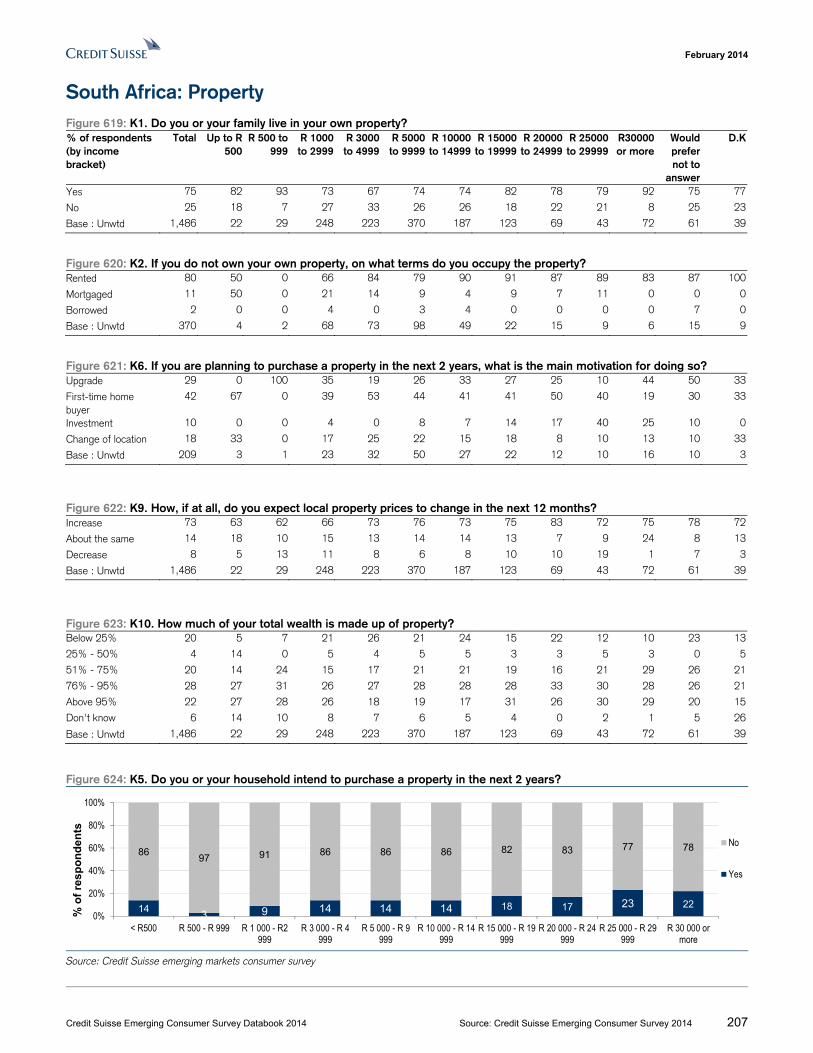
February 2014
Credit Suisse Emerging Consumer Survey Databook 2014 Source: Credit Suisse Emerging Consumer Survey 2014 207
South Africa: Property Figure 619: K1. Do you or your family live in your own property? % of respondents (by income bracket)
Total Up to R 500
R 500 to 999
R 1000 to 2999
R 3000 to 4999
R 5000 to 9999
R 10000 to 14999
R 15000 to 19999
R 20000 to 24999
R 25000 to 29999
R30000 or more
Would prefer not to
answer
D.K
Yes 75 82 93 73 67 74 74 82 78 79 92 75 77
No 25 18 7 27 33 26 26 18 22 21 8 25 23
Base : Unwtd 1,486 22 29 248 223 370 187 123 69 43 72 61 39
Figure 620: K2. If you do not own your own property, on what terms do you occupy the property? Rented 80 50 0 66 84 79 90 91 87 89 83 87 100
Mortgaged 11 50 0 21 14 9 4 9 7 11 0 0 0
Borrowed 2 0 0 4 0 3 4 0 0 0 0 7 0
Base : Unwtd 370 4 2 68 73 98 49 22 15 9 6 15 9
Figure 621: K6. If you are planning to purchase a property in the next 2 years, what is the main motivation for doing so? Upgrade 29 0 100 35 19 26 33 27 25 10 44 50 33
First-time home buyer
42 67 0 39 53 44 41 41 50 40 19 30 33
Investment 10 0 0 4 0 8 7 14 17 40 25 10 0
Change of location 18 33 0 17 25 22 15 18 8 10 13 10 33
Base : Unwtd 209 3 1 23 32 50 27 22 12 10 16 10 3
Figure 622: K9. How, if at all, do you expect local property prices to change in the next 12 months? Increase 73 63 62 66 73 76 73 75 83 72 75 78 72
About the same 14 18 10 15 13 14 14 13 7 9 24 8 13
Decrease 8 5 13 11 8 6 8 10 10 19 1 7 3
Base : Unwtd 1,486 22 29 248 223 370 187 123 69 43 72 61 39
Figure 623: K10. How much of your total wealth is made up of property? Below 25% 20 5 7 21 26 21 24 15 22 12 10 23 13
25% - 50% 4 14 0 5 4 5 5 3 3 5 3 0 5
51% - 75% 20 14 24 15 17 21 21 19 16 21 29 26 21
76% - 95% 28 27 31 26 27 28 28 28 33 30 28 26 21
Above 95% 22 27 28 26 18 19 17 31 26 30 29 20 15
Don't know 6 14 10 8 7 6 5 4 0 2 1 5 26
Base : Unwtd 1,486 22 29 248 223 370 187 123 69 43 72 61 39
Figure 624: K5. Do you or your household intend to purchase a property in the next 2 years?
Source: Credit Suisse emerging markets consumer survey
143 9 14 14 14 18 17 23 22
8697 91 86 86 86 82 83 77 78
0%
20%
40%
60%
80%
100%
< R500 R 500 - R 999 R 1 000 - R2999
R 3 000 - R 4999
R 5 000 - R 9999
R 10 000 - R 14999
R 15 000 - R 19999
R 20 000 - R 24999
R 25 000 - R 29999
R 30 000 ormore
% o
f re
sp
on
de
nts
No
Yes
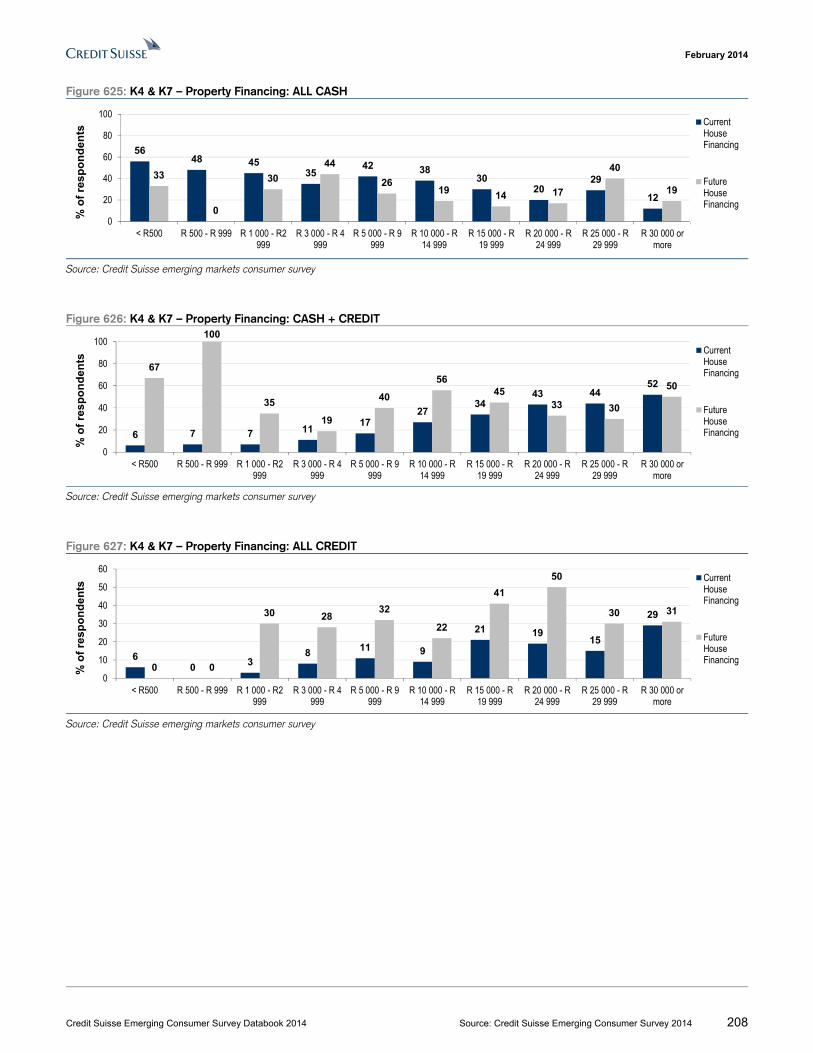
February 2014
Credit Suisse Emerging Consumer Survey Databook 2014 Source: Credit Suisse Emerging Consumer Survey 2014 208
Figure 625: K4 & K7 – Property Financing: ALL CASH
Source: Credit Suisse emerging markets consumer survey
Figure 626: K4 & K7 – Property Financing: CASH + CREDIT
Source: Credit Suisse emerging markets consumer survey
Figure 627: K4 & K7 – Property Financing: ALL CREDIT
Source: Credit Suisse emerging markets consumer survey
5648 45
3542 38
3020
29
12
33
0
30
44
2619 14 17
40
19
0
20
40
60
80
100
< R500 R 500 - R 999 R 1 000 - R2999
R 3 000 - R 4999
R 5 000 - R 9999
R 10 000 - R14 999
R 15 000 - R19 999
R 20 000 - R24 999
R 25 000 - R29 999
R 30 000 ormore
% o
f re
spo
nd
ents
CurrentHouseFinancing
FutureHouseFinancing
6 7 7 1117
2734
43 4452
67
100
35
19
40
5645
33 30
50
0
20
40
60
80
100
< R500 R 500 - R 999 R 1 000 - R2999
R 3 000 - R 4999
R 5 000 - R 9999
R 10 000 - R14 999
R 15 000 - R19 999
R 20 000 - R24 999
R 25 000 - R29 999
R 30 000 ormore
% o
f re
sp
on
de
nts
CurrentHouseFinancing
FutureHouseFinancing
60 3
8 11 9
21 1915
29
0 0
30 2832
22
41
50
30 31
0
10
20
30
40
50
60
< R500 R 500 - R 999 R 1 000 - R2999
R 3 000 - R 4999
R 5 000 - R 9999
R 10 000 - R14 999
R 15 000 - R19 999
R 20 000 - R24 999
R 25 000 - R29 999
R 30 000 ormore
% o
f re
sp
on
de
nts
CurrentHouseFinancing
FutureHouseFinancing
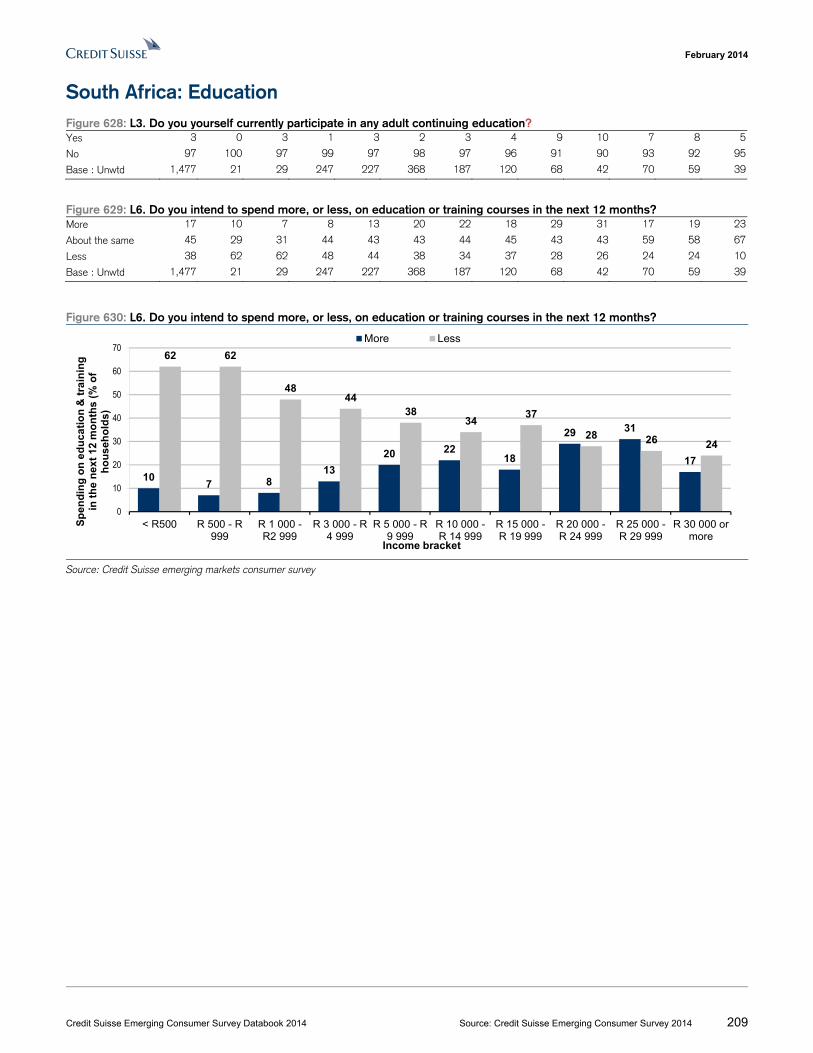
February 2014
Credit Suisse Emerging Consumer Survey Databook 2014 Source: Credit Suisse Emerging Consumer Survey 2014 209
South Africa: Education Figure 628: L3. Do you yourself currently participate in any adult continuing education? Yes 3 0 3 1 3 2 3 4 9 10 7 8 5
No 97 100 97 99 97 98 97 96 91 90 93 92 95
Base : Unwtd 1,477 21 29 247 227 368 187 120 68 42 70 59 39
Figure 629: L6. Do you intend to spend more, or less, on education or training courses in the next 12 months? More 17 10 7 8 13 20 22 18 29 31 17 19 23
About the same 45 29 31 44 43 43 44 45 43 43 59 58 67
Less 38 62 62 48 44 38 34 37 28 26 24 24 10
Base : Unwtd 1,477 21 29 247 227 368 187 120 68 42 70 59 39
Figure 630: L6. Do you intend to spend more, or less, on education or training courses in the next 12 months?
Source: Credit Suisse emerging markets consumer survey
107 8
13
20 2218
29 31
17
62 62
4844
3834
37
28 26 24
0
10
20
30
40
50
60
70
< R500 R 500 - R999
R 1 000 -R2 999
R 3 000 - R4 999
R 5 000 - R9 999
R 10 000 -R 14 999
R 15 000 -R 19 999
R 20 000 -R 24 999
R 25 000 -R 29 999
R 30 000 ormore
Sp
end
ing
on
ed
uca
tio
n &
tra
inin
g
in t
he
nex
t 12
mo
nth
s (
% o
f h
ou
seh
old
s)
Income bracket
More Less
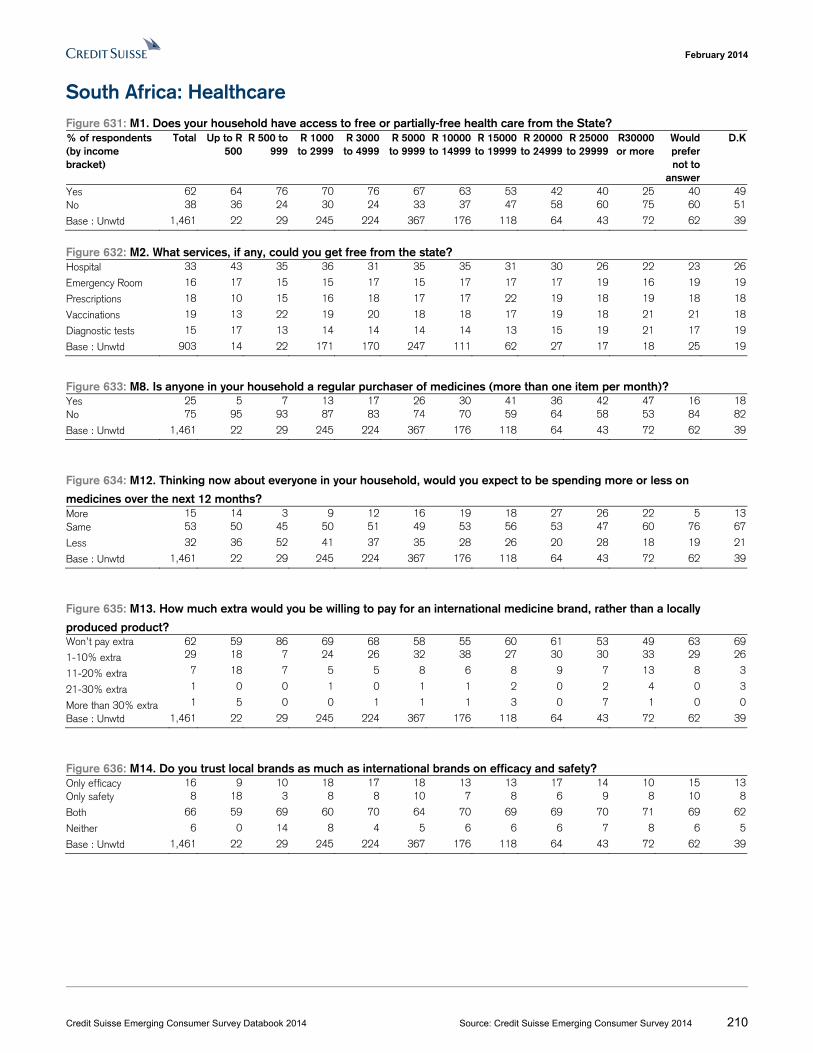
February 2014
Credit Suisse Emerging Consumer Survey Databook 2014 Source: Credit Suisse Emerging Consumer Survey 2014 210
South Africa: Healthcare Figure 631: M1. Does your household have access to free or partially-free health care from the State? % of respondents (by income bracket)
Total Up to R 500
R 500 to 999
R 1000 to 2999
R 3000 to 4999
R 5000 to 9999
R 10000 to 14999
R 15000 to 19999
R 20000 to 24999
R 25000 to 29999
R30000 or more
Would prefer not to
answer
D.K
Yes 62 64 76 70 76 67 63 53 42 40 25 40 49No 38 36 24 30 24 33 37 47 58 60 75 60 51
Base : Unwtd 1,461 22 29 245 224 367 176 118 64 43 72 62 39
Figure 632: M2. What services, if any, could you get free from the state? Hospital 33 43 35 36 31 35 35 31 30 26 22 23 26
Emergency Room 16 17 15 15 17 15 17 17 17 19 16 19 19
Prescriptions 18 10 15 16 18 17 17 22 19 18 19 18 18
Vaccinations 19 13 22 19 20 18 18 17 19 18 21 21 18
Diagnostic tests 15 17 13 14 14 14 14 13 15 19 21 17 19
Base : Unwtd 903 14 22 171 170 247 111 62 27 17 18 25 19
Figure 633: M8. Is anyone in your household a regular purchaser of medicines (more than one item per month)? Yes 25 5 7 13 17 26 30 41 36 42 47 16 18No 75 95 93 87 83 74 70 59 64 58 53 84 82
Base : Unwtd 1,461 22 29 245 224 367 176 118 64 43 72 62 39
Figure 634: M12. Thinking now about everyone in your household, would you expect to be spending more or less on
medicines over the next 12 months? More 15 14 3 9 12 16 19 18 27 26 22 5 13Same 53 50 45 50 51 49 53 56 53 47 60 76 67
Less 32 36 52 41 37 35 28 26 20 28 18 19 21
Base : Unwtd 1,461 22 29 245 224 367 176 118 64 43 72 62 39
Figure 635: M13. How much extra would you be willing to pay for an international medicine brand, rather than a locally
produced product? Won’t pay extra 62 59 86 69 68 58 55 60 61 53 49 63 69
1-10% extra 29 18 7 24 26 32 38 27 30 30 33 29 26
11-20% extra 7 18 7 5 5 8 6 8 9 7 13 8 3
21-30% extra 1 0 0 1 0 1 1 2 0 2 4 0 3
More than 30% extra 1 5 0 0 1 1 1 3 0 7 1 0 0
Base : Unwtd 1,461 22 29 245 224 367 176 118 64 43 72 62 39
Figure 636: M14. Do you trust local brands as much as international brands on efficacy and safety? Only efficacy 16 9 10 18 17 18 13 13 17 14 10 15 13Only safety 8 18 3 8 8 10 7 8 6 9 8 10 8
Both 66 59 69 60 70 64 70 69 69 70 71 69 62
Neither 6 0 14 8 4 5 6 6 6 7 8 6 5
Base : Unwtd 1,461 22 29 245 224 367 176 118 64 43 72 62 39
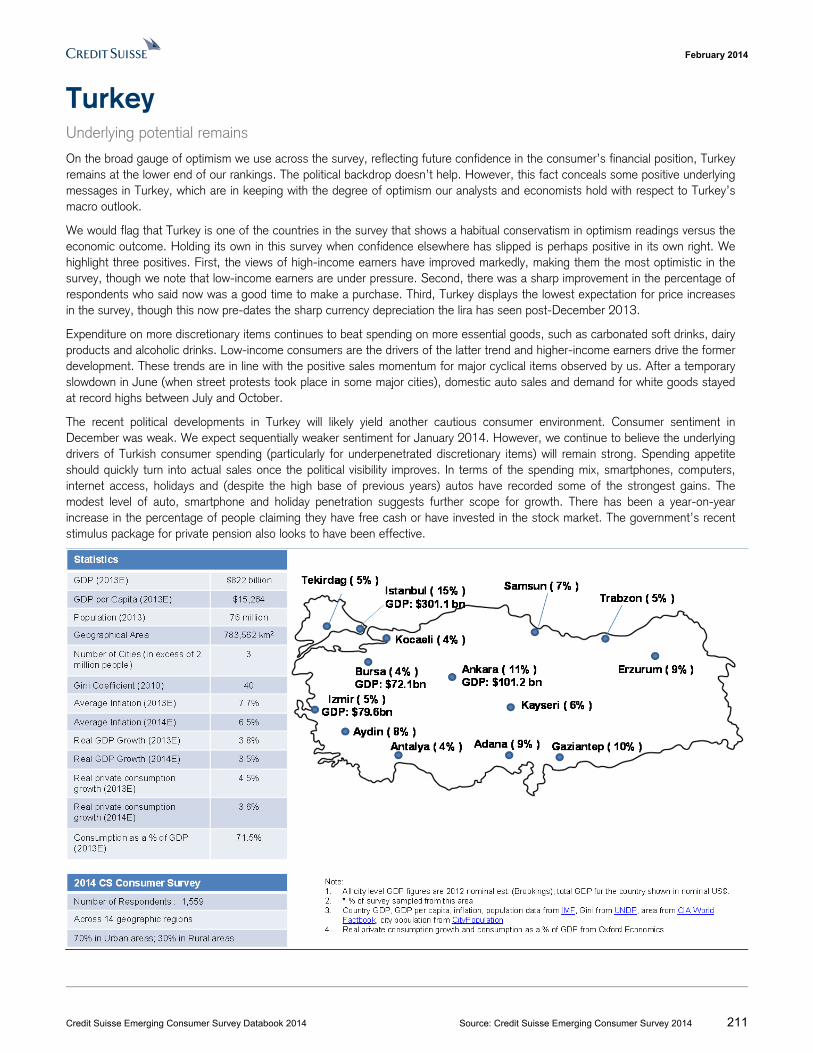
February 2014
Credit Suisse Emerging Consumer Survey Databook 2014 Source: Credit Suisse Emerging Consumer Survey 2014 211
Turkey Underlying potential remains
On the broad gauge of optimism we use across the survey, reflecting future confidence in the consumer’s financial position, Turkey remains at the lower end of our rankings. The political backdrop doesn’t help. However, this fact conceals some positive underlying messages in Turkey, which are in keeping with the degree of optimism our analysts and economists hold with respect to Turkey’s macro outlook.
We would flag that Turkey is one of the countries in the survey that shows a habitual conservatism in optimism readings versus the economic outcome. Holding its own in this survey when confidence elsewhere has slipped is perhaps positive in its own right. We highlight three positives. First, the views of high-income earners have improved markedly, making them the most optimistic in the survey, though we note that low-income earners are under pressure. Second, there was a sharp improvement in the percentage of respondents who said now was a good time to make a purchase. Third, Turkey displays the lowest expectation for price increases in the survey, though this now pre-dates the sharp currency depreciation the lira has seen post-December 2013.
Expenditure on more discretionary items continues to beat spending on more essential goods, such as carbonated soft drinks, dairy products and alcoholic drinks. Low-income consumers are the drivers of the latter trend and higher-income earners drive the former development. These trends are in line with the positive sales momentum for major cyclical items observed by us. After a temporary slowdown in June (when street protests took place in some major cities), domestic auto sales and demand for white goods stayed at record highs between July and October.
The recent political developments in Turkey will likely yield another cautious consumer environment. Consumer sentiment in December was weak. We expect sequentially weaker sentiment for January 2014. However, we continue to believe the underlying drivers of Turkish consumer spending (particularly for underpenetrated discretionary items) will remain strong. Spending appetite should quickly turn into actual sales once the political visibility improves. In terms of the spending mix, smartphones, computers, internet access, holidays and (despite the high base of previous years) autos have recorded some of the strongest gains. The modest level of auto, smartphone and holiday penetration suggests further scope for growth. There has been a year-on-year increase in the percentage of people claiming they have free cash or have invested in the stock market. The government’s recent stimulus package for private pension also looks to have been effective.
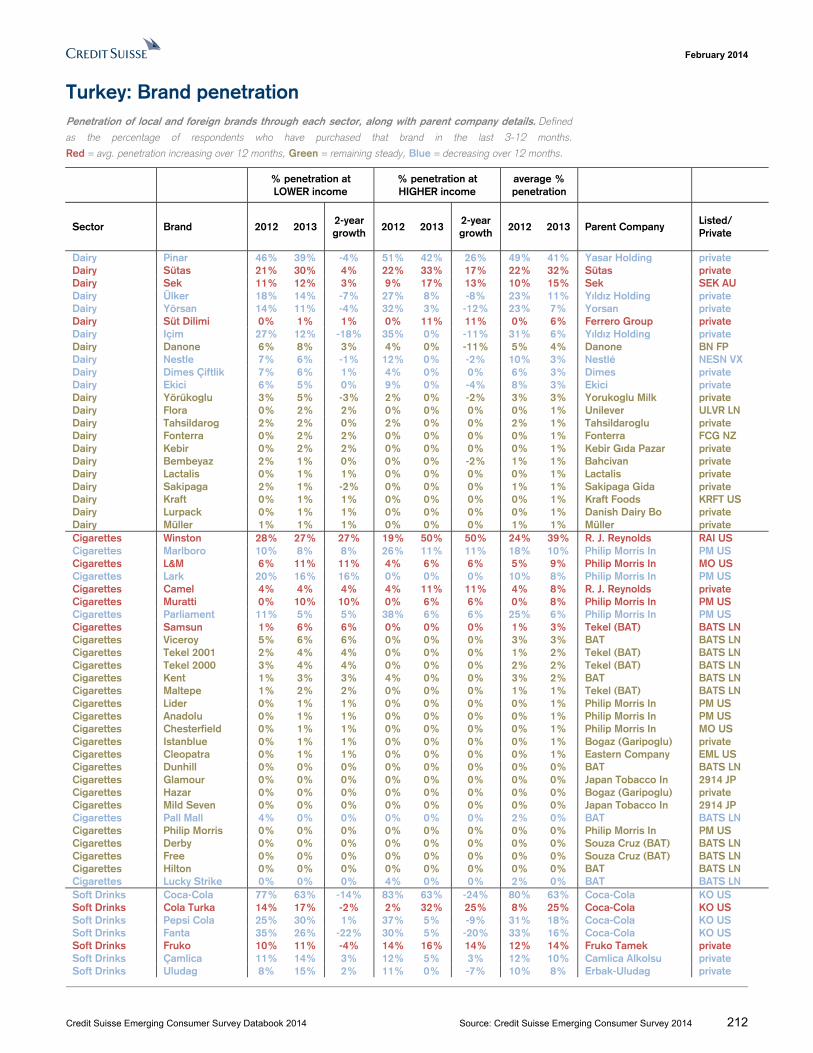
February 2014
Credit Suisse Emerging Consumer Survey Databook 2014 Source: Credit Suisse Emerging Consumer Survey 2014 212
Turkey: Brand penetration Penetration of local and foreign brands through each sector, along with parent company details. Defined
as the percentage of respondents who have purchased that brand in the last 3-12 months.
Red = avg. penetration increasing over 12 months, Green = remaining steady, Blue = decreasing over 12 months.
% penetration at LOWER income
% penetration at HIGHER income
average % penetration
Sector Brand 2012 2013 2-year growth
2012 2013 2-year growth
2012 2013 Parent Company Listed/ Private
Dairy Pinar 46% 39% -4% 51% 42% 26% 49% 41% Yasar Holding private Dairy Sütas 21% 30% 4% 22% 33% 17% 22% 32% Sütas private Dairy Sek 11% 12% 3% 9% 17% 13% 10% 15% Sek SEK AU Dairy Ülker 18% 14% -7% 27% 8% -8% 23% 11% Yıldız Holding private Dairy Yörsan 14% 11% -4% 32% 3% -12% 23% 7% Yorsan private Dairy Süt Dilimi 0% 1% 1% 0% 11% 11% 0% 6% Ferrero Group private Dairy Içim 27% 12% -18% 35% 0% -11% 31% 6% Yıldız Holding private Dairy Danone 6% 8% 3% 4% 0% -11% 5% 4% Danone BN FP Dairy Nestle 7% 6% -1% 12% 0% -2% 10% 3% Nestlé NESN VX Dairy Dimes Çiftlik 7% 6% 1% 4% 0% 0% 6% 3% Dimes private Dairy Ekici 6% 5% 0% 9% 0% -4% 8% 3% Ekici private Dairy Yörükoglu 3% 5% -3% 2% 0% -2% 3% 3% Yorukoglu Milk private Dairy Flora 0% 2% 2% 0% 0% 0% 0% 1% Unilever ULVR LN Dairy Tahsildarog 2% 2% 0% 2% 0% 0% 2% 1% Tahsildaroglu private Dairy Fonterra 0% 2% 2% 0% 0% 0% 0% 1% Fonterra FCG NZ Dairy Kebir 0% 2% 2% 0% 0% 0% 0% 1% Kebir Gıda Pazar private Dairy Bembeyaz 2% 1% 0% 0% 0% -2% 1% 1% Bahcivan private Dairy Lactalis 0% 1% 1% 0% 0% 0% 0% 1% Lactalis private Dairy Sakipaga 2% 1% -2% 0% 0% 0% 1% 1% Sakipaga Gida private Dairy Kraft 0% 1% 1% 0% 0% 0% 0% 1% Kraft Foods KRFT US Dairy Lurpack 0% 1% 1% 0% 0% 0% 0% 1% Danish Dairy Bo private Dairy Müller 1% 1% 1% 0% 0% 0% 1% 1% Müller private Cigarettes Winston 28% 27% 27% 19% 50% 50% 24% 39% R. J. Reynolds RAI US Cigarettes Marlboro 10% 8% 8% 26% 11% 11% 18% 10% Philip Morris In PM US Cigarettes L&M 6% 11% 11% 4% 6% 6% 5% 9% Philip Morris In MO US Cigarettes Lark 20% 16% 16% 0% 0% 0% 10% 8% Philip Morris In PM US Cigarettes Camel 4% 4% 4% 4% 11% 11% 4% 8% R. J. Reynolds private Cigarettes Muratti 0% 10% 10% 0% 6% 6% 0% 8% Philip Morris In PM US Cigarettes Parliament 11% 5% 5% 38% 6% 6% 25% 6% Philip Morris In PM US Cigarettes Samsun 1% 6% 6% 0% 0% 0% 1% 3% Tekel (BAT) BATS LN Cigarettes Viceroy 5% 6% 6% 0% 0% 0% 3% 3% BAT BATS LN Cigarettes Tekel 2001 2% 4% 4% 0% 0% 0% 1% 2% Tekel (BAT) BATS LN Cigarettes Tekel 2000 3% 4% 4% 0% 0% 0% 2% 2% Tekel (BAT) BATS LN Cigarettes Kent 1% 3% 3% 4% 0% 0% 3% 2% BAT BATS LN Cigarettes Maltepe 1% 2% 2% 0% 0% 0% 1% 1% Tekel (BAT) BATS LN Cigarettes Lider 0% 1% 1% 0% 0% 0% 0% 1% Philip Morris In PM US Cigarettes Anadolu 0% 1% 1% 0% 0% 0% 0% 1% Philip Morris In PM US Cigarettes Chesterfield 0% 1% 1% 0% 0% 0% 0% 1% Philip Morris In MO US Cigarettes Istanblue 0% 1% 1% 0% 0% 0% 0% 1% Bogaz (Garipoglu) private Cigarettes Cleopatra 0% 1% 1% 0% 0% 0% 0% 1% Eastern Company EML US Cigarettes Dunhill 0% 0% 0% 0% 0% 0% 0% 0% BAT BATS LN Cigarettes Glamour 0% 0% 0% 0% 0% 0% 0% 0% Japan Tobacco In 2914 JP Cigarettes Hazar 0% 0% 0% 0% 0% 0% 0% 0% Bogaz (Garipoglu) private Cigarettes Mild Seven 0% 0% 0% 0% 0% 0% 0% 0% Japan Tobacco In 2914 JP Cigarettes Pall Mall 4% 0% 0% 0% 0% 0% 2% 0% BAT BATS LN Cigarettes Philip Morris 0% 0% 0% 0% 0% 0% 0% 0% Philip Morris In PM US Cigarettes Derby 0% 0% 0% 0% 0% 0% 0% 0% Souza Cruz (BAT) BATS LN Cigarettes Free 0% 0% 0% 0% 0% 0% 0% 0% Souza Cruz (BAT) BATS LN Cigarettes Hilton 0% 0% 0% 0% 0% 0% 0% 0% BAT BATS LN Cigarettes Lucky Strike 0% 0% 0% 4% 0% 0% 2% 0% BAT BATS LN Soft Drinks Coca-Cola 77% 63% -14% 83% 63% -24% 80% 63% Coca-Cola KO US Soft Drinks Cola Turka 14% 17% -2% 2% 32% 25% 8% 25% Coca-Cola KO US Soft Drinks Pepsi Cola 25% 30% 1% 37% 5% -9% 31% 18% Coca-Cola KO US Soft Drinks Fanta 35% 26% -22% 30% 5% -20% 33% 16% Coca-Cola KO US Soft Drinks Fruko 10% 11% -4% 14% 16% 14% 12% 14% Fruko Tamek private Soft Drinks Çamlica 11% 14% 3% 12% 5% 3% 12% 10% Camlica Alkolsu private Soft Drinks Uludag 8% 15% 2% 11% 0% -7% 10% 8% Erbak-Uludag private
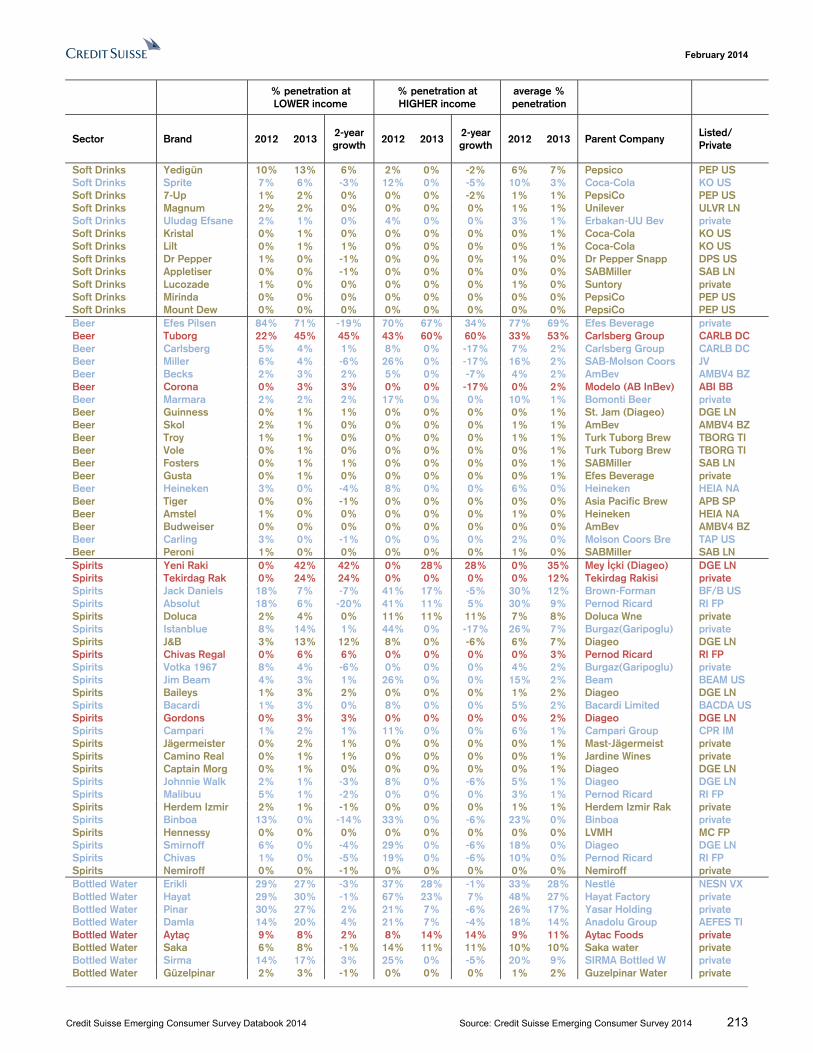
February 2014
Credit Suisse Emerging Consumer Survey Databook 2014 Source: Credit Suisse Emerging Consumer Survey 2014 213
% penetration at LOWER income
% penetration at HIGHER income
average % penetration
Sector Brand 2012 2013 2-year growth
2012 2013 2-year growth
2012 2013 Parent Company Listed/ Private
Soft Drinks Yedigün 10% 13% 6% 2% 0% -2% 6% 7% Pepsico PEP US Soft Drinks Sprite 7% 6% -3% 12% 0% -5% 10% 3% Coca-Cola KO US Soft Drinks 7-Up 1% 2% 0% 0% 0% -2% 1% 1% PepsiCo PEP US Soft Drinks Magnum 2% 2% 0% 0% 0% 0% 1% 1% Unilever ULVR LN Soft Drinks Uludag Efsane 2% 1% 0% 4% 0% 0% 3% 1% Erbakan-UU Bev private Soft Drinks Kristal 0% 1% 0% 0% 0% 0% 0% 1% Coca-Cola KO US Soft Drinks Lilt 0% 1% 1% 0% 0% 0% 0% 1% Coca-Cola KO US Soft Drinks Dr Pepper 1% 0% -1% 0% 0% 0% 1% 0% Dr Pepper Snapp DPS US Soft Drinks Appletiser 0% 0% -1% 0% 0% 0% 0% 0% SABMiller SAB LN Soft Drinks Lucozade 1% 0% 0% 0% 0% 0% 1% 0% Suntory private Soft Drinks Mirinda 0% 0% 0% 0% 0% 0% 0% 0% PepsiCo PEP US Soft Drinks Mount Dew 0% 0% 0% 0% 0% 0% 0% 0% PepsiCo PEP US Beer Efes Pilsen 84% 71% -19% 70% 67% 34% 77% 69% Efes Beverage private Beer Tuborg 22% 45% 45% 43% 60% 60% 33% 53% Carlsberg Group CARLB DC Beer Carlsberg 5% 4% 1% 8% 0% -17% 7% 2% Carlsberg Group CARLB DC Beer Miller 6% 4% -6% 26% 0% -17% 16% 2% SAB-Molson Coors JV Beer Becks 2% 3% 2% 5% 0% -7% 4% 2% AmBev AMBV4 BZ Beer Corona 0% 3% 3% 0% 0% -17% 0% 2% Modelo (AB InBev) ABI BB Beer Marmara 2% 2% 2% 17% 0% 0% 10% 1% Bomonti Beer private Beer Guinness 0% 1% 1% 0% 0% 0% 0% 1% St. Jam (Diageo) DGE LN Beer Skol 2% 1% 0% 0% 0% 0% 1% 1% AmBev AMBV4 BZ Beer Troy 1% 1% 0% 0% 0% 0% 1% 1% Turk Tuborg Brew TBORG TI Beer Vole 0% 1% 0% 0% 0% 0% 0% 1% Turk Tuborg Brew TBORG TI Beer Fosters 0% 1% 1% 0% 0% 0% 0% 1% SABMiller SAB LN Beer Gusta 0% 1% 0% 0% 0% 0% 0% 1% Efes Beverage private Beer Heineken 3% 0% -4% 8% 0% 0% 6% 0% Heineken HEIA NA Beer Tiger 0% 0% -1% 0% 0% 0% 0% 0% Asia Pacific Brew APB SP Beer Amstel 1% 0% 0% 0% 0% 0% 1% 0% Heineken HEIA NA Beer Budweiser 0% 0% 0% 0% 0% 0% 0% 0% AmBev AMBV4 BZ Beer Carling 3% 0% -1% 0% 0% 0% 2% 0% Molson Coors Bre TAP US Beer Peroni 1% 0% 0% 0% 0% 0% 1% 0% SABMiller SAB LN Spirits Yeni Raki 0% 42% 42% 0% 28% 28% 0% 35% Mey İçki (Diageo) DGE LN Spirits Tekirdag Rak 0% 24% 24% 0% 0% 0% 0% 12% Tekirdag Rakisi private Spirits Jack Daniels 18% 7% -7% 41% 17% -5% 30% 12% Brown-Forman BF/B US Spirits Absolut 18% 6% -20% 41% 11% 5% 30% 9% Pernod Ricard RI FP Spirits Doluca 2% 4% 0% 11% 11% 11% 7% 8% Doluca Wne private Spirits Istanblue 8% 14% 1% 44% 0% -17% 26% 7% Burgaz(Garipoglu) private Spirits J&B 3% 13% 12% 8% 0% -6% 6% 7% Diageo DGE LN Spirits Chivas Regal 0% 6% 6% 0% 0% 0% 0% 3% Pernod Ricard RI FP Spirits Votka 1967 8% 4% -6% 0% 0% 0% 4% 2% Burgaz(Garipoglu) private Spirits Jim Beam 4% 3% 1% 26% 0% 0% 15% 2% Beam BEAM US Spirits Baileys 1% 3% 2% 0% 0% 0% 1% 2% Diageo DGE LN Spirits Bacardi 1% 3% 0% 8% 0% 0% 5% 2% Bacardi Limited BACDA US Spirits Gordons 0% 3% 3% 0% 0% 0% 0% 2% Diageo DGE LN Spirits Campari 1% 2% 1% 11% 0% 0% 6% 1% Campari Group CPR IM Spirits Jägermeister 0% 2% 1% 0% 0% 0% 0% 1% Mast-Jägermeist private Spirits Camino Real 0% 1% 1% 0% 0% 0% 0% 1% Jardine Wines private Spirits Captain Morg 0% 1% 0% 0% 0% 0% 0% 1% Diageo DGE LN Spirits Johnnie Walk 2% 1% -3% 8% 0% -6% 5% 1% Diageo DGE LN Spirits Malibuu 5% 1% -2% 0% 0% 0% 3% 1% Pernod Ricard RI FP Spirits Herdem Izmir 2% 1% -1% 0% 0% 0% 1% 1% Herdem Izmir Rak private Spirits Binboa 13% 0% -14% 33% 0% -6% 23% 0% Binboa private Spirits Hennessy 0% 0% 0% 0% 0% 0% 0% 0% LVMH MC FP Spirits Smirnoff 6% 0% -4% 29% 0% -6% 18% 0% Diageo DGE LN Spirits Chivas 1% 0% -5% 19% 0% -6% 10% 0% Pernod Ricard RI FP Spirits Nemiroff 0% 0% -1% 0% 0% 0% 0% 0% Nemiroff private Bottled Water Erikli 29% 27% -3% 37% 28% -1% 33% 28% Nestlé NESN VX Bottled Water Hayat 29% 30% -1% 67% 23% 7% 48% 27% Hayat Factory private Bottled Water Pinar 30% 27% 2% 21% 7% -6% 26% 17% Yasar Holding private Bottled Water Damla 14% 20% 4% 21% 7% -4% 18% 14% Anadolu Group AEFES TI Bottled Water Aytaç 9% 8% 2% 8% 14% 14% 9% 11% Aytac Foods private Bottled Water Saka 6% 8% -1% 14% 11% 11% 10% 10% Saka water private Bottled Water Sirma 14% 17% 3% 25% 0% -5% 20% 9% SIRMA Bottled W private Bottled Water Güzelpinar 2% 3% -1% 0% 0% 0% 1% 2% Guzelpinar Water private
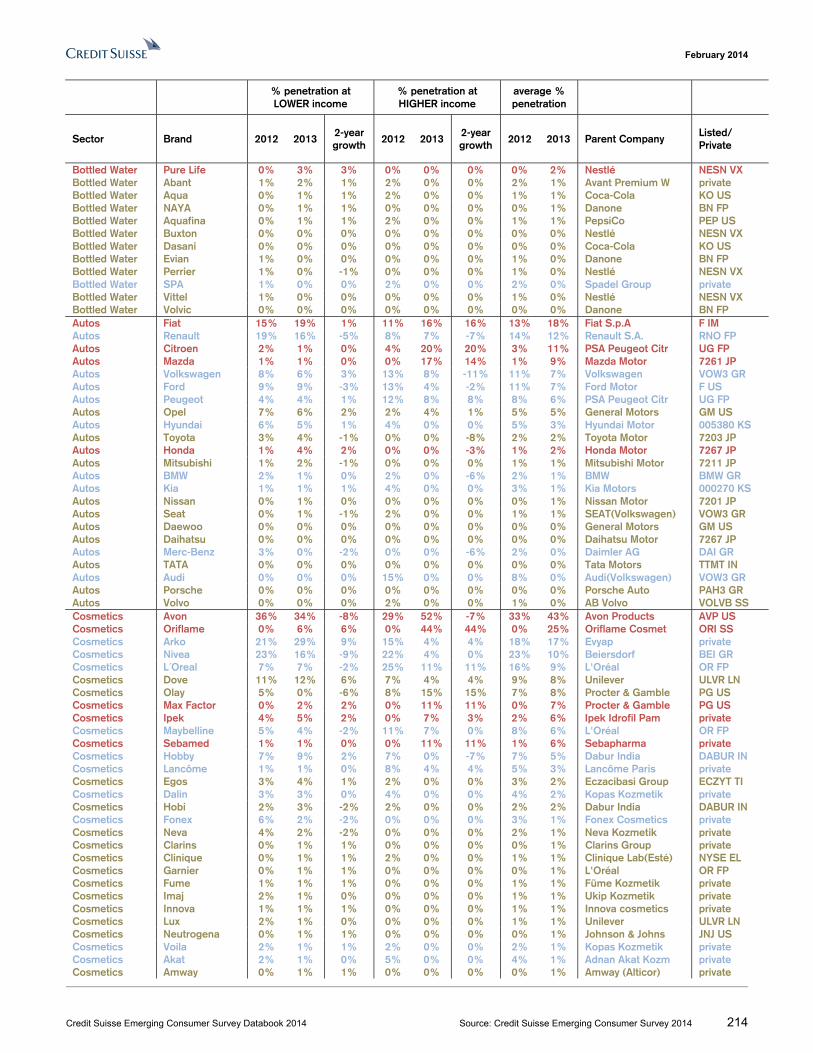
February 2014
Credit Suisse Emerging Consumer Survey Databook 2014 Source: Credit Suisse Emerging Consumer Survey 2014 214
% penetration at LOWER income
% penetration at HIGHER income
average % penetration
Sector Brand 2012 2013 2-year growth
2012 2013 2-year growth
2012 2013 Parent Company Listed/ Private
Bottled Water Pure Life 0% 3% 3% 0% 0% 0% 0% 2% Nestlé NESN VX Bottled Water Abant 1% 2% 1% 2% 0% 0% 2% 1% Avant Premium W private Bottled Water Aqua 0% 1% 1% 2% 0% 0% 1% 1% Coca-Cola KO US Bottled Water NAYA 0% 1% 1% 0% 0% 0% 0% 1% Danone BN FP Bottled Water Aquafina 0% 1% 1% 2% 0% 0% 1% 1% PepsiCo PEP US Bottled Water Buxton 0% 0% 0% 0% 0% 0% 0% 0% Nestlé NESN VX Bottled Water Dasani 0% 0% 0% 0% 0% 0% 0% 0% Coca-Cola KO US Bottled Water Evian 1% 0% 0% 0% 0% 0% 1% 0% Danone BN FP Bottled Water Perrier 1% 0% -1% 0% 0% 0% 1% 0% Nestlé NESN VX Bottled Water SPA 1% 0% 0% 2% 0% 0% 2% 0% Spadel Group private Bottled Water Vittel 1% 0% 0% 0% 0% 0% 1% 0% Nestlé NESN VX Bottled Water Volvic 0% 0% 0% 0% 0% 0% 0% 0% Danone BN FP Autos Fiat 15% 19% 1% 11% 16% 16% 13% 18% Fiat S.p.A F IM Autos Renault 19% 16% -5% 8% 7% -7% 14% 12% Renault S.A. RNO FP Autos Citroen 2% 1% 0% 4% 20% 20% 3% 11% PSA Peugeot Citr UG FP Autos Mazda 1% 1% 0% 0% 17% 14% 1% 9% Mazda Motor 7261 JP Autos Volkswagen 8% 6% 3% 13% 8% -11% 11% 7% Volkswagen VOW3 GR Autos Ford 9% 9% -3% 13% 4% -2% 11% 7% Ford Motor F US Autos Peugeot 4% 4% 1% 12% 8% 8% 8% 6% PSA Peugeot Citr UG FP Autos Opel 7% 6% 2% 2% 4% 1% 5% 5% General Motors GM US Autos Hyundai 6% 5% 1% 4% 0% 0% 5% 3% Hyundai Motor 005380 KS Autos Toyota 3% 4% -1% 0% 0% -8% 2% 2% Toyota Motor 7203 JP Autos Honda 1% 4% 2% 0% 0% -3% 1% 2% Honda Motor 7267 JP Autos Mitsubishi 1% 2% -1% 0% 0% 0% 1% 1% Mitsubishi Motor 7211 JP Autos BMW 2% 1% 0% 2% 0% -6% 2% 1% BMW BMW GR Autos Kia 1% 1% 1% 4% 0% 0% 3% 1% Kia Motors 000270 KS Autos Nissan 0% 1% 0% 0% 0% 0% 0% 1% Nissan Motor 7201 JP Autos Seat 0% 1% -1% 2% 0% 0% 1% 1% SEAT(Volkswagen) VOW3 GR Autos Daewoo 0% 0% 0% 0% 0% 0% 0% 0% General Motors GM US Autos Daihatsu 0% 0% 0% 0% 0% 0% 0% 0% Daihatsu Motor 7267 JP Autos Merc-Benz 3% 0% -2% 0% 0% -6% 2% 0% Daimler AG DAI GR Autos TATA 0% 0% 0% 0% 0% 0% 0% 0% Tata Motors TTMT IN Autos Audi 0% 0% 0% 15% 0% 0% 8% 0% Audi(Volkswagen) VOW3 GR Autos Porsche 0% 0% 0% 0% 0% 0% 0% 0% Porsche Auto PAH3 GR Autos Volvo 0% 0% 0% 2% 0% 0% 1% 0% AB Volvo VOLVB SS Cosmetics Avon 36% 34% -8% 29% 52% -7% 33% 43% Avon Products AVP US Cosmetics Oriflame 0% 6% 6% 0% 44% 44% 0% 25% Oriflame Cosmet ORI SS Cosmetics Arko 21% 29% 9% 15% 4% 4% 18% 17% Evyap private Cosmetics Nivea 23% 16% -9% 22% 4% 0% 23% 10% Beiersdorf BEI GR Cosmetics L´Oreal 7% 7% -2% 25% 11% 11% 16% 9% L'Oréal OR FP Cosmetics Dove 11% 12% 6% 7% 4% 4% 9% 8% Unilever ULVR LN Cosmetics Olay 5% 0% -6% 8% 15% 15% 7% 8% Procter & Gamble PG US Cosmetics Max Factor 0% 2% 2% 0% 11% 11% 0% 7% Procter & Gamble PG US Cosmetics Ipek 4% 5% 2% 0% 7% 3% 2% 6% Ipek Idrofil Pam private Cosmetics Maybelline 5% 4% -2% 11% 7% 0% 8% 6% L'Oréal OR FP Cosmetics Sebamed 1% 1% 0% 0% 11% 11% 1% 6% Sebapharma private Cosmetics Hobby 7% 9% 2% 7% 0% -7% 7% 5% Dabur India DABUR IN Cosmetics Lancôme 1% 1% 0% 8% 4% 4% 5% 3% Lancôme Paris private Cosmetics Egos 3% 4% 1% 2% 0% 0% 3% 2% Eczacibasi Group ECZYT TI Cosmetics Dalin 3% 3% 0% 4% 0% 0% 4% 2% Kopas Kozmetik private Cosmetics Hobi 2% 3% -2% 2% 0% 0% 2% 2% Dabur India DABUR IN Cosmetics Fonex 6% 2% -2% 0% 0% 0% 3% 1% Fonex Cosmetics private Cosmetics Neva 4% 2% -2% 0% 0% 0% 2% 1% Neva Kozmetik private Cosmetics Clarins 0% 1% 1% 0% 0% 0% 0% 1% Clarins Group private Cosmetics Clinique 0% 1% 1% 2% 0% 0% 1% 1% Clinique Lab(Esté) NYSE EL Cosmetics Garnier 0% 1% 1% 0% 0% 0% 0% 1% L'Oréal OR FP Cosmetics Fume 1% 1% 1% 0% 0% 0% 1% 1% Füme Kozmetik private Cosmetics Imaj 2% 1% 0% 0% 0% 0% 1% 1% Ukip Kozmetik private Cosmetics Innova 1% 1% 1% 0% 0% 0% 1% 1% Innova cosmetics private Cosmetics Lux 2% 1% 0% 0% 0% 0% 1% 1% Unilever ULVR LN Cosmetics Neutrogena 0% 1% 1% 0% 0% 0% 0% 1% Johnson & Johns JNJ US Cosmetics Voila 2% 1% 1% 2% 0% 0% 2% 1% Kopas Kozmetik private Cosmetics Akat 2% 1% 0% 5% 0% 0% 4% 1% Adnan Akat Kozm private Cosmetics Amway 0% 1% 1% 0% 0% 0% 0% 1% Amway (Alticor) private
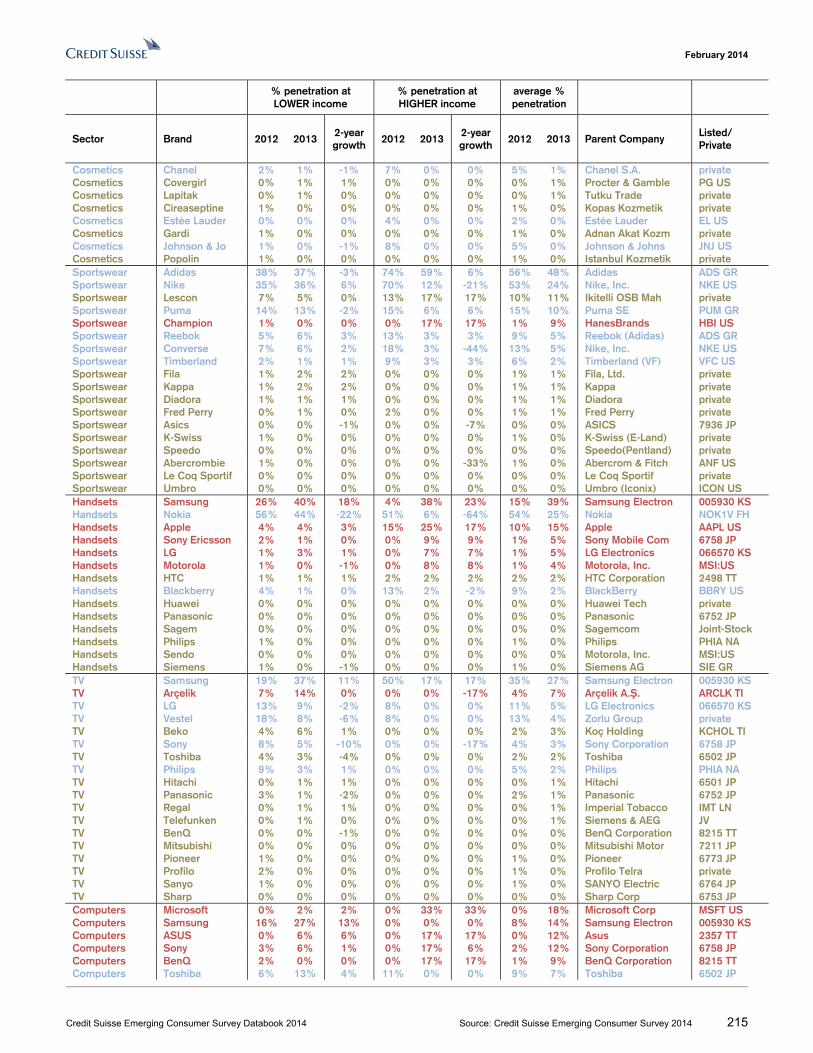
February 2014
Credit Suisse Emerging Consumer Survey Databook 2014 Source: Credit Suisse Emerging Consumer Survey 2014 215
% penetration at LOWER income
% penetration at HIGHER income
average % penetration
Sector Brand 2012 2013 2-year growth
2012 2013 2-year growth
2012 2013 Parent Company Listed/ Private
Cosmetics Chanel 2% 1% -1% 7% 0% 0% 5% 1% Chanel S.A. private Cosmetics Covergirl 0% 1% 1% 0% 0% 0% 0% 1% Procter & Gamble PG US Cosmetics Lapitak 0% 1% 0% 0% 0% 0% 0% 1% Tutku Trade private Cosmetics Cireaseptine 1% 0% 0% 0% 0% 0% 1% 0% Kopas Kozmetik private Cosmetics Estée Lauder 0% 0% 0% 4% 0% 0% 2% 0% Estée Lauder EL US Cosmetics Gardi 1% 0% 0% 0% 0% 0% 1% 0% Adnan Akat Kozm private Cosmetics Johnson & Jo 1% 0% -1% 8% 0% 0% 5% 0% Johnson & Johns JNJ US Cosmetics Popolin 1% 0% 0% 0% 0% 0% 1% 0% Istanbul Kozmetik private Sportswear Adidas 38% 37% -3% 74% 59% 6% 56% 48% Adidas ADS GR Sportswear Nike 35% 36% 6% 70% 12% -21% 53% 24% Nike, Inc. NKE US Sportswear Lescon 7% 5% 0% 13% 17% 17% 10% 11% Ikitelli OSB Mah private Sportswear Puma 14% 13% -2% 15% 6% 6% 15% 10% Puma SE PUM GR Sportswear Champion 1% 0% 0% 0% 17% 17% 1% 9% HanesBrands HBI US Sportswear Reebok 5% 6% 3% 13% 3% 3% 9% 5% Reebok (Adidas) ADS GR Sportswear Converse 7% 6% 2% 18% 3% -44% 13% 5% Nike, Inc. NKE US Sportswear Timberland 2% 1% 1% 9% 3% 3% 6% 2% Timberland (VF) VFC US Sportswear Fila 1% 2% 2% 0% 0% 0% 1% 1% Fila, Ltd. private Sportswear Kappa 1% 2% 2% 0% 0% 0% 1% 1% Kappa private Sportswear Diadora 1% 1% 1% 0% 0% 0% 1% 1% Diadora private Sportswear Fred Perry 0% 1% 0% 2% 0% 0% 1% 1% Fred Perry private Sportswear Asics 0% 0% -1% 0% 0% -7% 0% 0% ASICS 7936 JP Sportswear K-Swiss 1% 0% 0% 0% 0% 0% 1% 0% K-Swiss (E-Land) private Sportswear Speedo 0% 0% 0% 0% 0% 0% 0% 0% Speedo(Pentland) private Sportswear Abercrombie 1% 0% 0% 0% 0% -33% 1% 0% Abercrom & Fitch ANF US Sportswear Le Coq Sportif 0% 0% 0% 0% 0% 0% 0% 0% Le Coq Sportif private Sportswear Umbro 0% 0% 0% 0% 0% 0% 0% 0% Umbro (Iconix) ICON US Handsets Samsung 26% 40% 18% 4% 38% 23% 15% 39% Samsung Electron 005930 KS Handsets Nokia 56% 44% -22% 51% 6% -64% 54% 25% Nokia NOK1V FH Handsets Apple 4% 4% 3% 15% 25% 17% 10% 15% Apple AAPL US Handsets Sony Ericsson 2% 1% 0% 0% 9% 9% 1% 5% Sony Mobile Com 6758 JP Handsets LG 1% 3% 1% 0% 7% 7% 1% 5% LG Electronics 066570 KS Handsets Motorola 1% 0% -1% 0% 8% 8% 1% 4% Motorola, Inc. MSI:US Handsets HTC 1% 1% 1% 2% 2% 2% 2% 2% HTC Corporation 2498 TT Handsets Blackberry 4% 1% 0% 13% 2% -2% 9% 2% BlackBerry BBRY US Handsets Huawei 0% 0% 0% 0% 0% 0% 0% 0% Huawei Tech private Handsets Panasonic 0% 0% 0% 0% 0% 0% 0% 0% Panasonic 6752 JP Handsets Sagem 0% 0% 0% 0% 0% 0% 0% 0% Sagemcom Joint-Stock Handsets Philips 1% 0% 0% 0% 0% 0% 1% 0% Philips PHIA NA Handsets Sendo 0% 0% 0% 0% 0% 0% 0% 0% Motorola, Inc. MSI:US Handsets Siemens 1% 0% -1% 0% 0% 0% 1% 0% Siemens AG SIE GR TV Samsung 19% 37% 11% 50% 17% 17% 35% 27% Samsung Electron 005930 KS TV Arçelik 7% 14% 0% 0% 0% -17% 4% 7% Arçelik A.Ş. ARCLK TI TV LG 13% 9% -2% 8% 0% 0% 11% 5% LG Electronics 066570 KS TV Vestel 18% 8% -6% 8% 0% 0% 13% 4% Zorlu Group private TV Beko 4% 6% 1% 0% 0% 0% 2% 3% Koç Holding KCHOL TI TV Sony 8% 5% -10% 0% 0% -17% 4% 3% Sony Corporation 6758 JP TV Toshiba 4% 3% -4% 0% 0% 0% 2% 2% Toshiba 6502 JP TV Philips 9% 3% 1% 0% 0% 0% 5% 2% Philips PHIA NA TV Hitachi 0% 1% 1% 0% 0% 0% 0% 1% Hitachi 6501 JP TV Panasonic 3% 1% -2% 0% 0% 0% 2% 1% Panasonic 6752 JP TV Regal 0% 1% 1% 0% 0% 0% 0% 1% Imperial Tobacco IMT LN TV Telefunken 0% 1% 0% 0% 0% 0% 0% 1% Siemens & AEG JV TV BenQ 0% 0% -1% 0% 0% 0% 0% 0% BenQ Corporation 8215 TT TV Mitsubishi 0% 0% 0% 0% 0% 0% 0% 0% Mitsubishi Motor 7211 JP TV Pioneer 1% 0% 0% 0% 0% 0% 1% 0% Pioneer 6773 JP TV Profilo 2% 0% 0% 0% 0% 0% 1% 0% Profilo Telra private TV Sanyo 1% 0% 0% 0% 0% 0% 1% 0% SANYO Electric 6764 JP TV Sharp 0% 0% 0% 0% 0% 0% 0% 0% Sharp Corp 6753 JP Computers Microsoft 0% 2% 2% 0% 33% 33% 0% 18% Microsoft Corp MSFT US Computers Samsung 16% 27% 13% 0% 0% 0% 8% 14% Samsung Electron 005930 KS Computers ASUS 0% 6% 6% 0% 17% 17% 0% 12% Asus 2357 TT Computers Sony 3% 6% 1% 0% 17% 6% 2% 12% Sony Corporation 6758 JP Computers BenQ 2% 0% 0% 0% 17% 17% 1% 9% BenQ Corporation 8215 TT Computers Toshiba 6% 13% 4% 11% 0% 0% 9% 7% Toshiba 6502 JP
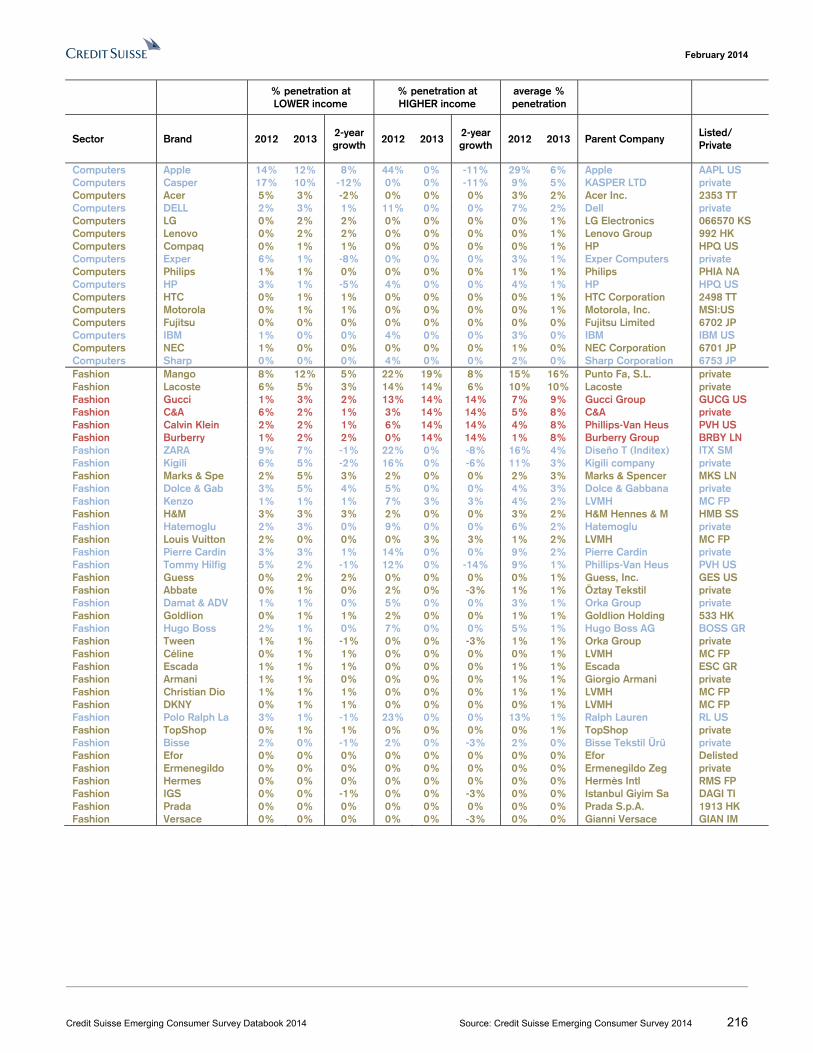
February 2014
Credit Suisse Emerging Consumer Survey Databook 2014 Source: Credit Suisse Emerging Consumer Survey 2014 216
% penetration at LOWER income
% penetration at HIGHER income
average % penetration
Sector Brand 2012 2013 2-year growth
2012 2013 2-year growth
2012 2013 Parent Company Listed/ Private
Computers Apple 14% 12% 8% 44% 0% -11% 29% 6% Apple AAPL US Computers Casper 17% 10% -12% 0% 0% -11% 9% 5% KASPER LTD private Computers Acer 5% 3% -2% 0% 0% 0% 3% 2% Acer Inc. 2353 TT Computers DELL 2% 3% 1% 11% 0% 0% 7% 2% Dell private Computers LG 0% 2% 2% 0% 0% 0% 0% 1% LG Electronics 066570 KS Computers Lenovo 0% 2% 2% 0% 0% 0% 0% 1% Lenovo Group 992 HK Computers Compaq 0% 1% 1% 0% 0% 0% 0% 1% HP HPQ US Computers Exper 6% 1% -8% 0% 0% 0% 3% 1% Exper Computers private Computers Philips 1% 1% 0% 0% 0% 0% 1% 1% Philips PHIA NA Computers HP 3% 1% -5% 4% 0% 0% 4% 1% HP HPQ US Computers HTC 0% 1% 1% 0% 0% 0% 0% 1% HTC Corporation 2498 TT Computers Motorola 0% 1% 1% 0% 0% 0% 0% 1% Motorola, Inc. MSI:US Computers Fujitsu 0% 0% 0% 0% 0% 0% 0% 0% Fujitsu Limited 6702 JP Computers IBM 1% 0% 0% 4% 0% 0% 3% 0% IBM IBM US Computers NEC 1% 0% 0% 0% 0% 0% 1% 0% NEC Corporation 6701 JP Computers Sharp 0% 0% 0% 4% 0% 0% 2% 0% Sharp Corporation 6753 JP Fashion Mango 8% 12% 5% 22% 19% 8% 15% 16% Punto Fa, S.L. private Fashion Lacoste 6% 5% 3% 14% 14% 6% 10% 10% Lacoste private Fashion Gucci 1% 3% 2% 13% 14% 14% 7% 9% Gucci Group GUCG US Fashion C&A 6% 2% 1% 3% 14% 14% 5% 8% C&A private Fashion Calvin Klein 2% 2% 1% 6% 14% 14% 4% 8% Phillips-Van Heus PVH US Fashion Burberry 1% 2% 2% 0% 14% 14% 1% 8% Burberry Group BRBY LN Fashion ZARA 9% 7% -1% 22% 0% -8% 16% 4% Diseño T (Inditex) ITX SM Fashion Kigili 6% 5% -2% 16% 0% -6% 11% 3% Kigili company private Fashion Marks & Spe 2% 5% 3% 2% 0% 0% 2% 3% Marks & Spencer MKS LN Fashion Dolce & Gab 3% 5% 4% 5% 0% 0% 4% 3% Dolce & Gabbana private Fashion Kenzo 1% 1% 1% 7% 3% 3% 4% 2% LVMH MC FP Fashion H&M 3% 3% 3% 2% 0% 0% 3% 2% H&M Hennes & M HMB SS Fashion Hatemoglu 2% 3% 0% 9% 0% 0% 6% 2% Hatemoglu private Fashion Louis Vuitton 2% 0% 0% 0% 3% 3% 1% 2% LVMH MC FP Fashion Pierre Cardin 3% 3% 1% 14% 0% 0% 9% 2% Pierre Cardin private Fashion Tommy Hilfig 5% 2% -1% 12% 0% -14% 9% 1% Phillips-Van Heus PVH US Fashion Guess 0% 2% 2% 0% 0% 0% 0% 1% Guess, Inc. GES US Fashion Abbate 0% 1% 0% 2% 0% -3% 1% 1% Öztay Tekstil private Fashion Damat & ADV 1% 1% 0% 5% 0% 0% 3% 1% Orka Group private Fashion Goldlion 0% 1% 1% 2% 0% 0% 1% 1% Goldlion Holding 533 HK Fashion Hugo Boss 2% 1% 0% 7% 0% 0% 5% 1% Hugo Boss AG BOSS GR Fashion Tween 1% 1% -1% 0% 0% -3% 1% 1% Orka Group private Fashion Céline 0% 1% 1% 0% 0% 0% 0% 1% LVMH MC FP Fashion Escada 1% 1% 1% 0% 0% 0% 1% 1% Escada ESC GR Fashion Armani 1% 1% 0% 0% 0% 0% 1% 1% Giorgio Armani private Fashion Christian Dio 1% 1% 1% 0% 0% 0% 1% 1% LVMH MC FP Fashion DKNY 0% 1% 1% 0% 0% 0% 0% 1% LVMH MC FP Fashion Polo Ralph La 3% 1% -1% 23% 0% 0% 13% 1% Ralph Lauren RL US Fashion TopShop 0% 1% 1% 0% 0% 0% 0% 1% TopShop private Fashion Bisse 2% 0% -1% 2% 0% -3% 2% 0% Bisse Tekstil Ürü private Fashion Efor 0% 0% 0% 0% 0% 0% 0% 0% Efor Delisted Fashion Ermenegildo 0% 0% 0% 0% 0% 0% 0% 0% Ermenegildo Zeg private Fashion Hermes 0% 0% 0% 0% 0% 0% 0% 0% Hermès Intl RMS FP Fashion IGS 0% 0% -1% 0% 0% -3% 0% 0% Istanbul Giyim Sa DAGI TI Fashion Prada 0% 0% 0% 0% 0% 0% 0% 0% Prada S.p.A. 1913 HK Fashion Versace 0% 0% 0% 0% 0% -3% 0% 0% Gianni Versace GIAN IM
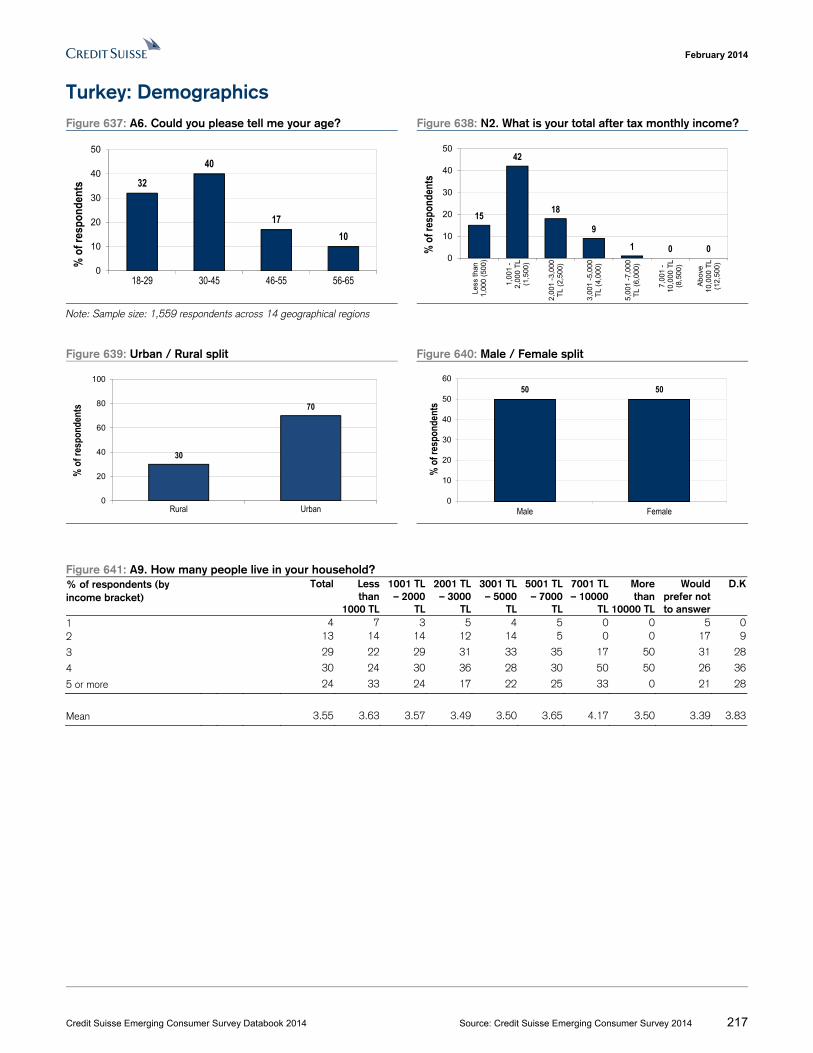
February 2014
Credit Suisse Emerging Consumer Survey Databook 2014 Source: Credit Suisse Emerging Consumer Survey 2014 217
Turkey: Demographics Figure 637: A6. Could you please tell me your age? Figure 638: N2. What is your total after tax monthly income?
Note: Sample size: 1,559 respondents across 14 geographical regions
Figure 639: Urban / Rural split Figure 640: Male / Female split
Figure 641: A9. How many people live in your household? % of respondents (by income bracket)
Total Less than
1000 TL
1001 TL – 2000
TL
2001 TL – 3000
TL
3001 TL – 5000
TL
5001 TL – 7000
TL
7001 TL – 10000
TL
More than
10000 TL
Would prefer not to answer
D.K
1 4 7 3 5 4 5 0 0 5 02 13 14 14 12 14 5 0 0 17 9
3 29 22 29 31 33 35 17 50 31 28
4 30 24 30 36 28 30 50 50 26 36
5 or more 24 33 24 17 22 25 33 0 21 28
Mean 3.55 3.63 3.57 3.49 3.50 3.65 4.17 3.50 3.39 3.83
32
40
1710
0
10
20
30
40
50
18-29 30-45 46-55 56-65
% o
f res
pond
ents
15
42
18
9
1 0 00
10
20
30
40
50
Less
than
1,00
0 (5
00)
1,00
1 -
2,00
0 T
L(1
,500
)
2,00
1 -3
,000
TL
(2,5
00)
3,00
1 -5
,000
TL
(4,0
00)
5,00
1 -7
,000
TL
(6,0
00)
7,00
1 -
10,0
00 T
L(8
,500
)
Ab
ove
10,0
00 T
L(1
2,50
0)
% o
f res
pond
ents
30
70
0
20
40
60
80
100
Rural Urban
% o
f res
pond
ents
50 50
0
10
20
30
40
50
60
Male Female
% o
f res
pond
ents
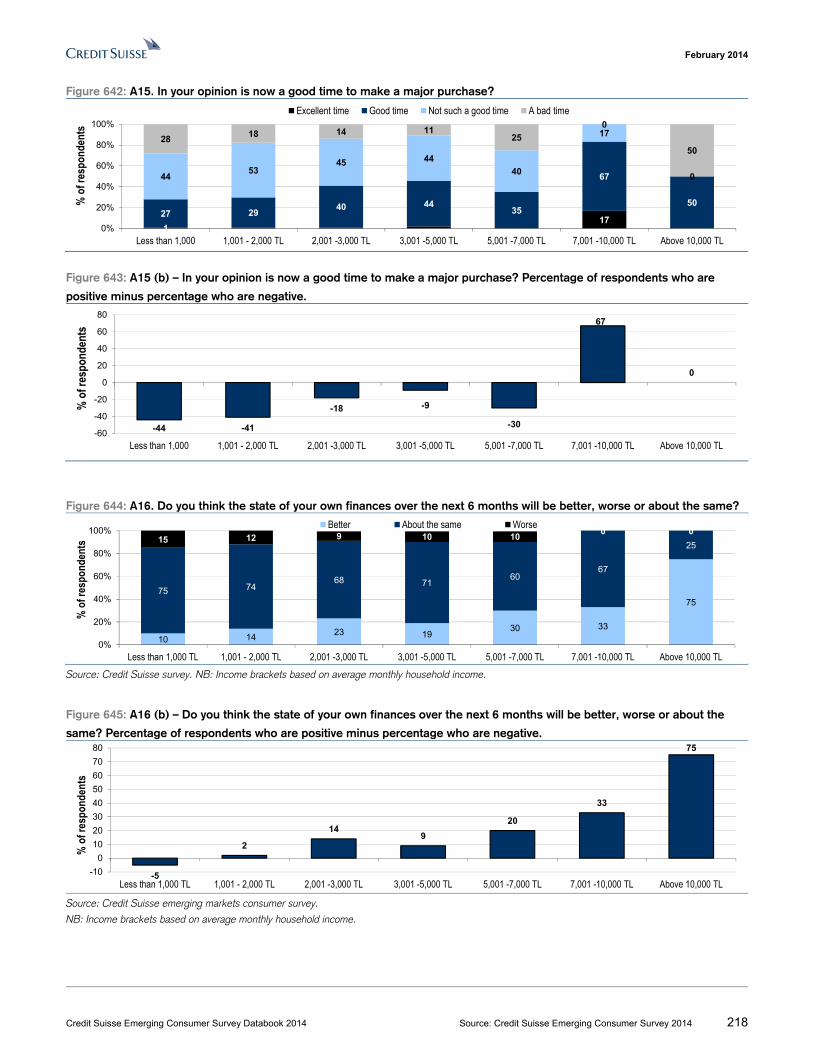
February 2014
Credit Suisse Emerging Consumer Survey Databook 2014 Source: Credit Suisse Emerging Consumer Survey 2014 218
Figure 642: A15. In your opinion is now a good time to make a major purchase?
Figure 643: A15 (b) – In your opinion is now a good time to make a major purchase? Percentage of respondents who are
positive minus percentage who are negative.
Figure 644: A16. Do you think the state of your own finances over the next 6 months will be better, worse or about the same?
Source: Credit Suisse survey. NB: Income brackets based on average monthly household income.
Figure 645: A16 (b) – Do you think the state of your own finances over the next 6 months will be better, worse or about the
same? Percentage of respondents who are positive minus percentage who are negative.
Source: Credit Suisse emerging markets consumer survey.
NB: Income brackets based on average monthly household income.
117
27 2940 44
35
67
50
4453
45 44
40
17
0
2818 14 11
25
0
50
0%
20%
40%
60%
80%
100%
Less than 1,000 1,001 - 2,000 TL 2,001 -3,000 TL 3,001 -5,000 TL 5,001 -7,000 TL 7,001 -10,000 TL Above 10,000 TL
% o
f res
pond
ents
Excellent time Good time Not such a good time A bad time
-44 -41
-18 -9
-30
67
0
-60
-40
-20
0
20
40
60
80
Less than 1,000 1,001 - 2,000 TL 2,001 -3,000 TL 3,001 -5,000 TL 5,001 -7,000 TL 7,001 -10,000 TL Above 10,000 TL
% o
f res
pond
ents
10 1423 19
30 33
7575 74
68 7160
67
2515 12 9 10 10
0 0
0%
20%
40%
60%
80%
100%
Less than 1,000 TL 1,001 - 2,000 TL 2,001 -3,000 TL 3,001 -5,000 TL 5,001 -7,000 TL 7,001 -10,000 TL Above 10,000 TL
% o
f res
pond
ents
Better About the same Worse
-5
2
149
20
33
75
-10
0
10
20
30
40
50
60
70
80
Less than 1,000 TL 1,001 - 2,000 TL 2,001 -3,000 TL 3,001 -5,000 TL 5,001 -7,000 TL 7,001 -10,000 TL Above 10,000 TL
% o
f res
pond
ents
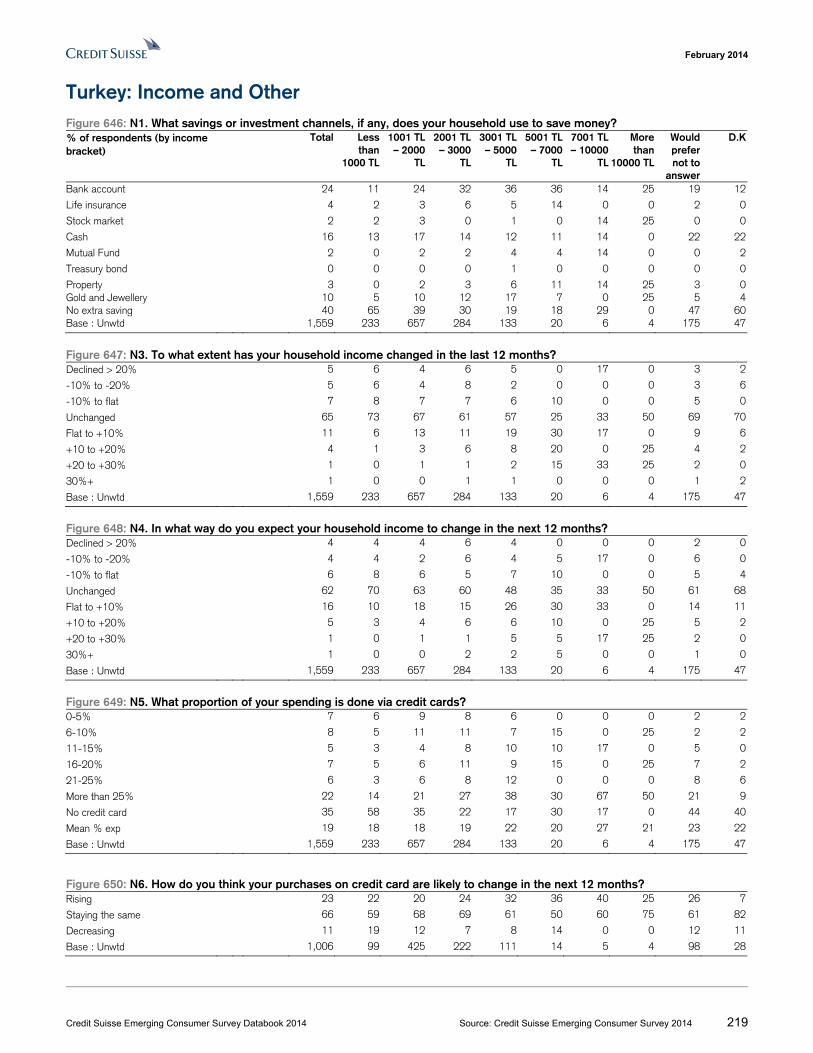
February 2014
Credit Suisse Emerging Consumer Survey Databook 2014 Source: Credit Suisse Emerging Consumer Survey 2014 219
Turkey: Income and Other Figure 646: N1. What savings or investment channels, if any, does your household use to save money? % of respondents (by income bracket)
Total Less than
1000 TL
1001 TL – 2000
TL
2001 TL – 3000
TL
3001 TL – 5000
TL
5001 TL – 7000
TL
7001 TL – 10000
TL
More than
10000 TL
Would prefer not to
answer
D.K
Bank account 24 11 24 32 36 36 14 25 19 12
Life insurance 4 2 3 6 5 14 0 0 2 0
Stock market 2 2 3 0 1 0 14 25 0 0
Cash 16 13 17 14 12 11 14 0 22 22
Mutual Fund 2 0 2 2 4 4 14 0 0 2
Treasury bond 0 0 0 0 1 0 0 0 0 0
Property 3 0 2 3 6 11 14 25 3 0Gold and Jewellery 10 5 10 12 17 7 0 25 5 4No extra saving 40 65 39 30 19 18 29 0 47 60Base : Unwtd 1,559 233 657 284 133 20 6 4 175 47
Figure 647: N3. To what extent has your household income changed in the last 12 months? Declined > 20% 5 6 4 6 5 0 17 0 3 2
-10% to -20% 5 6 4 8 2 0 0 0 3 6
-10% to flat 7 8 7 7 6 10 0 0 5 0
Unchanged 65 73 67 61 57 25 33 50 69 70
Flat to +10% 11 6 13 11 19 30 17 0 9 6
+10 to +20% 4 1 3 6 8 20 0 25 4 2
+20 to +30% 1 0 1 1 2 15 33 25 2 0
30%+ 1 0 0 1 1 0 0 0 1 2
Base : Unwtd 1,559 233 657 284 133 20 6 4 175 47
Figure 648: N4. In what way do you expect your household income to change in the next 12 months? Declined > 20% 4 4 4 6 4 0 0 0 2 0
-10% to -20% 4 4 2 6 4 5 17 0 6 0
-10% to flat 6 8 6 5 7 10 0 0 5 4
Unchanged 62 70 63 60 48 35 33 50 61 68
Flat to +10% 16 10 18 15 26 30 33 0 14 11
+10 to +20% 5 3 4 6 6 10 0 25 5 2
+20 to +30% 1 0 1 1 5 5 17 25 2 0
30%+ 1 0 0 2 2 5 0 0 1 0
Base : Unwtd 1,559 233 657 284 133 20 6 4 175 47
Figure 649: N5. What proportion of your spending is done via credit cards? 0-5% 7 6 9 8 6 0 0 0 2 2
6-10% 8 5 11 11 7 15 0 25 2 2
11-15% 5 3 4 8 10 10 17 0 5 0
16-20% 7 5 6 11 9 15 0 25 7 2
21-25% 6 3 6 8 12 0 0 0 8 6
More than 25% 22 14 21 27 38 30 67 50 21 9
No credit card 35 58 35 22 17 30 17 0 44 40
Mean % exp 19 18 18 19 22 20 27 21 23 22
Base : Unwtd 1,559 233 657 284 133 20 6 4 175 47
Figure 650: N6. How do you think your purchases on credit card are likely to change in the next 12 months? Rising 23 22 20 24 32 36 40 25 26 7
Staying the same 66 59 68 69 61 50 60 75 61 82
Decreasing 11 19 12 7 8 14 0 0 12 11
Base : Unwtd 1,006 99 425 222 111 14 5 4 98 28
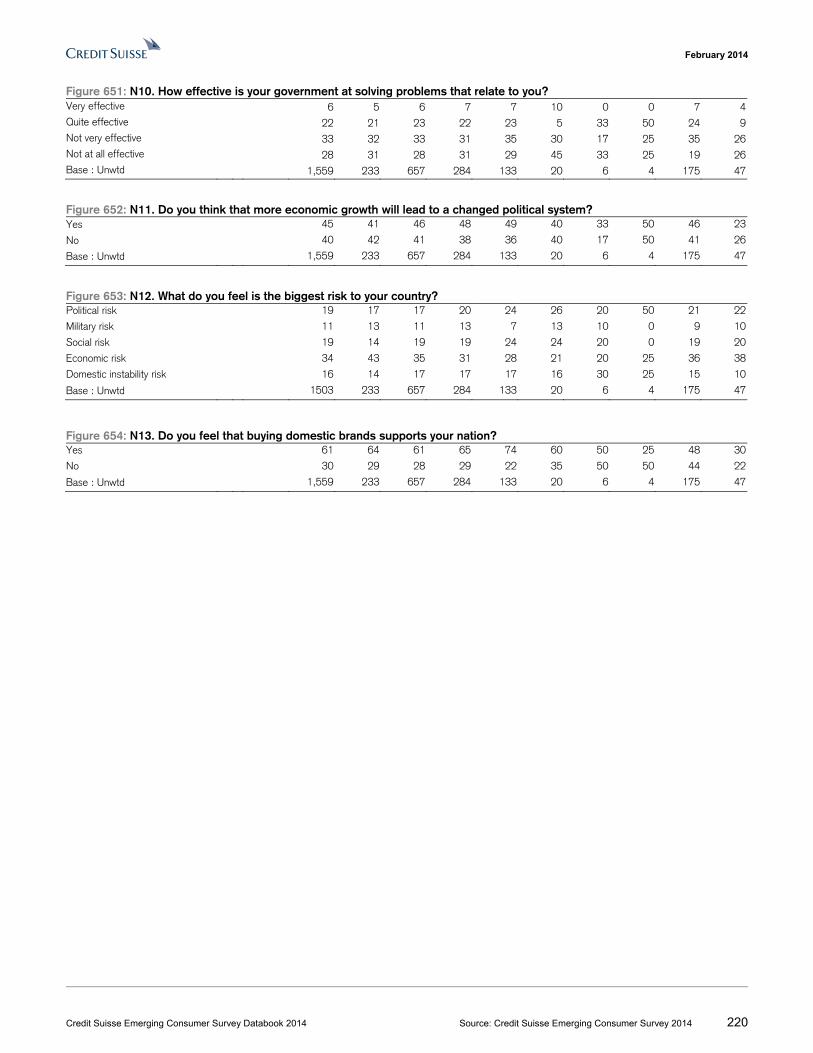
February 2014
Credit Suisse Emerging Consumer Survey Databook 2014 Source: Credit Suisse Emerging Consumer Survey 2014 220
Figure 651: N10. How effective is your government at solving problems that relate to you? Very effective 6 5 6 7 7 10 0 0 7 4Quite effective 22 21 23 22 23 5 33 50 24 9Not very effective 33 32 33 31 35 30 17 25 35 26Not at all effective 28 31 28 31 29 45 33 25 19 26Base : Unwtd 1,559 233 657 284 133 20 6 4 175 47
Figure 652: N11. Do you think that more economic growth will lead to a changed political system? Yes 45 41 46 48 49 40 33 50 46 23
No 40 42 41 38 36 40 17 50 41 26
Base : Unwtd 1,559 233 657 284 133 20 6 4 175 47
Figure 653: N12. What do you feel is the biggest risk to your country? Political risk 19 17 17 20 24 26 20 50 21 22
Military risk 11 13 11 13 7 13 10 0 9 10
Social risk 19 14 19 19 24 24 20 0 19 20
Economic risk 34 43 35 31 28 21 20 25 36 38
Domestic instability risk 16 14 17 17 17 16 30 25 15 10
Base : Unwtd 1503 233 657 284 133 20 6 4 175 47
Figure 654: N13. Do you feel that buying domestic brands supports your nation? Yes 61 64 61 65 74 60 50 25 48 30
No 30 29 28 29 22 35 50 50 44 22
Base : Unwtd 1,559 233 657 284 133 20 6 4 175 47
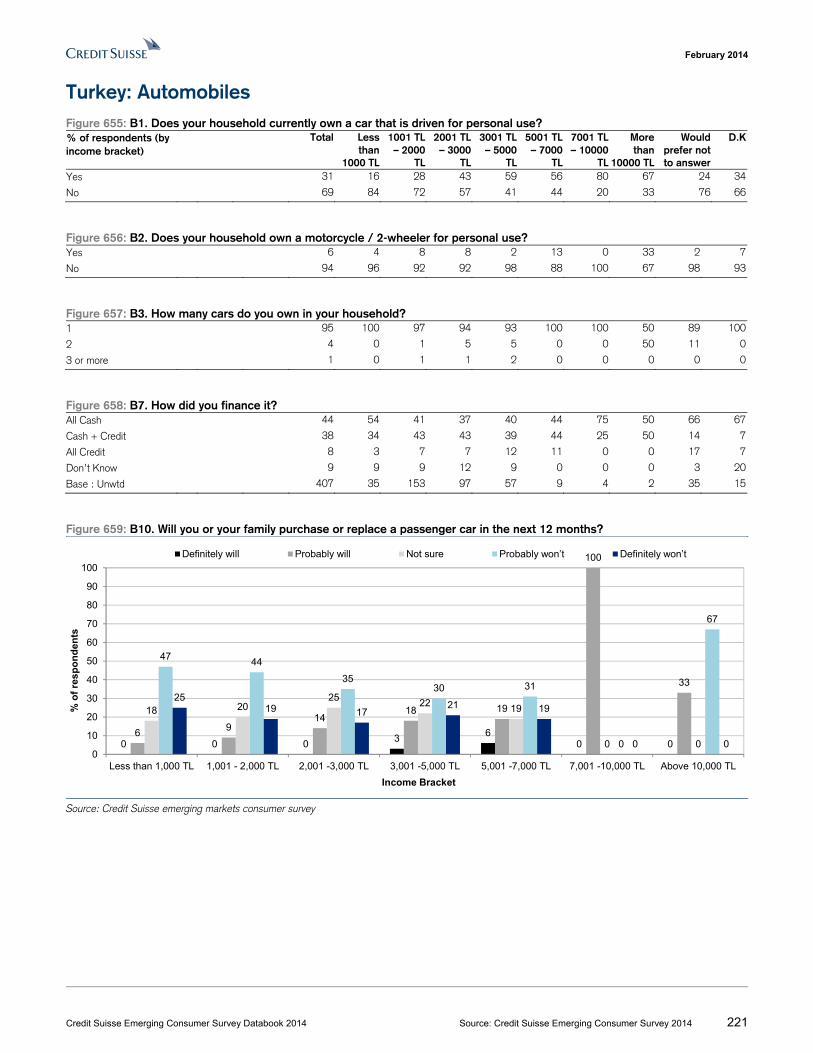
February 2014
Credit Suisse Emerging Consumer Survey Databook 2014 Source: Credit Suisse Emerging Consumer Survey 2014 221
Turkey: Automobiles Figure 655: B1. Does your household currently own a car that is driven for personal use? % of respondents (by income bracket)
Total Less than
1000 TL
1001 TL – 2000
TL
2001 TL – 3000
TL
3001 TL – 5000
TL
5001 TL – 7000
TL
7001 TL – 10000
TL
More than
10000 TL
Would prefer not to answer
D.K
Yes 31 16 28 43 59 56 80 67 24 34
No 69 84 72 57 41 44 20 33 76 66
Figure 656: B2. Does your household own a motorcycle / 2-wheeler for personal use? Yes 6 4 8 8 2 13 0 33 2 7
No 94 96 92 92 98 88 100 67 98 93
Figure 657: B3. How many cars do you own in your household? 1 95 100 97 94 93 100 100 50 89 100
2 4 0 1 5 5 0 0 50 11 0
3 or more 1 0 1 1 2 0 0 0 0 0
Figure 658: B7. How did you finance it? All Cash 44 54 41 37 40 44 75 50 66 67
Cash + Credit 38 34 43 43 39 44 25 50 14 7
All Credit 8 3 7 7 12 11 0 0 17 7
Don’t Know 9 9 9 12 9 0 0 0 3 20
Base : Unwtd 407 35 153 97 57 9 4 2 35 15
Figure 659: B10. Will you or your family purchase or replace a passenger car in the next 12 months?
Source: Credit Suisse emerging markets consumer survey
0 0 03
60 0
69
1418 19
100
33
18 2025
2219
0 0
4744
3530 31
0
67
2519 17
21 19
0 00
10
20
30
40
50
60
70
80
90
100
Less than 1,000 TL 1,001 - 2,000 TL 2,001 -3,000 TL 3,001 -5,000 TL 5,001 -7,000 TL 7,001 -10,000 TL Above 10,000 TL
% o
f re
sp
on
den
ts
Income Bracket
Definitely will Probably will Not sure Probably won’t Definitely won’t
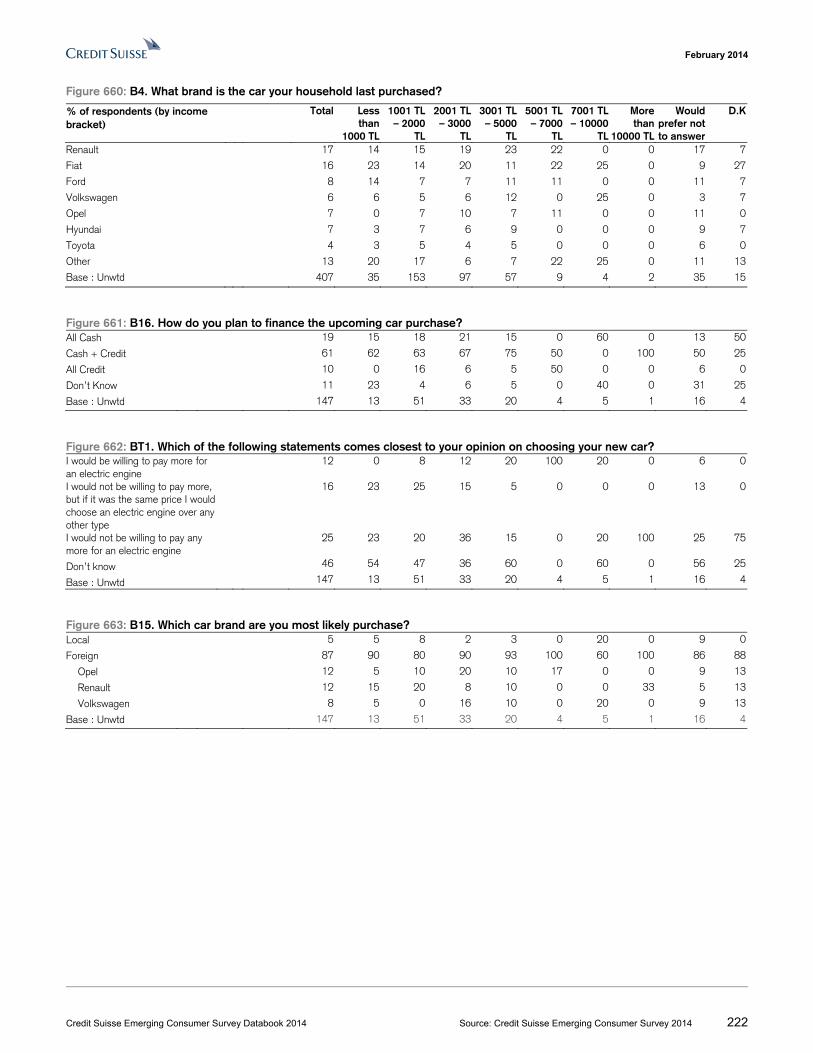
February 2014
Credit Suisse Emerging Consumer Survey Databook 2014 Source: Credit Suisse Emerging Consumer Survey 2014 222
Figure 660: B4. What brand is the car your household last purchased?
Renault 17 14 15 19 23 22 0 0 17 7
Fiat 16 23 14 20 11 22 25 0 9 27
Ford 8 14 7 7 11 11 0 0 11 7
Volkswagen 6 6 5 6 12 0 25 0 3 7
Opel 7 0 7 10 7 11 0 0 11 0
Hyundai 7 3 7 6 9 0 0 0 9 7
Toyota 4 3 5 4 5 0 0 0 6 0
Other 13 20 17 6 7 22 25 0 11 13
Base : Unwtd 407 35 153 97 57 9 4 2 35 15
Figure 661: B16. How do you plan to finance the upcoming car purchase? All Cash 19 15 18 21 15 0 60 0 13 50
Cash + Credit 61 62 63 67 75 50 0 100 50 25
All Credit 10 0 16 6 5 50 0 0 6 0
Don’t Know 11 23 4 6 5 0 40 0 31 25
Base : Unwtd 147 13 51 33 20 4 5 1 16 4
Figure 662: BT1. Which of the following statements comes closest to your opinion on choosing your new car? I would be willing to pay more for an electric engine
12 0 8 12 20 100 20 0 6 0
I would not be willing to pay more, but if it was the same price I would choose an electric engine over any other type
16 23 25 15 5 0 0 0 13 0
I would not be willing to pay any more for an electric engine
25 23 20 36 15 0 20 100 25 75
Don’t know 46 54 47 36 60 0 60 0 56 25
Base : Unwtd 147 13 51 33 20 4 5 1 16 4
Figure 663: B15. Which car brand are you most likely purchase? Local 5 5 8 2 3 0 20 0 9 0
Foreign 87 90 80 90 93 100 60 100 86 88
Opel 12 5 10 20 10 17 0 0 9 13
Renault 12 15 20 8 10 0 0 33 5 13
Volkswagen 8 5 0 16 10 0 20 0 9 13
Base : Unwtd 147 13 51 33 20 4 5 1 16 4
% of respondents (by income bracket)
Total Less than
1000 TL
1001 TL – 2000
TL
2001 TL – 3000
TL
3001 TL – 5000
TL
5001 TL – 7000
TL
7001 TL – 10000
TL
More than
10000 TL
Would prefer not to answer
D.K
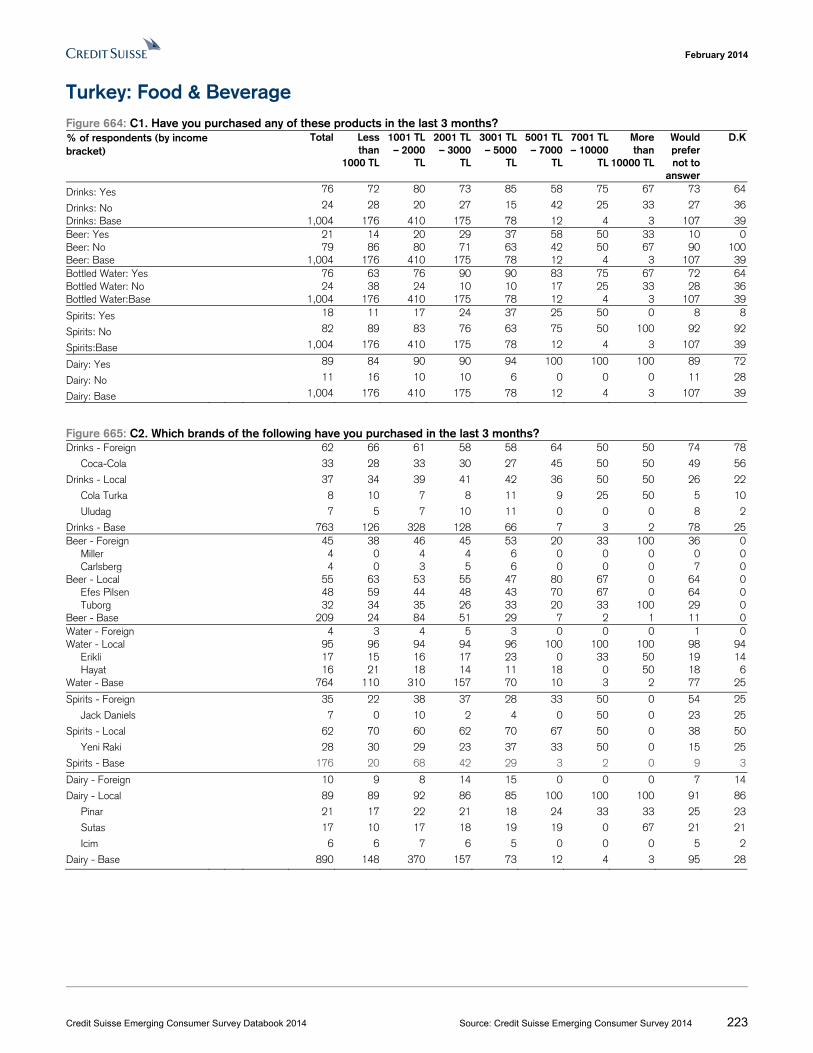
February 2014
Credit Suisse Emerging Consumer Survey Databook 2014 Source: Credit Suisse Emerging Consumer Survey 2014 223
Turkey: Food & Beverage Figure 664: C1. Have you purchased any of these products in the last 3 months? % of respondents (by income bracket)
Total Less than
1000 TL
1001 TL – 2000
TL
2001 TL – 3000
TL
3001 TL – 5000
TL
5001 TL – 7000
TL
7001 TL – 10000
TL
More than
10000 TL
Would prefer not to
answer
D.K
Drinks: Yes 76 72 80 73 85 58 75 67 73 64
Drinks: No 24 28 20 27 15 42 25 33 27 36
Drinks: Base 1,004 176 410 175 78 12 4 3 107 39Beer: Yes 21 14 20 29 37 58 50 33 10 0Beer: No 79 86 80 71 63 42 50 67 90 100Beer: Base 1,004 176 410 175 78 12 4 3 107 39Bottled Water: Yes 76 63 76 90 90 83 75 67 72 64Bottled Water: No 24 38 24 10 10 17 25 33 28 36Bottled Water:Base 1,004 176 410 175 78 12 4 3 107 39
Spirits: Yes 18 11 17 24 37 25 50 0 8 8
Spirits: No 82 89 83 76 63 75 50 100 92 92
Spirits:Base 1,004 176 410 175 78 12 4 3 107 39
Dairy: Yes 89 84 90 90 94 100 100 100 89 72
Dairy: No 11 16 10 10 6 0 0 0 11 28
Dairy: Base 1,004 176 410 175 78 12 4 3 107 39
Figure 665: C2. Which brands of the following have you purchased in the last 3 months? Drinks - Foreign 62 66 61 58 58 64 50 50 74 78
Coca-Cola 33 28 33 30 27 45 50 50 49 56
Drinks - Local 37 34 39 41 42 36 50 50 26 22
Cola Turka 8 10 7 8 11 9 25 50 5 10
Uludag 7 5 7 10 11 0 0 0 8 2
Drinks - Base 763 126 328 128 66 7 3 2 78 25Beer - Foreign 45 38 46 45 53 20 33 100 36 0 Miller 4 0 4 4 6 0 0 0 0 0 Carlsberg 4 0 3 5 6 0 0 0 7 0Beer - Local 55 63 53 55 47 80 67 0 64 0 Efes Pilsen 48 59 44 48 43 70 67 0 64 0 Tuborg 32 34 35 26 33 20 33 100 29 0Beer - Base 209 24 84 51 29 7 2 1 11 0Water - Foreign 4 3 4 5 3 0 0 0 1 0Water - Local 95 96 94 94 96 100 100 100 98 94 Erikli 17 15 16 17 23 0 33 50 19 14 Hayat 16 21 18 14 11 18 0 50 18 6Water - Base 764 110 310 157 70 10 3 2 77 25
Spirits - Foreign 35 22 38 37 28 33 50 0 54 25
Jack Daniels 7 0 10 2 4 0 50 0 23 25
Spirits - Local 62 70 60 62 70 67 50 0 38 50
Yeni Raki 28 30 29 23 37 33 50 0 15 25
Spirits - Base 176 20 68 42 29 3 2 0 9 3
Dairy - Foreign 10 9 8 14 15 0 0 0 7 14
Dairy - Local 89 89 92 86 85 100 100 100 91 86
Pinar 21 17 22 21 18 24 33 33 25 23
Sutas 17 10 17 18 19 19 0 67 21 21
Icim 6 6 7 6 5 0 0 0 5 2
Dairy - Base 890 148 370 157 73 12 4 3 95 28
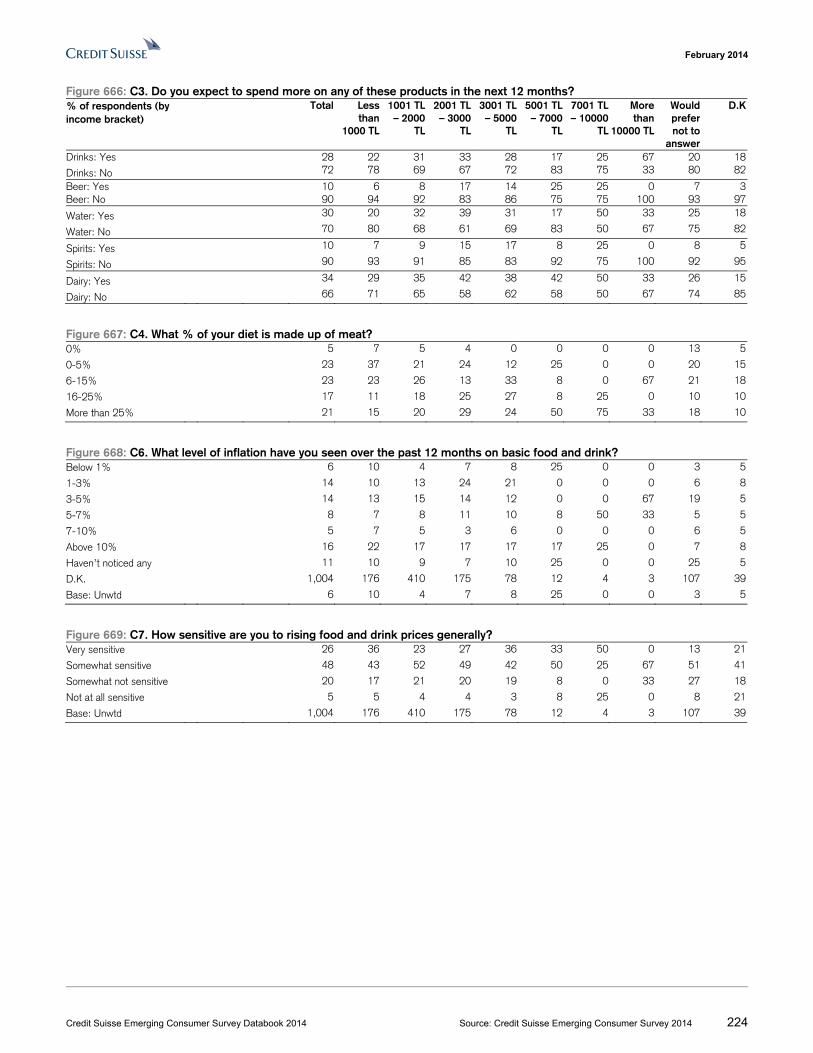
February 2014
Credit Suisse Emerging Consumer Survey Databook 2014 Source: Credit Suisse Emerging Consumer Survey 2014 224
Figure 666: C3. Do you expect to spend more on any of these products in the next 12 months? % of respondents (by income bracket)
Total Less than
1000 TL
1001 TL – 2000
TL
2001 TL – 3000
TL
3001 TL – 5000
TL
5001 TL – 7000
TL
7001 TL – 10000
TL
More than
10000 TL
Would prefer not to
answer
D.K
Drinks: Yes 28 22 31 33 28 17 25 67 20 18
Drinks: No 72 78 69 67 72 83 75 33 80 82
Beer: Yes 10 6 8 17 14 25 25 0 7 3Beer: No 90 94 92 83 86 75 75 100 93 97
Water: Yes 30 20 32 39 31 17 50 33 25 18
Water: No 70 80 68 61 69 83 50 67 75 82
Spirits: Yes 10 7 9 15 17 8 25 0 8 5
Spirits: No 90 93 91 85 83 92 75 100 92 95
Dairy: Yes 34 29 35 42 38 42 50 33 26 15
Dairy: No 66 71 65 58 62 58 50 67 74 85
Figure 667: C4. What % of your diet is made up of meat? 0% 5 7 5 4 0 0 0 0 13 5
0-5% 23 37 21 24 12 25 0 0 20 15
6-15% 23 23 26 13 33 8 0 67 21 18
16-25% 17 11 18 25 27 8 25 0 10 10
More than 25% 21 15 20 29 24 50 75 33 18 10
Figure 668: C6. What level of inflation have you seen over the past 12 months on basic food and drink? Below 1% 6 10 4 7 8 25 0 0 3 5
1-3% 14 10 13 24 21 0 0 0 6 8
3-5% 14 13 15 14 12 0 0 67 19 5
5-7% 8 7 8 11 10 8 50 33 5 5
7-10% 5 7 5 3 6 0 0 0 6 5
Above 10% 16 22 17 17 17 17 25 0 7 8
Haven’t noticed any 11 10 9 7 10 25 0 0 25 5
D.K. 1,004 176 410 175 78 12 4 3 107 39
Base: Unwtd 6 10 4 7 8 25 0 0 3 5
Figure 669: C7. How sensitive are you to rising food and drink prices generally? Very sensitive 26 36 23 27 36 33 50 0 13 21
Somewhat sensitive 48 43 52 49 42 50 25 67 51 41
Somewhat not sensitive 20 17 21 20 19 8 0 33 27 18
Not at all sensitive 5 5 4 4 3 8 25 0 8 21
Base: Unwtd 1,004 176 410 175 78 12 4 3 107 39
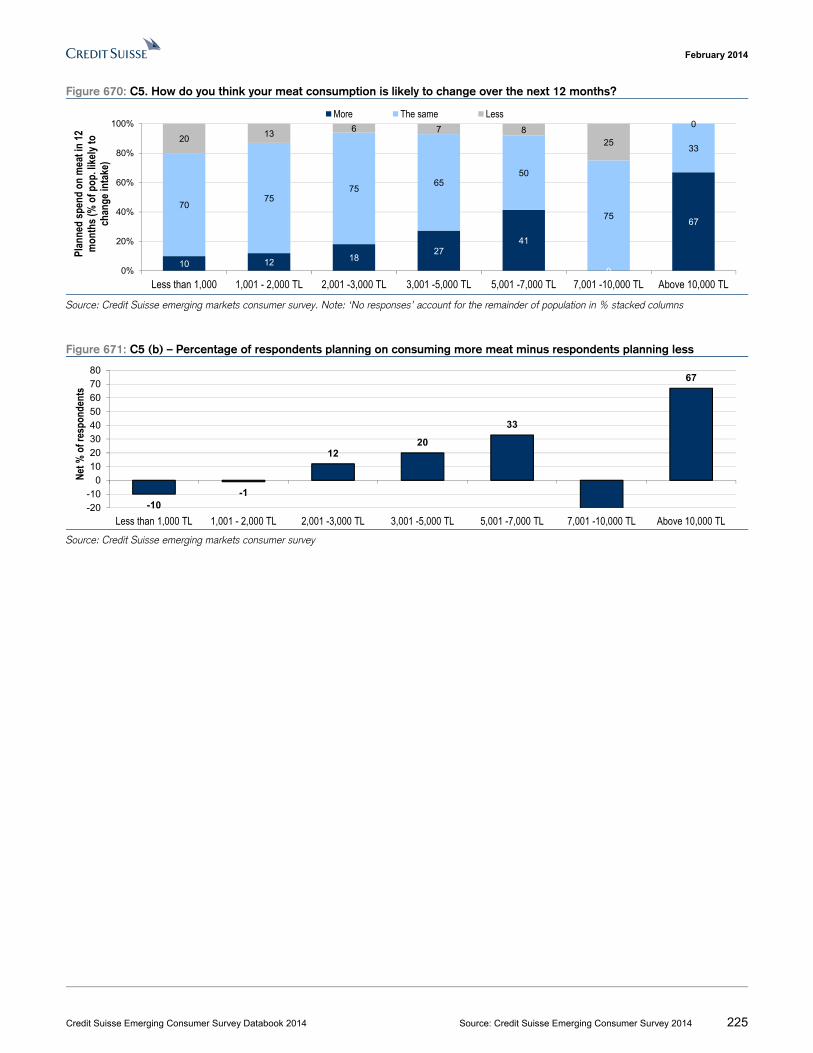
February 2014
Credit Suisse Emerging Consumer Survey Databook 2014 Source: Credit Suisse Emerging Consumer Survey 2014 225
Figure 670: C5. How do you think your meat consumption is likely to change over the next 12 months?
Source: Credit Suisse emerging markets consumer survey. Note: ‘No responses’ account for the remainder of population in % stacked columns
Figure 671: C5 (b) – Percentage of respondents planning on consuming more meat minus respondents planning less
Source: Credit Suisse emerging markets consumer survey
10 12 1827
41
0
67
7075
7565
50
75
3320
136 7 8
25
0
0%
20%
40%
60%
80%
100%
Less than 1,000 1,001 - 2,000 TL 2,001 -3,000 TL 3,001 -5,000 TL 5,001 -7,000 TL 7,001 -10,000 TL Above 10,000 TL
Plan
ned
spen
d on
mea
t in
12
mon
ths (
% o
f pop
. like
ly to
ch
ange
inta
ke)
More The same Less
-10-1
1220
33
67
-20
-10
0
10
20
30
40
50
60
70
80
Less than 1,000 TL 1,001 - 2,000 TL 2,001 -3,000 TL 3,001 -5,000 TL 5,001 -7,000 TL 7,001 -10,000 TL Above 10,000 TL
Net %
of r
espo
nden
ts
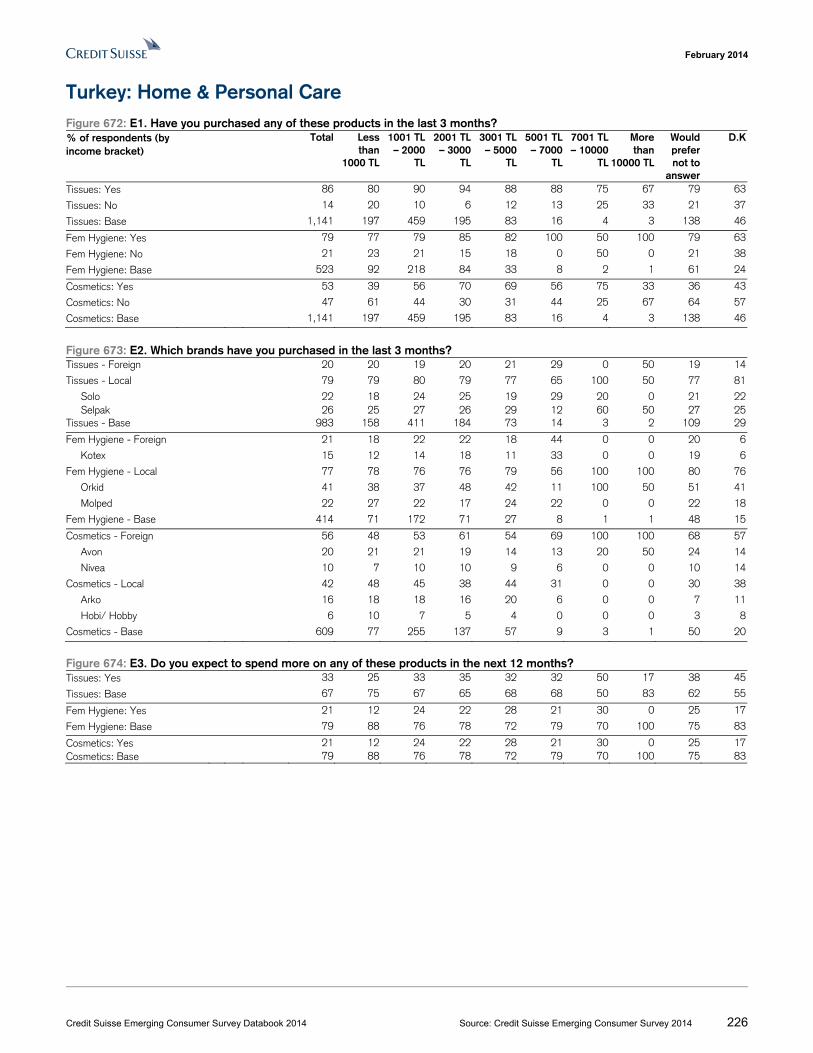
February 2014
Credit Suisse Emerging Consumer Survey Databook 2014 Source: Credit Suisse Emerging Consumer Survey 2014 226
Turkey: Home & Personal Care Figure 672: E1. Have you purchased any of these products in the last 3 months? % of respondents (by income bracket)
Total Less than
1000 TL
1001 TL – 2000
TL
2001 TL – 3000
TL
3001 TL – 5000
TL
5001 TL – 7000
TL
7001 TL – 10000
TL
More than
10000 TL
Would prefernot to
answer
D.K
Tissues: Yes 86 80 90 94 88 88 75 67 79 63
Tissues: No 14 20 10 6 12 13 25 33 21 37
Tissues: Base 1,141 197 459 195 83 16 4 3 138 46
Fem Hygiene: Yes 79 77 79 85 82 100 50 100 79 63
Fem Hygiene: No 21 23 21 15 18 0 50 0 21 38
Fem Hygiene: Base 523 92 218 84 33 8 2 1 61 24
Cosmetics: Yes 53 39 56 70 69 56 75 33 36 43
Cosmetics: No 47 61 44 30 31 44 25 67 64 57
Cosmetics: Base 1,141 197 459 195 83 16 4 3 138 46
Figure 673: E2. Which brands have you purchased in the last 3 months? Tissues - Foreign 20 20 19 20 21 29 0 50 19 14
Tissues - Local 79 79 80 79 77 65 100 50 77 81
Solo 22 18 24 25 19 29 20 0 21 22 Selpak 26 25 27 26 29 12 60 50 27 25Tissues - Base 983 158 411 184 73 14 3 2 109 29
Fem Hygiene - Foreign 21 18 22 22 18 44 0 0 20 6
Kotex 15 12 14 18 11 33 0 0 19 6
Fem Hygiene - Local 77 78 76 76 79 56 100 100 80 76
Orkid 41 38 37 48 42 11 100 50 51 41
Molped 22 27 22 17 24 22 0 0 22 18
Fem Hygiene - Base 414 71 172 71 27 8 1 1 48 15
Cosmetics - Foreign 56 48 53 61 54 69 100 100 68 57
Avon 20 21 21 19 14 13 20 50 24 14
Nivea 10 7 10 10 9 6 0 0 10 14
Cosmetics - Local 42 48 45 38 44 31 0 0 30 38
Arko 16 18 18 16 20 6 0 0 7 11
Hobi/ Hobby 6 10 7 5 4 0 0 0 3 8
Cosmetics - Base 609 77 255 137 57 9 3 1 50 20
Figure 674: E3. Do you expect to spend more on any of these products in the next 12 months? Tissues: Yes 33 25 33 35 32 32 50 17 38 45
Tissues: Base 67 75 67 65 68 68 50 83 62 55
Fem Hygiene: Yes 21 12 24 22 28 21 30 0 25 17
Fem Hygiene: Base 79 88 76 78 72 79 70 100 75 83
Cosmetics: Yes 21 12 24 22 28 21 30 0 25 17Cosmetics: Base 79 88 76 78 72 79 70 100 75 83
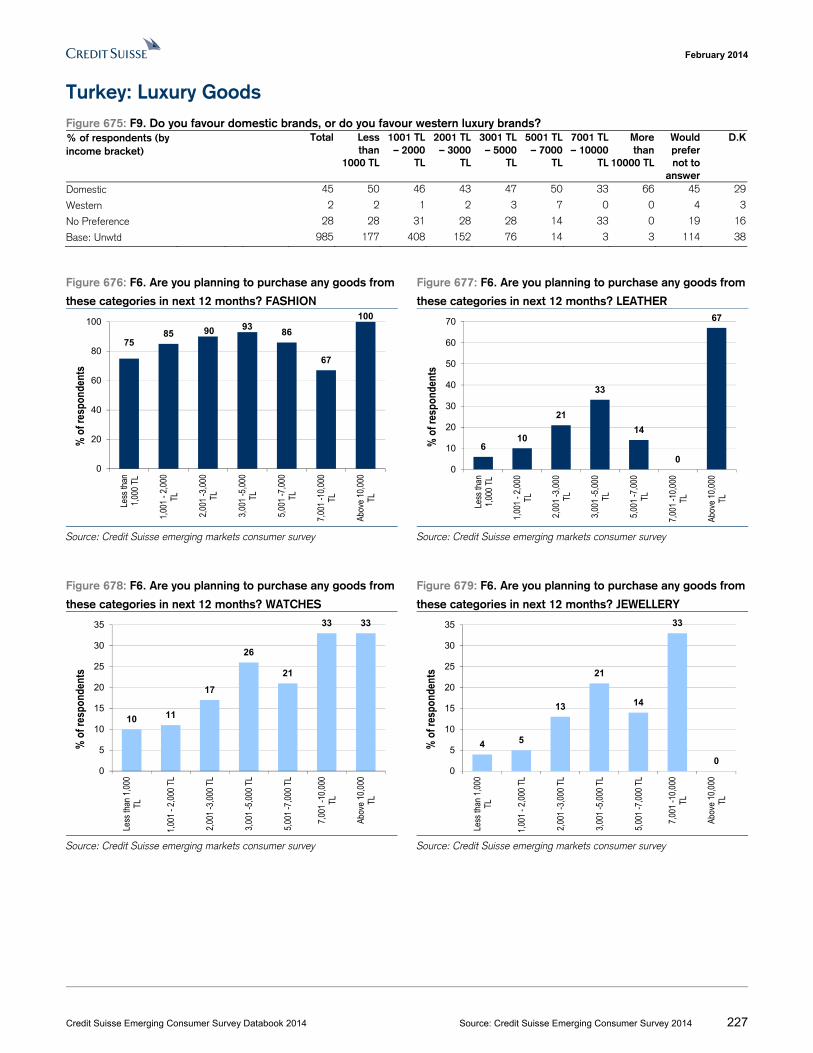
February 2014
Credit Suisse Emerging Consumer Survey Databook 2014 Source: Credit Suisse Emerging Consumer Survey 2014 227
Turkey: Luxury Goods Figure 675: F9. Do you favour domestic brands, or do you favour western luxury brands? % of respondents (by income bracket)
Total Less than
1000 TL
1001 TL – 2000
TL
2001 TL – 3000
TL
3001 TL – 5000
TL
5001 TL – 7000
TL
7001 TL – 10000
TL
More than
10000 TL
Would prefer not to
answer
D.K
Domestic 45 50 46 43 47 50 33 66 45 29
Western 2 2 1 2 3 7 0 0 4 3
No Preference 28 28 31 28 28 14 33 0 19 16
Base: Unwtd 985 177 408 152 76 14 3 3 114 38
Figure 676: F6. Are you planning to purchase any goods from
these categories in next 12 months? FASHION
Figure 677: F6. Are you planning to purchase any goods from
these categories in next 12 months? LEATHER
Source: Credit Suisse emerging markets consumer survey Source: Credit Suisse emerging markets consumer survey
Figure 678: F6. Are you planning to purchase any goods from
these categories in next 12 months? WATCHES
Figure 679: F6. Are you planning to purchase any goods from
these categories in next 12 months? JEWELLERY
Source: Credit Suisse emerging markets consumer survey Source: Credit Suisse emerging markets consumer survey
7585 90 93
86
67
100
0
20
40
60
80
100
Less
than
1,00
0 TL
1,00
1 - 2
,000
TL
2,00
1 -3
,000
TL
3,00
1 -5
,000
TL
5,00
1 -7
,000
TL
7,00
1 -1
0,00
0TL
Abov
e 10
,000
TL
% o
f res
pond
ents
610
21
33
14
0
67
0
10
20
30
40
50
60
70
Less
than
1,00
0 TL
1,00
1 - 2
,000
TL
2,00
1 -3
,000
TL
3,00
1 -5
,000
TL
5,00
1 -7
,000
TL
7,00
1 -1
0,00
0TL
Abov
e 10
,000
TL
% o
f res
pond
ents
10 11
17
26
21
33 33
0
5
10
15
20
25
30
35
Less
than
1,0
00TL
1,00
1 - 2
,000
TL
2,00
1 -3
,000
TL
3,00
1 -5
,000
TL
5,00
1 -7
,000
TL
7,00
1 -1
0,00
0TL
Abov
e 10
,000
TL
% o
f res
pond
ents
4 5
13
21
14
33
00
5
10
15
20
25
30
35
Less
than
1,0
00TL
1,00
1 - 2
,000
TL
2,00
1 -3
,000
TL
3,00
1 -5
,000
TL
5,00
1 -7
,000
TL
7,00
1 -1
0,00
0TL
Abov
e 10
,000
TL
% o
f res
pond
ents
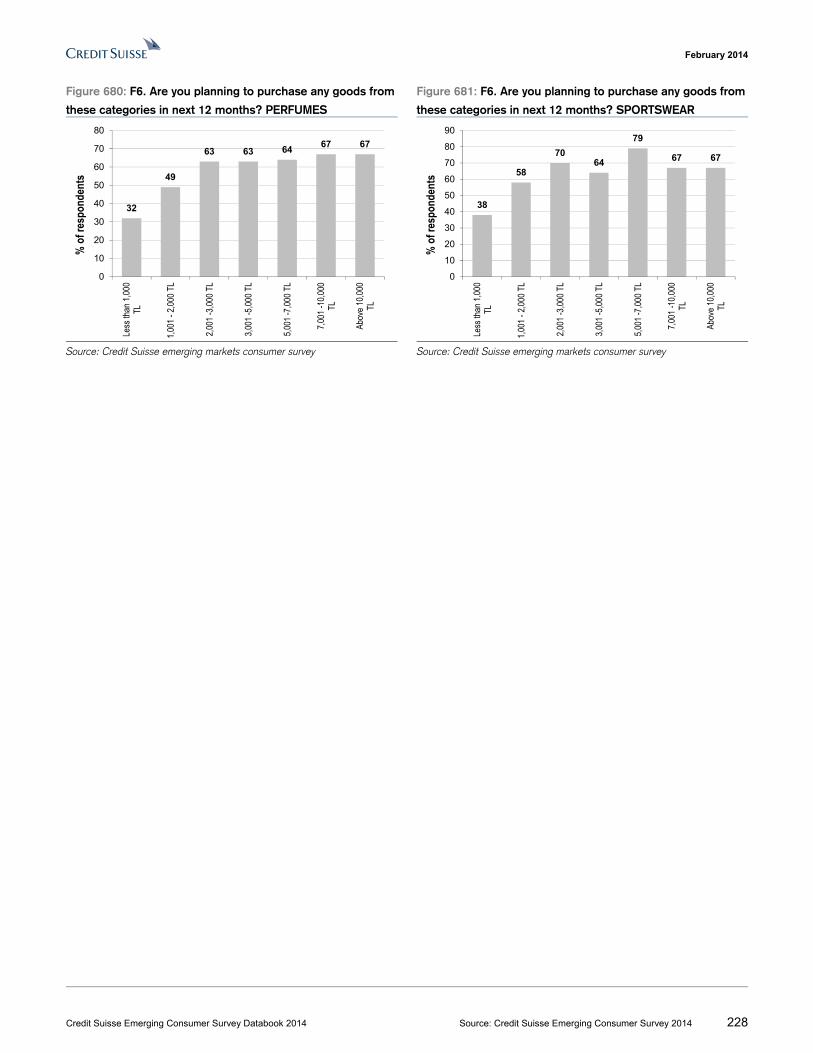
February 2014
Credit Suisse Emerging Consumer Survey Databook 2014 Source: Credit Suisse Emerging Consumer Survey 2014 228
Figure 680: F6. Are you planning to purchase any goods from
these categories in next 12 months? PERFUMES
Figure 681: F6. Are you planning to purchase any goods from
these categories in next 12 months? SPORTSWEAR
Source: Credit Suisse emerging markets consumer survey Source: Credit Suisse emerging markets consumer survey
32
49
63 63 6467 67
0
10
20
30
40
50
60
70
80Le
ss th
an 1
,000
TL
1,00
1 - 2
,000
TL
2,00
1 -3
,000
TL
3,00
1 -5
,000
TL
5,00
1 -7
,000
TL
7,00
1 -1
0,00
0TL
Abov
e 10
,000
TL
% o
f res
pond
ents
38
58
7064
79
67 67
0
10
20
30
40
50
60
70
80
90
Less
than
1,0
00TL
1,00
1 - 2
,000
TL
2,00
1 -3
,000
TL
3,00
1 -5
,000
TL
5,00
1 -7
,000
TL
7,00
1 -1
0,00
0TL
Abov
e 10
,000
TL
% o
f res
pond
ents
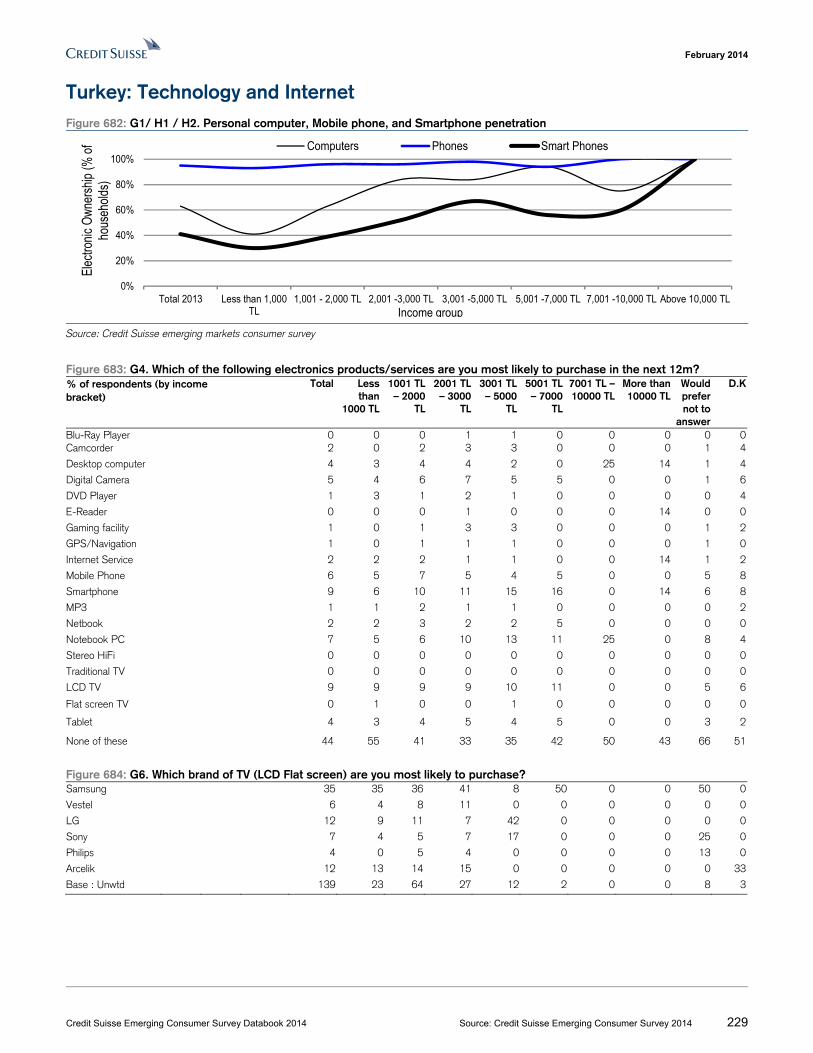
February 2014
Credit Suisse Emerging Consumer Survey Databook 2014 Source: Credit Suisse Emerging Consumer Survey 2014 229
Turkey: Technology and Internet Figure 682: G1/ H1 / H2. Personal computer, Mobile phone, and Smartphone penetration
Source: Credit Suisse emerging markets consumer survey
Figure 683: G4. Which of the following electronics products/services are you most likely to purchase in the next 12m? % of respondents (by income bracket)
Total Less than
1000 TL
1001 TL – 2000
TL
2001 TL – 3000
TL
3001 TL – 5000
TL
5001 TL – 7000
TL
7001 TL – 10000 TL
More than 10000 TL
Would prefer not to
answer
D.K
Blu-Ray Player 0 0 0 1 1 0 0 0 0 0Camcorder 2 0 2 3 3 0 0 0 1 4
Desktop computer 4 3 4 4 2 0 25 14 1 4
Digital Camera 5 4 6 7 5 5 0 0 1 6
DVD Player 1 3 1 2 1 0 0 0 0 4
E-Reader 0 0 0 1 0 0 0 14 0 0
Gaming facility 1 0 1 3 3 0 0 0 1 2
GPS/Navigation 1 0 1 1 1 0 0 0 1 0
Internet Service 2 2 2 1 1 0 0 14 1 2
Mobile Phone 6 5 7 5 4 5 0 0 5 8
Smartphone 9 6 10 11 15 16 0 14 6 8
MP3 1 1 2 1 1 0 0 0 0 2
Netbook 2 2 3 2 2 5 0 0 0 0
Notebook PC 7 5 6 10 13 11 25 0 8 4
Stereo HiFi 0 0 0 0 0 0 0 0 0 0
Traditional TV 0 0 0 0 0 0 0 0 0 0
LCD TV 9 9 9 9 10 11 0 0 5 6
Flat screen TV 0 1 0 0 1 0 0 0 0 0
Tablet 4 3 4 5 4 5 0 0 3 2
None of these 44 55 41 33 35 42 50 43 66 51
Figure 684: G6. Which brand of TV (LCD Flat screen) are you most likely to purchase? Samsung 35 35 36 41 8 50 0 0 50 0
Vestel 6 4 8 11 0 0 0 0 0 0
LG 12 9 11 7 42 0 0 0 0 0
Sony 7 4 5 7 17 0 0 0 25 0
Philips 4 0 5 4 0 0 0 0 13 0
Arcelik 12 13 14 15 0 0 0 0 0 33
Base : Unwtd 139 23 64 27 12 2 0 0 8 3
0%
20%
40%
60%
80%
100%
Total 2013 Less than 1,000TL
1,001 - 2,000 TL 2,001 -3,000 TL 3,001 -5,000 TL 5,001 -7,000 TL 7,001 -10,000 TL Above 10,000 TL
Elec
troni
c O
wner
ship
(% o
f ho
useh
olds
)
Computers Phones Smart Phones
Income group
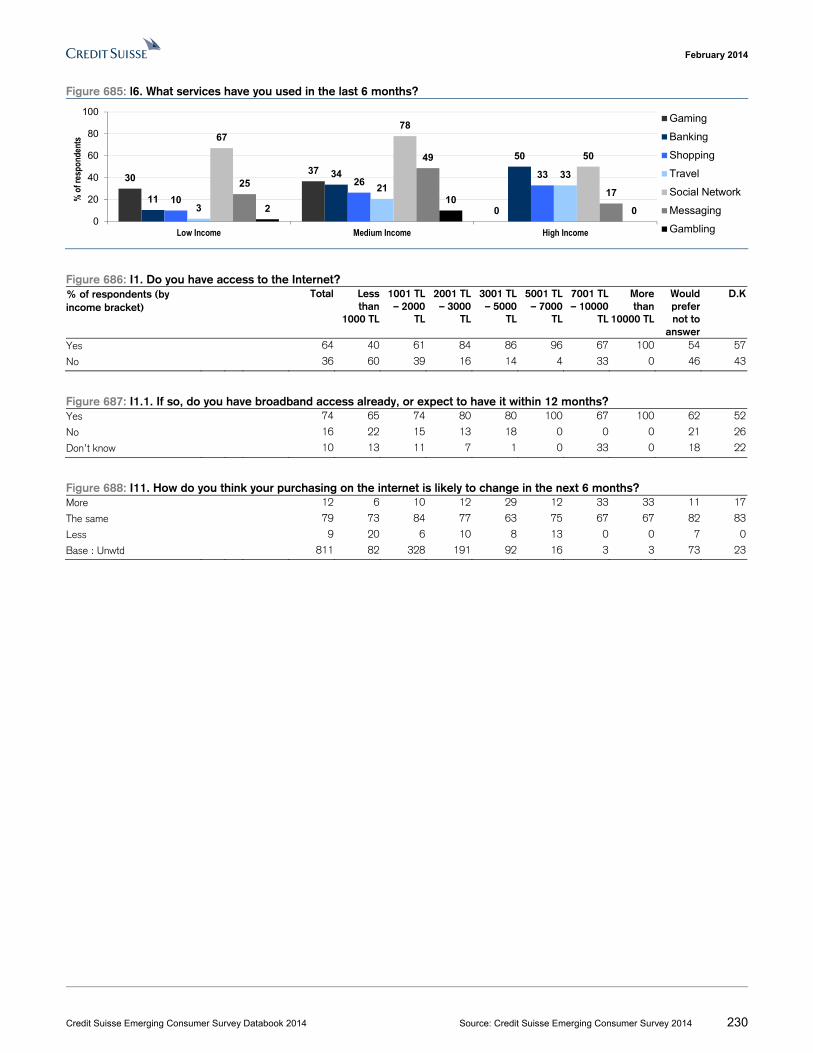
February 2014
Credit Suisse Emerging Consumer Survey Databook 2014 Source: Credit Suisse Emerging Consumer Survey 2014 230
Figure 685: l6. What services have you used in the last 6 months?
Figure 686: I1. Do you have access to the Internet? % of respondents (by income bracket)
Total Less than
1000 TL
1001 TL – 2000
TL
2001 TL – 3000
TL
3001 TL – 5000
TL
5001 TL – 7000
TL
7001 TL – 10000
TL
More than
10000 TL
Would prefer not to
answer
D.K
Yes 64 40 61 84 86 96 67 100 54 57
No 36 60 39 16 14 4 33 0 46 43
Figure 687: I1.1. If so, do you have broadband access already, or expect to have it within 12 months? Yes 74 65 74 80 80 100 67 100 62 52
No 16 22 15 13 18 0 0 0 21 26
Don’t know 10 13 11 7 1 0 33 0 18 22
Figure 688: I11. How do you think your purchasing on the internet is likely to change in the next 6 months? More 12 6 10 12 29 12 33 33 11 17
The same 79 73 84 77 63 75 67 67 82 83
Less 9 20 6 10 8 13 0 0 7 0
Base : Unwtd 811 82 328 191 92 16 3 3 73 23
3037
011
34
50
10
2633
3
2133
6778
50
25
49
17
210
00
20
40
60
80
100
Low Income Medium Income High Income
% o
f res
pond
ents
Gaming
Banking
Shopping
Travel
Social Network
Messaging
Gambling
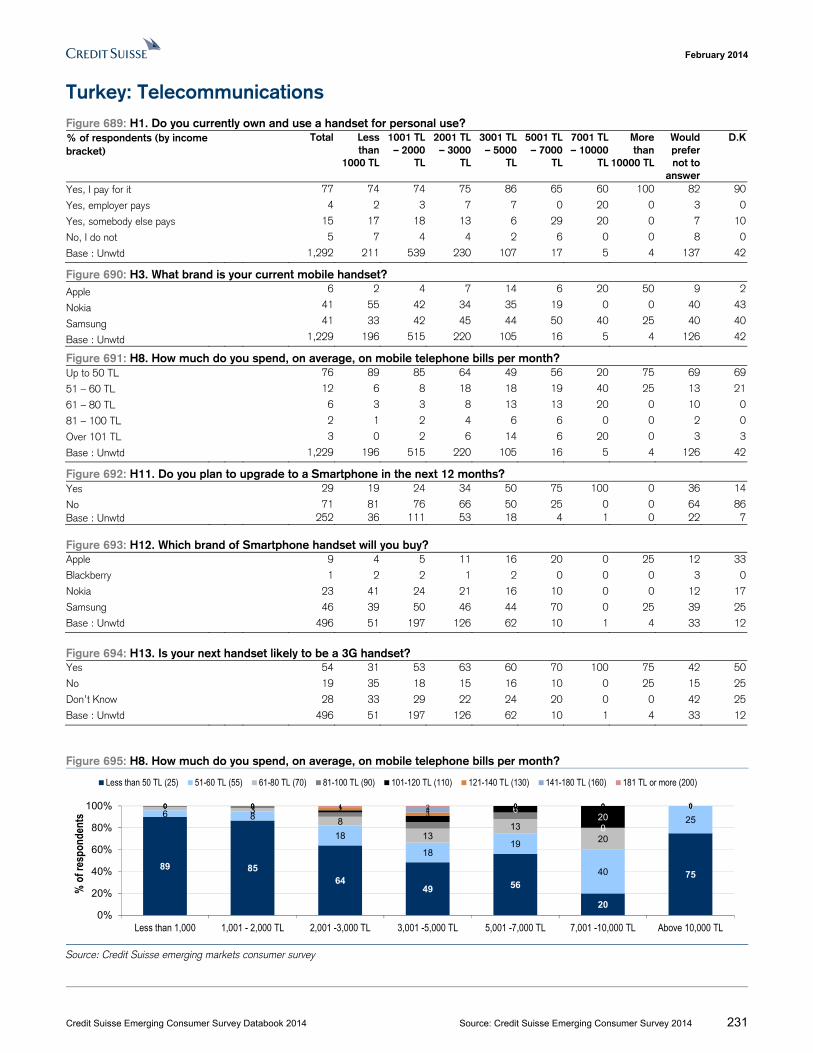
February 2014
Credit Suisse Emerging Consumer Survey Databook 2014 Source: Credit Suisse Emerging Consumer Survey 2014 231
Turkey: Telecommunications Figure 689: H1. Do you currently own and use a handset for personal use? % of respondents (by income bracket)
Total Less than
1000 TL
1001 TL – 2000
TL
2001 TL – 3000
TL
3001 TL – 5000
TL
5001 TL – 7000
TL
7001 TL – 10000
TL
More than
10000 TL
Would prefer not to
answer
D.K
Yes, I pay for it 77 74 74 75 86 65 60 100 82 90
Yes, employer pays 4 2 3 7 7 0 20 0 3 0
Yes, somebody else pays 15 17 18 13 6 29 20 0 7 10
No, I do not 5 7 4 4 2 6 0 0 8 0
Base : Unwtd 1,292 211 539 230 107 17 5 4 137 42
Figure 690: H3. What brand is your current mobile handset? Apple 6 2 4 7 14 6 20 50 9 2
Nokia 41 55 42 34 35 19 0 0 40 43
Samsung 41 33 42 45 44 50 40 25 40 40
Base : Unwtd 1,229 196 515 220 105 16 5 4 126 42
Figure 691: H8. How much do you spend, on average, on mobile telephone bills per month? Up to 50 TL 76 89 85 64 49 56 20 75 69 69
51 – 60 TL 12 6 8 18 18 19 40 25 13 21
61 – 80 TL 6 3 3 8 13 13 20 0 10 0
81 – 100 TL 2 1 2 4 6 6 0 0 2 0
Over 101 TL 3 0 2 6 14 6 20 0 3 3
Base : Unwtd 1,229 196 515 220 105 16 5 4 126 42
Figure 692: H11. Do you plan to upgrade to a Smartphone in the next 12 months? Yes 29 19 24 34 50 75 100 0 36 14
No 71 81 76 66 50 25 0 0 64 86Base : Unwtd 252 36 111 53 18 4 1 0 22 7 Figure 693: H12. Which brand of Smartphone handset will you buy? Apple 9 4 5 11 16 20 0 25 12 33
Blackberry 1 2 2 1 2 0 0 0 3 0
Nokia 23 41 24 21 16 10 0 0 12 17
Samsung 46 39 50 46 44 70 0 25 39 25
Base : Unwtd 496 51 197 126 62 10 1 4 33 12
Figure 694: H13. Is your next handset likely to be a 3G handset? Yes 54 31 53 63 60 70 100 75 42 50
No 19 35 18 15 16 10 0 25 15 25
Don’t Know 28 33 29 22 24 20 0 0 42 25
Base : Unwtd 496 51 197 126 62 10 1 4 33 12
Figure 695: H8. How much do you spend, on average, on mobile telephone bills per month?
Source: Credit Suisse emerging markets consumer survey
89 8564
49 56
20
75
6 8
18
1819
40
253
8
1313
20
0
0
0620
00 0 23
0 0 00 0 1 40 0 00 0 1 2 0 0 0
0%
20%
40%
60%
80%
100%
Less than 1,000 1,001 - 2,000 TL 2,001 -3,000 TL 3,001 -5,000 TL 5,001 -7,000 TL 7,001 -10,000 TL Above 10,000 TL
% o
f res
pond
ents
Less than 50 TL (25) 51-60 TL (55) 61-80 TL (70) 81-100 TL (90) 101-120 TL (110) 121-140 TL (130) 141-180 TL (160) 181 TL or more (200)
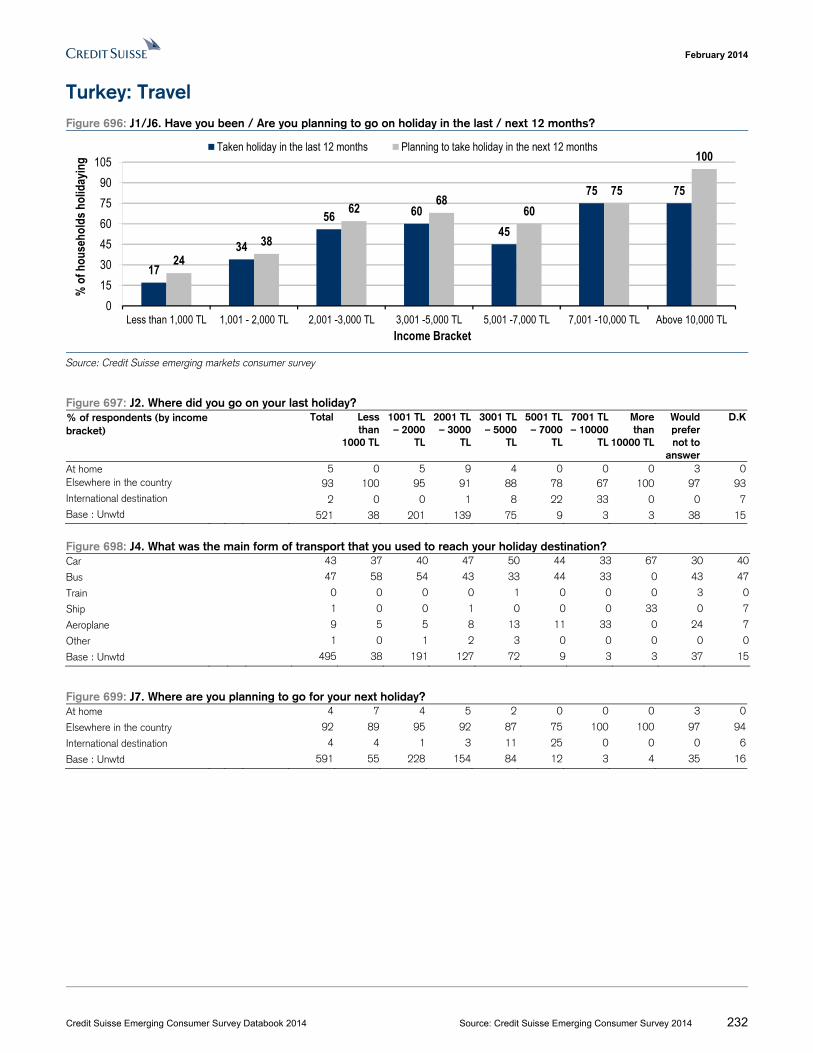
February 2014
Credit Suisse Emerging Consumer Survey Databook 2014 Source: Credit Suisse Emerging Consumer Survey 2014 232
Turkey: Travel Figure 696: J1/J6. Have you been / Are you planning to go on holiday in the last / next 12 months?
Source: Credit Suisse emerging markets consumer survey
Figure 697: J2. Where did you go on your last holiday? % of respondents (by income bracket)
Total Less than
1000 TL
1001 TL – 2000
TL
2001 TL – 3000
TL
3001 TL – 5000
TL
5001 TL – 7000
TL
7001 TL – 10000
TL
More than
10000 TL
Would prefer not to
answer
D.K
At home 5 0 5 9 4 0 0 0 3 0Elsewhere in the country 93 100 95 91 88 78 67 100 97 93International destination 2 0 0 1 8 22 33 0 0 7Base : Unwtd 521 38 201 139 75 9 3 3 38 15
Figure 698: J4. What was the main form of transport that you used to reach your holiday destination? Car 43 37 40 47 50 44 33 67 30 40
Bus 47 58 54 43 33 44 33 0 43 47
Train 0 0 0 0 1 0 0 0 3 0
Ship 1 0 0 1 0 0 0 33 0 7
Aeroplane 9 5 5 8 13 11 33 0 24 7
Other 1 0 1 2 3 0 0 0 0 0
Base : Unwtd 495 38 191 127 72 9 3 3 37 15
Figure 699: J7. Where are you planning to go for your next holiday? At home 4 7 4 5 2 0 0 0 3 0
Elsewhere in the country 92 89 95 92 87 75 100 100 97 94
International destination 4 4 1 3 11 25 0 0 0 6
Base : Unwtd 591 55 228 154 84 12 3 4 35 16
17
34
56 6045
75 75
2438
62 6860
75
100
0
15
30
45
60
75
90
105
Less than 1,000 TL 1,001 - 2,000 TL 2,001 -3,000 TL 3,001 -5,000 TL 5,001 -7,000 TL 7,001 -10,000 TL Above 10,000 TL
% o
f hou
seho
lds h
olid
ayin
g
Income Bracket
Taken holiday in the last 12 months Planning to take holiday in the next 12 months
February 2014
Credit Suisse Emerging Consumer Survey Databook 2014 Source: Credit Suisse Emerging Consumer Survey 2014 233
Turkey: Property Figure 700: K1. Do you or your family live in your own property? % of respondents (by income bracket)
Total Less than
1000 TL
1001 TL – 2000
TL
2001 TL – 3000
TL
3001 TL – 5000
TL
5001 TL – 7000
TL
7001 TL – 10000
TL
More than
10000 TL
Would prefer not to
answer
D.K
Yes 60 50 61 64 67 65 80 100 50 73
No 40 50 39 36 33 35 20 0 50 27
Base : Unwtd 1,235 205 536 216 86 17 5 3 126 41
Figure 701: K2. If you do not own your own property, on what terms do you occupy the property? Rented 84 72 86 96 93 50 100 0 87 82
Allocated 1 2 0 0 4 50 0 0 0 0
Borrowed 8 20 7 1 0 0 0 0 5 0
Base : Unwtd 496 102 207 78 28 6 1 0 63 11
Figure 702: K6. If you are planning to purchase a property in the next 2 years, what is the main motivation for doing so? Upgrade 15 11 20 10 22 13 0 0 17 0
First-time home 59 78 61 65 56 25 50 0 58 67
Investment 18 11 8 20 22 50 50 67 17 33
Change of location 1 0 2 0 0 0 0 33 0 0Holiday property 2 0 2 2 0 13 0 0 8 0Base : Unwtd 167 9 61 51 18 8 2 3 12 3
Figure 703: K9. How, if at all, do you expect local property prices to change in the next 12 months? Increase 38 41 34 39 44 59 40 100 39 30
About the same 39 38 41 43 37 12 60 0 33 32
Decrease 10 6 10 10 6 18 0 0 14 12
Base : Unwtd 1,235 205 536 216 86 17 5 3 126 41
Figure 704: K10. How much of your total wealth is made up of property? Below 25% 29 38 27 31 24 29 40 0 31 12
25% - 50% 14 16 13 19 15 18 0 0 10 7
51% - 75% 13 4 15 14 24 12 40 0 9 5
76% - 95% 6 5 7 7 12 18 0 33 1 2
Above 95% 6 5 6 8 10 12 0 67 2 0
Don't know 32 32 32 22 14 12 20 0 48 73
Base : Unwtd 1,235 205 536 216 86 17 5 3 126 41
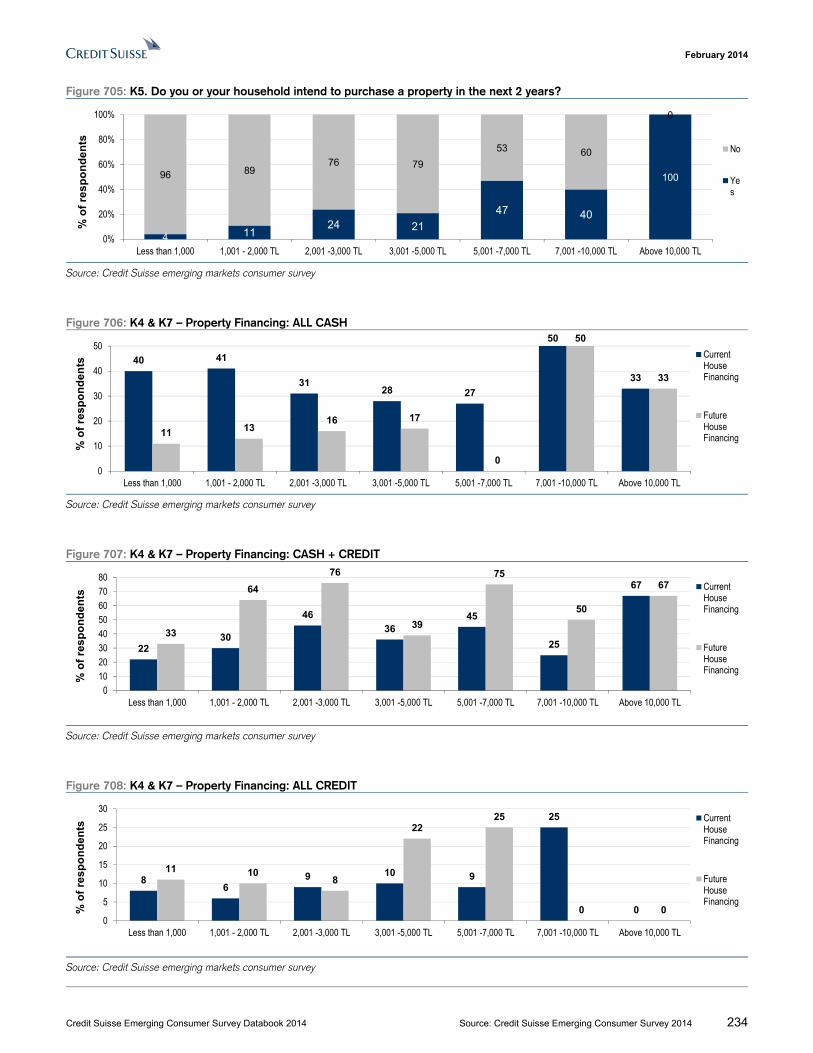
February 2014
Credit Suisse Emerging Consumer Survey Databook 2014 Source: Credit Suisse Emerging Consumer Survey 2014 234
Figure 705: K5. Do you or your household intend to purchase a property in the next 2 years?
Source: Credit Suisse emerging markets consumer survey
Figure 706: K4 & K7 – Property Financing: ALL CASH
Source: Credit Suisse emerging markets consumer survey
Figure 707: K4 & K7 – Property Financing: CASH + CREDIT
Source: Credit Suisse emerging markets consumer survey
Figure 708: K4 & K7 – Property Financing: ALL CREDIT
Source: Credit Suisse emerging markets consumer survey
4 1124 21
47 40
10096 8976 79
53 60
0
0%
20%
40%
60%
80%
100%
Less than 1,000 1,001 - 2,000 TL 2,001 -3,000 TL 3,001 -5,000 TL 5,001 -7,000 TL 7,001 -10,000 TL Above 10,000 TL
% o
f re
sp
on
de
nts
No
Yes
40 41
3128 27
50
33
11 1316 17
0
50
33
0
10
20
30
40
50
Less than 1,000 1,001 - 2,000 TL 2,001 -3,000 TL 3,001 -5,000 TL 5,001 -7,000 TL 7,001 -10,000 TL Above 10,000 TL
% o
f re
spo
nd
ents
CurrentHouseFinancing
FutureHouseFinancing
2230
46
3645
25
67
33
64
76
39
75
50
67
010
2030405060
7080
Less than 1,000 1,001 - 2,000 TL 2,001 -3,000 TL 3,001 -5,000 TL 5,001 -7,000 TL 7,001 -10,000 TL Above 10,000 TL
% o
f re
spo
nd
ents
CurrentHouseFinancing
FutureHouseFinancing
86
9 10 9
25
0
11 108
2225
0 00
5
10
15
20
25
30
Less than 1,000 1,001 - 2,000 TL 2,001 -3,000 TL 3,001 -5,000 TL 5,001 -7,000 TL 7,001 -10,000 TL Above 10,000 TL
% o
f re
spo
nd
ents
CurrentHouseFinancing
FutureHouseFinancing
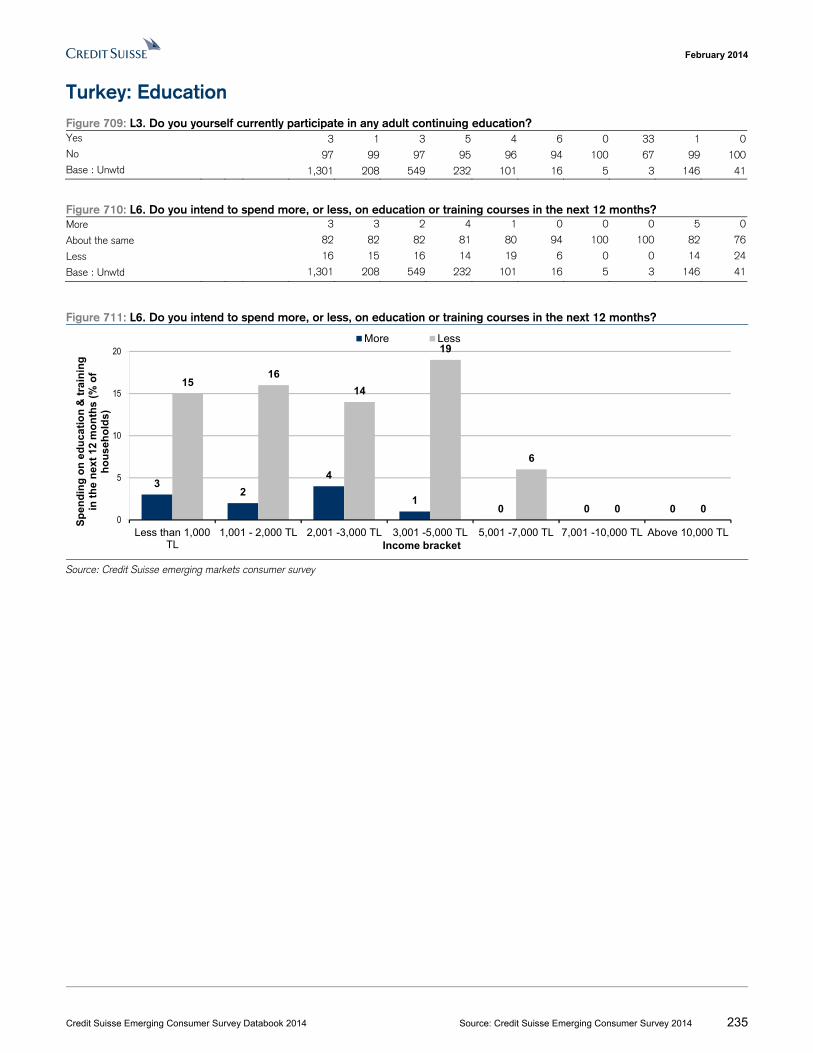
February 2014
Credit Suisse Emerging Consumer Survey Databook 2014 Source: Credit Suisse Emerging Consumer Survey 2014 235
Turkey: Education Figure 709: L3. Do you yourself currently participate in any adult continuing education? Yes 3 1 3 5 4 6 0 33 1 0No 97 99 97 95 96 94 100 67 99 100Base : Unwtd 1,301 208 549 232 101 16 5 3 146 41
Figure 710: L6. Do you intend to spend more, or less, on education or training courses in the next 12 months? More 3 3 2 4 1 0 0 0 5 0
About the same 82 82 82 81 80 94 100 100 82 76
Less 16 15 16 14 19 6 0 0 14 24
Base : Unwtd 1,301 208 549 232 101 16 5 3 146 41
Figure 711: L6. Do you intend to spend more, or less, on education or training courses in the next 12 months?
Source: Credit Suisse emerging markets consumer survey
32
4
10 0 0
1516
14
19
6
0 00
5
10
15
20
Less than 1,000TL
1,001 - 2,000 TL 2,001 -3,000 TL 3,001 -5,000 TL 5,001 -7,000 TL 7,001 -10,000 TL Above 10,000 TL
Sp
end
ing
on
ed
uca
tio
n &
tra
inin
g
in t
he
nex
t 12
mo
nth
s (
% o
f h
ou
seh
old
s)
Income bracket
More Less
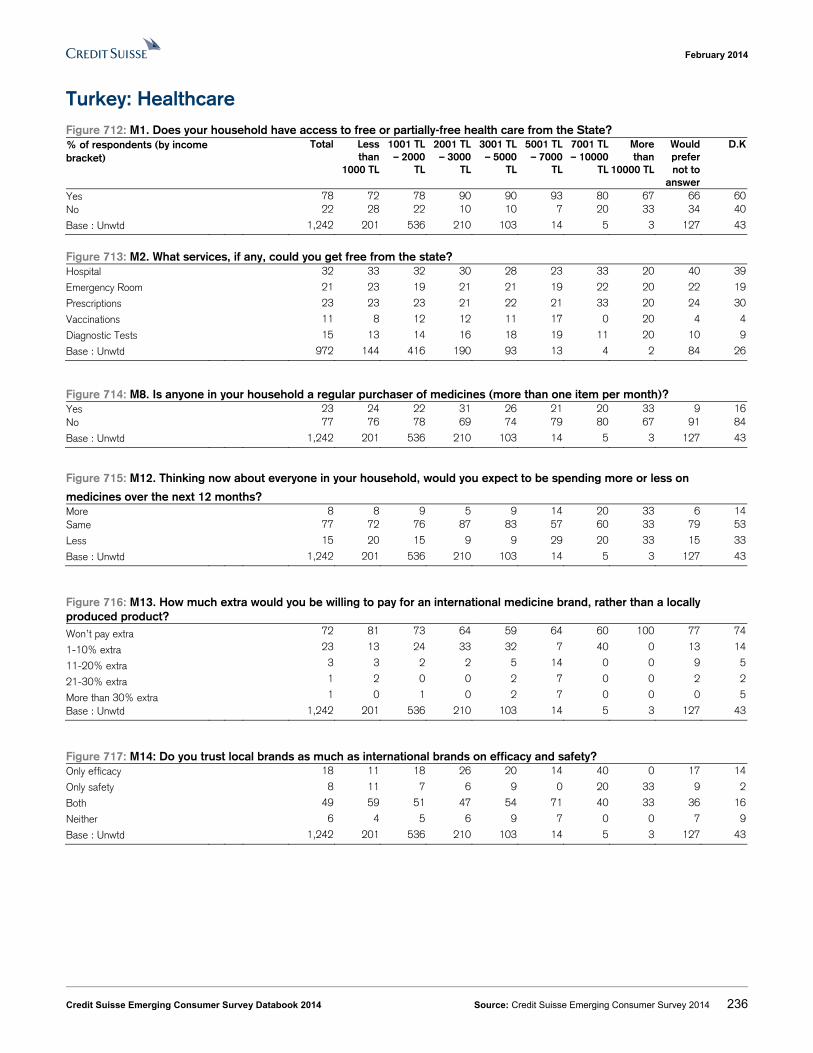
February 2014
Credit Suisse Emerging Consumer Survey Databook 2014 Source: Credit Suisse Emerging Consumer Survey 2014 236
Turkey: Healthcare Figure 712: M1. Does your household have access to free or partially-free health care from the State? % of respondents (by income bracket)
Total Less than
1000 TL
1001 TL – 2000
TL
2001 TL – 3000
TL
3001 TL – 5000
TL
5001 TL – 7000
TL
7001 TL – 10000
TL
More than
10000 TL
Would prefer not to
answer
D.K
Yes 78 72 78 90 90 93 80 67 66 60No 22 28 22 10 10 7 20 33 34 40
Base : Unwtd 1,242 201 536 210 103 14 5 3 127 43
Figure 713: M2. What services, if any, could you get free from the state? Hospital 32 33 32 30 28 23 33 20 40 39
Emergency Room 21 23 19 21 21 19 22 20 22 19
Prescriptions 23 23 23 21 22 21 33 20 24 30
Vaccinations 11 8 12 12 11 17 0 20 4 4
Diagnostic Tests 15 13 14 16 18 19 11 20 10 9
Base : Unwtd 972 144 416 190 93 13 4 2 84 26
Figure 714: M8. Is anyone in your household a regular purchaser of medicines (more than one item per month)? Yes 23 24 22 31 26 21 20 33 9 16No 77 76 78 69 74 79 80 67 91 84
Base : Unwtd 1,242 201 536 210 103 14 5 3 127 43
Figure 715: M12. Thinking now about everyone in your household, would you expect to be spending more or less on
medicines over the next 12 months? More 8 8 9 5 9 14 20 33 6 14Same 77 72 76 87 83 57 60 33 79 53
Less 15 20 15 9 9 29 20 33 15 33
Base : Unwtd 1,242 201 536 210 103 14 5 3 127 43
Figure 716: M13. How much extra would you be willing to pay for an international medicine brand, rather than a locally produced product? Won’t pay extra 72 81 73 64 59 64 60 100 77 74
1-10% extra 23 13 24 33 32 7 40 0 13 14
11-20% extra 3 3 2 2 5 14 0 0 9 5
21-30% extra 1 2 0 0 2 7 0 0 2 2
More than 30% extra 1 0 1 0 2 7 0 0 0 5
Base : Unwtd 1,242 201 536 210 103 14 5 3 127 43
Figure 717: M14: Do you trust local brands as much as international brands on efficacy and safety? Only efficacy 18 11 18 26 20 14 40 0 17 14
Only safety 8 11 7 6 9 0 20 33 9 2
Both 49 59 51 47 54 71 40 33 36 16
Neither 6 4 5 6 9 7 0 0 7 9
Base : Unwtd 1,242 201 536 210 103 14 5 3 127 43
February 2014
Credit Suisse Emerging Consumer Survey Databook 2014 Source: Credit Suisse Emerging Consumer Survey 2014 237
Appendix: Methodology The Credit Suisse Emerging Market Consumer Survey was carried out by the global marketing firm, The Nielsen Company, in Q3 2013. This builds upon and expands work undertaken by Credit Suisse in the Emerging Consumer Survey (published in 2013, 2012 and 2011) and the China Consumer Survey (published annually since 2005).
This survey was conducted across nine emerging countries: China, India, Russia, Brazil, Mexico, Saudi Arabia, South Africa, Turkey and Indonesia. The data set consists of more than 2,500 successful interviews in both China and India and more than 1,500 in the other seven countries.
The interviews were conducted across several cities and rural areas in each country, with urban respondents accounting for roughly 70% of the interviews and rural respondents making up the balance, except for Saudi Arabia, where the breakdown was approximately 90:10. A gender split of 50% male and 50% female was the aim throughout the markets.
The survey adopted a face-to-face interviewing method for all respondents, with interviews taking place on the street and in people’s homes. While cross-region consistency was the aim in constructing the survey from the outset, the questionnaires were adjusted slightly to account of local factors in each country with the surveyor guiding the interviewee through the process from start to finish. Screening questions were asked of respondents willing to cooperate. Qualified respondents continued to the main questionnaire.
Only fully complete interviews were accepted as successful interviews. Samples were distributed to make the survey representative of the national population, and respondents were thus spread over a range of income brackets, ages, professions, and educational levels.
Those who work for (or have family members or close friends working for) marketing, market research, media or PR companies were disqualified from the survey. Similarly, those working in industries related to the questions we were asking skipped the corresponding section. In any instance where a family member did not control household finances, but still made purchasing decisions, they were still classed as a consumer and surveyed.
Interviews were carried out throughout the week, with different sections of the population ‘targeted’ depending on the time of day, thereby ensuring a representative sample. Doing so ensured a biased proportion of employed or unemployed participants were not surveyed. Depending on the number of sections relevant to each surveyee the length of the questionnaire was between 25-35 minutes.
February 2014
Credit Suisse Emerging Consumer Survey Databook 2014 Source: Credit Suisse Emerging Consumer Survey 2014 238
About the survey This report has been produced using market research gathered by The Nielsen Company. This has given the Credit Suisse Research Institute the ability to conduct a consistent multi-region survey while also incorporating questions specific to the countries surveyed in the report.
Nielsen is a leader in data measurement and information across a wide range of industries and regions. Their expertise has complemented the analysis the Research Institute has conducted in this report. Nielsen’s input has helped develop a more complete view of the competitive consumer landscape across emerging markets.
Nielsen was founded in 1923 by Arthur C. Nielsen, Sr., who invented an approach to measuring competitive sales results that established the concept of “market share” as a practical management tool. For nearly 90 years, they have advanced the practice of market research and audience measurement for the benefits of their clients in a constantly evolving marketplace.
Nielsen has a presence in approximately 100 countries, and holds positions within established and emerging markets. Their operating model is grounded in a simple, open and integrated approach that delivers a broad portfolio of services and solutions for their clients.
The Credit Suisse Research Institute would like to thank The Nielsen Company for their invaluable assistance in this project.
General disclaimer / Important informationThis document was produced by and the opinions expressed are those of Credit Suisse as of the date of writing and are subject to change. It has been prepared solely for information purposes and for the use of the recipient. It does not constitute an offer or an invitation by or on behalf of Credit Suisse to any person to buy or sell any security. Nothing in this material constitutes investment, legal, accounting or tax advice, or a representation that any investment or strategy is suitable or appropriate to your individual circumstances, or otherwise constitutes a personal recommendation to you. The price and value of investments mentioned and any income that might accrue may fluctuate and may fall or rise. Any reference to past performance is not a guide to the future.The information and analysis contained in this publication have been compiled or arrived at from sources believed to be reliable but Credit Suisse does not make any representation as to their accuracy or completeness and does not accept liability for any loss arising from the use hereof. A Credit Suisse Group company may have acted upon the information and analysis contained in this publication before being made available to clients of Credit Suisse. Investments in emerging markets are speculative and considerably more volatile than investments in established markets. Some of the main risks are political risks, economic risks, credit risks, currency risks and market risks. Investments in foreign currencies are subject to exchange rate fluctuations. Before entering into any transaction, you should consider the suitability of the transaction to your particular circumstances and independently review (with your professional advisers as necessary) the specific financial risks as well as legal, regulatory, credit, tax and accounting consequences. This document is issued and distributed in the United States by Credit Suisse Securities (USA) LLC, a U.S. registered broker-dealer; in Canada by Credit Suisse Securities (Canada), Inc.; and in Brazil by Banco de Investimentos Credit Suisse (Brasil) S.A.This document is distributed in Switzerland by Credit Suisse AG, a Swiss bank. Credit Suisse is authorized and regulated by the Swiss Financial Market Supervisory Authority (FINMA). This document is issued and distributed in Europe (except Switzerland) by Credit Suisse (UK) Limited and Credit Suisse Securities (Europe) Limited. Credit Suisse Securities (Europe) Limited and Credit Suisse (UK) Limited, both authorized by the Prudential Regulation Authority and regulated by the Financial Conduct Authority and the Prudential Regulation Authority, are associated but independent legal entities within Credit Suisse. The protections made available by the Financial Conduct Authority and/or the Prudential Regulation Authority for retail clients do not apply to investments or services provided by a person outside the UK, nor will the Financial Services Compensation Scheme be available if the issuer of the investment fails to meet its obligations. This document is distributed in Guernsey by Credit Suisse (Channel Islands) Limited, an independent legal entity registered in Guernsey under 15197, with its registered address at Helvetia Court, Les Echelons, South Esplanade, St Peter Port, Guernsey. Credit Suisse (Channel Islands) Limited is wholly owned by Credit Suisse AG and is regulated by the Guernsey Financial Services Commission. Copies of the latest audited accounts are available on request. This document is distributed in Jersey by Credit Suisse (Channel Islands) Limited, Jersey Branch, which is regulated by the Jersey Financial Services Commission. The business address of Credit Suisse (Channel Islands) Limited, Jersey Branch, in Jersey is: TradeWind House, 22 Esplanade, St Helier, Jersey JE2 3QA. This document has been issued in Asia-Pacific by whichever of the following is the appropriately authorised entity of the relevant jurisdiction: in Hong Kong by Credit Suisse (Hong Kong) Limited, a corporation licensed with the Hong Kong Securities and Futures Commission or Credit Suisse Hong Kong branch, an Authorized Institution regulated by the Hong Kong Monetary Authority and a Registered Institution regulated by the Securities and Futures Ordinance (Chapter 571 of the Laws of Hong Kong); in Japan by Credit Suisse Securities (Japan) Limited; elsewhere in Asia/Pacific by whichever of the following is the appropriately authorized entity in the relevant jurisdiction: Credit Suisse Equities (Australia) Limited, Credit Suisse Securities (Thailand) Limited, Credit Suisse Securities (Malaysia) Sdn Bhd, Credit Suisse AG, Singapore Branch, and elsewhere in the world by the relevant authorized affiliate of the above.This document may not be reproduced either in whole, or in part, without the written permission of the authors and Credit Suisse. © 2014 Credit Suisse Group AG and/or its affiliates. All rights reservedauthors and Credit Suisse. © 2014 Credit Suisse Group AG and/or its affiliates. All rights reserved
PUBLISHER CREDIT SUISSE AGResearch InstituteParadeplatz 8CH-8070 ZurichSwitzerland
PRODUCTION MANAGEMENTINvESTMENT STRATEGy & RESEARCHINvESTMENT PUBLISHINGMarkus Kleeb (Head)Ross HewittKatharina Schlatter
AUTHORSMujtaba RanaRichard KersleyAshlee Ramanathan
EDITORIAL DEADLINE31 January 2014
Imprint
CREDIT SUISSE AGResearch InstituteParadeplatz 8CH-8070 ZurichSwitzerland
[email protected]/researchinstitute 02
/201
4