Emergence of HIV-1 Drug Resistance in South Africa ... · Emergence of HIV-1 Drug Resistance in...
26
Emergence of HIV-1 Drug Resistance in South Africa – evidence over past 24 months Gillian Hunt Centre for HIV and STI National Institute for Communicable Diseases FIDSSA - November 2015
Transcript of Emergence of HIV-1 Drug Resistance in South Africa ... · Emergence of HIV-1 Drug Resistance in...

Emergence of HIV-1 Drug Resistance in South Africa – evidence over past 24 months
Gillian HuntCentre for HIV and STI
National Institute for Communicable Diseases
FIDSSA - November 2015

Formation of the SA HIVDR Working Group
2

Prevention, attention to early warning indicators, capacitation of HIVDR for individual patient management,
strengthening surveillance and prompt reporting on national data
HIV Drug ResistanceStrategy
EWI
HIV DR
Clinical
Mx
HIVDR
Surveill-ance
Data Manage-
ment
MnE
Reporting
3

HIVDR testing algorithm in strategy
HIV RNA >1000 copies/ml on PI-based
ART
Repeat VL after 6 months
VL ≤1000 copies/ml
Continue second-line regimen
VL >1000 copies/ml
Specialist referral
Genotypic resistance
testing
Specialist decision regarding further
management
Check for adherence, compliance, tolerability and drug- drug interaction and assess psychological issues
4

National Surveillance of Transmitted DR: 2012 ANSUR
Province
Number of
specimens
amplifiable by
genotyping
PCR
Genotyping
amplification
rate
Number of
sequences
with PI
mutations
PI Point
Prevalence
(95% CI)
Number of
sequences
with NRTI
mutations
NRTI Point
Prevalence
(95% CI)
Number of
sequences
with NNRTI
mutations
NNRTI Point
Prevalence
Eastern Cape 99 88.4% 0 0% (0 - 3.7) 0 0% (0 - 3.7) 3 3% (1.0 - 8.5)
Free State 54 76.1% 0 0% (0 - 6.6) 1 1.9% (0.3 - 9.8) 4 7.4% (2.9 - 17.6)
Gauteng 65 69.1% 1 1.5% (0.3 - 8.2) 0 0% (0 - 5.6) 6 9.2% (4.3 - 18.7)
KwaZulu
Natal196 64.5% 0 0% (0 - 1.9) 4 2% (0.8 - 5.1) 8 4.1% (2.1 - 7.8)
Limpopo 20 47.6% 0 0% (0 - 16.1) 0 0% (0 - 16.1) 2 10% (2.8 - 30.1)
Mpumalanga 45 76.3% 0 0% (0 - 7.9) 1 2.2% (0.4 - 11.6) 2 4.4% (1.2 - 14.8)
North West 21 44.7% 2 9.5% (2.7 - 28.9) 0 0% (0 - 15.5) 1 4.8% (0.8 - 22.7)
Northern
Cape4 57.1% 0 0% (0 - 49.0) 0 0% (0 - 49.0) 0 0% (0 - 49.0)
Western
Cape28 82.4% 0 0% (0 - 12.1) 0 0% (0 - 12.1) 2 7.1% (2.0 - 22.6)
National 532 69.1% 3 0.6% (0.1 - 1.6) 6 1.1% (0.5 - 2.4) 28 5.3% (3.7 - 7.5)
5
Hunt G et al, NICD Bulletin, April 2015

• Pre-screening resistance rates 7.4%
6
Parikh U et al, Pone 2013

ART naïve surveyAre patients initiating treatment susceptible to the 1st line ART regimen?
• Specimens collected from 45 health care facilities, in 34 districts and all 9 provinces
• Sample size of 336 calculated, using PPS sampling
• 277 sequences included in analysis (82.4% of target)
• 25 out of 277 patients presented with ≥ 1 surveillance drug resistance mutation (SDRM, WHO 2009)
• Prevalence of SDRM 9.0% (95% CI: 6.1-13.0%)– NNRTI mutations most common, n=23
– NRTI mutations, n=7
– PI mutations, n=2
– In 4 patients ≥ 4 SDRMs detected, which might indicate they were not truly ART-naïve7
Steegen K et al, IAS 2015: TUPEB232

Germs-SA: Sentinel site surveillance of HIVDR and TBDR(INH) at initiation of treatment
• 1 clinic per province
• To measure HIV/TB co-infection in patients initiating therapy
• To measure levels of HIV and TB DR at initiation of therapy
• Recruitment ~30%
• NNRTI+NRTI resistance: 2.3%
• NNRTI resistance: 16.9%
• ~1/3rd of participants are re-entering into care
0.0%
20.0%
40.0%
60.0%
80.0%
100.0%
Prior ART (PMTCT orHAART) n=64
No Prior ART n=150
No amplification
No Resistance
NNRTI Resistance
Dual-class resistance
8

Pillay, ARHR 2008: n=26 2000-03 GP
Marconi, CID 2008: n=115 2005-06 KZN
Hoffmann, CID 2009: n=68 2002-06 GP
Orrell, AT 2009: n=120 2002-07 WC
Wallis, JAIDS 2010: n=226 2005-09 GP
Murphy, AIDS 2010: n=141 2005-09 KZN
El Khatib, AIDS 2010: n=129 2008 GP
Singh, JAIDS 2011: n=45 <2010 KZN
Sunpath, AIDS 2012: n=33 2010-11 KZN
Sigaloff, ARHR 2012: n=43 2006-09 GP
Manasa, POne 2013: n-242 2010-2012 KZN
Resistance mutations among 1st-line failures in SA
9

10
Different patterns of resistance within NRTI drug class…
Van Zyl et al, PLoS ONE2013
11
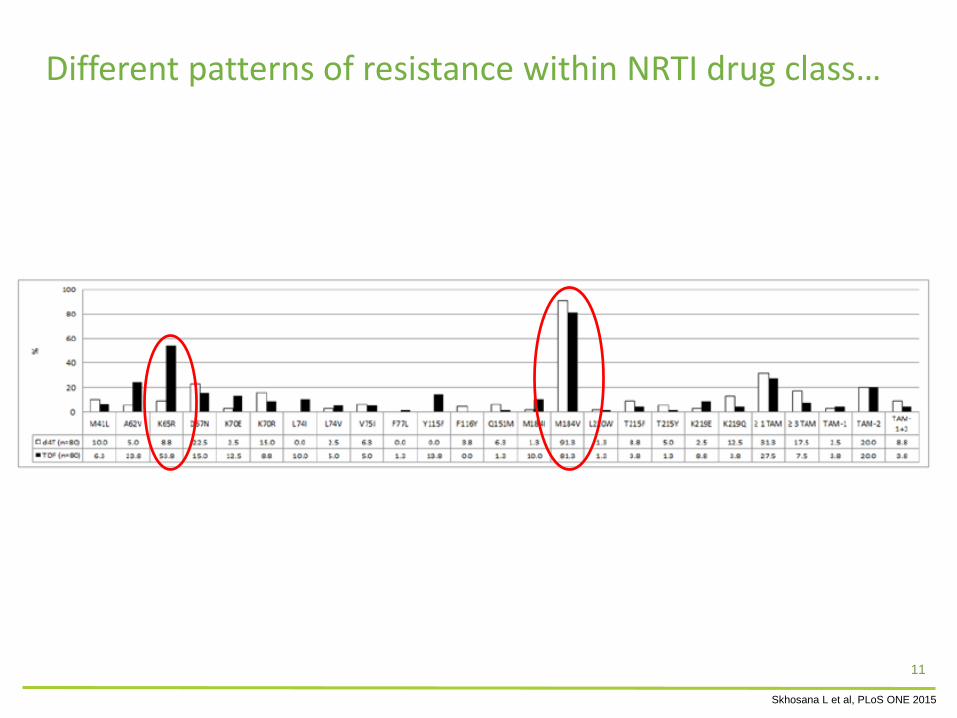
Different patterns of resistance within NRTI drug class…
Skhosana L et al, PLoS ONE 2015

12
Different patterns of resistance within NNRTI drug class…
Van Zyl et al, PLoS ONE2013

13
Different patterns of resistance within NNRTI drug class…
Skhosana L et al, PLOS One 2015

KZN pilot cross sectional ADR survey
• To estimate the proportion of adult patients failing 1st-line ART after 1 year and after 2 years on treatment, and the proportion of paediatric patients failing first-line ART at 15 ART clinics in KZN
• To describe the patterns of HIV DRM in patients with detectable viral load
• Viral Suppression rates:– I year (n=540): 93%
– 2-3 years (n=760): 89%
– Paeds (n=106): 69%
• Factors associated with viral failure: – Male gender, initiation of ART at CD4 <200, NVP vs EFV, d4T and
AZT vs TDF
• Resistance detected in 89% of viral failures
14
Hunt G et al, XXIII International HIV Drug Resistance Workshop, Berlin, 2014

KZN ADR: HIVDR patterns
15
Hunt G et al, XXIII International HIV Drug Resistance Workshop, Berlin, 2014

ART-experienced surveyAre patients who fail 1st line treatment susceptible to the 2nd line ART regimen?
• Specimens collected from 91 health care facilities, in 37 districts and 8 provinces (excl NC).
• 793 sequences included in analysis (88.1% of target 900)
• VL 4.7log cp/ml
• Median time on ART: 36 months
• 3.7% of patients presented with wild-type virus (indication for non-adherence)
• Most common NNRTI mutations: K103N (48.8%), V106M (34.9%), Y181C (26.2%), G190A (21.7%)
• Most common NRTI mutations: M184V/I (82.7%), K65R (45.8%)
• K65R in TDF-exposed patients: 57.5%16
Steegen K et al, IAS 2015: TUPEB238

ART-experienced surveyAre patients who fail 2nd- line treatment susceptible to the 3rd- line ART regimen?
• Specimens collected from 72 health care facilities, in 38 districts and all 9 provinces.
• 354 sequences included in analysis (78.6% of target 450)
• VL 4.8log cp/ml
• Median time on PI-ART: 25months
• Median time on ART: 62 months
17
Steegen K et al, IAS 2015: TUPEB289

National 3rd-line committee• ~n=163 patients
• Median age 40 years
• DRV/r +3TC/FTC+AZT/TDF ± RAL ± ETR
• Facility completes motivation form and submits to:
– the Secretariat: Third Line ARV Peer Review Committee (PRC)
18
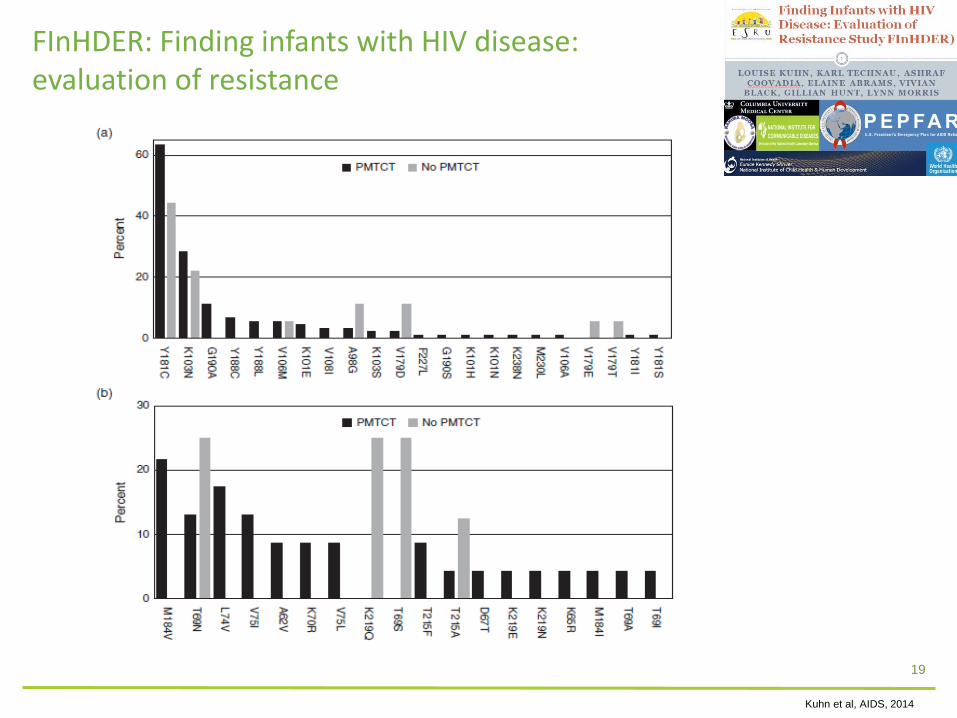
FInHDER: Finding infants with HIV disease:evaluation of resistance
19
Kuhn et al, AIDS, 2014

Resistance in infants What are the resistance profiles in infants <18 months who failed PMTCT?
• Stored 6w remnant DBS for routine HIV early infant diagnosis (EID) were collected from September 2014 to January 2015 from all 9 NHLS EID laboratories in South Africa
• 408 cases of which 51% were female infants
• Median age of 81 days (IQR 45-240) at the time of diagnosis
• HIVDR amplification and sequencing was achieved in 350 (85.8%) specimens
20
• NNRTI resistance was detected in 60.8% (n=213)
• NRTI resistance was observed in 13.1% (n=25)
• Only three infants presented with single PI mutation
Carmona S et al, IAS 2015: TUPEB231

• PASER: 2579 participants, 5.5% had pretreatment drug resistance.
• PDR was associated with increased risk of regimen switch (aHR 3.80 p=0.005)
• PDR was not associated with mortality (aHR 0.75 p=0.617) or new AIDS events (aHR 1.06 p=0.807)
• VL monitoring can improve the accuracy of failure detection and efficiency of switching practices
Boender TS et al, CID,2015
21
• 76.2% vs 90.5% suppression with vs without PDR @12mo
• 81.4% vs 91.3% suppression with vs without PDR @36mo

Paton NI et al, NEJM 2014
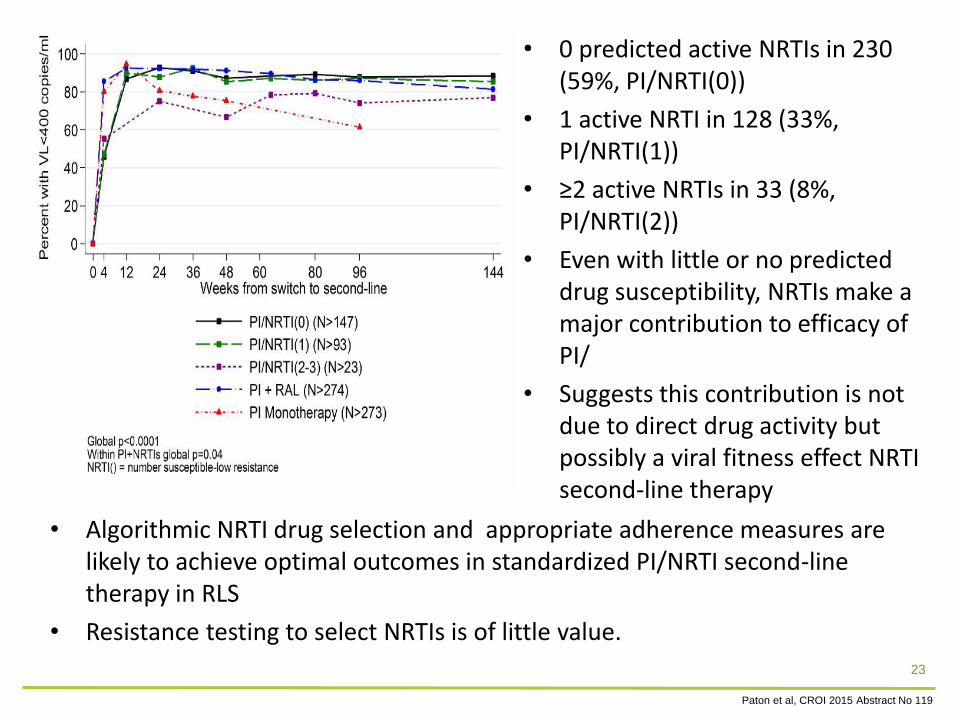
• 0 predicted active NRTIs in 230 (59%, PI/NRTI(0))
• 1 active NRTI in 128 (33%, PI/NRTI(1))
• ≥2 active NRTIs in 33 (8%, PI/NRTI(2))
• Even with little or no predicted drug susceptibility, NRTIs make a major contribution to efficacy of PI/
• Suggests this contribution is not due to direct drug activity but possibly a viral fitness effect NRTI second-line therapy
• Algorithmic NRTI drug selection and appropriate adherence measures are likely to achieve optimal outcomes in standardized PI/NRTI second-line therapy in RLS
• Resistance testing to select NRTIs is of little value.
Paton et al, CROI 2015 Abstract No 119
23

Global epidemiology of drug resistance following failure of WHO recommended tenofovir containing first line regimens for adult HIV-1
infection – an international collaborative study
J Gregson; M Tang; N Ndembi; RLHamers; SY Rhee; VC Marconi; L Diero; K Brooks; K Theys; TF Rinke de Wit; M Arruda; F Garcia; S Monge; HF Günthard; CJ Hoffmann; PJ Kanki; N Kumarasamy ; B Kerschberger; O Mor; C Charpentier; E Todesco; C Rokx; L Gras; EK Halvas; H Sunpath; D Di Carlo; A Antinori; M Andreoni; A Latin; C Mussini; A Aghokeng; A Sonnerborg; U Neogi; WJ Fessels; S Agolory; C Yang; JL Blanco; JMc Juma; E Smit; D Schmidt; C Watera; J Asio; W Kirungi; A Tostevin; T El-Hay; N Clumeck; D Goedhals; C van Vuuren; A Bester; C Sabin; I Mukui; MM Santoro; CF Perno; G Hunt; L Morris; R Camacho; T de Oliveira; D Pillay; E Schulter; A Murakami-Ogasawara; G Reyes-Terán; K Romero; S Avila-Rios; S Sirivichayakul; K Ruxrungtham; S Mekprasan; D Dunn; P Kaleebu; E Raizes; R Kantor; RW Shafer; RK Gupta (The TenoRes Study Group)
24
Conclusions
• HIVDR levels are increasing but not to alarming levels
• Evidence-based justification for adherence to treatment algorithms
• Scale-up and adherence of testing algorithms
• Future strategies and regimens supported and encouraged
25

Acknowledgements
• National HIV Drug Resistance Working Group and Steering Group including all members and affiliates
• National Health Laboratory Service
• National Institute for Communicable Diseases
26