
EMEA Investor Intentions Survey 2016
20
EMEA Investor Intentions Survey 2016 CBRE Research
-
Upload
anze-sagadin -
Category
Documents
-
view
76 -
download
1
Transcript of EMEA Investor Intentions Survey 2016

EMEA Investor Intentions Survey 2016
CBRE Research
EMEA Investor Intentions Survey 2016
C | CBRE Research © 2016 CBRE, Inc.
North America
Western Europe
20%
19%
Central & Western Europe
South & Central America
4%
Pacific
Developed Asia
Emerging Asia
Africa
2%
3%
2%
47%
4%
3%
Executive summary
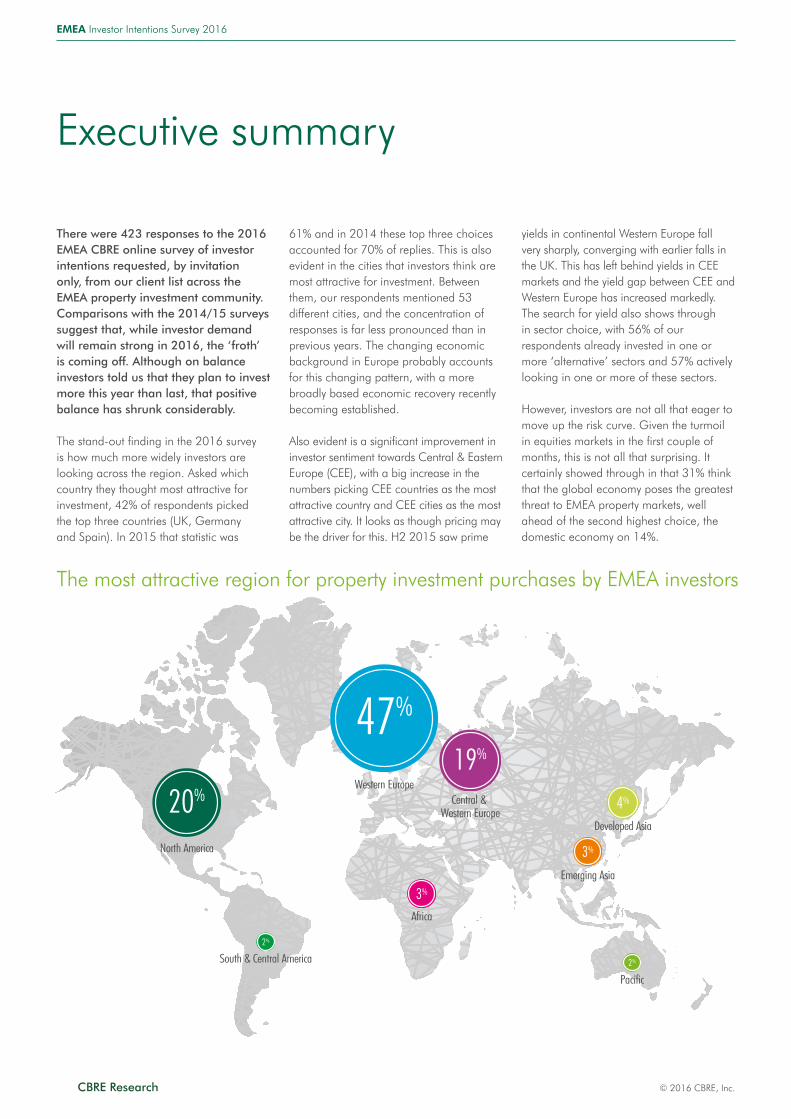
There were 423 responses to the 2016 EMEA CBRE online survey of investor intentions requested, by invitation only, from our client list across the EMEA property investment community. Comparisons with the 2014/15 surveys suggest that, while investor demand will remain strong in 2016, the ‘froth’ is coming off. Although on balance investors told us that they plan to invest more this year than last, that positive balance has shrunk considerably.
The stand-out finding in the 2016 survey is how much more widely investors are looking across the region. Asked which country they thought most attractive for investment, 42% of respondents picked the top three countries (UK, Germany and Spain). In 2015 that statistic was
61% and in 2014 these top three choices accounted for 70% of replies. This is also evident in the cities that investors think are most attractive for investment. Between them, our respondents mentioned 53 different cities, and the concentration of responses is far less pronounced than in previous years. The changing economic background in Europe probably accounts for this changing pattern, with a more broadly based economic recovery recently becoming established.
Also evident is a significant improvement in investor sentiment towards Central & Eastern Europe (CEE), with a big increase in the numbers picking CEE countries as the most attractive country and CEE cities as the most attractive city. It looks as though pricing may be the driver for this. H2 2015 saw prime
yields in continental Western Europe fall very sharply, converging with earlier falls in the UK. This has left behind yields in CEE markets and the yield gap between CEE and Western Europe has increased markedly.The search for yield also shows through in sector choice, with 56% of our respondents already invested in one or more ‘alternative’ sectors and 57% actively looking in one or more of these sectors.
However, investors are not all that eager to move up the risk curve. Given the turmoil in equities markets in the first couple of months, this is not all that surprising. It certainly showed through in that 31% think that the global economy poses the greatest threat to EMEA property markets, well ahead of the second highest choice, the domestic economy on 14%.
The most attractive region for property investment purchases by EMEA investors

EMEA Investor Intentions Survey 2016
CBRE Research | 1© 2016 CBRE, Inc.
Most attractive countries for investment in EMEA
9.2%
France17%
Germany9.9%
Netherlands10.2%
Spain15.1%
United Kingdom9.2 %
Poland
Source: CBRE EMEA Investor Intentions Survey, 2016
Actively pursuing investment in ‘alternative’ sectors
28%Student Living
Self-storage5%
26%Real Estate Debt
19%Healthcare
18%Retirement Living
16%Leisure /
Entertainment
11%Data Centres
9%Automotive /
Car Parks
Buying / selling activity in 2016
Expected purchasing activity in 2016: Expected selling activity in 2016:
Higher purchasing activity Higher selling activity
About the same About the same
Lower purchasing activity Lower selling activity
48% 43%
37% 42%
15% 15%
11%Infrastructure

EMEA Investor Intentions Survey 2016
2 | CBRE Research © 2016 CBRE, Inc.
Where are people planning to invest?
Most attractive country in EMEA for investmentDiverging investor views are prevalent in the responses given for the most attractive country for real estate investment in EMEA. Germany (17%) is the most frequent, beating the UK into second place after two years at the top. More importantly though, this is by far the closest result of any of the seven surveys that we have carried out, with many more markets coming into the mix.
The biggest change compared to 2015’s survey is the jump in interest in CEE markets. Poland jumped from 2% in 2015 to 9% in 2016 and, taken as a group, CEE markets have seen their proportion of preferences rise from 6% in the 2015 survey to 23% in this year’s. There are no obvious reasons from outside the property sector for this dramatic shift. In core CEE countries, although economic growth is
stronger than in Western Europe, it is stable and not materially higher than last year. Nor have there been any dramatic changes to the political environment that might explain this turnaround. Investors’ search for yield may be part of the explanation.
The substantial falls in prime yields in Western Europe in recent years mean that the yield premium for CEE markets has increased by nearly a percentage point over the last year and a half.
The other notable positive change is the 10% of respondents who think the Netherlands is the most attractive market in EMEA, up from 5% in both 2014 and 2015.
The increased attraction of the Netherlands has already been seen in the strong growth in investment activity in Q4 2015 and this result suggests that growth is set to continue.
Figure 1: In EMEA, which country/region do you believe to be the most attractive for making property investment purchases in 2016?
20152014 2016% of respondents
0All CEE
CountriesGermany UK Netherlands France Nordics OtherItalySpain
22.9
17.0 15.1
10.2 9.9 9.25.4 4.75
10
15
20
25
30
35
5.4
Source: CBRE EMEA Investor Intentions Survey, 2016
After several years of being the clear favourite of EMEA investment markets, the UK has slipped back to second place behind Germany in the 2016 survey. As with the Netherlands, this result has already been seen in investment turnover which was down by 18% in H2 2015 compared to H2 2014. A number of factors may be contributing to this;
• Diverging monetary policy (QE in the euro area versus expected rate rises in the UK),• Nervousness about the UK’s EU referendum result, and • A slight weakening of economic growth.

EMEA Investor Intentions Survey 2016
CBRE Research | 3© 2016 CBRE, Inc.
▼
▼
Biggest preference increase Y-o-Y
Poland
9.2%
Netherlands
9.9%
Russia
2.8%▼
“In keeping with the theme of greater diversity of investment, cities outside the top ten attracted a substantial share of investors’ preferences”
Figure 2: In EMEA, which city do you believe to be the most attractive for making property investment purchases in 2016?
% of respondents
Warsaw
Milan
London Amsterdam
Budapest Prague ManchesterMunich Helsinki Bucharest
Madrid Paris Berlin
Hamburg Dublin
15.1% 12.2% 11.6% 10.8% 7.3% 7.0%
4.7% 2.9% 2.7% 2.4% 2.1% 1.8% 1.7% 1.7% 1.7%
Source: CBRE EMEA Investor Intentions Survey, 2016
Most attractive city inEMEA for investmentMuch the same trends that are evident in the country level results, also show through in the cities that respondents picked as being the most attractive for real estate investment in EMEA.
The results are far more diverse in the 2016 survey, with 53 different cities mentioned by respondents. London remains the most frequent pick – as it has been all five times we have asked this question in our survey.
However, its lead over the rest has been cut. Prominent in the most popular markets this year are cities in the CEE, with Warsaw, Budapest, Prague and Bucharest all
featuring in the top 15. A number of other Polish markets also feature further down the list and in total Polish cities attracted 9.5% of preferences.
Three German cities (Berlin, Munich and Hamburg) make it into this top 15 and between these and Frankfurt the big-4 German cities attracted 16% of city preferences. Notable over the last few years is the increase in the number of investors highlighting Berlin and a decrease in those picking Munich as their preferred investment destination.
In line with the increase in the preference for the Netherlands at a country level, Amsterdam saw a big increase in responses to 7% of the total.
2.4%in 2015
5.2%in 2015
0.7%in 2015
EMEA Investor Intentions Survey 2016
4 | CBRE Research © 2016 CBRE, Inc.
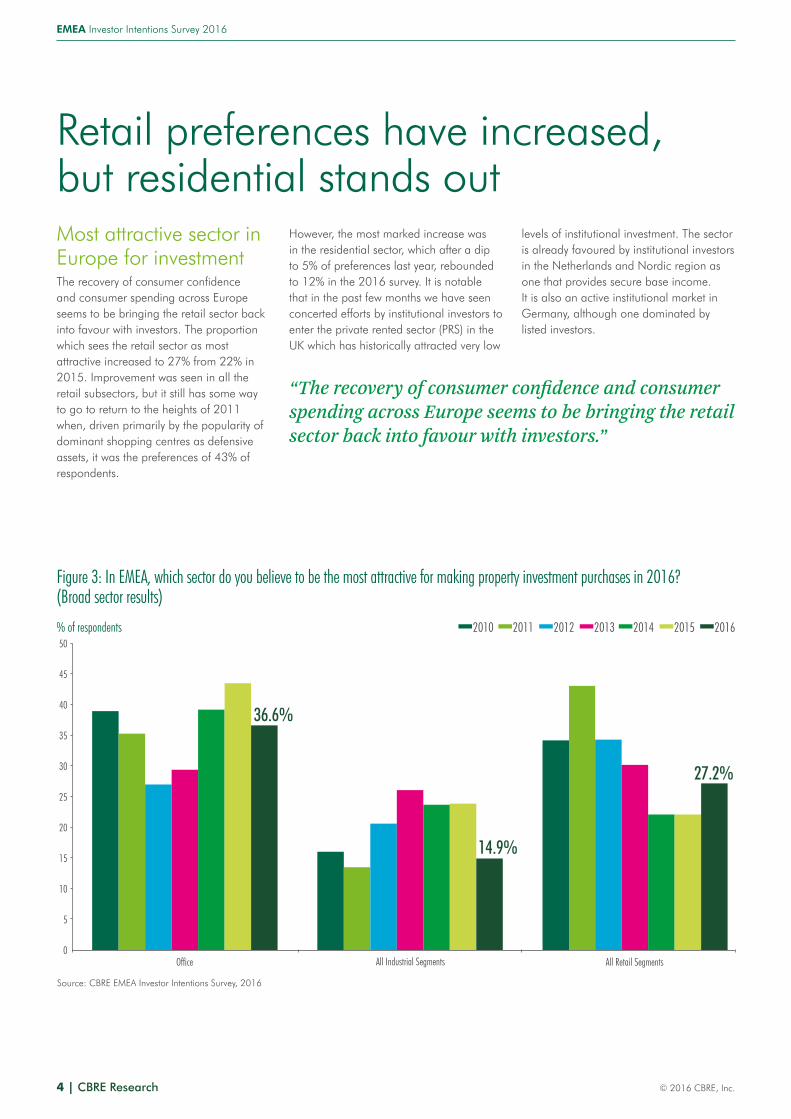
Most attractive sector in Europe for investmentThe recovery of consumer confidence and consumer spending across Europe seems to be bringing the retail sector back into favour with investors. The proportion which sees the retail sector as most attractive increased to 27% from 22% in 2015. Improvement was seen in all the retail subsectors, but it still has some way to go to return to the heights of 2011 when, driven primarily by the popularity of dominant shopping centres as defensive assets, it was the preferences of 43% of respondents.
Retail preferences have increased, but residential stands out
2016201520142013201220112010% of respondents
Office All Industrial Segments All Retail Segments
36.6%
0
5
10
15
20
25
30
35
40
45
50
14.9%
27.2%
Figure 3: In EMEA, which sector do you believe to be the most attractive for making property investment purchases in 2016? (Broad sector results)
Source: CBRE EMEA Investor Intentions Survey, 2016
However, the most marked increase was in the residential sector, which after a dip to 5% of preferences last year, rebounded to 12% in the 2016 survey. It is notable that in the past few months we have seen concerted efforts by institutional investors to enter the private rented sector (PRS) in the UK which has historically attracted very low
“The recovery of consumer confidence and consumer spending across Europe seems to be bringing the retail sector back into favour with investors.”
levels of institutional investment. The sector is already favoured by institutional investors in the Netherlands and Nordic region as one that provides secure base income. It is also an active institutional market in Germany, although one dominated by listed investors.
EMEA Investor Intentions Survey 2016
CBRE Research | 5© 2016 CBRE, Inc.
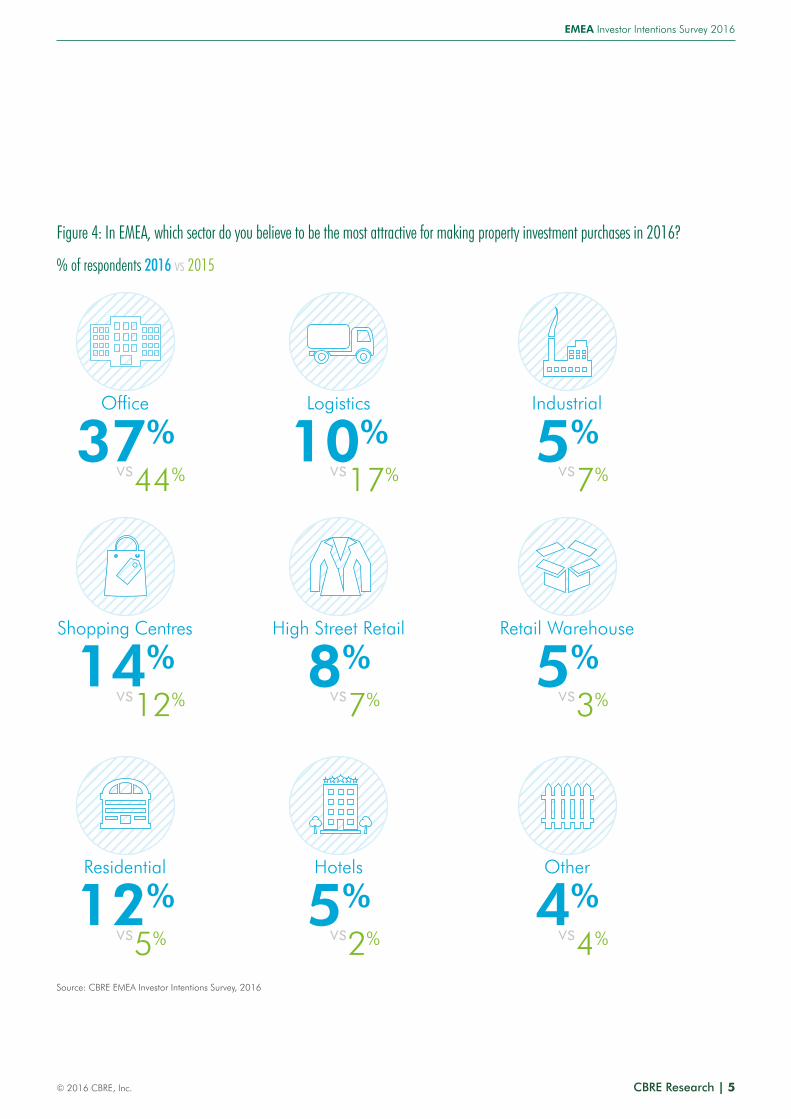
Figure 4: In EMEA, which sector do you believe to be the most attractive for making property investment purchases in 2016?
% of respondents 2016 vs 2015
vs vs vs14% 8% 5%
12% 7% 3%
Shopping Centres High Street Retail Retail Warehouse
Source: CBRE EMEA Investor Intentions Survey, 2016
vs vs vs12% 5% 4%
5% 2% 4%
Residential Hotels Other
vs vs vs37% 10% 5%
44% 17% 7%
Office Logistics Industrial

EMEA Investor Intentions Survey 2016
6 | CBRE Research © 2016 CBRE, Inc.
Figure 5: Are you already invested/actively pursuing investment in any of the following ‘alternative’ sectors?Already invested and actively pursuing further exposureNot invested, but actively looking for exposureAlready invested, but not looking for further exposure
% of respondents
0 10 20 30 40
Student living
Real estate debt
Healthcare
Retirement living
Leisure / Entertainment
Infrastructure
Data centre
Automotive / Car parks
Self-storage
Source: CBRE EMEA Investor Intentions Survey, 2016
Rising new interest in student housing
Investment in alternative sectorsThe increasing sophistication of the real estate industry is being seen both in what respondents are prepared to invest in and how they execute that investment.
More than half (56%) of respondents were already invested in one or more of the ‘alternative’ sectors, shown in the graph below, and 57% (albeit with quite a big overlap) actively looking.
Real estate debt is the segment that has the greatest existing market penetration. Over 30% of investors already have some exposure to real estate debt and of those
the vast majority (22%) is actively looking for further exposure to the segment. There is also a small proportion (4%) without any current investment in debt, but who are looking to invest.
Student Housing is the segment attracting most new interest. 20% of our respondents already have investments in student housing with most (15%) of those seeking further exposure. However, a further 13% of respondents are looking for investment in this market for the first time.
Our survey showed enormous diversity in the vehicles that investors now use to invest in real estate. The majority of respondents (69%) use direct investment, but just 25%
use direct investment alone. Property funds (43%) and Partnership/Joint Venture (42%) are the next most commonly used routes to real estate investment.
REITs or other listed real estate companies are used by a relatively small proportion of respondents (18%), which may be a reflection of clients who responded to the survey, but may also show that for many multi-asset investors all listed investments (even in real estate) sit within their equity allocation rather than their real estate allocation.

EMEA Investor Intentions Survey 2016
CBRE Research | 7© 2016 CBRE, Inc.
% of respondents
0
CMBS
Other debt
Other equity
Listed eealestate company
Private debt
REIT
Partnership/Joint venture
Property fund
Direct
10 20 30 40 50 60 70 80
Source: CBRE EMEA Investor Intentions Survey, 2016
“More than half already invested in alternative sectors” Michael Haddock, Senior Director, EMEA Research
Figure 6: Please indicate the main types of investment vehicle your organisation is currently using in the real estate sector
8.0%in 2015
6.2%in 2015
4.5%in 2015
▼
▼
Most new investor interest
Student Living
12.7%
Retirement Living
8.5%
Healthcare
8.5%▼

EMEA Investor Intentions Survey 2016
8 | CBRE Research © 2016 CBRE, Inc.
A new question that was added to our Investor Intentions Survey in 2016 investigates investors’ motivation for investing in real estate.
Although we do not have past results against which to make a comparison, the 2016 responses do appear to be influenced by the position in the market cycle. That access to a steady income stream from rents is the most frequent reply chimes with responses in other parts of the survey, and is what might be expected in what is a relatively late cycle market.There are very substantial differences in motivation by type of organisation. For institutional investors (pension funds,
insurance companies, sovereign wealth funds and banks) asset class diversification is by far the leading motivation (34%), for REITs and listed property companies steady income from rents (38%) and capital value growth (35%) stand out. For private equity/venture capital companies, capital value growth (62%) is unsurprisingly the main motivation.
Given that globally in mature economies inflation has been subdued for some time, it is not all that surprising that one of the traditional reasons given for investing in real estate, ‘hedge against inflation’ is virtually absent from responses.
Figure 7: What is your organisation’s main motivation for investing in real estate in 2016?
% of respondents
Other
Hedge againstinflation
Yield relative tocost of debt
Geographicdiversification
Asset class diversification
Yield relative toother assets
Capitalvalue growth
Steady incomefrom rents
0 5 10 15 20 25 30
Source: CBRE EMEA Investor Intentions Survey, 2016
“As the cycle matures, income is increasingly why investors are picking Real Estate” Michael Haddock, Senior Director, EMEA Research
Motivation for investment

EMEA Investor Intentions Survey 2016
CBRE Research | 9© 2016 CBRE, Inc.

EMEA Investor Intentions Survey 2016
10 | CBRE Research © 2016 CBRE, Inc.
Investors remain positive about their investment activity in 2016, but less so than in the last two survey years. Just under half (48%) of respondents said that they expected their purchasing activity to be higher than last year – and half of those (24%) expected to increase their purchasing activity by 20% or more. This compares with just 15% who expected to be less active buyers, a positive balance of 32%.
Figure 8: Compared to 2015, do you expect your purchasing activity in 2016 to be:
2015 2016% of respondents
13.7 10.2
36.9
5.7 4.5 5.2
More than20% higher
Between 10%-20%
higher
Up to10% higher
Up to10% lower
About thesame
Between 10%-20%
lower
More than20% lower
0
5
10
15
20
25
30
35
40
23.9
Source: CBRE EMEA Investor Intentions Survey, 2016
This means that investors remain expansionary, but less so than in recent years. This balance has shrunk over the last two years – from +62% in 2014 and +48% in 2015. There has been virtually no change in expectations of selling activity. As was the case last year there is an intention that selling activity should be greater than last year. Taken together these results suggest that 2016 should be another year of strong growth in investment activity after 2015’s record level of €273 billion. However, our own forecasts suggest that growth in investment will be more moderate.
58%in 2015
48%in 2015
11%in 2015
Purchasing activity in 2016
All higher
48%▲
Higher minus lower
32%▲
All lower
15%▼
Purchasing and selling activity

EMEA Investor Intentions Survey 2016
CBRE Research | 11© 2016 CBRE, Inc.
“With both buyers and sellers planning to be more active, it should be another year of strong investment activity.”Michael Haddock, Senior Director, EMEA Research
Figure 9: Compared to 2015, do you expect your selling activity in 2016 to be:
2015 2016% of respondents
More than20% higher
Between 10%-20%
higher
Up to 10% higher
Up to10% lower
About thesame
Between 10%-20%
lower
More than20% lower
0
5
10
15
20
25
30
35
40
45
18.1
11.4 13.5
41.5
6.2 4.3 5.0
Source: CBRE EMEA Investor Intentions Survey, 2016
46%in 2015
34%in 2015
13%in 2015
Selling activity in 2016
All higher
43%▲
Higher minus lower
28%▲
All lower
15%▼
EMEA Investor Intentions Survey 2016
12 | CBRE Research © 2016 CBRE, Inc.
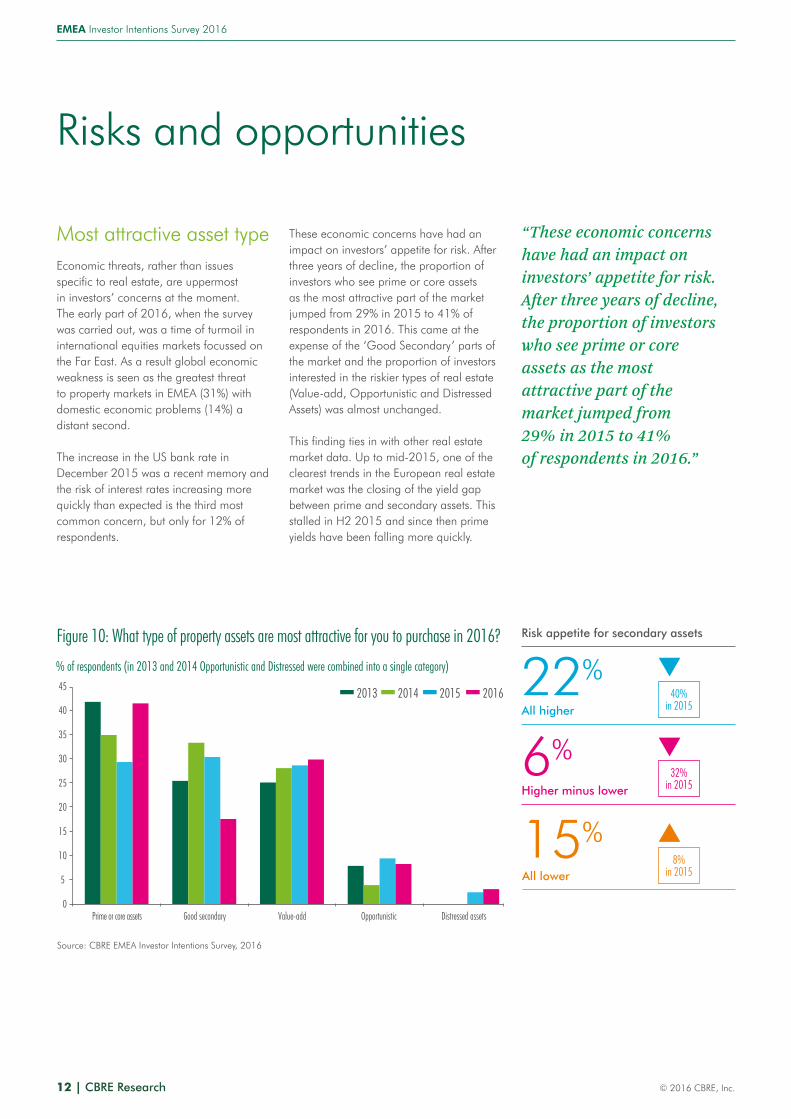
Most attractive asset typeEconomic threats, rather than issues specific to real estate, are uppermost in investors’ concerns at the moment. The early part of 2016, when the survey was carried out, was a time of turmoil in international equities markets focussed on the Far East. As a result global economic weakness is seen as the greatest threat to property markets in EMEA (31%) with domestic economic problems (14%) a distant second.
The increase in the US bank rate in December 2015 was a recent memory and the risk of interest rates increasing more quickly than expected is the third most common concern, but only for 12% of respondents.
Risks and opportunities
These economic concerns have had an impact on investors’ appetite for risk. After three years of decline, the proportion of investors who see prime or core assets as the most attractive part of the market jumped from 29% in 2015 to 41% of respondents in 2016. This came at the expense of the ‘Good Secondary’ parts of the market and the proportion of investors interested in the riskier types of real estate (Value-add, Opportunistic and Distressed Assets) was almost unchanged.
This finding ties in with other real estate market data. Up to mid-2015, one of the clearest trends in the European real estate market was the closing of the yield gap between prime and secondary assets. This stalled in H2 2015 and since then prime yields have been falling more quickly.
“These economic concerns have had an impact on investors’ appetite for risk. After three years of decline, the proportion of investors who see prime or core assets as the most attractive part of the market jumped from 29% in 2015 to 41% of respondents in 2016.”
Figure 10: What type of property assets are most attractive for you to purchase in 2016?
40%in 2015
32%in 2015
8%in 2015
Risk appetite for secondary assets
All higher
22%▲
Higher minus lower
6%▲
All lower
15%▼
% of respondents (in 2013 and 2014 Opportunistic and Distressed were combined into a single category)
2016201520142013
Prime or core assets Good secondary Value-add Distressed assetsOpportunistic0
5
10
15
20
25
30
35
40
45
Source: CBRE EMEA Investor Intentions Survey, 2016

EMEA Investor Intentions Survey 2016
CBRE Research | 13© 2016 CBRE, Inc.

EMEA Investor Intentions Survey 2016
14 | CBRE Research © 2016 CBRE, Inc.
SustainabilityThe issue of sustainability in real estate investment is one that divides opinion in the industry. While there has not yet been definitive research that it has had a direct impact on performance, a growing proportion of investors believes that it does and that the sustainability credentials of an investment could prove crucial to its future performance. Investors active in the EMEA region put greater importance on sustainability than those in other global regions.
Compared to the result in 2015 there has been a material increase in the proportion of respondents that had sustainability at or close to the top of their criteria for selecting investments, from 15% in the 2015 survey to 22% in 2016.
Interestingly this is at the expense of a fall in our third category “Other considerations are more important, but sustainability definitely matters to us” and the proportions in the other three categories are virtually unchanged, suggesting that polarisation between investors on this topic is increasing.
What seems to determine which side of this debate an investor will fall into is the nature of their organisation. Institutional investors (respondents who described themselves as pension funds, insurance
“Investors’ increasing focus on sustainability reflects a desire to reduce the risk of obsolescence due to legislative changes and occupier expectations, improve financial performance and enhance their reputation as the low carbon economy gains momentum”
Rebecca Pearce, Head of EMEA Sustainability
Does sustainability matter?
companies, sovereign wealth funds or banks) were far more likely to put a strong emphasis on sustainability, with 39% in our top two categories compared to 19% in the rest of the sample. The responses from REITs had a similar profile to those from the institutions.
Within our survey, the group that is least likely (and by a significant margin) to take sustainability into account in their investment decisions is Private Equity/Venture Capital, perhaps because their investments are typically short term.

EMEA Investor Intentions Survey 2016
CBRE Research | 15© 2016 CBRE, Inc.
Figure 11: Which of the following statements most closely describes your approach to sustainability in asset selection?
Source: CBRE Research, 2016
Figure 12: Which of the following statements most closely describes your approach to sustainability in asset selection?
% of respondents: Institutional Investors Others
Sustainability is not a significant consideration in selecting assets to buy
8% 13%
Sustainability considerations tip the balancebetween possible options if other factors are equal
15% 13%
We sometimes reject buildings for reasons of sustainability
4% 5%
Other considerations are more important,but sustainability definitely matters to us
35% 50%
It is one of the most important criteria indetermining the properties we buy
31% 14%
We will not even consider buildings that do not meet strict criteria
7% 5%
Source: CBRE EMEA Investor Intentions Survey, 2016
% of respondents
Sustainability is not a significantconsideration in selecting assets to buy
Sustainability considerations tipthe balance between possible options if
other factors are equal
We sometimes reject buildings forreasons of sustainability
Other considerations are more important,but sustainability definitely matters to us
It is one of the most important criteria indetermining the properties we buy
We will not even consider buildings thatdo not meet strict criteria
0 10 20 30 40 50

EMEA Investor Intention Survey 2016
Conclusions
Two themes stand out in the results of 2016’s Investor Intentions Survey:
Of particular interest is the increase in interest in CEE markets. Investment turnover in the CEE markets has been relatively subdued recently. Whereas investment activity in Western Europe was at a record level in 2015 (€261 billion compared to €243 billion in 2007) investment in the CEE markets has not been anything like as buoyant. Total CRE investment in the CEE in 2015 was €11.8 billion, still 22% below the €15.1 billion recorded in 2007 and the fall in CEE yields has also lagged behind the trend in Western Europe. These results suggest that the CEE will be a part of the market to watch closely in 2016, with the Dutch market also looking interesting.
Growing demand for real estate assets has encouraged investors to look at different types of real estate that, until recently, were not considered mainstream investment products, such as debt, student housing and healthcare assets. However, at the sector level, it is residential that stands out. In most of EMEA, the trend over the last decade has been away from the residential sector.
However, in a market looking for a product this is an obvious place for investors to look. In the USA residential real estate makes up the same proportion of the investment market as offices.
The other trend where the future looks to be different from the past is in investors’ attitude to risk.
“As differences in opinion are what makes a market this suggests that 2016 will be an interesting time in real estate”
Since the financial crisis made nearly all investors risk averse, the trend each year has been for greater risk taking. This year’s survey has seen that trend seemingly reverse although not in a linear way. The proportion of investors who see value-add and opportunistic investments as most attractive has remained much the same. However, at the other end of the risk spectrum, investors are moving away from ‘Good Secondary’ to a more prime real estate.
Overall there is much less agreement on what constitutes the most attractive market and the best strategy than has previously been the case. As differences in opinion are what makes a market this suggests that 2016 will be an interesting time in real estate.
16 | CBRE Research © 2016 CBRE, Inc.
EMEA Investor Intentions Survey 2016
CBRE Research | Q© 2016 CBRE, Inc.
Methodology
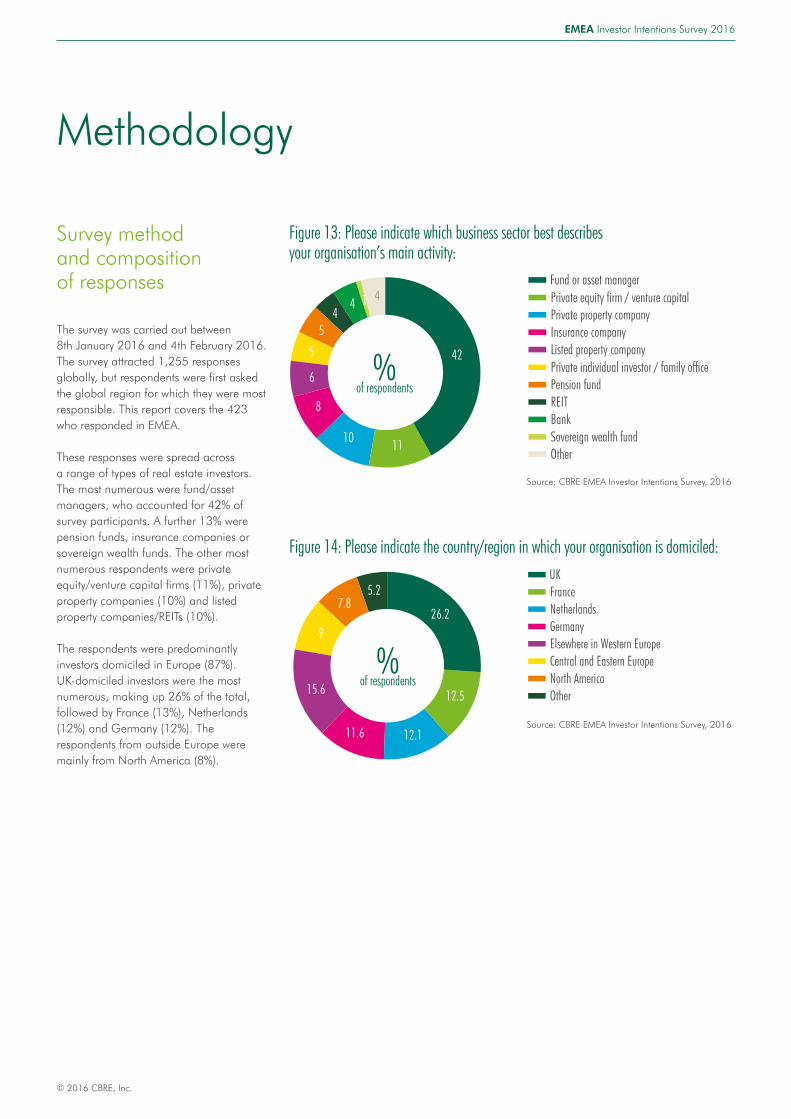
Survey method and composition of responses
The survey was carried out between 8th January 2016 and 4th February 2016. The survey attracted 1,255 responses globally, but respondents were first asked the global region for which they were most responsible. This report covers the 423 who responded in EMEA.
These responses were spread across a range of types of real estate investors. The most numerous were fund/asset managers, who accounted for 42% of survey participants. A further 13% were pension funds, insurance companies or sovereign wealth funds. The other most numerous respondents were private equity/venture capital firms (11%), private property companies (10%) and listed property companies/REITs (10%).
The respondents were predominantly investors domiciled in Europe (87%). UK-domiciled investors were the most numerous, making up 26% of the total, followed by France (13%), Netherlands (12%) and Germany (12%). The respondents from outside Europe were mainly from North America (8%).
Figure 14: Please indicate the country/region in which your organisation is domiciled:UKFranceNetherlandsGermanyElsewhere in Western EuropeCentral and Eastern EuropeNorth AmericaOther
26.2
12.515.6
9
7.85.2
% of respondents
12.111.6Source: CBRE EMEA Investor Intentions Survey, 2016
Fund or asset managerPrivate equity firm / venture capitalPrivate property companyInsurance companyListed property companyPrivate individual investor / family officePension fundREITBankSovereign wealth fundOther
42
8
5
6
54
% of respondents
1110
4 41
Figure 13: Please indicate which business sector best describes your organisation’s main activity:
Source: CBRE EMEA Investor Intentions Survey, 2016

cbre.com/research
Key contacts
Global Research Leadership
For more information about this regional report, please contact:
DisclaimerCBRE Ltd confirms that information contained herein, including projections, has been obtained from sources believed to be reliable. While we do not doubt their accuracy, we have not verified them and make no guarantee, warranty or representation about them. It is your responsibility to confirm independently their accuracy and completeness. This information is presented exclusively for use by CBRE clients and professionals and all rights to the material are reserved and cannot be reproduced without prior written permission of CBRE.
Michael HaddockSenior Director EMEA Researcht: +44 207 182 3274 e: [email protected]
Claire WilliamsAnalyst EMEA Researcht: +44 207 182 3196e: [email protected]
Nick Axford, Ph.D. Head of Research, Globalt: +44 207 182 2876e: [email protected] Nick on Twitter: @NickAxford1
Richard Barkham, Ph.D.Chief Economist, Globalt: +44 207 182 2665e: [email protected]
Spencer LevyHead of Research, Americast: +1 617 912 5236e: [email protected] Spencer on Twitter: @SpencerGLevy
Neil Blake, Ph.D. Head of Research, EMEA t: +44 207 182 2133 e: [email protected] Neil on Twitter: @NeilBlake123
Henry Chin, Ph.D. Head of Research, Asia Pacifict: +852 2820 8160 e: [email protected] Henry on Twitter: @HenryChinPhD
To learn more about CBRE Research, or to access additional research reports, please visit the Global Research Gateway at www.cbre.com/researchgateway