EMEA Insurance Outlook 2022 Volker Kudszus
21
Nov. 16, 2021 Volker Kudszus Sector Lead Insurance Ratings, Senior Director EMEA Insurance Outlook 2022 Fighting Fit For 2022 This article does not constitute a rating action
Transcript of EMEA Insurance Outlook 2022 Volker Kudszus
Nov. 16, 2021
Volker KudszusSector Lead Insurance Ratings, Senior DirectorEMEA Insurance Outlook 2022
Fighting Fit For 2022
This article does not constitute a rating action
Contents
2
EMEA Insurers 3
Capital Buffers 4
Capital Quality 5
Property & Casualty 6
Life Insurance 7
Insurance in 2022 8
EMEA Insurers Credit Conditions 10
External Factors 11
Insurance Key Risks 12
Sector Credit Overviews 13
European Life Insurers 14
European Nonlife Insurers 15
Russian And CIS 16
Gulf Cooperation Council 17
South African And Rest Of Africa 18
Related Research 19
Analytical Contacts 20

EMEA Insurers | Alive And Kicking
3
Predominantly Stable Outlooks
Source: S&P Global Ratings as of Nov. 8, 2021.
Ratings Remain Strong
EMEA insurers’ capital surplus has largely recovered, and now stands at 92% of its prepandemic level. For the EMEA insurance sector in aggregate, capitalization is 9% above the ‘AA’ category, which supports our current ratings.
Although competition is picking up in motor insurance, the non-life sector is expected to maintain solid insurance margins. Low and negative interest rates remain a burden for life insurers but, for many, we expect margins to bottom out at prepandemic levels.
In many cases, the quality of capital remained high, with hard capital providing a solid base and hybrid capital limits underused. However, the re-emergence of other uses of capital, such as progressive dividends, share buybacks, and mergers and acquisitions (M&A), suggests that capital adequacy will remain at about the current level.
EMEA insurers are well prepared for the current and upcoming challenges. In 2021, upgrades outpaced downgrades, and we saw limited downside risk. That said, we do not expect this trend to continue into 2022.
24.9%
63.6%
7.3%
3.8% 0.3%
AA A BBB BB CCC
3.8%
85.4%
8.2%
0.3% 2.3%
Positive Stable
Negative CreditWatch Positive
CreditWatch Negative

Capital Buffers | Back To Being A Key Strength
4
– As the capital market has rallied, much of the capital surplus has been reclaimed over the past year.
– Defaults and rating migration caused less capital stress than we feared.
– EMEA insurers are back to progressive dividends, share buybacks, and M&A.
– We expect capital to be rebuilt further but more slowly in 2022, roughly in line with top-line growth.
– We estimate that the capital buffer will remain 8% below its prepandemic level.
– That said, on average, EMEA insurers’ capital is 9% above the ‘AA’ confidence level in our risk-based capital model.
Source: S&P Global Ratings.
Capital Surplus Almost At Pre-Pandemic Levels
79,537
-21,724
-8,193
-17,003
-13,061
-7,610
72,905
0
10,000
20,000
30,000
40,000
50,000
60,000
70,000
80,000
90,000
2020 startingbuffer
Equity Default Migration Property Loan/mortgages Est. capitalsurplus Nov.
2021
Cap
ital
sur
plus
(mil.
€)
Decrease Increase

Capital Quality | Hard Forms Of Capital Continue To Dominate
5
– Our view of insurers’ capital adequacy relies not only on the amount of total adjusted capital (TAC), but also on the balance between shareholders’ equity, for example, which is considered stronger than softer forms of capital such as value in force.
– Most capital resources at EMEA insurers are hard, comprising shareholders’ equity and policyholders’ capital, e.g., German discretionary profit-sharing reserves (“free RfB”) and French deferred policyholder profit sharing provisions (PPE).
– VIF has a sizable share, at 16% of the total.
– The average 7% of unrealized gains are partly offset by the 3% of unrealized losses, making 4% in total.
– Hybrid equity compromises only 13% of TAC in EMEA, indicating some additional hybrid capacity if needed. This is unevenly split across listed and mutual insurers.Source: S&P Global Ratings.
Soft Forms Of Capital
Shareholder’s equity including minority, 50% Hybrid capital, 13%
Non life lossreservesadjustement, 2% Others, 2%
Unrealised gainadjustment, 4%
Unrealisedlossadjustment,3%
Policy bonus reserves, 16% Present value of future profits, 16%
86
88
90
92
94
96
98
100
102
2016 2017 2018 2019 2020 A/E 2021F 2022F
P/C
com
bine
d ra
tio
(%)
U.K. Italy France Germany Spain Switzerland
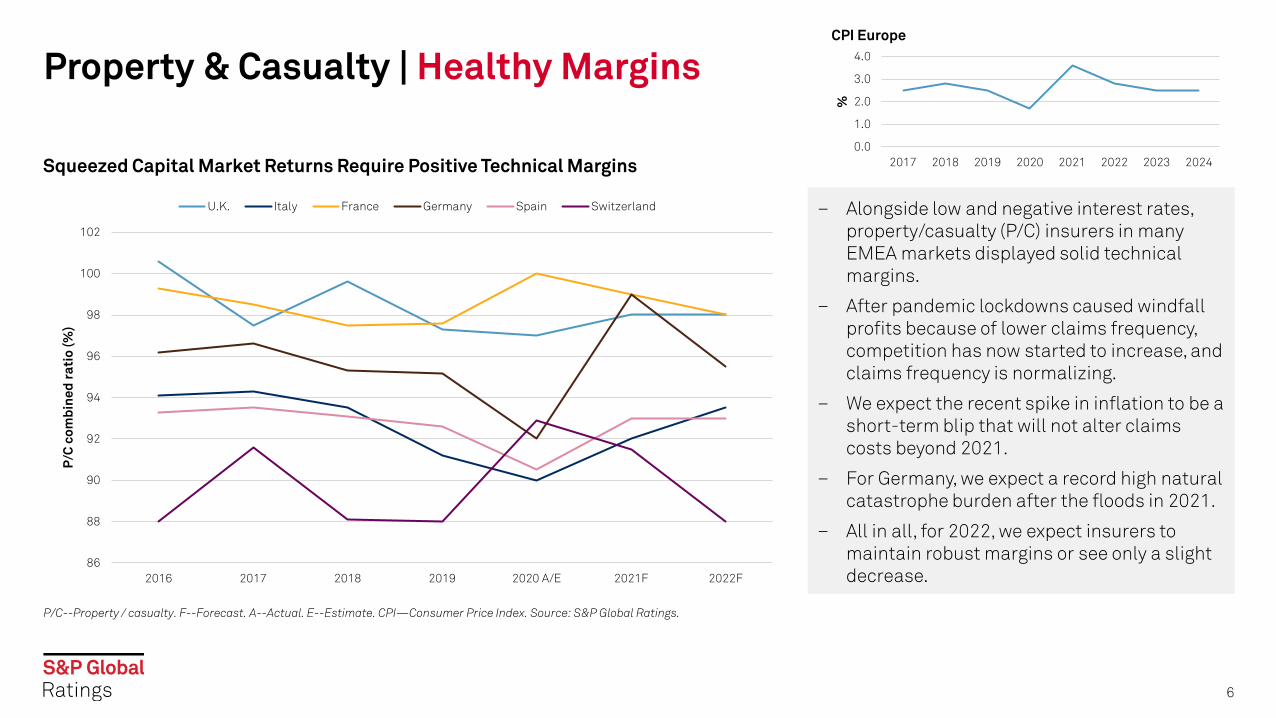
Property & Casualty | Healthy Margins
6
– Alongside low and negative interest rates, property/casualty (P/C) insurers in many EMEA markets displayed solid technical margins.
– After pandemic lockdowns caused windfall profits because of lower claims frequency, competition has now started to increase, and claims frequency is normalizing.
– We expect the recent spike in inflation to be a short-term blip that will not alter claims costs beyond 2021.
– For Germany, we expect a record high natural catastrophe burden after the floods in 2021.
– All in all, for 2022, we expect insurers to maintain robust margins or see only a slight decrease.
P/C--Property / casualty. F--Forecast. A--Actual. E--Estimate. CPI—Consumer Price Index. Source: S&P Global Ratings.
Squeezed Capital Market Returns Require Positive Technical Margins0.0
1.0
2.0
3.0
4.0
2017 2018 2019 2020 2021 2022 2023 2024
%
CPI Europe

Life Insurance | Margins Bottomed Out
7
– Low and negative interest rates remain a challenge for life insurers in some EMEA markets.
– We expect margins to bottom out in many major life markets.
– For years, insurers have steered new business toward capital-light products that offer guarantees of 0% or even below, protection, and unit-linked life insurance.
– However, the guaranteed general account legacy back-book still comprised 71% of the total in 1Q2021 in the European Economic Area, down from 77% in 3Q2016.
– Germany and Spain have particularly low shares of unit-linked products.
ROA--Return on assets. F--Forecast. A--Actual. E--Estimate. Q--Quarter. Source: S&P Global Ratings.
Low And Negative Interest Rates Remain A Challenge
0.0
0.2
0.4
0.6
0.8
1.0
1.2
1.4
2016 2017 2018 2019 2020 A/E 2021F 2022F
Life
RO
A (%
)
U.K. Italy France Germany Spain Switzerland
77
71
65
70
75
80
2016 Q3 2021 Q1
%
Share Of General Account Assets
-6%
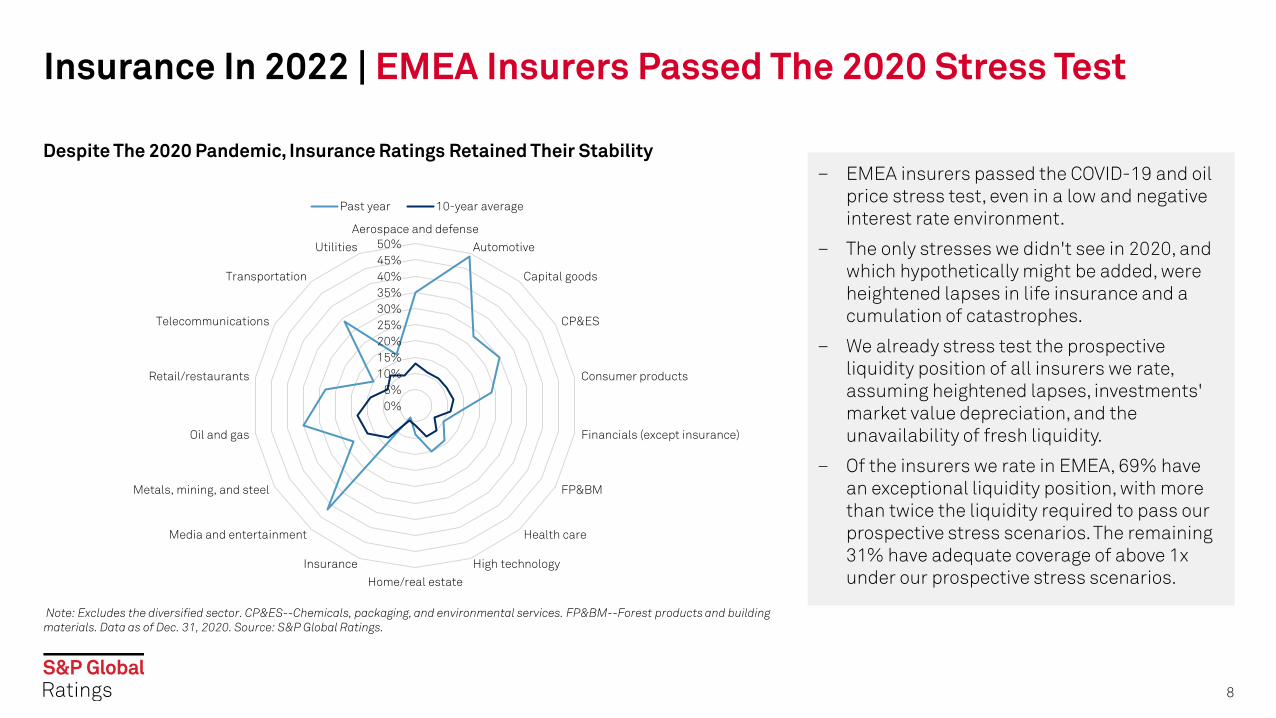
Insurance In 2022 | EMEA Insurers Passed The 2020 Stress Test
8
– EMEA insurers passed the COVID-19 and oil price stress test, even in a low and negative interest rate environment.
– The only stresses we didn't see in 2020, and which hypothetically might be added, were heightened lapses in life insurance and a cumulation of catastrophes.
– We already stress test the prospective liquidity position of all insurers we rate, assuming heightened lapses, investments' market value depreciation, and the unavailability of fresh liquidity.
– Of the insurers we rate in EMEA, 69% have an exceptional liquidity position, with more than twice the liquidity required to pass our prospective stress scenarios. The remaining 31% have adequate coverage of above 1x under our prospective stress scenarios.
Note: Excludes the diversified sector. CP&ES--Chemicals, packaging, and environmental services. FP&BM--Forest products and building materials. Data as of Dec. 31, 2020. Source: S&P Global Ratings.
Despite The 2020 Pandemic, Insurance Ratings Retained Their Stability
0%5%
10%15%20%25%30%35%40%45%50%
Aerospace and defense
Automotive
Capital goods
CP&ES
Consumer products
Financials (except insurance)
FP&BM
Health care
High technology
Home/real estate
Insurance
Media and entertainment
Metals, mining, and steel
Oil and gas
Retail/restaurants
Telecommunications
Transportation
Utilities
Past year 10-year average

Insurance In 2022 | EMEA Insurers Upside?
(1.0)
(0.5)
0.0
0.5
1.0
1.5
2.0
2.5
2020 2021F 2022F 2023F 2024F
10 y
ears
rat
e %
Eurozone Belgium France Germany Italy Spain Switzerland U.K.
9
– Upgrades outpaced downgrades in EMEA insurance during 2021.
– We do not expect this trend to continue into 2022.
– After the 2021 upgrades, more than twice as many ratings have a negative outlook or CreditWatch placement (10.5%) as have a positive outlook or CreditWatch placement (4.1%).
– On average, EMEA insurance ratings are in the ‘A’ range and 85.4% of them carry a stable outlook.
F--Forecast. Q—Quarter. Source: S&P Global Ratings.
Low Interest Rates Are Here To Stay
0123456789
Q4-20 Q1-21 Q2-21 Q3-21 Q4-21
No.
of
upgr
ades
/dow
ngra
des
Upgrades Downgrades

EMEA Insurers Credit Conditions
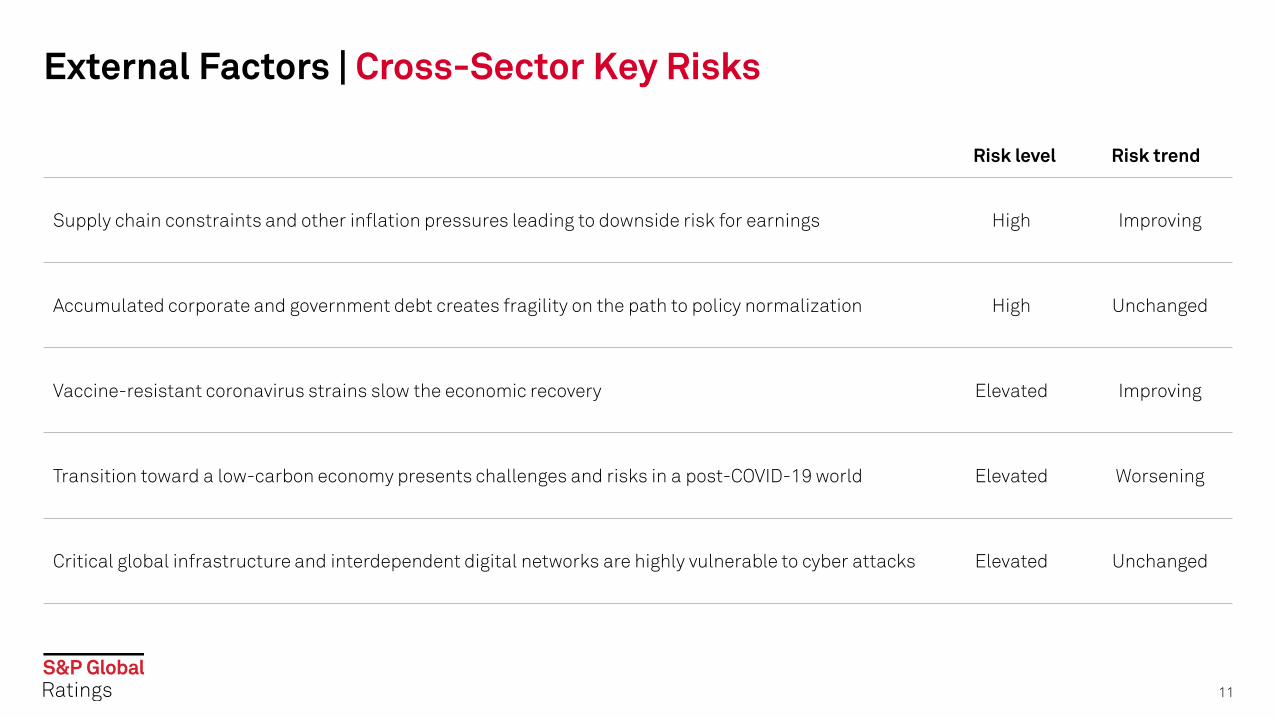
External Factors | Cross-Sector Key Risks
11
Supply chain constraints and other inflation pressures leading to downside risk for earnings High Improving
Accumulated corporate and government debt creates fragility on the path to policy normalization High Unchanged
Vaccine-resistant coronavirus strains slow the economic recovery Elevated Improving
Transition toward a low-carbon economy presents challenges and risks in a post-COVID-19 world Elevated Worsening
Critical global infrastructure and interdependent digital networks are highly vulnerable to cyber attacks Elevated Unchanged
Risk level Risk trend

Insurance Key Risks | Structural Risks Revealed After Recovery Risk factor Descriptor Risk trend What could change? EMEA
Asset riskDrop in value of insurers' invested assets as a result of financial market volatility. Persistent low interest rates depressing life insurers' investment margins.
DecreasingLife insurers’ investment margins appear to have bottomed out, and although this is challenging, we expect them being able to deal with long duration legacy back books with a material amount of guarantees.
Moderate
Insurance claims The spike in 2021 consumer price index inflation might lead to higher insurance claims in 2021. Flooding events and wildfires led to higher insured losses in some markets.
Decreasing Inflation assumed to normalize in 2022. Moderate
Insurance top line
We observed some top-line recovery in 2021, and expect full economic recovery for 2022.
UnchangedEconomic hiccups, for example, around supply chain issues, might affect the top line in selected segments and markets.
Low
Financing conditions
Financial market volatility and investor uncertainty might make it difficult to issue new instruments.
UnchangedFinancial markets and quantitative easing facilitate strong liquidity and new issuances, while refinancing remains favorable for insurers.
Low
Hybrid ratings Volatility in regulatory solvency ratios could heighten deferral risk.
UnchangedStarting point for solvency ratios is very high in many markets, and insurers narrowed the duration gap further to benefit solvency ratios. Solvency II updates might affect selected life insurers’ solvency ratios in the long run, to a limited extent.
Low
Climate transition
Transition toward a low-carbon economy presents challenges and risks in a post-COVID-19 world
Increasing
Insurers can act as enablers for society to transition to a low-carbon future through their roles as underwriters, investors, and risk advisors. This offers opportunities for new products and revenue streams. However, risks to capital and earnings persists for those with concentrations in industries which are exposed to the transition.
Moderate
Cyber risk Critical global infrastructure and interdependent digital networks are highly vulnerable to cyber attacks
Increasing
Rising tide of economic losses due to cyber attacks presents an opportunity for the growing cyber insurance market, but with it a need to understand and price the underlying risks. Insurers also face increasing attacks and must protect customer data and privacy or risk reputational or financial damage.
Moderate
12

Sector Credit Overviews
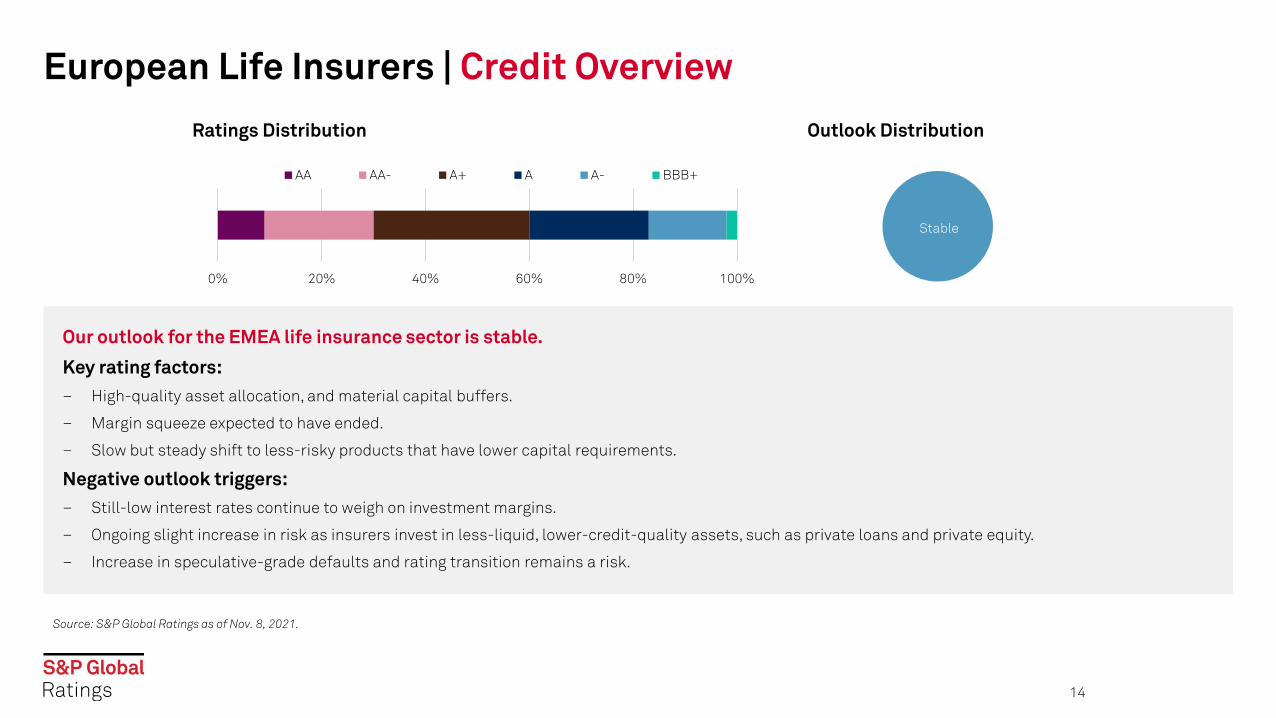
European Life Insurers | Credit Overview
Our outlook for the EMEA life insurance sector is stable.
Key rating factors:– High-quality asset allocation, and material capital buffers.
– Margin squeeze expected to have ended.
– Slow but steady shift to less-risky products that have lower capital requirements.
Negative outlook triggers:– Still-low interest rates continue to weigh on investment margins.
– Ongoing slight increase in risk as insurers invest in less-liquid, lower-credit-quality assets, such as private loans and private equity.
– Increase in speculative-grade defaults and rating transition remains a risk.
Ratings Distribution Outlook Distribution
14
0% 20% 40% 60% 80% 100%
AA AA- A+ A A- BBB+
Stable
Source: S&P Global Ratings as of Nov. 8, 2021.
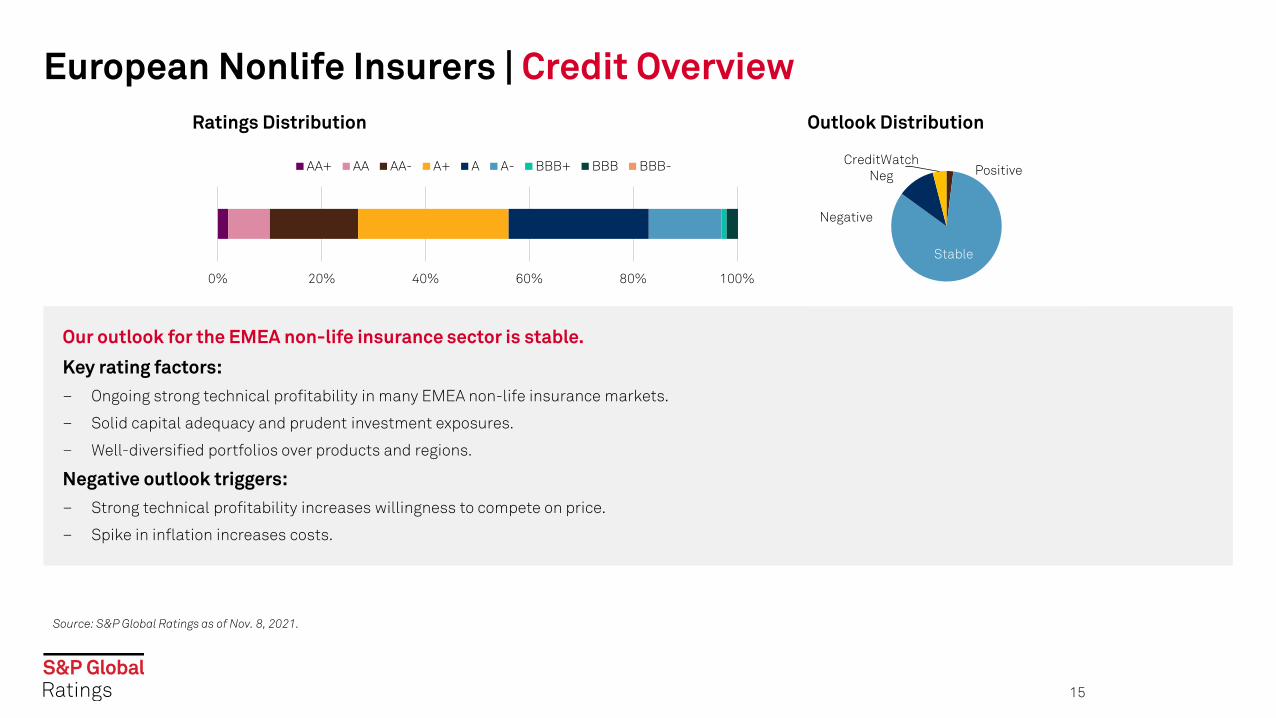
European Nonlife Insurers | Credit Overview
Our outlook for the EMEA non-life insurance sector is stable.
Key rating factors:– Ongoing strong technical profitability in many EMEA non-life insurance markets.
– Solid capital adequacy and prudent investment exposures.
– Well-diversified portfolios over products and regions.
Negative outlook triggers:– Strong technical profitability increases willingness to compete on price.
– Spike in inflation increases costs.
Ratings Distribution Outlook Distribution
15
0% 20% 40% 60% 80% 100%
AA+ AA AA- A+ A A- BBB+ BBB BBB- Positive
Stable
Negative
CreditWatch Neg
Source: S&P Global Ratings as of Nov. 8, 2021.
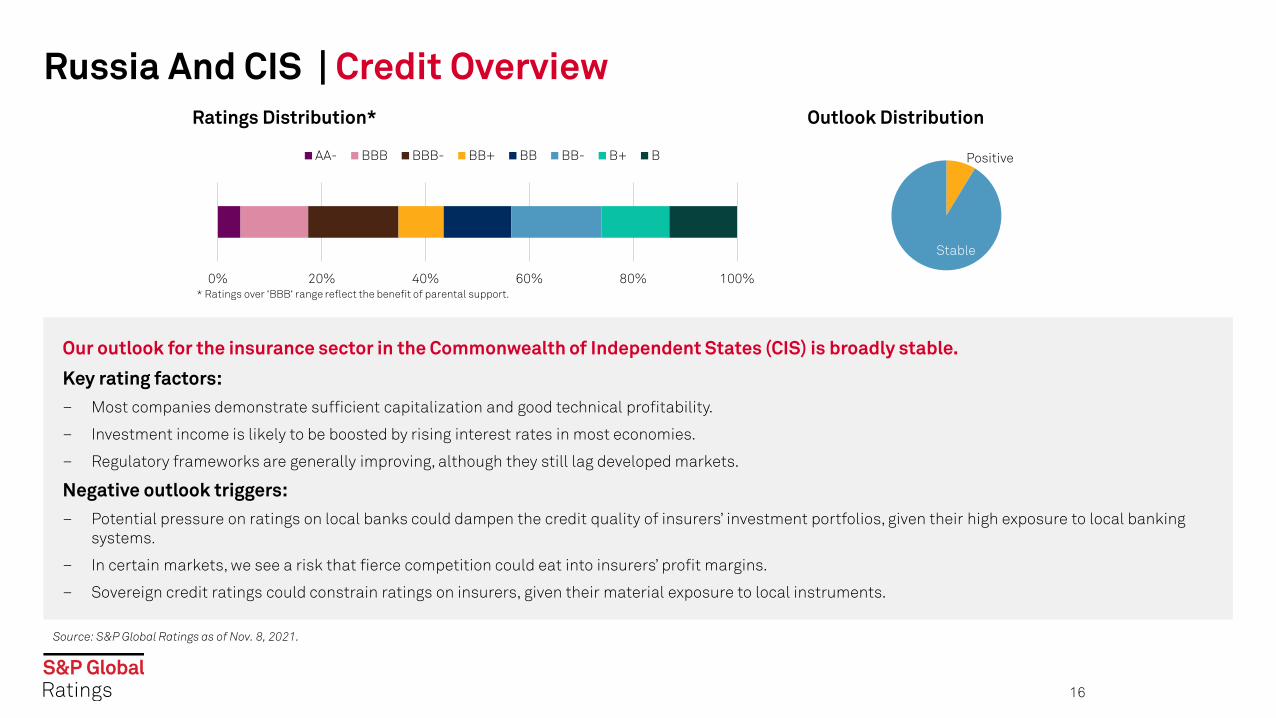
Russia And CIS | Credit Overview
Our outlook for the insurance sector in the Commonwealth of Independent States (CIS) is broadly stable.
Key rating factors:– Most companies demonstrate sufficient capitalization and good technical profitability.
– Investment income is likely to be boosted by rising interest rates in most economies.
– Regulatory frameworks are generally improving, although they still lag developed markets.
Negative outlook triggers:– Potential pressure on ratings on local banks could dampen the credit quality of insurers’ investment portfolios, given their high exposure to local banking
systems.
– In certain markets, we see a risk that fierce competition could eat into insurers’ profit margins.
– Sovereign credit ratings could constrain ratings on insurers, given their material exposure to local instruments.
Ratings Distribution* Outlook Distribution
16
0% 20% 40% 60% 80% 100%
AA- BBB BBB- BB+ BB BB- B+ B Positive
Stable
* Ratings over ‘BBB‘ range reflect the benefit of parental support.
Source: S&P Global Ratings as of Nov. 8, 2021.

Gulf Corporation Council (GCC) | Credit Overview
Our sector outlook for the insurance sector in the GCC is stable.
Key rating factors:– Very robust capital adequacy—more than 90% of our rated insurers maintain capital adequacy above our ‘AAA’ benchmark.
– Satisfactory technical profitability in most non-life insurance markets in the Gulf.
– Limited exposure to COVID-19-related claims, natural catastrophe, or other large risks.
Negative outlook triggers:– Elevated exposure to high-risk assets could affect earnings and capital buffers, if market volatility returns.
– Intense competition, particularly in motor and medical lines, leading to weaker operating performance and earnings.
– A significant increase in bad debt provisions, hitting earnings and liquidity buffers, as a result of a slowdown in premium collection and new accounting standards.
Ratings Distribution Outlook Distribution*
17
0% 20% 40% 60% 80% 100%
AA- A+ A A- BBB+ BBB BBB- BB+ Positive
Stable
Negative
CreditWatchNeg
*Includes a group with several subsidiaries that have a negative outlook.
Source: S&P Global Ratings as of Nov. 8, 2021.

South Africa And Rest of Africa | Credit Overview
Our outlook for the insurance sector within Africa is stable, reflecting already low ratings.
Key rating factors:– Generally, high economic and country risk constrains our ratings (unless a guarantee is present from the parent).
– Resilient capital buffers within the South African market, which makes up most of the premiums from Africa. Rest-of-Africa entities usually have a small capital base and limited earnings.
– Profitability for both 2020 and 2021 affected by COVID-19-related provisions (notably mortality-related losses across both periods, and business interruption in 2020), although capital remains resilient.
– Returns have yet to return to their historical highs but are expected to recover over the medium term.
– Low asset quality remains a concern, given most assets are held domestically (this is already reflected in ratings).
Negative outlook triggers:– More pressure on sovereign creditworthiness and, by extension, asset quality.
– Sustained poor economic conditions affecting broader growth environment and reinforcing the pressure on earnings.
Ratings Distribution* Outlook Distribution
18
0% 20% 40% 60% 80% 100%
AA+ AA- A- BB+ BB BB- CCC+
Stable
Negative
*Most ratings above ‘BB’ range reflect the benefit of parental support.
Source: S&P Global Ratings as of Nov. 8, 2021.

Related Research
Visit our website spglobal.com/ratings where you can find all our latest research, events and insights
19

Analytical Contacts
20
Victor [email protected]
Volker [email protected]
Emir [email protected]
Tatiana [email protected]
Mark [email protected]
Simon [email protected]
Johannes [email protected]
Trevor [email protected]
Taos [email protected]
Dennis [email protected]
Research ContributorAmi ShahGAC

21
Copyright © 2021 by Standard & Poor’s Financial Services LLC. All rights reserved.
No content (including ratings, credit-related analyses and data, valuations, model, software or other application or output therefrom) or any part thereof (Content) may be modified, reverse engineered, reproduced or distributed in any form by any means, or stored in a database or retrieval system, without the prior written permission of Standard & Poor's Financial Services LLC or its affiliates (collectively, S&P). The Content shall not be used for any unlawful or unauthorized purposes. S&P and any third-party providers, as well as their directors, officers, shareholders, employees or agents (collectively S&P Parties) do not guarantee the accuracy, completeness, timeliness or availability of the Content. S&P Parties are not responsible for any errors or omissions (negligent or otherwise), regardless of the cause, for the results obtained from the use of the Content, or for the security or maintenance of any data input by the user. The Content is provided on an "as is" basis. S&P PARTIES DISCLAIM ANY AND ALL EXPRESS OR IMPLIED WARRANTIES, INCLUDING, BUT NOT LIMITED TO, ANY WARRANTIES OF MERCHANTABILITY OR FITNESS FOR A PARTICULAR PURPOSE OR USE, FREEDOM FROM BUGS, SOFTWARE ERRORS OR DEFECTS, THAT THE CONTENT'S FUNCTIONING WILL BE UNINTERRUPTED, OR THAT THE CONTENT WILL OPERATE WITH ANY SOFTWARE OR HARDWARE CONFIGURATION. In no event shall S&P Parties be liable to any party for any direct, indirect, incidental, exemplary, compensatory, punitive, special or consequential damages, costs, expenses, legal fees, or losses (including, without limitation, lost income or lost profits and opportunity costs or losses caused by negligence) in connection with any use of the Content even if advised of the possibility of such damages.
Credit-related and other analyses, including ratings, and statements in the Content are statements of opinion as of the date they are expressed and not statements of fact. S&P's opinions, analyses, and rating acknowledgment decisions (described below) are not recommendations to purchase, hold, or sell any securities or to make any investment decisions, and do not address the suitability of any security. S&P assumes no obligation to update the Content following publication in any form or format. The Content should not be relied on and is not a substitute for the skill, judgment and experience of the user, its management, employees, advisors and/or clients when making investment and other business decisions. S&P does not act as a fiduciary or an investment advisor except where registered as such. While S&P has obtained information from sources it believes to be reliable, S&P does not perform an audit and undertakes no duty of due diligence or independent verification of any information it receives. Rating-related publications may be published for a variety of reasons that are not necessarily dependent on action by rating committees, including, but not limited to, the publication of a periodic update on a credit rating and related analyses.
To the extent that regulatory authorities allow a rating agency to acknowledge in one jurisdiction a rating issued in another jurisdiction for certain regulatory purposes, S&P reserves the right to assign, withdraw, or suspend such acknowledgement at any time and in its sole discretion. S&P Parties disclaim any duty whatsoever arising out of the assignment, withdrawal, or suspension of an acknowledgment as well as any liability for any damage alleged to have been suffered on account thereof.
S&P keeps certain activities of its business units separate from each other in order to preserve the independence and objectivity of their respective activities. As a result, certain business units of S&P may have information that is not available to other S&P business units. S&P has established policies and procedures to maintain the confidentiality of certain nonpublic information received in connection with each analytical process.
S&P may receive compensation for its ratings and certain analyses, normally from issuers or underwriters of securities or from obligors. S&P reserves the right to disseminate its opinions and analyses. S&P's public ratings and analyses are made available on its Web sites, www.standardandpoors.com (free of charge), and www.spcapitaliq.com (subscription) and may be distributed through other means, including via S&P publications and third-party redistributors. Additional information about our ratings fees is available at www.standardandpoors.com/usratingsfees.
Australia: S&P Global Ratings Australia Pty Ltd holds Australian financial services license number 337565 under the Corporations Act 2001. S&P Global Ratings' credit ratings and related research are not intended for and must not be distributed to any person in Australia other than a wholesale client (as defined in Chapter 7 of the Corporations Act).
STANDARD & POOR'S, S&P and RATINGSDIRECT are registered trademarks of Standard & Poor's Financial Services LLC.
spglobal.com/ratings