EMC Clariion SAN storage ... - eG Innovations Implementer's Guides... · Configuring and Monitoring...
17
Configuring and Monitoring an EMC Clariion SAN storage system eG Enterprise v5.2 Configuring and Monitoring an EMC Clariion SAN storage system eG Enterprise v5.6
Transcript of EMC Clariion SAN storage ... - eG Innovations Implementer's Guides... · Configuring and Monitoring...

Configuring and Monitoring an EMC Clariion SAN storage system
eG Enterprise v5.2
Configuring and Monitoring an EMC
Clariion SAN storage system
eG Enterprise v5.6

Restricted Rights Legend
The information contained in this document is confidential and subject to change without notice. No part of
this document may be reproduced or disclosed to others without the prior permission of eG Innovations,
Inc. eG Innovations, Inc. makes no warranty of any kind with regard to the software and documentation,
including, but not limited to, the implied warranties of merchantability and fitness for a particular purpose.
Trademarks
Microsoft Windows, Windows NT, Windows 2000, Windows 2003 and Windows 2008 are either registered
trademarks or trademarks of Microsoft Corporation in United States and/or other countries.
The names of actual companies and products mentioned herein may be the trademarks of their respective
owners.
Copyright
© 2012 eG Innovations, Inc. All rights reserved.
Table of Contents CONFIGURING AND MONITORING AN EMC CLARIION SAN STORAGE SYSTEM ................................... 1
1.1 Pre-requisites for Monitoring EMC Clariion SAN storage system ................................................................... 1
1.1.1 Enabling Performance Logging on the Storage System ............................................................................ 1
1.2 Administering the eG Manager to monitor an EMC Clariion SAN storage system .......................................... 5
1.3 Monitoring the EMC Clariion SAN storage system .......................................................................................... 8
CONFIGURING AND MONITORING EMC VNX STORAGE SYSTEM .............................................................. 9
2.1 Pre-requisites for Monitoring EMC VNX Storage system ................................................................................ 9
2.2 Administering the eG Manager to monitor an EMC VNX Storage system ....................................................... 9
2.3 Monitoring the EMC VNX Storage system .................................................................................................... 12
CONCLUSION ............................................................................................................................................................. 13

Table of Figures
Figure 1.1: Logging into the Navisphere Express Console ...................................................................................................................... 2 Figure 1.2: The Navisphere Express Console .......................................................................................................................................... 2 Figure 1.3: The System Services section ................................................................................................................................................. 3 Figure 1.4: The Diagnostic Files page ..................................................................................................................................................... 3 Figure 1.5: Scrolling down the Diagnostic Files pages to view the Performance Logs button ................................................................. 4 Figure 1.6: Starting data logging ............................................................................................................................................................. 4 Figure 1.7: Configuring data logging ....................................................................................................................................................... 5 Figure 1.8: Reviewing data logging specifications .................................................................................................................................. 5 Figure 1.9: Selecting the type of component to be added ........................................................................................................................ 6 Figure 1.10: Adding a new component type of EMC Clariion SAN ........................................................................................................ 6 Figure 1.11: A page displaying the tests that need to be configured for the EMC Clariion SAN ............................................................. 7 Figure 1.12: Configuring the Clariion Cache test parameters .................................................................................................................. 7 Figure 2.1: Adding a new component type of EMC VNX Storage system ............................................................................................ 10 Figure 2.2: A page displaying the tests that need to be configured for the EMC VNX Storage ............................................................. 10 Figure 2.3: Configuring the Storage Processor Cache test parameters ................................................................................................... 11 Figure 1.13: Configuring the CIFS Performance test parameters .......................................................................................................... 12

Conf igu r ing and Mon ito r ing an EMC Clar i ion SAN storage system
1
Configuring and Monitoring an EMC Clariion SAN storage system The EMC Clariion SAN storage system can be configured and monitored by following the steps given below:
Administer the eG manager to monitor the EMC Clariion SAN storage system
Monitor the EMC Clariion SAN storage system
1.1 Pre-requisites for Monitoring EMC Clariion SAN storage system
To enable the eG agent to invoke and communicate with the storage system, the following pre-requisites
should be fulfilled:
The eG agent should be deployed on the same host on which the NaviSphere CLI (i.e., the
NaviSecCLI.exe) operates;
The NaviSphere CLI should run on a host that communicates with the storage system
Each test executed by the agent should be configured with the full path to the NaviSecCLI.exe and
the credentials of a user who has access to the storage system
Performance logging should be enabled on the storage system; the steps to be followed to
achieve this have been detailed in Section 1.1.1 of this document.
1.1.1 Enabling Performance Logging on the Storage System To achieve this, login to the host on which the Navisphere CLI operates, and issue the following command
at the command prompt:
naviseccli -h <array-ip> -scope 0 -user <name of user with access to storage system> -password <password of
user with access to storage system> setstats -on
For instance, if the IP address of the storage array is 192.168.10.86, and the credentials of the user with
rights to access the storage array are username: john and password: john, the command will be:
naviseccli -h 19.168.10.86 -scope 0 -user john -password john setstats -on
Alternatively, you can follow the steps detailed below to enable performance logging on the storage system:
1. From a web browser, connect to the storage array using the URL:
http://<IP_address_of_storage_array>/
2. Figure 1.1 will then appear prompting you to login to the Navisphere Express Console. Provide the
credentials of the SAN administrator against the User name and Password textbox, and click the Login

Conf igu r ing and Mon ito r ing an EMC Clar i ion SAN storage system
2
button to login.
Figure 1.1: Logging into the Navisphere Express Console
3. The Navisphere Express Console will then appear, as depicted by Figure 1.2.
Figure 1.2: The Navisphere Express Console
4. From the list of options provided in the left panel of Figure 1.2, select the Services option under the
System head (as indicated by Figure 1.2).
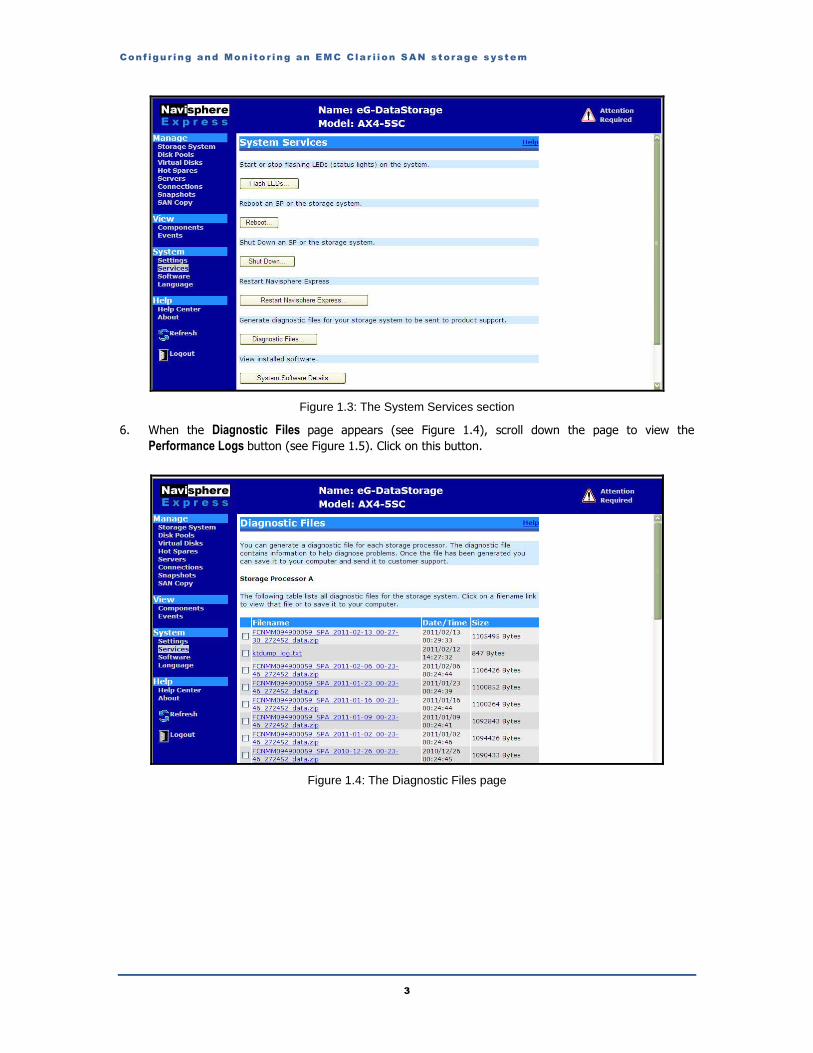
5. A System Services page will then appear in the right panel (see Figure 1.3). Click on the Diagnostic
Files button in Figure 1.3.
Click on this option
Conf igu r ing and Mon ito r ing an EMC Clar i ion SAN storage system
3
Figure 1.3: The System Services section
6. When the Diagnostic Files page appears (see Figure 1.4), scroll down the page to view the
Performance Logs button (see Figure 1.5). Click on this button.
Figure 1.4: The Diagnostic Files page

Conf igu r ing and Mon ito r ing an EMC Clar i ion SAN storage system
4
Figure 1.5: Scrolling down the Diagnostic Files pages to view the Performance Logs button
7. In the Performance Logs page that then appears (see Figure 1.6), click on the Start button to begin
data logging.
Figure 1.6: Starting data logging
8. You can configure how frequently data logging should occur and also indicate when it should stop
using the Polling interval and Stop Logging in controls (respectively) in Figure 1.7 that appears. Then,
click the Start Logging button in Figure 1.7 to begin data logging.

Conf igu r ing and Mon ito r ing an EMC Clar i ion SAN storage system
5
Figure 1.7: Configuring data logging
9. Figure 1.8 then appears where you can review your data logging specifications.
Figure 1.8: Reviewing data logging specifications
Once the aforesaid pre-requisites are fulfilled, the eG agent will extract useful statistics from the storage
system and report it to the eG manager.
1.2 Administering the eG Manager to monitor an EMC Clariion SAN storage system
1. Login to the administrative interface of eG as an administrator (admin).
2. Manually add the EMC Clariion SAN storage system to be monitored using the add/modify components
page (see Figure 1.9). To navigate to the add/modify Components page, follow the menu sequence:
Infrastructure-> Components -> Add/Modify.
3. To add a new EMC Clariion SAN storage system, first, select EMC Clariion SAN as the Component type
(as shown Figure 1.9 below) and then, click the Add New Component button.

Conf igu r ing and Mon ito r ing an EMC Clar i ion SAN storage system
6
Figure 1.9: Selecting the type of component to be added
4. The following page will then appear. Specify the Host IP address and the Nick name of the EMC
Clariion SAN storage system. This EMC Clariion SAN component can only be monitored in an agentless
manner. Therefore, set the Agentless flag to Yes, select Other as the OS and SNMP as the Mode.
Then, click the Add button to register the changes (see Figure 1.10).
Figure 1.10: Adding a new component type of EMC Clariion SAN
Though the Mode is set to SNMP while adding a new component, the eG agent will be able
to collect metrics from the target environment through the NAVISSECCLI path that will be
specified by you during parameter configuration for the tests pertaining to the EMC Clariion
SAN storage system.
5. A summary of the new component details will then appear.
6. The EMC Clariion SAN component type so added will be managed automatically by eG Enterprise. Now,
try to sign out of the user interface. Doing so, will bring up the following page as shown in Figure
1.11, which prompts you to configure a list of unconfigured tests for the new EMC Clariion SAN
component type.

Conf igu r ing and Mon ito r ing an EMC Clar i ion SAN storage system
7
Figure 1.11: A page displaying the tests that need to be configured for the EMC Clariion SAN
7. Click on Clariion Cache Test to configure it. Figure 1.12 will then appear.
Figure 1.12: Configuring the Clariion Cache test parameters
8. Here, specify the following:
TEST PERIOD – How often should the test needs to be executed
HOST - The IP address of the storage device.
PORT - The port number at which the storage device listens. The default is NULL.
CLARIION IP – By default, the HOST IP will be displayed here. If at a later point in time, the IP
address of the device changes, you can change the CLARIION IP.
NAVISECCLIPATH – The eG agent uses the command-line utility, NaviSecCli.exe, which is
part of the NaviSphere Management Suite, to communicate with and monitor the storage
device. To enable the eG agent to invoke the CLI, configure the full path to the CLI
in the NAVISECCLIPATH text box.
USERNAME and PASSWORD– Provide the credentials of a user who is authorized to access the
storage device in the USER NAME and PASSWORD text boxes.
CONFIRM PASSWORD – Confirm the password by retyping it here.
TIMEOUT - Indicate the duration (in seconds) for which this test should wait for a response from
the storage device. By default, this is set to 120 seconds.

Conf igu r ing and Mon ito r ing an EMC Clar i ion SAN storage system
8
9. Click the Update button to configure the test.
10. Finally, signout of the eG administrative interface.
1.3 Monitoring the EMC Clariion SAN storage system To monitor an EMC Clariion SAN storage system, do the following:
1. Login as a monitor / supermonitor user.
2. Click on the Components option in the menu bar, and select the Servers option from the Components
menu.
3. Click on the EMC Clariion SAN that is being monitored to view its measurements.

Conf igu r ing and Mon ito r ing EMX VNX Storage system
9
Configuring and Monitoring EMC VNX Storage system The EMC VNX Storage system can be configured and monitored by following the steps given below:
Administer the eG Manager to monitor the EMC VNX Storage system
Monitor the EMC VNX Storage system
2.1 Pre-requisites for Monitoring EMC VNX Storage system
To enable the eG agent to invoke and communicate with the storage system, the following pre-requisites
should be fulfilled:
The eG agent should be deployed on the same host on which the NaviSphere CLI (i.e., the
NaviSecCLI.exe) operates;
The NaviSphere CLI should run on a host that communicates with the storage system
Each test executed by the agent should be configured with the full path to the NaviSecCLI.exe and
the credentials of a user possessing nasadmin role
Performance logging should be enabled on the storage system; the steps to be followed to
achieve this have been detailed in Section 1.1.1 of this document.
2.2 Administering the eG Manager to monitor an EMC VNX Storage system
1. Login to the eG administrative interface.
2. The eG Enterprise suite does not automatically discover the EMC VNX Storage system in the target
environment. Therefore, add the component manually (see Figure 2.1) using the ADD/MODIFY
COMPONENTS page (Infrastructure -> Components -> Add/Modify). Remember that components
manually added are managed automatically. Discovered components, however, are managed using the
COMPONENTS - MANAGE/UNMANAGE page.
3. While adding the component, specify the Host IP address and the Nick name of the EMC VNX Storage
system. Then, select the OS for the storage system that is to be monitored and SSH as the Mode and
click the Add button to register the changes (see Figure 2.1).

Conf igu r ing and Mon ito r ing EMX VNX Storage system
10
Figure 2.1: Adding a new component type of EMC VNX Storage system
Though the Mode is set to SSH while adding a new component, the eG agent will be able to
collect metrics from the target environment through the NAVISSECCLI path that will be
specified by you during parameter configuration for the tests pertaining to the EMC VNX
Storage system.
4. A summary of the new component details will then appear.
5. The EMC VNX Storage component type so added will be managed automatically by eG Enterprise.
Now, try to sign out of the eG administrative interface. Doing so, will bring up the following page as
shown in Figure 1.11, which prompts you to configure a list of unconfigured tests for the new EMC
VNX Storage system.
Figure 2.2: A page displaying the tests that need to be configured for the EMC VNX Storage
6. Click on the Storage Processor Cache Test to configure it. Figure 1.12 will then appear.

Conf igu r ing and Mon ito r ing EMX VNX Storage system
11
Figure 2.3: Configuring the Storage Processor Cache test parameters
7. Here, specify the following:
TEST PERIOD – How often should the test needs to be executed
HOST - The IP address of the storage system.
CONTROLLER IP – By default, the HOST IP will be displayed here. If at a later point in time, the
IP address of the device changes, you can change the CLARIION IP.
NAVISECCLIPATH – The eG agent uses the command-line utility, NaviSecCli.exe, which is
part of the NaviSphere Management Suite, to communicate with and monitor the storage
device. To enable the eG agent to invoke the CLI, configure the full path to the CLI
in the NAVISECCLIPATH text box.
USERNAME and PASSWORD– Provide the credentials of a user who is authorized to access the
storage device in the USER NAME and PASSWORD text boxes.
CONFIRM PASSWORD – Confirm the password by retyping it here.
TIMEOUT - Indicate the duration (in seconds) for which this test should wait for a response from
the storage system. By default, this is set to 120 seconds.
USER SCOPE - In most secure target environments, administrators may not want to expose their
user credentials for those accessing all the EMC VNX Storage systems in the target environment.
In such a case, select Local as the USER SCOPE so that the user will be allowed to access only
that EMC VNX Storage system he/she is authorized to. Select Global from this list if the user is
authorized to access all the EMC VNX Storage systems in the target environment.
8. Click the Update button to configure the test.
9. Now when you try to signout of the eG administrative interface, a list of unconfigured tests will appear.
Click on the CIFS Performance test to configure it. Figure 2.13 will then appear.

Conf igu r ing and Mon ito r ing EMX VNX Storage system
12
Figure 1.13: Configuring the CIFS Performance test parameters
10. Here, specify the following:
TEST PERIOD – How often should the test needs to be executed
HOST - The IP address of the storage system.
CONTROLLER STATION IP – Here, specify the IP address of the storage controller. By default,
the HOST IP will be displayed here. If at a later point in time, the IP address of the device
changes, you can change the CONTROLLER STATION IP.
11. Click the Update button to configure the test and finally, signout of the eG administrative interface.
2.3 Monitoring the EMC VNX Storage system To monitor an EMC VNX Storage system, do the following:
1. Login as a monitor / supermonitor user.
2. Click on the Components option in the menu bar, and select the Servers option from the Components
menu.
3. Click on the EMC VNX Storage that is being monitored to view its measurements.
Conc lus ion
13
Conclusion This document has described in detail the steps for configuring and monitoring the EMC Storage systems.
For details of how to administer and use the eG Enterprise suite of products, refer to the user manuals.
We will be adding new measurement capabilities into the future versions of the eG Enterprise suite. If you
can identify new capabilities that you would like us to incorporate in the eG Enterprise suite of products,
please contact [email protected]. We look forward to your support and cooperation. Any
feedback regarding this manual or any other aspects of the eG Enterprise suite can be forwarded to