
Embedded-Text Detection and Its Application to Anti-Spam...
79
UNIVERSITY OF CALIFORNIA Santa Barbara Embedded-Text Detection and Its Application to Anti-Spam Filtering A Thesis submitted in partial satisfaction of the requirements for the degree of Master of Science in Computer Science by Ching-Tung Wu Committee in Charge: Professor Kwang-Ting Cheng, Chair Professor Yuan-Fang Wang Associate Professor Matthew Turk April 2005
Transcript of Embedded-Text Detection and Its Application to Anti-Spam...

UNIVERSITY OF CALIFORNIASanta Barbara
Embedded-Text Detection and Its Application to
Anti-Spam Filtering
A Thesis submitted in partial satisfaction
of the requirements for the degree of
Master of Science
in
Computer Science
by
Ching-Tung Wu
Committee in Charge:
Professor Kwang-Ting Cheng, Chair
Professor Yuan-Fang Wang
Associate Professor Matthew Turk
April 2005

The Thesis ofChing-Tung Wu is approved:
Professor Yuan-Fang Wang
Associate Professor Matthew Turk
Professor Kwang-Ting Cheng, Committee Chairperson
April 2005

Embedded-Text Detection and Its Application to Anti-Spam Filtering
Copyright c© 2005
by
Ching-Tung Wu
iii

Abstract
Embedded-Text Detection and Its Application to
Anti-Spam Filtering
Ching-Tung Wu
Embedded-text in images usually carry important messages about the content.
In the past, several algorithms have been proposed to detect text boxes in video
frames. Previous work often followed a multi-step framework using a combina-
tion of image-analysis and machine-learning techniques. In this work, we propose
a unified embedded-text detection framework to efficiently and accurately locate
text boxes particularly in web and email images. We approach the embedded-
text problem from the angle of object detection. We define position-independent
features to capture the essence of characters and a smart-scan algorithm to trace
text lines using their spatial and geometrical properties. We also propose a novel
anti-spam system which utilizes visual clues, including the embedded-text infor-
mation. The experimental results demonstrate the effectiveness of the proposed
embedded-text detection framework and the anti-spam filtering system.
Professor Kwang-Ting Cheng
Thesis Committee Chair
iv

Contents
List of Figures vii
List of Tables viii
1 Introduction 1
1.1 Previous Work . . . . . . . . . . . . . . . . . . . . . . . . . . . . 21.2 Motivation . . . . . . . . . . . . . . . . . . . . . . . . . . . . . . . 51.3 Contributions . . . . . . . . . . . . . . . . . . . . . . . . . . . . . 81.4 Outline . . . . . . . . . . . . . . . . . . . . . . . . . . . . . . . . . 9
2 Embedded-Text Detection 12
2.1 Cascade Detector . . . . . . . . . . . . . . . . . . . . . . . . . . . 132.1.1 Position-Independent Feature - Motivation . . . . . . . . . 142.1.2 Position-Independent Feature - Definition . . . . . . . . . 172.1.3 Cascade Detector Training . . . . . . . . . . . . . . . . . . 212.1.4 Experiments and Discussions . . . . . . . . . . . . . . . . 24
2.2 Detection Framework . . . . . . . . . . . . . . . . . . . . . . . . . 272.2.1 One-Step Framework . . . . . . . . . . . . . . . . . . . . . 282.2.2 Two-Step Framework . . . . . . . . . . . . . . . . . . . . . 37
2.3 Experiments . . . . . . . . . . . . . . . . . . . . . . . . . . . . . . 382.3.1 Metrics . . . . . . . . . . . . . . . . . . . . . . . . . . . . 392.3.2 Experimental Results . . . . . . . . . . . . . . . . . . . . . 412.3.3 Computation Cost . . . . . . . . . . . . . . . . . . . . . . 442.3.4 Memory Consumption . . . . . . . . . . . . . . . . . . . . 45
3 Visual-Based Anti-Spam Filtering 48
3.1 The Spam Datasets and Analysis . . . . . . . . . . . . . . . . . . 513.2 The Anti-Spam Filter . . . . . . . . . . . . . . . . . . . . . . . . . 54
v

3.2.1 Feature Description . . . . . . . . . . . . . . . . . . . . . . 543.2.2 Feature Extraction . . . . . . . . . . . . . . . . . . . . . . 563.2.3 The Classifier . . . . . . . . . . . . . . . . . . . . . . . . . 58
3.3 Experiments . . . . . . . . . . . . . . . . . . . . . . . . . . . . . . 603.3.1 Datasets . . . . . . . . . . . . . . . . . . . . . . . . . . . . 613.3.2 Experimental Results . . . . . . . . . . . . . . . . . . . . . 62
4 Conclusions 65
Bibliography 67
vi

List of Figures
1.1 Embedded-Text in Images Example . . . . . . . . . . . . . . . . . 11
2.1 Top two features selected by AdaBoosting in Viola’s work . . . . . 152.2 Canny edge detection result of a sample image . . . . . . . . . . . 162.3 Edge coding, 3x3 sub-window, horizontal, and vertical pattern . . 172.4 Edge map of text and confusing background objects . . . . . . . . 242.5 Top three features selected by BrownBoosting . . . . . . . . . . . 262.6 Tough case of negative training samples . . . . . . . . . . . . . . . 272.7 One-Step Framework Flow . . . . . . . . . . . . . . . . . . . . . . 292.8 Example of Locality Shifts . . . . . . . . . . . . . . . . . . . . . . 302.9 Locality-Filter Rectangle Features . . . . . . . . . . . . . . . . . . 322.10 Vertical Locality-Filter Example of Letter A . . . . . . . . . . . . 322.11 Horizontal Locality-Filter Example of Letter A . . . . . . . . . . . 332.12 Horizontal Locality-Filter Example of Letter I . . . . . . . . . . . 332.13 Horizontal Locality-Filter Example of Letter L . . . . . . . . . . . 342.14 Diagram of the search algorithm . . . . . . . . . . . . . . . . . . . 362.15 Two-Step Framework Flow . . . . . . . . . . . . . . . . . . . . . . 382.16 Embedded-Text Detection Raw Results . . . . . . . . . . . . . . . 462.17 Embedded-Text Detection Final Results . . . . . . . . . . . . . . 47
3.1 Spam email with embedded-text in image example . . . . . . . . . 533.2 Text embedded in image example . . . . . . . . . . . . . . . . . . 583.3 Detected embedded-text regions . . . . . . . . . . . . . . . . . . . 59
vii

List of Tables
2.1 18-stage cascade detector using BrownBoosting . . . . . . . . . . 252.2 Feature sets comparison . . . . . . . . . . . . . . . . . . . . . . . 262.3 Locality-Filter Verification . . . . . . . . . . . . . . . . . . . . . . 412.4 Performance Comparison . . . . . . . . . . . . . . . . . . . . . . . 432.5 Computation Cost Comparison . . . . . . . . . . . . . . . . . . . 44
3.1 Statistics of emails containing accessible images . . . . . . . . . . 523.2 Classifier comparison . . . . . . . . . . . . . . . . . . . . . . . . . 633.3 Filter comparison . . . . . . . . . . . . . . . . . . . . . . . . . . . 633.4 Blocked/Missed email analysis . . . . . . . . . . . . . . . . . . . . 63
viii

Chapter 1
Introduction
As the Internet continues to grow, the type of information available to users
has shifted from text-only to multimedia-enriched. Embedded-text in multime-
dia content (e.g. images and videos) is becoming one of the prevalent means
for delivering messages to content viewers. Several embedded-text detection and
recognition algorithms have been proposed in the past. However, as the type of
multimedia content keeps getting more and more diverse and the amount grows
exponentially, developing an embedded-text detector that is accurate and efficient
has become an interesting topic and a challenging task.
Embedded-text often carries important messages regarding the where, what,
and who of the content. This information clearly helps with the recognition and
annotation of the content. Embedded-text within images and videos can be cat-
1

Chapter 1. Introduction
egorized as natural scene text and artificial text. Natural scene text refers to text
that appears as part of the scene in images or videos; for example, a news video
showing an event that happened in a recognizable location. Artificial text, on the
other hand, is manually added to provide content to viewers. One example of
artificial text is the closed caption of a video; another is the text banner box on
a web image.
The first step to extract embedded-text in an image or a video frame is to
pinpoint the location of the text boxes. In this thesis, we aim to develop a robust
and accurate embedded-text detector particularly for detecting artificial text in
web and images. The detection result can be fed into the existing Optical Charac-
ter Recognition (OCR) packages such as OmniPage or GNU OCR. In the second
part of this thesis, we also demonstrate an application to anti-spam filtering which
directly uses the text-detection result.
1.1 Previous Work
Artificial text boxes are designed to attract attention. These text boxes usually
present strong coherence in space, geometry, and color. For example, they usu-
ally align horizontally, contain homogeneous color regions, pose strong edge ener-
gies, and exhibit high intensity differences from neighboring objects or contrasting
2
Chapter 1. Introduction
background. Since visual, spatial, and geometric coherence provides strong clues,
previous work has primarily focused on these characteristics for the task of text
detection.
Based on the detection framework, previous work can be roughly classified
into two categories; (1) Image-analysis-based (2) Image-analysis plus machine-
learning-based. In the first category, embedded-text detection depends heavily
on image analysis techniques, such as edge detection, connected component, and
texture analysis. In the second category, a machine learning method is applied
in addition to the image analysis techniques. The machine learning step is used
mainly for verification purposes because it can further reduce the number of false
positives.
In the image-analysis category, embedded-text detection depends heavily on
image analysis techniques. These can be further sub-categorized into edge-based
and texture-based approaches. The common flow works as follows: First, edge
detection or texture analysis is performed on the image under consideration. The
image’s raw features are then grouped according to connectivity, spatial, and ge-
ometric correlations to form potential text regions. Second, potential text regions
are further examined using rule-based heuristics, such as the size, aspect ratio , and
orientation of the region. Fletcher et al. [6] used edge detection and connected-
component analysis to generate connected text blocks. Then, they applied a
3

Chapter 1. Introduction
Hough transformation to aggregate the text blocks into text strings. LeBourgeois
[12] proposed using a linear filter to transform the gradient map, such as the edge
energy map of an image, to a texture map by smearing and dilating the gradient
map in one direction. Since text pixels appear in a coherent way, text regions
usually stand out and can be easily identified after the transformation. Zhou et
al. [39] proposed a texture-based approach to extract text from web images using
color clustering and connected component analysis. Wu et al. [23] presented a
text segmentation based on distinctive textures of text. Text strokes are extracted
and refined in multiple phases to form the final bounding boxes.
In the second category, the machine-learning method is applied in conjunction
with image analysis techniques. The machine-learning step serves as the text
pixel or text region verifier. It is usually applied after the image analysis step to
further reduce the false positive rate. Chen et al. [2] used edge dilation to merge
horizontal and vertical edges into regions, then applied an SVM model to classify
these text regions. The assumption was that text lines contain short horizontal
and vertical edges within a confined space. The dilation and merging of these
edges make text appear as continuous regions. These regions are then classified
using the trained SVM model. Wolf et al. [25] extended LeBourgeois’ idea by
applying more geometrical and spatial heuristics on the text lines identification.
Then, an SVM model was trained for the final classification. Kim et al. [10] also
4

Chapter 1. Introduction
presented a texture-based approach by using SVM to report the probability of a
pixel being part of text texture, then, by applying CAMSHIFT algorithm on the
probability map to locate text regions.
The common part between image analysis based and image analysis plus ma-
chine learning based is that they often followed a two-step procedure. In the first
step, potential text regions are identified. Then, in the second step, a statistical-
driven and/or heuristics-based models were applied to refine the potential text
regions and to determine the final ones.
1.2 Motivation
The first motivation for our work is that the number of images with embedded-
text has increased rapidly, especially in web and email applications. Being able
to detect text embedded in these images will be a good starting point to further
analyze the received contents. One example is the Unsolicited Commercial Email
(UCE), also known as ”spam”, on the Internet. With the increasing importance of
email and the incursions of Internet marketers, spam has become a major problem.
In the past, researchers have addressed this problem as a text classification or
categorization problem. Recently, spammers have been using embedded-text in
5

Chapter 1. Introduction
images to avoid these text-based anti-spam filters. Without the ability to detect
embedded-text, it will be very difficult to alleviate this problem.
The second motivation for our work is to improve the text-detection accuracy
beyond the previous two-step framework. We hope to keep the advantages of the
existing two-step framework while reducing or eliminating its disadvantages.
In the previous embedded-text frameworks, the text detection problem is di-
vided into two sub-tasks. In the first step, potential text regions are identified
using primarily image-analysis techniques. Then, in the second step, potential
text regions are further refined using statistical-driven models or heuristic rules
based on spatial and geometrical constraints. One advantage of these frameworks
is that the embedded-text detection problem can be divided into two easier sub-
problems. Each step in the two-step framework deals with one of the sub-tasks,
making the process more efficient. The first step is to locate potential text regions.
The second step, which usually takes more time, is to refine and to determine the
final text regions. By separating the tasks, the slower step only has to deal with
part of the image, rather than the entire image. Another advantage is that the
false alarms can be further reduced as the text regions pass through each step.
A major disadvantage of the two-step framework is that the two steps depend
on each other, hence, the overall detection rate is constrained by the lowest one of
6

Chapter 1. Introduction
the two. For example, if the lowest detection rate of the two steps is 80%, then,
the overall detection rate cannot surpass 80%.
Viola and Jones [22] proposed a rapid object-detection framework using rect-
angle features and boosted cascade detector for the task of face detection. The
rectangle features are position-dependent and somewhat rigid. They are suitable
for capturing the differences in intensity among facial regions. The cascade de-
tector is a degenerated decision tree which acts as a rejection-based classifier. In
each stage of the cascade detector, the classifier is trained using AdaBoosting to
passes almost every positive sample while rejecting most of the negative ones.
The combination of stages yields a desirable ratio of a high detection rate to a low
false-positive rate. Both rectangle features and cascade detector can be evaluated
efficiently at every location and scale.
In our work, we focus on developing a robust embedded-text detection frame-
work to locate artificial text boxes embedded in images, especially web and email
images. Our goals are (1) efficiency, especially in detection speed; (2) favorable
ratio of high detection rate to low false-positive rate. We approach the embedded-
text detection problem from the angle of object detection. We define three sets of
Position-Independent Features (PIF) and propose using the boosted cascade de-
tector, similar to Viola and Jones’, as the text detection engine. The PIF features
can be evaluated efficiently. They are suitable for tackling the diverse and some-
7

Chapter 1. Introduction
what unpredictable shapes of text. Then, we propose a unified embedded-text
detection framework using the cascade detector and PIF features. The proposed
framework is capable of detecting horizontal text lines embedded within an image
at every location and scale.
1.3 Contributions
The main contributions of this thesis are summarized as follows:
• We define three sets of position-independent features (PIF) which can be
computed efficiently for the task of text detection. The three sets of PIF
features are local edge-pattern, local edge-density, and global edge-density.
These PIF features are able to capture diverse types and sizes of fonts as
well as to differentiate edges of characters from those of random objects.
• We propose using a cascade detector for the task of text detection. The
proposed cascade detector is trained using the position-independent features
and BrownBoosting mentioned above.
• We propose a novel unified-step embedded-text detection framework using
the above cascade detector. This embedded-text detector does not require
any pre-processing step and can do full image scans.
8

Chapter 1. Introduction
• We introduce the use of visual information for anti-spam filtering. By thor-
oughly analyzing a large collection of spam emails, we demonstrate that
useful features and parameters can be derived from images in spam emails
for the purpose of anti-spam filtering.
• Based on such visual features and parameters, we propose a novel visual-
based anti-spam filter. The proposed filter, used in conjunction with existing
text-based filters, can improve the filtering accuracy.
• We have successfully integrated the proposed anti-spam filter with Thun-
derbird and demonstrated very promising results.
1.4 Outline
The rest of this thesis is organized as follows: In chapter 2, we present the
details of the proposed embedded-text detector. In chapter 2.1, we introduce the
concept of the position-independent features as well as details of feature selection
and training. In chapter 2.2, we present the detection framework and explain how
to apply the cascade detector for the task of text detection. In chapter 2.3, we
show experimental results to evaluate the effectiveness of the position-independent
features and to demonstrate the robustness of the proposed embedded-text detec-
tor.
9

Chapter 1. Introduction
In chapter 3, we present the details of the visual-based anti-spam filter. In
chapter 3.1, we present the statistics of some visual parameters from a thorough
analysis of more than 120K spam emails downloaded from SpamArchive [30]. In
chapter 3.2, we present the proposed filtering system in detail. Then, in chap-
ter 3.3, we present experimental results to show the effectiveness of the proposed
anti-spam filter.
In chapter 4, we present the conclusions of this thesis.
10

Chapter 1. Introduction
Figure 1.1: Embedded-Text in Images Example
11

Chapter 2
Embedded-Text Detection
The heart of the proposed embedded-text detection system is the cascade
detector and Position-Independent Features (PIF). The cascade detector is de-
generated decision tree which consists of several stages organized in a sequential
manner. Each stage, in turn, is a boosted classifier that is trained to pass almost
every positive sample while rejecting as many negative ones as possible. The
PIF features are designed to differentiate the edges of text from those of random
objects. Both of the cascade detector and the PIF features can be evaluated ef-
ficiently. Therefore, they can be applied on part or even the entire image under
consideration.
In this chapter, we present the architecture of the proposed embedded-text de-
tection system. In chapter 2.1, we discuss the details of the PIF features, feature
12

Chapter 2. Embedded-Text Detection
selection, and cascade detector training. We elaborate the rationales behind the
design of the PIF features and the training strategy. In chapter 2.2, we demon-
strate how to applied the text detector engine (trained cascade detector and PIF
features) in the traditional two-step framework and the proposed unified one-step
framework.
2.1 Cascade Detector
Viola and Jones [22] proposed a cascade framework that is capable of detect-
ing face rapidly while achieving a high detection accuracy. There are three key
contributions in their approach. The first one is the introduction of a new image
structure called the Integral Image, which allows the features to be computed ef-
ficiently. The second one is the use of AdaBoosting learning algorithm to select
and combine a small number of critical features to become efficient and yet strong
classifiers. The third contribution is a smart framework for organizing classifiers
in a cascade manner, which allows background regions to be quickly discarded
while spending more computation on promising face-like regions. Our purpose is
to extend the similar idea to a new task, detecting embedded-text within images.
13

Chapter 2. Embedded-Text Detection
2.1.1 Position-Independent Feature - Motivation
Viola and Jones defined a set of rectangle features, which can be calculated
by computing the differences of raw pixel sums among regions within the rect-
angle under consideration. More than 40K rectangle features can be extracted
from a 24x24 training sample, and they can be calculated quickly in less than
100 machine instructions per feature value using a data structure called integral
image. Although rectangle features are proven to be effective and efficient for the
specific purpose of face detection, no work has been done so far for general object
detection using this type of feature. The main reason is that the rectangle fea-
tures carry position information (position-dependent), and thus the target object
has to strictly follow a well-defined rigid structure. For example, the first feature
selected by AdaBoosting algorithm, as shown in Figure 2.1, measures the differ-
ences in intensity between the eyes and the upper cheeks. The feature capitalizes
on the observation that the eye region is often darker than the cheeks. However,
in the task of text detection, due to the different fonts, sizes, and shapes of text,
position-dependent features cannot capture the unified information towards a set
of samples.
Edge information is a dominant feature used by many researchers for embedded-
text detection in images. Figure 2.2 shows the Canny edge detection result of a
14

Chapter 2. Embedded-Text Detection
Figure 2.1: Top two features selected by AdaBoosting in Viola’s work
sample image. By comparing the edges from the text and the background, we
conclude several key observations as follows:
• Text edges always follow a few fixed patterns, such as vertical and horizon-
tal lines, half-circles, and ’T-like’ conjunctions, while background edges are
totally unpredictable.
• Text edges should be smooth and continuous, and thus edge points of an
individual character should be connected to each other. Therefore, if we
define a small sub-window around a text edge point, the number of edge
points within the sub-window should fall within a certain range. Neverthe-
15

Chapter 2. Embedded-Text Detection
Figure 2.2: Canny edge detection result of a sample image
less, the number of edge points within a sub-window around a background
edge point is completely random.
• For a sub-window containing a full character, the edge points often equally
spread over the entire sub-window. However, for a sub-window containing
a background object, the edge points often cluster into small regions.
16
Chapter 2. Embedded-Text Detection
2.1.2 Position-Independent Feature - Definition
In this section, we introduce three different types of edge-based features corre-
sponding to the three key observations mentioned above. In addition, the proposed
features satisfy the following rules:
• Features must be able to differentiate edges of text from those of background
objects.
• Features do not include any position information, i.e. position-independent.
• Features can be computed efficiently.
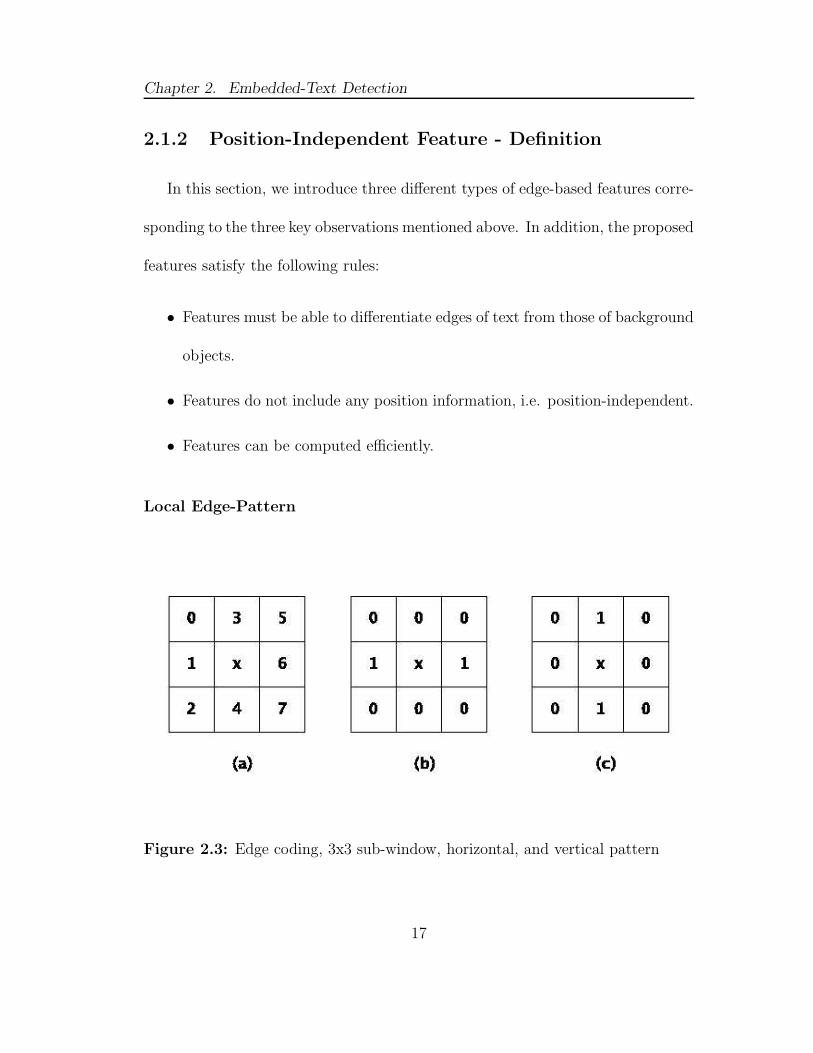
Local Edge-Pattern
Figure 2.3: Edge coding, 3x3 sub-window, horizontal, and vertical pattern
17

Chapter 2. Embedded-Text Detection
To compute local-edge pattern, first, we apply the Canny edge detector on the
image under consideration, then we binarize the detection result by using ’0’ to
represent non-edge points and ’1’ to represent edge points. For each edge point,
if we define a 3x3 sub-window as shown in Figure 2.3a, we can use 8-bit binary
strings to represent different edge patterns. Figure 2.3b and Figure 2.3c show
the horizontal and vertical patterns. They represent a horizontal and a vertical
line respectively. Each binary number can be mapped to a decimal number. For
example, the binary and decimal numbers for Figure 2.3b and Figure 2.3c are
01000010 (66) and 00011000 (24) respectively. By using the binary coding scheme
and the 3x3 sub-window, we can extract and compute edge patterns efficiently.
The total number of edge patterns defined by a 3x3 sub-window is 256. These edge
patterns can be used to represent horizontal, vertical, diagonal, curvy, and even
conjunctional patterns. In algorithm 1, we show the local edge-pattern extraction
work flow.
Theoretically, we can compute 256 integral images, one for each edge pattern.
In real implementation, however, we do not need to compute all of them. Instead,
we only need to compute the features that are actually selected during the cascade
training. It should be noted that multiple integral images can be generated after
a single scan. The additional cost is mainly for memory, not for computation.
Moreover, we use a histogram manner to represent features of a rectangle to be
18

Chapter 2. Embedded-Text Detection
Algorithm 1 Local Edge-Pattern ExtractionINPUT: Image
OUTPUT: Local Edge-Pattern Features
step1: Produce an edge map by using Canny edge detector
step2: Obtain a pattern map by evaluating each edge point
step3: Compute integral images based on the pattern map
step4: Extract and Evaluate histogram features
evaluated. This design implicitly eliminates the position information. In other
words, we only consider the frequency of an interested pattern in a sub-window,
not the position of that pattern. Therefore, we refer to our feature as Position-
Independent Features (PIF) in contrast to Viola and Jones’ rectangle features.
Local Edge-Density
Based on the second observation in section 2.1.1, we concluded that the local
edge-density around each edge point will be useful for discriminating edges of text
from those of background objects. Therefore, we propose the local edge-density
feature set to capitalize on this information. We define a number of small sub-
windows around each edge point, and count the number of edge points within
the sub-windows. Empirically, we adopt different size sub-windows from 3x3 to
7x7. Using the similar algorithm mentioned above, we can calculate the integral
19

Chapter 2. Embedded-Text Detection
images based on local edge-density maps with respect to each pre-defined window.
In order to eliminate position information, we adopt a normalized histogram rep-
resentation as well.
Global Edge-Density
Besides local edge-density, we have also observed that the edges of text in
the rectangle under consideration often form a well-proportioned distribution.
Therefore, we propose the global edge-density feature set to capitalize on this
finding. For a NxN rectangle, we use a N2xN
2sub-window to do a sliding scan.
Each sub-window steps N4
pixels in x and/or y directions from the previous one.
As a result, totally nine sub-windows can be scanned. Based on the integral image
calculated from the edge map, we can extract nine numbers from the nine sub-
windows. These nine numbers exhibit an intuitive cue for the global distribution
of the edge points. However, a potential problem is that they are not position-
independent since each sub-window contains position information with respect to
the rectangle. Therefore, in order to remove the position information, we sort these
nine numbers to make them position-independent. Moreover, we can produce
more features based on the nine basic numbers, such as addition or subtraction
between any pair of them. Because this feature set requires additional cost of
20

Chapter 2. Embedded-Text Detection
sorting, the computation is significantly increased. In chapter 2.1.3, we introduce
a hierarchical training algorithm to minimize the computation cost.
2.1.3 Cascade Detector Training
The cascade detector is a degenerated decision tree in which several simple
classifiers (stages) are organized in a sequential manner. During the testing phase,
the stages are applied subsequently to a region of interest until at some stage the
candidate is rejected or all the stages are passed. In general, such a hierarchical
structure, i.e. cascade, can be learned by using Boosting algorithm which is a
method of combining several weak learners into a strong learner.
In Viola and Jones’ framework, a variant of AdaBoosting, discrete AdaBoost-
ing, was adopted to train the cascade detector for the task of face detection. How-
ever, for the specific purpose of embedded-text detection, we not only adopted a
different boosting algorithm, BrownBoosting[8], but also a different training strat-
egy, hierarchical training. The reasons are explained in detail as follows:
• BrownBoosting: Different boosting algorithms use different strategies to
re-weight the training samples. In discrete AdaBoosting, the weight of a
sample is adjusted based on its classification result. If a sample is correctly
classified, then the weight of this sample will be reduced for the next round
training. On the other hand, if a sample is misclassified, the weight of the
21

Chapter 2. Embedded-Text Detection
sample will remain the same. While the success of AdaBoosting is indis-
putable, however, there is a rising awareness that the algorithm is quite
susceptible to noise. Dietterich has given a detailed explanation of this be-
havior in [9]. He shows that, in general, boosting tends to assign much
higher weights to noisy samples than those to legitimate ones. As a re-
sult, the hypotheses generated in the later iterations often over-fit the noisy
samples. In our embedded-text detection, this weakness will significantly
degrade the performance of the resulting classifier. In Figure 2.4, we show
the edge maps of two letters, T and H, as well as three examples from noisy
objects. We observed an interesting phenomenon. If we only consider the
features proposed in section 2.1.2, i.e. local edge-pattern, local edge-density,
and global edge-density, it is very difficult to differentiate the edges of text
from those of noisy background objects. Due to (1) some negative samples
are very similar to positive ones (as shown in Figure 2.4); (2) Millions of
negative samples are required during the cascade training, a careful and
thorough check for every sample is quite impossible, if we follow the original
AdaBoosting algorithm, the final classifier will be inevitably less desirable.
Therefore, we borrow a key idea from BrownBoosting[8], another variant of
AdaBoosting. We use a non-monotone function to re-weight the misclassi-
fied samples: for small values of margin, the weight increases in a way very
22

Chapter 2. Embedded-Text Detection
similar to AdaBoosting; however, for some point onwards, the weight de-
creases to restrain the impact caused by the noisy examples (e.g. confusing
background objects).
• Hierarchical Training: We noticed that the computation cost for the
proposed three sets of PIF features differs from each other. The cost of the
local edge-pattern feature set is as cheap as the rectangle features proposed
in Viola and Jones’ work, while the local and global edge-density feature
sets require more time to compute. During the testing phase, the number
of testing samples reduces as they pass through the cascade. Therefore, it
is important to keep the early stages as fast as possible. To avoid using
the expensive sets of features at early stages of the cascade, we adopted a
hierarchical training strategy. The training procedure is as follows: (1) for
the first eleven stages, we only used the local edge-pattern feature set; (2)
from the 12th to 14th stages, we added the second feature set, which is the
local edge-density set; (3) from the 14th stages on, we applied all three sets
of features until the training process converged and the final stop criteria
was reached. Our experimental results showed that the hierarchical train-
ing scheme significantly boosted the detection performance without much
compromise on the total computation cost. In other words, the hierarchical
training scheme helps the boosting algorithm to find the best combination
23

Chapter 2. Embedded-Text Detection
of the PIF feature sets by balancing the detection performance and compu-
tation cost.
Figure 2.4: Edge map of text and confusing background objects
2.1.4 Experiments and Discussions
For the cascade detector training, we used 5,000 positive samples and 5,000
negative samples in each stage. The positive samples were manually labeled and
selected from a pool of web images. Each positive sample contained a single
English letter. The negative samples were dynamically generated from a selected
set of Corel images [4]. Table 2.1 shows the details of the 18-stage cascade detector
and its stage classifiers. The target criteria for each stage was 0.97 detection rate
and 0.60 false-positive rate. In other words, each stage classifier must pass at least
97% of the positive samples while rejecting more than 40% of the negative ones.
To save computation cost, the local edge-density and global edge-density fea-
ture sets were only used in later stages. As shown in Table 2.2, once the new
feature sets were added, the number of features selected in that stage were greatly
24

Chapter 2. Embedded-Text Detection
Table 2.1: 18-stage cascade detector using BrownBoosting
Stage Features Detection Rate False Positive
Features: Local Edge-Pattern1 4 0.991163 0.4788112 5 0.978423 0.2741703 9 0.965846 0.1515944 11 0.953431 0.0865915 12 0.941941 0.0536696 14 0.929834 0.0316477 24 0.917882 0.0186118 29 0.906083 0.0110729 25 0.895164 0.00682710 35 0.883658 0.00422211 98 0.872299 0.002596
Features: Local Edge-Pattern, Local Edge-Density12 29 0.861087 0.00160913 98 0.850019 0.000988
Features: Local Edge-Pattern, Local Edge-Density, Global Edge-Density14 10 0.839263 0.00058415 30 0.828475 0.00036116 52 0.817826 0.00022317 103 0.807314 0.00013718 152 0.796936 0.000084
reduced. This behavior indicated that the classification accuracy and efficiency
can be further improved by combining the three PIF feature sets.
In Figure 2.5, we show the top three features selected in the first round of
the boosting. The depicted features are considered as the most discriminative
ones. An intuitive explanation for these three patterns are as follows: Figure 2.5a
represents a horizontal line, Figure 2.5b represents a vertical line, and Figure 2.5c
25

Chapter 2. Embedded-Text Detection
Table 2.2: Feature sets comparison
Stage Features Detection Rate False Positive
w/ Local Edge-Density 12 29 0.861087 0.001609w/o Local Edge-Density 12 216 0.861087 0.001605w/ Global Edge-Density 14 10 0.839263 0.000584
w/o Global Edge-Density 14 105 0.839092 0.000601
corresponds to a half circle. These patterns appear frequently as parts of the text
edges.
Figure 2.5: Top three features selected by BrownBoosting
Figure 2.6 shows several negative samples which were misclassified when the
local edge-pattern feature set was used alone. These samples were correctly clas-
sified after adding the local and global edge-density feature sets. This example
26

Chapter 2. Embedded-Text Detection
Figure 2.6: Tough case of negative training samples
clearly demonstrates the effectiveness of the edge-density feature sets and proves
the rationales behind the design.
As shown in Table 2.1, the final detection rate is around 80%. It is relatively
low compared to that of the face-detection applications. (the common detection
rate for the face-detection is around 90%). However, faces appear in images as
independent objects while text objects appear as regions. This implies that if there
is a text object detected at some location, then, there should be text objects of
similar size at nearby positions. The additional spatial and geometric regularities
can be used not only to enhance the overall detection accuracy but also to reduce
the overall false positive rate. In the following sub-section, we present the details
of our embedded-text framework.
2.2 Detection Framework
Here we describe two detection frameworks, the proposed unified one-step
framework, and traditional two-step framework. In the one-step framework, the
27

Chapter 2. Embedded-Text Detection
cascade detector acts as a full image scanner while in the two-step framework, the
cascade detector acts as the text region classifier. In the following subsections, we
present both frameworks in detail.
2.2.1 One-Step Framework
In the one-step framework, the cascade detector is applied on the entire image
at every location and at various scales. For the task of text detection, we use a
sliding window to scan through the entire image. The scanning starts with an
initial window size. After each full image scan, the sliding window is enlarged by
10% until it is larger than the stopping window size or the image size. In our
experiments, we found that initial window size of 12x10 and the stopping window
size of 72x60 are sufficient to detect embedded-text in web images. Once a sub-
window is detected as text, its neighboring windows are examined and aggregated
to form the text region.
In addition to the cascade detector, there are three major components in the
proposed one-step framework. These components are locality filter, search algo-
rithm, and post processing. The locality filter centers the detection window on
the text object. The search algorithm helps cascade detector find the text line.
Then, the post processing cleans up the detection results and merge them into
regions. These components guides the cascade detector to right starting points
28
Administrator
locality �lter,
Administrator
search algorithm,
Administrator
post processing.

Chapter 2. Embedded-Text Detection
and optimizes the detection performance during the full image scan. They are
discussed in detail in the following sub-sections.
Figure 2.7: One-Step Framework Flow
During the scanning, the corresponding PIF features of the sub-window are
calculated using integral images and their values are sent to the cascade detector
to determine whether the sub-window contains text.
A. Locality Filter
Since the PIF features used in the cascade detector are completely position
independent, they are insensitive to the locality change of the text in a window.
An example is depicted in Figure 2.8. The cascade detector and PIF features
would not be able to tell the differences between the left and right samples with-
out additional helps. To avoid this phenomenon, we define three locality filters
29

Chapter 2. Embedded-Text Detection
to tackle the horizontal and vertical shifts of text objects in the detection sub-
windows. The three locality filters are central, vertical, and horizontal locality
filter. The locality filters serve for the following purposes: (1) To center the de-
tection sub-window on the edge-rich region by eliminating sub-windows which does
not contain enough edge points in the center region; (2) To reduce the number
of detected sub-windows around the same text object; (3) To reject sub-windows
which do not lie entirely on the text line by eliminating sub-windows with vertical
shifts; (4) To pinpoint the begin and start position of a text line by eliminating
sub-windows with left and right horizontal shifts.
Figure 2.8: Example of Locality Shifts
The locality filters act as the gate keeper and can be considered as the first
stage of the cascade detector. Although the locality filters are not trained by using
boosting algorithm, they are empirically verified to meet the same detection rate
criteria, i.e. to maintain a near 100% detection rate.
30

Chapter 2. Embedded-Text Detection
The evaluation of these filters are based on rectangle features which can be
calculated from the integral image of edge points in the original image. Figure 2.9
shows the rectangle features used in the three locality filters. These rectangle
features are similar to some of the extended features in [14].
The central locality-filter examines the number of edge points in the center
region of a sub-window. The area of the center region is set to 81% of the overall
area of the sub-window (9/10 in width and height). The sub-window is rejected
if the number of edge points is lower than the predefined threshold. In our imple-
mentation, we set the threshold to 60% of the total number of edge points in the
sub-window.
The vertical locality-filter divides the sub-window into top, middle, and bottom
regions, then examines the number of edge points in these regions. The height of
each region is set to 10% of the sub-window height. If the number of edge points
in any of the regions is zero, the, the sub-window is rejected. Figure 2.10 shows
the example of vertical locality filters on letter A.
The horizontal locality-filter divides the sub-window into left, and right re-
gions, then examines the number of edge points in them. The width of each
region is set to 10% of the sub-window width. If the number of edge points in one
of the region is zero while the other is not zero, then, the sub-window is rejected.
The reason is that some letters are very narrow in width, such as letter I, while
31

Chapter 2. Embedded-Text Detection
others are nearly square, such as letter A and D. If the detection sub-window
aligns with the letter, then, the letter should overlap with both regions (square
letters), or should not overlap with any of the regions (narrow letters). Figure 2.11,
figure 2.12, and figure 2.13 show the examples of horizontal locality-filter on letter
A, I, and L respectively.
Figure 2.9: Locality-Filter Rectangle Features
Figure 2.10: Vertical Locality-Filter Example of Letter A
32

Chapter 2. Embedded-Text Detection
Figure 2.11: Horizontal Locality-Filter Example of Letter A
Figure 2.12: Horizontal Locality-Filter Example of Letter I
B. Search Algorithm
In face detection, since faces have no correlation between each other, a random
and exhaustive scan of the entire image is necessary in order to detect all the
independent faces in the image. Text objects, on the other hand, appear in an
image as horizontal regions and have strong spatial and geometrical correlation
among each other along the same line. If a text object is detected at a particular
location, then, its neighboring sub-windows are likely to be text objects of the
same height as well. This spatial and geometrical coherence can be used to (1)
33

Chapter 2. Embedded-Text Detection
Figure 2.13: Horizontal Locality-Filter Example of Letter L
verify whether a detected sub-window is indeed text, hence reduce false positive;
(2) effectively detect text objects along the same line.
In this paper, we propose an efficient search algorithm which captures the
spatial and geometrical coherence among text objects on the same text line. The
search algorithm works as follows:
• For each sub-window size, WxH, we divide the image into 20 bands horizon-
tally. The width of each band is equal to the width of the sub-window W.
Depends on the sub-window width, W, each band may or may not overlap
with its neighbors.
• For each band, we do a vertical sliding scan. Each vertical scan steps 2
pixels from the previous one all the way toward the bottom of the image
until it reaches the end.
34

Chapter 2. Embedded-Text Detection
• During the vertical sliding scan, if a sub-window is detected as text at band
I, its neighboring ten sub-windows to the left and to the right from the
detected location are scanned. Each sub-window steps by half of the sub-
window width to the left or to the right. If there are less than half of
the neighboring sub-windows contain text, then the original sub-window is
regarded as false positive and discarded. This step is considered as the text
verification step.
• If the sub-window is verified as text sub-window, we do a horizontal sliding
scan starting from band I to band I-1 and from band I to band I+1. Each
sub-window steps by half of the sub-window width to the left or to the
right. The sub-windows detected consecutively are merged into a single text
rectangle. This step is considered as the horizontal sliding step.
• The vertical sliding scan and horizontal sliding scan are repeatedly applied
on the image until the entire image has been visited.
Figure 2.14 shows the diagram of the search algorithm. The search algorithm
makes use of the spatial and geometrical coherence between text objects along the
same line.
Figure 2.16 shows the raw detection results of images in figure 1.1 after the
vertical and horizontal sliding scan.
35

Chapter 2. Embedded-Text Detection
Figure 2.14: Diagram of the search algorithm
C. Post-Processing
Due to the exhaustive scan over the entire image, there are usually multiple
text rectangles along the same text line. These rectangles could be neighboring,
overlapping, or duplicate. Two rectangles are overlapping if their bounding boxes
overlap. Two rectangles are neighboring if they do not overlap but the distance
between each other is within a threshold. (In our application, we set the threshold
to 10% of the width of the shorter rectangle). A rectangle is duplicate if the major
part of it is covered by another one. (In our application, we set the threshold to
80%).
In the post-processing step, actions are carried out as follows: (1) Overlapping
text rectangles along the same line are merged into one single rectangle; (2) Du-
36

Chapter 2. Embedded-Text Detection
plicate rectangles are removed; (3) Single rectangles that are narrow or short are
removed.
As in [22], detected rectangles are partitioned into subsets based on their
height and centroid location on the Y-axis. For two rectangles in the same subset,
if their bounding boxes overlap, they are merged by enlarging one of the rectangle
to include the other. This process is repeated until there are no more overlapping
text rectangles. After the merging process, each partition usually yields a single
text line, sometimes a few.
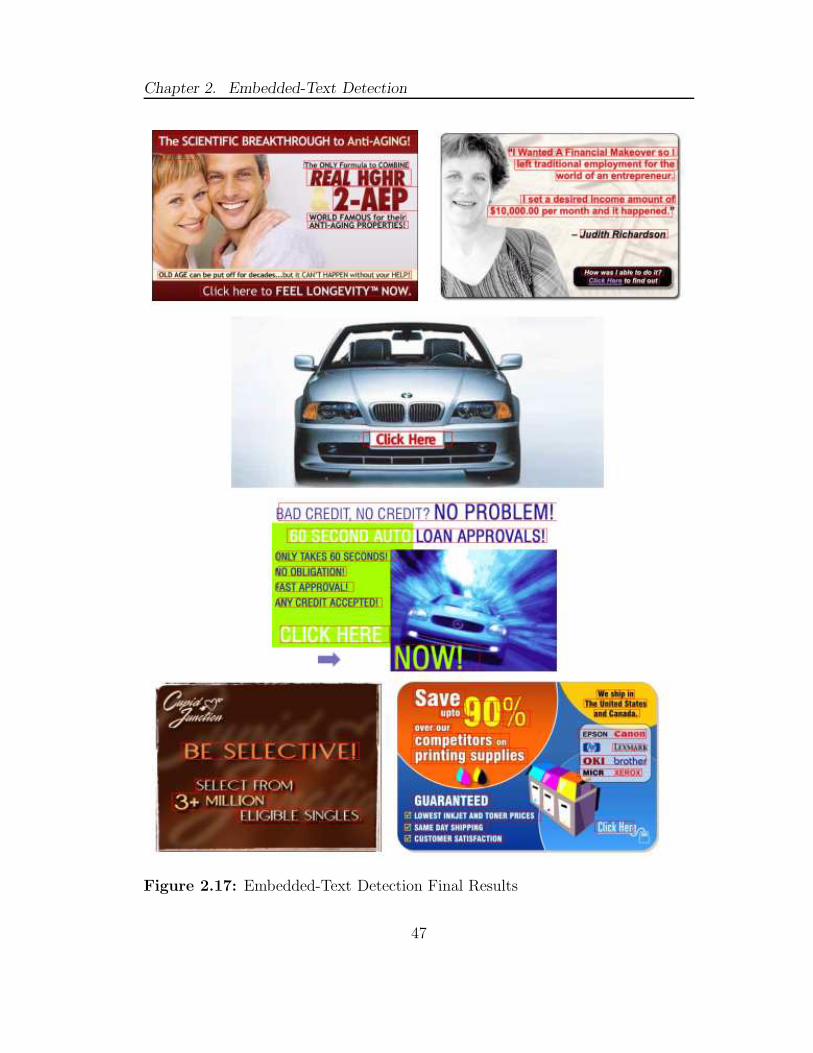
Figure 2.16 shows the examples of raw detection results. Figure 2.17 shows
the final detection results after post-processing.
2.2.2 Two-Step Framework
The cascade detector can also be applied in the two-step framework. In this
case, the cascade detector works as a text-region classifier. There are two ad-
vantages of using cascade detector for classification. First, cascade detector is
relatively fast. Second, the cascade detector can achieve very detection rate to
false positive rate ratio.
To classify a text region, we use a sliding window to scan the entire region.
The height of the sub-window is set to the height of the text region and the width
of the sub-window is set to 1.2 times of the height. Each subsequent sub-window
37

Chapter 2. Embedded-Text Detection
steps 2 pixel from the previous one. The final decision for the text region is
determined by the majority vote of each individual sub-window.
Figure 2.15: Two-Step Framework Flow
2.3 Experiments
We have designed and conducted experiments to answer the following ques-
tions:
• The effectiveness of the locality-filters.
• The comparison between the cascade detector and other learning-based clas-
sifiers, particularly Support Vector Machines (SVM).
• The performance comparison between the proposed top-down framework
and traditional bottom-up approaches.
• The computation cost comparison between the proposed top-down frame-
work and traditional bottom-up approaches.
38

Chapter 2. Embedded-Text Detection
2.3.1 Metrics
To evaluate the performance of the proposed embedded-text detector, we de-
fined two types of metrics, pixel-based and region-based.
Before we dive in the definiton of metrics, we define text regions as follows for
better explanation:
• detected region: a text region reported by the text detector.
• matched region: a detected text region which covers more than 90% and
less than 110% of the ground-truth region. In other words, a detection text
region matches a ground-truth region if they are relatively similar in position
and size.
• refined region: a matched region whose top and height are set to that
of the matching ground-truth region. The reason for doing this is because
sometimes there’s a small shift between the detected region and ground-
truth. The refined region is to overcome this phenomenon and to better
reflect the detection results.
The pixel-based metric is measured as the ratio of number of correctly detected
pixels to the total number of ground-truth pixels. The DRpixel (Detection Rate)
and FPpixel (False Positive) are defined as follows:
39

Chapter 2. Embedded-Text Detection
DRpixel =area of refined regions
area of ground − truth regions(2.1)
For the pixel-based metric, the false positive comes from the following two
parts: (1) If a detected region is larger than the ground-truth region it matches,
then region is considered matched, however, the exceeding part is counted as false
positive. (2) If a detected text region does not match any of the ground-truth
regions, the entire region is counted as false positive.
FPpixel =area of mismatched regions
area of the image(2.2)
The region-based metric is measured as the ratio of number of correctly de-
tected regions to the total number of ground-truth regions. The false positive
is defined as the ratio of the number of mismatcched regions to the number of
detected regions. The DRregion (Detection Rate) and FPregion (False Positive) are
defined as follows:
DRregion =# of matched regions
# of ground − truth regions(2.3)
FPregion =# of mismatched regions
# of detected regions(2.4)
40

Chapter 2. Embedded-Text Detection
2.3.2 Experimental Results
Locality-Filter Verification
In this experiment, we verify the performance of locality-filters. To conduct
this experiment, we prepared three sets of data, the positive set, vertical shift set,
and horizontal shift set. They are summarized as follows:
• Positive set: 1,000 positive samples randomly selected from the cascade
detector training samples.
• Vertical shift set: 5,000 samples manually generated using positive set. Each
sample in the positive set was used to generate five samples by randomly
shifting from zero to half of the height of the sample vertically.
• Horizontal shift set: 5,000 samples manually generated using positive set.
Each sample in the positive set was used to generate five samples by ran-
domly shifting from zero to half of the width of the sample horizontally.
Table 2.3: Locality-Filter Verification
Filter Positive Set Vertical Shift Set Horizontal Shift Set
Central Filter 100.00 91.88 95.96Vertical Filter 99.30 16.08 99.30
Horizontal Filter 99.60 99.90 56.02Overall 98.90 7.00 48.70
41

Chapter 2. Embedded-Text Detection
Table 2.3 shows the experimental results. As we can see, the proposed locality-
filters can maintain a near 99% detection rate while reducing over 50% of the
sub-windows with vertical or horizontal shift. Also, the vertical locality-filter is
very powerful in rejecting sub-windows with vertical shift. This filter can help the
cascade detector find the text line more precisely.
Framework Experiments
In this experiment, we compared the performance among different frameworks,
Image Analysis based [6, 12, 13, 15, 23], image analysis + machine learning based
[2, 25, 38], image analysis + cascade detector, and the proposed framework.
To conduct this experiment, we extracted 2,000 images from a pool of SPAM
emails for training and testing. We manually labeled each image and identified
4,461 text regions. We reserved 3,000 text regions (1,435 images) for training
Support Vector Machines (SVM) classifiers. The rest of the images were used for
testing. The datasets were summarized as follows:
• Testing dataset: 565 email images. Totally 1,461 regions were labeled.
• SVM Training positive dataset: 1,435 email images. Totally 3,000 regions
were labeled.
• SVM Training negative dataset: 3,000 regions were randomly cropped from
a pool of Corel images.
42

Chapter 2. Embedded-Text Detection
We implemented two commonly used features to train the SVM classifiers.
The first one was the distance map [2] and the second one was star-like pixel
pattern [38]. The distance map is generated by transforming every pixel from its
raw value to its distance to the closest edge point. The star-like pixel pattern is
extracted directly from the gray level using a star pattern. The SVM program we
used for this experiment was SVMTorch[3]. The two implementation were referred
as SVM1 and SVM2 respectively in Table 2.4 and Table 2.5.
Table 2.4: Performance Comparison
Framework Pixel-based Region-based
Proposed 93.60/1.13 86.43/3.70Image Analysis 90.68/3.54 86.31/14.50
Image Analysis + SVM1 87.11/3.40 82.71/15.13Image Analysis + SVM2 86.82/3.39 82.91/15.89
Image Analysis + Cascade 87.76/2.05 83.62/9.89
Table 2.4 shows the comparison results. There are three observations. (1)
Clearly, the proposed embedded-text detection framework outperforms the rest.
(2) For other frameworks that bases on image analysis step, the detection rate is
bounded by the image analysis step. (3) Cascade detector based framework yields
relatively lower false positive than others.
43

Chapter 2. Embedded-Text Detection
2.3.3 Computation Cost
In this experiment, we compared the computation cost among different frame-
works. The experiment was carried out on Pentium-4, 2.8GHz Linux machine
with 1GB memory. Table 2.5 shows the experimental results. As indicated in the
table, the proposed embedded-text detection system only took 0.32 seconds per
image, while SVM based systems required 0.54 and 1.98 seconds respectively.
Table 2.5: Computation Cost Comparison
Framework Step1 Step2 Overall
Proposed na na 0.32sImage Analysis 0.11s na 0.11s
Image Analysis + SVM1 0.11s 1.87s 1.98sImage Analysis + SVM2 0.11s 0.43s 0.54s
Image Analysis + Cascade 0.11s 0.26s 0.37s
If comparing SVMs and Cascade alone, it is obvious that the cascade approach
is much more efficient than SVM-based ones. The star-like pixel pattern in SVM2
is based on raw pixels, therefore, it is close to the performance of cascade, however,
cascade still outperforms because cascade generally requires less computation than
SVM.
44

Chapter 2. Embedded-Text Detection
2.3.4 Memory Consumption
The memory consumption of the embedded-text detector is higher than that
of the face detector. In the face detection problem, rectangle features can be
calculated from a single integral image. In the proposed text detector, multiple
integral images have to be built.
To reduce the memory consumption, the image can be divided into sub-regions
horizontally or vertically. For example, if the image is divided into four regions,
the memory consumption can be reduced to 1/4 of the original without much
computation overhead.
45

Chapter 2. Embedded-Text Detection
Figure 2.16: Embedded-Text Detection Raw Results
46
Chapter 2. Embedded-Text Detection
Figure 2.17: Embedded-Text Detection Final Results
47

Chapter 3
Visual-Based Anti-Spam Filtering
With the increasing importance of email and the incursions of Internet mar-
keters, unsolicited commercial email (also known as spam) has become a major
problem on the Internet.
Junk email has been recognized as a problem since 1975 [27]. It was not a se-
rious concern until marketers began to flood the system, overtaxing the resources
of Internet Service Providers (ISPs). Since the late ’90s, several anti-spam filter-
ing solutions have been proposed. In general, these approaches treat the email
spam filtering problem as a text classification or categorization problem, employ-
ing various machine learning techniques to solve the problem. In [31], the authors
proposed using a Naive Bayesian classifier to filter junk emails. Some researchers
have also suggested using Support Vector Machines (SVM) [33] and decision trees
48

Chapter 3. Visual-Based Anti-Spam Filtering
[34] for this task. These text-based approaches have achieved a remarkable accu-
racy in filtering spam e-mails.
However, there are two major limitations to these text-based approaches.
First, spammers often use various tricks to confuse text-based anti-spam filters
[28]. Examples of these tricks are text obfuscation, random space or word in-
sertion, HTML layout, and text embedded in images. Second, as the scale and
capacity of the Internet continues to grow, the type of information in emails has
become more diverse. The genre of email content has moved from text-only to
multimedia-enriched. These limitations greatly reduce the effectiveness of existing
text-based anti-spam filters.
The key issue behind these challenges is that the type of content in emails
has switched from text-based to visual-based. On one hand, legitimate message
senders start to add more multimedia content, particularly images, to text-only
emails to enrich the message. On the other hand, spammers mask spam emails
with unreadable content, such as images, and employ HTML-based tricks to con-
found text-based anti-spam filters. The raw content of these spam emails may
not make any sense, but the key messages can be rendered visible when recipients
open them.
Since visual information is becoming more prevalent in emails, it becomes
increasingly necessary to use such information to achieve high accuracy for anti-
49

Chapter 3. Visual-Based Anti-Spam Filtering
spam filtering. Our research team has investigated ways of using visual infor-
mation, particularly images, in anti-spam filtering. We studied the spam emails
to analyze the characteristics of the visual information in spam. One noticeable
characteristic is the types of images used in spam emails. These images are usu-
ally artificially generated and contain embedded text (i.e. text boxes embedded
into image files). In this work, we propose a novel anti-spam filter, which clas-
sifies multimedia-enriched emails based on their visual information. Specifically,
the proposed anti-spam filter extracts image features and uses an one-class SVM
classifier to decide whether an unseen email is in the spam category. Experimental
results show that, for emails containing image data, the proposed anti-spam filter
can achieve a detection rate of 80% or more with less than 1% false positives. In
addition, the proposed anti-spam filter can work with existing text-based filters.
In comparison with the Bayesian text-based filter used in Thunderbird (a mail
client of Mozilla [29]), our proposed filter can improve the spam detection rate
from 47.7% to 83.9% for the validation set derived from the SpamArchive dataset
[30].
The main contributions of this paper are summarized as follows:
• We introduce the use of visual information for anti-spam filtering. By thor-
oughly analyzing a large collection of spam emails, we demonstrate that
50

Chapter 3. Visual-Based Anti-Spam Filtering
useful features and parameters can be derived from images in spam emails
for the purpose of anti-spam filtering.
• Based on such visual features and parameters, we propose a novel visual-
based anti-spam filter. The proposed filter, used in conjunction with existing
text-based filters, can improve the filtering accuracy.
• We have successfully integrated the proposed anti-spam filter with Thun-
derbird and demonstrated very promising results.
The rest of this chapter is organized as follows: In Section 3.1, we present the
statistics of some visual parameters from a thorough analysis of more than 120K
spam emails randomly downloaded from SpamArchive [30]. In Section 3.2, we
present the proposed filtering system in detail. Then, in Section 3.3, we present
experimental results to show the effectiveness of the proposed anti-spam filter.
3.1 The Spam Datasets and Analysis
We prepared the following datasets for analysis and experiments:
• SpamArchive dataset: 122,877 spam emails.
• Ling-Spam dataset: 2,412 legitimate emails from Linguist mailing list and
481 spam emails [32].
51

Chapter 3. Visual-Based Anti-Spam Filtering
The SpamArchive dataset was randomly downloaded from the SpamArchive
website. The total number of downloaded and processed spam messages is 122,877.
The Ling-Spam dataset is a public anti-spam filtering corpus [32]. For this work,
we used the Ling-Spam dataset to train the Bayesian anti-spam filter in Thun-
derbird. Using these two datasets and the trained Bayesian anti-spam filter, we
intended to show experimentally the limitations of text-based anti-spam filters,
and also to demonstrate the additional power they can gain with our visual-based
anti-spam filter.
In the SpamArchive dataset, 37.76% (46,395/122,877), of the emails contain
images. Among those emails containing images, only 43.72% (20,283/46,395)
contain accessible images. Many emails did not have images explicitly attached
but they provided links to the images. A fraction of these links were no longer
accessible at the time we processed them. We further analyzed these 20,283 spam
emails. The statistics are shown in Table 3.1.
Table 3.1: Statistics of emails containing accessible images
Type no. of Emails Percentage
w/ image with embedded-text 16,849 83.07%w/ banner or graphics 19,868 97.95%
w/ external image 19,813 97.68%blocked by Bayesian filter 9,420 46.44%
52

Chapter 3. Visual-Based Anti-Spam Filtering
Figure 3.1: Spam email with embedded-text in image example
The results shown in Table 3.1 clearly indicate that if a spam email contains
images, the images are likely to be artificially generated and external (i.e. not
explicitly attached to the email). These images may be banners/graphics or text
boxes embedded within the images. Figure 3.1 shows an example of a spam
email which only contains embedded-text message and no traditional text. The
message embedded in the spam email is clearly visible when being rendered by
email clients even though it contains no text at all. Figure 3.2 shows an example of
a computer generated image with embedded-text regions. In the following section,
we introduce the ideas behind our visual-based anti-spam filter.
53

Chapter 3. Visual-Based Anti-Spam Filtering
3.2 The Anti-Spam Filter
For each email, we extract a set of features from the images contained in
the email. The set of features is then used for classification, where the one-class
Support Vector Machines (SVM) is used as the base classifier. In the following
subsections, we discuss the two major components, the features and the classifier,
respectively.
3.2.1 Feature Description
Based on the observations summarized in Section 3.1, we define three sets of
features as follows:
• Embedded-text features
• Banner and graphic features
• Image location features
More and more frequently, spam emails are embedding text messages in images
to get around text-based anti-spam filters. To detect such devious techniques, it
would be helpful to know (1) whether there is embedded text in the images, (2) if
so, the area of text regions vs. the total image area. To derive such information,
we have developed a text-in-image detector which is capable of detecting the text
region(s) in an image. The details of the detector will be described later. We use
54

Chapter 3. Visual-Based Anti-Spam Filtering
this text-in-image detector to scan through each image in the email and derive the
following embedded-text features: (1) the total number of text regions detected in
all images in the email, (2) the percentage of images with detected embedded-text
regions, and (3) the pixel count ratio of the detected text regions to that of the
overall image area. Figure 3.3 shows an example of an image with identified text
regions.
Many of the images in spam emails are banners and computer-generated graph-
ics which are part of advertisements. We have developed a banner detector and
a graphics detector. Banner images are usually very narrow in width or height.
Also, banner images usually have a large aspect ratio vertically or horizontally.
Graphic images, on the other hand, usually contain homogeneous background and
very little texture.
Using these detectors, we can extract the following banner and graphic fea-
tures: (1) the ratio of the number of banner images to the total number of images,
and (2) the ratio of the number of graphic images to the total.
Spammers usually put the images behind web servers and create references in
the emails to save server and network resources. This is in contrast to personal
emails, where images are usually attached with the emails. We define the image
location feature to be the ratio of the number of external images to the total
number of images in the email.
55

Chapter 3. Visual-Based Anti-Spam Filtering
3.2.2 Feature Extraction
Banner and Graphic Feature Extraction
Since banner images carry certain geometric characteristics, they can be de-
tected by using a very simple rule-based detector. In extracting banner features,
we first use the rule-based detector to check the size and aspect ratio of images;
then, we calculate the corresponding features according to the detected number
of banner images.
Because computer-generated graphics usually contain homogeneous color pat-
terns, they contain almost no texture in fine resolution. To extract graphics
features, we first apply wavelet transformation on the input images. Then, we ex-
tract texture features in three orientations (vertical, horizontal, and diagonal) at
fine resolution. If any of these extracted texture features falls below a predefined
threshold, the image is likely to be a computer-generated graphic. We calculate
the graphic features based on the detected number of graphic images.
Embedded-Text Feature Extraction
Several text-detection and text-recognition methods have been proposed in
the past. Previous text-detection methods often followed a multi-step framework
using a combination of image analysis and machine learning techniques. While
a multi-step framework greatly simplifies the problem by dividing the problem
56

Chapter 3. Visual-Based Anti-Spam Filtering
into several sub-tasks, the overall detection accuracy is the product of every step
and is bounded by the lowest one. Since the web and email images are diverse,
previous text-detection methods could not work well if any of the steps yields low
detection rate.
We have developed an unified embedded-text detector particularly for web
and email images. Based on Viola and Jones’ object detection framework [22],
we define position-independent features to capture the essence of characters and
a smart scan algorithm to trace text lines using their spatial and geometrical
regularities. The embedded-text detector can be applied at every location and at
every size of the image. The heart of the embedded-text detector is the boosted
cascade detector. The cascade detector is a degenerated decision tree which acts
as a rejection-based classifier. In each stage of the cascade detector, a classifier is
training using BrownBoosting[8], which is a variant of AdaBoosting[7], to reject as
many negative samples as possible while keeping almost all the positive samples.
As a result, the cascade detector can yield a very high detection rate to false
positive rate ratio. Figure 3.2 shows an example of an email image with embedded-
text. Figure 3.3 shows the detection result by our embedded-text detector. We
calculate the embedded-text feature based on the detected text regions, such as
the number and area of regions.
57

Chapter 3. Visual-Based Anti-Spam Filtering
Figure 3.2: Text embedded in image example
3.2.3 The Classifier
In previous approaches, the anti-spam filtering problem has typically been
treated as a two-class or multiple-class classification problem. In the two-class
case, researchers were trying to determine whether an unseen email was spam,
whereas in the multiple-class case, the unseen emails were divided into several
categories (such as commercial, financial, objectionable, health, spiritual, etc.).
One difficulty with the two-class and multiple-class classification is the need for
multiple sets of training samples. For example, in the Naive Bayesian approach,
58

Chapter 3. Visual-Based Anti-Spam Filtering
Figure 3.3: Detected embedded-text regions
one set of spam emails and one set of legitimate emails are required to train
the classifier. While spam datasets are easily accessible, a representative set of
legitimate emails is difficult to collect. In our anti-spam filter, we define the anti-
spam filtering problem as a task of finding whether an unseen email is the spam
class. We propose using the one-class SVM [37] as the base classifier.
One-Class SVM
The basic model of SVM[36] is a maximal margin classifier. Given a positive
and a negative dataset, the SVM classifier maps the data from the input space to
59

Chapter 3. Visual-Based Anti-Spam Filtering
a higher dimensional space, called the feature space, and constructs a hyperplane
in the feature space which separates the data with a maximal margin. In [37],
the authors extend the SVM to support one-class classification. The basic idea
is to construct a probability-dense region which encompasses the training data in
the input space. In this case, the support vectors define a region, rather than a
hyperplane. For training a one-class SVM classifier, we need only positive training
examples (i.e. spam emails in this target application). There is no need to obtain
a representative set of legitimate emails for training. In training a one-class SVM
classifier, the user can adjust a parameter to allow a certain percentage of training
samples to be outside the defined region (called the outlier percentage). The
larger the outlier percentage, the smaller the defined region, and thus the lower
the detection rate as well as the false-positive rate in the testing phase.
To evaluate the effectiveness of the one-class classifier, we have also imple-
mented a classifier using the standard two-class SVM. Our study of the trade-offs
between using one-class and two-class classifiers will be presented in Section 3.3.
3.3 Experiments
We have designed and conducted experiments to answer the following ques-
tions:
60

Chapter 3. Visual-Based Anti-Spam Filtering
• The trade-offs between using the one-class and two-class classifiers for the
filtering task.
• The added value of the proposed visual-based anti-spam filter beyond exist-
ing text-based filter.
3.3.1 Datasets
In the experiments, the statistics of the datasets used for training and valida-
tion were as follows:
• 8,500 spam emails as the positive training set.
• 1,500 spam emails as the positive validation set.
• 428 legitimate emails as the negative validation set.
• 10,000 artificial emails as the negative training set.
The positive training and validation set were created from the SpamArchive
dataset introduced in section 3.1. From the spam emails which contain accessible
images, we randomly selected 10,000 of them as the positive set. We reserve 15%
of the positive set for validation and the rest for training.
We collected 428 legitimate emails which contained images as the negative
validation set. These emails were collected from several people. We also generated
10,000 artificial emails using a large collection of photo images from Corel CDs.
61

Chapter 3. Visual-Based Anti-Spam Filtering
Each email contained a random number (from 1 to 10) of images. Every image
was assumed to be local (i.e. explicitly attached in the email).
3.3.2 Experimental Results
In this experiment, we trained several one-class SVM classifiers using a dif-
ferent percentage of outliers for each classifier. We also trained a two-class SVM
classifier using 8,500 spam emails as our positive training set and 10,000 artificial
emails as our negative training set. The SVM package we used in this experiment
is LIBSVM [35]. Table 3.2 compares the performance of these classifiers. In the
case of one-class classification, it is clear that the tighter the positive region (i.e.
the larger the outlier percentage), the lower the false positive rate will be. In two-
class classification, even though the detection rate is very high, the false positive
rate will also be high. One reason for the high false positive rate could be that the
negative sets (for both training and validation) are not representative or diverse
enough. In anti-spam filtering, due to privacy issues, a representative negative
set is difficult to collect. Moreover, low false positive rates are more important
than high detection rates. Therefore, we choose the one-class SVM classifier as
the base classifier with 20% outlier in our anti-spam filter.
Table 3.3 shows the comparative performances of the anti-spam filters. The
Bayesian filter, trained using Ling-Spam dataset, can only detect 47.73% of the
62

Chapter 3. Visual-Based Anti-Spam Filtering
Table 3.2: Classifier comparison
Classifier Detection Rate False Positive
1-class SVM, 5% outlier 94.87% 6.54%1-class SVM, 10% outlier 90.73% 2.80%1-class SVM, 20% outlier 80.07% 0.93%
2-class SVM 99.93% 14.01%
spam emails. The proposed anti-spam filter can detect 80.05% (using 1-class SVM
with 20% outlier) of the spam emails and can bring an additional 36.2% detection
rate to the Bayesian filter.
Table 3.3: Filter comparison
Filter Detection Rate
Text-based Bayesian 47.73%Proposed 80.05%
Text-based Bayesian + Proposed 83.93%
Table 3.4: Blocked/Missed email analysis
Filter Blocked Missed
Text-based Bayesian 265 tokens 96 tokensProposed 69,224 pixels 48,975 pixels
Table 3.4 shows the statistics of emails blocked and those missed by the text-
based Bayesian and the proposed anti-spam filters. Most of the spam emails that
were missed by the Bayesian filter contained very few text tokens. Some of them
contained no text at all. The average number of text tokens in these emails was
63

Chapter 3. Visual-Based Anti-Spam Filtering
96, while the average number of text tokens in emails that were blocked by the
Bayesian filter was 265. Moreover, the average number of image pixels per email
in those spam emails blocked by the proposed anti-spam filter was 69,224 and the
average number for the missed spam emails was 48,975.
The computation time for our proposed anti-spam filter depends on the number
of images in the email and the number of text regions in each image. For a 384x256
photo image, it takes around 100-200 ms to extract features. For a text-rich image,
it may take around 500-700 ms. To classify an email with four images, it takes
roughly 2-3 seconds. Since the proposed anti-spam filter is a client-side filter, and
email clients do not need real-time performance, the additional overhead caused
by the proposed anti-spam filter is not a concern.
64

Chapter 4
Conclusions
Previous work on embedded-text detection often followed a two-step frame-
work. First, image analysis techniques were applied to locate potential text re-
gions. Then, heuristic-based or machine learning-based models were applied to
refine the text regions. In other words, the two-step frameworks divided the
embedded-text task into two easier sub-tasks. There are two advantages for sep-
arating the task; the first is computation cost saving; the second is reduction in
false-positive rate. However, the sequential dependency between the two steps
can cause a major bottleneck in the two-step framework. The overall detection
accuracy will be the product of the results of the two steps, therefore the overall
result is constrained by the lower accuracy rate.
65

Chapter 4. Conclusions
In this thesis, we have proposed a unified embedded-text detection framework
to push the accuracy and efficiency beyond existing two-step frameworks. We ap-
proached the embedded-text detection problem from the angle of object detection.
Based on Viola and Jones’ rapid object-detection framework, we define three sets
of position-independent features to capture the essence of the characters; locality-
filters to locate text lines boundaries, and a smart-scan algorithm to trace text
lines using their spatial and geometrical properties.
Previous work in content-based anti-spam filtering relies primarily on the text
content of the emails. As the spammers’ techniques become more sophisticated,
and the genre of email content continues to evolve, these text-based approaches
alone are no longer sufficient for solving the spam problem. In this thesis, we have
analyzed the spam emails containing images and identified a number of useful
visual features that can be efficiently extracted from the emails for anti-spam
filtering. We have proposed a novel anti-spam filter based on these features using
a one-class SVM classifier.
We have integrated the proposed anti-spam filter with Thunderbird, an email
client from Mozilla. The experimental results show that the proposed anti-spam
filter is both effective and efficient. They clearly indicate that the proposed anti-
spam filter can bring extra filtering power to the existing text-based anti-spam
filters.
66

Bibliography
[1] D. Chen, J. Luettin and K. Shearer. A Survey of Text Detection and Recognition
in Images and Videos. IDIAP-RR 00-38, IDIAP, 2000
[2] D. Chen, H. Bourlard, and J-Ph. Thiran. Text identification in complex background
using SVM. In Proc. IEEE CVPR, p.621-626, Dec. 2001
[3] R. Collobert and S. Bengio. SVMTorch: Support Vector Machines for Large-Scale
Regression Problems. Journal of Machine Learning Research, vol 1, pages 143-160,
2001.
[4] Corel Images. http://www.corel.com
[5] Gary R Bradski. Open Source Computer Vision Library. Intel Corporation, 2001.
[6] L.A. Fletcher and R. Kasturi. A Robust Algorithm for Text String Separation
from Mixed Text/Graphics Images. IEEE Trans. on Pattern Analysis and Machine
Intelligence, vol. 10, no. 6, pp. 910-918, Nov. 1988
67

Bibliography
[7] Y. Freund and R.E. Schapire. A decision-theoretic generalization of on-line learn-
ing and an application to boosting. Journal of Computer and System Sciences,
55(1):119–139, Aug. 1997.
[8] Y. Freund. An adaptive version of the boost by majority algorithm. Machine
Learning, 43(3):293–318, Jun. 2001.
[9] T. G. Dietterich. An experimental comparison of three methods for constructing en-
sembles of decision trees: Bagging, boosting, and randomization. Machine Learning,
40(2):139–158, 2000
[10] K. I. Kim, K. Jung, and J. H. Kim. Texture-based approach for text detection in
images using support vector machines and continuously adaptive mean shift algo-
rithm. PAMI, 25(12):16311639, Dec. 2003.
[11] W. Liu and D. Dori. A Proposed Scheme for Performance Evaluation of Graph-
ics/Text Separation Algorithms. GREC 1997: 359-371
[12] F. LeBourgeois. Robust multifont OCR system from gray level images. In Proc. of
the 4th ICDAR, p.1-5, 1997.
[13] R. Lienhart. Automatic text recognition for video indexing Proc. of 4th ACM MM,
p.11-20, Nov. 1996, Boston,
68

Bibliography
[14] R. Lienhart, A. Kuranov, and V. Pisarevsky. Empirical analysis of detection cas-
cades of boosted classifiers for rapid object detection MRL Technical Report, Intel,
May, 2002
[15] R. Lienhart and A. Wernicked. Localizing and segmenting text in images and
videos. IEEE Trans. Circuits Syst. Video Technol., vol. 12, pp. 236-268, Apr. 2002.
[16] R. Lienhart. Video OCR: A Survey and Practitioner’s Guide. VideoMining03,
Chapter 6, 2003
[17] J. Ohya, A. Shio and S. Akamatsu. Recognizing Characters in Scene Images. IEEE
Trans. PAMI, Vol 16, No. 2, pp.214-224, Feb. 1994
[18] C. L. Tan and P. O. Ng Text extraction using pyramid. Pattern Recognition, 31
(1): 63-72, 1998.
[19] Q. Yuan and C. L. Tan Text extraction from gray scale document images using
edge informaiton In the 6th ICDAR, Sep. 2001, Seattle
[20] R. Cao and C. L. Tan Separation of overlapping text from graphics In the 6th
ICDAR, Sep. 2001, Seattle
[21] Z.W. Tu, X.R. Chen, A.L. Yuille and S.-C. Zhu. Image parsing: unifying segmen-
tation, detection, and recognition. In ICCV, 2003
[22] P. Viola and M. Jones. Rapid object detection using a boosted cascade of simple
features. In CVPR, 2001.
69

Bibliography
[23] V. Wu, R. Manmatha, and E. M. Riseman. Finding text in images. In Proc. ACM
Int. Conf. Digital Libraries, 1997.
[24] V. Wu, R. Manmatha, and E. M. Riseman. TextFinder: An automatic system to
detect and recognize text in images. IEEE Trans. on PAMI, 21(11):1224-1229, 1999
[25] C. Wolf and J.-M. Jolion Model based text detection in images and videos: a
learning approach Tech. Report RR-2004-13, LIRIS, 2004
[26] Y. Zhong, K. Karu, and A. K. Jain. Locating text in complex color images. In
Proc. of the 3rd ICDAR, p.146, Washington DC, 1995.
[27] J. Postel. On The Junk Mail Problem. RFC706. November 1975.
[28] J. Graham-Cumming. The Spammer’s Compendium. http://www.jgc.org/tsc/
[29] The Mozilla Project. http://www.mozilla.org
[30] SpamArchive. http://www.spamarchive.org
[31] M. Sahami, S. Dumais, D. Heckerman, and E. Horvitz. A Bayesian approach to
filtering junk email. AAAI Workshop on Learning for Text Categorization, Jul.
1998, Madison, Wisconsin. AAAI Technical Report WS-98-05
[32] I. Androutsopoulos, J. Koutsias, K. V. Chandrinos, G. Paliouras, and C. D. Spy-
ropoulos. An Evaluation of Naive Bayesian Anti-Spam Filtering. In Proc. of the
workshop on Machine Learning in the New Information Age, 2000.
70

Bibliography
[33] A. Kolcz and J. Alspector. SVM-based filtering of e-mail spam with content-specific
misclassification costs. ICDM Workshop on Text Mining (TextDM 2001), Nov. 2001.
[34] X. Carreras and L. Mrquez. Boosting trees for anti-spam email filtering. In Pro-
ceedings of RANLP-01, 4th International Conference on Recent Advances in Natural
Language Processing, Tzigov Chark, BG, 2001
[35] C.-C. Chang and C.-J. Lin. LIBSVM: a library for support vector machines, 2001.
Software available at http://www.csie.ntu.edu.tw/ cjlin/libsvm
[36] V. Vapnik. The Nature of Statistical Learning Theory. Springer Verlag, New York,
1995.
[37] B. Scolkopf, J. Platt, J. Shawe-Taylor, A. J. Smola, and R. C. Williamson. Es-
timating the support of a high-dimensional distribution. Technical Report 99-87,
Microsoft Research, 1999.
[38] K.I. Kim, K.C. Jung, S.H. Park, and H.J. Kim. Support vector machine-based text
detection in digital video. Pattern Recognition 34(2): 527-529 (2001)
[39] J. Zhou and D. Lopresti Extracting text from WWW images In Proc. of the 4th
ICDAR, p.242-252, 1997.
71