eMARS Reporting - finance.ky.gov Resource...Primary or Secondary – Determine whether or not the...
17
4.1 3.10 eMARS Reporting BASIC NAVIGATION, QUERIES, REPORTS SEPTEMBER 18, 2017
Transcript of eMARS Reporting - finance.ky.gov Resource...Primary or Secondary – Determine whether or not the...

4.1 3.10
eMARS Reporting BASIC NAVIGATION, QUERIES, REPORTS SEPTEMBER 18, 2017

eMARS Reporting Basic Navigation, Queries, Reports
eMARS Reporting Basic Navigation, Queries, Reports 1
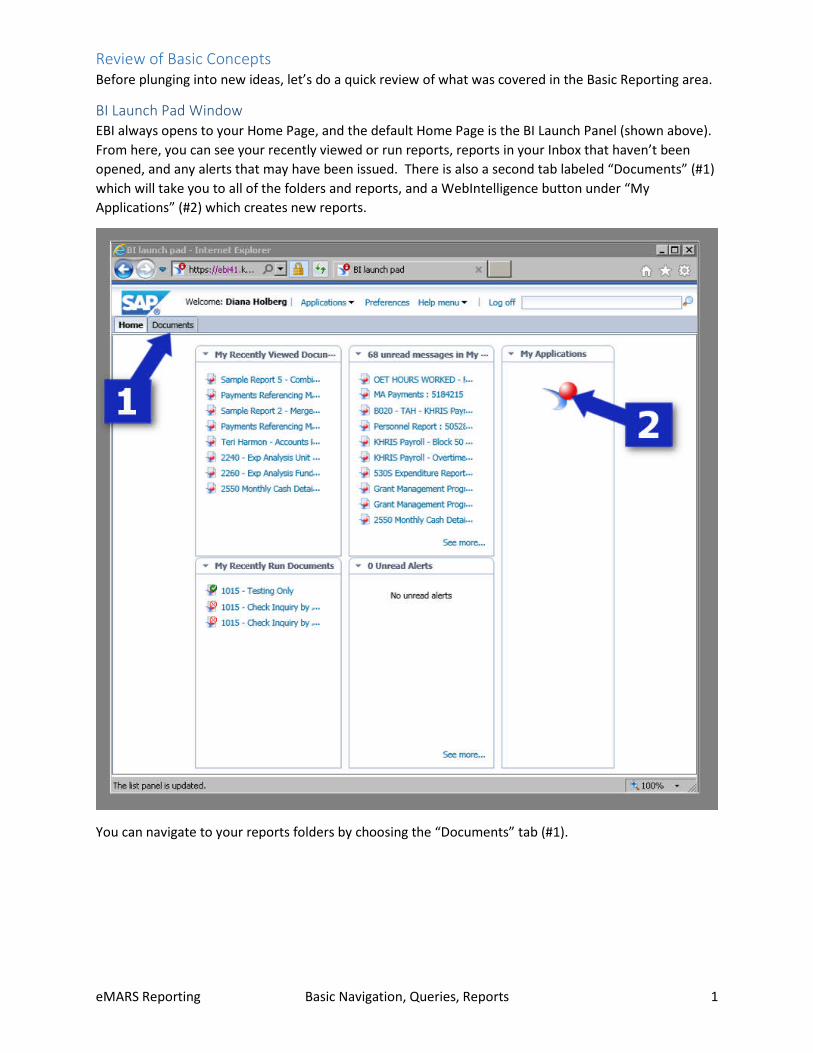
Review of Basic Concepts Before plunging into new ideas, let’s do a quick review of what was covered in the Basic Reporting area.
BI Launch Pad Window EBI always opens to your Home Page, and the default Home Page is the BI Launch Panel (shown above). From here, you can see your recently viewed or run reports, reports in your Inbox that haven’t been opened, and any alerts that may have been issued. There is also a second tab labeled “Documents” (#1) which will take you to all of the folders and reports, and a WebIntelligence button under “My Applications” (#2) which creates new reports.
You can navigate to your reports folders by choosing the “Documents” tab (#1).

eMARS Reporting Basic Navigation, Queries, Reports 2
“My Documents” Panel and Window The “My Documents” panel on the left displays your “My Favorites” folder (#3) where you can store reports while you are working on them. Any folders you create in the “My Favorites” folder will be listed in the panel on the right (#4). You will also find your Inbox (#5) which contains any reports sent to you by other users, the “Folders” section (#6) containing Agency and Statewide Reports, and the “Search” bar (#7).
Let’s take a look at Agency and Statewide Reports folders by navigating to the “Folders” section (#6).

eMARS Reporting Basic Navigation, Queries, Reports 3
“Folders” Panel for Agency and Statewide Reports In the “Folders” panel, you will see all folders for all the reporting resources to which you have access through EBI in the “Public Folders”. As an eMARS Report Developer, you will see the “eMARS Financial” folder among them. Your Agency reports are stored under your Cabinet in the “eMARS Agency Reports” folder (#8).
In the “Statewide Reports” folder (#9), you will find subfolders containing statewide reports for various eMARS functional areas (#10). These are useful as templates for developing custom reports for your department or cabinet. Within your security limitations, you can copy/paste reports using the “Organize” button (#11), and send copies of reports to other users with the “Send” button (#12).
Now let’s look at a new report, starting with the Query Panel. There are several ways to create a new report:
• Use the WebIntelligence button under “My Applications” on the BI Launch Pad. • Choose “WebIntelligence” from the “Applications” dropdown at the top of the window. • Copy/paste an existing report in “My Favorites”, then right-click the new report and choose
“Modify”.
When WebIntelligence launches, at first all you will see is a toolbar. You will have to click the “New Document” button (#13) and choose a universe before the Query Panel will appear.

eMARS Reporting Basic Navigation, Queries, Reports 4
Tip: The most frequently used universe is the one named FIN-General Accounting, which can be used to develop reports containing data from the Accounting Journal, including cash, encumbrances, expenditures, and disbursements, among other types.
Query Panel for a New Report As mentioned, the “New Documents” button (#13) brings up the Query Panel for a new report. On the left side, you will see a list of all of the classes and objects contained in the specified universe (#14). To create a query, drag objects from the left side to the Result Objects section (#15), and then filter your data by dragging objects to the Query Filters section (#16) and specifying your criteria. (The sample query shown will create a report of Fund codes and names for Fund Types excluding Capital Projects.) Finally, click the “Run Query” button (#17) to pull in the data and create the report.
Tip: It is best to use the “Close” button next to the “Run Query” button the first time you create a new query. Choose “Apply Changes and Close”, then use the “Save” button in the Report Panel to save the new report in your “My Favorites” folder. This way, if your query fails to complete (or your session crashes), you won’t lose the query.
Once you have used the “Run Query” or “Close” button, you will be taken to the Report Panel.

eMARS Reporting Basic Navigation, Queries, Reports 5
Report Panel for a New Report As mentioned, when you click “Run Query” or choose a “Close” option, you will be taken to the Report Panel for your report. The first thing you should do is use the “Save” button to save the new report in your “My Favorites” folder.
When a new report generates for the first time, by default it has one report tab named “Report 1” and a single table containing all objects from the query (#19). Objects are added or removed using the Available Objects panel on the left side (#18). The “Page Setup” tab (#20) allows you to choose options for displaying and printing the report. The “Design” button (#21) allows you to see the structure of the report with or without data. Lastly, at the bottom of the Report Panel is a page navigator (#22). Use the arrow buttons or type in a page number to navigate to the desired page.

eMARS Reporting Basic Navigation, Queries, Reports 6
Java Features: “Data” Button, “Tools” Tab and Custom Number Formatting If you have Java configured correctly, you will also see a “Data” button to the right of the “Design” button at the top of the report panel. Other Java-related functionality includes the “Tools” tab under “Data Access” and the “Custom” button for Number Formatting under “Format”. These features are described in the “Advanced Techniques” section. If they are missing from your Report panel, please refer to the “Troubleshooting” section.

eMARS Reporting Basic Navigation, Queries, Reports 7
Standard Report Design Approach It is highly recommended that you adopt a standard approach to report design. In this way, you will more easily communicate with other Report Developers, and the queries and reports designed will demonstrate a higher level of consistency. The current standard approach for development of Statewide Reports (or requests submitted to Statewide Accounting Services) is as follows:
I. Query Design A. Name the report and Save it – To name and save the report, there must be at least one
object in the query. You can use the “Close” button to “Close and apply changes” and click the “Save” button to save the report to your “My Favorites” folder with the desired name.
B. FIN-General Accounting universe query 1. Primary or Secondary – Determine whether or not the FIN-General Accounting
universe will be sufficient, and whether it should be the primary query or a secondary one (such as for Procurement reports, Fixed Assets reports, etc.)
2. Basic Ledger, Detail Ledger, or Accounting Journal for Measures – Determine whether you can use the Basic Accounting Ledger class or the Detailed Accounting Ledger class for amount measures, or if you will have to use a measure from the Accounting Journal class (such as when you need Document Numbers or grant-related objects). When in doubt, use measures from the Accounting Journal classes.
Class Measure Most Often Used When… Accounting Journal > Jrnl Doc Amounts
Jrnl Posting Amt Report includes Document Number objects (Code, Dept Code, ID), or grant-related COA codes (Major Program, Program, Program Period, etc.).
Accounting Ledger Measures > Basic Accounting Ledger
Posting Amount Report includes only Chart of Accounts elements from COA-Fund Accounting or COA-Organization classes (i.e., no Function).
Accounting Ledger Measures > Detailed Accounting Ledger
Posting Amount Report includes only Chart of Accounts elements from COA-Fund Accounting, COA-Organization
3. Accounting Journal Class – If the Basic or Detailed Accounting Ledgers cannot be used, pull any needed objects from the Accounting Journal sub-classes. The most commonly used objects include:
Description Sub-Class Objects Document Number Jrnl Doc Identification Jrnl Doc Code
Jrnl Doc Dept Code Jrnl Doc ID
Record Date from Header Jrnl Doc Dates *Jrnl Doc Record Date Amount from Posting Lines Jrnl Doc Amounts Jrnl Posting Amt Referenced Document Numbers Jrnl Doc Ref
Identification Jrnl Doc Ref Doc Code Jrnl Doc Ref Doc Dept Code Jrnl Doc Ref Doc ID
Vendor Information Jrnl Doc Vendor Jrnl Vendor Code Jrnl Vendor Legal Name
Commodity Code (if merging with a Procurement query)
Jrnl Commodity Jrnl Commodity Code

eMARS Reporting Basic Navigation, Queries, Reports 8
4. Chart of Accounts Class – Pull any objects needed from the Chart of Accounts sub-classes. The most commonly included objects are:
Description Sub-Class Objects Basic Accounting COA Elements Fund COA-Fund Accounting >
Fund *Fund Fund Name
Department COA-Organization > Organization – Centralized view
*Department Department Name
Unit COA-Organization > Organization – Decentralized view
Unit Unit Name
Object COA-Fund Accounting > Object
Object Object Name
Revenue (Source) COA-Fund Accounting > Revenue
Revenue Source Revenue Source Name
Detailed Accounting COA Elements Function COA-Detailed Accounting
Function Function Function Name
Activity COA-Detailed Accounting Activity
Activity Activity Name
Location COA-Detailed Accounting Location
Location Location Name
Reporting (Category) COA-Detailed Accounting Reporting
Reporting Reporting Name
Grant-Related COA Elements Major Program COA-Cost Accounting
Major Program Major Program Major Program Name
Program COA-Cost Accounting Major Program Program
Program Code Program Name
Program Period COA-Cost Accounting Program Period
Program Period Code
5. Financial Reporting Periods Class – Pull any objects needed from the Financial Reporting Periods class. The most commonly included objects are:
Description Sub-Class Objects Fiscal Year Fiscal Year *Fiscal Year Budget Fiscal Year Budget Fiscal Year BFY Accounting Period Accounting Period *Accounting Period
6. Posting Attributes – Pull any needed objects from the Posting Attributes class. The most commonly included objects are:
Description Sub-Class Objects Posting Code Posting Code Posting Code Closing Classification Posting Code *Closing Classification Event Type Event Type Event Type
7. Query Filters - Drag objects from Result Objects to Query Filters to create filters as needed. Set them as Prompts where possible and keep the “Faster Report Execution” tips in mind. The objects most commonly used as Query Filters are prefixed with an asterisk (“*”) in the tables above. Tip: If you make it a practice to include objects commonly used for Query Filters in Result Objects, you can drag them down as needed to quickly create Query Filters.

eMARS Reporting Basic Navigation, Queries, Reports 9
8. Prompt Order – Open Query Properties; arrange prompts in the order in which they should appear to the user. Generally speaking, the first prompts should be Organizational objects (such as Cabinet, Department, or Unit), followed by Reporting Period objects (such as Fiscal Year, BFY, or Accounting Period). Chart of Accounts prompts should follow, in the same order in which they appear on eMARS documents (i.e., Fund, Object, Revenue Source, Function, Activity, Location, Reporting, Major Program, Program, Program Period).
C. Other universe queries and merging – Use the “Add Query” button (or the “Add a combined query” button) to create additional queries (from FIN-General Accounting or other universes) as needed. Where necessary, use the “Merge” button (located in the “Data Objects” section of the “Data Access” tab in the toolbars) to merge the queries. (See the “Merged Query” section for details.)
D. Save the report – Once again, use the “Close” button and choose “Apply changes and close”, then save the report with the “Save” button.
II. Report Design A. Default report design – By default, the report generated is named “Report 1” and
includes a title box and a table which includes all of the objects in the report. It is suggested that you delete the title box (or drag it into the header), delete the table (or move it to the top of the report), and rename the report tab to “For Export” before doing anything else. Remember to save frequently as you work on the report.
B. Table block – If you deleted the generated table, hold your Control key down while you select objects to be included in the report, then drag them into the report and position the table at the top of the page. Include all of the objects required for the most detailed report tab in your report. (If you did not delete the generated table, review the columns and add/delete objects as needed.) If desired, use the Report Element > Table tab in the toolbars to change the table design. For vertical tables, try to arrange the columns in the order in which you want the data sorted. By default, data is automatically sorted (from the left column to the right), in ascending order (from top to bottom).
C. Report & Table filters – If your queries are retrieving more data than you want to display in the report, add filters to your table block until the correct data is shown. (Although technically report filters can also be applied, filters applied to table blocks have proven to yield more reliable results.)
D. Report data & variables – Before spending a lot of time on the appearance of the report, make sure the data is complete and totals are correct. As needed, create variables for amounts not easily obtained using query objects (such as for different Closing Classifications). If appropriate, use the “Sum” button (from Analysis > Functions in the toolbars) to total amount columns. If the report was requested by an end user, export the data and send for confirmation. (Many times, the data will be all they need.)
E. Report headers and footers – Copy the “For Export” tab to create a tab for your most detailed report, naming it appropriately. For formatted reports, it is a good practice to keep the tab named “For Export” with an unformatted table block that includes all (or most) of the report objects and variables. This allows users to easily access the data behind the report without having to create their own query. If you are not using a report template, create a header and a footer for your report according to the standards and conventions in use by your organization. Ideally, these should include the execution date and time for the report, the page number, the report title, and any prompts and responses from the query filters. Tip: There are standard cells for all of this information. Select Report Element > Cell > Pre-defined in the toolbars to see a list of them.

eMARS Reporting Basic Navigation, Queries, Reports 10
F. Sections – Once it is confirmed that the data is complete, create any needed sections by right-clicking on the column for an object and choosing “Set as section”. (If you want the object to remain in the table as well, you will need to drag it into the table again.) Whenever possible, create sections in the order you want them to appear to ensure your table’s structure remains intact. Sections are preferable to breaks because sections are displayed in the Report Map, which is helpful for navigation.
G. Breaks – Create any breaks by right-clicking the object column and choosing “Break > Add Break”. Whenever possible, create the breaks on objects as you want them to appear from left to right. This will ensure your table’s structure remains intact.
H. Totals – If desired, add cells for Section totals, and a Grand Total. These will usually be standalone cells with formulas such as “=Sum([Appropriation Amount])”. As needed, format the totals (using “Numbers” on the “Format” tab) to make all numbers in the report consistent.
I. Other reports – As needed, right click the report tab at the bottom of the window and choose “Duplicate Report” to create additional reports using the same queries. Create them from most detailed to least, removing and adding sections, breaks, and objects as needed, and creating additional variables as necessary to obtain the level of detail desired on each tab. Table formats may also be changes (e.g., to crosstabs, graphs, etc.).
J. Save, review, correct, purge and publish– Complete formatting of your report according to the standards and conventions for your organization. Once your report is formatted, send a copy to the requestor for review. Make any necessary corrections and then put a purged copy of the report in the Public Folders so that it will be accessible to other users. (Purging reduces the amount of storage space required for reports. A report is purged by choosing the “Purge” button from the “Data Access” tab.) Keep a copy in your “My Favorites” folder as a backup. Tip: Other users may not be able to copy the report from Public Folders, but they can create a shortcut to it in their “My Favorites” folder (to make it easier to locate and open).

eMARS Reporting Basic Navigation, Queries, Reports 11
Operational Budget Report – Start to Finish This section follows the standard approach to report design detailed in “Basic Concepts” to create a report showing Operational Budget appropriation and allotment amounts (i.e., Budget Structure 3). Here is summary information about this report (following the conventions detailed in “Basic Concepts”:
Item Name Filters Objects/Variables Document Operational Budget – Appropriation & Allotment Amounts Universe(s) Budget Execution Universe - KY Query(s) BE-KY Data Cabinet filter = Prompt
BFY filter = Prompt Budget Structure Id = 3 Budget Level Id = 2 Function Group = Prompt (optional) Function Type = Prompt (optional)
Filter objects (& names) Allotment Period Allotment Period Name Fund Type CAFR Fund Type Object Type Line Amount Signed Allotment Line Amount Signed
Report(s) Appropriations Allotments For Export
Fund Type = “0100” table filter Prompt variables Quarter dimension Amt-Approp measure Amt-Allot measure Cabinet section Fund Type section Function Group break
III. Query Design A. Name the report and Save it – The best universe for an Operational Budget report at
this time is the Budget Execution Universe - KY universe. Since we need a query with at least one object in it to save our initial report, the first step is to create a query against Budget Execution Universe - KY.
1. Drag the [Cabinet] and [Cabinet Name] objects (from COA-Organization > Organization-Centralized view) to Result Objects. Rename your query tab to “BE-KY Data”.
2. Use the “Close” button to “Close and apply changes”. (This takes you to the Report Panel.)
3. Click the “Save” button to save the report to your “My Favorites” folder with a meaningful name (such as “Operational Budget – Appropriation & Allotment Amounts).
B. FIN-General Accounting universe query – A report displaying only budget amounts does not require a query against FIN-General Accounting. When we look at a merged report for balances we will need to merge the query from this report with the one from the Encumbrance & Expenditure report.
C. Other universe queries –Edit the BE-KY Data query, pulling the following objects: 1. COA - Fund Accounting class – Pull the following objects:
Description Sub-Class Objects Fund Type Fund
Fund Hierarchy Fund Type Fund Type Name
CAFR Fund Type Fund CAFR Fund
CAFR Fund Type CAFR Fund Type Name
Object Type Object Object Hierarchy
Object Type Object Type Name

eMARS Reporting Basic Navigation, Queries, Reports 12
2. COA – Organization class – Pull the following objects:
Description Sub-Class Objects Cabinet Organization - Centralized view Cabinet
Cabinet Name
3. Budget Structure class – Pull the following objects:
Description Sub-Class Objects Budget Structure ID Budget Structure Id Budget Level ID Budget Level Budget Level Id Quarter Name Allotment Option Allotment Period Name
4. Financial Reporting Periods– Pull the following objects:
Description Sub-Class Objects Budget Fiscal Year Budget Fiscal Year BFY
5. Budgeting Journal class – Pull the following objects:
Description Sub-Class Objects Appropriation Amount Line Amount Signed Quarter Number Allotment Information Allotment Period Allotment Amount Allotment Information Allotment Line Amount Signed
6. Query Filters – Drag the following objects from Result Objects to Query Filters to create filters:
Object Operator Values Optional? Default Values Cabinet Equal to Prompt: Enter Cabinet: No BFY Equal to Prompt: Enter BFY: No 2017 (or current BFY) Function Group Equal to Prompt: Enter Function
Group (optional): Yes
Function Type Equal to Prompt: Enter Function Type (optional):
Yes
Budget Structure ID Equal to 3 Budget Level ID Equal to 2
7. Prompt Order – Open Query Properties and arrange the prompts in the order shown above.
D. Save the report – Once again, use the “Close” button and choose “Apply changes and close”, then save the report with the “Save” button.

eMARS Reporting Basic Navigation, Queries, Reports 13
IV. Report Design – Refresh the report as needed while you design your report. A. Default report design – Make the following changes to the generated report:
1. Delete the title box and the table block. 2. Rename the report tab from “Report 1” to “For Export”. 3. Save the report.
B. Add table block – Add the table block back as follows: 1. Hold your “Ctrl” key down while you select the following objects, then drag
them into the report and arrange them in the following order (add “Name” objects as desired):
Objects for Table Block Fund Type Function Group CAFR Fund Type Line Amount Signed
Tip: For reports having only one query, the table is automatically created with the objects in the order in which you select them.
2. Format the table to set the position to the top of the page (i.e., Horizontal Position = 0, Vertical Position = 0).
C. Report & Table filters – For simplification, apply the following table filters (if you want other Fund Types, remove this filter once the report design is complete):
Object Operator Values Fund Type Equal to 0100

eMARS Reporting Basic Navigation, Queries, Reports 14
D. Report data & variables – Make sure the data is complete and totals are correct. Tip: A quick way to compare amounts within the report is to duplicate it, then add breaks and column totals.
1. To make the report easier to understand, create a measure variable named “Amt-Approp” and set it equal to [Line Amount Signed]. Replace [Line Amount Signed] in the table with [Amt-Approp], update the column heading, then save the report.
2. Spot-check the appropriation amounts in the table, comparing them with the Current Budget amounts on the eMARS inquiry page for Appropriations (BQ3LV1) for the BFY and CAFR Fund Type = “GNRL”.
3. Add [Function Type] to the table (after [Function Group]), then save the report. Compare the new amounts with the Current Budget amounts on the eMARS inquiry page for Allotments (BQ3LV2).
4. Create a dimension variable named “Quarter” and set it equal to [Allotment Period]. Add [Quarter] to the table (after [CAFR Fund Type]), then save the report.
5. Create a measure variable named “Amt-Allot” and set it equal to [Allotment Line Amount Signed]. Add [Amt-Allot] to the table (after [Quarter]), update the column heading, then save the report.
6. Compare the allotment amounts to the eMARS inquiry page for Quarterly Allotments (BQ3LV2, click the Allotments link at the bottom of the page).
7. Add [Object Type] to the table (after [Quarter]), then save the report. Note: At this stage, there will be no values in the Object Type column, since [Object Type] is only on Budget Level 3 and our query pulls for Budget Level 2.
8. As desired, format all numbers consistently (using “Numbers” options on the “Format” tab).
9. Right-click the report tab and choose “Duplicate Report”. Rename the new report “Allotments” and make it the first report tab.
10. Remove [Object Type] and [Amt-Approp] from the Allotments report. 11. Save the report.
E. Report headers and footers – If you are not using a report template, create a header and a footer for the Allotments report tab according to the standards and conventions in use by your organization. Ideally, these should include the execution date and time for the report, the page number, the report title, and any prompts and responses from the query filters. (Refer to other Start to Finish sections for sample instructions and layout settings.) Tip: There are standard cells for all of this information. Select Report Element > Cell > Pre-defined in the toolbars to see a list of them.
F. Sections – Once it is confirmed that the data is complete, create sections on [Fund Type] and [Function Group] by right-clicking on each column and choosing “Set as section”.
G. Breaks – Create a break on [Function Type] by right-clicking the object column and choosing “Break > Add Break”. Whenever possible, create the breaks on objects as you want them to appear from left to right. This will ensure your table’s structure remains intact. Use the “Sum” button (under “Functions” on the “Analysis” tab) to add break totals. Use the “Numbers” options (on the “Format” tab) to format the totals consistently with the other numbers.
H. Totals – Add standalone cells for section totals, and a Grand Total for the report. Use the “Numbers” options (on the “Format” tab) to format the totals consistently with the other numbers.

eMARS Reporting Basic Navigation, Queries, Reports 15
I. Other reports – Copy the “For Export” report tab (or the “Allotments” report tab) to create additional reports named “Appropriations” and “Object Types” using the same queries and the formatting suggestions above. Hint: You will have to change your query to pull amounts from Budget Level 3 instead of Budget Level 2 to obtain amounts for by Object Type.
J. Save, review, correct, purge and publish– Complete formatting of your report according to the standards and conventions for your organization. (If desired, remember to remove the Fund Type = “0100” filter from your report tables.) Normally, you would be designing this report for other users, so in addition to keeping a copy of the report in your “My Favorites” folder (or a sub-folder), you would want to put a purged copy in your Agency folder (or sub-folder). Remember, your Agency folder is under your cabinet number on the “Folders” tab under Public Folders > eMARS Financial > eMARS Agency Reports.
V. For Review and Discussion A. Why do allotment amounts disappear when pulling data from Budget Level 3 instead of
Budget Level 2?
B. Do you think it is safe to define appropriation amounts as a sum of allotment amounts?
C. How would you develop a report to provide amounts at all three levels of the Budget Structure?