Emaar Properties PJSC Corporate Presentation October … 2014 Corporate... · Corporate...
43
© Emaar 2014 Emaar Properties PJSC Corporate Presentation October 12 th , 2014
Transcript of Emaar Properties PJSC Corporate Presentation October … 2014 Corporate... · Corporate...

© Emaar 2014
Emaar Properties PJSC
Corporate Presentation
October 12th, 2014
© Emaar 2014
EMAAR OVERVIEW
2

© Emaar 2014
Emaar Properties is the largest publicly-listed property developer in the MENA region
Market Cap (1) : AED 82.34 bn (US $22.42 bn)
Revenues :
FY 2011 AED 8.11 bn (US $ 2.21 bn)
FY 2012 AED 8.24 bn (US $ 2.24 bn)
FY 2013 AED 10.33 bn (US $ 2.81 bn)
H1 2014 AED 5.06 bn (US $ 1.38 bn)
Net Operating Profit : FY 2011 AED 2.06 bn (US $ 0.56 bn)
FY 2012 AED 2.12 bn (US $ 0.58 bn)
FY 2013 AED 2.57 bn (US $ 0.70 bn)
H1 2014 AED 1.73 bn (US $ 0.47 bn)
Hotels : 12 hotels and resorts (over 1,900 keys)
(including Egypt, India and Italy)
Recurring Revenue : Over 690,000 sqm of recurring revenue
generating assets
Residential Units Delivered : Over 37,800 since 2001
NAV/Share : AED 14.9 (2) (2012: AED 9.6)
(1) As of 07/Oct/2014
(2) Number of shares as at 30/June/2014 & Fair value as at 31/Dec/2013 except for Emaar Malls Group which is being valued based on its share price of AED 3.28 per
shares as on 7/Oct /2014.
EMAAR at a Glance
3
© Emaar 2014
EMAAR’s Strategy & Goals
4
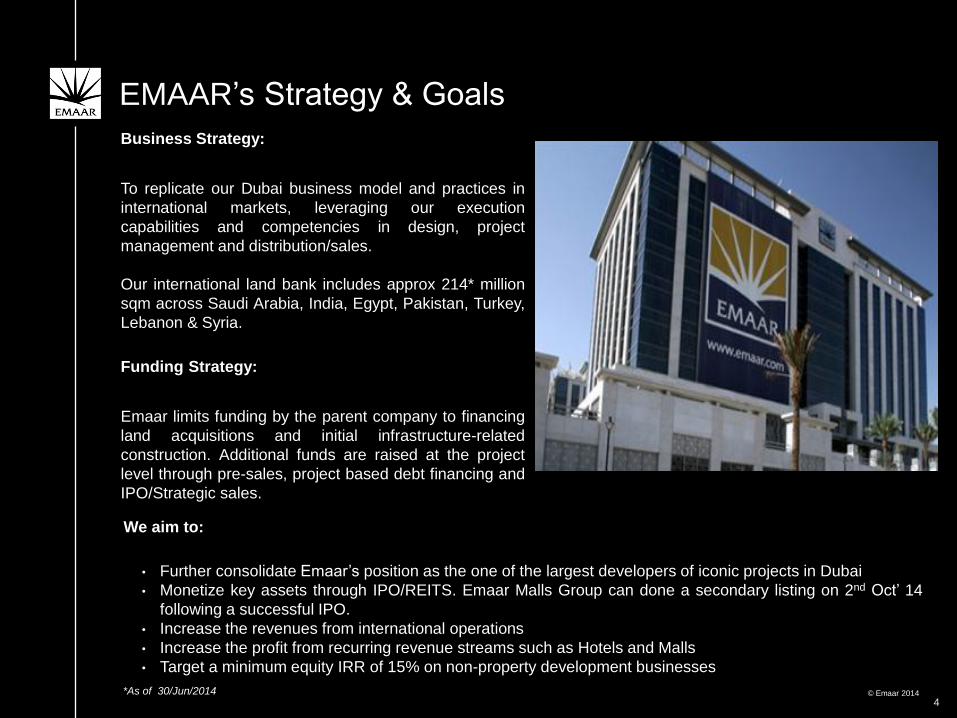
Business Strategy:
To replicate our Dubai business model and practices in
international markets, leveraging our execution
capabilities and competencies in design, project
management and distribution/sales.
Our international land bank includes approx 214* million
sqm across Saudi Arabia, India, Egypt, Pakistan, Turkey,
Lebanon & Syria.
Funding Strategy:
Emaar limits funding by the parent company to financing
land acquisitions and initial infrastructure-related
construction. Additional funds are raised at the project
level through pre-sales, project based debt financing and
IPO/Strategic sales.
We aim to:
• Further consolidate Emaar’s position as the one of the largest developers of iconic projects in Dubai
• Monetize key assets through IPO/REITS. Emaar Malls Group can done a secondary listing on 2nd Oct’ 14
following a successful IPO.
• Increase the revenues from international operations
• Increase the profit from recurring revenue streams such as Hotels and Malls
• Target a minimum equity IRR of 15% on non-property development businesses
*As of 30/Jun/2014

© Emaar 2014
5
• Take advantage of the recent buoyancy in Dubai’s Real
Estate market by developing new iconic projects
• Enter into Joint ventures in Dubai to get access to
significant land bank with no immediate cash outflow for
land purchase.
• Develop Rental / Mall assets in other countries including
Egypt and Turkey; Extension of Dubai Mall and
development of new malls & retail in Joint ventures.
• Continue to develop the existing sizeable land bank in
International Markets and further establish the ‘Emaar’
brand (similar to Dubai)
• Monetise core assets (IPO / REITs) including, Hospitality,
Egypt, Turkey and India to provide further growth capital
and reduce reliance on debt.
• As the first step in monetising core assets, Emaar
concluded an IPO for 15.4% of Emaar Malls Group (EMG)
for US$ 1.6 bn at AED 2.90 per share. As on 7 October
2014 the share was trading at 3.28.
EMAAR’s Business Strategy – Mid Term

© Emaar 2014
EMAAR Group H1 2014 Performance Highlights
6
• Dubai RE: Emaar has successfully launched 10 new projects – Opera Grand, Boulevard Crescent, Boulevard
Point, Vida Residences in Downtown Dubai, Lila, Rasha, Yasmin, Samara, Aseel in Arabian Ranches I & II and
Mulberry Park Heights, Plots in Dubai Hills Estate (part of Mohammed Bin Rashid City). All launches had
excellent sales response. The total sales value in Dubai during H1 2014 (over AED 9 billion) is 43 per cent
higher than the same period in 2013 (over AED 6.3 billion).
• Currently, more than 117,000 sq. ft. of additional commercial space is available for immediate leasing in Dubai.
• Took its subsidiary EMG to IPO through a secondary offering of shares and raised AED 5.8 billion (US $ 1.6
billion) by divesting 15.4% of its shareholding, marking one of the largest public offerings in the region since
2008. The shares were listed on DFM and started trading on 2 October 2014.
• The Hospitality and Malls subsidiaries contributed nearly 52% of the Group’s revenue.
• Hospitality: The Address Hotels & Resorts maintained an average occupancy of 89% in H1 2014 and recorded
increase in revenue by 16% as compared to H1 2013.
• Malls: Average Footfall of 6.59 million per month in Dubai Mall totaling approx 40 million visitors in H1 2014.
Retail sales in the mall increased by 18% in H1 2014 Y-o-Y.
• International: Handover of RE units in Egypt (Marassi, Uptown Cairo & Mivida), The Kingdom of Saudi Arabia
(Jeddah Gate & Khobar Lakes), Lebanon (Beit Misk), Morocco (Hattan), Pakistan (Mirador), Turkey (Tuscan
Valley) and USA (Beverly West) in H1 2014.

© Emaar 2014
EMAAR Group H1 2014 Performance Highlights Cont’d
1. The Fair value of total assets is as at 31 December 2013 except for Emaar Mallls assets which is being valued based on its share
price of AED 3.28 per share as on 7 October 2014.
2. Fair value of Development Properties as at 31 December 2013.
Profitability for the period ended 30th June 2014 |
• Revenues for H1 2014 were AED 5.06 bn (versus H1 2013 AED 5.22 bn)
• Net Operating Profit of H1 2014 was AED 1.73 bn (versus H1 2013 AED 1.23 bn)
Balance Sheet as at 30th June 2014 | remains robust
• Total Assets at AED 71.57 bn (fair value of AED 140.2 bn)1
• Investment properties and fixed assets at AED 15.90 bn
• Development Properties at AED 26.68 bn (fair value of AED 68.1 bn)2
• Consolidated Group Debt at AED 11.27 bn (31 Dec 2013: AED 11.73 bn) as International
RE development expansion was funded through local borrowings. Net cash at AED 3.46 bn
(31 Dec 2013: net debt at AED 1.94 bn)
7 Note: Please refer to the summarised financials for the period ended 30 June 2014

© Emaar 2014
EMAAR Key Group Divisions
Provide stable and recurring revenue
generation Growth Engine
Property
Development
UAE
Property
Development
International
Malls
and
Retail
•Market leading developer
in Dubai Developer of the
flagship project Burj Khalifa
•Forming JVs with strong
local partners with sizable
land bank
•Active in 10 targeted
high growth countries
•Forming JVs with
strong local partners to
leverage off local
expertise
•Current retail space of
over 690,000
sqm GLA
•Listed EMG through an
IPO
Hotels
Resorts &
Hospitality
•Developer, owner
and manager of Armani
branded hotels and
resorts (1st Armani
Hotel in Burj Khalifa
and the 2nd Armani
opened in Milan)
•Own 5 star premium
global brand “The
Address Hotels and
Resorts”
•Own 4 star premium
upscale global brand
“Vida Hotels and
Resorts”
•Launched an
affordable-stylish hotel
brand “Dubai Inn”
•12 hotels (Over 1900
keys)
8

© Emaar 2014
Strong Record of Execution
9
Note:
1. Emaar had delivered over 33,000 residential units in UAE (including Umm Al Quwain) and approx 4,800
residential units in its international markets.
2. In addition, Emaar had also delivered more than 2.4 million Sq. Ft. of commercial space of which more than
693 thousands Sq. Ft. were delivered in international markets.
-
5,000
10,000
15,000
20,000
25,000
30,000
35,000
40,000
2005 2006 2007 2008 2009 2010 2011 2012 2013 2014
8,048 10,227 13,185 14,226 14,736 14,879 15,211 15,488 15,874 16,194
4,870 5,965
8,217
12,152 14,686
17,794 18,289 19,791 21,477 21,694
Villas Apartments
16,19212,918
32,673
21,402
26,378
29,454
33,500 35,279
37,35137,888

© Emaar 2014
INVESTMENT HIGHLIGHTS
10

© Emaar 2014
(AED million)
Shareholder’s Value – NAV Computation
Fair valuation is carried out by CBRE, DTZ and other reputed valuers for development properties (including land), investment properties and revenue
generating fixed assets.
11
1. Book value and fair value of individual assets item does not include EMG, the fair value of which is based on the share
price as on 7 October 2014 and disclosed seperately.
2. Fair value based on its share price of AED 3.28 per share as of 7 October 2014.
3. Number of shares outstanding as at 30 June 2014.
Book value Fair value Book value Fair value
Cash and bank balances 7,210 7,210 3,711 3,711
Trade and other receivables 3,220 3,220 3,559 3,559
Development properties 25,867 68,092 26,998 43,181
Investment in associates 5,820 6,982 6,428 6,351
Securities and loans to associates 5,305 5,305 4,369 4,369
Investment properties 561 1,399 7,831 16,112
Fixed assets 7,713 11,817 8,209 10,519
Goodwill 46 46 46 46
Emaar Malls - Market Cap (2) 9,190 42,687 - -
Total assets 64,932 146,758 61,151 87,848
Total liabilities (incl. minority interest) (30,390) (46,278) (28,617) (29,220)
Net Asset Value 34,542 100,480 32,534 58,628
Number of Shares Outstanding (in Million) 7160 (3)
7160 (3) 6,091 6,091
Net Asset Value per Share (AED) 4.8 14.0 5.3 9.6
2013 1 2012

© Emaar 2014
Shareholder’s Value – NAV Computation
Fair valuation is carried out by CBRE, DTZ and other reputed valuers for development properties (including land), investment properties and revenue generating
fixed assets
12
(AED million)
1. Fair value of investment properties in excess of book value does not include EMG.
2. The fair value of EMG is based on the share price as on 7 October 2014.
3. Number of shares outstanding as at 30 June 2014.
2013 2012
Net Asset Value as per consolidated balance
sheet
34,542 32,534
Add: Fair value in excess of book value for
Development properties
32,960 15,547
Add: Fair value of assets in excess of book value
for Investment Properties 1
838 8,281
Add: Fair value of assets in excess of book value
for Fixed Assets
4,105 2,310
Add: Fair value investment in listed associates in
excess of the book value
1,100 (45)
Add: Market Capitalisation of Emaar Malls in
excess of the book value 2
26,936 -
Net Asset Value (Fair Value) 100,480 58,628
Number of Shares Outstanding (in Million) 7,160 3 6,091
Net Asset Value per Share (AED) 14.0 9.6
© Emaar 2014
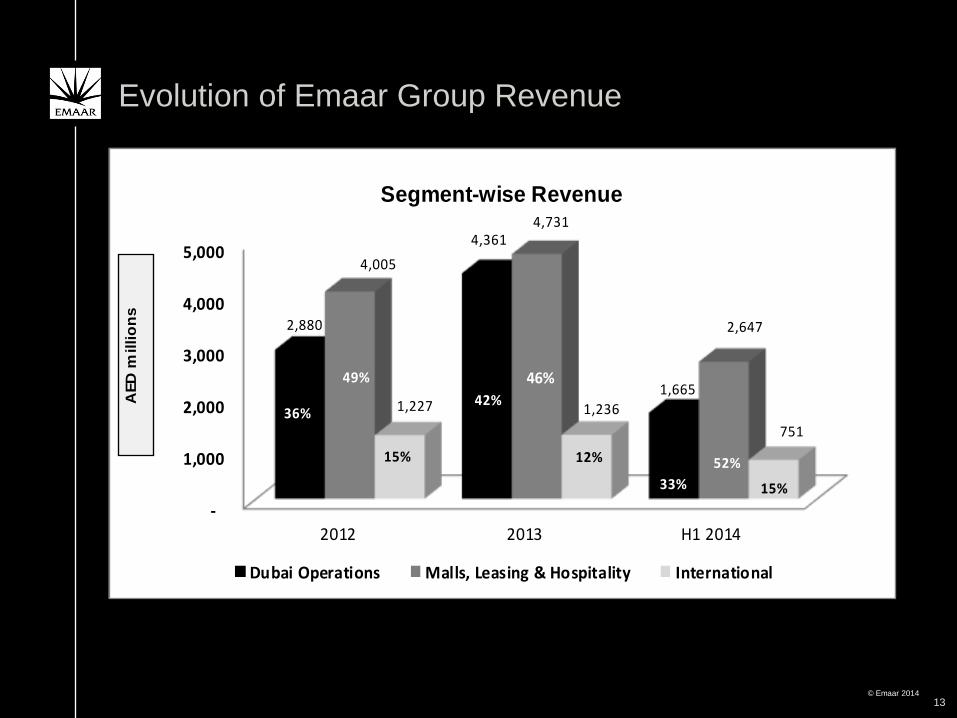
Evolution of Emaar Group Revenue
13
-
1,000
2,000
3,000
4,000
5,000
2012 2013 H1 2014
2,880
4,361
1,665
4,005
4,731
2,647
1,227 1,236
751
Dubai Operations Malls, Leasing & Hospitality International
AED
millio
ns
36%
15%
42%
46%
12%
Segment-wise Revenue
33%
52%
15%
49%

© Emaar 2014
Fair Value of Development Properties
Note : The India numbers include the JV with APIIC , Hyderabad only and does not include Emaar MGF.
14
(AED million)
Book value Fair value Book value Fair value
UAE 12,562 43,777 13,653 19,195
Egypt 5,758 13,167 5,700 13,553
India 52 52 77 77
Turkey 3,354 4,147 3,160 3,848
KSA 1,553 2,211 1,574 2,527
Pakistan 714 2,120 757 1,341
Canada & USA 682 682 898 898
Lebanon 581 1,014 407 712
Syria 162 162 280 280
Morocco 449 761 492 751
Total Value 25,867 68,092 26,998 43,181
20122013
© Emaar 2014
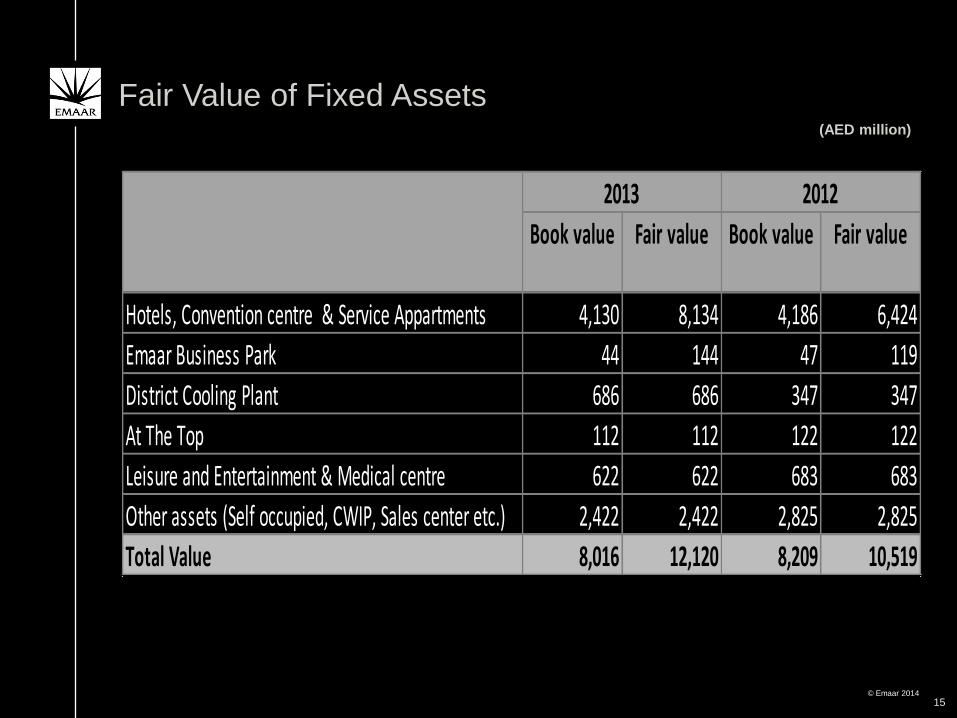
Fair Value of Fixed Assets
15
(AED million)
Book value Fair value Book value Fair value
Hotels, Convention centre & Service Appartments 4,130 8,134 4,186 6,424
Emaar Business Park 44 144 47 119
District Cooling Plant 686 686 347 347
At The Top 112 112 122 122
Leisure and Entertainment & Medical centre 622 622 683 683
Other assets (Self occupied, CWIP, Sales center etc.) 2,422 2,422 2,825 2,825
Total Value 8,016 12,120 8,209 10,519
20122013

© Emaar 2014
Shareholders’ Value
16
333131
29
35
59
505254
100
9.61
8.238.798.58
14
0
10
20
30
40
50
60
70
80
90
100
2009 2010 2011 2012 2013
Year
AE
D b
illio
ns
0
2
4
6
8
10
12
14
16
18
20
AE
D p
er
sh
are Shareholders' equity as per audited
financial statements
Net asset value (including FV of DP,
Assets, market value of listed securites
and market capitalisation of Emaar Malls)
Net asset value per share

© Emaar 2014
UAE OPERATIONS
17

© Emaar 2014
• Government Support: Historic land grants and 29.22% shareholding
Property Development: UAE
• Partnership with Quality
Contractors:
Arabtec, Multiplex, Samsung, Al Futtaim Carillion,
Arabian Construction Company
• Established Reputation: Timely deliveries of high quality properties
• Track Record:(1) 33,095 residential properties delivered up to H1 2014
(12,598 Villas and 20,497 Apartments)
More than 1.7 million sq ft of commercial space
delivered up to the end of H1 2014
(1) Including Umm Al Quwain
18
• Strategic Partnership with
reputed Developers:
Meraas Holding, Dubai Holding, Dubai Properties
Group, Dubai World Central.

© Emaar 2014
Dubai RE – Key Strengths • All Dubai RE projects currently under construction have been substantially sold. Recoveries remain
strong as evident from increased revenues. • Pre-sales model utilised, with cash inflows from customers’ instalments financing the bulk of
constructions costs.
• Conservative construction methodology—if sufficient pre-sales levels are not achieved, projects are rescheduled. Contracts signed with contractors provide Emaar with the flexibility to reschedule projects / development phases without incurring material costs / charges from contractors for work which may potentially not go ahead.
• More than 97% of the total units launched in 2013 & 2014 have been sold*.
• Emaar’s developments in Dubai are located in prime locations which will be the focus of the majority of sales activity in the coming years.
• Emaar unveiled projects over 5,700 apartments, townhouses, villas and plots during 2013 & 2014*:
− In 2013: The Address The Fountain Views I, II & III (786 serviced apartments and 194 hotel rooms), The Address The Sky Views I & II (531 serviced apartments), Burj Vista (651 apartments) in Downtown Dubai, The Hills (426 apartments) and Vida Residences (136 apartments) in Emirates Living, Palma (121 villas) and Rosa (144 villas) in Arabian Ranches II and Grove & Views plots (20 plots) in Dubai Hills Estate.
− In 2014: Boulevard Crescent (307 apartments), Boulevard Point (311 apartments), Vida Downtown (335 serviced apartments), Operah Grand (249 apartments), Boulevard Heights (255 apartments), in Downtown Dubai, Aseel (55 plots), La Avenida 2 (33 villas) in Arabian Ranches I, Lila (219 villas), Rasha (140 villas), Yasmin (98 villas), Samara (177 villas) in Arabian Ranches II, Grove & Views plots (78 plots) and Mulberry Park Heights (664 apartments) in Dubai Hills Estate.
• All launches have witnessed an excellent response from investors and end users. The total sales value
in Dubai during H1 2014 (over AED 9 billion) is 43 per cent higher than the same period in 2013 (over
AED 6.3 billion).
* As of end of September 2014
19

© Emaar 2014
Regional Business Highlights
20
2017 deliveries are based on projects launched till 30 June 2014; this will change with additional launches
Projects Completed Units under
development
Deliveries till
2013
Deliveries
2014
Deliveries
2015
Deliveries
2016
Deliveries
2017
Downtown Development 9,880 3,688 9,880 - 533 1,224 1,931
Downtown Commercial spaces (sq ft) 2,860,476 - 2,860,476 - - - -
Dubai Marina 4,450 - 4,450 - - - -
Dubai Marina Commercial spaces (sq ft) 768,385 - 768,385 - - - -
Arabian Ranches 4,210 150 4,210 150 - - -
Arabian Ranches II - 1,152 - 253 121 144 634
Emirates Living (excl land) 14,146 786 14,146 224 - 562 -
Emaar Towers 168 - 168 - - - -
Dubai Hills Estate - 761 - - 97 664
Umm Al Quwain 277 - 277 - - - -
Grand Total (Excluding comm. units) 33,131 6,537 33,131 627 654 2,027 3,229
Grand Total (Comm. Spaces-sq fts) 3,628,861 - 3,628,861 - - - -

© Emaar 2014
INTERNATIONAL OPERATIONS

© Emaar 2014
Key International RE Markets–Unit Sales to Date
Emaar has achieved an overall sales level of 83% in its key International markets
As of 30 June 2014
Country EntityUnits
Released
Unit Sale
achieved
% sales
achieved
Egypt Emaar Misr for Development S.A.E. 5,651 5,295 94%
KSA Emaar Middle East 719 657 91%
Syria Emaar IGO 905 707 78%
Turkey Emaar Turkey 722 568 79%
Lebanon Metn Renaissance Holding 488 379 78%
Pakistan Emaar GIGA Karachi Limited 1050 334 32%
Associate India EMGF 20,437 16,958 83%
Grand Total 29,972 24,898 83%
Subsidiaries

© Emaar 2014
Key International Markets - Business Highlights
As of 30 June 2014
Country EntityUnits
Completed
Units
Currently
Under
Development
To be
Developed
(Launches in
2014-2016)
Actual
Deliveries till
2013
Deliveries
2014
Deliveries
2015
Deliveries
2016
Subsidiaries
Egypt Emaar Misr 1,320 2,968 4,249 860 933 723 1,191
KSA Emaar Middle East 515 348 1,518 311 57 107 374
Syria Emaar IGO 444 461 284 419 - 97 189
Turkey Turkey (TV & NID) 232 1,063 - 151 72 286 287
Lebanon Metn Renaissance 200 201 492 113 139 112 20
PakistanEmaar GIGA Karachi
Limited- 1,065 3,173 - - - 280
Total 2,711 6,106 9,716 1,854 1,201 1,325 2,341
Associates
India EMGF 5,007 11,226 3,370 1,403 4,103 4,431 1,975
Grand Total 7,718 17,332 13,086 3,257 5,304 5,756 4,316

© Emaar 2014
International RE – Key Strengths
• Successful expansion of Emaar’s RE development model to several International locations. This has enabled Emaar to grow simultaneously while limiting concentration risk on the Dubai real estate market.
• For the International RE developments, Emaar has acquired its land (solely and with JV partners). Most of Emaar’s International land bank has already been paid for.
• Available land bank of 214M sqm in key international markets.
• Despite market conditions, Emaar successfully concluded a number of development launches Internationally and with enhanced Emaar brand awareness, Emaar remains confident of the success of the new launches over the forecast period.

© Emaar 2014
International RE – Key Strengths – contd. • A number of large projects are coming on line, each with localised demand and
supply characteristics:
• EME – Several projects are under development, with over 710 units successfully
launched to date. Additional launches of residential units and commercial space are
in the pipeline.
• Egypt – Demand characteristics are solid, with a growing population and a lack of
quality supply. Emaar has three projects under construction, with more than 5,290
units sold to date. Achieved sales of AED 1.56 Billion in H1-2014 with growth of
127% against H1-2013.
• Turkey – Sales in Emaar Square project in Istanbul commenced in January 2013 and
received strong positive response for both residential units and retail space.
Construction activities are progressing as planned. Achieved 64% pre-lease of the
Mall retail area till date by top international and local brands.
• Lebanon - Launches of new phase (MiskTown) had taken place in Q3-2013.
Continuing with the handover of sold and completed BeitMisk phase one.
Construction is progressing in phases two and three with phase two expected to be
completed by 2014.
• Pakistan – Launch of villas plots in Islamabad – Canyon Views project attracted
many customers with significant number of the launched plots already sold. In
addition, further launches of residential and commercial units are planned during the
next few quarters. Karachi – Crescent Bay project: three launch events took place
since December 2013 and were positively received by the customers.

© Emaar 2014
SEGMENTS
26

© Emaar 2014
Malls – Key Strengths
27
• Significant Gross Leasable Area (“GLA”) – All Dubai-based Mall assets are now open (5.9 m
Sq Ft of GLA), with Total GLA Occupancy at 95% (Jun 2014).
• The Dubai Mall - Opened in Nov-08 and is one of the largest malls in the world (3.7m sq ft
GLA). GLA occupancy at 99% (Jun 2014).
• Preferable Lease Terms - Non-anchor tenants on 3-5 year lease contracts while anchor tenants
on 10–20 year tenancy agreements. Rentals are submitted in advance of lease year (PDCs) and
additional security deposits covering three month rent are held from all lessees.
• Significant and Growing Footfall - Dubai Mall is now the busiest mall in Dubai (measured by
footfall) and the most visited tourist destination in the World. Dubai mall achieved a footfall of 40
million visitors in the first half of 2014, registering a 3% increase compared to the same period in
2013. Overall footfall trends remain positive across the Malls division.
• Diversified Lease Payment Risk – Lease payment risk diversified across a significant number
of tenants. Key anchor tenants comprise large regional and international entities.
• High Margin Assets and strong collection rates - Mall assets generate significant cash
inflows as a result of low maintenance CAPEX and operational expenses, with no negligible
delays on lease payments on any of the EMG assets in Dubai.
• Active Tenant Management – Total increase in contractual/base rent of over AED 88 M
achieved for The Dubai Mall alone; increase of contractual base rent in renewal negotiations with
30% upside vs. last base rent achieved during H1 2014.

© Emaar 2014
Malls – Key Strengths (Cont’d)
28
• Exclusive Tenants - Several exclusive tenants who do not have retail outlets anywhere else in
the UAE / GCC including Bloomingdales and Galleries Lafayette.
• Dubai Mall is being expanded with additional leasable area of approximately 15% of the current
mall. The expansion is likely to be completed by beginning 2016 and will primarily house the
International Fashion Brands. The Dubai Mall accounts for about half of all luxury goods
purchases in the emirate, according to a study by Bain & Company.
• Retail Attractions - Below retail attractions provide impetus in terms of both footfall and
revenues:
- Reel Cinema 28 Screen Cineplex (the largest and No. 1 cinema in Dubai based on
admissions)
- SEGA Republic (76,000 sqft indoor theme park)
- Indoor Aquarium
- Olympic size Ice Rink
- Kidzania (children’s entertainment facility)
• Financial Highlights
- Malls and Retail achieved revenues of AED 1.5 Billion in H1 2014 (excluding At the Top and
Commercial Leasing), an increase of 12% over H1 2013
- Malls and Retail achieved EBITDA of AED 1.1 billion in H1 2014 (excluding At the Top and
Commercial Leasing), an increase of 22% over H1 2013

© Emaar 2014
Dubai Mall Footfall Trend
29

© Emaar 2014
Current Projects Management
Company Category
Capacity Operational
Rooms
Milan
Armani Hotel Milan at Via Manzoni AHM(1) 5 Star 95 2011
Dubai
Armani Hotel Dubai at Burj Khalifa AHM(1) 5 Star 160 2010
The Address Downtown Dubai TAH&R(2) 5 Star 196 2008
Manzil Downtown Dubai Emaar Hospitality 4 Star 197 2007
Vida Downtown Dubai(3) Emaar Hospitality 4 Star 156(3) 2007
The Palace Downtown Dubai TAH&R(2) 5 Star 242 2007
The Address Dubai Mall TAH&R(2) 5 Star 244 2009
The Address Dubai Marina TAH&R(2) 5 Star 200 2009
The Address Montgomerie Dubai TAH&R(2) Standard 21 2006
Arabian Ranches Golf Club Emaar Hospitality Standard 11 2007
Nuran Marina Residences(4) Nuran Standard 90 2006
(1) AHM – Alabbar Hotel Management
(2) TAH&R – The Address Hotels and Resorts
(3) Formerly Qamardeen Hotel – Re-open as Vida Downtown Dubai on 16th June 2013
(4) Nuran Marina – management rights only, disposed ownership interest on 7th June 2012
Emaar Hospitality Group
30

© Emaar 2014
Emaar Hospitality Group
31
YTD June 14'
The
Address The Palace
The
Address
The
Address
Downtown Downtown Dubai Mall
Dubai
Marina
Avail. room nights 35,476 43,802 44,164 36,200 35,657 28,236
Occupancy % 89% 86% 90% 88% 84% 83%
ADR (AED) 2,012 1,709 1,688 1,098 981 1,014
RevPar (AED) 1,801 1,477 1,515 970 829 844
Room Revenue
(AED thousands) 63,876 64,716 66,915 35,111 29,547 23,819
YTD June 13'
The
Address The Palace
The
Address
The
Address
Downtown Downtown Dubai Mall
Dubai
Marina
Avail. room nights 35,476 43,802 44,164 36,200 35,657 2,340
Occupancy % 91% 89% 89% 89% 91% 45%
ADR (AED) 1,784 1,442 1,555 988 901 730
RevPar (AED) 1,628 1,278 1,377 883 822 326
Room Revenue
(AED thousands) 57,739 55,972 60,799 31,973 29,309 763
Al Manzil
Vida
Downtown
Al Manzil
Vida
Downtown

© Emaar 2014
Emaar Hospitality – Key Strengths
Portfolio of Hospitality Brands:
The Hospitality Division has successfully developed recognisable brands for the different
categories of assets which have driven the creation of brand equity. It has also the license rights
of the “Armani” brand for development of a separate chain of hotels and resorts which aims to
drive additional premium to the real estate value. Wholly owned brands include “The Address”,
“The Palace” and “Nuran” for its hotels, resorts and serviced residences and a new 4-star hotel
brand of its own – “VIDA”, launched last year for the purpose of rebranding and re-opening of the
former Qamardeen Hotel, now known as “Vida Downtown Dubai”.
Portfolio of Operating Assets:
The Hospitality Division carries a portfolio of high quality hospitality assets and undertakes pro-
active asset management functions since its inception. These assets include (a) six 5-star hotels
at Downtown Dubai, Dubai Marina and Milan Italy, and one golf retreat in Emirates Hills, which
are managed in arm’s length under the respective management companies it owns for “The
Address” and “Armani”, (b) the two 4-star hotels at Downtown Dubai under the name “Manzil” and
“Vida” which will be managed directly by new upscale hospitality brand – VIDA Hotels & Resorts
under Emaar Hospitality and (c) a serviced apartment operation which is owned by a 3rd party at
Dubai Marina but managed by our subsidiary Nuran LLC.
32

© Emaar 2014
Emaar Hospitality – Key Strengths (Cont’d)
High Margin Lease Income:
The operations of Nuran Serviced Apartments had generated regular, high margin annuity income
from low maintenance prime assets in Dubai. Though such streams of income have now ceased
with the sale of Nuran Greens and Nuran Marina to 3rd parties in September 2013 and June 2012
respectively, with the latter still being managed by Nuran LLC under short-term management
contracts.
Key Leisure and F&B Assets:
Hospitality Division also manages multiple leisure and F&B assets across Dubai complementing
the residential lifestyle offering of Emaar Properties, including the Leisure Division which has 2
golf clubs, a Polo & Equestrian Club and a Yacht Club as well as the Lifestyle Dining Division
running various F&B concepts like At.mosphere Grill & Lounge, Pavilion, Madeleine Café &
Boulangerie, Palace Café and La Serre Bistro & Boulangerie.
Partnership with strong and reputable restaurateurs like Wolfgang Puck with the recent opening
of CUT Restaurant at The Address Downtown Dubai has provided an uplift to the overall value
proposition to our valuable customers. The opening of ‘The Burj Club’ last year at Burj Khalifa
aims to provide a world class health club and spa experience as a part of our lifestyle offerings.
Businesses with a high proportion of Dubai-residents in their customer base have provided well
balanced exposure for the group since the traditional hotel assets are targeted at mostly transient
visitors to Dubai, thus further diversifying Emaar’s income streams.
33

© Emaar 2014
FINANCIAL HIGHLIGHTS
34

© Emaar 2014
Financial Performance – AED millions
35
Q2-14 Q1-14 % Q2-14 Q2-13 %YTD June
2014
YTD June
2013%
Revenue 2,807 2,256 24% 2,807 3,109 (10%) 5,063 5,219 (3%)
Gross Profit 1,726 1,441 20% 1,726 1,367 26% 3,167 2,484 27%
SGA (659) (620) 6% (659) (577) 14% (1,279) (1,108) 15%
Other (expense)/income (12) 162 (107%) (12) (34) (65%) 150 (53) (383%)
Associates 7 (16) 144% 7 (63) 111% (9) (82) (89%)
Income Tax 2 (1) 300% 2 (12) 117% 1 (8) 106%
Minority interest (196) (103) 90% (196) (6) 3167% (299) (2) (14850%)
Net Profit/ (loss) 868 863 1% 868 675 29% 1,731 1,231 41%
Earnings per share (AED) 0.13 0.13 - 0.13 0.11 18% 0.26 0.20 30%
© Emaar 2014
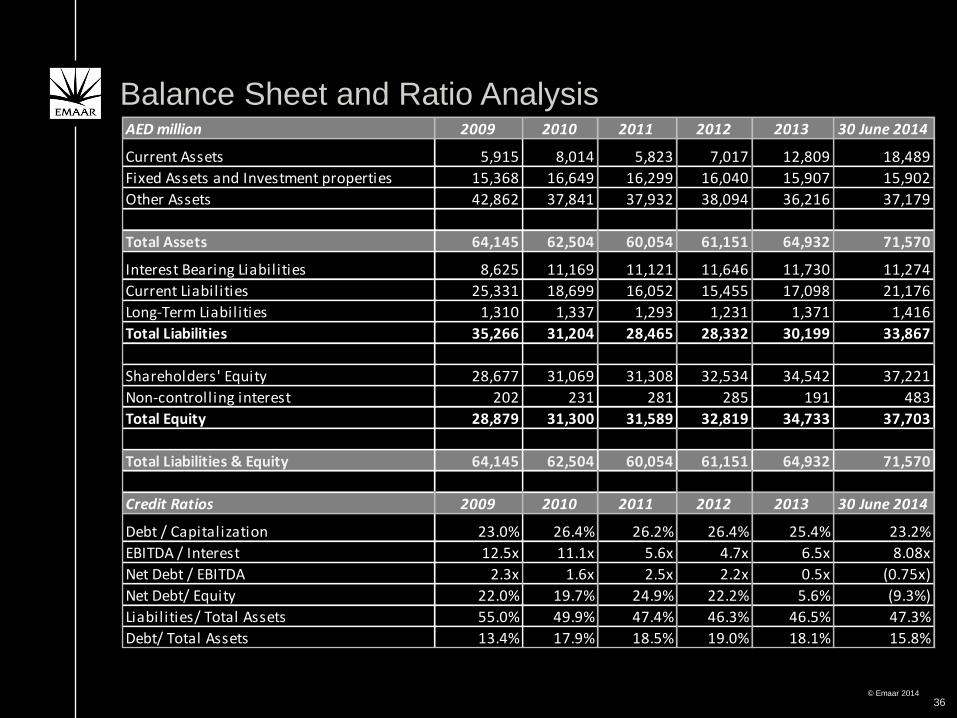
Balance Sheet and Ratio Analysis
36
AED million 2009 2010 2011 2012 2013 30 June 2014
Current Assets 5,915 8,014 5,823 7,017 12,809 18,489
Fixed Assets and Investment properties 15,368 16,649 16,299 16,040 15,907 15,902
Other Assets 42,862 37,841 37,932 38,094 36,216 37,179
Total Assets 64,145 62,504 60,054 61,151 64,932 71,570
Interest Bearing Liabilities 8,625 11,169 11,121 11,646 11,730 11,274
Current Liabilities 25,331 18,699 16,052 15,455 17,098 21,176
Long-Term Liabilities 1,310 1,337 1,293 1,231 1,371 1,416
Total Liabilities 35,266 31,204 28,465 28,332 30,199 33,867
Shareholders' Equity 28,677 31,069 31,308 32,534 34,542 37,221
Non-controlling interest 202 231 281 285 191 483
Total Equity 28,879 31,300 31,589 32,819 34,733 37,703
Total Liabilities & Equity 64,145 62,504 60,054 61,151 64,932 71,570
Credit Ratios 2009 2010 2011 2012 2013 30 June 2014
Debt / Capitalization 23.0% 26.4% 26.2% 26.4% 25.4% 23.2%
EBITDA / Interest 12.5x 11.1x 5.6x 4.7x 6.5x 8.08x
Net Debt / EBITDA 2.3x 1.6x 2.5x 2.2x 0.5x (0.75x)
Net Debt/ Equity 22.0% 19.7% 24.9% 22.2% 5.6% (9.3%)
Liabilities/ Total Assets 55.0% 49.9% 47.4% 46.3% 46.5% 47.3%
Debt/ Total Assets 13.4% 17.9% 18.5% 19.0% 18.1% 15.8%

© Emaar 2014
THANK YOU
37

© Emaar 2014
APPENDIX
38
© Emaar 2014
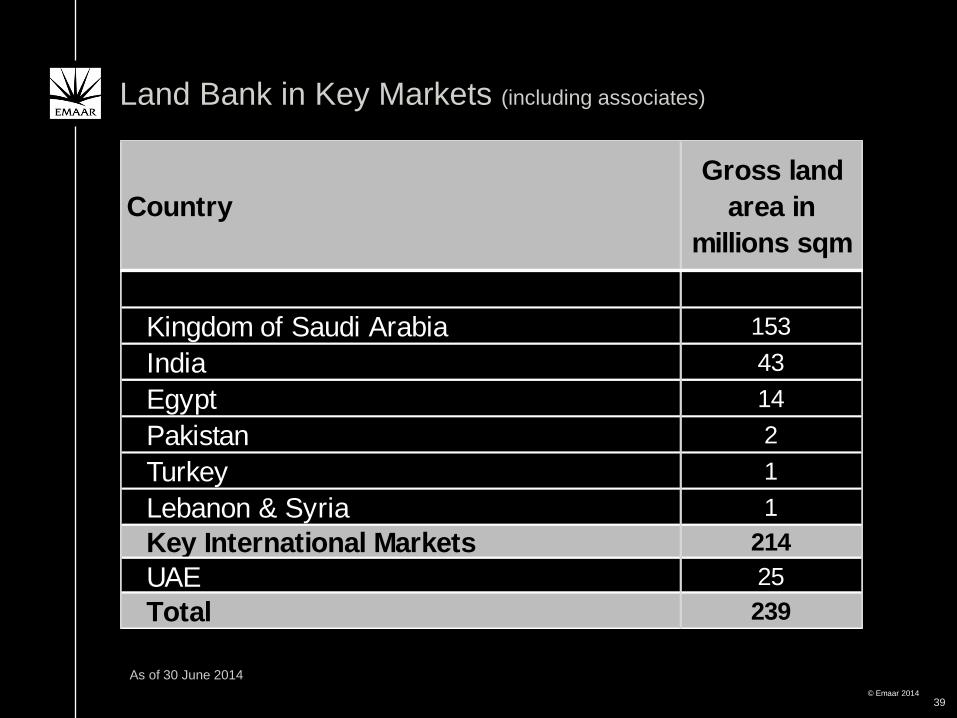
Land Bank in Key Markets (including associates)
39
As of 30 June 2014
Kingdom of Saudi Arabia 153
India 43
Egypt 14
Pakistan 2
Turkey 1
Lebanon & Syria 1
Key International Markets 214
UAE 25
Total 239
Country
Gross land
area in
millions sqm

© Emaar 2014
Board of Directors
Chairman: Mohamed Ali Alabbar
Vice Chairman: Hussain Al Qemzi
Managing Director: Ahmad Al Matrooshi
Abdulla Lahej Group CEO
Amit Jain
Group CFO
Robert Booth
CEO Real Estate
Emaar Dubai
Arif Amiri – Chief
Commercial
Officer
Ayman Hamdy Company Secretary & Executive Director
Legal
Other
Businesses
Nasser Rafi—CEO Malls
Maitha Dossari— CEO, Retail
Philippe Zuber—COO Hospitality and
Emaar Hotels & Resorts
The above only includes the key persons at the group level; kindly refer to our website www.emaar.com for full management structure and profiles.
Experienced & Highly Qualified Management Team
40

© Emaar 2014
EMAAR
PROPERTIES
PJSC
KSA - EEC
30.59%
MGF-India
48.86%
Syria
60%
Turkey
100%
Canada
100%
Lebanon
65%
Turner Int’l ME
50%
Emaar Retail LLC
100%
HOTELS &
RESORTS
100%
HOSPITALITY
100% MALLS
84.6%
Industries & Investments
40%
EMAAR
INTERNATIONAL EMAAR
INVESTMENTS
KSA - EME
61%
Pakistan
EGKL -73.1%
EDIL – 66.7%
APIC-India
74%
EMAAR DUBAI
Property Development
Projects - 100%
Group Structure
Emrill Services
33.33%
District Cooling
100%
Capital Partner
100%
Emaar America
100%
Dead Sea Co. of
Tourism 29.33%
Amlak
48.08%
Dubai Mall
100%
Emaar Retail
100%
Int’l Malls
100%
Giorgio Armani
Hotels 100%
Misr - Egypt
100%
Int’l Jordan
100%
41
Nuran LLC
100%
The Address Hotels 100%
Emaar Hotel Management
100%
Emaar Leisure Group 100%
Emaar Int’l Hospitality
100%
Morocco
100%
Vida Hotel +
Resorts
100%
Dubai Inn
50%
(JV with Meeras)
Dubai Hills Estate
50%
(JV with Meeras)
Emaar Bawadi
50%
(JV with Dubai
Properties)
MENA Hamptons
100%
Reel Cinema
100%

© Emaar 2014
Emaar Properties PJSC, for themselves and for Emaar Group, give notice that:
The particulars of this presentation do not constitute any part of an offer or a
contract.
Given that the presentation contains information based on forecasts and roll outs,
all statements contained in this presentation are made without responsibility on
the part of Emaar Properties PJSC, their advisors, or members of Emaar Group
(including their directors, officers and employees).
None of the statements contained in this presentation is to be relied upon as a
statement or representation of fact.
All parties must satisfy themselves as to the correctness of each of the
statements contained in this presentation.
Emaar Properties PJSC and members of the Emaar Group do not make or give,
and neither members of the Emaar Group nor any of their directors or officers or
persons in their employment or advisors has any authority to make or give, any
representation or warranty whatsoever in relation to this presentation.
This presentation may not be stored, copied, distributed, transmitted,
retransmitted or reproduced, in whole or in part, in any form or medium without
the permission of Emaar Properties PJSC.
Disclaimer
42

© Emaar 2014
Thank You
www.emaar.com
43


![[TRANSLATION FROM ARABIC] Emaar Properties PJSC Corporate ...](https://static.fdocuments.net/doc/165x107/61f0e875ec66ee0e72497ec3/translation-from-arabic-emaar-properties-pjsc-corporate-.jpg)