Elringklinger - Conference Call Q2 2014
22
Conference Call Results Q2 2014 August 7, 2014
-
Upload
company-spotlight -
Category
Investor Relations
-
view
449 -
download
2
description
Second Quarter 2014 Conference Call
Transcript of Elringklinger - Conference Call Q2 2014
Conference Call
Results Q2 2014
August 7, 2014

Group sales increased 12.6 % yoy to EUR 333.5 (296.1) mn; organic growth at
10.2 % again clearly outperforming world car production;
Higher share of tooling sales in preparation for ramp-ups
Sales up 2.9 % sequentially despite 4 days less of production (calendar effect)
Consolidation of EKMA in 2013 retroactively changed to equity method (IFRS 11)
resulting in slightly lower comparable sales and EBIT basis;
EKMA contributes an additional EUR 5.7 mn in sales in Q2 2014
Continued high pre-expenses and start-up losses in battery technology (EBIT
EUR -1.9 mn), slightly better than in Q1 (EBIT EUR -2.2 mn)
Hug delivered solid earnings up y-o-y (EBIT margin 20%+); however at a more
normalized level compared to Q1 (EUR 4.0 mn as compared to EUR 7.7 mn)
EBIT(=operating result) up by 1.2 % to EUR 41.5 (41.0) mn incl. EUR 0.9 mn
ppa on high previous year’s basis
Q2 2014: Key developments
2

H1 2014: China and USA drive global car markets –
BRI markets drop sharply, production in Brazil -17%
3
New car registrations H1 2014 (yoy change)
14.5%
11.0%
5.5%
4.3%
-3.2%
-7.3%
-7.6%
-10% -5% 0% 5% 10% 15% 20%
Russia
Brazil
India
USA
Western Europe
Japan
China
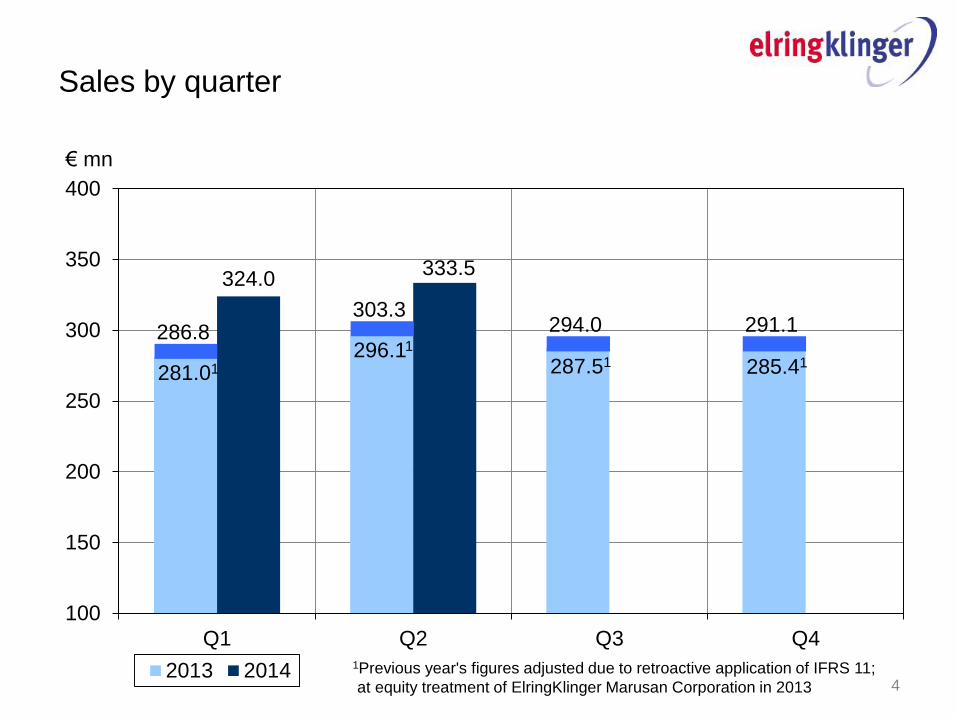
281.01 296.11
287.51 285.41
324.0 333.5
100
150
200
250
300
350
400
Q1 Q2 Q3 Q4
2013 2014
286.8 303.3
294.0 291.1
Sales by quarter
1Previous year's figures adjusted due to retroactive application of IFRS 11;
at equity treatment of ElringKlinger Marusan Corporation in 2013
€ mn
4
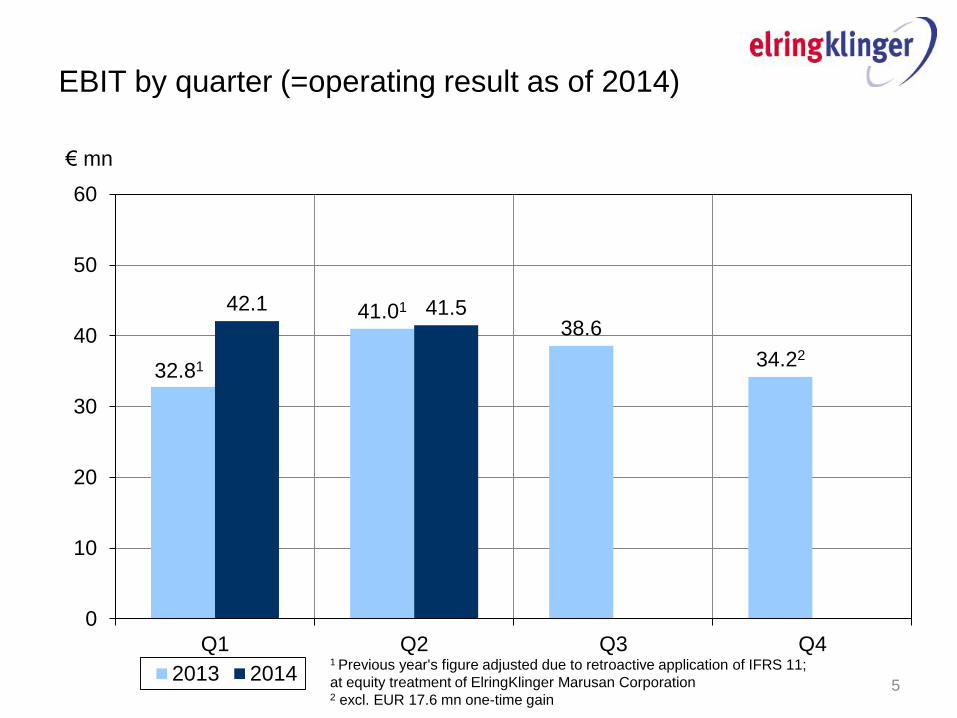
EBIT by quarter (=operating result as of 2014)
32.81
41.01 38.6
34.22
42.1 41.5
0
10
20
30
40
50
60
Q1 Q2 Q3 Q4
2013 2014
€ mn
5
1 Previous year's figure adjusted due to retroactive application of IFRS 11;
at equity treatment of ElringKlinger Marusan Corporation 2 excl. EUR 17.6 mn one-time gain

Q2 2014: OEM sales up 13.7 % driven by core
business, higher tooling sales, EKMA
241.21
274.2
0
100
200
300
400
2013 20141Previous year's figures adjusted due to retroactive application of IFRS 11;
at equity treatment of ElringKlinger Marusan Corporation (- EUR 7.2 mn) in Q2 2013
EBIT
30.5 (30.6)
€ mn
6

Q2 2014: Aftermarket sales up 14.8%
29.0
33.3
0
10
20
30
40
50
2013 2014
EBIT +15.3%
6.8 (5.9)
€ mn
7

Q2 2014: Sales Engineered Plastics down 0.9%
22.9 22.7
0
10
20
30
40
2013 2014
EBIT -12.2%
3.6 (4.1)
€ mn
8

Group Sales by segment Q2 2014 (py): OE share up
driven by structural growth and new product ramp-ups
Industrial Parks
0.3% (0.4%) Services
0.7% (0.7%)
OEM
82.2% (81.4%)
Engineered Plastics
6.8% (7.7%)
Aftermarket
10.0% (9.8%)
9
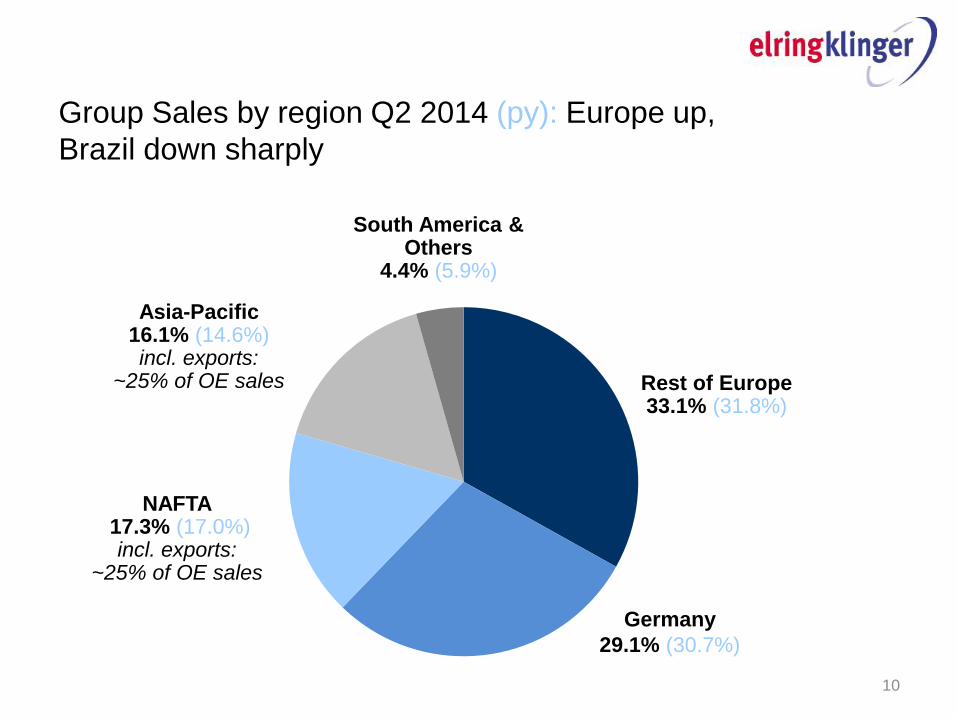
Group Sales by region Q2 2014 (py): Europe up,
Brazil down sharply
South America & Others
4.4% (5.9%)
Rest of Europe 33.1% (31.8%)
Germany
29.1% (30.7%)
Asia-Pacific 16.1% (14.6%) incl. exports:
~25% of OE sales
NAFTA 17.3% (17.0%)
incl. exports: ~25% of OE sales
10
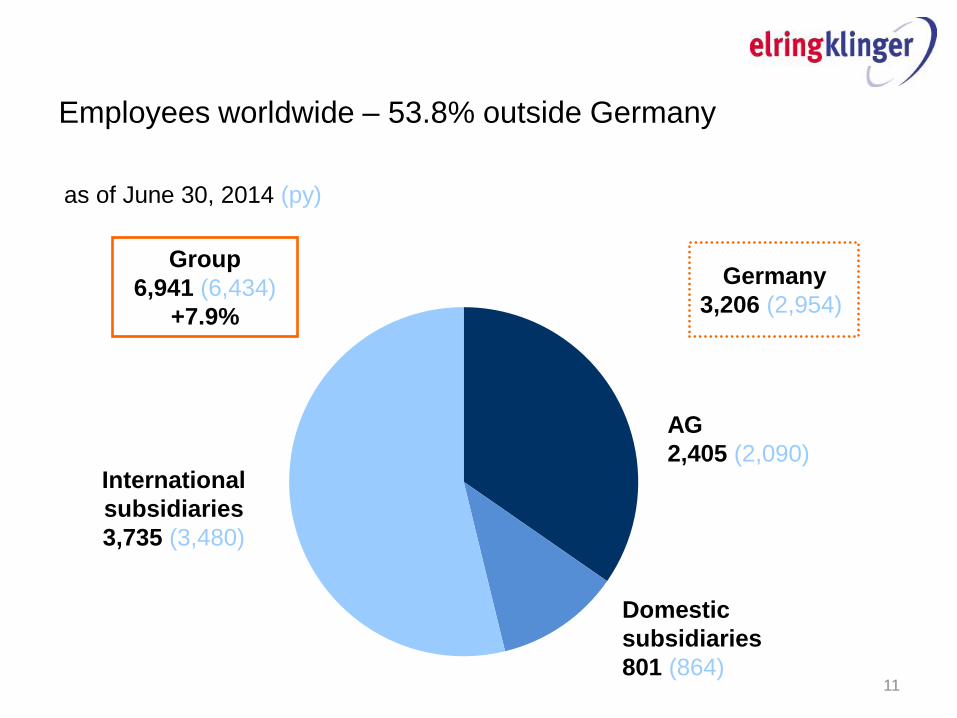
Employees worldwide – 53.8% outside Germany
AG
2,405 (2,090)
Domestic
subsidiaries
801 (864)
International
subsidiaries
3,735 (3,480)
Group
6,941 (6,434)
+7.9%
Germany
3,206 (2,954)
as of June 30, 2014 (py)
11

12
Q2 2014: Sequential improvement in net cash from
operating activities
€ mn
17.8 18.8
36.2 36.3
0
10
20
30
40
50
Q1 2013 Q1 2014 Q2 2013 Q2 2014
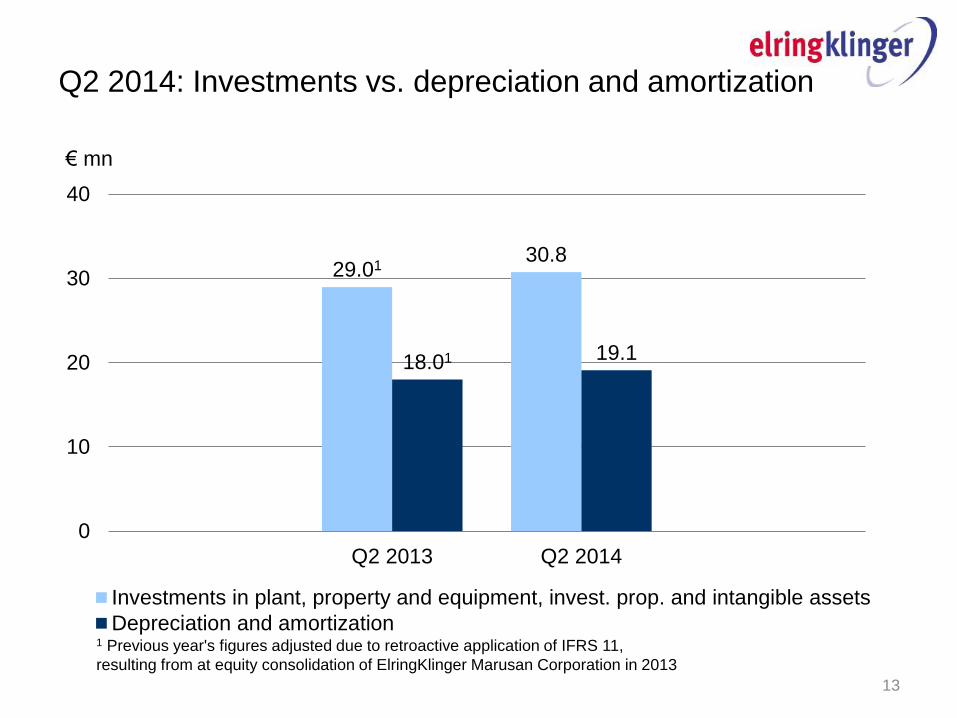
Q2 2014: Investments vs. depreciation and amortization
29.01 30.8
18.01 19.1
0
10
20
30
40
Q2 2013 Q2 2014
Investments in plant, property and equipment, invest. prop. and intangible assets
Depreciation and amortization1 Previous year's figures adjusted due to retroactive application of IFRS 11,
resulting from at equity consolidation of ElringKlinger Marusan Corporation in 2013
€ mn
13

14
Cash flow bridge first half 2014
62.9
+55.0
+33.6
-59.9
-32.8 60.1
0
40
80
120
160
200
Cash atDec 31,
2013
Net cashfrom
operatingactivities
Investments Dividendspaid
Change infinancialliabilities
Others Cash atJune 30,
2014
€ mn
1.3

41.5 42.5
26.7 24.1
58.5 57.5
24.6 26.1
48.7 49.8
June 30, 2013 June 30, 2014 June 30, 2013 June 30, 2014
Balance sheet structure as at June 30, 2014
Equity ratio slightly higher
Non-current liabilities
Current liabilities
Shareholder‘s equity Non-current assets
Current assets
Assets
in %
Liabilities and
shareholder’s equity in %
15
16
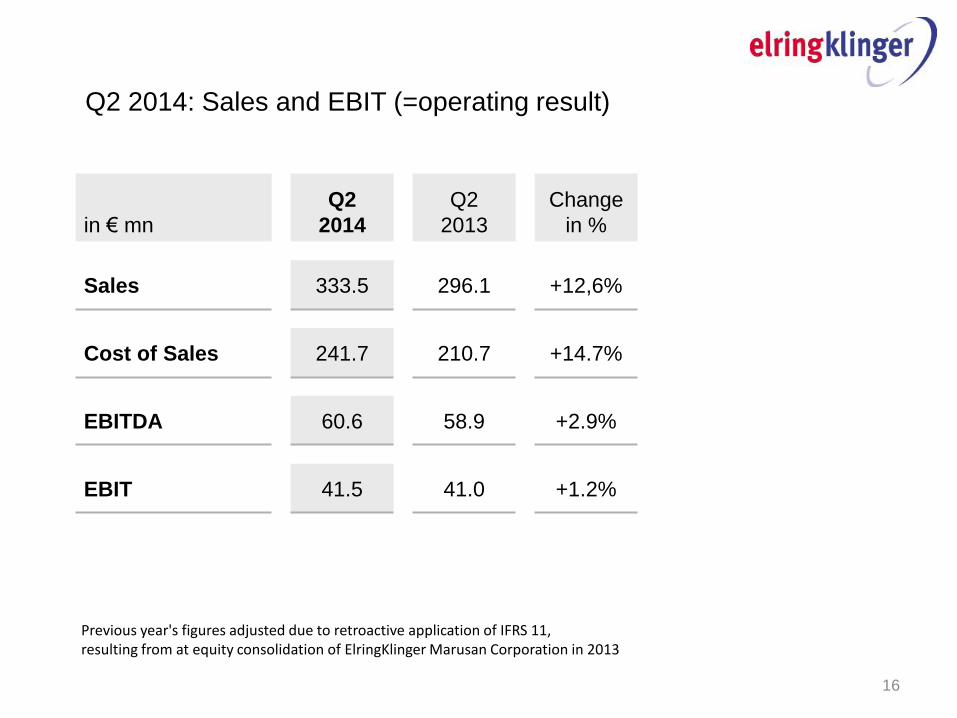
Q2 2014: Sales and EBIT (=operating result)
in € mn
Q2
2014
Q2
2013
Change
in %
Sales 333.5 296.1 +12,6%
Cost of Sales 241.7 210.7 +14.7%
EBITDA 60.6 58.9 +2.9%
EBIT 41.5 41.0 +1.2%
Previous year's figures adjusted due to retroactive application of IFRS 11, resulting from at equity consolidation of ElringKlinger Marusan Corporation in 2013
17
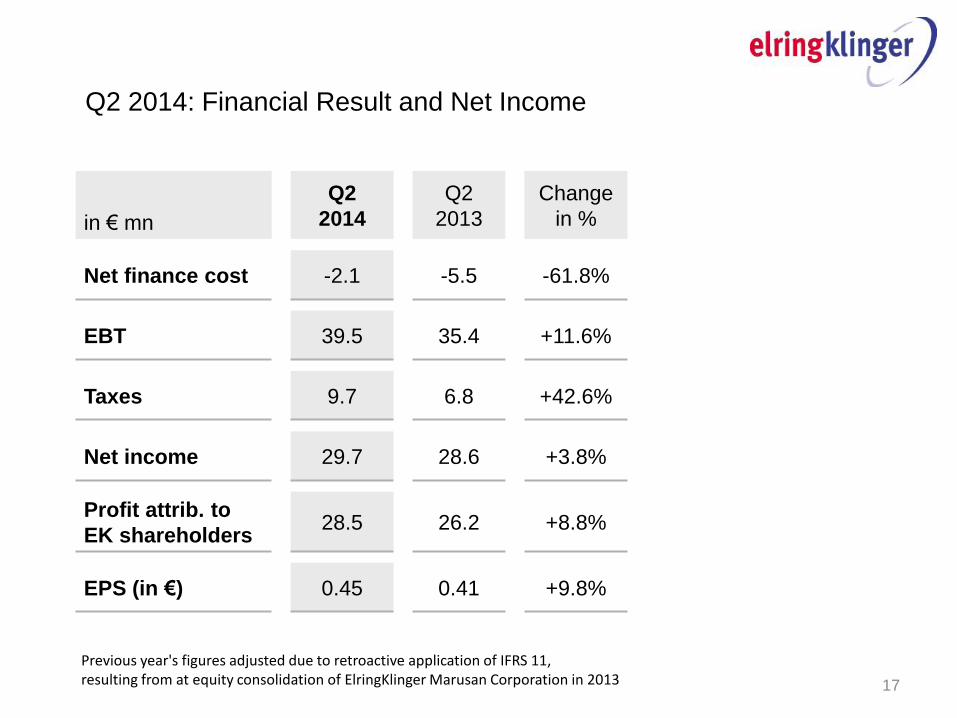
Q2 2014: Financial Result and Net Income
in € mn
Q2
2014
Q2
2013
Change
in %
Net finance cost -2.1 -5.5 -61.8%
EBT 39.5 35.4 +11.6%
Taxes 9.7 6.8 +42.6%
Net income 29.7 28.6 +3.8%
Profit attrib. to
EK shareholders 28.5 26.2 +8.8%
EPS (in €) 0.45 0.41 +9.8%
Previous year's figures adjusted due to retroactive application of IFRS 11, resulting from at equity consolidation of ElringKlinger Marusan Corporation in 2013

18
Q2 2014: Solid performance of Exhaust Gas Purification
division, following extraordinary Q1 2014
in € mn Hug Group
Q2
2014
Q2
2013
Q1
2014
∆ Q2
Sales 19.5 18.2 20.7 +1.3
EBIT 4.0 3.9 7.7 +0.1
PPA -0.3 -0.2 -0.3 -0.1
As expected, project-related and product-mix related business leads to
higher sales/earnings volatility over the quarters
Original sales target (high single digit %-growth) might be slightly exceeded
EBIT margin above Group average

Geopolitical risk factors have clearly increased (Russia, Mid East, Northern
Africa, South America)
EK still expects overall worldwide car production to grow by 2-3%; several
market researchers have been lowering their forecasts
Regional divergence is increasing: Demand primarily driven by China, NA
Modest Western European recovery from still historically low levels to
continue
Mixed picture in BRI markets: Sharp drop in vehicle sales in Brazil and
Russia (June 2014: -17 % each); India showing first signs of recovery
Truck sales in Europe following Euro VI pre-buying better than feared; for
the full year nevertheless moderate decline; EK increases value sold-in
Outlook 2014: Markets show a mixed picure
19

Outlook 2014: Financial performance
in € mn FY 2013
Guidance
FY 2014
Sales 1,175.2
5-7% organic growth
(+ close to EUR 25 mn
scope change) 2
Adj. EBIT1 149.2 160 - 165
Investments 127.2
100 - 110
(+ up to EUR 20 mn
for HFHT)
20
Full consolidation of ElringKlinger Marusan Corporation to add
close to EUR 25 mn in sales but 0.3 PP dilution to Group margin
Order intake Q2 up by 3.5% at EUR 380.0 (367.0) mn, up 14.7%
sequentially
Backlog exceeds prior year by 13.9 % (EUR 649.1 mn)
1 EBIT=operating result as is standard as from Dec. 31, 2013


Disclaimer – Forward-looking Statements and Predictions
This presentation contains statements about the future. These statements are based
on current expectations, market evaluations and predictions by the Management Board,
and on information that is currently available to them. The statements about the future
should not be interpreted as guarantees of the future developments and results that they
refer to. Whilst the Management Board are convinced that the statements that have
been made, and the convictions and expectations on which they are based, are realistic,
they rely on suppositions that may conceivably prove to be incorrect; future results and
developments are dependant on a multitude of factors, they involve various risks and
imponderabilities that can affect whether the ongoing development deviates from the
expectations that have been expressed. These factors include, for example, changes to
the general economic and business situation, variations of exchange rates and interest
rates, poor acceptance of new products and services, and changes to business strategy.
22