ELM- Part 1 Labour market trends in the EU Manuela Samek References European Commission (2006)...
35
ELM- Part 1 Labour market trends in the EU Manuela Samek References European Commission (2006) Employment in Europe 2006, Brussels: executive summary and chapter 1 http://europa.eu.int/comm/employment_so cial/employment_analysis/employ_2006_en .htm Main source of comparative data at EU level: Eurostat European Labour Force Survey Main source of comparative analysis European Commission, Employment in Europe OECD, Employment Outlook,
-
Upload
janice-welch -
Category
Documents
-
view
215 -
download
2
Transcript of ELM- Part 1 Labour market trends in the EU Manuela Samek References European Commission (2006)...

ELM- Part 1Labour market trends in the EU
Manuela Samek
References
European Commission (2006) Employment in Europe 2006, Brussels: executive summary and chapter 1 http://europa.eu.int/comm/employment_social/employment_analysis/employ_2006_en.htm
Main source of comparative data at EU level:Eurostat European Labour Force Survey
Main source of comparative analysisEuropean Commission, Employment in EuropeOECD, Employment Outlook,

Introduction: the economic approach to the analysis of the labour market
Application of the scientific method :1. Individuation of relevant trends/features in labour
market performance to be explained2. Definition of theoretical models focussing on the
relevant variables and their causal relations3. Testing of theoretical models using available data
(time series and longitudinal data) and econometric methods
4. If models are validated, use their predictive capacity :
to explain labour market trends and features to simulate likely effects of economic policies and future trends to evaluate the effectiveness of policies
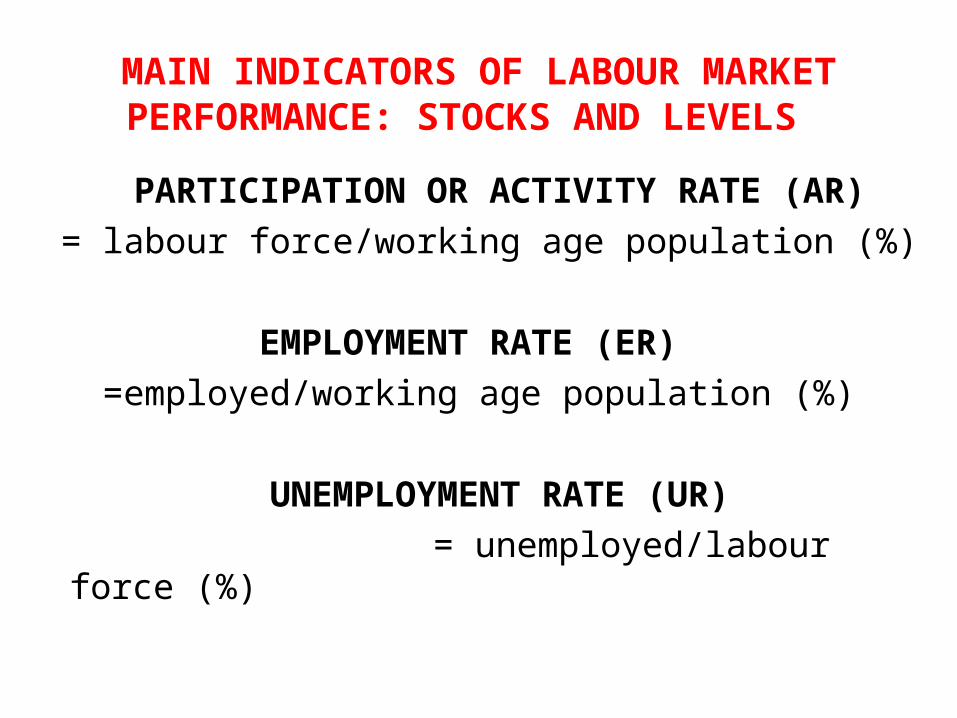
MAIN INDICATORS OF LABOUR MARKET PERFORMANCE: STOCKS AND LEVELS
PARTICIPATION OR ACTIVITY RATE (AR)
= labour force/working age population (%)
EMPLOYMENT RATE (ER)
=employed/working age population (%)
UNEMPLOYMENT RATE (UR)
= unemployed/labour force (%)
INDICATORS OF LABOUR MARKET PERFORMANCE: FLOWS
In any given year, as many as one-fourth of all persons in the working-age population may undergo a change in labour force status. People lose or leave their jobs, or enter or depart from the labour market.
Statistics on labour market flows describe the number of persons who have changed jobs or have moved into and out of employment, and into and out of being unemployed or outside the labour market, rather than just changes in the number of persons in these situations and in the labour force characteristics of groups. In this way, the statistics can give insight into how labour market developments affect different groups of individuals over the course of time.
• Flows in and out of unemployment useful to measure average unemployment duration: Du= U/I
• Flows in and out of employment to measure labour mobility and job and worker turnover
• Flows in and out of the labour force to understand labour participation and its relation to the economic cycle
INDICATORS OF LABOUR MARKET PERFORMANCE: WAGES and PRODUCTIVITY
• Wages measure the price of labour services. • Labour costs are the costs incurred by firms when
employing labour: they include hourly wages,fringe benefits, social security contributions and training,recruiting, firing costs.
• Labour productivity measures the contribution of labour to output, given the other production factors
• In economics the relevant variables are the real wage (W/P), unit labour costs (LC/Q), labour marginal productivity (dQ/dL) and average productivity (Q/L)
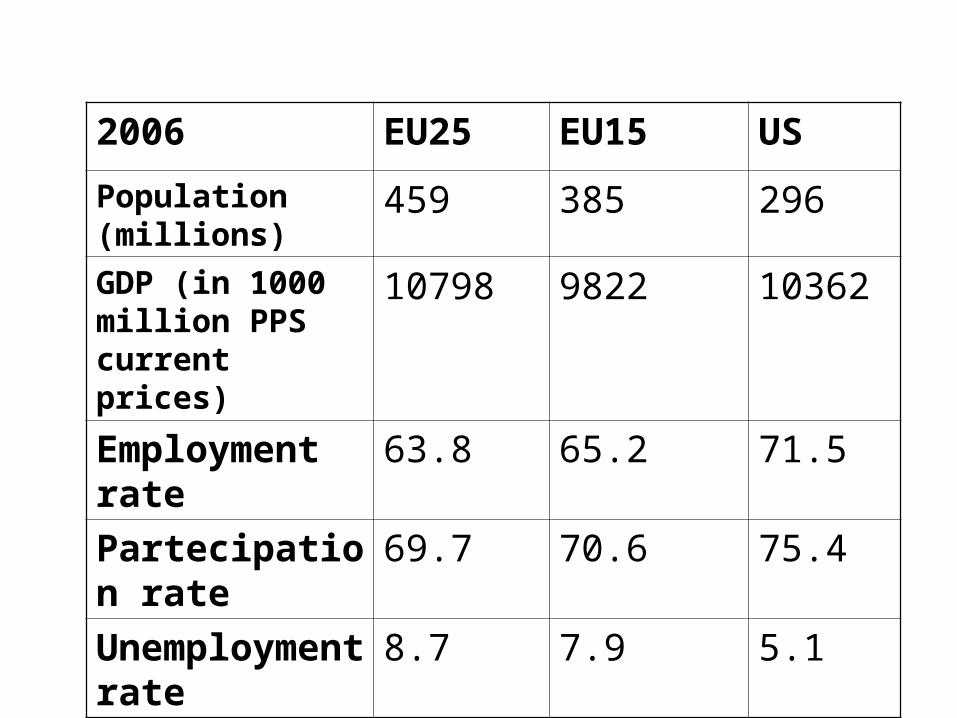
2006 EU25 EU15 US
Population (millions)
459 385 296
GDP (in 1000 million PPS current prices)
10798 9822 10362
Employment rate
63.8 65.2 71.5
Partecipation rate
69.7 70.6 75.4
Unemployment rate
8.7 7.9 5.1
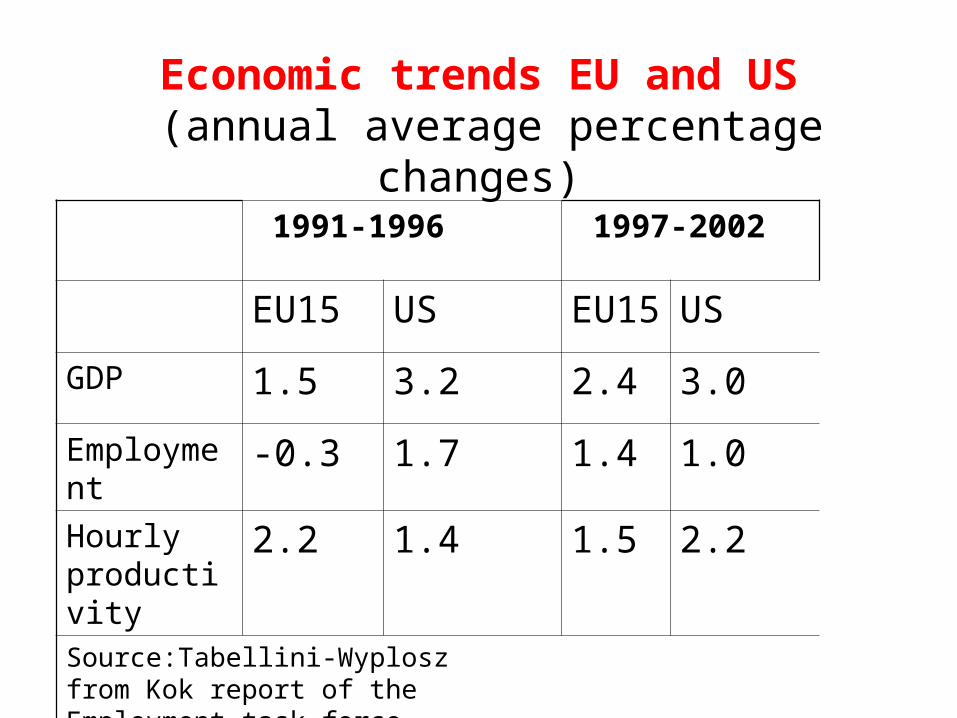
Economic trends EU and US (annual average percentage changes)
1991-1996 1997-2002
EU15 US EU15 US
GDP 1.5 3.2 2.4 3.0
Employment -0.3 1.7 1.4 1.0
Hourly productivity
2.2 1.4 1.5 2.2
Source:Tabellini-Wyplosz from Kok report of the Employment task force, nov.2003
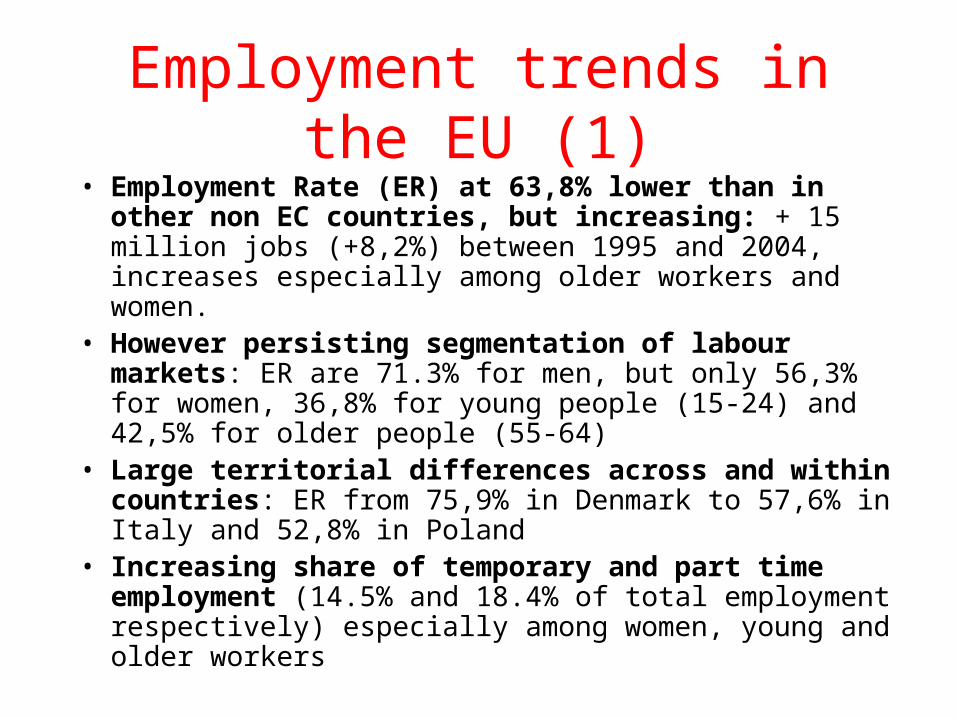
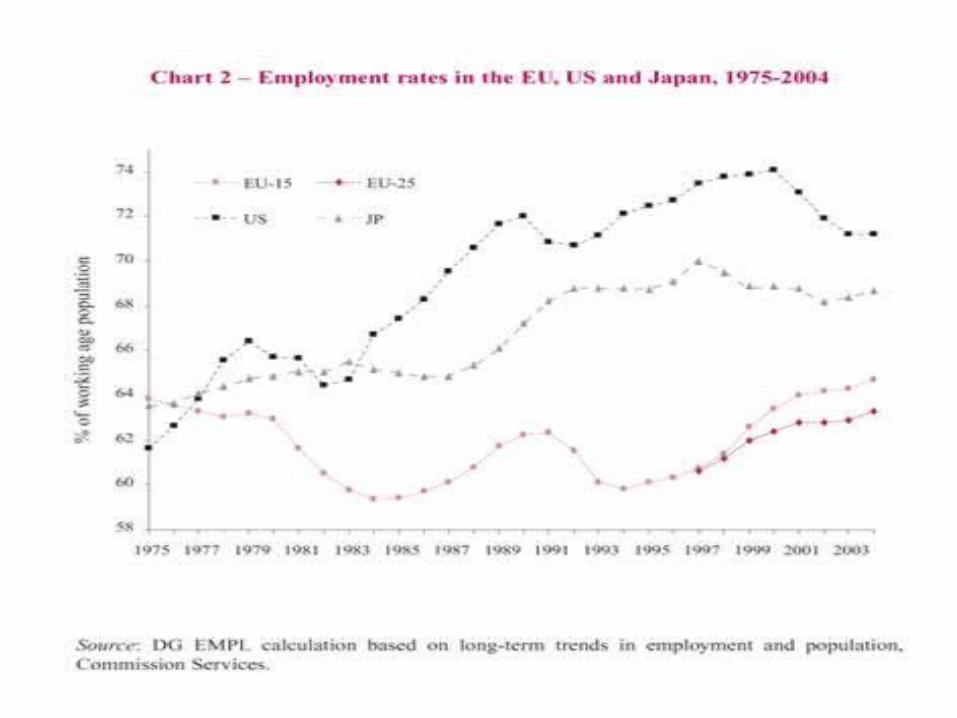
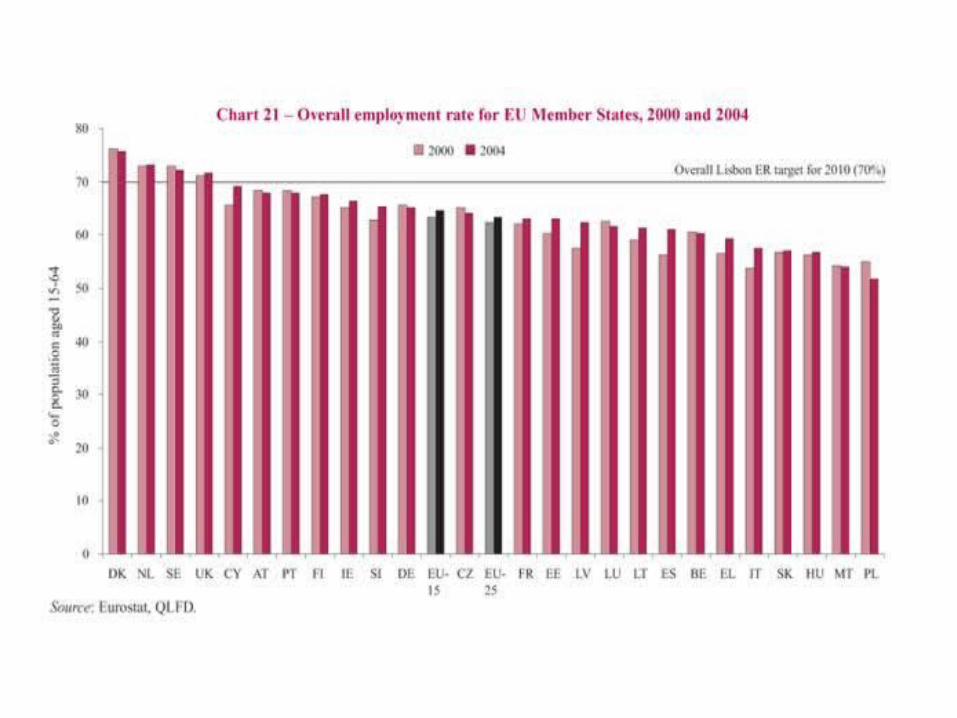
• Employment Rate (ER) at 63,8% lower than in other non EC countries, but increasing: + 15 million jobs (+8,2%) between 1995 and 2004, increases especially among older workers and women.
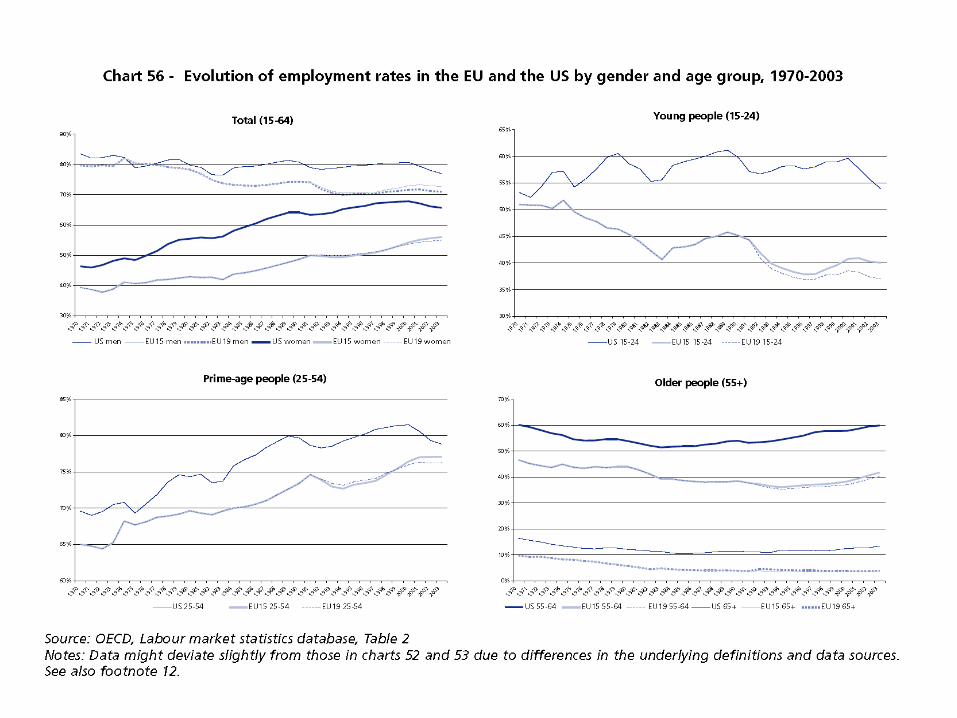
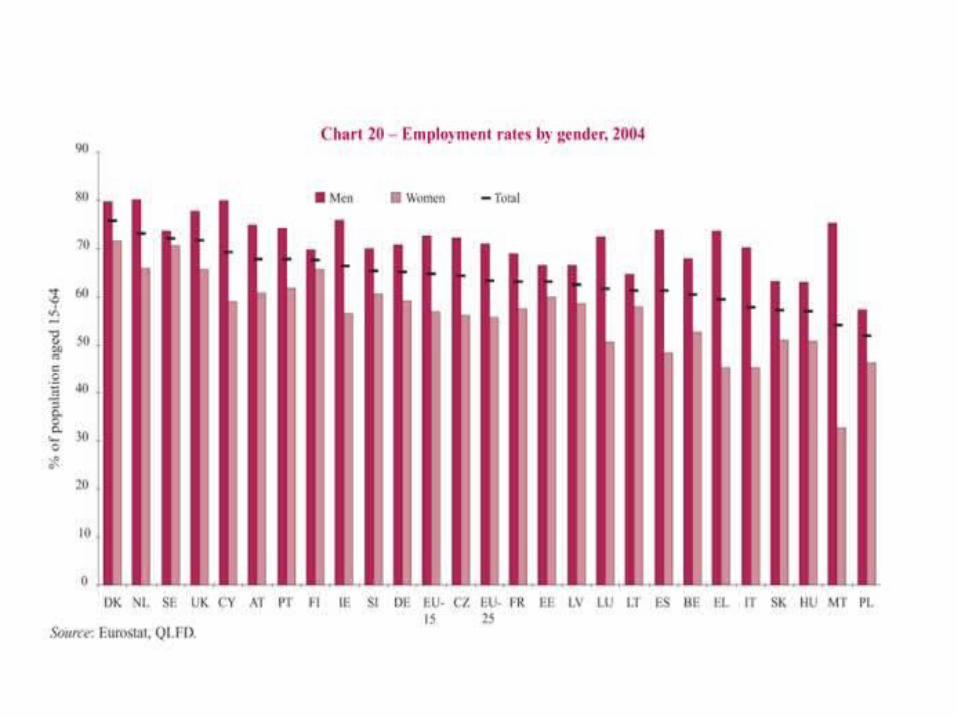
• However persisting segmentation of labour markets: ER are 71.3% for men, but only 56,3% for women, 36,8% for young people (15-24) and 42,5% for older people (55-64)
• Large territorial differences across and within countries: ER from 75,9% in Denmark to 57,6% in Italy and 52,8% in Poland
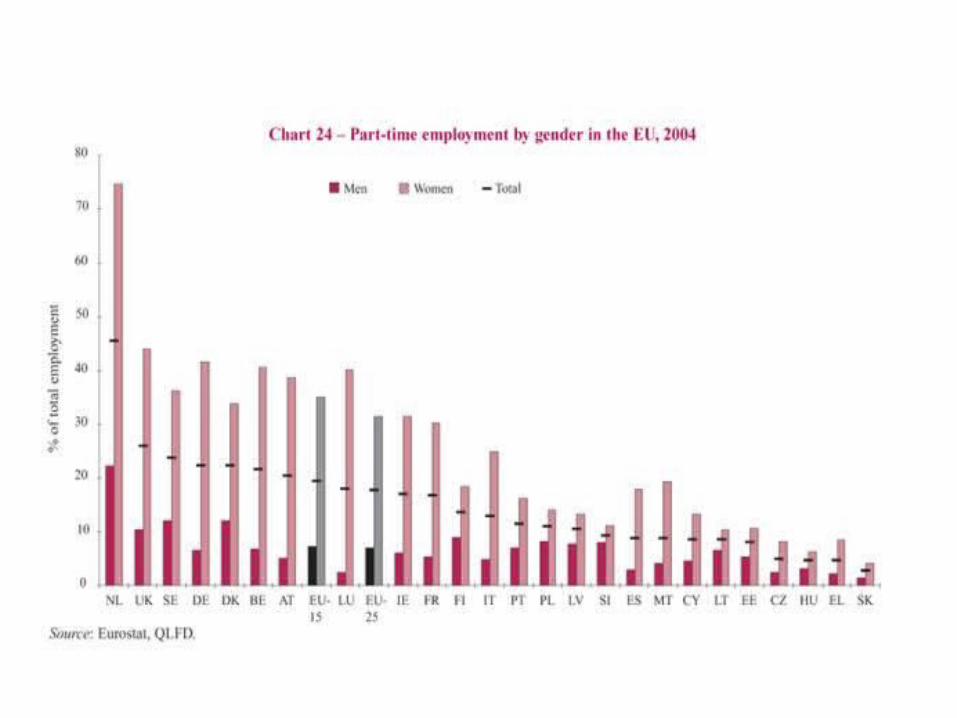
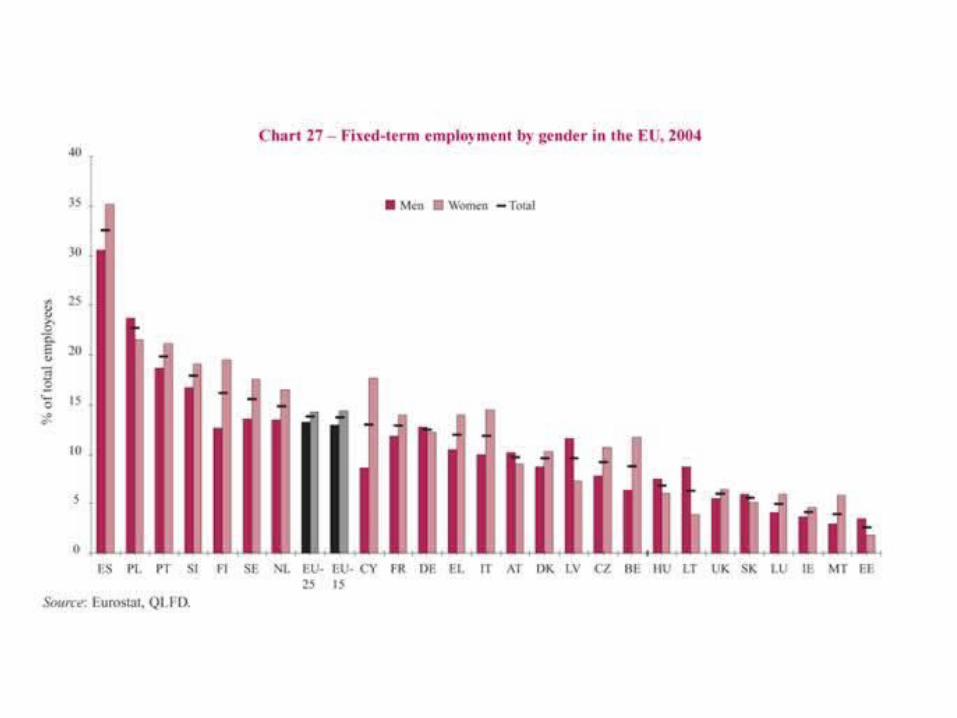
• Increasing share of temporary and part time employment (14.5% and 18.4% of total employment respectively) especially among women, young and older workers
Employment trends in the EU (1)
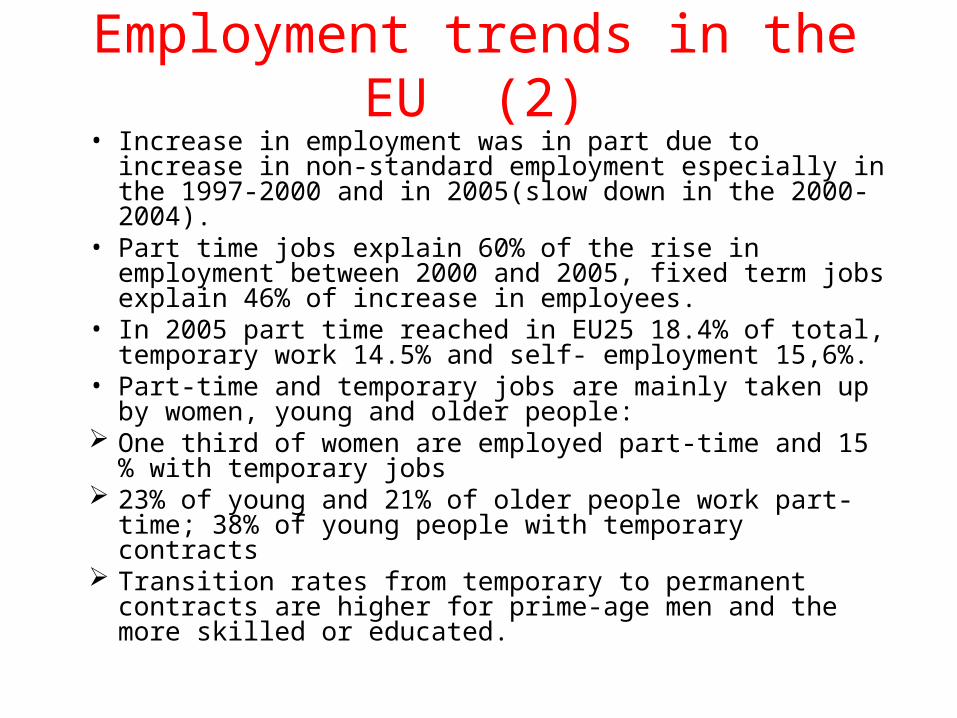
Employment trends in the EU (2)• Increase in employment was in part due to increase in non-
standard employment especially in the 1997-2000 and in 2005(slow down in the 2000-2004).
• Part time jobs explain 60% of the rise in employment between 2000 and 2005, fixed term jobs explain 46% of increase in employees.
• In 2005 part time reached in EU25 18.4% of total, temporary work 14.5% and self- employment 15,6%.
• Part-time and temporary jobs are mainly taken up by women, young and older people:
One third of women are employed part-time and 15 % with temporary jobs
23% of young and 21% of older people work part-time; 38% of young people with temporary contracts
Transition rates from temporary to permanent contracts are higher for prime-age men and the more skilled or educated.
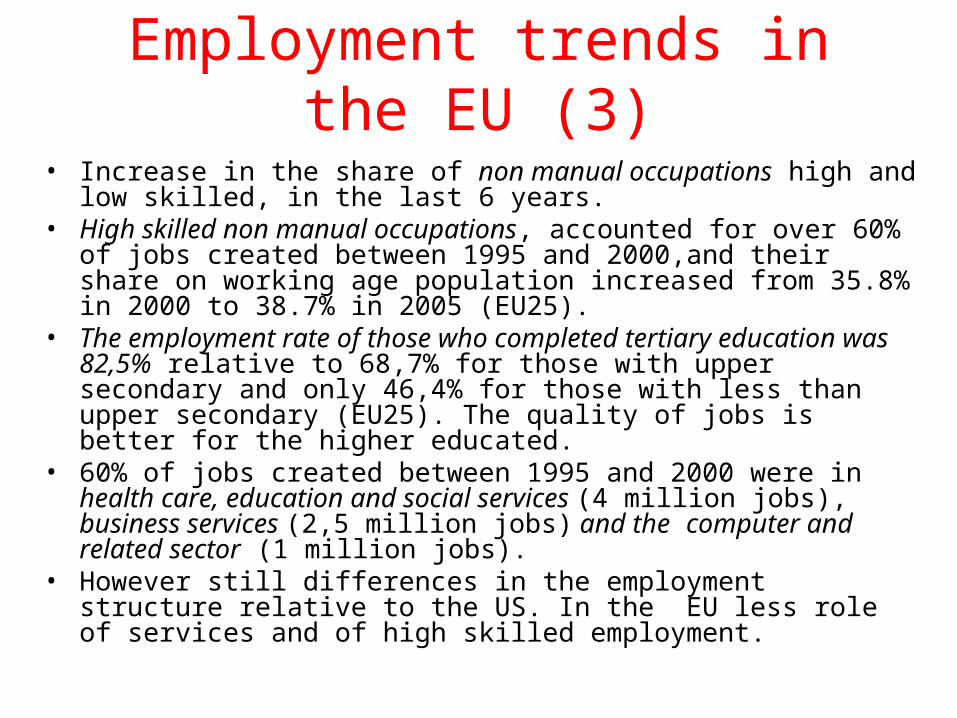
Employment trends in the EU (3)
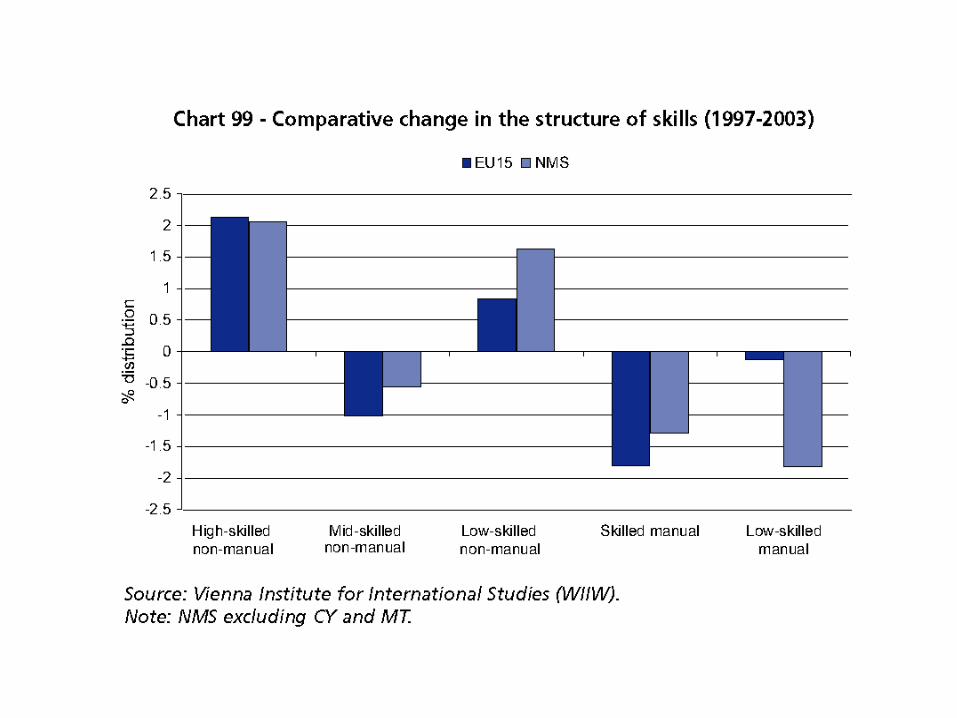
• Increase in the share of non manual occupations high and low skilled, in the last 6 years.
• High skilled non manual occupations, accounted for over 60% of jobs created between 1995 and 2000,and their share on working age population increased from 35.8% in 2000 to 38.7% in 2005 (EU25).
• The employment rate of those who completed tertiary education was 82,5% relative to 68,7% for those with upper secondary and only 46,4% for those with less than upper secondary (EU25). The quality of jobs is better for the higher educated.
• 60% of jobs created between 1995 and 2000 were in health care, education and social services (4 million jobs), business services (2,5 million jobs) and the computer and related sector (1 million jobs).
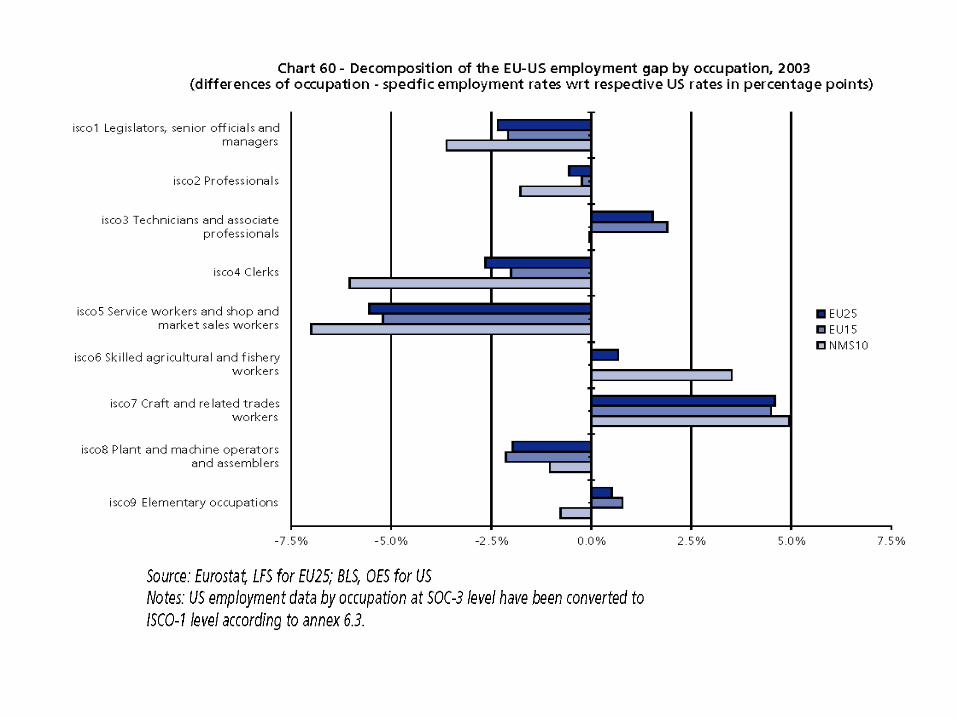
• However still differences in the employment structure relative to the US. In the EU less role of services and of high skilled employment.

Labour market participation
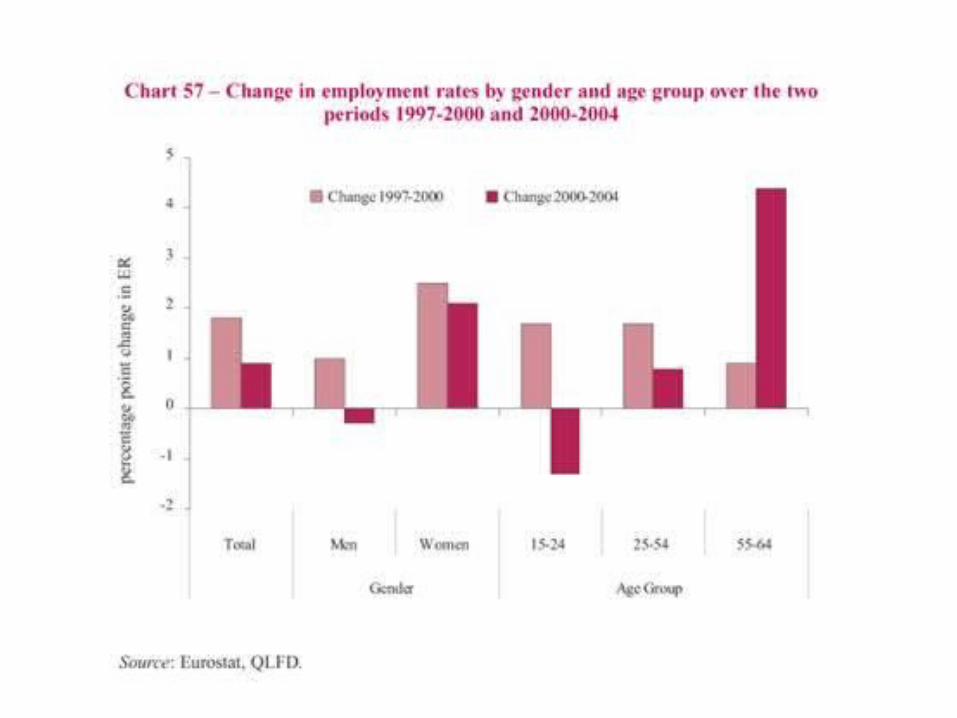
• Positive employment trends have activated participation, among women and older people.
• Overall AR rose from 67.7% in 1997 to 70,2% in 2005. But still lower than in the US and still some 92 million people in working age were inactive in 2004
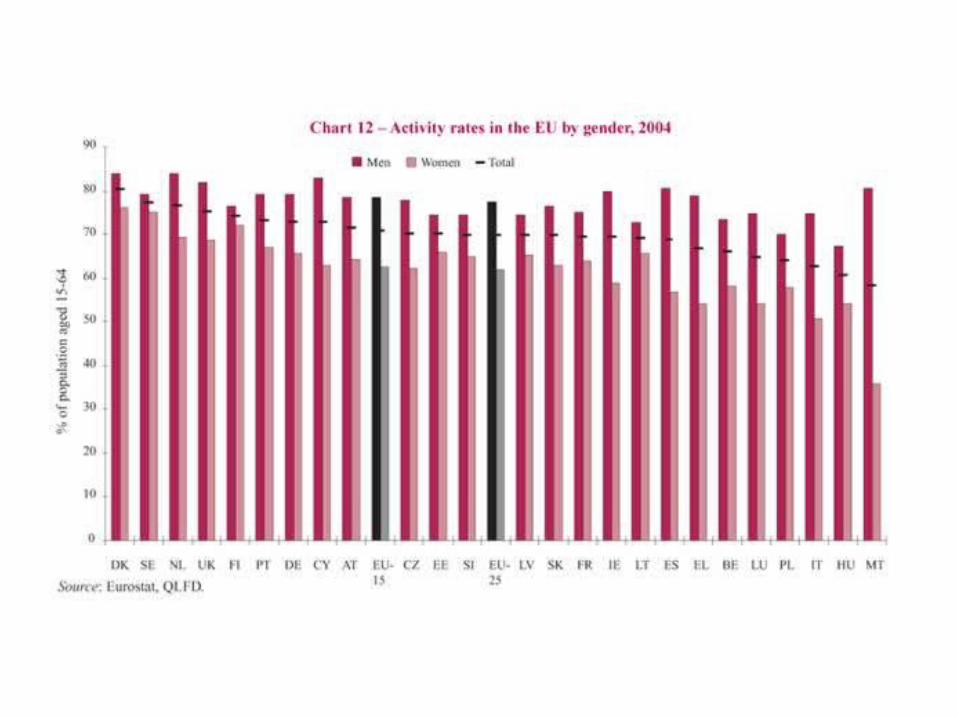
• In the EU25, women participation rates increased from 58.1% in 1997 to 62,5% in 2005. Participation rate of older people from 39,1% in 1995 to 45.5% in 2005.
• Participation rates for young people at 45,2%• Inactivity especially large among the low skilled and women: over
half of the inactive are low skilled. One third are young people in education/training, 1/5 is on retirement, 16% is inactive for family or personal responsibilities , 13% for illness/disability and 4,5% due to discouragement effects.
• Strong correlation between inactivity and unemployment (female participation rate related positively to male unemployment rate and negatively with female unemployment rate)
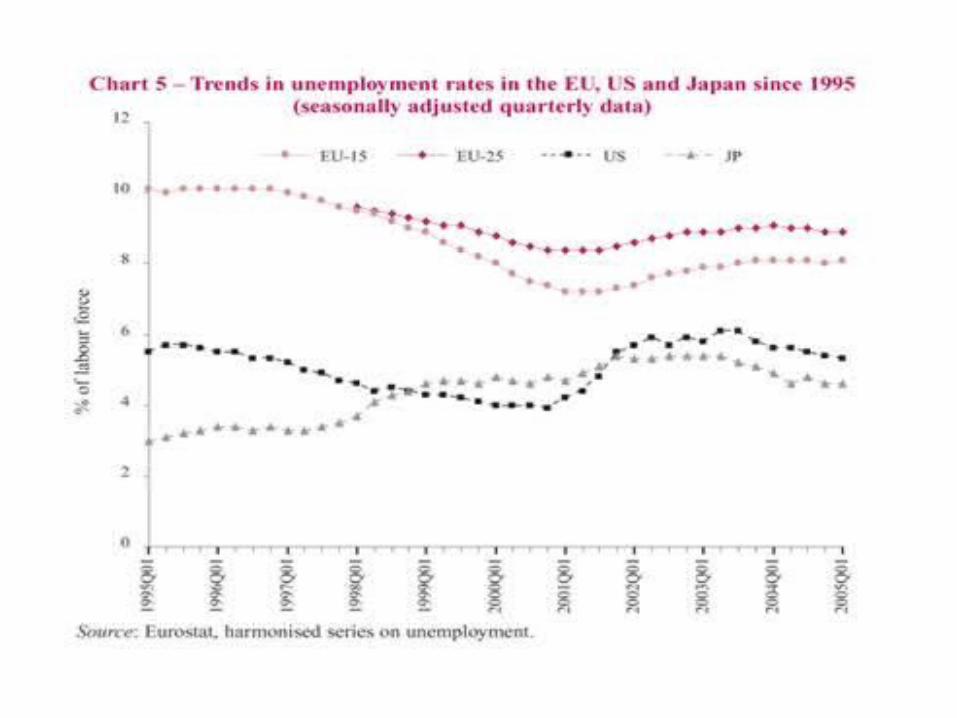
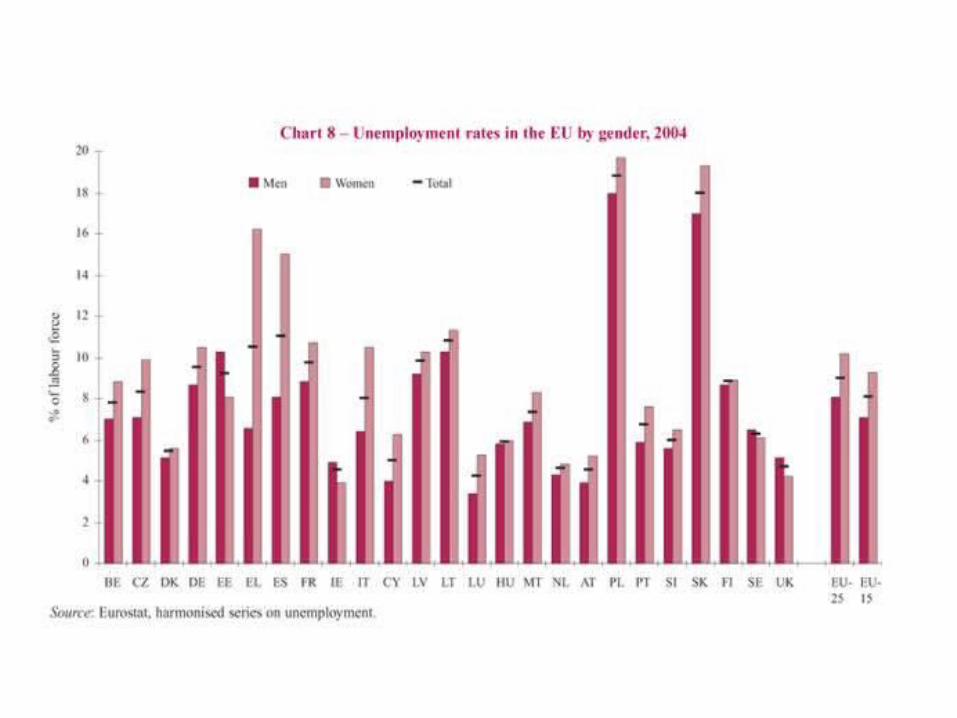
Unemployment• Unemployment is slowly falling, but still more than 19,4 million
individuals were unemployed in 2004, with the unemployment rate at 8,7% in the EU25 .
• “OLD” PROBLEMS:
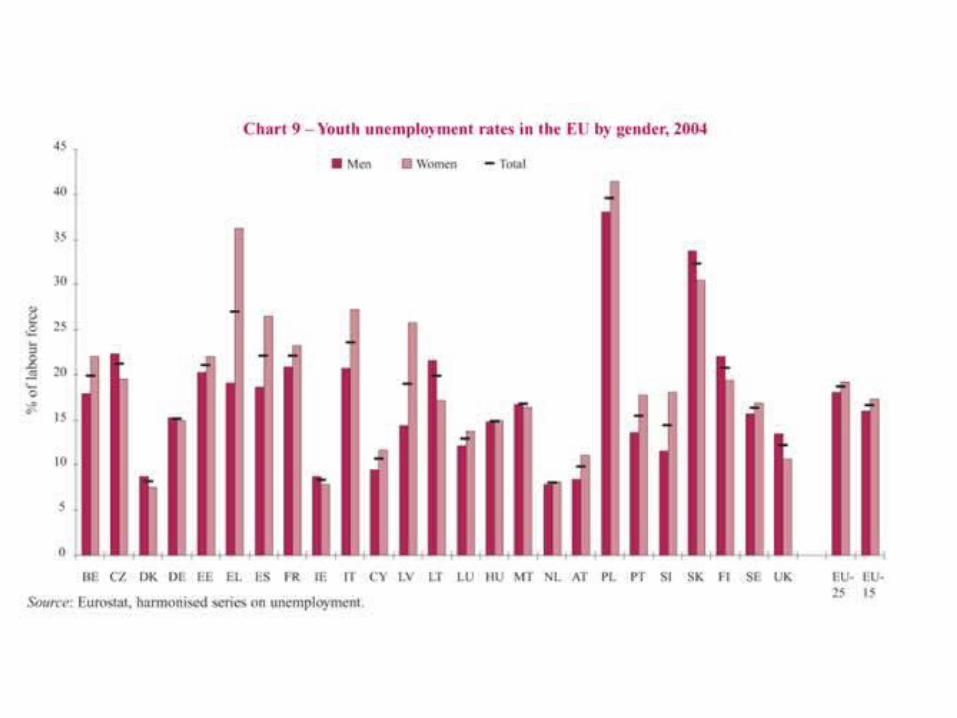
• UR for adult men is relatively low (7,9%) and stable over time, while higher and cyclical in the case of women (9,8%), young people (18.5%) and the low educated (12.2% relative to 4.9% for the high educated) and in some territorial areas.
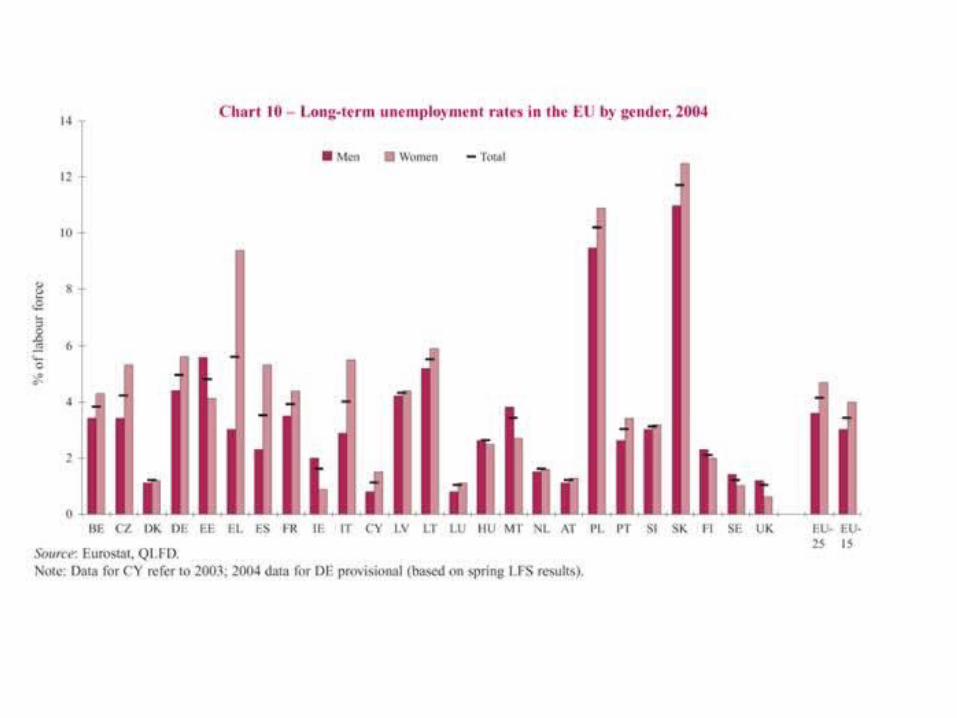
• high unemployment is usually associated with long-term unemployment, suggesting that unemployment and labour market/social exclusion might be positively correlated.
• Long-term unemployment is a primary concern for women, older workers and the low-educated.

and “NEW” PROBLEMS:
1) Ageing of EU population reforms of pensions and welfare systems
Impact on older workers: incentives to retire and low activty rates, but need to retain and retrain there might be increasing U rates for the elderly (and present low levels of participaton might hide it)
2) (Skill-biased) technological progress changing skill demand and skill gaps higher risk of unemployment for the low-educated
3) Increasing net migration flows: do migrants substitute or complement native workers? No clear pattern between national unemployment rates and incidence of foreign population.

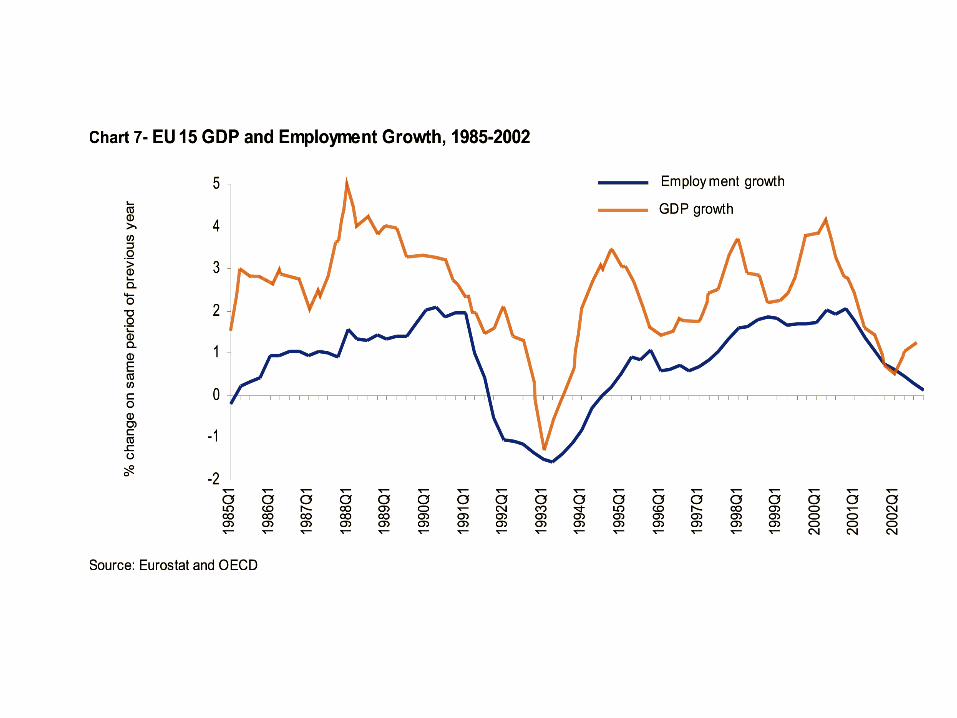
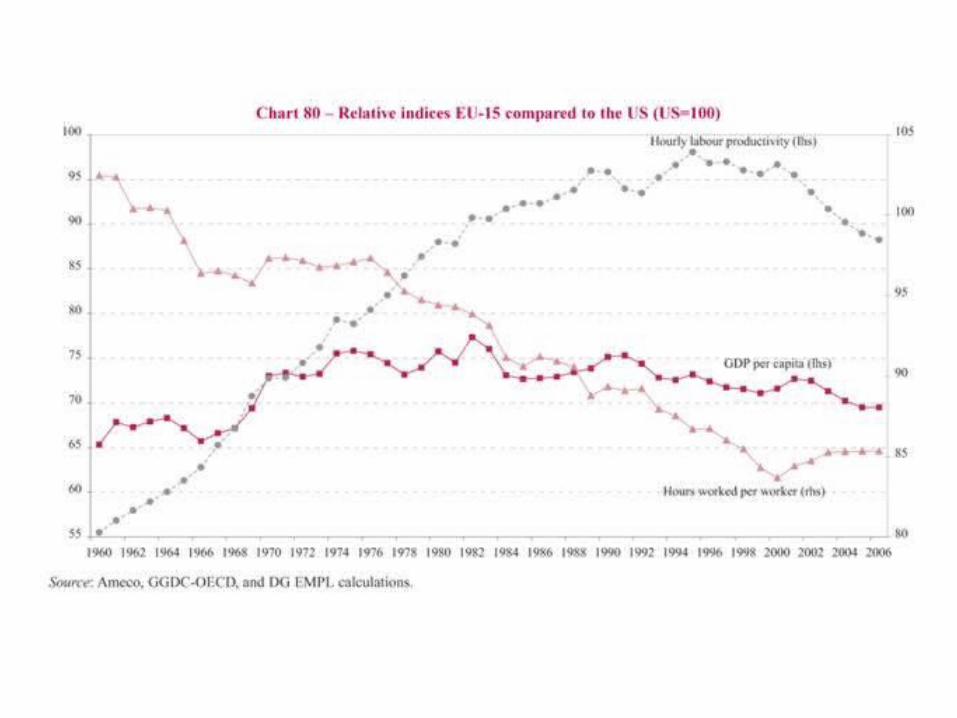
Productivity and wages• Since 1995 employment growth higher than GDP growth.
Hence slow down of productivity growth in all economic sectors.
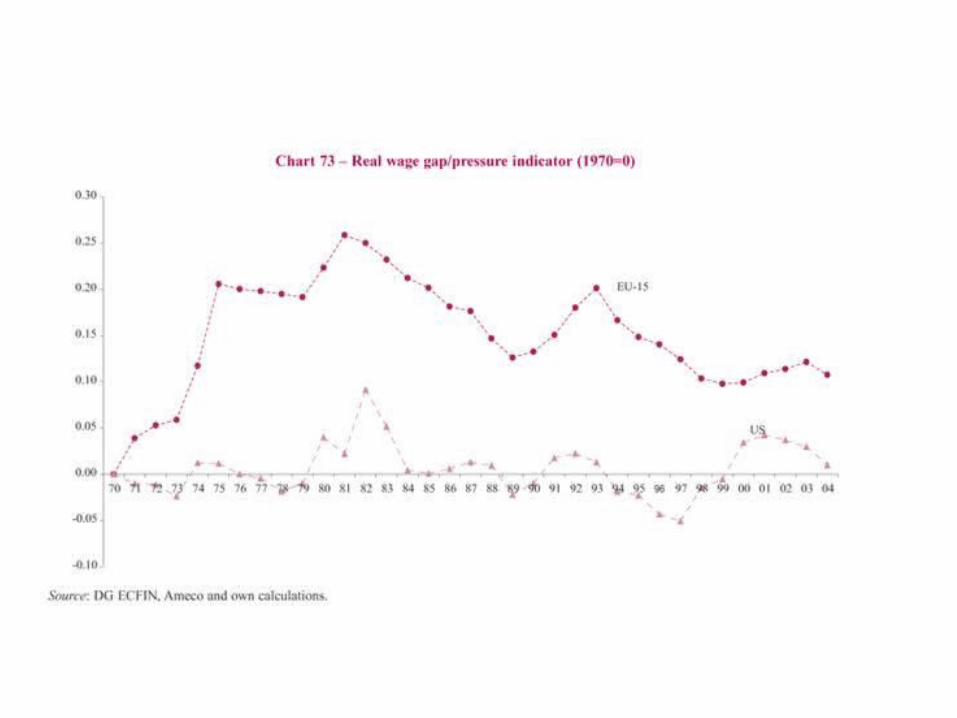
• Real wage moderation has characterised the EU since 1995, wage differentials and earning inequalities have been increasing in some countries (UK, Poland, Denmark especially) and within some countries.
• However non wage labour costs (taxation and social contributions to finance welfare provisions) still high share of labour costs (from 30% in Swe, Ita,Fra, Hung,Rom, to 15% in Dk and Ire)
• There is evidence of a greater increase in nominal and real wages in accession countries, which shows a tendency to convergence, even if accession countries start from wage levels much lower than EUcountries.
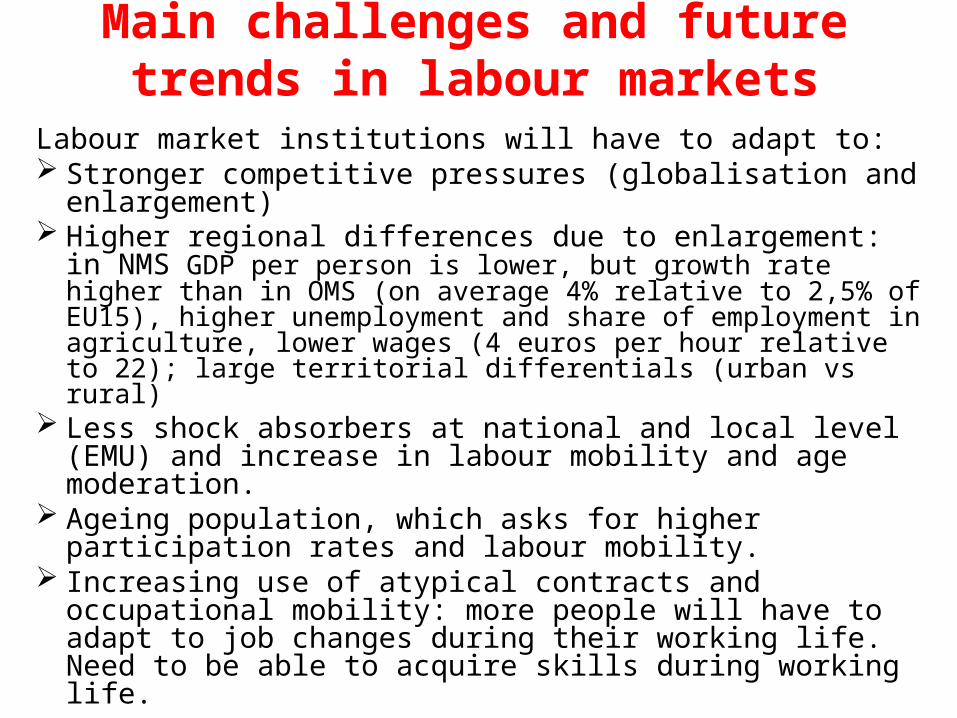
Main challenges and future trends in labour markets
Labour market institutions will have to adapt to: Stronger competitive pressures (globalisation and
enlargement) Higher regional differences due to enlargement: in NMS
GDP per person is lower, but growth rate higher than in OMS (on average 4% relative to 2,5% of EU15), higher unemployment and share of employment in agriculture, lower wages (4 euros per hour relative to 22); large territorial differentials (urban vs rural)
Less shock absorbers at national and local level (EMU) and increase in labour mobility and age moderation.
Ageing population, which asks for higher participation rates and labour mobility.
Increasing use of atypical contracts and occupational mobility: more people will have to adapt to job changes during their working life. Need to be able to acquire skills during working life.

Current institutional framework in the EU/1
• Higher public intervention to regulate labour and product markets than in non EC contries
• Higher relevance of collective bargaining in wage determination
• Higher employment protection legislation• Large role of welfare state with high expenditures
in social and labour policies funded largely through social security contributions and taxation which increase non wage labour costs

Current institutional framework /2
Three main regulatory and welfare regimes:
• the liberal regime (UK): high labour and wage flexibility, universal public support only against “bad risks”. Decentralized and uncoordinated industrial relations at the firm/plant level. Increasing attention to ALMP and “work to welfare” model.
• the conservative regime of the continental and southern European countries: high employment protection for “core workers” (adult males in the industrial sector), low and differentiated support during unemployment (especially in Southern Europe), little attention to active policies relative to income support.
• the social-democratic regime of the Scandinavian countries: low employment protection and high labour flexibility, but generous support during job search and labour market transitions (through activation policies and unemployment benefits). Wage-setting and regulation of working conditions left to centralized bargaining between unions and employers’ associations