ELLM: the Extraordinarily Long-Lived Mouse
7
Volume 10, Number 9 May 19, 2020 ELLM: the Extraordinarily Long-Lived Mouse It is curious, the things the mundane discipline of biblical chronology can get a scientist into. Two decades ago, I embarked on a full-time quest to discover why humans had lived so much longer before Noah’s Flood than they do to- day. 1 My chronology research, combining radio- carbon dating and biblical chronology, had re- vealed a missing thousand years in traditional bib- lical chronologies such as the Ussher chronology. 2 Prior to its discovery, this missing thousand years had caused biblical chronology to be seriously out of step with radiocarbon and secular historical chronologies prior to about 1000 B.C., and this had made the biblical historical narrative from Genesis through Judges seem unhistorical. 3 When the missing thousand years were restored to their rightful place in biblical chronology, biblical and secular chronologies were found to be in harmony from the present back into the earliest chapters in Genesis. Noah’s Flood, for example, recounted in Genesis chapters 6 through 9, was found to have a radiocarbon date of 3525±12.5 B.C. and a bib- lical chronology date of 3520±21 B.C. 4 These two dates are breathtakingly indistinguishable for such a remote time. Once it has become clear that biblical chronol- 1 Gerald E. Aardsma, “Research in Progress,” The Bib- lical Chronologist 8.6 (November/December 2002): 15–16. www.BiblicalChronologist.org. 2 Gerald E. Aardsma, A New Approach to the Chronol- ogy of Biblical History from Abraham to Samuel, 2nd ed. (Loda, IL: Aardsma Research and Publishing, 1995). www.BiblicalChronologist.org. 3 Gerald E. Aardsma, “Evidence for a Lost Millennium in Biblical Chronology,” Radiocarbon 37.2 (1995): 267–273. 4 Gerald E. Aardsma, Noah’s Flood Happened 3520 B.C. (Loda, IL: Aardsma Research and Publishing, 2015), pages 307–313. www.BiblicalChronologist.org. Figure 1: ELLM at 166 weeks of age. ogy is highly dependable back into the earli- est chapters in Genesis, then it immediately fol- lows that the multi-century life spans of humans recorded in the early chapters in Genesis must be factual, for the genealogies in which these life spans are found in Genesis 5 and Genesis 11 provide the backbone for biblical chronology for more than two thousand years, from before Noah’s Flood until well after it. This, of course, leads immediately to the question of why ordinary people lived so much longer back then than we do now. I conjectured that pre-Flood humans were get- ting a vitamin that we no longer get today, and that aging as we know it is a deficiency disease of this vitamin. I called the unknown vitamin “vita- min X,” and I set out to find it. 5 The present article analyzes research carried out using ICR 6 female weanling mice in the ARP Ro- dent Lab between March 2001 and September 2019 to discover vitamin X. Four separate, same-age cohorts of mice of that type (in addition to nu- merous other cohorts of other types of mice) were 5 Gerald E. Aardsma, “The Cause of Reduced Post-Flood Life Spans – Part IV,” The Biblical Chronologist 8.1 (Jan- uary/February 2002): 1–8. www.BiblicalChronologist.org. 6 These are outbred white laboratory mice. The full des- ignation of the strain is Hsd:ICR (CD-1 R ).
Transcript of ELLM: the Extraordinarily Long-Lived Mouse

Volume 10, Number 9 May 19, 2020
ELLM: the Extraordinarily
Long-Lived Mouse
It is curious, the things the mundane discipline ofbiblical chronology can get a scientist into.
Two decades ago, I embarked on a full-time
quest to discover why humans had lived so muchlonger before Noah’s Flood than they do to-
day.1 My chronology research, combining radio-carbon dating and biblical chronology, had re-vealed a missing thousand years in traditional bib-
lical chronologies such as the Ussher chronology.2
Prior to its discovery, this missing thousand years
had caused biblical chronology to be seriously outof step with radiocarbon and secular historical
chronologies prior to about 1000 B.C., and thishad made the biblical historical narrative from
Genesis through Judges seem unhistorical.3 Whenthe missing thousand years were restored to their
rightful place in biblical chronology, biblical andsecular chronologies were found to be in harmonyfrom the present back into the earliest chapters in
Genesis. Noah’s Flood, for example, recounted inGenesis chapters 6 through 9, was found to have
a radiocarbon date of 3525±12.5 B.C. and a bib-lical chronology date of 3520±21 B.C.4 These two
dates are breathtakingly indistinguishable for sucha remote time.
Once it has become clear that biblical chronol-
1Gerald E. Aardsma, “Research in Progress,” The Bib-
lical Chronologist 8.6 (November/December 2002): 15–16.www.BiblicalChronologist.org.
2Gerald E. Aardsma, A New Approach to the Chronol-
ogy of Biblical History from Abraham to Samuel, 2nded. (Loda, IL: Aardsma Research and Publishing, 1995).www.BiblicalChronologist.org.
3Gerald E. Aardsma, “Evidence for a Lost Millenniumin Biblical Chronology,” Radiocarbon 37.2 (1995): 267–273.
4Gerald E. Aardsma, Noah’s Flood Happened 3520 B.C.
(Loda, IL: Aardsma Research and Publishing, 2015), pages307–313. www.BiblicalChronologist.org.
Figure 1: ELLM at 166 weeks of age.
ogy is highly dependable back into the earli-est chapters in Genesis, then it immediately fol-
lows that the multi-century life spans of humansrecorded in the early chapters in Genesis must be
factual, for the genealogies in which these life spansare found in Genesis 5 and Genesis 11 provide the
backbone for biblical chronology for more than twothousand years, from before Noah’s Flood until
well after it. This, of course, leads immediatelyto the question of why ordinary people lived so
much longer back then than we do now.
I conjectured that pre-Flood humans were get-ting a vitamin that we no longer get today, and
that aging as we know it is a deficiency disease ofthis vitamin. I called the unknown vitamin “vita-min X,” and I set out to find it.5
The present article analyzes research carried out
using ICR6 female weanling mice in the ARP Ro-dent Lab between March 2001 and September 2019
to discover vitamin X. Four separate, same-agecohorts of mice of that type (in addition to nu-
merous other cohorts of other types of mice) were
5Gerald E. Aardsma, “The Cause of Reduced Post-FloodLife Spans – Part IV,” The Biblical Chronologist 8.1 (Jan-uary/February 2002): 1–8. www.BiblicalChronologist.org.
6These are outbred white laboratory mice. The full des-ignation of the strain is Hsd:ICR (CD-1R©).

2 The Biblical Chronologist Volume 10, Number 9
used during those eighteen and a half years to test
a variety of vitamin X candidate substances bothfor toxicity and for life-lengthening efficacy. The
choice of vitamin X candidates was guided by aconstantly maturing theory explaining biblically-
recorded, near-1,000-year human life spans priorto Noah’s Flood.7 Sister vitamin X candidates,methylphosphonic acid (MePA) and methylphos-
phinic acid (MePiA), were tested separately withthe fourth cohort of ICR female weanling mice. By
the time this MePA-versus-MePiA test was initi-ated, both the theoretical side and the experimen-
tal side of the work had progressed sufficiently topredict with near certainty that either MePA or
MePiA or both were the long-sought vitamin X.This prediction had received preliminary confir-
mation by dramatic, positive health effects due toself-dosing with 1 µg MePA per day.8
The working hypothesis at the launching of the
MePA-vs-MePiA experiment was that MePA andMePiA acted as a pair of vitamins in the body. Ex-
periments on mice treated with MePA had shownno life-lengthening. The working hypothesis was
that this was due to mice lacking the enzymes nec-essary to convert MePA to MePiA. The MePA-vs-
MePiA experiment was designed to test this hy-pothesis. MePiA, according to the working hy-pothesis, acts as an anti-oxidant in the body to
mitigate damage due to free radicals, in accor-dance with Harman’s free radical theory of aging.9
MePiA is oxidized to MePA by free radicals of thereactive oxygen species group including OH·, the
hydroxyl radical. MePA may then operate in atypical vitamin capacity in a variety of biochemi-
cal reactions. Ultimately, it is either enzymaticallyreduced back to MePiA or filtered by the kidneys
and excreted from the body. This working hypoth-esis makes MePiA to be essential for life lengthen-ing, and the expectation was that mice receiving
MePiA would show life lengthening.
Life span experiments with mice take several
7Gerald E. Aardsma, Aging: Cause and Cure
(Loda, IL: Aardsma Research and Publishing, 2017).www.BiblicalChronologist.org.
8Gerald E. Aardsma, Aging: Cause and Cure (Loda, IL:Aardsma Research and Publishing, 2017), pages 113–118.www.BiblicalChronologist.org.
9Denham Harman, “The biologic clock: the mitochon-dria?,” Journal of the American Geriatrics Society 20(1972): 145–147.
years to run to completion. I have previously
described how early results from this experimentseemed contrary to the hypothesis, leaving MePA
as the sole anti-aging vitamin, and how it tooktwo years for this mistaken impression to be cor-
rected.10 The present article shows that the finalresults of the experiment corroborate the work-ing hypothesis beyond reasonable doubt. It shows
that the mice receiving MePiA did experience lifelengthening. Of the 16 vitamin X candidates
tested with these four cohorts of mice, and of how-ever many other vitamin X candidates tested with
other types of mice in the ARP Rodent Lab, onlyMePiA has ever given a positive, life-lengthening
signal.
The 2019 discovery of the life-lengthening effi-cacy of MePiA with mice was announced in Adden-
dum to Aging: Cause and Cure.11 Three MePiA-treated mice played an especially important rolein that publication.12 These three mice were all
unusually long lived. Of these three mice, one(subsequently dubbed “ELLM”) was of special in-
terest. ELLM appeared more youthful than theother two, both of whom appeared quite aged, and
she outlived the other two. At the time of writingof Addendum to Aging: Cause and Cure, the two
aged-looking mice had died and ELLM was stillalive.
ELLM died seven and a half weeks later. She,
too, looked aged by the time she died. She was171.6 weeks of age when she died. This is an ex-traordinarily long life span for this type of mouse.
The previous record age for this same type ofmouse (ICR female weanling) in ARP Rodent Lab,
not treated with MePiA, was 150.4 weeks. Thisrecord is for a total of 176 mice of this type raised
in ARP Lab. ELLM extended this record by 21.2weeks (14%).
In human-equivalent terms, ELLM lived for
135.3 years.13 The previous record (150.4 weeks)
10Gerald E. Aardsma, Addendum to Aging: Cause and
Cure (Loda, IL: Aardsma Research and Publishing, July26, 2019), pages 2–5. www.BiblicalChronologist.org.
11Gerald E. Aardsma, Addendum to Aging: Cause and
Cure (Loda, IL: Aardsma Research and Publishing, July26, 2019). www.BiblicalChronologist.org.
12Gerald E. Aardsma, Addendum to Aging: Cause and
Cure (Loda, IL: Aardsma Research and Publishing, July 26,2019), pages 4, 8, and 10. www.BiblicalChronologist.org.
13I have used the Social Security Administration’s 2016

Volume 10, Number 9 The Biblical Chronologist 3
mouse had a human-equivalent age of 118.6 years.
The world record age for modern humans—froma sample population numbered in the billions—is
122.4 years.14 In human-equivalent terms, ELLMoutlived the human record age by nearly 15 years.
She was truly extraordinarily long lived—which iswhy she was dubbed “ELLM,” an acronym for Ex-traordinarily Long Lived Mouse.
ELLM’s long life makes an important contri-
bution to the all-important question of whethertreatment of her group with MePiA irrefutably
demonstrates life lengthening. Addendum to Ag-
ing: Cause and Cure relied upon a simple graphi-
cal presentation of survival curve data to make thecase that it had done so. The present article per-
forms a quantitative, mathematical analysis of thedata, with the final data point for ELLM’s group
(resulting from her death) included, to make thesame case more objectively and more forcefully.
The Data
Figure 2 shows the final graph of the MePA-vs-MePiA dataset. Each treatment group began with
4 cages containing 9 mice each, all of the same age.One cage was removed from the MePiA dataset
due to a treatment-unrelated, juvenile die-off eventas previously discussed.15 The final red dot on the
right corresponds to the ELLM datapoint.
Data Analysis
In BC107, a means of analyzing survival curve data
in light of the general theory of aging was intro-duced.16 A weighted least-squares method is used
to fit the Aardsma model (Equation 1) to experi-mental datasets.
N = N0e−[(K/A)(eAt
−At−1)+Rt] (1)
Actuarial Life Table (ssa.gov/oact/STATS/table4c6.html)to calculate this human-equivalent age. Specifically, the50% survivors point for U.S. females in 2016 is 84.6 years.For the cohort of mice sporting the previous 150.4 weekrecord, the 50% survivors point is 107.3 weeks. This yields(171.6×84.6/107.3=) 135.3 years.
14en.wikipedia.org/wiki/Oldest people (accessed May 18,2020).
15Gerald E. Aardsma, Addendum to Aging: Cause and
Cure (Loda, IL: Aardsma Research and Publishing, July26, 2019), pages 6–9. www.BiblicalChronologist.org.
16Gerald E. Aardsma, “Modeling Survival Curves in Lightof the General Theory of Aging,” The Biblical Chronologist
10.7 (April 24, 2020): 1–7. www.BiblicalChronologist.org.
0 20 40 60 80 100 120 140 160 180
age (weeks)
0
10
20
30
40
50
60
70
80
90
100
surv
ivors
(%)
•••
•••••••••••••••
••••
••
•
0.1g MePiA/L••••
••••••
•••••••••••••••••••
•
0.1g MePA/L
··································································································································································································································································································································································································································
beg
intr
eatm
ents
··································································································································································································································································································································································································································
end
trea
tmen
ts
··································································································································································································································································································································································································································
resu
me
trea
tmen
t
Figure 2: Survival curve datasets for the MePA-vs-MePiA-treated ICR female weanling mice experiment. The bluegroup was treated with 0.1g MePA per liter of drinking wa-ter, and the red group was treated with 0.1g MePiA per literof drinking water. Treatment commenced at 24.7 weeks ofage and ended at 109.6 weeks of age. Treatment resumedat 161.9 weeks in an effort to keep ELLM alive as long aspossible.
The Aardsma model has three potentially free
parameters: A, K, and R. It was pointed outin BC108 that A may be treated as a fixed pa-
rameter when the model is used to compare sur-vival curves for organisms of a given type.17 This
reduces the model from three to two parameters.The two-parameter model simplifies interpretationof the fit. Specifically, whatever changes in aging
there may be within the datasets being comparedwill show up as changes to K. Since all of the
survival curves of interest this issue are for ICRfemale weanling mice, it is expedient to use the
two-parameter model.
Determination of Model Parameter A for
ICR Female Weanling Mice
To determine the value of A for ICR female wean-
ling mice, datasets from four cohorts were used.These four cohorts are all of this type of mouse
ever used in the ARP Rodent Lab. For the firstthree cohorts, the treated and control mice in each
cohort were pooled to produce a survival curve for
17Gerald E. Aardsma, “Human Aging is a Two-Phase Dis-ease,” The Biblical Chronologist 10.8 (May 13, 2020): 4.www.BiblicalChronologist.org.

4 The Biblical Chronologist Volume 10, Number 9
that cohort. The fourth cohort was split into the
two groups depicted in Figure 2. This split wasnecessary because of the difference in longevity
between MePA-treated and MePiA-treated mice.This produced five independent datasets for ICR
female weanling mice (Figure 3).
0 1 2 3 4 5 6
dataset number
0.035
0.040
0.045
0.050
0.055
0.060
0.065
0.070
0.075
0.080
0.085
A(p
erw
eek)
•
•
•
•
•
··
··································································· ·························································
·····································································································
·······························································
·········
·········
········· ·········
·········
·········
·········
·········
·········
·········
············· ············· ············· ············· ············· ············· ············· ············· ············· ············· ············· ············· ············· ············· ············· ············· ············· ············· ············· ·············
Figure 3: Values of free parameter A (±1 SD) resultingfrom three-parameter fits of the Aardsma model to the fivedatasets.
A three-parameter, weighted least-squares fit ofthe Aardsma model was performed with these five
datasets. Of the five A values obtained, three weregrouped (dataset numbers 2, 3, and 4) while two
appeared as separate outliers. Because A is ex-pected to be the same for organisms of a given
type, a weighted average of the three grouped val-ues was used to determine A for the two-parametermodel. This gave A = 0.070517, shown as the
dashed line in Figure 3.
Stock Drift in ICR Female Weanling Mice
Two-parameter fits of the Aardsma model to thefive datasets were then performed with A treated
as a fixed parameter having a value of 0.070517.The resulting K values are shown in Figure 4.
As K measures aging effects, the K values for
the first four datasets were expected to be simi-lar. Surprisingly, the first three datasets show a
slow, apparently real decline in K. This impliesa slow, small increase in life spans for these first
three cohorts.
0 1 2 3 4 5 6
dataset number
0.0
0.5
1.0
1.5
2.0
K(×
10−
5per
wee
k)
•
•
••
•
··················································
················ ························
···················
·········
·········
··················
·········
·········
·········
········· ·········
·········
cohort 1
cohort 2
cohort 3cohort 4a
cohort 4b
Figure 4: Values of free parameter K (±1 SD) resultingfrom two-parameter fits of the Aardsma model to the fivedatasets with A = 0.070517.
It is difficult to see how this slow drift in life
spans could be due to treatments or environmen-tal conditions in the ARP Lab. Rather, it seems
probably to represent what I will call “stock drift.”Stock drift includes, for example, genetic change or
improved removal of viruses affecting the breeder’sICR stock. This explanation is encouraged by the
length of time which elapsed between birthdatesof the four cohorts (Figure 5). A simple linear
drift with time adequately describes the changesobserved in these four K values.
1/1/2001 1/1/2009 1/1/2017
birthdates
1.4
1.5
1.6
1.7
1.8
1.9
2.0
2.1
K(×
10−
5per
wee
k)
•
•
•
•
·····························································································
········································································
·······································································································································
········
········
········
········
········
········
········
········
············· ············· ············· ············· ············· ············· ············· ············· ············· ············· ············· ············· ············· ············· ············· ············· ············· ············· ············· ············· ············· ············· ············· ·
cohort 1
cohort 2
cohort 3
cohort 4a
Figure 5: K (±1 SD) for datasets versus birthdates for co-horts showing stock drift with time.
Volume 10, Number 9 The Biblical Chronologist 5
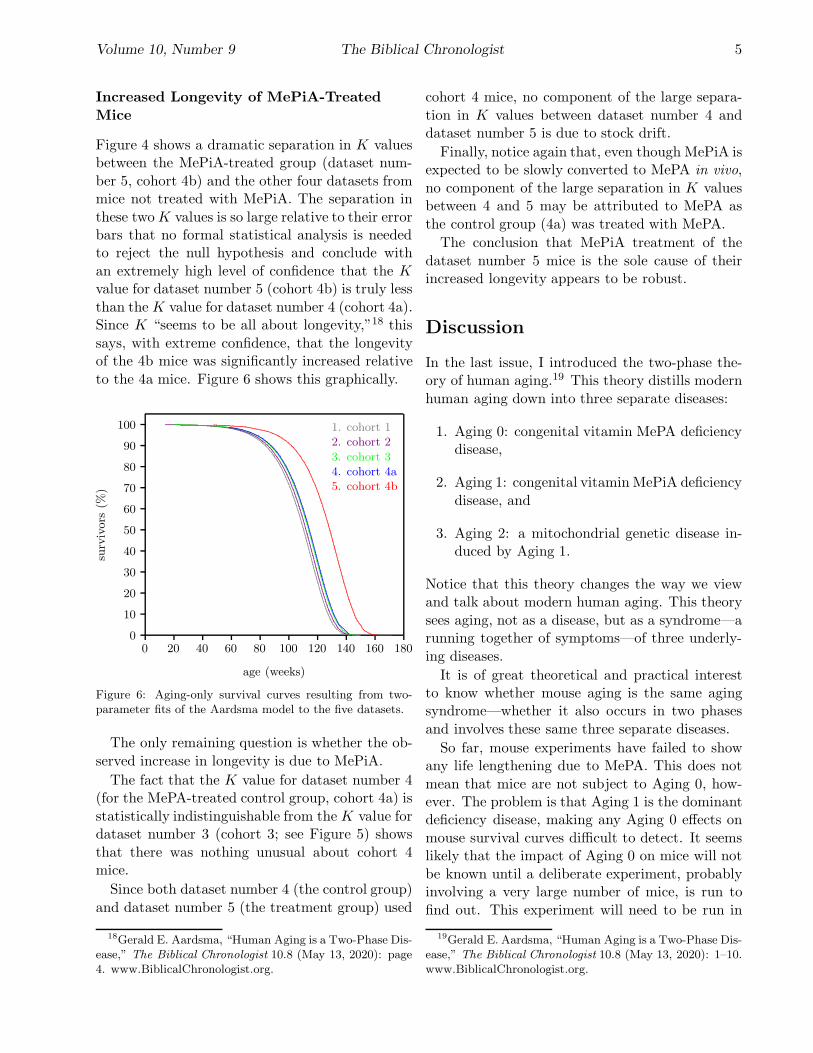
Increased Longevity of MePiA-Treated
Mice
Figure 4 shows a dramatic separation in K valuesbetween the MePiA-treated group (dataset num-
ber 5, cohort 4b) and the other four datasets frommice not treated with MePiA. The separation in
these two K values is so large relative to their errorbars that no formal statistical analysis is neededto reject the null hypothesis and conclude with
an extremely high level of confidence that the K
value for dataset number 5 (cohort 4b) is truly less
than the K value for dataset number 4 (cohort 4a).Since K “seems to be all about longevity,”18 this
says, with extreme confidence, that the longevityof the 4b mice was significantly increased relative
to the 4a mice. Figure 6 shows this graphically.
0 20 40 60 80 100 120 140 160 180
age (weeks)
0
10
20
30
40
50
60
70
80
90
100
surv
ivors
(%)
...............................................................................................................................................................................................................................................................................................................................................................................................................................................................................................................................................................................................................................................
1. cohort 1..........................................................................................................................................................................................................................................................................................................................................................................................................................................................................................................................................................................................................................................................................
2. cohort 2
..................................................................................................................................................................................................................................................................................................................................................................................................................................................................................................................................................................................................................................................................
3. cohort 3
.....................................................................................................................................................................................................................................................................................................................................................................................................................................................................................................................
4. cohort 4a
................................................................................................................................................................................................................................................................................................................................................................................................................................................................................................................................................................................................................................
5. cohort 4b
Figure 6: Aging-only survival curves resulting from two-parameter fits of the Aardsma model to the five datasets.
The only remaining question is whether the ob-
served increase in longevity is due to MePiA.
The fact that the K value for dataset number 4(for the MePA-treated control group, cohort 4a) is
statistically indistinguishable from the K value fordataset number 3 (cohort 3; see Figure 5) shows
that there was nothing unusual about cohort 4mice.
Since both dataset number 4 (the control group)
and dataset number 5 (the treatment group) used
18Gerald E. Aardsma, “Human Aging is a Two-Phase Dis-ease,” The Biblical Chronologist 10.8 (May 13, 2020): page4. www.BiblicalChronologist.org.
cohort 4 mice, no component of the large separa-
tion in K values between dataset number 4 anddataset number 5 is due to stock drift.
Finally, notice again that, even though MePiA isexpected to be slowly converted to MePA in vivo,
no component of the large separation in K valuesbetween 4 and 5 may be attributed to MePA as
the control group (4a) was treated with MePA.
The conclusion that MePiA treatment of the
dataset number 5 mice is the sole cause of theirincreased longevity appears to be robust.
Discussion
In the last issue, I introduced the two-phase the-ory of human aging.19 This theory distills modern
human aging down into three separate diseases:
1. Aging 0: congenital vitamin MePA deficiencydisease,
2. Aging 1: congenital vitamin MePiA deficiency
disease, and
3. Aging 2: a mitochondrial genetic disease in-duced by Aging 1.
Notice that this theory changes the way we viewand talk about modern human aging. This theory
sees aging, not as a disease, but as a syndrome—arunning together of symptoms—of three underly-
ing diseases.
It is of great theoretical and practical interestto know whether mouse aging is the same agingsyndrome—whether it also occurs in two phases
and involves these same three separate diseases.
So far, mouse experiments have failed to showany life lengthening due to MePA. This does not
mean that mice are not subject to Aging 0, how-ever. The problem is that Aging 1 is the dominantdeficiency disease, making any Aging 0 effects on
mouse survival curves difficult to detect. It seemslikely that the impact of Aging 0 on mice will not
be known until a deliberate experiment, probablyinvolving a very large number of mice, is run to
find out. This experiment will need to be run in
19Gerald E. Aardsma, “Human Aging is a Two-Phase Dis-ease,” The Biblical Chronologist 10.8 (May 13, 2020): 1–10.www.BiblicalChronologist.org.

6 The Biblical Chronologist Volume 10, Number 9
the absence of dietary MePiA since MePiA oxi-
dizes to produce MePA. In other words, it will needto be run on mice who are afflicted with the domi-
nant Aging 1 disease, which will continue to makeMePA-specific effects difficult to detect. Because
of the urgent need to know more about Aging 1and Aging 2, this experiment is likely to be of lowpriority and is probably some years off.
Because MePiA lengthens life spans of mice, itis clear that mice are subject to Aging 1. From
a theoretical perspective, this is not very surpris-ing. It is really just saying that mice suffer free
radical tissue damage which MePiA ameliorates.Aging 1 in mice is of great interest at present andseems sure to be intensely studied going forward.
Looming questions at present include the effect onlongevity of MePiA treatments at different concen-
trations, and the effect on longevity of beginningMePiA treatment at different ages.
Work with progeroid mice seems to imply thatmice are subject to Aging 2.20 These mice havean artificially created mtDNA repair defect which
causes them to show symptoms of aging earlierthan usual and to die sooner than usual. This arti-
ficial mtDNA repair defect in mice seems to be sim-ply a way of hastening what free radical damage
of mtDNA accomplishes in humans, namely, dys-functional scrapping of damaged mtDNA, which
equates to induction of Aging 2.21 Thus, symp-toms of aging in normal mice, including aging
death, appear to be due to Aging 2.
Since mice appear to be subject to Aging 1 andAging 2, they should serve as useful experimen-
tal models for further research into human aging,allowing such urgent questions as the efficacy of
MePiA for combating Aging 2 to be answered.Specifically, if Aging 2 is present in mice and not
responsive to MePiA, then a graph of life length-ening versus MePiA treatment starting age shoulddecline suddenly at the age of onset of Aging 2. If
Aging 2 is responsive to MePiA in mice, then nosudden decline should be seen. Figure 6 suggests
20R. H. Hamalainen, J. C. Landoni, K. J. Ahlqvist, et al.“Defects in mtDNA replication challenge nuclear genomestability through nucleotide depletion and provide a uni-fying mechanism for mouse progerias,” Nature Metabolism
1.10 (1 October 2019): pages 958-965.21Gerald E. Aardsma, “Human Aging is a Two-Phase Dis-
ease,” The Biblical Chronologist 10.8 (May 13, 2020): 7–8.www.BiblicalChronologist.org.
that the age of onset for Aging 2 is approximately
one year for ICR female weanling mice. Treatmentof the cohort 4 mice began just prior to half a year
of age (Figure 2), seemingly well before Aging 2had begun.
Conclusion
The quest to find vitamin X is now over. MePiAhas successfully increased longevity in ICR female
weanling mice. The extraordinarily long life spanof ELLM makes her to be Exhibit A of this re-
sult (Figure 1), but she does not stand alone. Theleast-squares method includes all 27 mice of her
treated group in its determination of K, and it isthe reduction in K relative to the control group
which produces extreme (off the statistics charts)confidence in this result.
There is still much to learn. At present, wedon’t know the efficacious treatment concentrationrange of MePiA in mice. We don’t know how much
longer mice may live if treatments are begun atyounger ages. We don’t know whether mice are ge-
netically equipped to make best use of MePiA theway humans appear to be. What we have at this
stage are two undeniable facts: (1) pre-Flood hu-mans lived very much longer than modern humans,
and (2) mice whose diets have been supplementedwith MePiA live longer than mice who have not
been supplemented with MePiA. These two factsfind a common explanation in the hypothesis thatMePiA is a previously unknown exogenous antiox-
idant vitamin, the lack of which causes a vitamindeficiency disease, Aging 1, leading to premature
death.
Noah’s Flood reduced the natural source of
MePiA effectively to zero.22 Five and a half thou-sand years later, we are yet living in the shadow of
that global geophysical catastrophe23 so that thereremains today no functional natural source of vi-
tamin MePiA. To halt the ravages of Aging 1, it isnecessary to supplement one’s diet with this vita-
min artificially.
22Gerald E. Aardsma, Aging: Cause and Cure (Loda,IL: Aardsma Research and Publishing, 2017), pages 67–70.www.BiblicalChronologist.org.
23Gerald E. Aardsma, Noah’s Flood Happened 3520
B.C. (Loda, IL: Aardsma Research and Publishing, 2015).www.BiblicalChronologist.org.

Volume 10, Number 9 The Biblical Chronologist 7
Synchronous with the publication of Addendum
to Aging: Cause and Cure, I made available asa dietary supplement Dr. Aardsma’s Anti-Aging
Vitamins. This supplement contains both MePiAand MePA.24 The two-phase theory of human ag-
ing says that those who have not started takingthis supplement will have Aging 0 disease, Aging 1disease, and, if old enough, Aging 2 disease. If they
continue not taking this supplement, they will ageand die around 70 or 80 years of age as humans
have been aging and dying for some four and ahalf thousand years now. Those who take the sup-
plement will halt and cure Aging 0 disease, andthey will halt and cure Aging 1 disease. If they
started taking the supplement at a young enoughage, they will not contract Aging 2 disease. Their
life expectancy will then be on the order of tenthousand years, as previously calculated.25 If itis found to be the case that MePiA is effective
against Aging 2, then extended life expectancieswill also apply to individuals who started supple-
menting with the anti-aging vitamin duo after theyhad already contracted Aging 2. Any individuals
who stop supplementing their diets with the anti-aging vitamins will contract Aging 0 and Aging 1
again, just as surely as they would contract scurvyif they eliminated vitamin C from their diets, and
they will close the door to the only known hope atpresent of combating Aging 2 disease.
To maximize health and longevity, Rules 1 and
2 still apply:26
Rule 1: Whatever your age, begin tak-ing the vitamins without delay.
Rule 2: Take the vitamins without fail
every day. �
24Dr. Aardsma’s Anti-Aging Vitamins can be obtainedvia AgingCauseAndCure.com/get-vitamin-mepa/.
25Gerald E. Aardsma, “Effect of the Anti-Aging Vitaminson Life Expectancy Today,” The Biblical Chronologist 10.6(April 7, 2020): 1–8. www.BiblicalChronologist.org.
26Gerald E. Aardsma, “Effect of the Anti-Aging Vitaminson Life Expectancy Today,” The Biblical Chronologist 10.6(April 7, 2020): 6–7. www.BiblicalChronologist.org.
The Biblical Chronologist is written and edited by Ger-ald E. Aardsma, a Ph.D. scientist (nuclear physics) withspecial background in radioisotopic dating methods suchas radiocarbon. The Biblical Chronologist has a fourfoldpurpose:
1. to encourage, enrich, and strengthen the faith ofconservative Christians through instruction in bib-lical chronology and its many implications,
2. to foster informed, up-to-date, scholarly researchin this vital field,
3. to communicate current developments and discov-eries stemming from biblical chronology in an eas-ily understood manner, and
4. to advance the growth of knowledge via a properintegration of ancient biblical and modern scien-tific data and ideas.
The Biblical Chronologist (ISSN 1081-762X) is pub-lished by:
Aardsma Research & Publishing414 N Mulberry StLoda, IL 60948-9651Web address: www.biblicalchronologist.org.
Copyright c© 2020 by Aardsma Research & Publishing.