electrophoresis - qpcrupdate.deqpcrupdate.de/Bio-Rad-bulletin-5761.pdf · such as SYBR® Gold and...
6
electrophoresis Evaluation of RNA Integrity The traditional method for assessing the integrity of an RNA sample is by visual inspection after electrophoresis on a formaldehyde agarose gel in the presence of a fluorescent dye, such as ethidium bromide. Observation of two sharp bands, one each for the large and small subunit ribosomal RNAs (rRNAs), with the intensity of the larger band being about twice that of the smaller band, is indicative of intact RNA. While this method is rapid and inexpensive, interpretation of the data requires a fair amount of experience. A major limitation of this technique is its low sensitivity. The traditional method using ethidium bromide as a fluorescent intercalating agent requires on the order of 200 ng of RNA to make an accurate assessment of its integrity. The amount needed can be reduced by using alternative fluorescent dyes such as SYBR ® Gold and SYBR ® Green II RNA gel stain (Invitrogen Corporation). However, when RNAs are extracted from tissues (such as biopsies) that are available in very limited quantities, agarose gel analysis may not be possible. It should also be noted that this method relies on the use of formaldehyde and ethidium bromide, both toxic chemicals requiring special handling and waste disposal procedures. Analysis of RNA by Automated Electrophoresis A major improvement in RNA analysis occurred with the introduction of microfluidics-based electrophoresis systems (Imbeaud et al. 2005), such as the Experion automated electrophoresis system (Bio-Rad Laboratories, Inc.) and the Agilent 2100 bioanalyzer (Agilent Technologies, Inc.), that combine quantitation and quality assessment in a single step. These methods, which measure fluorescence of a fluorophore bound to very small amounts of RNA, overcome many of the limitations of agarose gel electrophoresis. With Bio-Rad’s Experion electrophoresis system, electrophoresis is conducted in channels of microchips (lab-on-a-chip technology developed by Caliper Life Sciences, Inc.) and requires as little as 100 pg of RNA to produce an electropherogram displaying two distinctive peaks of rRNAs. The digital data produced can be used for a series of computer-based analyses. While it is possible with little experience to assess the quality of the RNA preparation by visual inspection of the electropherogram, RNA integrity can be evaluated and quantitated automatically by comparing the area Vladimir Denisov, William Strong, Mark Walder, Jeff Gingrich, and Henri Wintz, Bio-Rad Laboratories, Inc., 6000 James Watson Drive, Hercules, CA 94547 Introduction Gene expression analysis is essential to our understanding of molecular processes involved in health and disease. The ability to accurately quantitate steady-state levels of RNA is critical for studying molecular mechanisms of gene expression regulation. RNA quantitation techniques, such as northern blots, DNA microarrays, and real-time quantitative PCR, rely on the use of not only pure but also intact RNA. High- throughput gene expression analysis requires rapid, reliable, and standardized evaluation of RNA integrity. Yet the methods to accurately and objectively evaluate the integrity of RNA molecules prior to embarking on time-consuming, labor- intensive, and costly projects are limited. It is only recently that computerized methods have been developed to quantitate and evaluate the integrity of RNA samples. In this note, we describe the development and validation of a method for RNA quality assessment, the RNA quality indicator (RQI), a new feature of the Experion automated electrophoresis system that automatically assesses the integrity of RNA samples. RNA Analysis and Quality Assessment Evaluation of RNA Purity and Concentration Spectrophotometric methods to evaluate RNA concentrations and purity are well established and widely used. Absorbance at 260 nm (A260) gives an accurate measure of RNA concentration, and the ratio A260/A280 is an accepted indicator of the purity of an RNA preparation with respect to protein or phenol contaminations. Yet, these methods by themselves may give misleading results because they do not give any information on DNA contamination, the degradation state, or integrity of the sample. While RNA concentration and quality are important parameters for successful downstream applications, RNA integrity is of utmost importance when applications involve RNA quantitation for gene expression studies such as quantitative real-time RT-PCR and cDNA microarrays. Using partially degraded RNA from various states of degradation will lead to varying and incorrect quantitation results, both in microarray experiments and real-time PCR experiments (Fleige and Pfaffl 2006, Gingrich et al. 2006). tech note 5761 Development and Validation of RQI: An RNA Quality Indicator for the Experion ™ Automated Electrophoresis System
-
Upload
duongtuyen -
Category
Documents
-
view
214 -
download
0
Transcript of electrophoresis - qpcrupdate.deqpcrupdate.de/Bio-Rad-bulletin-5761.pdf · such as SYBR® Gold and...

electrophoresis
Evaluation of RNA Integrity
The traditional method for assessing the integrity of an RNA sample is by visual inspection after electrophoresis on a formaldehyde agarose gel in the presence of a fluorescent dye, such as ethidium bromide. Observation of two sharp bands, one each for the large and small subunit ribosomal RNAs (rRNAs), with the intensity of the larger band being about twice that of the smaller band, is indicative of intact RNA. While this method is rapid and inexpensive, interpretation of the data requires a fair amount of experience.
A major limitation of this technique is its low sensitivity. The traditional method using ethidium bromide as a fluorescent intercalating agent requires on the order of 200 ng of RNA to make an accurate assessment of its integrity. The amount needed can be reduced by using alternative fluorescent dyes such as SYBR® Gold and SYBR® Green II RNA gel stain (Invitrogen Corporation). However, when RNAs are extracted from tissues (such as biopsies) that are available in very limited quantities, agarose gel analysis may not be possible. It should also be noted that this method relies on the use of formaldehyde and ethidium bromide, both toxic chemicals requiring special handling and waste disposal procedures.
Analysis of RNA by Automated Electrophoresis
A major improvement in RNA analysis occurred with the introduction of microfluidics-based electrophoresis systems (Imbeaud et al. 2005), such as the Experion automated electrophoresis system (Bio-Rad Laboratories, Inc.) and the Agilent 2100 bioanalyzer (Agilent Technologies, Inc.), that combine quantitation and quality assessment in a single step. These methods, which measure fluorescence of a fluorophore bound to very small amounts of RNA, overcome many of the limitations of agarose gel electrophoresis. With Bio-Rad’s Experion electrophoresis system, electrophoresis is conducted in channels of microchips (lab-on-a-chip technology developed by Caliper Life Sciences, Inc.) and requires as little as 100 pg of RNA to produce an electropherogram displaying two distinctive peaks of rRNAs. The digital data produced can be used for a series of computer-based analyses. While it is possible with little experience to assess the quality of the RNA preparation by visual inspection of the electropherogram, RNA integrity can be evaluated and quantitated automatically by comparing the area
Vladimir Denisov, William Strong, Mark Walder, Jeff Gingrich, and Henri Wintz, Bio-Rad Laboratories, Inc., 6000 James Watson Drive, Hercules, CA 94547
IntroductionGene expression analysis is essential to our understanding of molecular processes involved in health and disease. The ability to accurately quantitate steady-state levels of RNA is critical for studying molecular mechanisms of gene expression regulation. RNA quantitation techniques, such as northern blots, DNA microarrays, and real-time quantitative PCR, rely on the use of not only pure but also intact RNA. High-throughput gene expression analysis requires rapid, reliable, and standardized evaluation of RNA integrity. Yet the methods to accurately and objectively evaluate the integrity of RNA molecules prior to embarking on time-consuming, labor-intensive, and costly projects are limited. It is only recently that computerized methods have been developed to quantitate and evaluate the integrity of RNA samples. In this note, we describe the development and validation of a method for RNA quality assessment, the RNA quality indicator (RQI), a new feature of the Experion automated electrophoresis system that automatically assesses the integrity of RNA samples.
RNA Analysis and Quality Assessment Evaluation of RNA Purity and Concentration
Spectrophotometric methods to evaluate RNA concentrations and purity are well established and widely used. Absorbance at 260 nm (A260) gives an accurate measure of RNA concentration, and the ratio A260/A280 is an accepted indicator of the purity of an RNA preparation with respect to protein or phenol contaminations. Yet, these methods by themselves may give misleading results because they do not give any information on DNA contamination, the degradation state, or integrity of the sample. While RNA concentration and quality are important parameters for successful downstream applications, RNA integrity is of utmost importance when applications involve RNA quantitation for gene expression studies such as quantitative real-time RT-PCR and cDNA microarrays. Using partially degraded RNA from various states of degradation will lead to varying and incorrect quantitation results, both in microarray experiments and real-time PCR experiments (Fleige and Pfaffl 2006, Gingrich et al. 2006).
tech note 5761
Development and Validation of RQI: An RNA Quality Indicator for the Experion™ Automated Electrophoresis System
of the peaks corresponding to the rRNAs. In theory, a 28S/18S rRNA ratio close to 2 should be indicative of intact RNA. However, in reality, the rRNA ratio may not be very reliable because the peak area measurements are dependent on the chosen start and end points of the peaks (Auer et al. 2003). In addition the correlation between rRNA integrity and mRNA integrity is not clear because different RNA (including 18S and 28S rRNA) may degrade at different rates (Gingrich 2006).
The RNA Integrity Number (RIN)
Because of the limited utility of and reproducibility of rRNA ratios to assess RNA integrity, Agilent Technologies introduced the user-independent classifier RIN to quantify RNA integrity. The RIN algorithm calculates RNA integrity using a Bayesian learning network that takes into consideration 8 features from the electrophoretic trace, including total RNA ratio (rRNA peaks to total area of the electropherograms), height of the 18S rRNA peak, ratio of the fast migrating RNAs to the total area of the electropherograms, and height of the lower marker (Imbeaud et al. 2005). The output RIN is a number between 1 (completely degraded RNA) and 10 (intact RNA).
The Degradometer
The absence of a standard method to assess RNA quality using electrophoresis profiles generated by the Agilent 2100 bioanalyzer drove the early development of the Degradometer (http://www.dnaarrays.org/downloads.php), a software that quantitates RNA degradation based on the 18S rRNA peak and a “degradation signal,” a region in front of the 18S rRNA peak where degraded RNA fragments migrate. The degradation factor is calculated as the ratio of the degradation signal mean value to the 18S peak (peak area) and is expressed as a percentage. This computerized method of assessing RNA integrity removed the bias introduced by human assessment
based on agarose gel electrophoresis (Auer et al. 2003). The Degradometer also provided a convenient color-coding system for ease of classification of RNA samples based on quality.
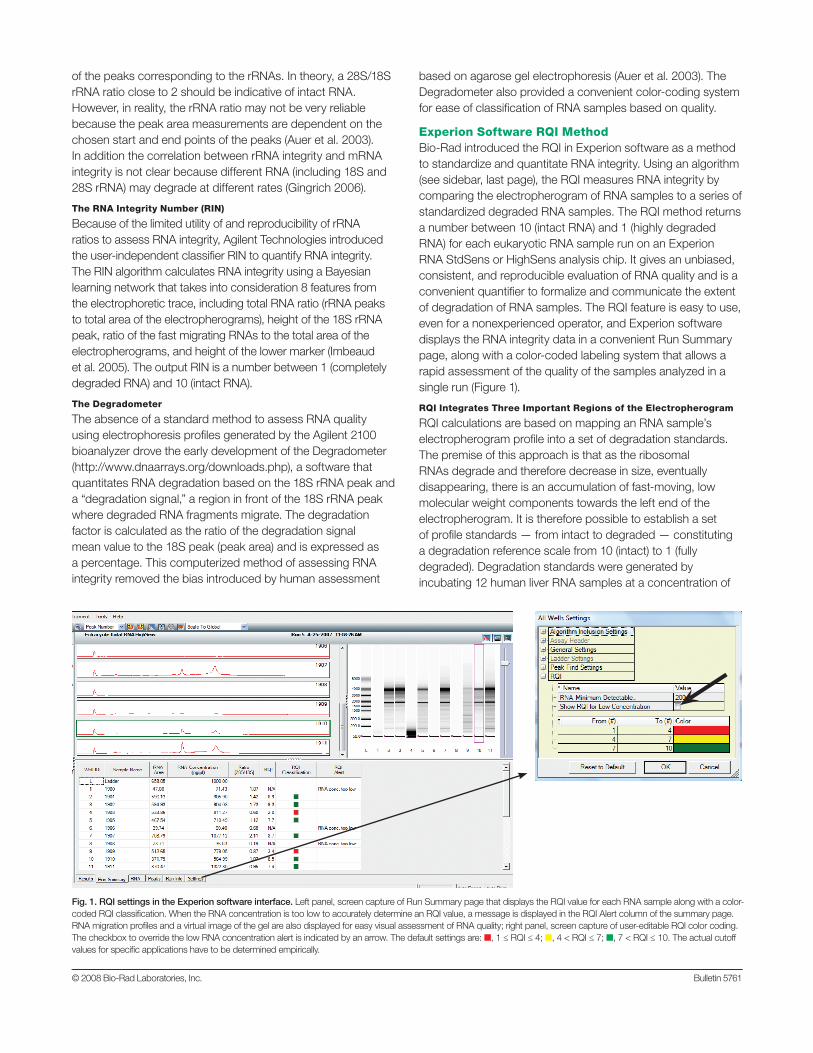
Experion Software RQI MethodBio-Rad introduced the RQI in Experion software as a method to standardize and quantitate RNA integrity. Using an algorithm (see sidebar, last page), the RQI measures RNA integrity by comparing the electropherogram of RNA samples to a series of standardized degraded RNA samples. The RQI method returns a number between 10 (intact RNA) and 1 (highly degraded RNA) for each eukaryotic RNA sample run on an Experion RNA StdSens or HighSens analysis chip. It gives an unbiased, consistent, and reproducible evaluation of RNA quality and is a convenient quantifier to formalize and communicate the extent of degradation of RNA samples. The RQI feature is easy to use, even for a nonexperienced operator, and Experion software displays the RNA integrity data in a convenient Run Summary page, along with a color-coded labeling system that allows a rapid assessment of the quality of the samples analyzed in a single run (Figure 1).
RQI Integrates Three Important Regions of the Electropherogram
RQI calculations are based on mapping an RNA sample’s electropherogram profile into a set of degradation standards. The premise of this approach is that as the ribosomal RNAs degrade and therefore decrease in size, eventually disappearing, there is an accumulation of fast-moving, low molecular weight components towards the left end of the electropherogram. It is therefore possible to establish a set of profile standards — from intact to degraded — constituting a degradation reference scale from 10 (intact) to 1 (fully degraded). Degradation standards were generated by incubating 12 human liver RNA samples at a concentration of
Fig. 1. RQI settings in the Experion software interface. Left panel, screen capture of Run Summary page that displays the RQI value for each RNA sample along with a color-coded RQI classification. When the RNA concentration is too low to accurately determine an RQI value, a message is displayed in the RQI Alert column of the summary page. RNA migration profiles and a virtual image of the gel are also displayed for easy visual assessment of RNA quality; right panel, screen capture of user-editable RQI color coding. The checkbox to override the low RNA concentration alert is indicated by an arrow. The default settings are: n, 1 ≤ RQI ≤ 4; n, 4 < RQI ≤ 7; n, 7 < RQI ≤ 10. The actual cutoff values for specific applications have to be determined empirically.
© 2008 Bio-Rad Laboratories, Inc. Bulletin 5761
© 2008 Bio-Rad Laboratories, Inc. Bulletin 5761
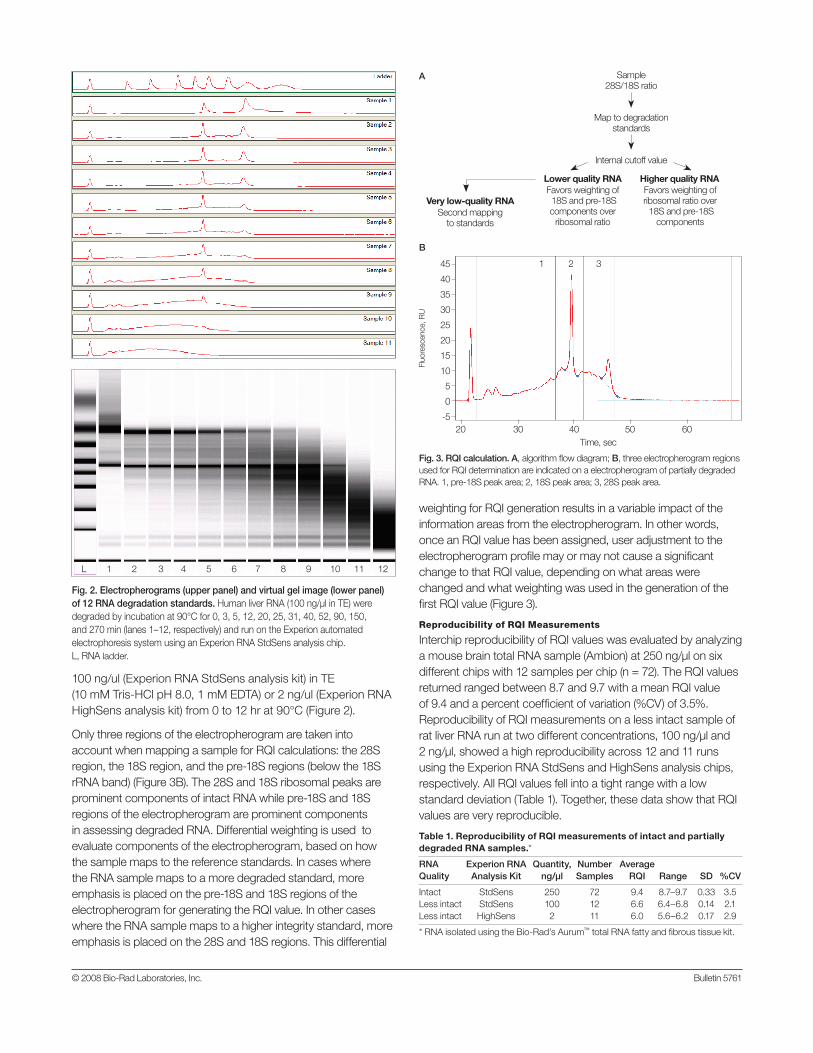
100 ng/ul (Experion RNA StdSens analysis kit) in TE (10 mM Tris-HCl pH 8.0, 1 mM EDTA) or 2 ng/ul (Experion RNA HighSens analysis kit) from 0 to 12 hr at 90°C (Figure 2).
Only three regions of the electropherogram are taken into account when mapping a sample for RQI calculations: the 28S region, the 18S region, and the pre-18S regions (below the 18S rRNA band) (Figure 3B). The 28S and 18S ribosomal peaks are prominent components of intact RNA while pre-18S and 18S regions of the electropherogram are prominent components in assessing degraded RNA. Differential weighting is used to evaluate components of the electropherogram, based on how the sample maps to the reference standards. In cases where the RNA sample maps to a more degraded standard, more emphasis is placed on the pre-18S and 18S regions of the electropherogram for generating the RQI value. In other cases where the RNA sample maps to a higher integrity standard, more emphasis is placed on the 28S and 18S regions. This differential
weighting for RQI generation results in a variable impact of the information areas from the electropherogram. In other words, once an RQI value has been assigned, user adjustment to the electropherogram profile may or may not cause a significant change to that RQI value, depending on what areas were changed and what weighting was used in the generation of the first RQI value (Figure 3).
Reproducibility of RQI Measurements
Interchip reproducibility of RQI values was evaluated by analyzing a mouse brain total RNA sample (Ambion) at 250 ng/µl on six different chips with 12 samples per chip (n = 72). The RQI values returned ranged between 8.7 and 9.7 with a mean RQI value of 9.4 and a percent coefficient of variation (%CV) of 3.5%. Reproducibility of RQI measurements on a less intact sample of rat liver RNA run at two different concentrations, 100 ng/µl and 2 ng/µl, showed a high reproducibility across 12 and 11 runs using the Experion RNA StdSens and HighSens analysis chips, respectively. All RQI values fell into a tight range with a low standard deviation (Table 1). Together, these data show that RQI values are very reproducible.
Table 1. Reproducibility of RQI measurements of intact and partially degraded RNA samples.*
RNA Experion RNA Quantity, Number Average Quality Analysis Kit ng/µl Samples RQI Range SD %CV
Intact StdSens 250 72 9.4 8.7–9.7 0.33 3.5Less intact StdSens 100 12 6.6 6.4–6.8 0.14 2.1Less intact HighSens 2 11 6.0 5.6–6.2 0.17 2.9
* RNA isolated using the Bio-Rad’s Aurum™ total RNA fatty and fibrous tissue kit.
Fig. 2. Electropherograms (upper panel) and virtual gel image (lower panel) of 12 RNA degradation standards. Human liver RNA (100 ng/µl in TE) were degraded by incubation at 90°C for 0, 3, 5, 12, 20, 25, 31, 40, 52, 90, 150, and 270 min (lanes 1–12, respectively) and run on the Experion automated electrophoresis system using an Experion RNA StdSens analysis chip. L, RNA ladder.
L 1 2 3 4 5 6 7 8 9 10 11 12
Fig. 3. RQI calculation. A, algorithm flow diagram; B, three electropherogram regions used for RQI determination are indicated on a electropherogram of partially degraded RNA. 1, pre-18S peak area; 2, 18S peak area; 3, 28S peak area.
45
40
35
30
25
20
15
10
5
0
-520 30 40 50 60
Time, sec
A
Second mapping to standards
Favors weighting of 18S and pre-18S components over
ribosomal ratio
Lower quality RNA
Very low-quality RNA
Higher quality RNAFavors weighting of ribosomal ratio over 18S and pre-18S
components
Sample 28S/18S ratio
Map to degradationstandards
Internal cutoff value
B
Fluo
resc
ence
, RU
1 2 3

RIN values. Additionally, hundreds of RNA samples were extracted and RQI values measured for a variety of tissues and organisms, including mouse liver, heart, brain, skin, cartilage, and skeletal muscle; rat brain and liver; rabbit lung; human neural blastoma biopsy samples; human endometrium biopsy samples; and HeLa, Jurkat, and HEPG2 cultured cells. All RQI values, independent of the methods used for RNA extraction (TRI reagent or membrane-based methods, such as Bio-Rad’s Aurum total RNA fatty and fibrous tissue kit or Aurum total RNA mini kit), could be confirmed by visual interpretation of the electropherograms.
Table 3. Comparison of RQI and RIN values for total RNA samples from various human tissues.*
Tissue RQI RIN Tissue RQI RIN
Adipose 8.1 7.7 Ovary 9.5 9.1Bladder 8.0 7.7 Placenta 7.6 7.3Brain 8.9 8.8 Pros tate 8.0 7.4Cervix 8.7 8.4 Skeletal muscle 9.3 9.2Colon 7.7 7.2 Spleen 9.4 9.2Esophagus 7.6 7.3 Testes 8.3 8.1Heart 8.9 8.2 Thymus 9.2 9.2Kidney 7.9 7.6 Thyroid 8.3 8.0Intestine 8.8 7.8 Trachea 8.4 8.0Liver 9.6 9.3 Liver 9.3 9.4Lung 8.1 7.4 Liver carcinoma 9.4 9.4
* From FirstChoice total RNA human survey panel.
© 2008 Bio-Rad Laboratories, Inc. Bulletin 5761
Linear Dynamic Range of RNA Concentrations for RQI Calculations
The effect of RNA concentration on RQI precision was determined by analyzing RNA samples with different levels of integrity. RNA samples were diluted to cover the entire dynamic range of the standard and high-sensitivity RNA chips. The qualitative detection range is 5–500 ng/μl and 100–5,000 pg/μl for Experion RNA StdSens and HighSens chips, respectively (Table 2).
Table 2. Lower limits of RNA concentrations for RNA detection and RQI determination.
Experion RNA Qualitative Lower Limit for Quantitative Analysis Kit LLOD* of RNA RQI Determination LLOD of RNA
StdSens 5 ng/µl ≥10 ng/µl 25 ng/µlHighSens 100 pg/µl ≥200 pg/µl 200 pg/µl
* Lower limit of detection.
To determine the lower limit of RNA concentrations for RQI determination using the Experion RNA StdSens chip, four samples of RNA from mouse and rat liver with different levels of integrity (RQI values ranging between ~3 and 9, Figure 4A, B) were used. Twelve serial dilutions (between 1–100 ng/μl) were prepared from each sample and run in triplicate on three StdSens analysis chips. The reported RQI values at each concentration, as measured by the Experion system (Figure 4A), indicate that a correct RQI value (within 1 unit of its expected value) is returned for RNA concentrations above 10 ng/μl.
The lower limit of RNA concentrations for RQI determination with the HighSens analysis chip was determined using an intact mouse liver RNA sample. Twelve RNA concentrations ranging between 10–10,000 pg/μl were analyzed in triplicate using HighSens analysis chips. The results (Figure 4B) indicate that the RQI value is accurately reported (within 1 unit of its expected value) above 200 pg/μl with the Experion RNA HighSens analysis chip.
These experiments showed that a reliable RQI value is reported at or below the actual lower limit of quantitative detection for RNA for both Experion RNA chips (Table 2). For samples whose concentrations fall below these thresholds, the Experion system cannot reliably report a valid RQI value and conveniently flags the sample by providing the comment “RNA conc. too low”. This cutoff can be overridden by the user by checking a box in the RQI settings (Figure 1), allowing display of the values in brackets.
Application of RQI to Different Tissues and Organisms
The RQI calculation algorithm was established using human liver RNA samples for standards and is intended to be used on eukaryotic samples. To test the applicability of the RQI feature to different RNA sample types, a variety of different sample tissues and sources were evaluated. These included a series of 20 human RNA samples from different tissues (FirstChoice human total RNA survey panel, Ambion), which were also measured by RIN (Table 3). This study indicated that the RQI method can be used to assess integrity of RNA from a variety of human tissues and compared to measured
Fig. 4. Effect of RNA concentration on RQI determination. A, RQI of different naturally degraded liver total RNA samples from mouse (red and yellow) and rat (blue and green) measured in triplicate at 12 RNA concentrations from 1–2,000 ng/ul (0 to 100 ng/µl shown above) using the Experion RNA StdSens analysis kit. B, RQI of a mouse liver total RNA sample measured in triplicate at various RNA concentrations from 10–10,000 pg/µl using the Experion RNA HighSens analysis kit.
10
9
8
7
6
5
4
3
RQ
IR
QI
0 10 20 30 40 50 60 70 80 90 100
0 10 100 1,000 10,000 100,000
RNA concentration, ng/µl
RNA concentration, pg/µl
10
8
6
4
2
0
A
B

Application of RQI to Different RNA Degradation Types
The RQI algorithm was established using heat-degraded RNA as reference samples. However, degradations that occur during the RNA extraction procedure are generally caused by the action of endogenous or exogenous RNases. To assess the validity of the RQI algorithm on such samples, RQI measurements of heat- and RNase-degraded RNA samples were compared. Endogenous RNase degradation was induced by incubating tissues (liver) at room temperature prior to RNA extraction. The two types of degradations yielded significantly different electrophoresis profiles as shown in Figure 5. One of the main differences resides in the size distribution of the degradation products. While heat degradation produces a homogenous population of fragments across all sizes, degradation by RNases yields fragments of discrete sizes that appear as distinct peaks
© 2008 Bio-Rad Laboratories, Inc. Bulletin 5761
Fig. 5. Comparison of electropherogram profiles and RQI values at different time points between natural RNase and heat-mediated degradations. RNA extracted from rat livers incubated at room temperature prior to extraction (left panels) are compared to profiles from heat-degraded RNAs (right panels). 18S and 28S rRNA peaks map at 40 sec and 47 sec respectively. RQI value and incubation time is indicated for each graph.
or spikes in the electropherogram. RQI calculations are not affected by the presence of the discrete bands of degraded RNAs in the pre-S18S region of the electropherogram. The RQI software will return a valid number assuming that both the 18S and 28S rRNA peaks have been correctly identified. Figure 5 shows that similar RQI values, compared to heat-degraded samples, were calculated across a wide range of “natural” degradation times (0–120 min).
Application of RQI Cutoff Values to Screen Samples
The RQI value can be used as a standardized measure of RNA integrity across samples and experiments. It provides an objective and consistent criterion to select samples that meet minimal integrity levels required for specific downstream applications. However, the connection between RQI value and the utility of a sample for a specific downstream application has to be determined empirically by the user. Once this value is known, it can be used to specify the color code used in the Run Summary page (Figure 1).
Correlation Between RQI and RIN
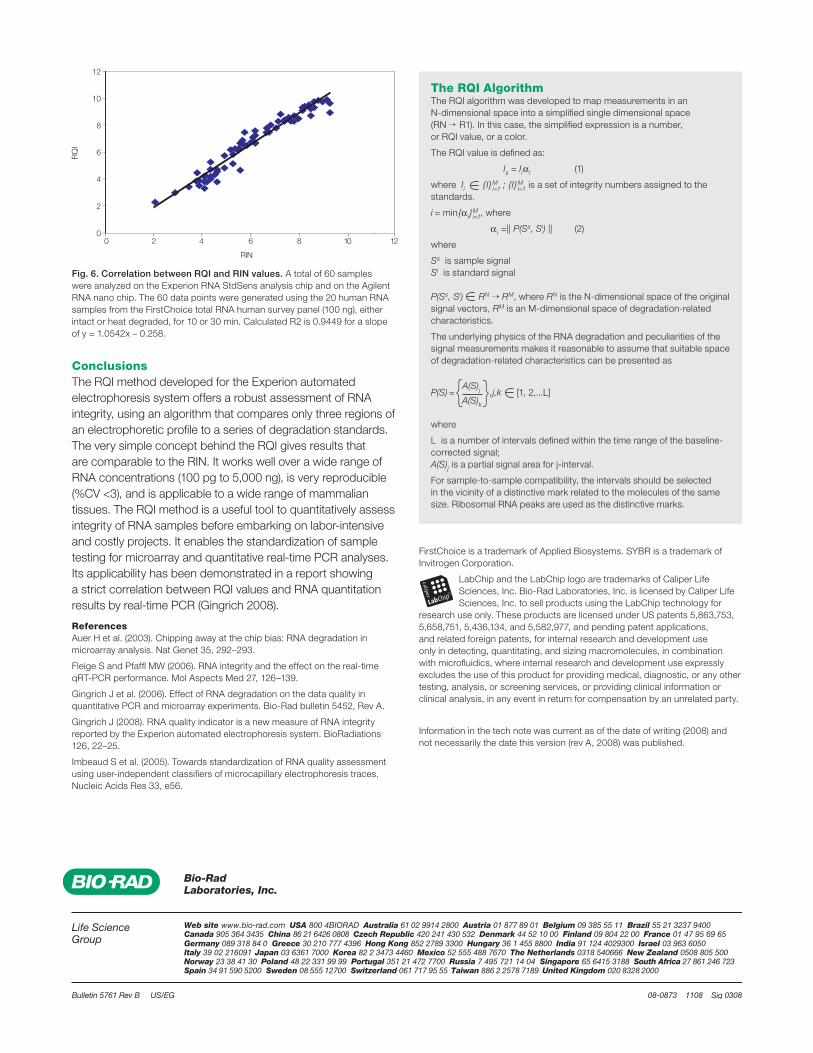
The correspondence between RQI and RIN values was demonstrated using 60 data points generated using the 20 human RNA samples from the FirstChoice total RNA human survey panel (100 ng), either intact or degraded, for 10 or 30 min. Each sample was analyzed on both the Experion system (using the Experion RNA StdSens analysis kit) and the Agilent 2100 bioanalyzer (using an Agilent RNA nano kit), and the measured RQI and RIN values were plotted (Figure 6). The best-fit line through the 60 data points shows a tight correlation with an R2 value of 0.9449, and within each case, the RQI and RIN values are within one unit of each other. Therefore, the RQI value, with its simpler algorithm that takes into account only three regions of the electropherogram, has been shown to be functionally equivalent to the RIN value in reliably determining RNA integrity.
Low Error Rate in RQI Determination
To date, over 2,500 RNA samples have been evaluated for RQI values. In this study, less than 1% of the lanes (22 out of 2,500) returned anomalous RQI results (>1 RQI unit different from value expected from visual inspection). Of that small percentage, the most frequent miscalled RQI value occurred due to miscalled ladder lanes, where RNA ladder fragments were misidentified by the software resulting in misidentification of the 18S and 28S regions. Since the RQI calculation relies on these regions, their improper identification leads to erroneous RQI values. This problem can be easily detected by visual inspection of the electropherogram and fixed by adjusting the peak identification parameters or by using manual integration (for the ladder well only) to add or delete ladder peaks to correct the miscalled band. Contamination with DNA may also affect the RQI readings. In rare cases, the peak of contaminating DNA may be identified as the 18S rRNA peak leading to an erroneous RQI value. This too can be corrected by redefining manually where the appropriate fragment starts and ends.
Fluo
resc
ence
, RU
RNAse Degraded
RQI: 8.4(5 min)
RQI: 7.0(12 min)
RQI: 4.2(40 min)
RQI: 2.8(120 min)
RQI: 8.4(5 min)
RQI: 6.7(20 min)
RQI: 4.3(45 min)
RQI: 2.6(90 min)
Heat Degraded
Fluo
resc
ence
, RU
Fluo
resc
ence
, RU
Fluo
resc
ence
, RU
400
300
200
100
0
400
300
200
100
0
200
150
100
50
0
250
200
150
100
50
0
50
40
30
20
10
0
50
40
30
20
10
0
25
20
15
10
5
0
25
20
15
10
5
0
20 30 40 50 60
20 30 40 50 60
20 30 40 50 60
20 30 40 50 60
Time, sec Time, sec
20 30 40 50 60
20 30 40 50 60
20 30 40 50 60
20 30 40 50 60
The RQI AlgorithmThe RQI algorithm was developed to map measurements in an N-dimensional space into a simplified single dimensional space (RN → R1). In this case, the simplified expression is a number, or RQI value, or a color.
The RQI value is defined as:
Is = Iia i (1)
where Ii {I}Mi=1 ; {I}
Mi=1 is a set of integrity numbers assigned to the
standards.
i = min{a i}Mi=1, where
a i =|| P(Ss, Si) || (2)
where
Ss is sample signal Si is standard signal
P(Ss, Si) RN → RM, where RN is the N-dimensional space of the original signal vectors, RM is an M-dimensional space of degradation-related characteristics.
The underlying physics of the RNA degradation and peculiarities of the signal measurements makes it reasonable to assume that suitable space of degradation-related characteristics can be presented as
P(S) = {A(S)j },j,k [1, 2,...L] A(S)k
where
L is a number of intervals defined within the time range of the baseline-corrected signal; A(S)j is a partial signal area for j-interval.
For sample-to-sample compatibility, the intervals should be selected in the vicinity of a distinctive mark related to the molecules of the same size. Ribosomal RNA peaks are used as the distinctive marks.
Fig. 6. Correlation between RQI and RIN values. A total of 60 samples were analyzed on the Experion RNA StdSens analysis chip and on the Agilent RNA nano chip. The 60 data points were generated using the 20 human RNA samples from the FirstChoice total RNA human survey panel (100 ng), either intact or heat degraded, for 10 or 30 min. Calculated R2 is 0.9449 for a slope of y = 1.0542x – 0.258.
ConclusionsThe RQI method developed for the Experion automated electrophoresis system offers a robust assessment of RNA integrity, using an algorithm that compares only three regions of an electrophoretic profile to a series of degradation standards. The very simple concept behind the RQI gives results that are comparable to the RIN. It works well over a wide range of RNA concentrations (100 pg to 5,000 ng), is very reproducible (%CV <3), and is applicable to a wide range of mammalian tissues. The RQI method is a useful tool to quantitatively assess integrity of RNA samples before embarking on labor-intensive and costly projects. It enables the standardization of sample testing for microarray and quantitative real-time PCR analyses. Its applicability has been demonstrated in a report showing a strict correlation between RQI values and RNA quantitation results by real-time PCR (Gingrich 2008).
ReferencesAuer H et al. (2003). Chipping away at the chip bias: RNA degradation in microarray analysis. Nat Genet 35, 292–293.
Fleige S and Pfaffl MW (2006). RNA integrity and the effect on the real-time qRT-PCR performance. Mol Aspects Med 27, 126–139.
Gingrich J et al. (2006). Effect of RNA degradation on the data quality in quantitative PCR and microarray experiments. Bio-Rad bulletin 5452, Rev A.
Gingrich J (2008). RNA quality indicator is a new measure of RNA integrity reported by the Experion automated electrophoresis system. BioRadiations 126, 22–25.
Imbeaud S et al. (2005). Towards standardization of RNA quality assessment using user-independent classifiers of microcapillary electrophoresis traces. Nucleic Acids Res 33, e56.
0 2 4 6 8 10 12
RIN
RQ
I12
10
8
6
4
2
0
Life Science Group
08-0873 1108 Sig 0308Bulletin 5761 Rev B US/EG
Bio-Rad Laboratories, Inc.
Web site www.bio-rad.com USA 800 4BIORAD Australia 61 02 9914 2800 Austria 01 877 89 01 Belgium 09 385 55 11 Brazil 55 21 3237 9400 Canada 905 364 3435 China 86 21 6426 0808 Czech Republic 420 241 430 532 Denmark 44 52 10 00 Finland 09 804 22 00 France 01 47 95 69 65 Germany 089 318 84 0 Greece 30 210 777 4396 Hong Kong 852 2789 3300 Hungary 36 1 455 8800 India 91 124 4029300 Israel 03 963 6050 Italy 39 02 216091 Japan 03 6361 7000 Korea 82 2 3473 4460 Mexico 52 555 488 7670 The Netherlands 0318 540666 New Zealand 0508 805 500 Norway 23 38 41 30 Poland 48 22 331 99 99 Portugal 351 21 472 7700 Russia 7 495 721 14 04 Singapore 65 6415 3188 South Africa 27 861 246 723 Spain 34 91 590 5200 Sweden 08 555 12700 Switzerland 061 717 95 55 Taiwan 886 2 2578 7189 United Kingdom 020 8328 2000
FirstChoice is a trademark of Applied Biosystems. SYBR is a trademark of Invitrogen Corporation.
LabChip and the LabChip logo are trademarks of Caliper Life Sciences, Inc. Bio-Rad Laboratories, Inc. is licensed by Caliper Life Sciences, Inc. to sell products using the LabChip technology for
research use only. These products are licensed under US patents 5,863,753, 5,658,751, 5,436,134, and 5,582,977, and pending patent applications, and related foreign patents, for internal research and development use only in detecting, quantitating, and sizing macromolecules, in combination with microfluidics, where internal research and development use expressly excludes the use of this product for providing medical, diagnostic, or any other testing, analysis, or screening services, or providing clinical information or clinical analysis, in any event in return for compensation by an unrelated party.
Information in the tech note was current as of the date of writing (2008) and not necessarily the date this version (rev A, 2008) was published.
R