
Electronic waste (e-waste) impacts and mitigation options ...
62
Energy Africa Compact – Sierra Leone Final report Electronic waste (e-waste) impacts and mitigation options in the off-grid renewable energy sector August 2016
Transcript of Electronic waste (e-waste) impacts and mitigation options ...
Energy Africa Compact – Sierra Leone Final report
Electronic waste (e-waste) impacts and mitigation options in the off-grid renewable energy sector
August 2016

This report and compact has been written by Federico Magalini, Deepali Sinha-Khetriwal, David Rochat, Jaco Huismann, Seth Munyambu, Joseph Oliech, Innocent Chidiabsu and Olivier Mbera and produced by Evidence on Demand with the assistance of the UK Department for International Development (DFID) contracted through the Climate, Environment, Infrastructure and Livelihoods Professional Evidence and Applied Knowledge Services (CEIL PEAKS) programme, jointly managed by HTSPE Limited and IMC Worldwide Limited. The views expressed in the report are entirely those of the author and do not necessarily represent DFID’s own views or policies, or those of Evidence on Demand. Comments and discussion on items related to content and opinion should be addressed to the author, via [email protected]. Cover Photo: School children from Kembu primary school holding solar lights, Longisa, Bomet county, Kenya. Photo: Corrie Wingate Photography / SolarAid via Flickr (CC BY). DOI:http://dx.doi.org/10.12774/eod_cr.august2016.Magalinifetal
First published October 2016 © CROWN COPYRIGHT


Contents
Acronyms and Abbreviations i Executive Summary ii
1. Impacts of off-grid solar household solutions at end-of-life 1
Baseline and Projected E-waste Burden 1
Impact of Solar Products at End-of-Life 3
International Evidence on Management Approaches to EOL Products 3
Existing International Activities 9
2. Legal framework and recycling infrastructure in Africa 11
Legal Framework and Challenges for Development and Implementation of E-waste Policies in Africa 11
Availability of Recycling Infrastructure & Markets for Fractions in Africa 15
3. Combined learning from Country Case studies 18
Main Lessons 18
The EOL Costs for Off Grid Products 19
4. Policy Recommendations 23
Roadmap for Policy Development 23
Roadmap for International Synergies 24
Roadmap for Collection and recycling Infrastructure Development 25
Roadmap for Awareness Raising and Capacity Building 25
5. Conclusions 27
6. References 29
7. Case study: Kenya 31
Country Overview 31
Legal Framework for E-waste 31
Collection and Recycling infrastructure 32
Market structure and dynamics 34
Costs for Recycling Products 35
Main Challenges & Opportunities 37
8. Case study: Nigeria 39
Country Overview 39

Legal Framework for E-waste 39
Market structure and dynamics 41
Costs for Recycling Products 43
Main Challenges & Opportunities 45
9. Case study: Rwanda 47
Country Overview 47
Legal Framework for E-waste 47
Collection and Recycling infrastructure 49
Market structure and dynamics 50
Costs for Recycling Products 52
Main Challenges & Opportunities 54

i
Acronyms and Abbreviations BFR Brominated Flame Retardant CFL Compact Fluorescent Lamps COP Conference of Parties DC Direct Current EEE Electric and Electronic Equipment EOL End of Life EPR Extended Producer Responsibility ESCO Energy Service Company GOGLA Global Off-Grid Lighting Association GSM Global System for Mobile Communications LED Light Emitting Diode lm Lumen MPPI Mobile Phone Partnership Initiative PACE Partnership on Action for Computing Equipment PAYG Pay-As-You-Go PCB Polychlorinated Biphenyls POM Put on Market PV (Modules) Photovoltaic (Modules) PWB Printed Wiring Boards SHS Solar Household Systems SPL Solar Portable Lamps t tonne WEEE Waste Electric and Electronic Equipment WG Waste (WEEE) Generated GOGLA Product categories Product Category Definition
PC 1 Single light source without external power outlet/ mobile phone charging < 100 lm
PC 2 Single light source with external power outlet/ mobile phone charging < 100 lm OR Single light source without external power outlet/ mobile phone charging > 100 lm
PC 3 Single light source with external power outlet/ mobile phone charging > 100 lm
PC 4 Multi light source application with external power outlet/ mobile phone charging
PC 5 Outdoor lighting, street lighting/ public lighting
PC 6 Lighting products of any other type not mentioned under category 1-5 of any size
PC 7 Providing multi-lighting, mobile charging, TV and/or fan above 69W

ii
Executive Summary Off-grid solar products have been revolutionizing the quality of life in Africa, especially in areas where energy access remains a challenge. According to the Social Impact Metrics from the Global Off-grid Lighting Association (GOGLA), over 76 million people worldwide have benefited from improved energy access from off-grid lighting products. Consumers are saving over GBP 2.6 billion from savings on lighting and phone charging costs compared to traditional energy sources. The broader societal benefits from better education, health, employment opportunities and environment are multi-fold. Therefore, many African governments, international agencies and private companies see off-grid solar as an opportunity to not only provide quick and affordable energy access, but also to meet broader sustainable development goals. The most promising off-grid lighting devices are Solar Portable Lights (SPL) and off-grid Solar Home Systems (SHS). They typically consist of one or more photovoltaic modules (PV), components to provide light or charge electric devices and battery storage. Depending on the component quality, these products are used for 3-5 years. Current waste volumes from this sector are almost negligible, in proportion to the quantity and environmental impact of the total e-waste stream. This report’s estimate of the expected volumes of end-of-life off-grid solar products in the 14 Energy Africa countries includes three case studies in Kenya, Nigeria and Rwanda. The estimates show that off-grid products represent less than 0.5% of the overall e-waste stream. In 2014, an estimated 2,500t of off-grid solar products were put on the market, and only 800t were expected in the waste stream, as compared to nearly 850,000t of Electrical and Electronic Equipment (EEE) put on market, and 460,000t of Waste EEE (WEEE). The overall economic impact for off-grid solar products is expected to be in the range of GBP 7.8m to 9.4m in 2017, varying from approximately 0.1 to 2.5% of product price. This estimate considers expected volumes across Africa and the potential collection and recycling costs. Due to rapid sector growth, the estimated volumes are expected to pass 10,000t by 2020. Therefore, the report makes the case for developing the end-of-life (EOL) management of off-grid solar products without delay. Approaching the inflexion point of rapid and widespread adoption, pro-actively developing EOL systems is key. Such systems should be efficient, effective, transparent and equitable. Based on the experiences in Africa and globally, the following is proposed:
• Establish targeted pilot-projects in collection and recycling of off-grid PV products, ideally with Pay-As-You-Go (PAYG) suppliers which provide interesting opportunities for return logistics.
• Develop targeted industry position papers as input for more efficient national legislation, which is based on more solid facts and figures.
• Develop awareness raising campaigns specifically designed for sound EOL management for off-grid PV products.
Practical suggestions are also made to support the three core recommendations above:
• Enhance partnerships with related industries to achieve joint solutions, • Develop practical toolkits for EOL management, • Create national focal groups, and • Develop options to overcome barriers in order to ship critical fractions to recyclers in other
countries.

1
1. Impacts of off-grid solar household solutions at end-of-life Baseline and Projected E-waste Burden Off-grid solar solutions became in recent years an enabler for increasing access to energy to off-grid regions around the world and in Africa in particular: out of the 1.2 billion people globally with no access to the grid, nearly 600 million live in sub-Saharan Africa (GOGLA, 2016). Solar Portable Lights (SPL) and off-grid Solar Home Systems (SHS) are rapidly spreading across Africa1; these products or systems consist of one or more photovoltaic modules (PV), some electric and electronic components to provide light or charge electric devices and battery storage. The total amount of Electric and Electronic Equipment (EEE) placed on selected African markets, and corresponding estimates of Waste EEE (WEEE), also called e-waste, generated (UNU, 2015a), is shown in the figure below. Results are obtained applying the so-called sales-lifespan model, in line with the common methodology to be adopted by the European Commission (UNU, 2015b), thus considering the past sales of products and the corresponding average lifespan prior the disposal; sales are obtained from COMTRADE database (UNU, 2015a) Figure 1 Evolution of total amount of EEE placed on national market in the 14 African countries and evolution of the total amount of e-waste generated (UNU, 2015a).
Sales are based on COMTRADE data. Data 2012-2017 are linear projections from 2000-2012 trends
1 Examples of products can be found here: https://www.lightingglobal.org/products/?view=grid
-
200,000
400,000
600,000
800,000
1,000,000
1,200,000
2000
2001
2002
2003
2004
2005
2006
2007
2008
2009
2010
2011
2012
2013
2014
2015
2016
2017
POM (EEE)
WG (WEEE)
2
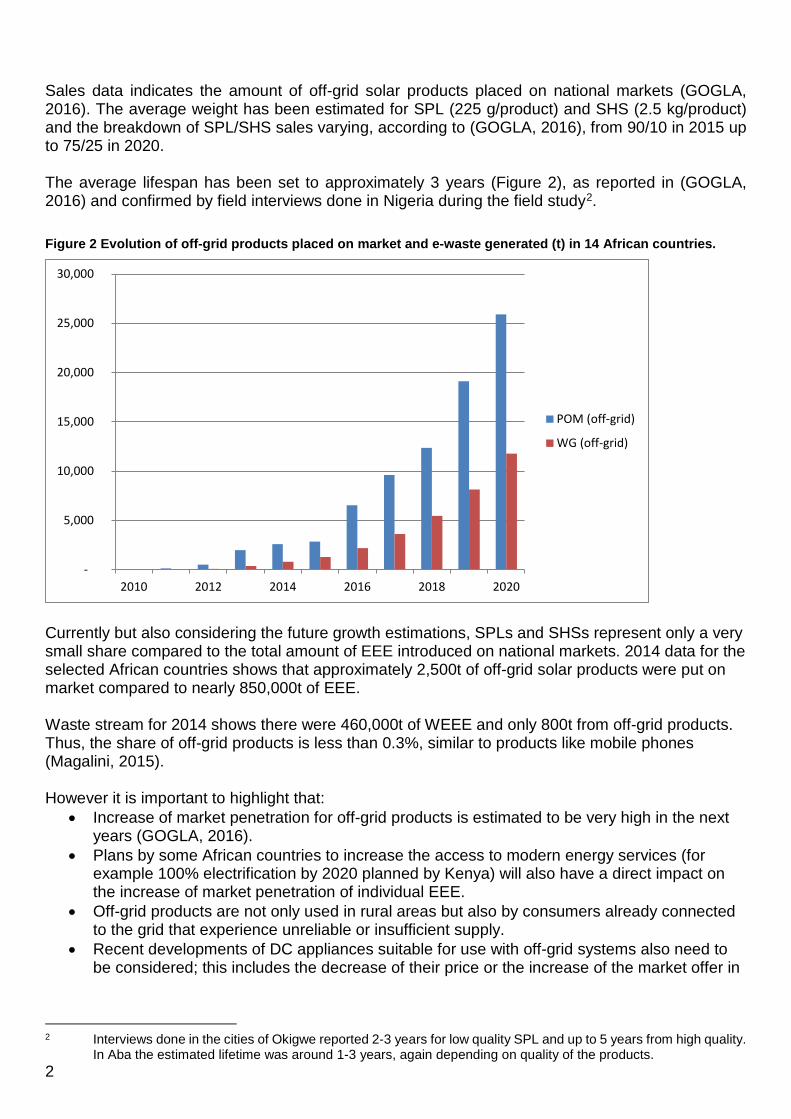
Sales data indicates the amount of off-grid solar products placed on national markets (GOGLA, 2016). The average weight has been estimated for SPL (225 g/product) and SHS (2.5 kg/product) and the breakdown of SPL/SHS sales varying, according to (GOGLA, 2016), from 90/10 in 2015 up to 75/25 in 2020. The average lifespan has been set to approximately 3 years (Figure 2), as reported in (GOGLA, 2016) and confirmed by field interviews done in Nigeria during the field study2. Figure 2 Evolution of off-grid products placed on market and e-waste generated (t) in 14 African countries.
Currently but also considering the future growth estimations, SPLs and SHSs represent only a very small share compared to the total amount of EEE introduced on national markets. 2014 data for the selected African countries shows that approximately 2,500t of off-grid solar products were put on market compared to nearly 850,000t of EEE. Waste stream for 2014 shows there were 460,000t of WEEE and only 800t from off-grid products. Thus, the share of off-grid products is less than 0.3%, similar to products like mobile phones (Magalini, 2015). However it is important to highlight that:
• Increase of market penetration for off-grid products is estimated to be very high in the next years (GOGLA, 2016).
• Plans by some African countries to increase the access to modern energy services (for example 100% electrification by 2020 planned by Kenya) will also have a direct impact on the increase of market penetration of individual EEE.
• Off-grid products are not only used in rural areas but also by consumers already connected to the grid that experience unreliable or insufficient supply.
• Recent developments of DC appliances suitable for use with off-grid systems also need to be considered; this includes the decrease of their price or the increase of the market offer in
2 Interviews done in the cities of Okigwe reported 2-3 years for low quality SPL and up to 5 years from high quality.
In Aba the estimated lifetime was around 1-3 years, again depending on quality of the products.
-
5,000
10,000
15,000
20,000
25,000
30,000
2010 2012 2014 2016 2018 2020
POM (off-grid)
WG (off-grid)

3
terms of models (GOGLA, 2016): this will include products like TVs and radio, refrigerators and fans.
So, in the next 5 to 10 years we might expect a growth not only in off-grid products arising as waste, but also a potential increase of other EEE due to energy access enabled by off-grid technologies. However, the impact of off-grid technologies on the generation of e-waste from TVs, refrigerators, fans and other EEE at large is difficult to predict. Impact of Solar Products at End-of-Life Off-grid solar products will have a direct and indirect impact at end-of-life:
• Impact on volume of e-waste generated: directly, there will be a small increase in volume of e-waste from EOL lamps, PV modules, cabling and control systems etc. Indirectly, there will also be the generation of e-waste through EEE acquired by households resulting from greater access to energy. This volume of e-waste is potentially larger than the volume of SHSs themselves, given the large number of consumer electronics, IT gadgets, household appliances etc. that consumer will demand following greater access to energy.
• Impact on the environment: immediate, and direct impact of inappropriate recycling or disposal of EOL products will mean local contamination, from example hazardous materials used in batteries. A study on the disposal of dry cell batteries (Bensch et. al 2015) showed that battery waste is frequently disposed of in nature, latrines, or open burning sites releasing toxic waste directly into the local environment. Indirectly, the impact of improper disposal is the loss of precious, often critical3 raw materials used in the production of solar products.
• Impact on finances: environmentally sound disposal of EOL solar products, especially batteries, can be expensive (see Table 2). Under the Extended Producer Responsibility (EPR) approach, the disposal costs of EOL products will impact producers/ distributors of solar products, depending on their ability to transfer these costs onto the consumer.
• In the absence of a funded collection and disposal mechanism, the financial burden of EOL disposal may be borne in the future by the government (i.e. taxpayers), users (who would need to pay for disposal), or existing industry (i.e. producers who put solar products on the market).
• Impact on policy and legislation: there will be a need for harmonisation and coordination between policies for access to energy and waste management.
International Evidence on Management Approaches to EOL Products Eventually all EEE and solar products become waste at the end of their life, sometimes after one or more repair/upgrade/reuse loops or after being used as source of spare parts or components by local repair shops, which are common in Africa in the electronic industry (OEKO, 2015)4. The most common policy measure for management of e-waste is through Extended Producer Responsibility (EPR) legislation, such as the European WEEE Directive. Whether off-grid products should or could be regarded as e-waste or not, is primarily a technical discussion and, secondly, a legal one, especially as solar products come under different legislative regimes in different jurisdictions. In some they are considered e-waste (e.g. EU) in some 3 Already in 2010 an expert group working of the Raw Materials Supply Group chaired by the European
Commission identified 14 metals as critical for EU economy. In the 2011 Communication on raw materials, the Commission formally adopted such initial list which has been updated in 2013 and includes 20 materials: Antimony, Indium, Beryllium, Borates, Chromium, Magnesium, Magnesite, Phosphorate rock, Coking coal, Cobalt, Niobium, Fluorspar, PGMs (Platinum Group Metals), Gallium, REEs (Heavy & Light), Silicon Metal, Grmanium, Graphite and Tungsten.
4 Data from Ethiopia on repair market.
4
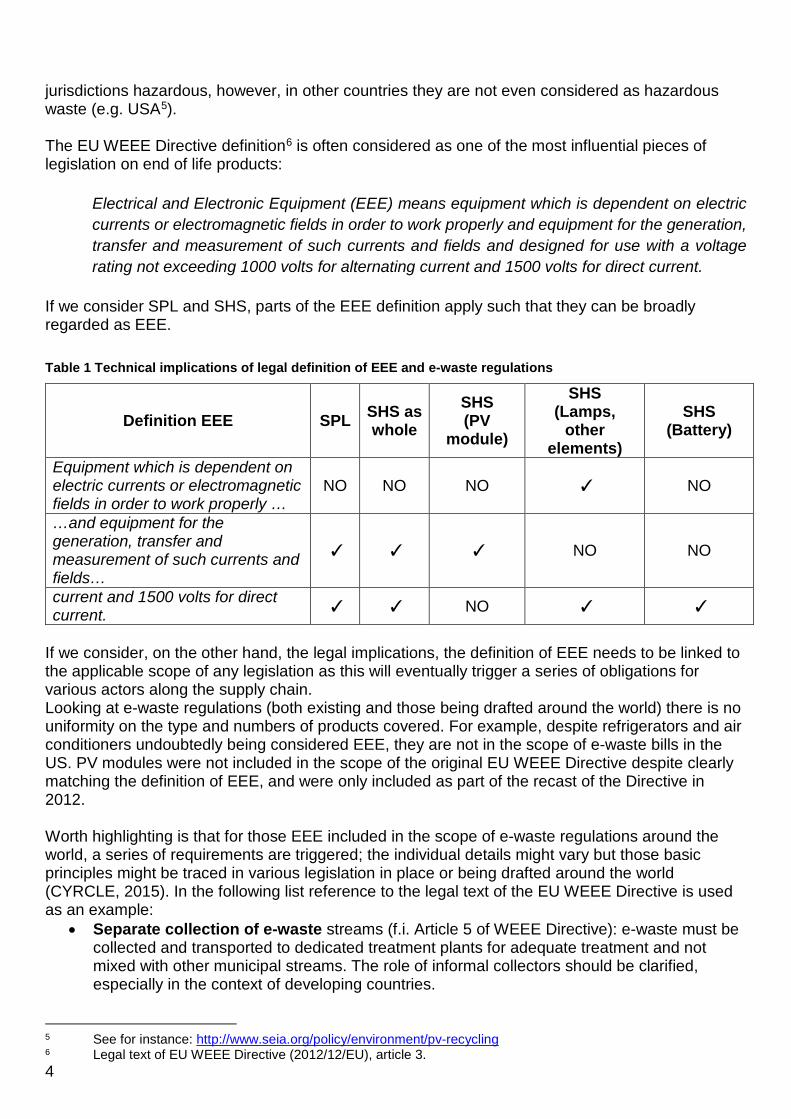
jurisdictions hazardous, however, in other countries they are not even considered as hazardous waste (e.g. USA5). The EU WEEE Directive definition6 is often considered as one of the most influential pieces of legislation on end of life products:
Electrical and Electronic Equipment (EEE) means equipment which is dependent on electric currents or electromagnetic fields in order to work properly and equipment for the generation, transfer and measurement of such currents and fields and designed for use with a voltage rating not exceeding 1000 volts for alternating current and 1500 volts for direct current.
If we consider SPL and SHS, parts of the EEE definition apply such that they can be broadly regarded as EEE. Table 1 Technical implications of legal definition of EEE and e-waste regulations
Definition EEE SPL SHS as whole
SHS (PV
module)
SHS (Lamps,
other elements)
SHS (Battery)
Equipment which is dependent on electric currents or electromagnetic fields in order to work properly …
NO NO NO ✓ NO
…and equipment for the generation, transfer and measurement of such currents and fields…
✓ ✓ ✓ NO NO
current and 1500 volts for direct current. ✓ ✓ NO ✓ ✓
If we consider, on the other hand, the legal implications, the definition of EEE needs to be linked to the applicable scope of any legislation as this will eventually trigger a series of obligations for various actors along the supply chain. Looking at e-waste regulations (both existing and those being drafted around the world) there is no uniformity on the type and numbers of products covered. For example, despite refrigerators and air conditioners undoubtedly being considered EEE, they are not in the scope of e-waste bills in the US. PV modules were not included in the scope of the original EU WEEE Directive despite clearly matching the definition of EEE, and were only included as part of the recast of the Directive in 2012. Worth highlighting is that for those EEE included in the scope of e-waste regulations around the world, a series of requirements are triggered; the individual details might vary but those basic principles might be traced in various legislation in place or being drafted around the world (CYRCLE, 2015). In the following list reference to the legal text of the EU WEEE Directive is used as an example:
• Separate collection of e-waste streams (f.i. Article 5 of WEEE Directive): e-waste must be collected and transported to dedicated treatment plants for adequate treatment and not mixed with other municipal streams. The role of informal collectors should be clarified, especially in the context of developing countries.
5 See for instance: http://www.seia.org/policy/environment/pv-recycling 6 Legal text of EU WEEE Directive (2012/12/EU), article 3.

5
• Specific treatment requirements and targets (f.i. Articles 7, 8 and 11 of WEEE Directive): all appliances collected must be treated in authorized facilities according to Best Available Techniques in order to ensure high level of environmental and human health protection; specific performance targets for collection and recovery might be established. Hazardous practices (like open burning of cables) should be prohibited.
• Financing mechanism for operations (f.i. Articles 12 and 13 of WEEE Directive): Financing of waste management activities and allocation of economic responsibilities along the downstream is a key element; the way stakeholders financially contribute to different activities varies and other models exist besides the EPR principle, which is used in the great majority of contexts: in California7 consumers pay for e-waste management upon purchase of new appliances while in Japan8 consumers (waste holders) pay for e-waste management when disposing of the equipment.
• Information and reporting requirements (f.i. Articles 14, 15 and 16 of WEEE Directive): one of the fundamental elements is the set up of a register of producers: this to ensure control over obliged parties for financing but also to keep records of EEE placed on national markets, WEEE collected, treated and recovered or recycled.
On an operational level, there are four main considerations for e-waste management systems for take-back and recycling operations:
• Access to waste: includes the costs (or revenues) to obtain the waste from the original holder (the consumer). In the majority of developed countries consumers get rid of their waste for free (or in some cases they have to pay); In the context of developing countries in most of the cases it is the opposite: the holder of the product to be discarded expects economic compensation when disposing off the waste.
• Collection: which depends on existing infrastructure, or in some cases might also mean the cost of setting it up, including for example hiring/ leasing a space, purchasing containers, cages, bins etc. to collect and store waste at the collection points. This also includes salary of staff at collection points.
• Transport: normally includes all the transportation costs from the collection point to the treatment plant or sometimes even from the consumers’ location itself, such as for door step collections.
• Treatment: represents the net costs for proper treatment, including disposal of hazardous fractions. Each treatment plant processing e-waste incurs in operative costs: labour costs, energy costs, depreciation of capital investment, other costs related to the functioning of the plant itself; e-waste being processed into the plant is dismantled and results in different fractions that are sold on national or international commodities markets. Some fractions have positive value (representing a revenue) while others have a negative value for disposal or further treatment (representing a cost).
Some key elements need to be taken into account when considering e-waste and comparing it with other existing waste streams:
• E-waste contains materials that are considered toxic, such as lead, mercury, cadmium, arsenic and polychlorinated biphenyls (PCBs), which are harmful to the environment and human health if improperly managed. Safe transport, disposal and handling might be very complicated and costly, particularly in the context of developing countries. For SPL and SHS examples include mercury contained in compact fluorescent lamps (CFLs) and lead or cadmium in batteries9
7 California bill: Electronic Waste Recycling Act (EWRA) was published in September 2003 (SB 20/2003, amended
by SB 50/2004). 8 Japan bill: law for promotion of effective utilization of resources (1991), law for the recycling of specific kinds of
home appliances (1998) and law for recycling of small electronic appliances (2013). 9 See for instance: Lighting Global, Eco Design Notes, Battery toxicity and Eco Product Design, September 2012
6
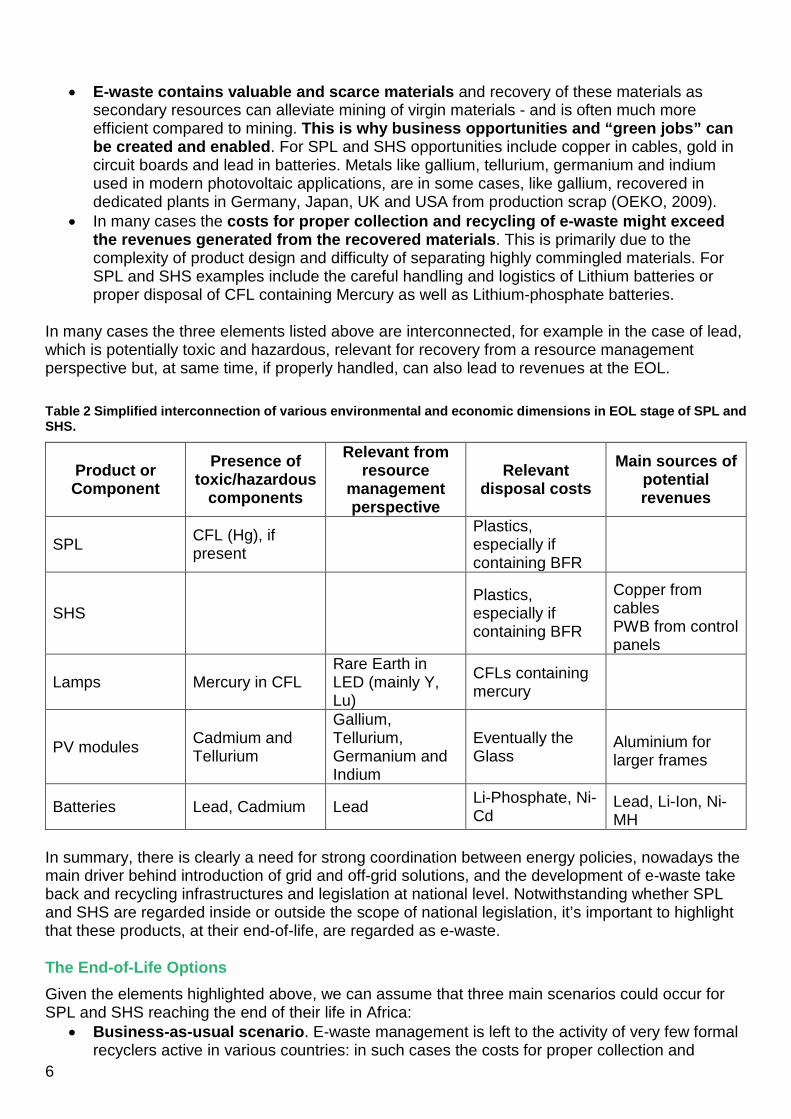
• E-waste contains valuable and scarce materials and recovery of these materials as secondary resources can alleviate mining of virgin materials - and is often much more efficient compared to mining. This is why business opportunities and “green jobs” can be created and enabled. For SPL and SHS opportunities include copper in cables, gold in circuit boards and lead in batteries. Metals like gallium, tellurium, germanium and indium used in modern photovoltaic applications, are in some cases, like gallium, recovered in dedicated plants in Germany, Japan, UK and USA from production scrap (OEKO, 2009).
• In many cases the costs for proper collection and recycling of e-waste might exceed the revenues generated from the recovered materials. This is primarily due to the complexity of product design and difficulty of separating highly commingled materials. For SPL and SHS examples include the careful handling and logistics of Lithium batteries or proper disposal of CFL containing Mercury as well as Lithium-phosphate batteries.
In many cases the three elements listed above are interconnected, for example in the case of lead, which is potentially toxic and hazardous, relevant for recovery from a resource management perspective but, at same time, if properly handled, can also lead to revenues at the EOL. Table 2 Simplified interconnection of various environmental and economic dimensions in EOL stage of SPL and SHS.
Product or Component
Presence of toxic/hazardous
components
Relevant from resource
management perspective
Relevant disposal costs
Main sources of potential revenues
SPL CFL (Hg), if present
Plastics, especially if containing BFR
SHS Plastics, especially if containing BFR
Copper from cables PWB from control panels
Lamps Mercury in CFL Rare Earth in LED (mainly Y, Lu)
CFLs containing mercury
PV modules Cadmium and Tellurium
Gallium, Tellurium, Germanium and Indium
Eventually the Glass
Aluminium for larger frames
Batteries Lead, Cadmium Lead Li-Phosphate, Ni-Cd
Lead, Li-Ion, Ni-MH
In summary, there is clearly a need for strong coordination between energy policies, nowadays the main driver behind introduction of grid and off-grid solutions, and the development of e-waste take back and recycling infrastructures and legislation at national level. Notwithstanding whether SPL and SHS are regarded inside or outside the scope of national legislation, it’s important to highlight that these products, at their end-of-life, are regarded as e-waste. The End-of-Life Options Given the elements highlighted above, we can assume that three main scenarios could occur for SPL and SHS reaching the end of their life in Africa:
• Business-as-usual scenario. E-waste management is left to the activity of very few formal recyclers active in various countries: in such cases the costs for proper collection and
7
treatment of the products has to be paid either by the person or company disposing of the product as the intrinsic economic value of SPL and SHS is not enough to compensate all the EOL costs (see chapter 3 and the individual case studies). On the other hand a great number of informal collectors and recyclers (UNEP, 2011; OEKO, 2014, Bates, 2014) extract with rudimental and often very hazardous and polluting technologies (Heacock et al, 2016) the economic value of some components, eventually harvesting and re-selling functioning components on the refurbishment market, neglecting the proper and environmentally sound disposal or treatment of all the other fractions.
• Voluntary take-back & recycling. In Europe, before the inclusion of PV panels in the scope
of the WEEE Directive, industry took a voluntary approach to ensure proper collection and recycling of PV modules. Founded in 2007 in the context of European Photovoltaic Industry Association (EPIA), PV CYCLE10 was the first pan-European Producer scheme for the treatment of photovoltaic waste across Europe before PV modules were included in the scope of WEEE Directive in 2012. PV CYCLE is operating through national subsidiaries that manage daily operations ensuring compliance solutions for a large set of solar energy system products. Recently PV CYCLE expanded their operations to Japan11.
• Voluntary approaches are also encouraged in countries such as Australia, where in 2016 the government announced that PV systems might be included in the scope of the Product Stewardship Act, either in some form of accreditation or regulation under the Act might be appropriate12.
• Mandatory take-back & recycling. This is the implementation of specific e-waste
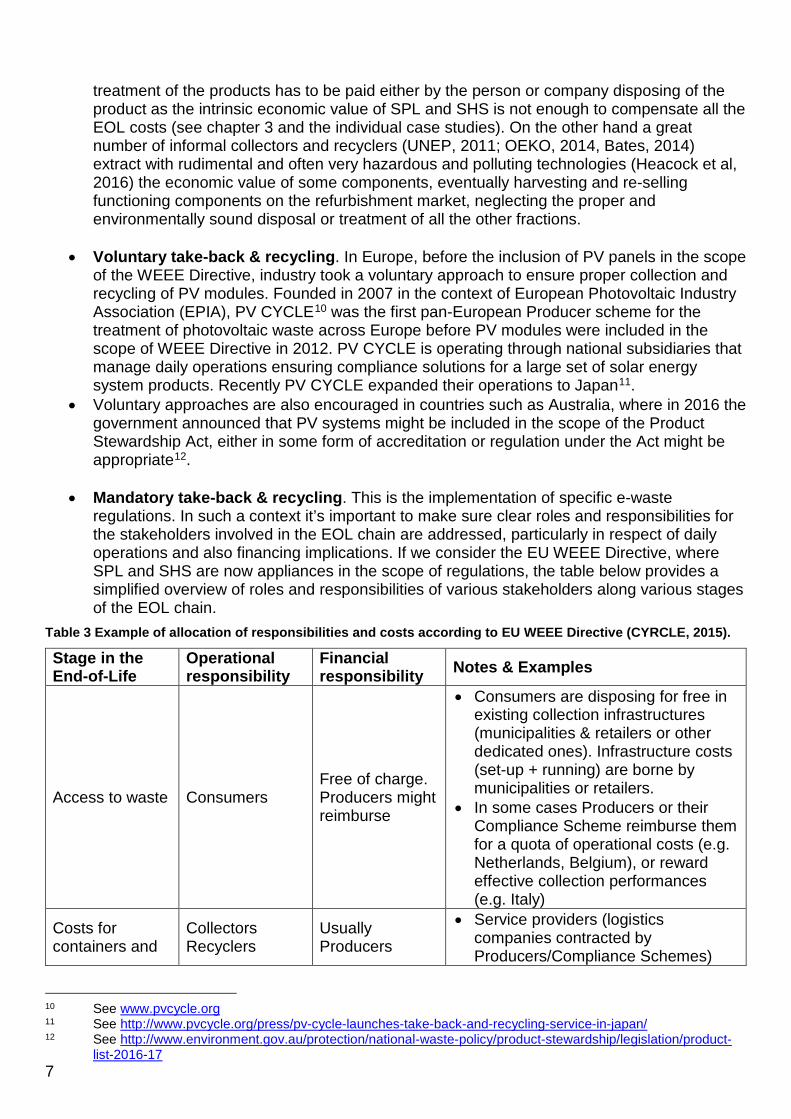
regulations. In such a context it’s important to make sure clear roles and responsibilities for the stakeholders involved in the EOL chain are addressed, particularly in respect of daily operations and also financing implications. If we consider the EU WEEE Directive, where SPL and SHS are now appliances in the scope of regulations, the table below provides a simplified overview of roles and responsibilities of various stakeholders along various stages of the EOL chain.
Table 3 Example of allocation of responsibilities and costs according to EU WEEE Directive (CYRCLE, 2015).
Stage in the End-of-Life
Operational responsibility
Financial responsibility Notes & Examples
Access to waste Consumers Free of charge. Producers might reimburse
• Consumers are disposing for free in existing collection infrastructures (municipalities & retailers or other dedicated ones). Infrastructure costs (set-up + running) are borne by municipalities or retailers.
• In some cases Producers or their Compliance Scheme reimburse them for a quota of operational costs (e.g. Netherlands, Belgium), or reward effective collection performances (e.g. Italy)
Costs for containers and
Collectors Recyclers
Usually Producers
• Service providers (logistics companies contracted by Producers/Compliance Schemes)
10 See www.pvcycle.org 11 See http://www.pvcycle.org/press/pv-cycle-launches-take-back-and-recycling-service-in-japan/ 12 See http://www.environment.gov.au/protection/national-waste-policy/product-stewardship/legislation/product-
list-2016-17

8
Stage in the End-of-Life
Operational responsibility
Financial responsibility Notes & Examples
logistics infrastructures
own containers. Renting price is usually included in the contractual agreement with Producers/Compliance Schemes.
• In some cases Compliance Schemes purchased containers (e.g. Italy, for lamp collection)
Transport Collectors Recyclers Producers
• Service providers (logistics companies contracted by Producers/Compliance Schemes) contractually agree on the price for services provided.
Treatment Recyclers Producers
• Treatment plants (contracted by Producers/Compliance Schemes) contractually agree on the price for services provided (net treatment cost, per waste stream usually, positive or negative) in a competitive environment.
Enforcement Government Government
• Enforcement is the responsibility of central government and dedicated agencies (having also the power to raise fines).
Audit on treatment standards
Government Producers
Government Producers (Compliance Schemes) running own audits
• Audits, particularly linked with issuing and monitoring of waste permit provisions belongs to responsibilities and roles of central government and dedicated agencies (having also the power to raise fines).
• In many cases Producers/Compliance Schemes are voluntarily carrying out audits (minimum annually) on their contracted suppliers to enforce contractual provisions and monitor environmental performance according to applicable standards (f.i. WEEE Forum WEEELabex)
Awareness Raising
Government Producers NGOs
Governments Producers (Compliance Schemes) voluntarily
• Awareness raising is usually the responsibility of Member States.
• In Austria the clearinghouse is responsible for setting a fee for the costs incurred by municipalities or associations of municipalities to ensure the harmonised information of final consumers as a function of the number of residents; costs are born by Compliance Schemes according to market share. For 2013, it was
9
Stage in the End-of-Life
Operational responsibility
Financial responsibility Notes & Examples
0.055 €/inhabitant (approx. 460,000 Euro)
• In many cases Compliance Schemes across EU are organizing anyway dedicated awareness raising campaigns.
One of the main arguments supporting the voluntary approach compared to the mandatory take back (EPIA, 2008) is the financial impact, particularly for products like PV installations, of EOL management for products:
• Having a relatively longer life-span (approx. 20 years for PV installations in Europe) compared to other EEE (Arcadis, 2014; UNU, 2015b),
• Being currently introduced on the market, thus without having a “substitution” of equivalent products becoming waste, and
• Having financial models, in the majority of the countries, where the end-of-life costs, per waste streams and not per individual products, shared among the actual producers present on the market; this means, having producers of PV modules or other off-grid solar products potentially contributing, on the basis of a growing market share, to a very limited amount of waste from off-grid products arising and, on the contrary, to a greater amount of other products arising as waste.
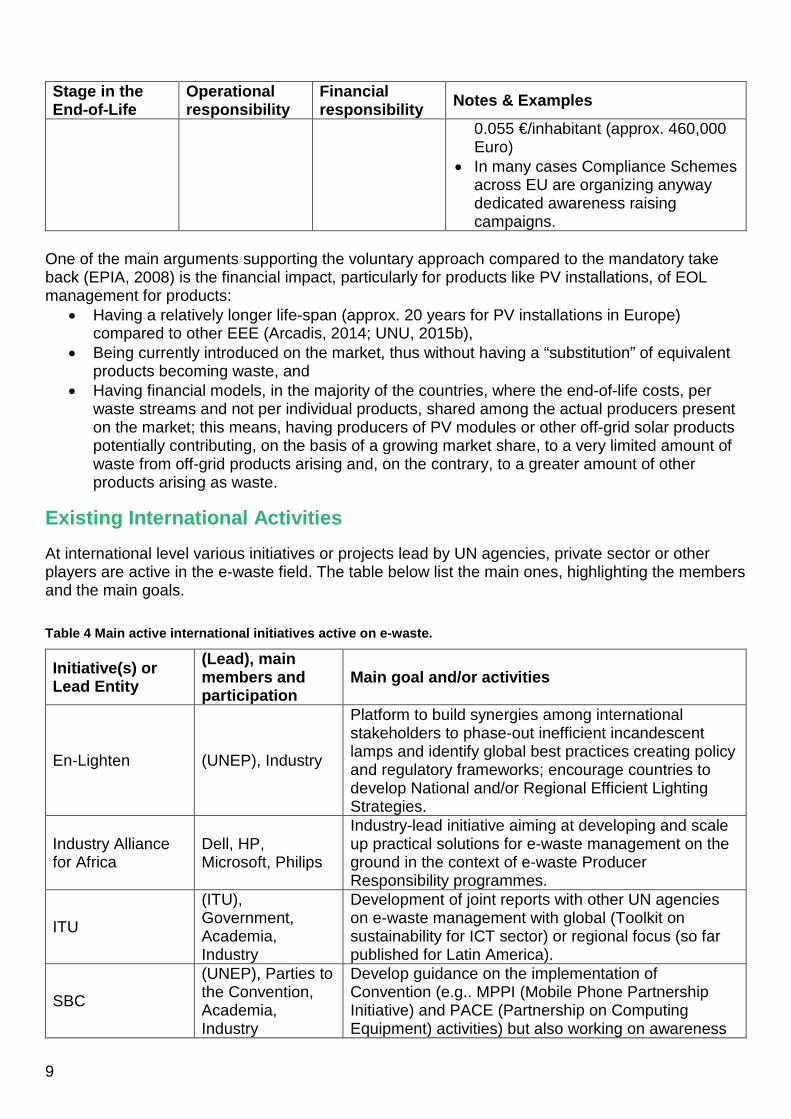
Existing International Activities At international level various initiatives or projects lead by UN agencies, private sector or other players are active in the e-waste field. The table below list the main ones, highlighting the members and the main goals. Table 4 Main active international initiatives active on e-waste.
Initiative(s) or Lead Entity
(Lead), main members and participation
Main goal and/or activities
En-Lighten (UNEP), Industry
Platform to build synergies among international stakeholders to phase-out inefficient incandescent lamps and identify global best practices creating policy and regulatory frameworks; encourage countries to develop National and/or Regional Efficient Lighting Strategies.
Industry Alliance for Africa
Dell, HP, Microsoft, Philips
Industry-lead initiative aiming at developing and scale up practical solutions for e-waste management on the ground in the context of e-waste Producer Responsibility programmes.
ITU
(ITU), Government, Academia, Industry
Development of joint reports with other UN agencies on e-waste management with global (Toolkit on sustainability for ICT sector) or regional focus (so far published for Latin America).
SBC
(UNEP), Parties to the Convention, Academia, Industry
Develop guidance on the implementation of Convention (e.g.. MPPI (Mobile Phone Partnership Initiative) and PACE (Partnership on Computing Equipment) activities) but also working on awareness

10
Initiative(s) or Lead Entity
(Lead), main members and participation
Main goal and/or activities
raising (MOOC on e-waste) and development of standards
Step Initiative
(UNU), UN agencies, Industry, Academia, NGOs and Governmental organizations
Facilitate multi-stakeholder dialogue to work on long-term solutions of e-waste challenges in developed and developing countries. StEP contributes to global thinking, knowledge, awareness and innovation in the management and development of environmentally, economically sound e-waste resource recovery, recycling and re-use.
Sustainable Recycling Industries (SRI)
World Resources Forum (WRF), Industry, Academia, Government and NGO
Build capacity for sustainable recycling in developing countries. Improve local capacity for sustainable recycling together with private and public institutions, as well as the informal sector in Colombia, Egypt, Ghana, India, Peru, and South Africa and facilitates a stakeholder consultation for the development of sustainability criteria for secondary raw materials.
UNEP (UNEP)
UNEP IETC serves as a secretariat for the Global Partnership on Waste Management. E-waste management is one of several focal areas of the Partnership. UNEP IETC produced series of e-waste management manuals and organized regional and international meetings and workshops on e-waste related topics.
UNIDO (UNIDO), Industry
Foster development of an environmentally sound e-waste recycling industry in developing countries, promoting an environmental service industry in developing countries. Establish partnerships with national and international institutions from the public and private sector to facilitate the establishment of local and regional e-waste dismantling and recycling facilities.
UNU (UNU)
Country studies on quantifying and qualifying the e-waste challenge and capacity building (E-waste Academy) for young scientists (EWAS) and managers/policy makers (EWAM). Studies on illegal e-waste shipments and projects on resource aspects associated with the production, usage and final disposal of EEE.
WHO (WHO), Collaborating Centers
Identification of main sources and potential health risks of e-waste exposures and defining successful interventions. WHO has recently launched the E-Waste and Child Health Initiative aiming at protecting children and their families from detrimental health consequences due to e-waste.

11
2. Legal framework and recycling infrastructure in Africa At international level the framework for proper waste management, including e-waste, is set by a few key conventions:
• The Basel Convention13: sets the principles for environmentally sound management of waste and regulates the transboundary shipments of various waste types. Under the Conference of Parties (COP) e-waste has been regarded as the priority issue since 2002 and in 2006 the COP adopted the so-called Nairobi Declaration on environmentally sound management of e-waste. Specific projects and activities have also been carried out in the context of the Mobile Phone Partnership Initiative first (MPPI, 2002) and Partnership on Computing Equipment (PACE, 2008) afterwards, with the publication of guidelines and other relevant studies and tools for the parties.
• The Bamako Convention14: serves as a treaty of African nations prohibiting the import of hazardous waste.
• The Stockholm Convention15: is linked to the proper management of some components of e-waste, particularly the plastic that might lead to the emission of furans.
• The Minamata Convention16: like the Stockholm convention is mainly linked to proper management of specific fractions, in particular those containing mercury, such as lamps.
Despite having been signed by parties and providing the legal background for the development of national waste management legislation or more specifically e-waste regulations, not all of the above conventions have been transposed and implemented in national legal frameworks and enforced, including African countries Legal Framework and Challenges for Development and Implementation of E-waste Policies in Africa As the findings of the E-waste Africa Programme (UNEP, 2011) highlighted for Benin, Cote D’Ivoire, Ghana, Liberia and Nigeria, very often countries do not have a consistent legal framework where e-waste management is inserted in a wider, organic, waste management framework; sometimes measures may be duplicative or contradictory, or leaving gaps, which makes coordinated implementation difficult. Furthermore different departments, agencies or levels of government (national versus regional or local) are sometimes responsible for law enforcement and there is no uniform approach to dealing with e-waste or hazardous wastes in general. Although almost all of the 14 Energy Africa countries have ratified the Basel Convention, sometimes since many years, it is also important to highlight not all of them have implemented into national legislation. Table 5 below provides an overview of the current status of implementation of e-waste legislation in the various countries, the existence of a clear indication of SPL and/or SHS in the scope of the legislation, including specific provisions on batteries. 13 The Basel Convention on the Control of Transboundary Movements of Hazardous Wastes and their Disposal,
1989 14 Ban on the Import into Africa and the Control of Transboundary Movement and Management of Hazardous
Wastes within Africa, 1991 15 Stockholm Convention on Persistent Organic Pollutants (POPs), 2001 16 The Minamata Convention on Mercury, 2013

12
Table 5 Overvierw of existing legal framework in selected African countries
Products in scope of legislation
Country National e-waste law
Off-grid solar products
PV Modules Batteries
Ratification Basel Convention
General waste management legislation
Ethiopia Draft bill NO/Partially NO NO 2000
Solid waste management proclamation No. 513/2007
Ghana Draft bill NO/Partially NO NO 2003 Environmental Sanitation Policy
Kenya Draft bill NO/Partially NO YES 2000
Environmental Management and Coordination Act EMCA
Malawi N.A. - - - 1994 National Environmental Policy
Mozambique N.A. - - - 1997
Environmental Law, Law No. 20/97, Regulation on Bio-Medical Waste Management, Decree No 8/2003, Regulation on Waste Management, Decree 13/2006 of 15 June,
Nigeria In force NO/Partially NO NO 1991
National Policy on Environment (includes SWM among other themes)
Rwanda Draft bill Partially Partially Yes 2003
The Environment Policy (2003), Organic law (No 04/2005 of 08/04/2005) , Environmental Regulations

13
Products in scope of legislation
Country National e-waste law
Off-grid solar products
PV Modules Batteries
Ratification Basel Convention
General waste management legislation (Management and Disposal of Wastewater). viii) Environmental Protection (Standards for Hazardous waste) Regulations.
Senegal N.A. - - - 1992 Code of environmental Law 2001
Sierra Leone N.A. - - - N.A.
The Environment Protection Act, 2001
Somalia N.A. - - - 2010 -
Tanzania Draft bill - - - 1993
Environment Management (Solid Waste Management) Regulations 2009
Uganda In force NO/Partially NO Not Clear 1999
The National Environment (Waste Management) Regulations, S.I. No 52/1999,
Zambia Draft bill NO/Partially NO Yes 1994 Environmental Management Act 2011
Zimbabwe N.A. - - - 2012
Environmental Management Act [Chapter 20:27] 2006
There are well known challenges, notwithstanding the development of legislation per se, when trying to implement e-waste legislation and take back systems in Africa (UNEP, 2011; Bates, 2014; OEKO, 2014; CYRCLE, 2015; Step, 2016). To-date, there is no single African country where legislation is enforced and take back of e-waste is done in an organized and structured form like we see in other regions of the world (e.g. Europe, North America, Japan, Australia):

14
• Role of repair and refurbishment and link with financing mechanism
Quite commonly across Africa (OEKO, 2014) EEE no longer used is sold directly to repair shops or to informal collectors which also, in some cases, sell to repair shops as a source of spare parts. At the very end, non-reusable products or fractions are sold to metal buyers or are disposed of. This means that the value of the economic compensation for handing-over the waste (so-called “access to waste” price) is mainly set by “repair” businesses. The prices paid are not linked to the intrinsic value of the materials contained in the products (metals, or other valuable fractions/components), but rather to the value of the products as a source of spare parts for the refurbishment business. For those reasons, prices paid by repair shops cannot be offered when products are collected for recycling and material recovery purposes. Re-use and refurbishment of electronic products still plays a crucial societal role in almost all African countries. Collection and recycling should mainly target those flows that are not competing with the repair and refurbishment business, especially when the financing of the EOL management is done in the context of EPR systems. Collection and treatment of e-waste should not be seen as an income source for waste holders, to be paid by producers; proper handling of e-waste generates costs that can only partially be compensated by revenues from certain materials streams and e-waste management should not compete with established reuse and refurbishment businesses, but look at the residual fractions and products that are finally disposed.
• Definition of producer in the context of EPR models and set up of national register For all models based on the EPR principle it is paramount to implement and enforce a proper definition of “producer”, as this is linked to all subsequent legal obligations. In an EPR context this cannot only refer to the manufacturer or the brand of the individual product, as the EPR is used as a principle to shift part of the financial contribution for proper e-waste management from society or consumers to entities making profits out of the introduction of EEE on the national market. In (Step, 2016) the following definition is proposed:
The local manufacturer or importer of new and used EEE to be placed on a national market at first invoice by sale or donation. The producer can be a legal or natural person and must be established in the country of import.
• Unfair competition from informal recyclers
When informal treatment occurs on different e-waste streams or products, the goal is usually to target those metals carrying economic value (mainly copper, sometimes gold): this is done through rudimental manual disassembly and in the worst cases, some end-processing (targeting copper and gold from printed circuit boards) occurs via rudimental hydro-metallurgical (acid bath) or pyro-metallurgical (burning/heating) approaches with poor yield and severe environmental and human health consequences. Rudimentary processing leading to revenues for informal recyclers is also the main barrier preventing the development of a local recycling industry as those players can usually generate the cash flow to access arising waste, neglecting the fair costs linked to proper treatment and disposal of hazardous fractions.
• Integration of informal collectors E-waste collection is usually done very effectively in developing countries by informal collectors that purchase the waste from consumers and re-sell it, depending on the status of the product, either to repair shops as a source of spare parts, or to local

15
recyclers, in the majority of cases informal. Creating the right incentives (Bates, 2014; OEKO, 2014; CYRCLE, 2015) to ensure the products collected by the informal sector are entering the formal recycling system is one of the key conditions for success.
Availability of Recycling Infrastructure & Markets for Fractions in Africa Treatment of e-waste is intimately connected with two aspects:
• The availability of local (national) players adopting suitable technologies for the pre-processing, meaning the removal of hazardous components (so called de-pollution) and segregation of various fractions and components for the further processing and recovery/disposal. This can be done manually, as in the great majority of cases has been demonstrated manual disassembly can lead to very good results from an environmental and economic perspective (Wang, 2012) or eventually adopting mechanical processes, where suitable.
• The availability of local or international, accessible, markets for the proper disposal of hazardous fractions/components or the final recovery and economic valorisation of valuable fractions resulting from the pre-processing stage. Usually local markets for final recovery can be found for base metals like steel, copper or aluminium while for more complex fractions local recyclers need to rely on international players (Deubzer, 2015). This means that while some markets dynamics might vary from African country to African country, the impact for proper recycling of disposal of critical fraction can be regarded as quite common especially in regards of costs implications.
Those two elements need to be considered for each product and fraction resulting from the collection and treatment of SPL and SHS. Considering the main constituent of those products we can highlight:
• Batteries: the cost for proper recycling of batteries is dependent on the chemistry of the battery itself; in almost all cases industrial processes adopt pyro-metallurgical approaches (smelters). In some cases, smelters pay for the material delivered (resulting in a revenue): for example, for Lead-Acid batteries the value of the waste is linked to the market value of lead, Ni-MH batteries are mainly linked to the market value of nickel and with Li-Ion batteries values are linked to the market value of cobalt. In other cases (primary batteries (Zn-C), Li-Phosphate and Ni-Cd), the proper treatment (or disposal) of batteries represents a cost . This means that depending on the chemical composition of batteries used in SPL and SHS the situation might be radically different when it comes to EOL revenues/costs for environmentally sound management of the fraction.
• PV modules: considering the standard recycling processes adopted in the EU, where PV
modules are recycled according to WEEE Directive specifications, treatment costs vary from 150-180 €/t for older modules and rise to 220-250 €/t for new modules using thin film technology (cadmium in particular).
• Light sources: the situation is radically different since the introduction of LED technology.
Whilst older compact fluorescent lamps (CFLs) deliver environmental benefits in terms of increased efficiency, the presence of mercury requires an integrated approach along the entire life-cycle to ensure that lamps are treated at their end of life to avoid mercury releases (En-Lighten, 2012). Currently the treatment cost for lamps containing mercury ranges from 500 to 625 GBP/t in Europe.
The development of LED technology has not only further increased the energy efficiency of lamps but also potentially phased out the EOL concerns around mercury. In fact, the proper treatment of LED lamps represents an opportunity to (CYCLED, 2015) recover rare earth elements - yttrium and lutetium in particular.

16
Actual costs for treatment of LED lamps alone are hard to predict given they are relatively new waste streams and still not collected and recycled in large quantities; in addition to that, whether they are processed with manual disassemble and further end-refining to recover rare earth elements or simply shredded with other non-hazardous EEE will have a major impact on the treatment costs. Currently LED lamps are shredded with mixed electronics in the EU (consumer electronics, IT, small appliances etc.). This means that they have a positive value (recyclers pay money to the waste holder) but this is mainly because LEDs are mixed with various other products rather than because of their intrinsic material content.
• Plastics: the recycling of plastics has always proved to be difficult mainly because of the variety of polymers used in EEE (EMPA, 2010) but especially for the use, in certain polymers and applications, of brominated flame-retardants (BFR). From an environmental perspective it is crucial to ensure fractions containing BFR are not burned at low temperature or sent to moulding processes to avoid the emission of dioxins and furans (Weber, 2003). The market for recycled plastics overall is heavily influenced by the price of virgin plastic, which is itself linked to the global oil price. In addition, different polymers with different additives have varying impact on the cost of and quality of recycled plastic.
• Other base metals (steel, copper, aluminium): base metals are usually the easiest to
process and recycle, even in local markets as some recent reports have demonstrated (Deubzer, 2015; Magashi, 2011). The presence of local markets for base metals has also been confirmed by e-waste recyclers contacted in: Nigeria, Kenya, Rwanda, South Africa, Tanzania, Cote D’Ivoire, Ghana and Burundi.
Figure 3 Values/Costs (€/t) for recycling various components/fractions of SPL and SHS. Average for 2015, EU market and African market (Steel, Copper, Aluminium and Plastics).
(€4,000)
(€3,000)
(€2,000)
(€1,000)
€0
€1,000
€2,000
€3,000
€4,000

17
Cost/Value for fractions (€/t)
Min Max Average
Steel 23 369 140 Copper 532 3,600 2,649 Aluminium 450 890 615 Plastics 45 360 129 Pb Batteries 80 645 363 Li-Ion Batteries 70 550 310 Ni-MH Batteries 100 900 500 Li-Phosphate Batteries -3,500 -3,000 -3,250 PV modules -220 -150 -185 CFL Lamps -750 -600 -675 LED Lamps 40 120 80 Mixed Plastics (incl. BFR) -30 75 23 PWB 400 € 600 € 500 €
In addition to the availability of technical infrastructure or national/international markets, including the existence of a legal and organizational frameworks allowing for transboundary shipment of waste, there are a few more elements that need to be considered as conditions for success:
• In the medium term the increase of cost-effectiveness of e-waste management systems can only be achieved by enabling the market conditions for fair competition between various service providers offering collection and treatment services17.
• In various regions of the world cost-effectiveness has been achieved fostering the boundary conditions for activities of private entrepreneurs. Unfortunately, such policy frameworks do not exist in all African countries. In some cases, like in the latest e-waste bill for Ghana, a single entity controlled by the government is planned to provide the e-waste collection and recycling services.
17 See in (CYRCLE 2015) the comparison of technical costs (collection plus transportation plus treatment) in
Europe in 2005 and 2011 for different waste streams.
18
3. Combined learning from Country Case studies Main Lessons Whilst the three case studies (see sections 7, 8 and 9) provide specific insights on the situation at country level in Kenya, Nigeria and Rwanda it’s possible to derive common patterns valid across the three countries that are relevant across other African countries. Those lessons are grouped into three main areas: (i) policy development, (ii) collection and recycling infrastructure, and (iii) financial provisions for EOL management. Lessons on policy development
• Policy can be fragmented and ambiguous especially if there are conflicting aims of providing low cost energy access, whilst ensuring costs of end-of-life management are included in the purchase price of products. Access to energy programmes, which seek to increase the adoption of off-grid products, are often driven by one ministry, while the issue of end-of-life electronic products falls under the jurisdiction of other ministries. As an example, a shortcoming of the current Nigerian regulation is that it does not specifically cover batteries, which are in many cases an integral part of off-grid products, leaving room for interpretation and ambiguity.
• Enact legislation, and follow up on implementation as policy development and enforcement of legislation can be time consuming, and difficult to implement given the different, often unaligned interests of key stakeholders. However, governments also have at their disposal various tools and directives that can be applied at local and regional levels to effectively achieve e-waste management objectives. By adopting a legislative framework, the government provides not only the basis for fair competition, but also enables and activates the stakeholders towards implementation efforts.
• Have local level implementation mechanisms that, for example, enable local authorities to enact bylaws to ensure that e-waste is separated from general solid waste at the point of collection.
Lessons on collection and recycling infrastructure
• Partnerships are necessary for ensuring access to waste and setting up functioning and efficient collection systems. This would mean collaboration and cooperation between recyclers, refurbishers and in particular repair shops where non-functional products are taken by consumers and left for disposal if they are not repairable. The repair shops and refurbishers collect products to use as a source of spare parts: this is one of the main reasons why they could also offer financial incentives to disposers. But for recycling of products such incentives cannot be paid under EPR schemes.
• Additionally, partnerships with OEMs, telecom operators, software majors etc. through various mechanisms – either for take-back and recycling of products, under CSR programs, specially for awareness creation and collection drives etc. are important to achieve impact.
• Upgrade local recycling facilities through technical assistance and investment promotion; in particular not only focusing on collection and dismantling activities, but also developing local markets for other fractions.
• Improve networks with local distributors of solar products and other channel partners to participate in the collection and take-back logistics setup, so that consumers can benefit from easier access to convenient disposal options.

19
Lessons on financial provisions for end-of-life management of products
• Incentives do encourage individuals to release the e-waste that they are keeping in their houses or disposing as general waste. However, it may not be possible to offer economic incentives for all products, especially those with low material / recycling value.
• Continued consumer engagement, particularly with large institutional organisations to change expectations of incentives for e-waste. Government agencies and companies in Kenya are responding positively to contractual arrangements for e-waste disposal.
• Embed financial provision for EOL management in legislation: the cornerstone of any legislation should be to ensure products with low intrinsic economic value are also collected and properly recycled. The Nigerian National Environmental (Electrical/Electronic Sector) Regulation makes a financial provision for the EOL management of e-waste by adopting EPR and ensuring that producers bear the financial responsibility of collection, take-back and sound recycling of their products through the Minimum Collection Incentive (MCI). However, the actual implementation of an EPR system is still currently being discussed. As yet, there are have been exploratory efforts only by a few individual producers, rather than a collective response as an industry wide EPR system. The draft e-waste bill in Ghana also suggests a provision for a financing mechanism, although its specific details are yet unclear.
The EOL Costs for Off Grid Products The estimation of EOL costs for off-grid products has been calculated considering only operations as described in chapter one (access to waste, collection, transport to recycling plant and treatment). Importantly, only the variable costs have been considered: this means that it’s assumed products are being treated in existing facilities and infrastructure and no depreciation of investment has been included. For the treatment phase in particular the margin that formal recyclers might add on top of the technical costs for dismantling and to take into consideration the intrinsic economic value of the product has not been included. The purpose of the calculations is to provide a reasonable order of magnitude for an environmentally sound recycling chain for off-grid products, showing the main influencing factors and where economies of scale or policy decisions might mitigate such economic impacts. Three different products have been considered as representative of SPL and SHS, with the material composition shown in the table below. Scenarios have been considered with a) CFL (valid for older products introduced on African markets) and b) LEDs (more in line with the future trends of waste arising) as the lighting source. Prices for base metals (steel, copper, aluminium) and plastics have been derived from averages provided by e-waste recyclers active in the following countries: Ethiopia, Nigeria, Kenya, Tanzania, Rwanda, Cote D’Ivoire and South Africa; and common patterns have been observed. For other fractions to be exported overseas EU recyclers have been contacted. A value of 5€/t has been added to account for the impact of transportation costs for fractions processed on local markets, with 150€/t added for materials requiring overseas shipment (including shipment notification costs).

20
Table 6 Material composition18 for representative products and average prices for fractions.
PC1 PC2 PC4 Market destination
Average price (incl.
transport) €/t
Average weight (g) 150 906 2,450 Steel 20 160 Local 140
Copper 418.6 Local 2.649 Aluminium Local 615
Plastics Local 129 Pb Batteries Overseas 363
LIP Batteries 100 100 100 Overseas -3.250 PV modules 411 1,180 Overseas -185
CFL (Hg) 30 30 107 Overseas -675 LED Overseas 80
Mixed Plastics (incl. BFR) 205 551.4 Overseas 23 Printed Wiring Boards
(PWB) 93 Overseas 500
One very important element to be considered is that, depending on the market fluctuations of commodities prices and the presence of CFL or LED lighting sources, the intrinsic economic value of the various products is changing (Table 7). The chemical composition of batteries has a significant impact on the overall results; for SHS using Lead-acid batteries (which are also heavier) the revenues could be substantial (potentially up to 0.5 €/product for a 1kg battery), compared to the costs incurred for the proper treatment of Lithium-Phosphate batteries. For plastics it is assumed that overseas shipment is required to ensure the proper treatment of the potential fractions containing BFRs. As regard PWB it is assumed the lowest quality is used in off-grid solar products. It’s also relevant to highlight how the main trigger for a positive value of SHS (PC4) is the presence of copper in the cables: without such fraction the product itself has a negative intrinsic economic value. Table 7 Fluctuations of intrinsic economic value for products (€/product).
PC1 PC2 PC4 Min market price - CFL -0.39 -0.58 -0.75 Min market price - LED -0.37 -0.55 -0.67 Average market price - CFL -0.36 -0.51 0.25 Average market price - LED -0.34 -0.48 0.33 Max market price - CFL -0.33 -0.42 0.76 Max market price - LED -0.31 -0.40 0.83
18 Derived from technical sheets available on: https://www.greenlightplanet.com

21
For the recycling chain the main variables to be considered are: • Access to waste: it is assumed, considering the low intrinsic economic value, that off-grid
products are disposed of by end-users without, or with very little, financial compensation (Nigeria shown approx. 0.13-0.25 €/product).
• Cost for collection: off-grid products are generally light weight and current waste represents only a small fraction of the overall e-waste arising in the case study countries (0.02% for Nigeria, 0.4% for Rwanda and 0.6% for Kenya in 2014, which might rise to 0.6%, 1.3% and 2.1% respectively in 2017).
• The financial impact of having dedicated collection infrastructure is high, compared to the share of those costs in the case of joint collection with other e-waste products.
• Transport to treatment plant: the impact of long-distance transportation within countries of appliances collected and consolidated at centralised collection points might a significant factor, especially in large countries/those with less well developed transport infrastructure. Therefore, in the medium-term the development of a nationwide network of plants could cut transport costs.
• Treatment costs: the impact of disassembly time for off-grid products is substantial, especially considering that there are very few fractions of positive value.
• This means that disassembly should focus on the removal of hazardous components and fractions rather than on the recovery of valuable fractions (such as PWB, copper or aluminium). Even if, for certain products, under particular conditions, the intrinsic economic value might be positive, the costs of disassembly needs to be considered: as individual case studies show, disassembly costs could significantly change the overall economic balance for specific products.
Table 8 Impact of EOL costs for off-grid products management (€/product).
Worst case scenario19 Best case scenario20 PC1 PC2 PC4 PC1 PC2 PC4
Access to waste -0.05 -0.05 -0.08 -0.05 -0.05 -0.08 Collection -0.02 -0.12 -0.32 -0.00 -0.00 -0.00 Transport to plant -0.01 -0.06 -0.17 -0.00 -0.00 -0.00 Treatment -0.62 -0.88 -0.50 -0.54 -0.75 -0.04 Total -0.69 -1.11 -1.07 -0.59 -0.80 -0.12 Market price 30 135 380 30 135 380 Incidence EOL cost (% on market price)
2.3% 0.8% 0.3% 2.0% 0.6% 0.03%
Considering the total number of off-grid products expected to arise as waste in the coming years it is possible to estimate the total economic impact for proper EOL management. As previous paragraphs explained the figures could change significantly depending on the collection strategy, the product mix, the market value of commodities as well as the cost for accessing international markets. Importantly, for all products the total EOL management leads to a cost. But assuming a product mix of 65% PC1 products, 25% PC2 and 10% PC4, if we look at the total off-grid products generated in the 14 African countries in 2014 and 2017, the following figures can be calculated (Table 9). 19 Worst case scenario is the one leading to highest economic impact: dedicated collection infrastructures, lowest
values of commodities, products with CFL. 20 Best case scenario is the one leading to lower economic impact: shared collection infrastructures, highest values
of commodities, products with LED.

22
Table 9 Impact of EOL costs for off-grid products management (€/year).
Worst case scenario Best case scenario PC1 PC2 PC4 PC1 PC2 PC4
Product Mix 65% 25% 10% 65% 25% 10% Total off-grid products arising as waste (t) - 2014
approx. 800
Total Cost (€m) 2.6 2 Total off-grid products arising as waste (t) - 2017
approx. 3,600
Total Cost (€m) 11.4 9.3 The figures in table 9 provide ranges of costs under current conditions. Despite some of the elements leading to current values being of a more structural nature as highlighted in the previous chapter (e.g. lack of infrastructure and poor markets for downstream fractions), there is room for improvement as the EU experience has shown:
• Increase of collection of e-waste and achievement of economies of scale at national and regional level will lead to a decrease of costs, as we have seen in the EU over the last 10 years (CYRCLE, 2015).
• Development of guidelines for producers to phase out, where possible, or substitute those materials or components having negative environmental and economic impacts. In some cases technology shifts like the introduction of LED compared to CLF had an environmental and economic benefit in terms of EOL.
• In some other cases trade offs between product functionalities during the life and the EOL perspective might exist (Lighting Global, 2012; GOGLA, 2016), like in the case of batteries (e.g. weight reduction, duration, production cost…).
• Overall, Table 8 shows that the EOL cost impacts could represent a small share of the total product price.

23
4. Policy Recommendations The following paragraphs provide some key recommendations for the inclusion of the EOL perspective into policies aiming at supporting the diffusion of off-grid technologies; they are grouped in 4 main thematic areas. Roadmap for Policy Development The main role of policymakers is to enable a framework supporting fair development of business and activities in the national context; three main areas of intervention can be highlighted for SPL and SHS:
1. Inclusion/exclusion from the scope of e-waste legislation: as pointed out in previous chapters SPL, SHS or some of their key components like batteries might not be included in the scope of e-waste legislation in Africa, depending on individual formulations. It is paramount to obtain clarity on this, even in the view of industry position papers (GOGLA 2014) to ensure a level playing field across industry and from country to country (IRENA, 2016). This is particularly linked to the impact of financing EOL management of products which should not create asymmetries, market distortions and barriers for off-grid products as, for instance, the case of kerosene subsidies and VAT exemptions (ODI, 2016a). Action items:
• Develop a position paper on off-gird products and e-waste legislation, clarifying their inclusion/exclusion into the scope.
• Disseminate and actively lobby to ensure adoption of the position paper in different countries.
2. Identification of the “producer” in the context of EPR legislation: as the e-waste
legislation published so far in African countries or currently under development are based on the EPR principle, it is paramount to clarify “who” is the producer, especially as producers are the stakeholders regarded as responsible for the financing of EOL operations. In previous chapters a definition has been proposed but off-grid market dynamics are quite different compared to other EEE sectors. The variety of distribution models and the increasing dynamics on the financing side in the off-grid sector (ODI, 2016b) call for a clear definition of stakeholders responsible for the EOL management under the various scenarios. The Original Equipment Manufacturer, national importer, company offering the products under PAYG models (or the ESCO) could all potentially be regarded as producers. Action items:
• Develop a position paper on definition of producer, on the basis of those already developed and ensure its adoption in different countries.
3. Enforcement of legislative provisions: legal obligations (financing, reporting,…) connected
to the inclusion of products in the scope of national legislation as well as clear identification of the legal entity being regarded as “producer” is paramount. This is vital to ensure a level playing field across industry and avoid disruption of efforts from legitimate players by free-riders. Action items:
• Actively lobby at national level to ensure enforcement of legal provision is seen as priority by national governments, eventually developing a position paper on disruptive consequences and jeopardizing the effect of lack of enforcement.

24
4. Development of incentives for compliant producers: economic incentives for “greener
products” have been developed in France from 2010 (IPR WG, 2012), based on a specific design for dismantling, recovery and reuse; this led to lower tariffs to be paid by producers complying with such requirements. Incentives could be developed for “certified” off-grid products, allowing only producers complying with a set of requirements (e.g. complying with e-waste regulations, even on a voluntary basis) to benefit from supporting measures developed in the context of access to energy policies (ODI, 2016a) like fiscal barriers, VAT exemptions, easier access to finance, and similar. Action Items:
• Develop a set of criteria to create favourable market conditions for those producers complying with EOL good practices in terms of product design but also legal compliance.
Roadmap for International Synergies Various international activities and fora, listed in chapter one, are working on sustainable solutions for e-waste challenges, particularly in the context of developing countries. In this respect few areas of intervention can also be highlighted:
1. Partnership between Off-Grid and EEE Industry to develop solutions on the ground: members of GOGLA already committed to join forces within GOGLA and with other industries in the area of (i) awareness raising for end-users and society at large, and (ii) identification of synergies for common collection and recycling activities (GOGLA 2016). This is, to-date, still one of the key challenges, especially ensuring volumes of e-waste collected are channelled towards formal recyclers, and thus supporting the development of local recycling industry. Furthermore the calculations of previous chapters demonstrate how a shared collection infrastructure and strategy might mitigate the overall economic implications. The electronic industry has been strongly involved over past few years in trying to support the development of legislation and systems to ensure e-waste arising in Africa could be collected and treated in an environmentally sound manner (Step 2015; Bates, 2014). Integration of key aspects of off-grid technology into the current policy debate should be a top priority to ensure alignment in the early stage of development of solutions on the ground. Action items:
• Join existing initiatives, stakeholder groups at international and national level to ensure efforts are aligned.
2. Integration of EOL perspective in off-grid policies and efforts: while strong efforts in
allowing African populations to have access to energy are carried out, it’s important to include the potential impacts that off-grid products or other EEE – which will be enabled by off-grid technologies – will have at the end of their life. An holistic, life-cycle approach needs to be taken, similar to what has been done in the context of energy-efficient lighting through the En-Lighten Initiative which included the EOL perspective in the toolkit for policy makers (En-Lighten, 2012). Calculations done in chapter 3 proved that the financial impact for EOL management for off-grid products is in the range of cents up to 2 €/product, which is equivalent to 0.03 to 2.3% of the average selling price for off-grid products, depending on commodity prices and collection set-up. How to integrate those costs in the current financing models for off-grid products should also be taken into account, in particular PAYG schemes.

25
Action items:
• Develop a specific toolkit on proper EOL management for off-grid solar products and widely distribute and adopt it in activities on the ground.
Roadmap for Collection and recycling Infrastructure Development Analysis carried out and detailed in previous chapters as well as in the individual case studies highlighted how SPL and SHS contain some fractions that are troublesome to recycle in Africa for 2 reasons: (i) lack of recycling infrastructure, combined with (ii) absence of local markets for specific resulting components or fractions; in particular for batteries, CFL and LED lamps and PV modules. Additionally, SPL and SHS are products that do not have high intrinsic economic value (except those containing lead-acid batteries or eventually for the presence of longer cables containing copper). This means, on one hand, that the financial contribution for proper treatment by producers will have to be higher compared to other EEE products but, on the other hand, also combined with a limited reuse and refurbishment market, that the access to waste cost might be lower. The main areas of intervention are in such case:
1. Development of local capacity for treatment: in line with the main concepts of the Basel Convention and the need to treat waste as close as possible to source, it is important to create favourable conditions – through policy interventions – for local or international investments aiming at developing local capacity (IRENA, 2016) for the treatment of the critical fractions, particularly for lamps. An increase in pre-processing capability as well as the creation of national or regional hubs for processing of resulting fractions will also have a positive impact on the overall economics of EOL management and job creation in the emerging recycling sectors. Action items:
• Carry out a number of pilot projects in selected countries aiming at collecting and recycling some off-grid products to create a first baseline for future, large-scale operations.
• Create national focal groups with recyclers and policy makers to discuss the outcomes of the pilots.
2. Creation of favourable conditions for transboundary shipments of troublesome
fractions to developed countries in the medium term: as it is not possible to establish processing capacity for all fractions in the short term, coupled with a lack of sufficient volumes, in the medium term many of the resulting fractions will be shipped to developed countries (mainly in Europe) for disposal or treatment. For some fractions the so-called “best-of-2-world philosophy” (Wang, 2012) – will apply in the longer term, with for example the treatment of batteries and eventually BFR containing plastics in state-of-the-art facilities in developing countries. This means that the creation of smooth approaches to ensure that international markets are easily accessible is relevant to ensure a positive impact on the overall costs of EOL. Action items:
• Create national focal groups with recyclers and policy makers to discuss how to overcome existing barriers.
Roadmap for Awareness Raising and Capacity Building One of the elements enabling proper e-waste management is the awareness of the societal implications of proper EOL, from an environmental, economic and health perspective. The way off-

26
grid products are distributed offers few advantages compared to other common EEE products; this offers a few areas of interventions:
1. Integrate EOL management within off-grid products business models: in the case of PV installations they are mounted and dis-installed by technicians. This offers a good (and cheaper) opportunity to implement a reverse logistics network for the collection and subsequent recycling of products. For SPL and SHS distributed under PAYG the link with the user is stronger (GOGLA, 2016) as they tend to establish a stronger relationship with the customer and materialises as development of downstream services which could potentially include the EOL management in the future. Additionally, the use of modern GSM technologies for PAYG could eventually be linked with GIS services and thus, potentially, the location of EEE products could be known, compared to the usual EEE that are sold and their location is no longer known to retailers and distributors. Action items:
• Embed voluntary take-back and provision for collection and recycling in the Compact programme, with the vision that it forms the basis or template for any future compulsory compliance that might be required.
• Develop with PAYG suppliers a roadmap to integrate EOL management into their activities, eventually carrying out national pilot projects.
• Create a toolkit to be disseminated among PAYG suppliers on proper management of EOL off-grid products.
2. Raise awareness amongst consumers and society: it’s crucial to explain consumers and
society at large the importance of proper EOL management for off-grid products. This could also help tackle the unfair competition of informal recyclers and prevent consumers to ask for financial compensation for disposal of the products, at least when they are collected for recycling and material recovery. Action items:
• Develop an awareness raising campaign specifically for off-grid products targeting consumers and the other key players in the value chain.
3. Build capacity across the sector: as the market for off-grid products is growing it would be
beneficial to integrate the EOL perspective at an early stage. This could also create new opportunities for local players (installers, technicians,..) to expand the range of the services they provide, embracing the EOL phase as well, particularly the collection and consolidation as well as proper refurbishment. Action items:
• Organize targeted events for stakeholders to exploit the toolkit on EOL management • Integrate a capacity building programme on end-of-life management, including repair
and recycling aspects, into energy access programs.

27
5. Conclusions Off-grid solar products represent a breakthrough in addressing some of the societal challenges that developing countries face in conjunction with access to energy rights. Off-grid solar technology not only addresses basic energy needs but also enables the use of other technologies, leading to a multiplier effect in raising quality of life and other societal indicators linked to UN Sustainable Development Goals such as education, communication, medicine, transportation, health, food-supply, security, environmental protection and culture. However, sooner or later, off-grid solar products reach the end of their functional life and become waste. This report focused specifically on the environmental and economic implications of waste solar products in Africa. The main findings are:
• The generation of waste from off-grid solar products represents a very small fraction compared to the overall e-waste generated in Africa: this is estimated to be approximately 800 t or 0.3% of the total e-waste generated in 2014 in the 14 countries studied, growing to approximately 3,600 t in 2017 due rapid adoption in the coming years coupled with short life-span of products. Nevertheless, it would still represent only 0.5% of the total e-waste generated in the 14 Energy Africa Campaign countries.
• Though the direct impact of off-grid products in the e-waste stream is proportionately quite small, there is the potential for indirect generation of e-waste through greater use of EEE given better energy access. The quantum of this secondary impact is not fully understood, and has not been considered in the estimates in this study. Nevertheless, it is expected to be significantly smaller than the e-waste generated due to greater grid access.
• Lack of proper collection and recycling infrastructure for e-waste in general across Africa, connected with the absence of disposal/treatment options for environmentally troublesome fractions and limited markets for resulting fractions pose challenges to the development of take-back schemes and result, in the short term, in higher EOL costs, particularly for off-grid solar products.
• There is currently no legal clearance on the inclusion or exclusion of off-grid products in current or upcoming draft e-waste bills across Africa.
• The same counts for some of the main constituent components like batteries. • The constituent materials of SPL and SHS and their components (PV modules, batteries
and lamps) in the great majority of cases represent a “cost” and not a “revenue” for recyclers, not only in Africa: this means that compared to other EEE, the economic impact of proper collection and recycling per product is particularly high; under the current situation, depending on product type and boundary conditions this might be as high as 0.5 – 2 €/product (0.1 to 2.5% of product price).
• Considering the expected volumes across Africa and the potential collection and recycling costs the overall economic impact is expected to be in the range of 9.3 to 11.3 M€ in 2017.
More detailed analysis carried out in Kenya, Nigeria and Rwanda allow identifying some key areas where short-term actions can be planned and extended also to the other countries:
1. Development of position papers and lobby activity calling for a level playing field and legislative clarity for SPL and SHS.
2. Alignment with existing International initiatives and local efforts from EEE Industry on e-waste in Africa.

28
3. Development of a toolkit for capacity building and training on proper EOL management for SPL and SHS and awareness raising campaign targeting various stakeholders in the value chain.
4. Creation of national focal-groups involving policy makers from different ministries, recyclers and other relevant players integrating the EOL dimension into the current activities of the Energy Africa campaign.
5. Set up of small-scale pilot projects in selected countries to create a first baseline for future scale-up of operations.
The activities suggested above range from those that are medium-term, easy-to-enact (1 and 2), to more structured (3) and some longer-term (4 and 5). They can help define a roadmap to successfully integrate the EOL perspective into the current debate on energy access and ensure the full life-cycle perspective is taken into account for off-grid solar products. This will pre-empt any negative environmental consequences from EOL solar products, thereby further enhancing the societal benefits that these products bring, especially in the African context.

29
6. References [Arcadis, 2014] Acoleyen et al., update exercise on future PV waste generation. Brussels, Belgium,
PV Cycle, 2014 [Bates, 2014] Bates et. al, Development of e-waste recycling infrastructure in Africa, Care
Innovation, 2014 [Bensch, 2015] Bensch et al., The Lighting Transition in Africa – From Kerosene to LED and the
Emerging Dry-Cell Battery Problem, 2015 [CYRCLE, 2015] Magalini F., Financing models for sound e-waste management in Ethiopia, 2015 [Deubzer, 2015] Deubzer et. al., National and International Downstream Markets for DMF E-waste
Dismantling Fractions – Metals, Printed Wiring Boards and Plastics, UNU, 2015 [EMPA, 2010] Wager P. et al., RoHS Substances in Mixed Plastics from Waste Electrical and
Electronic Equipment. Swiss Federal Laboratories for Materials Sci- ence and Technology (Empa). September 17, 2010
[En-lighten, 2012] UNEP, Achieving the global transition to energy efficient lighting toolkit, 2012 [EPIA, 2008], EPIA and PV CYCLE, Review of the WEEE Directive - European Commission
consultation- Joint reply of EPIA and PV Cycle, June 2008 [GOGLA, 2014] Adoption of Industry Opinion on Lifecycle and Recycling, 2015 [GOGLA, 2016] Off-grid solar market trends report 2016 [Heacock, 2016] Heacock M. et al., E-Waste and Harm to Vulnerable Populations: A Growing
Global Problem, Environmental Health Perspectives, volume 124, number 5, May 2016 [IPR WG, 2012] Waste Electrical and Electronic Equipment (WEEE) Regulations: Individual
Producer Responsibility (IPR) in a UK context, IPR Working Group, July 2012. [IRENA, 2016] End of Life Management Solar Photovoltaic panels, IRENA, 2016 [Lighting Global, 2012] Eco Design Notes, Battery Toxicity and Eco-Product Design, Issue 1
September 2012. [Magalini, 2015] Magalini et al., E-waste in Latin America: statistical analysis and policy
recommendations, GSMA, 2015 [Magashi, 2011] Magashi et al., E-waste Assessment Tanzania, UNIDO, 2011 [ODI, 2016a] Diecker et al., Accelerating access to electricity in Africa with off-grid solar: policies to
expand the market for solar household solutions, 2016 [ODI, 2016b] Scott et al., Accelerating access to electricity in Africa with off-grid solar: the market
for solar household solutions, 2016 [OEKO, 2009] Buchert M. et al., Critical metals for future sustainable technologies and their
recycling potential, Oeko-Institute, 2009 [OEKO, 2015] Schleicher T. et al., An efficient & effective e-waste collection system for Ethiopia,
Oeko-Institute, 2015. [Step 2016] Guiding Principles to Develop E-waste Management Systems and Legislation, Solving
the e-waste problem White Paper, 2016 [UNEP, 2011] UNEP, Where are WEEE in Africa, 2011 [UNU, 2015a] Baldé, C.P., et.al, The global e-waste monitor – 2014, United Nations University, IAS
– SCYCLE, Bonn, Germany, 2015 [UNU, 2015b] Magalini et al., Study on collection rates of waste electrical and electronic equipment
(WEEE): possible measures to be initiated by the commission as required by article 7(4), 7(5), 7(6) and 7(7) of directive 2012/19/EU on waste electrical and electronic equipment (WEEE), DG ENV, 2015
[WANG, 2012] Wang et al., The Best-of-2-Worlds philosophy: Developing local dismantling and global infrastructure network for sustainable e-waste treatment in emerging economies. Waste Management (2012)

30
[Weber, 2003] Weber R. et al., Relevance of BFRs and thermal conditions on the formation pathways of brominated and brominated–chlorinated dibenzodioxins and dibenzofurans, Environment International 29 (2003) 699–710

31
7. Case study: Kenya Country Overview Kenya is one of the most populous countries in Africa with a population of more than 46 million, with approximately 25% living in urban areas, with the rest 75% in rural Kenya. Urban areas have better access to grid electricity, albeit only 60% of the urban population is connected to the grid, while in rural areas, only 7% of the population has grid access. The Government of Kenya has set forth plans to achieve universal energy access by 2020. However, as yet Kenya has 2,150 MW of generation capacity, resulting in only 20% of Kenyans with access to electricity. The Kenyan government has generally adopted a 'light touch' regulatory approach to supporting the development of a private (household) market for SHS and thus resorted mainly to the use of indirect policy measures (Haskins, 2000). This has primarily been in the form of exemption from value-added tax (VAT) and duties on imported PV products and components, enacted in 1986. The government extended this tax waiver on solar products to encourage uptake of solar related products, with the aim to increase access to off grid power in order to reduce pressure on grid connectivity. Kenya is one of the most vibrant markets for the solar industry in Africa, with off-grid solar products reaching 15%-20% of households. Kenya holds the second position in terms of volume of product sales in H2 2015 in the sub-Saharan Africa region and more than 80% of these are quality verified products. It also tops the chart for cash sales revenue in SSA for H2 2015. Currently with 15 GOGLA members with sales presence, Kenya accounted for 30% of branded products sold in Africa in 2014-2015. The EY’s Renewable Energy Country Attractiveness Index 2016 has ranked Kenya at number 21 for Solar PV technology, which continues to boost the market along with favorable government policies and incentives. Legal Framework for E-waste Kenya is a signatory to numerous multilateral environmental agreements including the Basel Convention on the Control of Transboundary Movements of Hazardous Wastes and their Disposal and Bamako Convention on the Ban of the Import into Africa and the Control of the Transboundary movement and Management of Hazardous Wastes within Africa. The key stakeholders involved in the legal and regulatory framework in Kenya are given in the table below, along with their mandate regarding e-waste and their role in the implementation of policies and strategies. The existing legal framework for waste management includes the Environmental Management and Coordination Act (1999) and the Waste Management Regulations (2006) that currently regulate general waste management in Kenya. The proposed e-waste regulations builds on the general waste management guidelines by introducing a legislative framework for e-waste and making good e-waste practices legally binding to both producers and consumers.

32
Table 10 Key stakeholders invovled in Kenya legislative framework.
Key Stakeholder Mandate in the e-waste legal and regulatory
framework
Role in the implementation of the framework
Ministry of Environment and Mineral Resources (MEMR)
Set policy direction and enact legislation
National Environment Management Authority (NEMA)
Draft regulations and guidelines
Implements and regulates all policies relating to the environment Director General NEMA is the Competent Authority of the Basel Convention
The E-waste guidelines address a cross-section of the product value chain from producers/ manufacturers, importers and assemblers to large institutional and household consumers to refurbishers and recyclers. Based on the principles of Extended Producer Responsibility, the Guidelines for E-Waste Management issued by NEMA in 2013 is the only active government document that specifically addresses the issue of e-waste. E-Waste Regulations were drafted by NEMA in 2013 but are still awaiting Parliament’s approval. Whether off-grid products are included or excluded from the scope of the draft regulations is not clear as the definition of Electric Equipment (Part I, Article 2) refers to:
‘electrical equipment’ means equipment for the generation, transfer and measurement of electric currents and fields falling under the categories set out in schedule 1 of these regulation; ‘electronic equipment’ means equipment which is dependent on electric currents or electromagnetic fields in order to work properly under the categories set out in schedule 1 of these regulation;
And despite such definition is inclusive, in Schedule 1 off-grid products and PV panels are not clearly mentioned. On the other hand, batteries are clearly included in the scope, as a specific element in schedule 1. The draft Kenyan legislation on EEE is based on the EPR principle and the definition of producer is broad and includes:
‘producer’ means any person who introduces new or used electrical and EEE into the market and may include a person who manufactures and sells EEE under own brand, resells EEE produced by other suppliers under own brand, imports EEE into Kenya, assembles EEE for sale or distributes EEE;
Once into force, producers will have to register with NEMA in order to put a product on the market, as well as ensure collection, take back and recycling. The transboundary shipments of e-waste will also be applicable to product under the draft guidelines, and any import or export of e-waste will require. Collection and Recycling infrastructure Collection of e-waste is done largely by small and medium collectors, with small informal collectors dominating the collection. There is no public infrastructure for collection of e-waste. Some small scale collectors move from door to door of commercial buildings and houses in the residential areas to collect recyclable materials. There is also a large network of small scale collectors who collect e-waste from dumpsites where e-waste generated by individual users and small companies
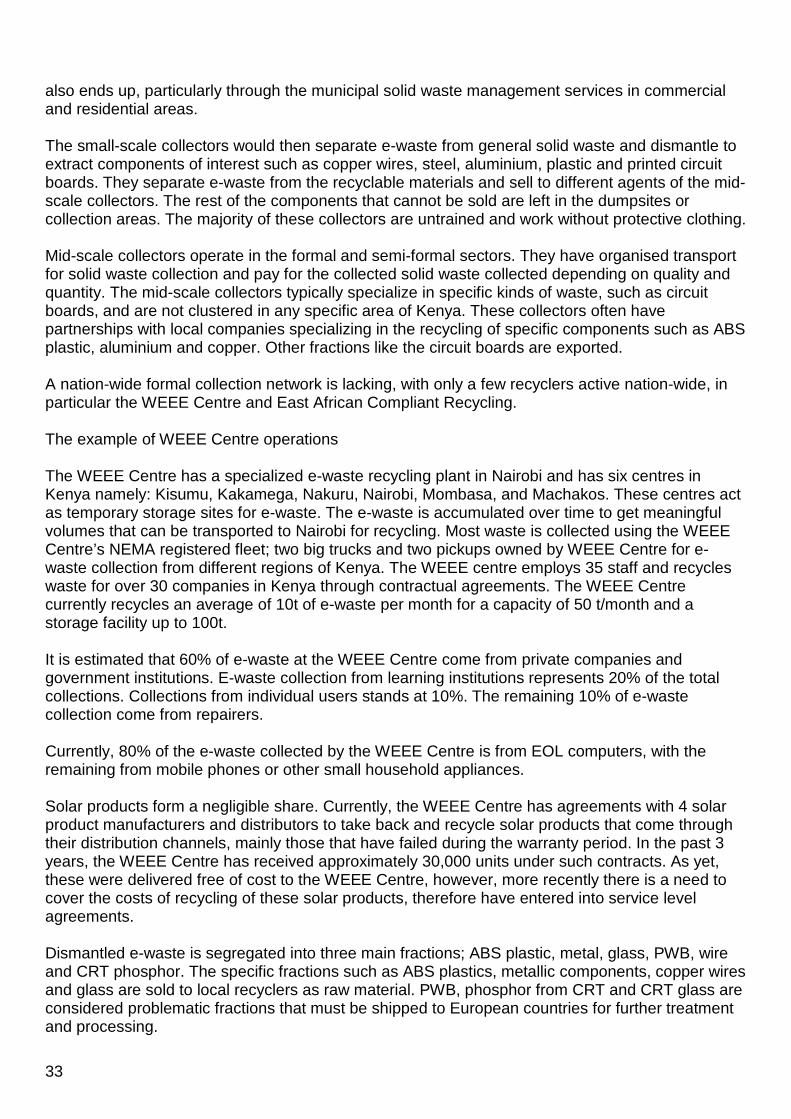
33
also ends up, particularly through the municipal solid waste management services in commercial and residential areas. The small-scale collectors would then separate e-waste from general solid waste and dismantle to extract components of interest such as copper wires, steel, aluminium, plastic and printed circuit boards. They separate e-waste from the recyclable materials and sell to different agents of the mid-scale collectors. The rest of the components that cannot be sold are left in the dumpsites or collection areas. The majority of these collectors are untrained and work without protective clothing. Mid-scale collectors operate in the formal and semi-formal sectors. They have organised transport for solid waste collection and pay for the collected solid waste collected depending on quality and quantity. The mid-scale collectors typically specialize in specific kinds of waste, such as circuit boards, and are not clustered in any specific area of Kenya. These collectors often have partnerships with local companies specializing in the recycling of specific components such as ABS plastic, aluminium and copper. Other fractions like the circuit boards are exported. A nation-wide formal collection network is lacking, with only a few recyclers active nation-wide, in particular the WEEE Centre and East African Compliant Recycling. The example of WEEE Centre operations The WEEE Centre has a specialized e-waste recycling plant in Nairobi and has six centres in Kenya namely: Kisumu, Kakamega, Nakuru, Nairobi, Mombasa, and Machakos. These centres act as temporary storage sites for e-waste. The e-waste is accumulated over time to get meaningful volumes that can be transported to Nairobi for recycling. Most waste is collected using the WEEE Centre’s NEMA registered fleet; two big trucks and two pickups owned by WEEE Centre for e-waste collection from different regions of Kenya. The WEEE centre employs 35 staff and recycles waste for over 30 companies in Kenya through contractual agreements. The WEEE Centre currently recycles an average of 10t of e-waste per month for a capacity of 50 t/month and a storage facility up to 100t. It is estimated that 60% of e-waste at the WEEE Centre come from private companies and government institutions. E-waste collection from learning institutions represents 20% of the total collections. Collections from individual users stands at 10%. The remaining 10% of e-waste collection come from repairers. Currently, 80% of the e-waste collected by the WEEE Centre is from EOL computers, with the remaining from mobile phones or other small household appliances. Solar products form a negligible share. Currently, the WEEE Centre has agreements with 4 solar product manufacturers and distributors to take back and recycle solar products that come through their distribution channels, mainly those that have failed during the warranty period. In the past 3 years, the WEEE Centre has received approximately 30,000 units under such contracts. As yet, these were delivered free of cost to the WEEE Centre, however, more recently there is a need to cover the costs of recycling of these solar products, therefore have entered into service level agreements. Dismantled e-waste is segregated into three main fractions; ABS plastic, metal, glass, PWB, wire and CRT phosphor. The specific fractions such as ABS plastics, metallic components, copper wires and glass are sold to local recyclers as raw material. PWB, phosphor from CRT and CRT glass are considered problematic fractions that must be shipped to European countries for further treatment and processing.

34
Given the low volumes and value of solar lamps and their distribution patterns, a collection and recycling system exclusively focused on solar products will require extensive logistical and financial efforts, that are neither cost efficient nor practical, also from the point of view of convenience for consumers. Therefore, a shared collection and recycling infrastructure, developed together and jointly with other manufacturers and producers of electronic and electrical appliances will not only create the required volumes for economies of scale, but also achieve better environmental outcomes. Market structure and dynamics Kenya is an early adopter of off-grid technology, and is currently the largest market for off-grid solar products. The current volume of off-grid products put on market in 2016 is estimated at over 1,500t, and approximately 700t of EOL off-grid products as waste. However, this is expected to grow to five-fold, to nearly 3,800t of EOL off-grid solar products by 2020. As a more mature market for solar products, the larger volume of EOL off-grid products as compared to other countries studied is expected as consumers replace older off-grid products with newer ones. Nevertheless, it will still form only a fraction of the WEEE generated, which is estimated at over 55,000 t in 2017 (UNU, 2015a). Figure 4: Evolution of off-grid products placed on market and e-waste generated (t) in Kenya.
The main companies that are involved in the production and distribution of solar lamps offer a 2-year warranty for their products, and have a mechanism for the replacement of defective devices within the warranty period. Consumers often first take their non-working solar products to repairers before discarding them. Repairers also buy defective solar products to use as spare parts. Some of the products are repaired and sold as secondhand products at relatively lower rates. The common problems with lamps included battery failure, broken connectors, defective switches, and problems with charging circuits. Most old models of solar lamps are assembled with standard Phillips screws, making it easy for any repairman to access the battery. A survey conducted by Lighting Africa between January 2013 – May 2013 indicated that at least 70% of technicians participated in the repair of Solar Lamps within a period of three (3) months. When lamps are successfully repaired, technicians seem to charge 26% of the original cost, making it more cost effective to have a failed product repaired locally than to purchase a new product. Most informal repairers do not have formal training on how to repair solar lamps and
-
1,000
2,000
3,000
4,000
5,000
6,000
7,000
2010 2011 2012 2013 2014 2015 2016 2017 2018 2019 2020
POM (t)
WG (t)
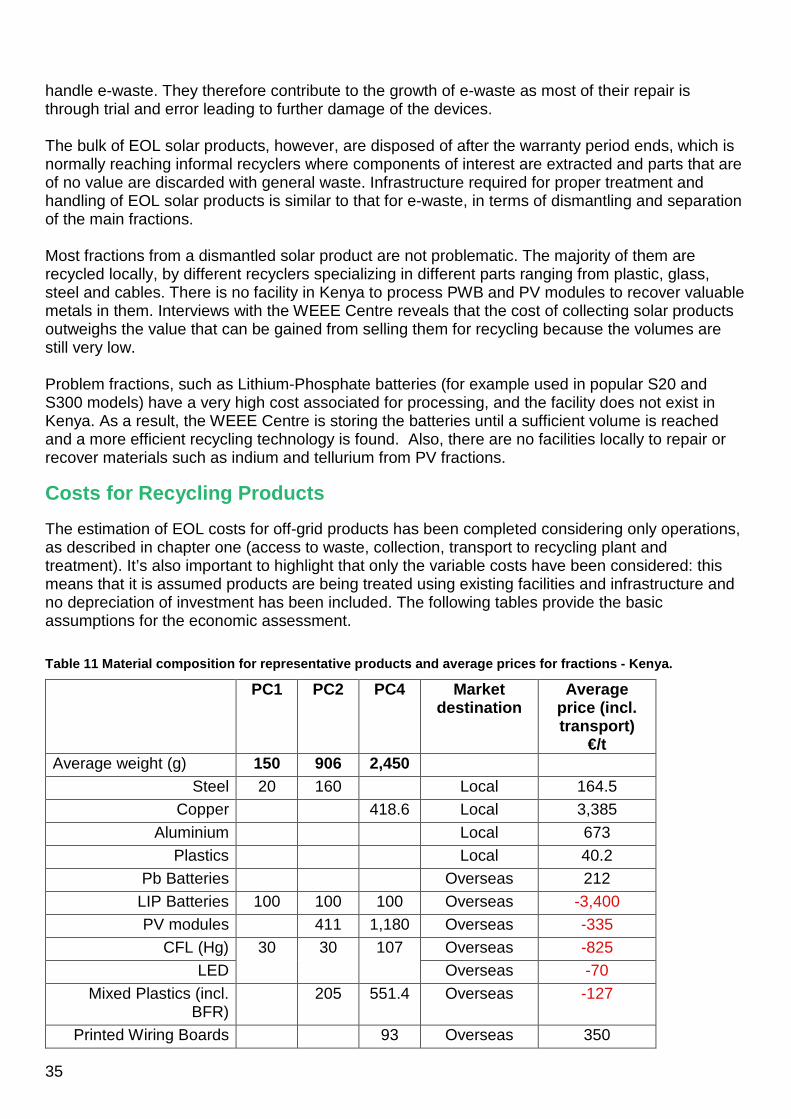
35
handle e-waste. They therefore contribute to the growth of e-waste as most of their repair is through trial and error leading to further damage of the devices. The bulk of EOL solar products, however, are disposed of after the warranty period ends, which is normally reaching informal recyclers where components of interest are extracted and parts that are of no value are discarded with general waste. Infrastructure required for proper treatment and handling of EOL solar products is similar to that for e-waste, in terms of dismantling and separation of the main fractions. Most fractions from a dismantled solar product are not problematic. The majority of them are recycled locally, by different recyclers specializing in different parts ranging from plastic, glass, steel and cables. There is no facility in Kenya to process PWB and PV modules to recover valuable metals in them. Interviews with the WEEE Centre reveals that the cost of collecting solar products outweighs the value that can be gained from selling them for recycling because the volumes are still very low. Problem fractions, such as Lithium-Phosphate batteries (for example used in popular S20 and S300 models) have a very high cost associated for processing, and the facility does not exist in Kenya. As a result, the WEEE Centre is storing the batteries until a sufficient volume is reached and a more efficient recycling technology is found. Also, there are no facilities locally to repair or recover materials such as indium and tellurium from PV fractions. Costs for Recycling Products The estimation of EOL costs for off-grid products has been completed considering only operations, as described in chapter one (access to waste, collection, transport to recycling plant and treatment). It’s also important to highlight that only the variable costs have been considered: this means that it is assumed products are being treated using existing facilities and infrastructure and no depreciation of investment has been included. The following tables provide the basic assumptions for the economic assessment. Table 11 Material composition for representative products and average prices for fractions - Kenya.
PC1 PC2 PC4 Market destination
Average price (incl. transport)
€/t Average weight (g) 150 906 2,450
Steel 20 160 Local 164.5 Copper 418.6 Local 3,385
Aluminium Local 673 Plastics Local 40.2
Pb Batteries Overseas 212 LIP Batteries 100 100 100 Overseas -3,400 PV modules 411 1,180 Overseas -335
CFL (Hg) 30 30 107 Overseas -825 LED Overseas -70
Mixed Plastics (incl. BFR)
205 551.4 Overseas -127
Printed Wiring Boards 93 Overseas 350

36
Table 12 Fluctuations of intrinsic economic value for products (€/product) - Kenya.
PC1 PC2 PC4 Min market price - CFL -0.39 -0.55 0.45 Min market price - LED -0.37 -0.53 0.53 Average market price - CFL -0.36 -0.50 0.56 Average market price - LED -0.34 -0.48 0.64 Max market price - CFL -0.33 -0.45 0.68 Max market price - LED -0.31 -0.43 0.75
As explained earlier the main driver behind the positive value of PC4-alike products is the presence of Copper cables and the high market value for such commodity. Compared to the other cases (Nigeria and Rwanda) the average salary for operators involved in collection and dismantling of products is relatively low (Table 13). Table 13 Main assumptions for the country case - Kenya.
Min Max Access to waste Cost to access the waste (€/product) 0 0 Cost for Collection (assuming 1t of material arising per month) Rent 20ft Container (€/month) 62 Salary operator collection centre (€/month) 93 Share off-grid products on total e-waste generated 0.6% 2.1% Transport to treatment plant (3t full load) Average transportation cost (€/km) 0.44 Average distance to the plant (km) 300 Treatment Salary operator dismantling (€/month) 167 Dismantling time (PC1, PC2, PC4) in minutes (5; 7; 15)
Assumptions described above lead to the results summarized in Table 14 below. Few elements can be highlighted (and are valid for other cases as well):
• The heavier the products (from PC1 to PC4) the higher the impact of the collection and transport, as calculated on a weight basis.
• In the case of treatment, the major impact is linked to disassembly time: in this respect lighter products lead to higher impact of labour cost per product dismantled. This is one of the reasons why, especially for products with low intrinsic economic value, manual disassembly further reduces the overall economic viability.
• Comparing the worst case and best case scenarios, in particular with regards to the collection and transport to plant, it is possible to highlight the positive impact of “shared collection infrastructures”, mitigating the economic impact of having 100% dedicated structures for off-grid products only.

37
Table 14 Impact of EOL costs for off-grid products management (€/product) - Kenya.
Worst case scenario21 Best case scenario22 PC1 PC2 PC4 PC1 PC2 PC4
Access to waste 0.00 0.00 0.00 0.00 0.00 0.00 Collection -0.01 -0.07 -0.20 -0.00 -0.00 -0.00 Transport to plant -0.01 -0.04 -0.11 -0.00 -0.00 -0.00 Treatment -0.47 -0.67 0.19 -0.40 -0.55 0.50 Total -0.49 -0.78 -0.11 -0.40 -0.55 0.49 Market price 30 135 380 € 30 € 135 380 Incidence EOL cost (% on market price)
1.6% 0.6% 0.03% 1.3% 0.4% 0.1%
Considering the total number of off-grid products expected to arise as waste in the coming years in Kenya it is possible to estimate the total economic impact for EOL management. Table 15 Impact of EOL costs for off-grid products management (€/year) - Kenya.
Worst case scenario Best case scenario PC1 PC2 PC4 PC1 PC2 PC4
Product Mix 65% 25% 10% 65% 25% 10% Total off-grid products arising as waste (t) - 2014
approx. 260
Total Cost (€m) 0.6 0.5 Total off-grid products arising as waste (t) - 2017
approx. 1,200
Total Cost (€m) 2.7 2.2 Main Challenges & Opportunities This section summarises the main challenges related to e-waste management in general and those specific for off-grid products; at the same time some opportunities related to the EOL management of off-grid products are presented. Main challenges related to e-waste management
• Low consumer awareness and unwillingness to change attitude of consumers: Awareness about the end-of-life disposal of EEE products and the harmful effects of improper disposal or recycling of e-waste is extremely low in Kenya. There is also no information on better ways of disposing e-waste than dumping with other rubbish. Also, most Kenyans are reluctant to give their e-waste for free, let alone pay for products that cost money to recycle properly.
• Lack of legislative framework to control the flow of used consumer electronic products: Although there is a discussion ongoing for legally obligated e-waste take-back and sound disposal, there is currently no adequate regulatory framework domestically to deal effectively with e-waste management in the country.
21 Worst case scenario is the one leading to highest economic impact: dedicated collection infrastructures, lowest
values of commodities, products with CFL. 22 Best case scenario is the one leading to lower economic impact: shared collection infrastructures, highest values
of commodities, products with LED.

38
• Lack of government support for collection and recycling infrastructure: The government has not put in place adequate infrastructure and resources for environmentally sound management of e-waste. The government has also not streamlined mechanisms for Local Authorities to separate e-waste from other solid wastes and store, collect, transport and process it in a structured manner. Currently, all e-waste collected by Local Authorities is not separated from general solid waste. Therefore, there is a need to develop a proper e-waste collection system in all Local Authorities where e-waste is separated at the source to effectively improve on its management.
• Inadequate technical expertise: There is a lack of trained manpower to properly depollute and dismantle EOL products. Most small scale and medium scale operators currently work without any formal training and therefore are unaware of best environmental practices, best available technologies or even simple measures that not only are environmentally sound but also more economically profitable.
Specific challenges for disposing EOL solar products
• Ministerial jurisdiction & policy: Alignment between access to energy programmes, which are driving the adoption of off-grid products and e-waste policies, in particular to clarify the status of EOL off-grid products and their coverage in e-waste bill.
• Unbranded/ Generic products: There is a large market of generic or unbranded solar products, which not only have a lower quality and lower product life, but also invisible producers, often local assemblers, who would resist any imposition of producer responsibility and potentially distorts the market.
• Low volumes: Unlike EEE products such as PCs and refrigerators which have not only larger volumes but also greater material value, the very low volumes, coupled with the low intrinsic material value of the products, makes them particularly difficult to collect or economically viable to process.
• Deeper rural penetration: One of the main virtues of off-grid solar products is its suitability for remote, rural areas that are inaccessible or unviable for a regular power grid. This widespread dispersion especially in remote rural areas is therefore also a challenge at the EOL for collection and take-back.
Opportunities in EOL solar product management
• Leveraging on PAYG, leasing: As the ownership remains with the producer or distributor, there is a greater incentive and opportunity to ensure that when products are replaced/ upgraded, the EOL products are collected, and brought back for proper recycling, especially if there are financial mechanisms linked to it.
• Possibilities of geo-location: As many SHS systems are connected through mobile networks, there is significant information on not only the operational efficiency, but also the geo-location of the systems that can be used to track trace and collect at the EOL.
• Awareness amongst OEMs/ Producer & Institutional Consumers: Government agencies and companies in Kenya are responding positively to the contractual arrangement for e-waste disposal.

39
8. Case study: Nigeria Country Overview Nigeria is Africa’s most populous country, with a population of over 170 million, with approximately 48% living in urban areas, with the rest 52% in rural areas. Despite its large oil and natural gas reserves, Nigeria’s electrification rate is less than 50% of the population with electricity generation varying between 2,500 MW and 5,000 MW of power out of an installed capacity of 5,963 MW. Urban areas have better access to grid electricity, with 40% of urban families and only 10% of rural families connected to the grid, albeit with an unreliable grid supply. Nigerian is Africa’s largest economy, but with the low electrification rate, the country provides huge demand for the off-grid solar market. As of H2 2015, Nigeria stood in 7th position for volume of solar products sold in Sub Saharan Africa and in 6th position for cash sales revenue from solar products. Nigeria also accounted for 4% of the branded products sold in Africa during 2014-2015. Programs like Lighting Africa, foreign investments and collaborations are said to contribute to the growth of solar sector. Based on the 1999 national survey by the Nigeria Energy Commission, there are a total of 33 companies that were active in Solar PV by then, with over 200 solar PV installations, in the country as at 1998, with capacities ranging from 3.5 to 7.2 kWp (Energy Commission of Nigeria). Legal Framework for E-waste Nigeria is a party to the Basel Convention on Trans-boundary Movement of Hazardous Waste, and also hosts the Regional Coordinating and Training Centre of the Basel Convention in Africa. The ‘Harmful Waste (Special Criminal Provisions) Act, 1988’ is similar to the Basel Convention. However, although Nigeria has signed the Bamako Convention, it is yet to ratify the Convention prohibiting the import into Africa of any hazardous (including radioactive) waste. The key stakeholders involved in the legal and regulatory framework in Nigeria are given in the table below, along with their mandate regarding e-waste and their role in the implementation of policies and strategies. Table 16 Key stakeholders invovled in Nigeria legislative framework.
Key Stakeholder Mandate in the e-waste legal and regulatory framework
Role in the implementation of the framework
The Federal Ministry of Environment
Set policy direction and enact legislation
Focal Point and Designated National Authority (DNA) in Nigeria
Regional Coordinating and Training Centre of the Basel Convention in Africa
Its responsibility includes the preparation of the national policy on e-waste, guideline on e-waste management and the national action plan for the management of e-waste
Created awareness, provided training, and has established a multi-stakeholder consultative committee on e-waste
National Environmental Standard and Regulation Enforcement Agency (NESREA)
Drafted Nigeria E-waste Regulation
Enforcement arm for all environmental laws, regulation, guidelines, rules, laws, policies and guidelines, including

40
Key Stakeholder Mandate in the e-waste legal and regulatory framework
Role in the implementation of the framework
monitoring and control of e-waste. Responsible for the implementation and enforcing of regulation related to EEE in Nigeria.
Lagos State EPA (LASEPA)
Set state-wide E-waste Policy Responsible for overseeing environmental legislation in Lagos State, including the port.
A legal and regulatory framework for proper E-waste management in Nigeria already exists to some extent, with the Nigerian National Environmental (Electrical/Electronic Sector) Regulation of May 201123, which aims to prevent and minimize pollution from all operations and ancillary activities of the electrical and electronic sector. Other relevant legislation and guidelines include:
• National Environmental (Sanitation and Waste Control) Regulation, S.I No. 28 OF 2009 – The purpose of this Regulation is to provide the legal framework for the adoption of sustainable and environment friendly practices in environmental sanitation and waste management to minimize pollution.
• National Pollution Abatement in Industries and Facilities Generating Wastes Regulations from 1991.
• National Environmental Protection Management of Solid and Hazardous Wastes Regulations 1991.
• National Guidelines on Registration of Environmental Friendly Products and Eco-labelling. • Guidelines on Hazardous Chemicals Management.
According to the Nigerian Bill, EEE is defined as:
‘equipment which is dependent on electric current/voltage or electromagnetic fields in order to function properly and equipment for the generation, transfer and measurement of such current and fields falling under the categories set out in Schedule 2 to these Regulation and designed for use with a voltage rating not exceeding 1,000 volts for alternating current and 1,500 volts for direct current’. Also ‘Equipment for generation, transfer, distribution and measurement of these current and fields, including the components necessary for cooling, heating, protection, etc, of any electrical or electronic component.
There is currently no special legislation for the management of solar panels. However, the existing NESREA regulation is applicable. Solar products were not specifically listed in the National Environmental Regulation of 2011 or any other national legislation on relating waste. However, the Regulation in its other sections recognizes EEE as ‘equipment for the generation, transfer, distribution and measurement of these currents and fields, including the components necessary for the cooling, heating, protection, etc., of the electrical or electronic components’. On this premise it can be assumed that off-grid solar components are covered by this regulation since they are used in electricity generation. Also, the battery and other components used in off-grid may be considered as ‘ancillary equipment’ covered by the Nigerian National Environmental (Electrical/Electronic Sector) Regulation. In this regard ‘ancillary equipment’ is defined as ‘pieces of equipment including batteries, memory devices, chargers used in EEE’ as listed in the regulation’.
23 The Federal Republic of Nigeria Official Gazette, No 50, Vol. 98, S.I 23, National Environmental (Electrical/
Electronic Sector) Regulations, 2011

41
In the Nigeria legislation a Producer is defined as a manufacturer in or outside of the Nigerian market for Electrical Electronic Equipment; an Importer is a person or body corporate who, in the ordinary course of conduct of a trade, occupation or profession, imports (brings into the country) Electrical Electronic Equipment (EEE) while a Distributor is defined as any person that provides electrical or electronic equipment on a commercial basis to the party who is going to use it. The Original Equipment Manufacturers (OEM)
“means manufacturers products or components that are purchased by a company and retailed under that purchasing company’s brand name; or producer of the finished product, last manufacturer in the supply chain before the end-user; or companies that design and build products bearing their name’
In this context, the ‘producer’ may include the brand owner, the outsourced manufacturer (where available) and the importers/distributors of EEE. The financial responsibilities for the management of EoL EEE rests on the ‘producers’ as the Nigerian legislation is based on EPR. The legislation requires that the ‘Manufacturers and Importers shall establish a process for the collection, handling, transportation and final treatment of post-consumer Electrical Electronic products regardless of who is the original brand owner. Under the Extended Producer Responsibility adopted by the NESREA regulations and obligations all three are regarded as producers. The responsibilities of the Producer as provided in the legislation include:
• collecting e-waste generated from the end-of-life of their products in line with the principle of Extended Producer Responsibility (EPR), and to ensure that such e-wastes are channelled to registered refurbisher or dismantler or recycler.
• setting up collection centres or take back system either individually or collectively for all electrical and electronic equipment at the end of their life.
• financing, and organizing a system to meet the costs involved in the environmentally sound management of e-waste generated from the end-of-life of its own products and historical waste available on the date from which these rules come into force. Such financing system shall be transparent. The producer may choose to establish such financial system either individually or by joining a collective scheme.
The NESREA regulation also stipulates that among others that ‘the distributor/dealer shall be responsible to collect the e-waste by providing the consumer(s) a box, bin or a demarcated area to deposit e-waste’. Batteries are not covered specifically as ‘equipment’ by the Nigerian National Environmental (Electrical/Electronic Sector) Regulation but were listed under the ’ancillary equipment’ in this Regulation. Since batteries are used as ‘equipment for the generation of currents and fields’ it can be considered to be covered by the regulation and is under EPR. Consequently batteries used under conditions similar to that defined by the EEE Regulation could be considered to be covered. However, it will be beneficial that a revision of this regulation takes into consideration these loopholes. Another Nigerian regulation titled the ‘Sanitation and Waste Control Regulation’ of 2009 covers batteries and requires that all waste rechargeable batteries are collected and properly recycled. Market structure and dynamics Nigeria, although a large market for EEE, is still a small market for off-grid solar products, albeit with the potential to grow exponentially. The current volume of off-grid products put on market in 2016 is estimated at 217t, and less than 100t of EOL off-grid products as waste approximately. However, this is expected to grow to three-fold, to nearly 530t of EOL off-grid solar products by

42
2020. Nevertheless, the volume of EOL solar products compared to WEEE, will remain negligible at less than 0.2%, given that Nigeria is estimated to generate over 280,000t of WEEE in 2017 (UNU, 2015a). Figure 5: Evolution of off-grid products placed on market and e-waste generated (t) in Nigeria.
A reason for the limited adoption and low usage of off-grid solar products is because the products are not readily refurbished in Nigeria. This is in stark contrast to electronic products for which there is a thriving repair and refurbishing infrastructure. While some non-working off-grid solar products are repaired and re-used, most are not. At component level only some components such as inverters and batteries may be reused, but typically panels are not. Recovered components of e-waste in general and some components of the solar off-grid (especially the batteries) have ready markets locally and internationally. Unusable components from solar products are therefore disposed with municipal solid wastes. As various rechargeable battery types are used in off-grid systems, some are more commonly reused than others. Non-working off-grid solar batteries are collected in the informal sector and by the companies supplying and installing solar products to clients for either repair or recycling in Lagos or for export. There is an informal sector growing in the reuse and replacement of batteries mostly in Lagos, however, the service life in most cases is drastically reduced and not guaranteed. These batteries most come from banks, telecommunication companies etc., that give or exchange their batteries after about 2-3 years of usage. Such batteries are often reused in the installation of off-grid products in private homes and small establishments. In the informal sector, used off-grid solar batteries of good quality, usually from the banking sector, sell for as much as N10,000. Management of Li-ion and NiMH battery technologies are still in the infancy if any in Nigeria. Most NiMH and Li-ion batteries especially those used in mobile phones and other hand held devices are disposed with MSW. Lead-acid batteries are disassembled and the lead processed into ingots for export or reused locally in the manufacture of automobile batteries. The plastic housing of batteries are recycled locally and used in the manufacture of plastic wares including chairs and other household goods. The glass fractions of the panels do not have reuse/recycling value. Aluminium frames stripped from the PV panels are also recycled locally. Presently, the PV panel and its glass components do not have a reuse option and there are no recycling technologies available. PV panels are disposed with MSW. The PWB components just like the PWB of other EEE are collected in the informal sector and recycled locally or exported.
-
100
200
300
400
500
600
700
800
900
2010 2011 2012 2013 2014 2015 2016 2017 2018 2019 2020
POM (t)
WG (t)

43
Household solar systems, including lamps (CFLs, LED) and plastics (tend to be poor products in terms of composition), the compact fluorescent lamps (CFLs) and light emitting diode (LED) bulbs are disposed with MSW and are not recycled. However, the rechargeable CFL and LED lamps are collected and the valuable components such as the batteries and plastic housing are mixed with recyclables and sold to recyclers. Costs for Recycling Products The estimation of EOL costs for off-grid products has been done considering only operations as described in chapter one (access to waste, collection, transport to recycling plant and treatment). It’s also important to highlight only the variable costs has been considered: this means that it is assumed that products are being treated in existing facilities and infrastructures and no depreciation of investment has been included. The following tables provide the basic assumptions for the economic assessment. Table 17 Material composition for representative products and average prices for fractions - Nigeria.
PC1 PC2 PC4 Market destination
Average price (incl. transport)
€/t Average weight (g) 150 906 2,450
Steel 20 160 Local 107.5 Copper 418.6 Local 3,175
Aluminium Local 580 Plastics Local 355
Pb Batteries Overseas 212.5 LIP Batteries 100 100 100 Overseas -3,400 PV modules 411 1,180 Overseas -335
CFL (Hg) 30 30 107 Overseas -825 LED Overseas -70
Mixed Plastics (incl. BFR)
205 551.4 Overseas -127.5
Printed Wiring Boards 93 Overseas 350 € Table 18 Fluctuations of intrinsic economic value for products (€/product) - Nigeria.
PC1 PC2 PC4 Min market price - CFL -0.39 -0.57 0.06 Min market price - LED -0.37 -0.54 0.14 Average market price - CFL -0.36 -0.51 0.47 Average market price - LED -0.34 -0.49 0.55 Max market price - CFL -0.33 -0.46 0.76 Max market price - LED -0.31 -0.43 0.83
Compared to the other cases in Nigeria off-grid products (SPL in particular) has been reported to be purchased by scavengers mainly interested in re-selling spare parts to repair shops. Transport cost is high compared to Kenya and Rwanda. Labour is higher compared to Kenya.

44
Table 19 Main assumptions for the country case - Nigeria.
Min Max Access to waste Cost to access the waste (€/product) 0.13 0.22 Cost for Collection (assuming 1t of material arising per month) Rent 20ft Container (€/month) 62 Salary operator collection centre (€/month) 235 Share off-grid products on total e-waste generated 0.02% 0.06% Transport to treatment plant (3t full load) Average transportation cost (€/km) 1.03 Average distance to the plant (km) 450 Treatment Salary operator dismantling (€/month) 330 Dismantling time (PC1, PC2, PC4) in minutes (5; 7; 15)
Assumptions of tables above lead to the summary results of Table 20. Because of high labour costs, treatment costs are high. Table 20 Impact of EOL costs for off-grid products management (€/product) - Nigeria.
Worst case scenario24 Best case scenario25 PC1 PC2 PC4 PC1 PC2 PC4
Access to waste -0.14 -0.14 -0.23 -0.14 -0.14 -0.23 Collection -0.02 -0.10 -0.27 -0.00 -0.00 -0.00 Transport to plant -0.02 -0.14 -0.38 -0.00 -0.00 -0.00 Treatment -0.55 -0.80 -0.43 -0.48 -0.67 0.34 Total -0.73 -1.18 -1.31 -0.61 -0.80 0.11 Market price 30 135 380 30 135 380 Incidence EOL cost (% on market price)
2.4% 0.9% 0.3% 2.0% 0.6% 0.03%
Considering the total number of off-grid products expected to arise as waste in the coming years in Nigeria it is possible to estimate the total economic impact for a proper EOL management.
24 Worst case scenario is the one leading to highest economic impact: dedicated collection infrastructures, lowest
values of commodities, products with CFL. 25 Best case scenario is the one leading to lower economic impact: shared collection infrastructures, highest values
of commodities, products with LED.

45
Table 21 Impact of EOL costs for off-grid products management (€/year) - Nigeria.
Worst case scenario Best case scenario PC1 PC2 PC4 PC1 PC2 PC4
Product Mix 65% 25% 10% 65% 25% 10% Total off-grid products arising as waste (t) - 2014
approx. 40
Total Cost (€m) 0.1 0.08 Total off-grid products arising as waste (t) - 2017
approx. 160
Total Cost (€m) 0.5 0.4 Main Challenges & Opportunities This section summarises the main challenges related to e-waste management in general and those specific for off-grid products; at the same time some opportunities related to the EOL management of off-grid products are presented. Main challenges related to e-waste management
• Low consumer awareness: Awareness of the environmental hazards of dumping e-waste is low. However, reports such as Basel Action Network report in 2005 and the E-waste Africa project of 2012 etc. have created some awareness of the flows and dangers of e-waste especially among the educated populace. Documentaries by foreign and local television channels have also been helpful. The awareness levels amongst the general population in Lagos are now increasing through Government led campaigns to pro-actively explain that dumping is wrong and there is a correct way to dispose of waste.
• Lack of financial framework: There is need to develop a financial scheme that would ensure the sustenance of recycling activities which consider the management of both EOL with economic value and the ones that have no economic value.
• Lack of appropriate technology: Presently, there is no formal recycling of e-waste in Nigeria. Linked to the absence of a financial framework, there is a lack of investor confidence in setting up economically viable formal recycling facilities. Material recovery is common through the disassembly of EoL devices to separate/recovery components of value for export. Selected components are also recycled informally using crude technologies.
Specific challenges for disposing EOL solar products
• Recycling technologies: The material composition, especially of PV products, is strikingly different from the mainstream e-waste components. These products contain crystalline silicon, or thin-film materials/technologies that use cadmium telluride, CIGS and amorphous silicon that are not common components of the mainstream e-waste. Recycling possibilities will depend on the kind of technology used in the modules (silicon based modules, non-silicon based modules etc.).
• Low volumes: Unlike EEE products such as PCs and refrigerators which have not only larger volumes but also greater material value, the very low volumes, coupled with the low intrinsic material value of the products, makes them particularly difficult to collect or economically viable to process.

46
Opportunities in EOL solar product management • Government advocacy: In Lagos State, waste management authority LAWMA has
introduced recycling stations26 where plastics, glass metal and paper can be collected for recycling. The presence of LAWMA and their volunteer teams on the streets has helped to provide a form of governance to the waste situation in Lagos. Such structures could represent a network on which off-grid products could also be collected.
• Replacement value: Components such as the inverters and batteries are of high value and have ready market. In fact, there is common knowledge/belief that the life span of the solar batteries is between 1 and 2 years. Consequently, most institutions that use solar as backup power supply replace their batteries every 2 years. The supplies/installers of solar off-grid regularly go back to their clients to take back the batteries in the name of ‘proper disposal’.
• Job creation: There is already a large population engaged in informal collection and recycling activities, however, living in subsistence conditions. With more systemic management of EOL products, including off-grid solar products, there will be substantial potential for creating green jobs in the collection, dismantling, repair and proper treatment and recycling of EOL products. Encouraging formalization of the present highly polluting informal recycling sector will also provide a chance for the existing recyclers to grow and foster entrepreneurship in the reverse supply chain.
26 Source: http://www.lawma.gov.ng/ - LAWMA

47
9. Case study: Rwanda Country Overview Rwanda is one of the most densely populated countries in Africa with a population of 11.6 million, although the large majority, over 70% lives in rural areas, and only 29% are urban residents. The Government of Rwanda has set a target to provide every Rwandan with access to electricity by 2020. The access to electricity over the last few years has increased from 14% in 2012 to 24% in 2016. The target for electricity access is for 70% of households to have access by 2017/18, to be met through a combination of on-grid and off-grid supply. The recent Rural Electrification Strategy show the commitment of the government of Rwanda to provide the most appropriate and affordable form of electricity access by increasing the off grid energy targets from 22% (EDPRS II target) to 37% and reduce from 48% to 33% of on grid energy access targets by 2017/1827. Rwanda is seen as one of the emerging markets for solar products in Sub Saharan Africa. Rwanda stood 5th for volume of solar products sold in SSA in H2 2015 and over 90% being quality verified products. Among the top countries in SSA for cash sales revenue, Rwanda ranked 5th indicating the willingness of consumers in investing on off-grid products. The strong and explicit support from Rwandan government with target of reaching a large section of population with off-grid solutions by 2018 has sent out a positive signal. Market mechanisms, consumer awareness and consumer financing are considered few major factors in realizing the potential of solar market in Rwanda. Legal Framework for E-waste Rwanda is also a signatory and has ratified some international conventions and agreements relating to the environment28, both regionally and globally. Conventions and agreements of potential relevance to e-waste management that Rwanda has signed are:
• The Basel Convention on the control of trans boundary movements of hazardous wastes and their disposal dangerous wastes and their elimination, was adopted in Basel on 22 March 1989 and ratify Rwanda in August 200329;
• The Stockholm Convention on Persistent Organic Pollutants signed in Stockholm on 22 May 2001 and ratified by Rwanda in 08 July 2002;
• The Rotterdam Convention was ratified by Rwanda in August 2003. • Rwanda is a party to the Bamako Convention, adopted under the auspices of the
Organization of Africa Unity (OAU), prohibits hazardous waste imports into Africa The key stakeholders involved in the legal and regulatory framework in Rwanda are given in the table below, along with their mandate regarding e-waste and their role in the implementation of policies and strategies. Table 22 Key stakeholders invovled in Rwanda legislative framework.
Key Stakeholder Mandate in the e-waste legal and regulatory framework
Role in the implementation of the framework
Ministry of Youth and ICT Lead the development of e-waste policy and strategic plan for management of e-waste
Focal point ministry that coordinates and monitors the implementation of the strategy
27 Source : Rwanda Rural Electrification Strategy 28 Source: National implementation plan of the Basel convention 2012-2021 29 Source: http://www.basel.int/
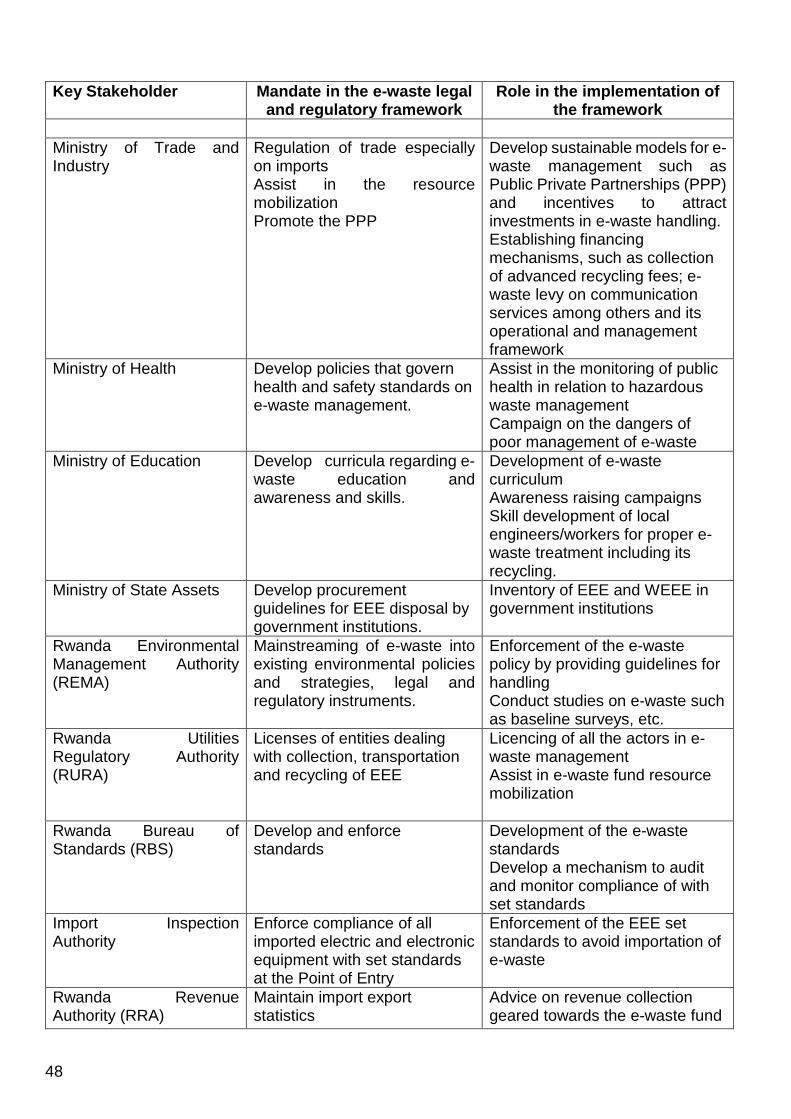
48
Key Stakeholder Mandate in the e-waste legal and regulatory framework
Role in the implementation of the framework
Ministry of Trade and Industry
Regulation of trade especially on imports Assist in the resource mobilization Promote the PPP
Develop sustainable models for e-waste management such as Public Private Partnerships (PPP) and incentives to attract investments in e-waste handling. Establishing financing mechanisms, such as collection of advanced recycling fees; e-waste levy on communication services among others and its operational and management framework
Ministry of Health Develop policies that govern health and safety standards on e-waste management.
Assist in the monitoring of public health in relation to hazardous waste management Campaign on the dangers of poor management of e-waste
Ministry of Education Develop curricula regarding e-waste education and awareness and skills.
Development of e-waste curriculum Awareness raising campaigns Skill development of local engineers/workers for proper e-waste treatment including its recycling.
Ministry of State Assets Develop procurement guidelines for EEE disposal by government institutions.
Inventory of EEE and WEEE in government institutions
Rwanda Environmental Management Authority (REMA)
Mainstreaming of e-waste into existing environmental policies and strategies, legal and regulatory instruments.
Enforcement of the e-waste policy by providing guidelines for handling Conduct studies on e-waste such as baseline surveys, etc.
Rwanda Utilities Regulatory Authority (RURA)
Licenses of entities dealing with collection, transportation and recycling of EEE
Licencing of all the actors in e-waste management Assist in e-waste fund resource mobilization
Rwanda Bureau of Standards (RBS)
Develop and enforce standards
Development of the e-waste standards Develop a mechanism to audit and monitor compliance of with set standards
Import Inspection Authority
Enforce compliance of all imported electric and electronic equipment with set standards at the Point of Entry
Enforcement of the EEE set standards to avoid importation of e-waste
Rwanda Revenue Authority (RRA)
Maintain import export statistics
Advice on revenue collection geared towards the e-waste fund

49
Key Stakeholder Mandate in the e-waste legal and regulatory framework
Role in the implementation of the framework
Rwanda Development Board
Government procurement Promotion of bulk leasing Registration of e-waste actors
Legal and regulatory framework for proper E-waste management in Rwanda is already under development. The following documents have been developed and submitted to the cabinet for approval (Draft E-waste law, Draft regulations and Draft E-waste policy & Strategy). Furthermore, under the Ministerial Order No:1 of 25/10/2011 related to importation of used electronics/ICT equipment30, the Rwanda Standard Board (RSB) has developed the requirements on importation of EEE towards the reduction of e-waste generation in the country, particularly from computers and other ICT devices. Other laws and regulations related to the waste management in Rwanda are
• The Environment Organic Law N° 04/2005 of 08/04/2005 : The law determines the modalities of protection, conservation and promotion of environment in Rwanda and it states that collection; transportation; treatment and disposal of waste should be done in an environmentally friendly manner but does not appropriately and specifically address the e-waste management.
• The ICT bill31 in its article 130 provides a framework for the development of e-waste management regulations.
• Regulations on solid waste collection and transportation, 2012; • Regulations on cleaning services, 2012; • Guidelines on standards for the management of waste disposal sites/Landfills, 2009.
Rwanda defines ‘Electrical and electronic equipment’ as devices which is dependent on electric currents or electromagnetic fields in order to work properly and equipment for the generation, transfer and measurement of such currents and fields falling under the categories set out in Annex 1 of draft E-waste regulations in Rwanda32. E-waste encompasses all discarded and disposed Electrical and Electronic Equipment (EEE). Solar products (SPL and SHS) might be regarded as in the scope of the E-waste management legislation in Rwanda as equipment that is used to generate, transfer and measure electrical currents. Under the legal framework producers are obliged to organize and finance the e-waste management systems in the country. It defines the Producer:
as any person or entity who introduces or causes to be introduced new and used electrical and electronic equipment into the market by sale, donation, gifts, inheritance or by any such related methods and can either be a manufacturer, importer, distributor or assembler.
Under this definition manufacturer, importer, distributor or assemblers of solar products will have obligation to ensure proper management of EOL solar products. Collection and Recycling infrastructure Recycling infrastructures for E-waste are currently under development. The most common collection channels in place for the general waste and e-waste are:
• Business to business: national and multinational companies, SMEs, NGOs, public sector, international organizations, etc
30 Ministerial Order No:1 of 25/10/2011 related to importation of used electronics/ICT equipment in Rwanda 31 Source: Rwanda ICT bill 32 See Annex 1 of the draft Regulations Governing E-waste management in Rwanda

50
• Door –to door collection which involves direct pick up of e-waste at the house hold or institutional level, This is currently mainly done by companies collecting solid waste and at the same collect e-waste
• The collection of the informal sector: A collection of informal waste pickers, small repair and refurbishment shops, etc.
An E-waste management Project funded by the Rwanda Green Fund (FONERWA) was designed to establish environmental friendly facilities to collect and dismantle electrical and electronic waste. The project is currently setting collection points (one in each district33) and provincial collection centres which will collect, register, store and transport e-waste to the central dismantling facility. The E-waste dismantling facility is under construction on a land of 2ha in the Bugesera Industrial Park, Bugesera District 30 km South east of the Rwanda Capital city of Kigali. E-waste that contains valuable materials (such as PC, TV, laptops, phones, fridges, Household off grid products, etc.) is first targeted and at the same time, e-waste that contains toxic materials will be collected, decontaminated and stored. Materials that can be recycled locally eg iron, copper, Aluminium, plastics will be sold to local industries. Other valuable components (such as PCB, etc) and hazardous components (CRT, batteries such as Nickel Cadmium, Nickel Metal Hydride & Lithium Ion ) will be exported to the international smelters. End of Life off grid products (SPL and SHS) also do contain both hazardous and valuable materials, hence are targeted by the E-waste management project in Rwanda. When contacted Rwanda Energy Group answered that they currently have about 2,500 faulty off-grid solar products at their central storage, which would be disposed once the construction of the dismantling facility is finished. Other companies selling off grid solar products such as BBox, Dassy Entreprise answered that they have a big number of end of life off grid solar products and batteries stored but there are waiting for guidance on their disposal. Market structure and dynamics Rwanda is a small market for off-grid solar products, but is growing exponentially. The current volume of off-grid products put on market in 2016 is estimated at 144 t, and only 65t of EOL off-grid products as waste. However, this is expected to grow to five-fold, to nearly 350t of EOL off-grid solar products by 2020.
33 Rwanda has 30 districts, 4 provinces and the City of Kigali.

51
Figure 6: Evolution of off-grid products placed on market and e-waste generated (t) in Rwanda.
However, EOL off-grid product would still form a very small fraction of the e-waste stream. The 2015 inventory survey on EEE and the expected amount of E-waste to be generated in Rwanda that focused on about 15 major EEE in Rwanda i.e PCs, printers, Mobile phones, Copying machines, Refrigerators, Air conditioners, Televisions, Washing machines, Car batteries, Dry cell batteries, Stabilizers, Electric cooking, stoves, Electric water heating systems, Fluorescent lamps and Radios revealed that there is an annual growth in the importation of EEE to Rwanda of about 5.95% (between 2010 and 2014). The survey indicates that Rwanda has an e-waste annual generation potential of 9,741t of which 7,677t (82.9%) will be contributed by individuals, 597t (6.34%) by private institutions and 1,143t (12.14%) by public institutions. To ensure effective collection of e-waste, 30 collection points (one in each district34) four provincial collection centres, and one central dismantling facility are being established. Each collection point will be equipped with a 20ft container to store e-waste and the collection centres will have a capacity of handling 500 tons of e-waste. An upcoming E-waste dismantling facility in Bugesera Industrial Park will have a capacity to handle 5,000 to 6,000 tons of e-waste per year with four major lines at the beginning, mainly for TV/PCs dismantling line, CRTs, Metal Baler and Plastic crushing and washing line. According to the project manager the facility will expand in the near future to have more additional to cover a wide range of end of life products. The e-waste facility will collect, sort, decontaminate, dismantle and recover fractions that can be reused or recycled locally and fractions that cannot be reused/recycled locally which will be shipped to international smelters to be treated in environmentally sound manner. The Table 23 below shows the existing and possible downstream market in Rwanda for different e-waste fractions generated by Electrical and electronic equipment35. Of these, of most interest for off-grid solar products is the market for plastics, base metals (iron, copper and aluminium), batteries and glass fractions. For the main fractions, plastics, iron, copper and aluminium, local markets exist. However, more complex and often hazardous to recycle fractions such as printed circuit boards and batteries (specially Lithium ones) have to be exported for final treatment and processing.
34 Rwanda has 30 districts, 4 provinces and the City of Kigali. 35 Source: Rwanda E-waste management project business plan.
-
100
200
300
400
500
600
2010 2011 2012 2013 2014 2015 2016 2017 2018 2019 2020
POM (t)
WG (t)
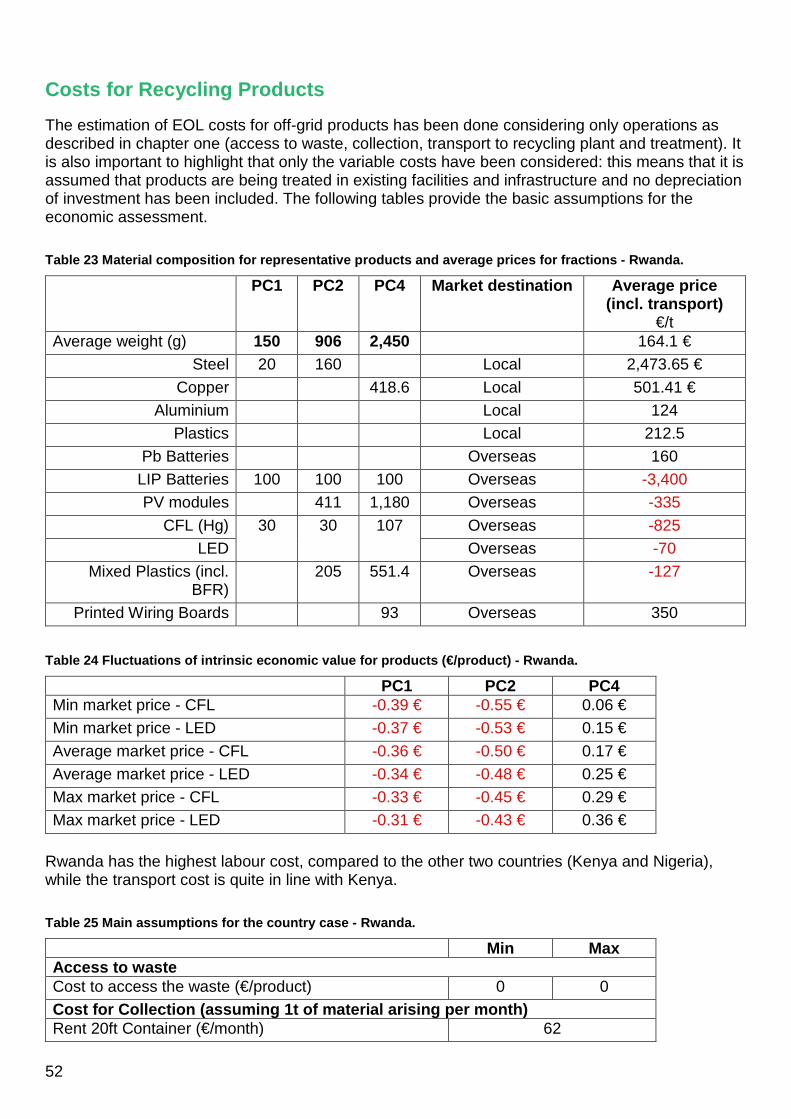
52
Costs for Recycling Products The estimation of EOL costs for off-grid products has been done considering only operations as described in chapter one (access to waste, collection, transport to recycling plant and treatment). It is also important to highlight that only the variable costs have been considered: this means that it is assumed that products are being treated in existing facilities and infrastructure and no depreciation of investment has been included. The following tables provide the basic assumptions for the economic assessment. Table 23 Material composition for representative products and average prices for fractions - Rwanda.
PC1 PC2 PC4 Market destination Average price (incl. transport)
€/t Average weight (g) 150 906 2,450 164.1 €
Steel 20 160 Local 2,473.65 € Copper 418.6 Local 501.41 €
Aluminium Local 124 Plastics Local 212.5
Pb Batteries Overseas 160 LIP Batteries 100 100 100 Overseas -3,400 PV modules 411 1,180 Overseas -335
CFL (Hg) 30 30 107 Overseas -825 LED Overseas -70
Mixed Plastics (incl. BFR)
205 551.4 Overseas -127
Printed Wiring Boards 93 Overseas 350 Table 24 Fluctuations of intrinsic economic value for products (€/product) - Rwanda.
PC1 PC2 PC4 Min market price - CFL -0.39 € -0.55 € 0.06 € Min market price - LED -0.37 € -0.53 € 0.15 € Average market price - CFL -0.36 € -0.50 € 0.17 € Average market price - LED -0.34 € -0.48 € 0.25 € Max market price - CFL -0.33 € -0.45 € 0.29 € Max market price - LED -0.31 € -0.43 € 0.36 €
Rwanda has the highest labour cost, compared to the other two countries (Kenya and Nigeria), while the transport cost is quite in line with Kenya. Table 25 Main assumptions for the country case - Rwanda.
Min Max Access to waste Cost to access the waste (€/product) 0 0 Cost for Collection (assuming 1t of material arising per month) Rent 20ft Container (€/month) 62

53
Min Max Salary operator collection centre (€/month) 713 Share off-grid products on total e-waste generated 0.4% 1.3% Transport to treatment plant (3t full load) Average transportation cost (€/km) 0.18 Average distance to the plant (km) 150 Treatment Salary operator dismantling (€/month) 892 Dismantling time (PC1, PC2, PC4) in minutes (5; 7; 15)
Assumptions above lead to results in table 26. As before it is clear how the impact of manual disassembly of such low-value product is playing a fundamental role in influencing the overall EOL management costs, together with the high cost for disposal of the most critical fractions. Table 26 Impact of EOL costs for off-grid products management (€/product) - Rwanda.
Worst case scenario36 Best case scenario37 PC1 PC2 PC4 PC1 PC2 PC4
Access to waste 0.00 € 0.00 € 0.00 € 0.00 € 0.00 € 0.00 € Collection -0.03 € -0.19 € -0.50 € -0.00 € -0.00 € -0.00 € Transport to plant -0.00 € -0.01 € -0.02 € -0.00 € -0.00 € -0.00 € Treatment -0.83 € -1.18 € -1.27 € -0.76 € -1.05 € -0.96 € Total -0.86 € -1.37 € -1.79 € -0.76 € -1.05 € -0.97 € Market price 30 € 135 € 380 € 30 € 135 € 380 € Incidence EOL cost (% on market price)
2.9% 1.0% 0.5% 2.5% 0.8% 0.3%
Considering the total number of off-grid e-waste products expected to arise in future years in Rwanda it is possible to estimate the total economic impact for proper EOL management. Table 27 Impact of EOL costs for off-grid products management (€/year) - Nigeria.
Worst case scenario Best case scenario PC1 PC2 PC4 PC1 PC2 PC4
Product Mix 65% 25% 10% 65% 25% 10% Total off-grid products arising as waste (t) - 2014
approx. 25
Total Cost (€) 0.1 M€ 0.08 M€ Total off-grid products arising as waste (t) - 2017
approx. 110
Total Cost (€) 0.45 M€ 0.4 M€
36 Worst case scenario is the one leading to highest economic impact: dedicated collection infrastructures, lowest
values of commodities, products with CFL. 37 Best case scenario is the one leading to lower economic impact: shared collection infrastructures, highest values
of commodities, products with LED.

54
Main Challenges & Opportunities This section summarises the main challenges related to e-waste management in general and those specific for off-grid products; at the same time some opportunities related to the EOL management of off-grid products are presented. Main challenges related to e-waste management
• Low consumer awareness: Overall environmental awareness of the general public is low, and even more on e-waste challenges and management, and especially EoL off-grid products.
• Ineffective legislative and regulatory framework: Though under discussion as a draft, there is no law in force to oblige consumers and producers to dispose of and recycle e-waste properly. In the absence of legislation, there is no or very limited producer responsibility voluntarily. Additionally, there are no complementary policies, regulations or standards that safeguard health, environment and social consequences of e-waste.
• Limited national capacity: Presently there is inadequate national capacity to process e-waste, which is accentuated with dumping of e-waste from developed countries in the form of donations, second hand or sub-standard products.
Specific challenges for disposing EOL solar products
• Low volumes: In 2012, only 1.5% of the population was using off-grid alternatives in Rwanda. This means very small numbers of products are on the market, and even smaller numbers are seen in the waste stream as yet.
Opportunities in EOL solar product management
• Government advocacy: Rwanda has identified the problem of e-waste and key stakeholders are involved in developing legislation and providing the framework. An E-waste Policy & Strategy, Law and Regulations have been developed (although not yet approved by Cabinet), and the E-waste management standards approved. In addition, the Rwandan Government has made a commitment to allocate funds for 3 years implementation of a e-waste treatment facility. This facility would be also useful for solar products dismantling and storage.
• Potential employment creation and revenue generation source: There is a potential for informal business in recycling to be formalized, also increasing the revenue from the recovery of valuables materials from e-waste. There are also government programs that support small entrepreneurs (e.g. Youth, disabled, Women) for livelihood improvements that would be able to participate in this sector.


