Electronic Supplementary Information - The Royal … · 1 Electronic Supplementary Information ....
13
1 Electronic Supplementary Information Facile Fabrication of Novel Highly Microporous Carbons with Superior Size-Selective Adsorption and Supercapacitance Properties Zhenghui Li, Dingcai Wu, ∗ Yeru Liang, Fei Xu, Ruowen Fu Materials Science Institute, PCFM Lab and DSAPM Lab, School of Chemistry and Chemical Engineering, Sun Yat-sen University, Guangzhou 510275, P. R. China Experimental Sample preparation In a typical process, 12.0 g of anhydrous aluminium chloride (AlCl 3 ) was added into 100 ml of carbon tetrachloride (CCl 4 ) in a three-neck flask. Then the mixture was refluxed with magnetic stir for 40 min at 75 °C. Subsequently, a solution of 5.0 g of linear polystyrene resin dissolved in 100 ml of CCl 4 was added to undergo a Friedel-Crafts crosslinking reaction. After 30 min, 100 ml of ethanol-water solution (95 wt. % ethanol/water = 80 ml/20 ml) was added slowly to stop the reaction. The product was filtered off, washed with the 95 wt.% ethanol/5 wt.% dilute hydrochloric acid mixture (150 ml/50 ml) and pure water, followed by drying at 100 °C for 8 h. After that, the as-obtained xPS was carbonized at 900 °C for 3 h in N 2 flow with a heating rate of 2 °C/min, leading to formation of HMC. To investigate the nanostructure evolution, xPS was also treated at 320 and 460 °C to obtain xPS-320 and xPS-460, respectively. For fabrication of uHMC, the procedure is exactly the same as that of HMC except that the used disposable polystyrene foam tableware, which was washed prior to utilization, was employed as the raw material. ∗ Corresponding author. E-mail: [email protected] Electronic Supplementary Material (ESI) for Nanoscale This journal is © The Royal Society of Chemistry 2013
-
Upload
nguyenminh -
Category
Documents
-
view
218 -
download
0
Transcript of Electronic Supplementary Information - The Royal … · 1 Electronic Supplementary Information ....
1
Electronic Supplementary Information
Facile Fabrication of Novel Highly Microporous Carbons with Superior
Size-Selective Adsorption and Supercapacitance Properties
Zhenghui Li, Dingcai Wu,∗ Yeru Liang, Fei Xu, Ruowen Fu
Materials Science Institute, PCFM Lab and DSAPM Lab, School of Chemistry and Chemical
Engineering, Sun Yat-sen University, Guangzhou 510275, P. R. China
Experimental
Sample preparation
In a typical process, 12.0 g of anhydrous aluminium chloride (AlCl3) was added into 100
ml of carbon tetrachloride (CCl4) in a three-neck flask. Then the mixture was refluxed with
magnetic stir for 40 min at 75 °C. Subsequently, a solution of 5.0 g of linear polystyrene resin
dissolved in 100 ml of CCl4 was added to undergo a Friedel-Crafts crosslinking reaction.
After 30 min, 100 ml of ethanol-water solution (95 wt. % ethanol/water = 80 ml/20 ml) was
added slowly to stop the reaction. The product was filtered off, washed with the 95 wt.%
ethanol/5 wt.% dilute hydrochloric acid mixture (150 ml/50 ml) and pure water, followed by
drying at 100 °C for 8 h. After that, the as-obtained xPS was carbonized at 900 °C for 3 h in
N2 flow with a heating rate of 2 °C/min, leading to formation of HMC. To investigate the
nanostructure evolution, xPS was also treated at 320 and 460 °C to obtain xPS-320 and
xPS-460, respectively. For fabrication of uHMC, the procedure is exactly the same as that of
HMC except that the used disposable polystyrene foam tableware, which was washed prior to
utilization, was employed as the raw material. ∗ Corresponding author. E-mail: [email protected]
Electronic Supplementary Material (ESI) for NanoscaleThis journal is © The Royal Society of Chemistry 2013

2
Structural Characterization
The thermogravimetric analysis (TGA) was performed with a heating rate of 5 °C/min in
N2 flow. Fourier transform infrared (FTIR) spectra were measured using a Bruker Equinox 55
FTIR spectroscopy. The morphologies of the samples were observed by a JSM-6330F
scanning electron microscope (SEM) and a JEM-2010HR transmission electron microscope
(TEM). The Raman spectrum was obtained with a Renishaw inVia Raman spectrometer. A
Micromeritics ASAP 2010 surface area and porosity analyzer was used to investigate the pore
structure. The BET surface area (SBET) was analyzed by Brunauer-Emmett-Teller (BET)
theory. The micropore surface area (Smic) was determined by t-plot method. The total pore
volume (Vt) was calculated from the amount adsorbed at a relative pressure P/P0 of 0.997.
The pore size distribution was analyzed by original density functional theory (DFT) with
non-negative regularization and medium smoothing.
Adsorption Characterization
Adsorption amounts of captopril and VB12 on carbon materials were obtained by
measuring their concentrations before and after adsorption. 45 mg of carbon powder was
added into a conical flask, and then 75 mL of captopril or VB12 solution (200 mg L-1) was
added quickly. After that, this suspension was shaken with a rate of 150 rpm at 30 °C. At
intervals, 0.5 mL of supernate was taken out and diluted to 5 mL. The concentration of
adsorbate was measured by UV-Vis spectra. The wavelength for captopril and VB12 is 220
and 360 nm, respectively. The adsorption capacity (C) was calculated according to the
equation C=(c0V0-c1V1)/(mSBET), where c0, V0, c1, V1 and m represent the initial
concentration, initial volume, concentration and volume after adsorption, and weight of
carbon materials, respectively. The selectivity (S) is obtained according to the equation
S=Ccap/CVB12, where Ccap and CVB12 are the molar saturation adsorption capacity at 24 h for
captopril and VB12, respectively.
Electronic Supplementary Material (ESI) for NanoscaleThis journal is © The Royal Society of Chemistry 2013
3
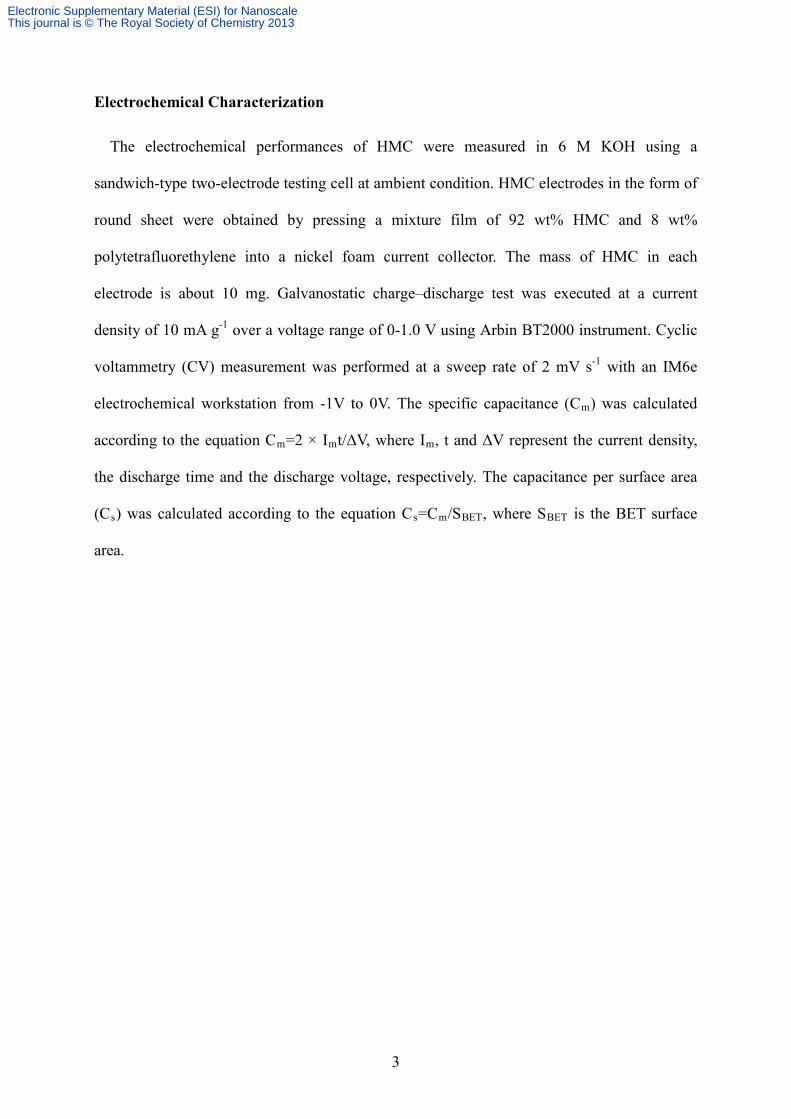
Electrochemical Characterization
The electrochemical performances of HMC were measured in 6 M KOH using a
sandwich-type two-electrode testing cell at ambient condition. HMC electrodes in the form of
round sheet were obtained by pressing a mixture film of 92 wt% HMC and 8 wt%
polytetrafluorethylene into a nickel foam current collector. The mass of HMC in each
electrode is about 10 mg. Galvanostatic charge–discharge test was executed at a current
density of 10 mA g-1 over a voltage range of 0-1.0 V using Arbin BT2000 instrument. Cyclic
voltammetry (CV) measurement was performed at a sweep rate of 2 mV s-1 with an IM6e
electrochemical workstation from -1V to 0V. The specific capacitance (Cm) was calculated
according to the equation Cm=2 × Imt/ΔV, where Im, t and ΔV represent the current density,
the discharge time and the discharge voltage, respectively. The capacitance per surface area
(Cs) was calculated according to the equation Cs=Cm/SBET, where SBET is the BET surface
area.
Electronic Supplementary Material (ESI) for NanoscaleThis journal is © The Royal Society of Chemistry 2013
4
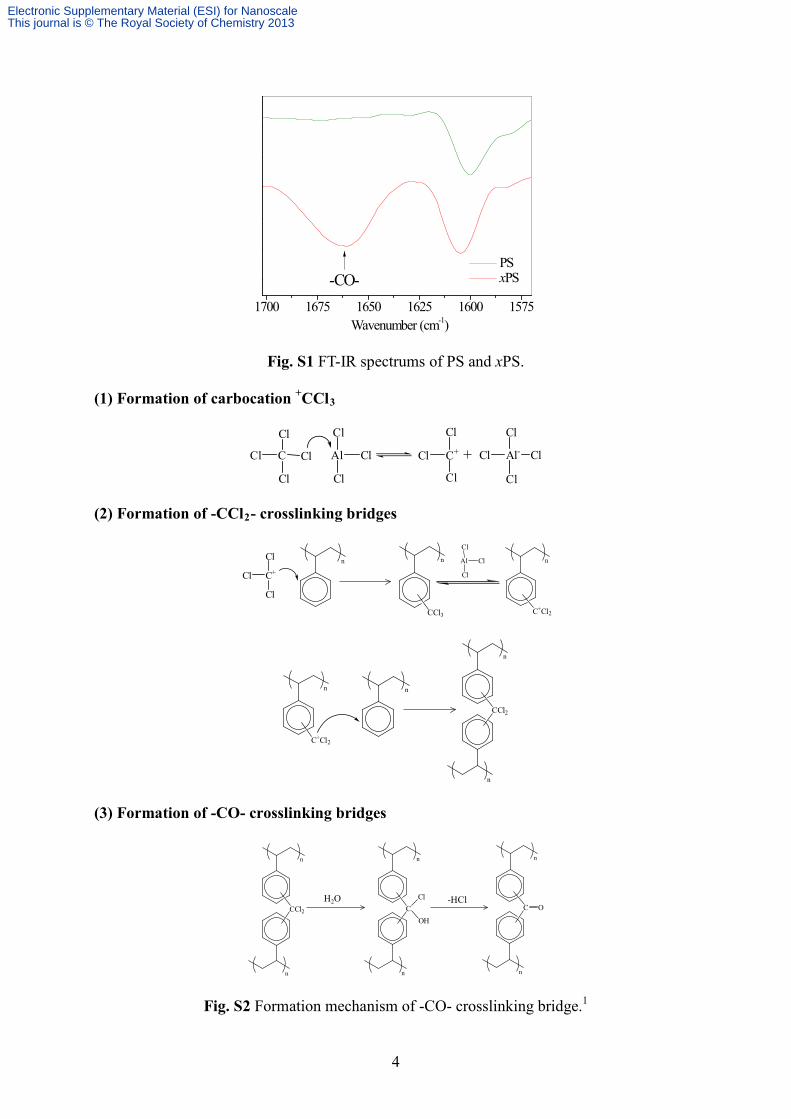
Fig. S1 FT-IR spectrums of PS and xPS.
(1) Formation of carbocation +CCl3
(2) Formation of -CCl2- crosslinking bridges
(3) Formation of -CO- crosslinking bridges
Fig. S2 Formation mechanism of -CO- crosslinking bridge.1
1700 1675 1650 1625 1600 1575
-CO-
Wavenumber (cm-1)
PS xPS
CCl Cl
Cl
Cl
Al Cl
Cl
Cl
C+Cl
Cl
Cl
Al-Cl Cl
Cl
Cl
+
C+Cl
Cl
Cl
n n
CCl3
Al Cl
Cl
Cl
n
C+Cl2
n
C+Cl2
n
n
n
CCl2
H2O -HCl
n
n
CCl
OH
n
n
C O
n
n
CCl2
Electronic Supplementary Material (ESI) for NanoscaleThis journal is © The Royal Society of Chemistry 2013
5
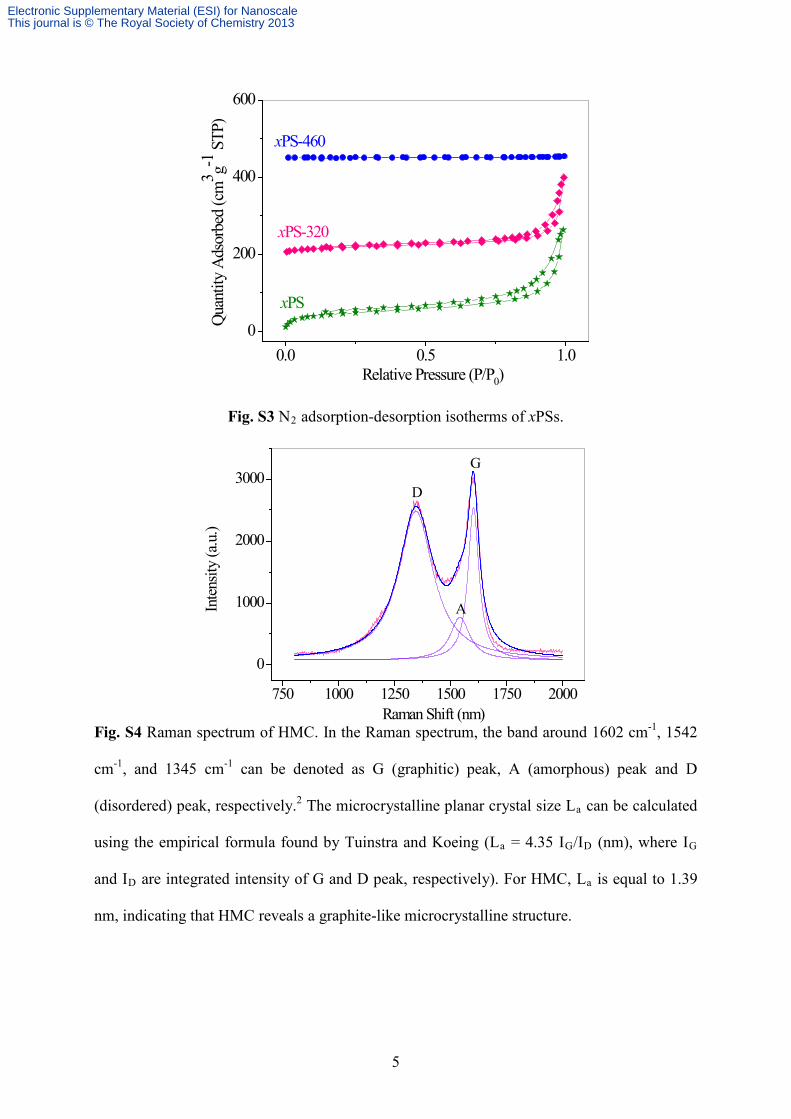
Fig. S3 N2 adsorption-desorption isotherms of xPSs.
Fig. S4 Raman spectrum of HMC. In the Raman spectrum, the band around 1602 cm-1, 1542
cm-1, and 1345 cm-1 can be denoted as G (graphitic) peak, A (amorphous) peak and D
(disordered) peak, respectively.2 The microcrystalline planar crystal size La can be calculated
using the empirical formula found by Tuinstra and Koeing (La = 4.35 IG/ID (nm), where IG
and ID are integrated intensity of G and D peak, respectively). For HMC, La is equal to 1.39
nm, indicating that HMC reveals a graphite-like microcrystalline structure.
0.0 0.5 1.00
200
400
600
xPS
xPS-320Qu
antit
y Ad
sorb
ed (c
m3 g-1
STP
)
Relative Pressure (P/P0)
xPS-460
750 1000 1250 1500 1750 2000
0
1000
2000
3000
Inten
sity
(a.u
.)
Raman Shift (nm)
D
G
A
Electronic Supplementary Material (ESI) for NanoscaleThis journal is © The Royal Society of Chemistry 2013
6
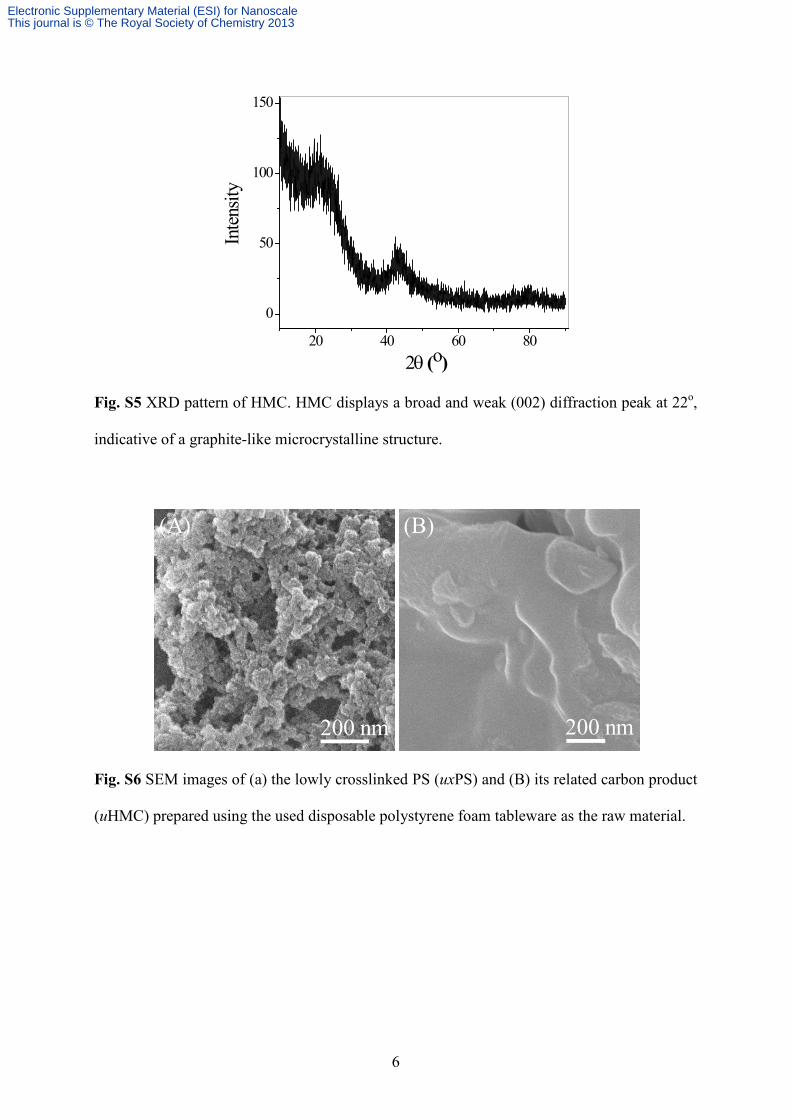
Fig. S5 XRD pattern of HMC. HMC displays a broad and weak (002) diffraction peak at 22o,
indicative of a graphite-like microcrystalline structure.
Fig. S6 SEM images of (a) the lowly crosslinked PS (uxPS) and (B) its related carbon product
(uHMC) prepared using the used disposable polystyrene foam tableware as the raw material.
20 40 60 80
0
50
100
150
Inten
sity
2θ (o)
HMC
200 nm 200 nm
(A) (B)
Electronic Supplementary Material (ESI) for NanoscaleThis journal is © The Royal Society of Chemistry 2013
7
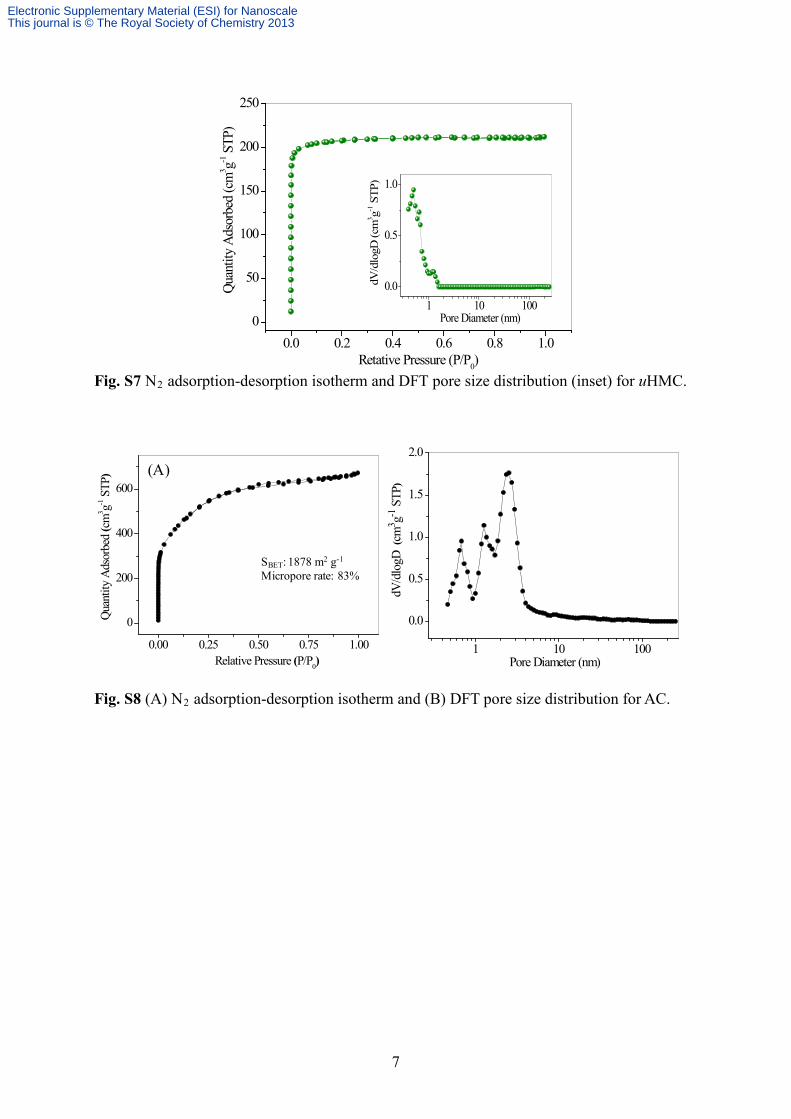
Fig. S7 N2 adsorption-desorption isotherm and DFT pore size distribution (inset) for uHMC.
Fig. S8 (A) N2 adsorption-desorption isotherm and (B) DFT pore size distribution for AC.
0.0 0.2 0.4 0.6 0.8 1.00
50
100
150
200
250
1 10 1000.0
0.5
1.0
dV/d
logD
(cm
3 g-1 S
TP)
Pore Diameter (nm)
Quan
tity
Adso
rbed
(cm
3 g-1 S
TP)
Retative Pressure (P/P0)
0.00 0.25 0.50 0.75 1.00
0
200
400
600
Quan
tity
Adso
rbed
(cm
3 g-1 S
TP)
Relative Pressure (P/P0)
SBET: 1878 m2 g-1
Micropore rate: 83%
(A)
1 10 100
0.0
0.5
1.0
1.5
2.0
Pore Diameter (nm)
dV/d
logD
(cm
3 g-1 S
TP)
Electronic Supplementary Material (ESI) for NanoscaleThis journal is © The Royal Society of Chemistry 2013
8
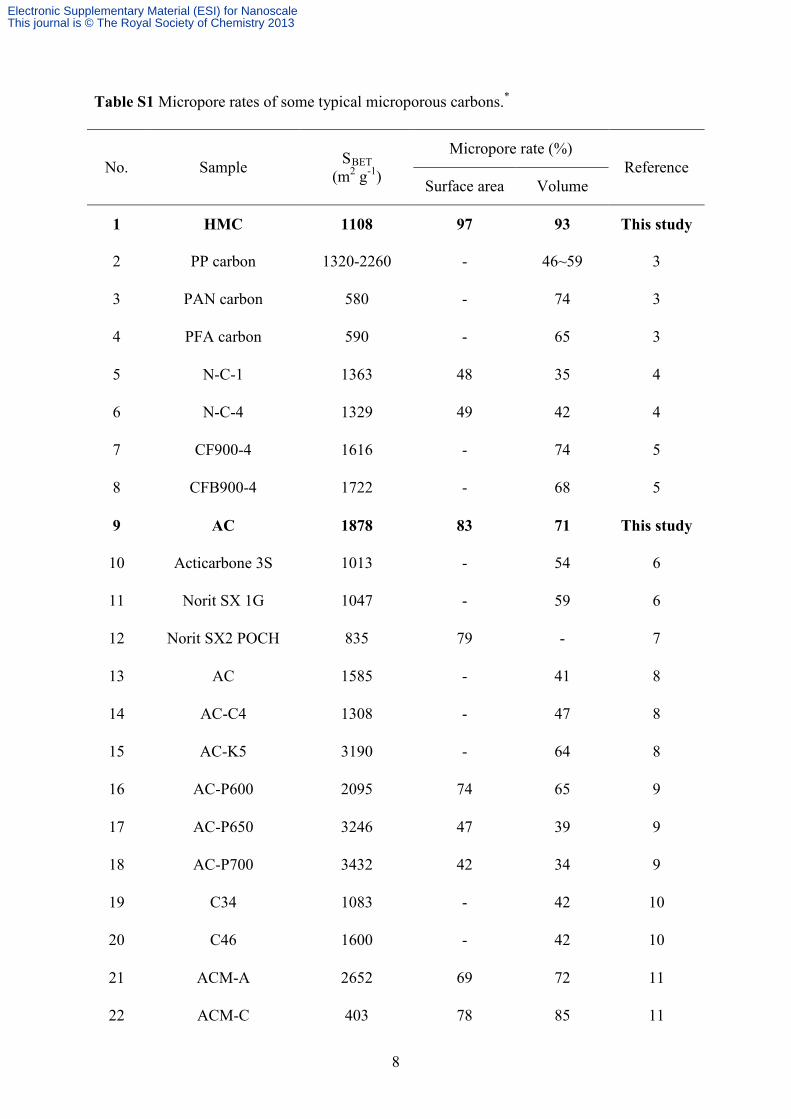
Table S1 Micropore rates of some typical microporous carbons.*
No. Sample SBET (m2 g-1)
Micropore rate (%) Reference
Surface area Volume
1 HMC 1108 97 93 This study
2 PP carbon 1320-2260 - 46~59 3
3 PAN carbon 580 - 74 3
4 PFA carbon 590 - 65 3
5 N-C-1 1363 48 35 4
6 N-C-4 1329 49 42 4
7 CF900-4 1616 - 74 5
8 CFB900-4 1722 - 68 5
9 AC 1878 83 71 This study
10 Acticarbone 3S 1013 - 54 6
11 Norit SX 1G 1047 - 59 6
12 Norit SX2 POCH 835 79 - 7
13 AC 1585 - 41 8
14 AC-C4 1308 - 47 8
15 AC-K5 3190 - 64 8
16 AC-P600 2095 74 65 9
17 AC-P650 3246 47 39 9
18 AC-P700 3432 42 34 9
19 C34 1083 - 42 10
20 C46 1600 - 42 10
21 ACM-A 2652 69 72 11
22 ACM-C 403 78 85 11
Electronic Supplementary Material (ESI) for NanoscaleThis journal is © The Royal Society of Chemistry 2013
9
23 DUT-38-A-850-6 2635 - 76 12
24 DUT-38-A-950-4 3104 - 60 12
25 K9-3/15 1576 - 83 13
26 K7-3/15 2438 - 70 13
27 K7-5/30 2875 - 54 13
28 popcarbon-600 589 86 - 14
29 popcarbon-750 773 84 - 14
30 popcarbon-900 1417 70 - 14
31 CS 430 - 87 15
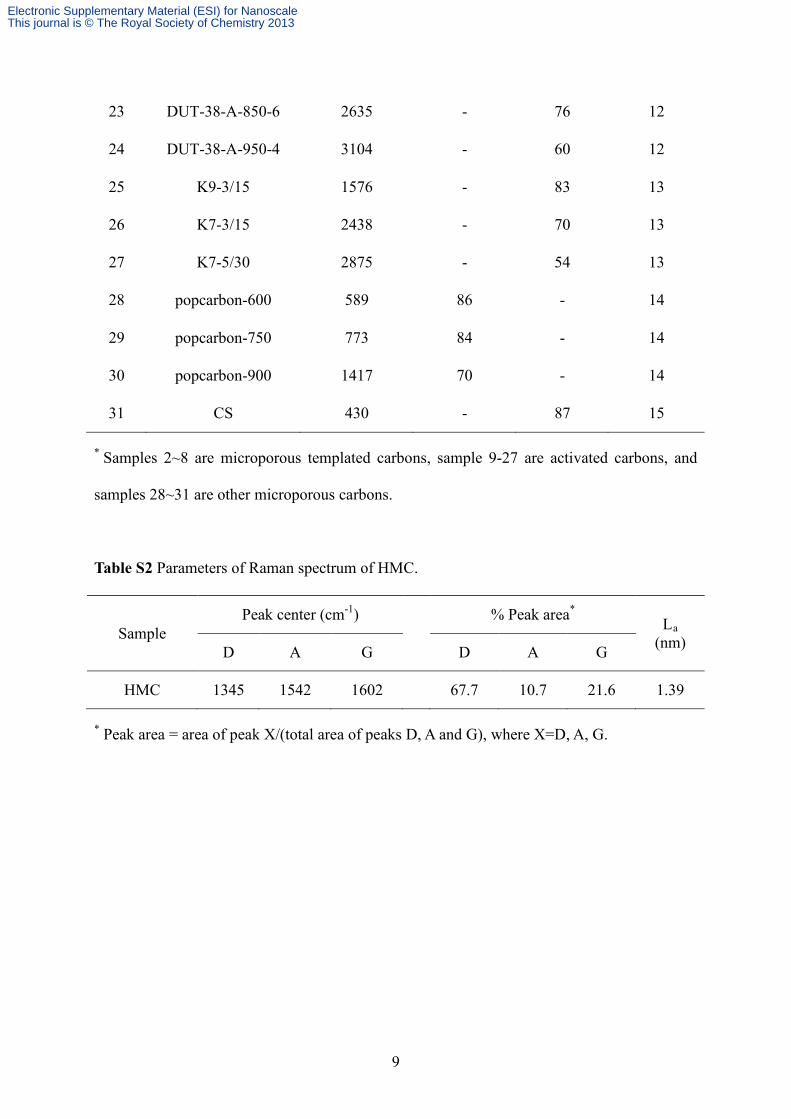
* Samples 2~8 are microporous templated carbons, sample 9-27 are activated carbons, and
samples 28~31 are other microporous carbons.
Table S2 Parameters of Raman spectrum of HMC.
Sample Peak center (cm-1) % Peak area* La
(nm) D A G D A G
HMC 1345 1542 1602 67.7 10.7 21.6 1.39
* Peak area = area of peak X/(total area of peaks D, A and G), where X=D, A, G.
Electronic Supplementary Material (ESI) for NanoscaleThis journal is © The Royal Society of Chemistry 2013
10
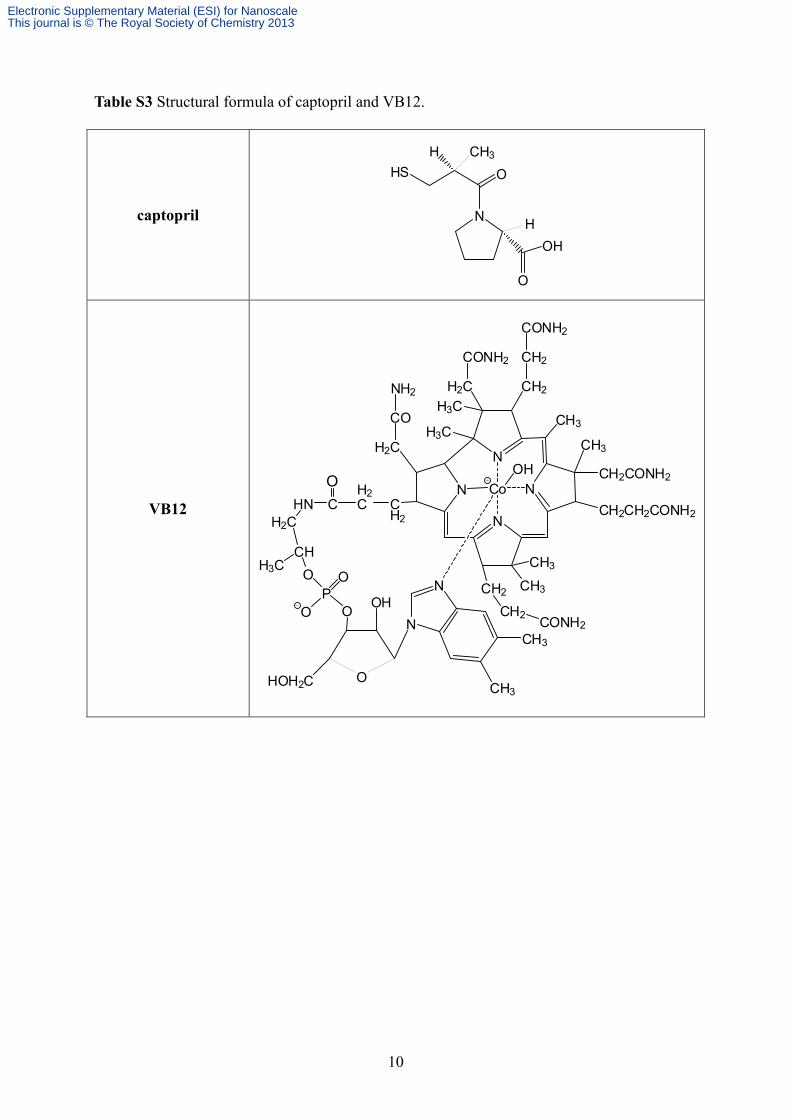
Table S3 Structural formula of captopril and VB12.
captopril
VB12
N H
HS OH CH3
OH
O
N
NN
NCH3
CH2CONH2
CH2CH2CONH2
CH3
CH2
CH2
CONH2
H2C
CONH2
H3C
H3CH2C
CO
NH2
CH2
H2CCHN
H2C
CHO
PO
O
OH
HOH2C
N
N
CH3
CH3
CH3
CH3CH2
CH2 CONH2
Co
H3C
O
O
OHO
Electronic Supplementary Material (ESI) for NanoscaleThis journal is © The Royal Society of Chemistry 2013

11
Table S4 The capacitance per surface area (Cs) of some typical microporous carbons.
No. Sample Measurement condition Electrolyte Cs (μF cm-2) Reference
1 HMC 10 mA g-1 6M KOH 15.0 This study
2 XC-72 5 mV s-1 2M H2SO4 8.8 16
3 Maxsorb 5~50 mV s-1 30% KOH 10.1~2.2 17
4 M30 1 mHz 30% KOH 2.4 18
5 SACF-20 1 mHz 30% KOH 2.7 18
6 A10 1 mHz 30% KOH 3.1 18
7 M10 1 mHz 30% KOH 4.1 18
8 TiC CDC 5 mV s-1 1M H2SO4 4.8~12.2 19
9 ZrC CDC 5 mV s-1 1M H2SO4 6.3~11.8 19
10 P-KOH-AC 10 mV s-1 1M NaNO3 9.3 20
11 CF 0.5~5 mA 1M H2SO4 9.4~8.8 21
12 CF01 0.5~5 mA 1M H2SO4 10~9.5 21
13 W-KOH-AC 10 mV s-1 1M NaNO3 10.9 20
14 LA/1 - 6M KOH 11.6 22
15 SA/S/1 - 6M KOH 11.9 22
16 CF03 0.5~5 mA 1M H2SO4 12.9~12.4 21
17 KJA - 6M KOH 13.7 22
18 DCG-5 5 mV s-1 2M H2SO4 16.5 16
19 CMS 5 mV s-1 2M H2SO4 17.3 16
References
1. D. C. Wu, A. Nese, J. Pietrasik, Y. R. Liang, H. K. He, M. Kruk, L. Huang, T.
Kowalewski and K. Matyjaszewski, Acs Nano, 2012, 6, 6208-6214.
Electronic Supplementary Material (ESI) for NanoscaleThis journal is © The Royal Society of Chemistry 2013

12
2. D. C. Wu, H. C. Dong, J. Pietrasik, E. K. Kim, C. M. Hui, M. J. Zhong, M. Jaroniec, T.
Kowalewski and K. Matyjaszewski, Chem. Mater., 2011, 23, 2024-2026.
3. T. Kyotani, T. Nagai, S. Inoue and A. Tomita, Chem. Mater., 1997, 9, 609-615.
4. G. P. Meisner and Q. Hu, Nanotechnology, 2009, 20, 204023.
5. F. Su, J. Zeng, Y. Yu, L. Lv, J. Y. Lee and X. S. Zhao, Carbon, 2005, 43, 2366-2373.
6. J. I. Paredes, A. Martinez-Alonso, P. X. Hou, T. Kyotani and J. M. D. Tascon, Carbon,
2006, 44, 2469-2478.
7. G. Lota, T. A. Centeno, E. Frackowiak and F. Stoeckli, Electrochim. Acta, 2008, 53,
2210-2216.
8. H. L. Wang, Q. M. Gao and J. Hu, J. Am. Chem. Soc., 2009, 131, 7016-7022.
9. L. Wei, M. Sevilla, A. B. Fuertes, R. Mokaya and G. Yushin, Adv. Funct. Mater., 2012,
22, 827-834.
10. C. H. Lei, N. Amini, F. Markoulidis, P. Wilson, S. Tennison and C. Lekakou, J. Mater.
Chem. A, 2013, 1, 6037-6042.
11. V. Ruiz, C. Blanco, R. Santamaria, J. M. Ramos-Fernandez, M. Martinez-Escandell, A.
Sepulveda-Escribano and F. Rodriguez-Reinoso, Carbon, 2009, 47, 195-200.
12. M. Oschatz, L. Borchardt, I. Senkovska, N. Klein, M. Leistner and S. Kaskel, Carbon,
2013, 56, 139-145.
13. K. Babel, D. Janasiak and K. Jurewicz, Carbon, 2012, 50, 5017-5026.
14. L. F. Wang, J. Zhang, D. S. Su, Y. Y. Ji, X. J. Cao and F. S. Xiao, Chem. Mater., 2007,
19, 2894-2897.
15. J. Choma, D. Jamiola, K. Augustynek, M. Marszewski, M. Gao and M. Jaroniec, J.
Mater. Chem., 2012, 22, 12636-12642.
16. T. A. Centeno, M. Hahn, J. A. Fernández, R. Kötz, F. Stoeckli, Electrochem. Commun.,
2007, 9, 1242-1246.
Electronic Supplementary Material (ESI) for NanoscaleThis journal is © The Royal Society of Chemistry 2013
13
17. W. Xing, S. Z. Qiao, R. G. Ding, F. Li, G. Q. Lu, Z. F. Yan, H. M. Cheng, Carbon, 2006,
44, 216-224.
18. D. Y. Qu, H. Shi, J. Power Sources, 1998, 74, 99-107.
19. J. Chmiola, G. Yushin, R. Dash, Y. Gogotsi, J. Power Sources, 2006, 158, 765–772.
20. F. C. Wu, R. L. Tseng, C. C. Hu, C. C. Wang, J. Power Sources, 2005, 144, 302–309.
21. C. T. Hsieh, H. Teng, Carbon, 2002, 40, 667-674.
22. G. Gryglewicz, J. Machnikowski, E. Lorenc-Grabowsk, G. Lota, E. Frackowiak,
Electrochim. Acta, 2005, 50, 1197-1206.
Electronic Supplementary Material (ESI) for NanoscaleThis journal is © The Royal Society of Chemistry 2013