Electronic Supplementary Information A Promising Bulky ... · Electronic Supplementary Information...
23
1 Electronic Supplementary Information A Promising Bulky Anion Based Lithium Borate Salt for Lithium Metal Batteries Lixin Qiao, ab Zili Cui,* b Bingbing Chen, b Gaojie Xu, b Zhonghua Zhang, b Jun Ma, b Huiping Du, b Xiaochen Liu, b Suqi Huang, c Kun Tang, ab Shanmu Dong, b Xinhong Zhou,* a Guanglei Cui* b a College of Chemistry and Molecular Engineering, Qingdao University of Science & Technology, Qingdao, 266042, P. R. China. *E-mail: [email protected]. b Qingdao Industrial Energy Storage Research Institute, Qingdao Institute of Bioenergy and Bioprocess Technology, Chinese Academy of Sciences, Qingdao, 266101, P. R. China. *E-mail: [email protected]; Tel.: 86-532-80662746; fax: 86-532-80662746. c School of Chemistry and Chemical Engineering, Qingdao University, Qingdao, 266071, P. R. China. Electronic Supplementary Material (ESI) for Chemical Science. This journal is © The Royal Society of Chemistry 2018
-
Upload
truongminh -
Category
Documents
-
view
219 -
download
0
Transcript of Electronic Supplementary Information A Promising Bulky ... · Electronic Supplementary Information...
1
Electronic Supplementary Information
A Promising Bulky Anion Based Lithium Borate Salt for
Lithium Metal Batteries
Lixin Qiao,ab Zili Cui,*b Bingbing Chen,b Gaojie Xu,b Zhonghua Zhang,b Jun Ma,b
Huiping Du,b Xiaochen Liu,b Suqi Huang,c Kun Tang,ab Shanmu Dong,b Xinhong
Zhou,*a Guanglei Cui*b aCollege of Chemistry and Molecular Engineering, Qingdao University of Science & Technology,
Qingdao, 266042, P. R. China.
*E-mail: [email protected].
bQingdao Industrial Energy Storage Research Institute, Qingdao Institute of Bioenergy and
Bioprocess Technology, Chinese Academy of Sciences, Qingdao, 266101, P. R. China.
*E-mail: [email protected]; Tel.: 86-532-80662746; fax: 86-532-80662746.
cSchool of Chemistry and Chemical Engineering, Qingdao University, Qingdao, 266071, P. R.
China.
Electronic Supplementary Material (ESI) for Chemical Science.This journal is © The Royal Society of Chemistry 2018
2
1. Experimental method
1.1 Material
Perfluoro-tert-butylalcohol (Fluorochem), propylene carbonate (PC) (98%,
Macklin), dimethyl carbonate (DMC) (98%, Macklin) and acetonitrile
(99.5%, Sigma Aldrich) were used as received without any treating
process. n-Butyllithium (1.6 M in hexane) and boron trifluoride diethyl
etherate (98%) were bought from Sigma Aldrich and Macklin,
respectively. Lithium bis(trifluoromethanesulfonimide) (LiTFSI) and
LiBF4 (99.99%) were purchased from Aladdin and retreated at 120 °C in
vacuum oven for 12 hours. The tetrahydrofuran (THF) (AR, Sinopharm
Chemical Reagent Limited Company) and 1,2-dimethoxyethane (DME)
(99.5%, Sigma Aldrich) solvents were refluxed with sodium using
benzophenone as indicator and distilled with 4 Å molecular sieve under
Ar atmosphere. 1.0 M LiBF4/PC and 1.0 M LiTFSI/PC were obtained by
dissolving the stoichiometric LiBF4 and LiTFSI in PC solvent,
respectively. The 1.0 M LiTFPFB/PC electrolyte was prepared by the
same method using the synthesized lithium salt in this work. All the
electrolytes were prepared in the glove box with the content of O2 and
H2O below 0.1 ppm.
1.2 Synthesis and characterization of LiTFPFB salt
The procedure for the synthesis of LiTFPFB salt is depicted in
Scheme S1.
3
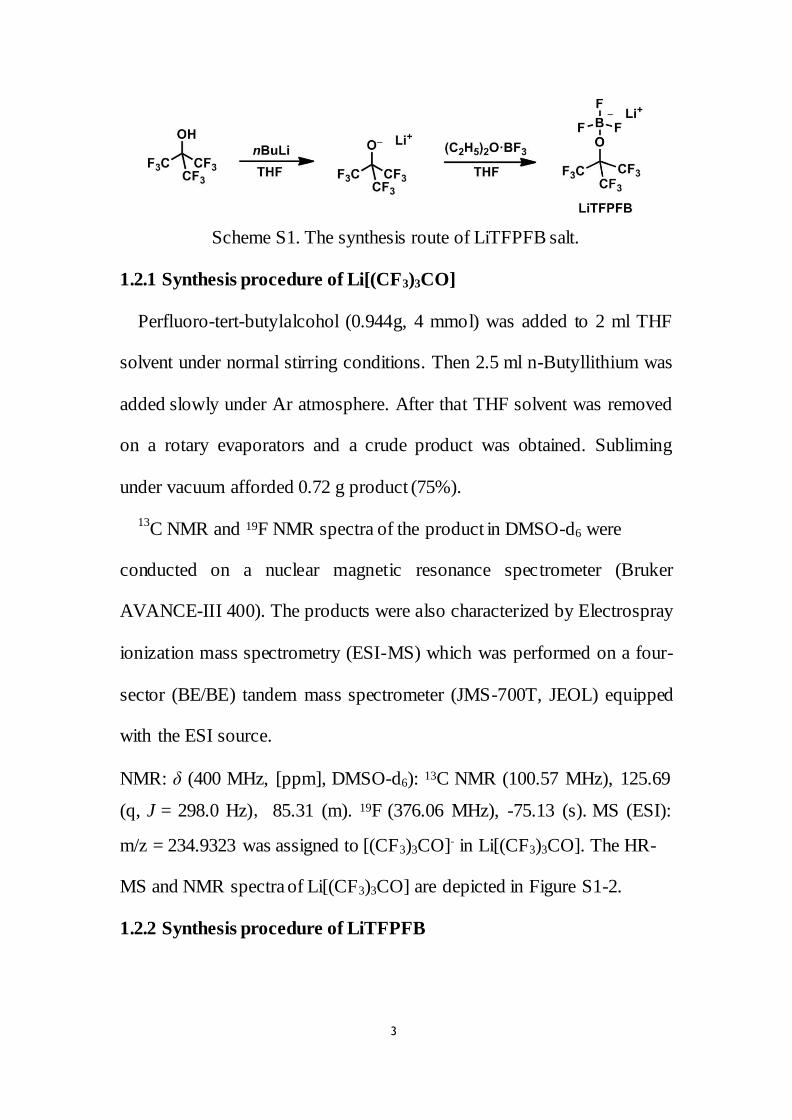
Scheme S1. The synthesis route of LiTFPFB salt.
1.2.1 Synthesis procedure of Li[(CF3)3CO]
Perfluoro-tert-butylalcohol (0.944g, 4 mmol) was added to 2 ml THF
solvent under normal stirring conditions. Then 2.5 ml n-Butyllithium was
added slowly under Ar atmosphere. After that THF solvent was removed
on a rotary evaporators and a crude product was obtained. Subliming
under vacuum afforded 0.72 g product (75%).
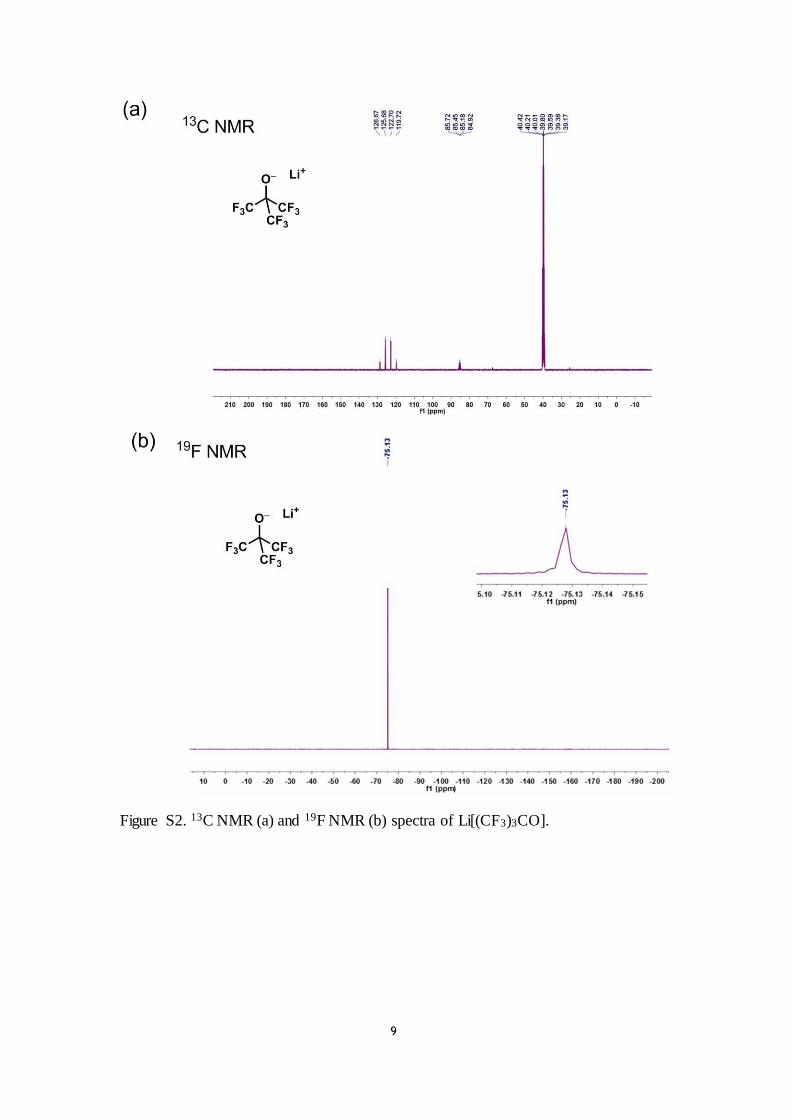
13C NMR and 19F NMR spectra of the product in DMSO-d6 were
conducted on a nuclear magnetic resonance spectrometer (Bruker
AVANCE-III 400). The products were also characterized by Electrospray
ionization mass spectrometry (ESI-MS) which was performed on a four-
sector (BE/BE) tandem mass spectrometer (JMS-700T, JEOL) equipped
with the ESI source.
NMR: δ (400 MHz, [ppm], DMSO-d6): 13C NMR (100.57 MHz), 125.69
(q, J = 298.0 Hz),85.31 (m). 19F (376.06 MHz), -75.13 (s). MS (ESI):
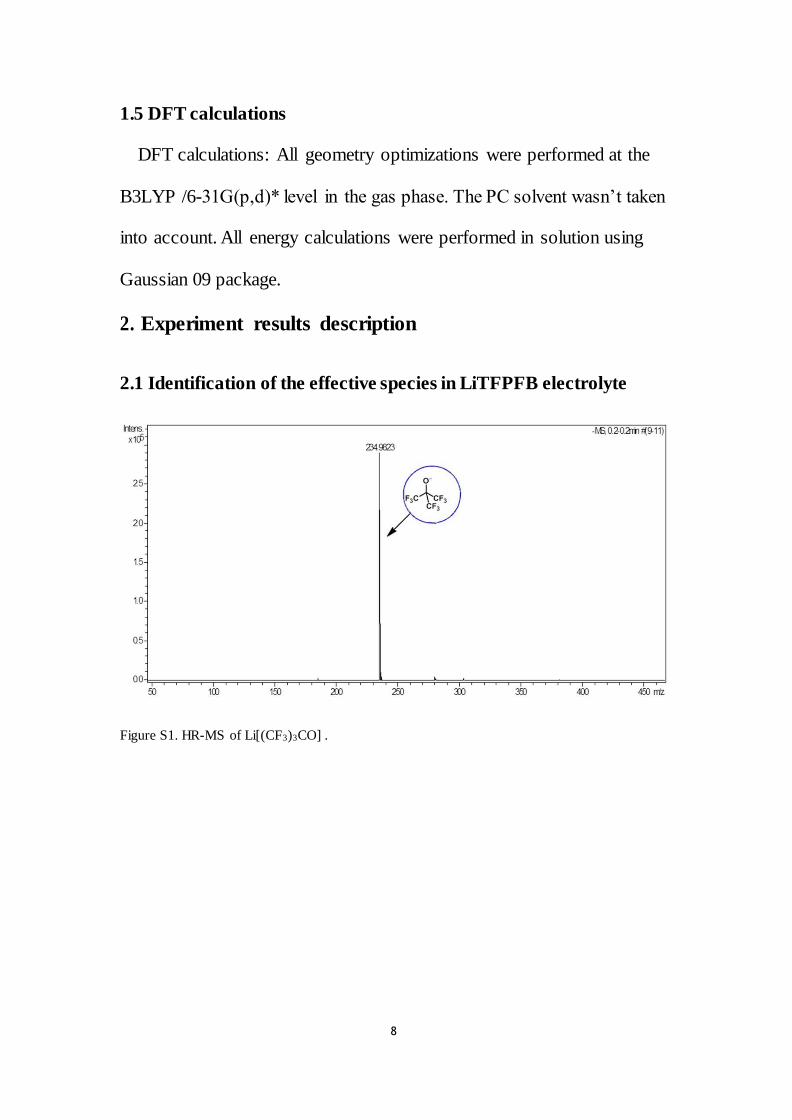
m/z = 234.9323 was assigned to [(CF3)3CO]– in Li[(CF3)3CO]. The HR-
MS and NMR spectra of Li[(CF3)3CO] are depicted in Figure S1-2.
1.2.2 Synthesis procedure of LiTFPFB
4
In a glove box, Li[(CF3)3CO] (0.484 g, 2 mmol) was added to 2 ml
THF solvent in a round-bottom flask and a transparent solution was
obtained. Then the solution was added to 0.282 g boron trifluoride diethyl
etherate dissolved in 2 ml THF dropwise under stirring conditions, and a
colorless & transparent solution was gained. Thereafter, the solvent was
volatilized under Argon atmosphere, and a white solid was obtained.
Finally, the solid was washed with acetonitrile (3 ml × 3) three times.
Drying under vacuum afforded 0.41 g product (66%). NMR: δ (400 MHz,
[ppm], DMSO-d6): 19F (376.06 MHz), δ = -71.92 (q, J = 4.0 Hz, 9 F),
-144.71 (m, 3F). 11B (128.32), δ = -0.91 (q, J = 16.0 Hz). 7Li NMR (s,
0.03). MS (ESI): m/z = 302.9860 was assigned to [(CF3)3COBF3]– in
LiTFPFB. The NMR and HR-MS spectra of LiTFPFB are depicted in
Figure 1.
1.3 Electrochemical characterization
Ionic conductivities of the electrolytes with a PP2500 separator
between two stainless steel plates were conducted by an AC impedance
analysis using a BioLogic VMP-300 with an AC voltage amplitude of 10
mV over the frequency range from 1 Hz to 1 MHz. The ionic
conductivity of these electrolytes were calculated by the following
equation
σ = (1)
where L presents the thickness of separator, S is the contact area between
5
0
electrode and electrolyte, and R is the bulk resistance of the electrolyte.
The interfacial compatibility of lithium metal with different electrolytes
was assessed by the same instrument for the ionic conductivity
measurement over a frequency range of 1 MHz-10 mHz using
Li/electrolyte/Li cells.
In this paper, the Al passivation measurement was evaluated by
chronoamperometry and cyclic voltammetry (scan rate was 1 mV s -1 from
2.5 V to 5.0 V) performed on a working electrode of fresh Al foil and a
counter and reference electrode of lithium metal in a coin cell (CR2032-
type). The Al foil was polished with a sandpaper and washed with DME
three times in the glove box, followed by drying in the transition cabin for
1 hour. The oxidative stability of the LiTFPFB electrolytes was evaluated
by linear sweep voltammetry using the platinum as the working electrode
and metal lithium as the counter and reference electrodes at a scanning
rate of 5 mV s-1.
The Li ion transference number was determined by the potentiostatic
polarization test on the Li/electrolyte/Li cell with a potential of 10 mV.
The initial and steady impedance before and after polarization scan were
determined by electrochemical impedance spectroscopy measurements.
�� (∆� − �����)
� �+ = � (∆� − � ���) 0 � �
In which, � �+ is the cationic transference number, ∆� is the potential
applied to the cell, ��� and ��� are the initial and steady-state 0 �
6
resistances, �0 and �� are the initial and steady-state currents.
For cell test, the LiFePO4 cathode was prepared via a traditional casting
method, by mixing 80 wt% LiFePO4, 10 wt% acetylene black, and 10 wt%
LA133 as binder. Finally, the mass loading of the active material on the
LiFePO4 cathode was about 1.5 mg cm-2. LiCoO2 cathode mixing the 80 wt%
LiCoO2, 10 wt% acetylene black and 10 wt% PVDF (polyvinylidene
fluoride) binder was also prepared by casting on Al foil. The active mass
loading of the LiCoO2 electrode was about 1.4 mg cm-2. The theoretical
capacity of the obtained LiFePO4 and LiCoO2 cathodes are approximately
160 and 140 mAh g-1, respectively. All the cells were assembled in an
argon-filled glove box (the content of H2O and O2 was less than 0.1 ppm).
The galvanostatic charge/discharge test of LiFePO4/Li coin cells between
2.5-4.0 V at varied current densities was conducted on LAND test system
(Wuhan LAND electronics Co., Ltd.). The LiCoO2/Li cells were charged
and discharged between 2.75-4.35 V.
Cu/Li cells of the both electrolytes were charged/discharged for 1 h
during each process at a constant current density of 0.5 mA cm-2 to
evaluate the lithium deposition/dissolution efficiency. To investigate the
cycle performance at room temperature, the LiFePO4/Li or LiCoO2/Li
cells were cycled at 0.2 C for the first three cycles and at 1 C for the
remaining cycles. The low temperature performances of LiFePO4/Li cells
were investigated at 0.2 C at -5 °C . The cycle performance of LiFePO4/Li
7
cells at 60 °C were measured at 1 C for the first three cycles and 5 C for
the following cycles. The rate performance tests were conducted under
various current densities of 0.2 C, 0.5 C, 1 C, 2 C, 3 C, 4 C, 5 C and 1 C
at room temperature, and 0.2 C, 0.5 C, 1 C, 2 C, 4 C, 6 C, 8 C, 10 C and 4
C at 60 °C .
The impedance variation of LiFePO4/Li cells using LiBF4 and
LiTFPFB electrolytes with cycling were investigated at room temperature.
After 1st, 50th, 100th, 200th cycles, the impedance was tested on the
BioLogic VMP-300 impedance instrument and the data was summarized
in Table S1.
1.4 Characterization of the electrodes
The cycled cells were disassembled in argon glove-box with O2 and
H2O content lower than 0.1 ppm. The obtained anodes were rinsed with
dimethyl carbonate (DMC) to remove the residual lithium salts and
solvents, and then dried in vacuum for 5 hours at room temperature.
Surface morphology of the cycled electrodes was characterized by
HITACHI (SU8010) field emission scanning electron microscope (FE-
SEM). X-ray photoelectron spectroscopy (XPS) with Al Kα radiation was
performed using a PHI 3056 XPS under ultrahigh vacuum conditions to
analyze the surface chemical composition of the cycled electrodes. The C
1s binding energy at 284.6 eV was used as a reference to calibrate the
energy scale.
8
1.5 DFT calculations
DFT calculations: All geometry optimizations were performed at the
B3LYP /6-31G(p,d)* level in the gas phase. The PC solvent wasn’t taken
into account. All energy calculations were performed in solution using
Gaussian 09 package.
2. Experiment results description
2.1 Identification of the effective species in LiTFPFB electrolyte
Figure S1. HR-MS of Li[(CF3)3CO] .
9
Figure S2. 13C NMR (a) and 19F NMR (b) spectra of Li[(CF3)3CO].
10
2.2 Ion transference number of LiTFPFB salt in PC solvent
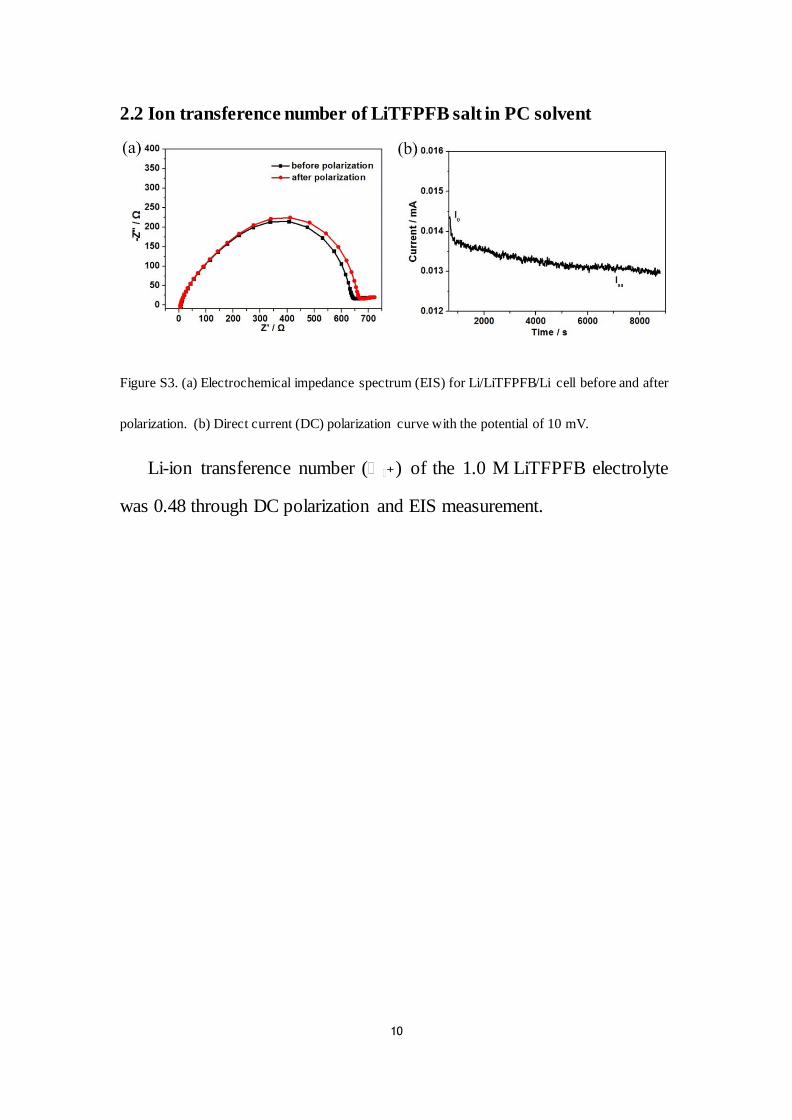
Figure S3. (a) Electrochemical impedance spectrum (EIS) for Li/LiTFPFB/Li cell before and after
polarization. (b) Direct current (DC) polarization curve with the potential of 10 mV.
Li-ion transference number (� �+) of the 1.0 M LiTFPFB electrolyte
was 0.48 through DC polarization and EIS measurement.
11
2.3 The stability of the LiBF4 electrolyte to the Al current
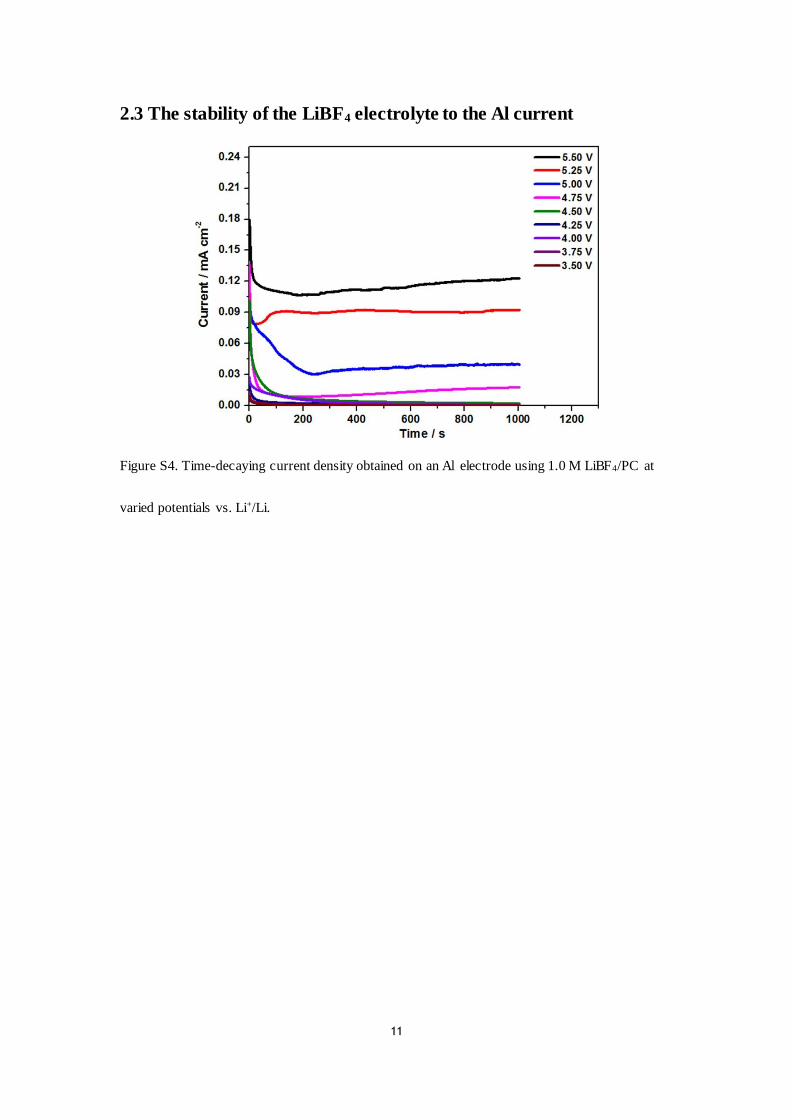
Figure S4. Time-decaying current density obtained on an Al electrode using 1.0 M LiBF4/PC at
varied potentials vs. Li+/Li.
12
2.4 The interface stability of Li anode to electrolytes
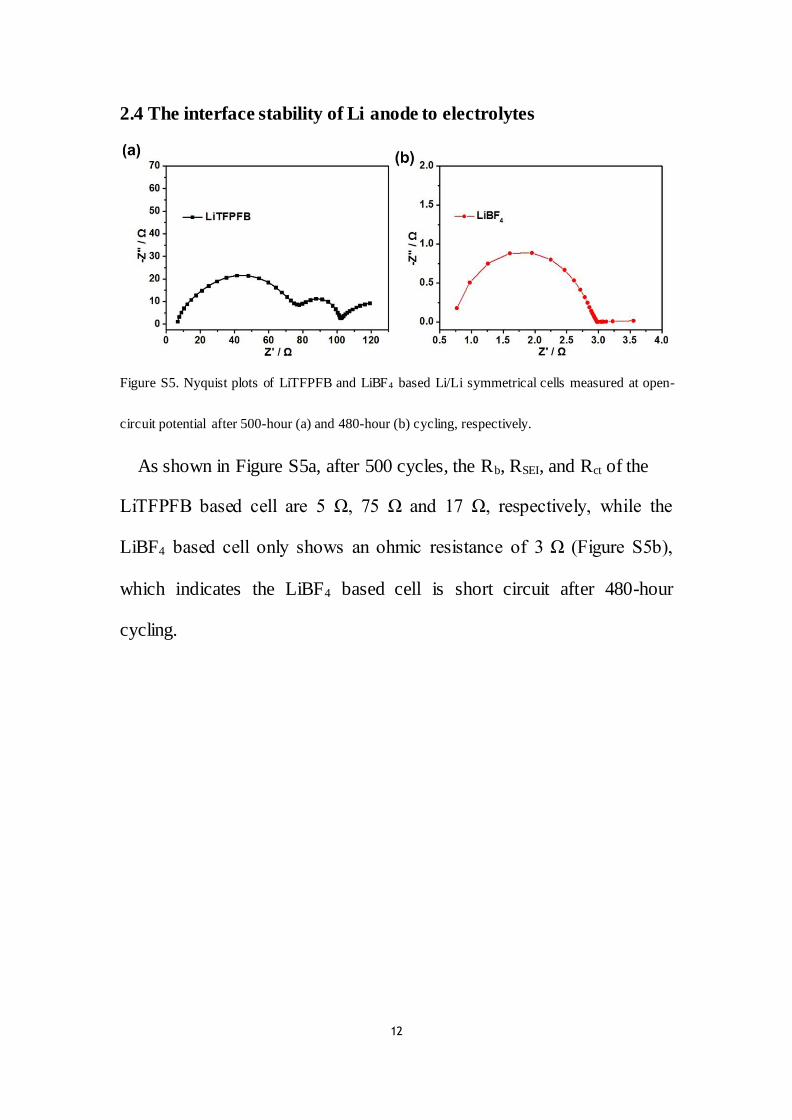
Figure S5. Nyquist plots of LiTFPFB and LiBF4 based Li/Li symmetrical cells measured at open-
circuit potential after 500-hour (a) and 480-hour (b) cycling, respectively.
As shown in Figure S5a, after 500 cycles, the Rb, RSEI, and Rct of the
LiTFPFB based cell are 5 Ω, 75 Ω and 17 Ω, respectively, while the
LiBF4 based cell only shows an ohmic resistance of 3 Ω (Figure S5b),
which indicates the LiBF4 based cell is short circuit after 480-hour
cycling.
13
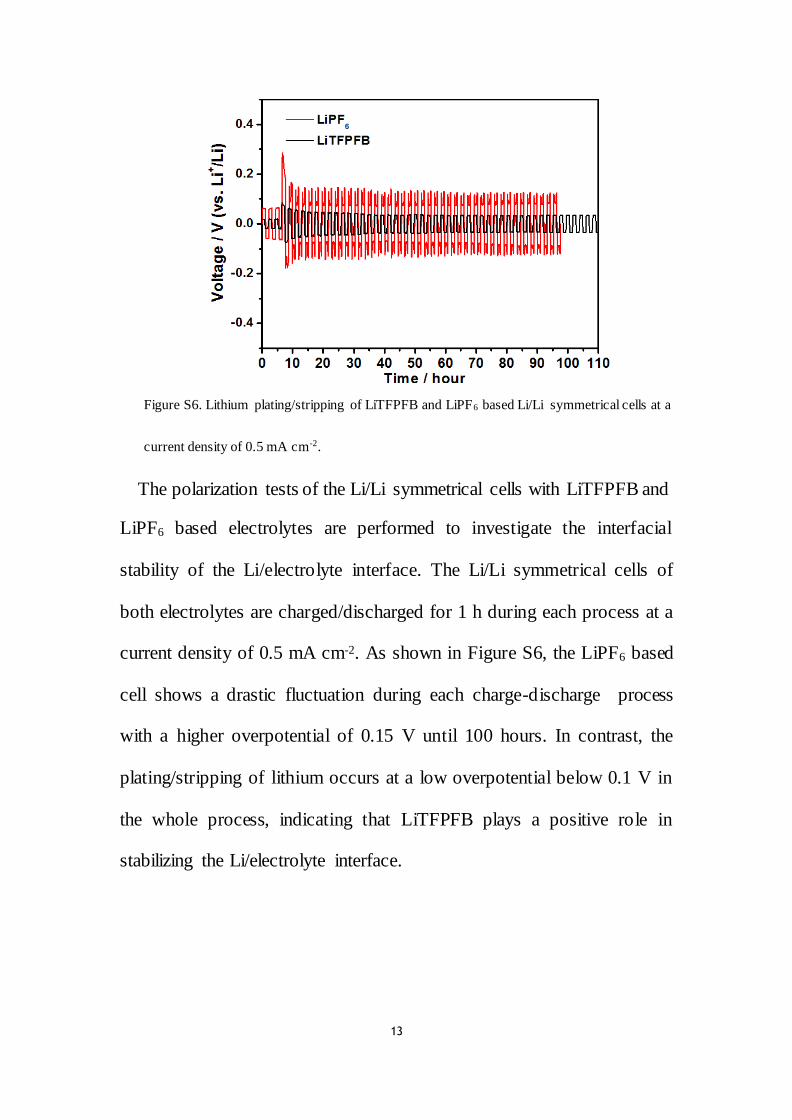
Figure S6. Lithium plating/stripping of LiTFPFB and LiPF6 based Li/Li symmetrical cells at a
current density of 0.5 mA cm-2.
The polarization tests of the Li/Li symmetrical cells with LiTFPFB and
LiPF6 based electrolytes are performed to investigate the interfacial
stability of the Li/electrolyte interface. The Li/Li symmetrical cells of
both electrolytes are charged/discharged for 1 h during each process at a
current density of 0.5 mA cm-2. As shown in Figure S6, the LiPF6 based
cell shows a drastic fluctuation during each charge-discharge process
with a higher overpotential of 0.15 V until 100 hours. In contrast, the
plating/stripping of lithium occurs at a low overpotential below 0.1 V in
the whole process, indicating that LiTFPFB plays a positive role in
stabilizing the Li/electrolyte interface.
14
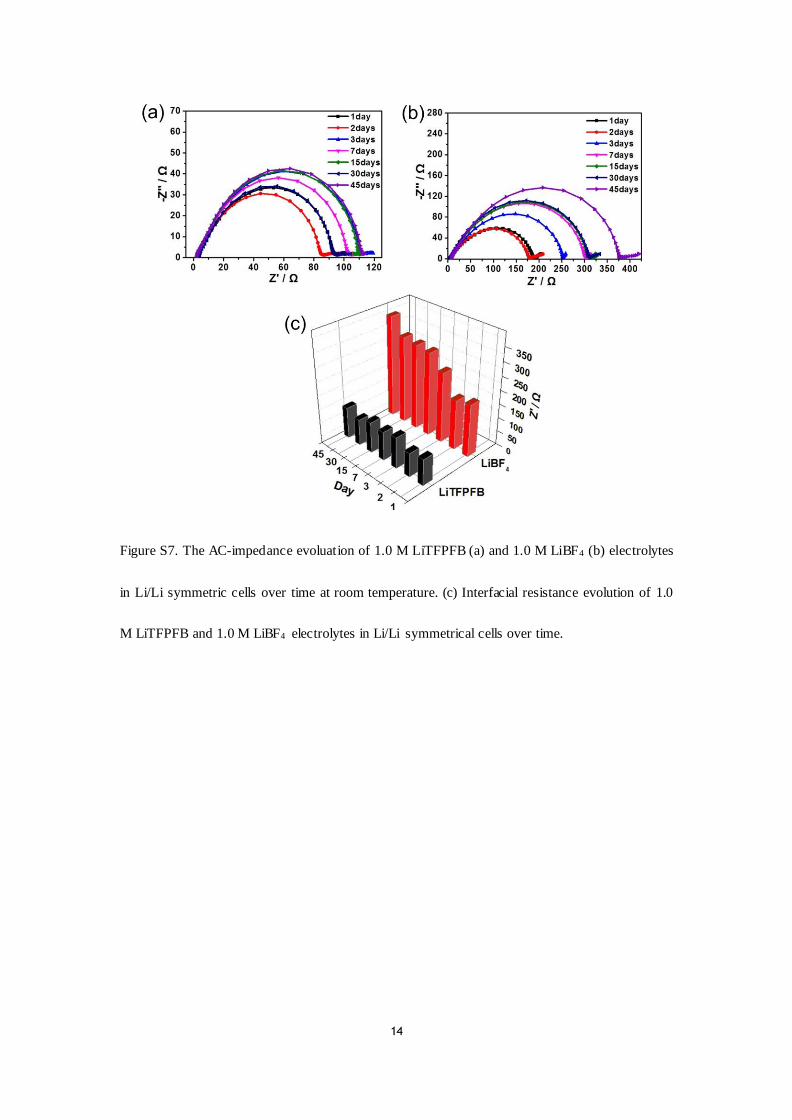
Figure S7. The AC-impedance evoluation of 1.0 M LiTFPFB (a) and 1.0 M LiBF4 (b) electrolytes
in Li/Li symmetric cells over time at room temperature. (c) Interfacial resistance evolution of 1.0
M LiTFPFB and 1.0 M LiBF4 electrolytes in Li/Li symmetrical cells over time.
15
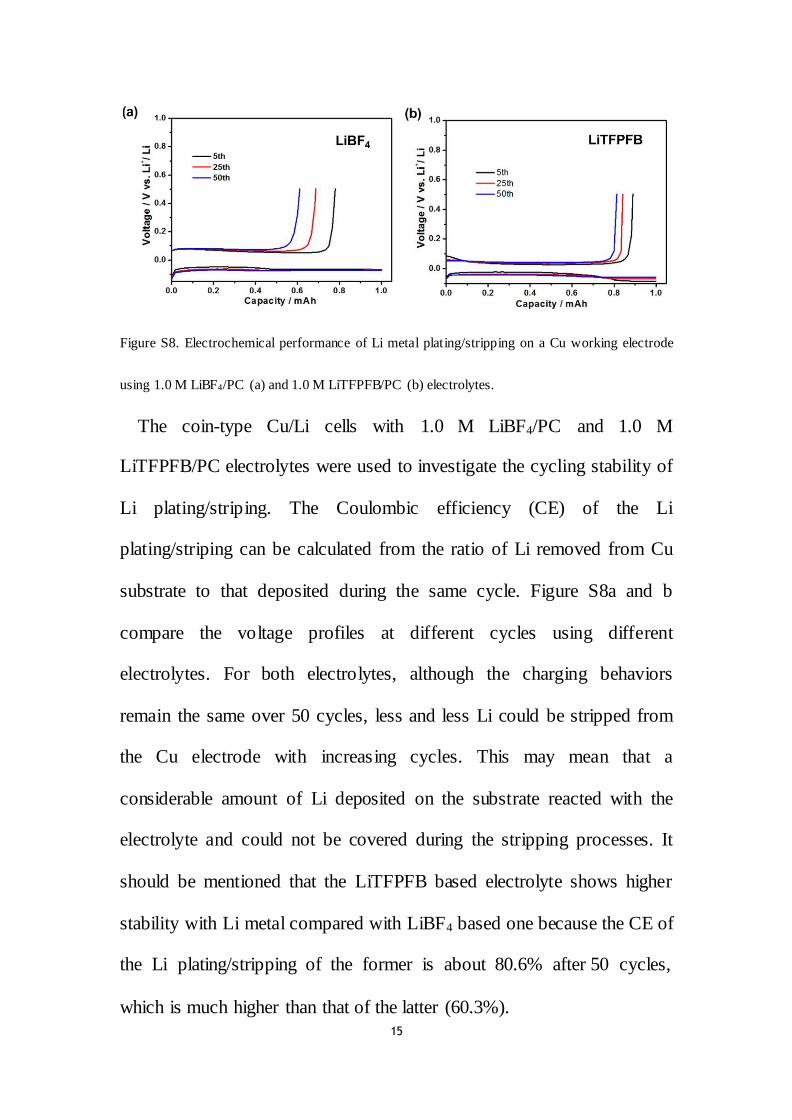
Figure S8. Electrochemical performance of Li metal plating/stripping on a Cu working electrode
using 1.0 M LiBF4/PC (a) and 1.0 M LiTFPFB/PC (b) electrolytes.
The coin-type Cu/Li cells with 1.0 M LiBF4/PC and 1.0 M
LiTFPFB/PC electrolytes were used to investigate the cycling stability of
Li plating/striping. The Coulombic efficiency (CE) of the Li
plating/striping can be calculated from the ratio of Li removed from Cu
substrate to that deposited during the same cycle. Figure S8a and b
compare the voltage profiles at different cycles using different
electrolytes. For both electrolytes, although the charging behaviors
remain the same over 50 cycles, less and less Li could be stripped from
the Cu electrode with increasing cycles. This may mean that a
considerable amount of Li deposited on the substrate reacted with the
electrolyte and could not be covered during the stripping processes. It
should be mentioned that the LiTFPFB based electrolyte shows higher
stability with Li metal compared with LiBF4 based one because the CE of
the Li plating/stripping of the former is about 80.6% after 50 cycles,
which is much higher than that of the latter (60.3%).
16
2.5 Room temperature performance of LiTFPFB
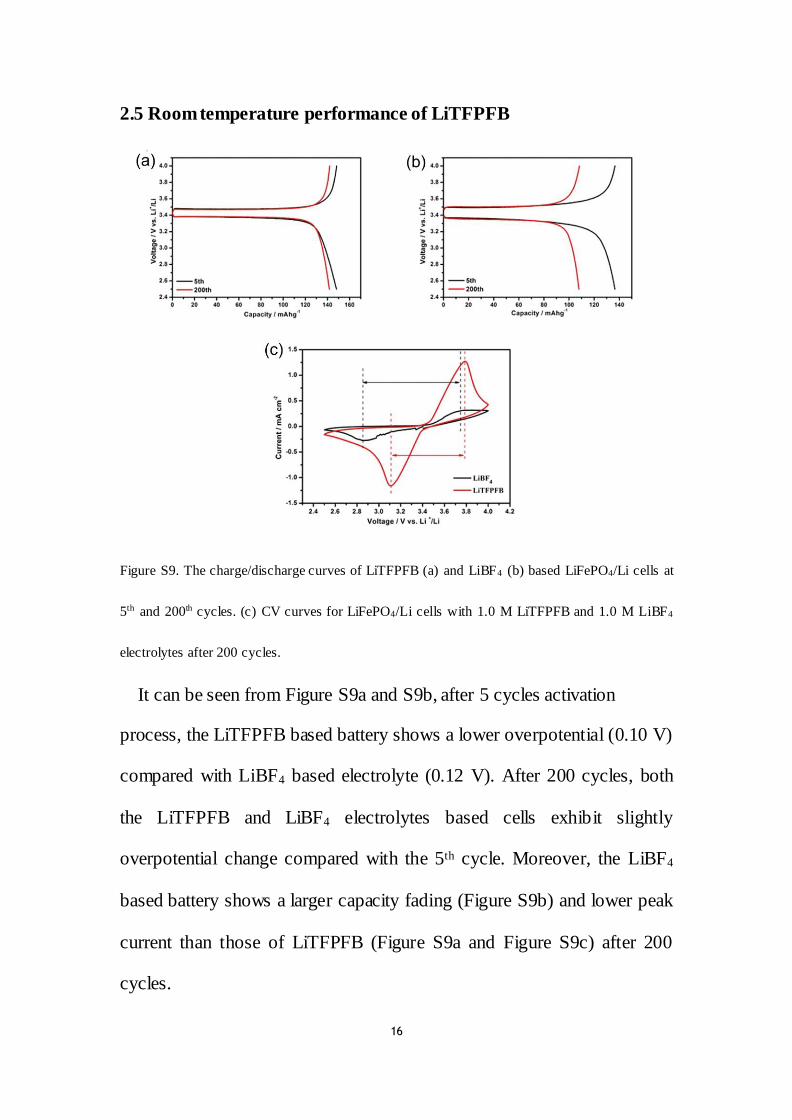
Figure S9. The charge/discharge curves of LiTFPFB (a) and LiBF4 (b) based LiFePO4/Li cells at
5th and 200th cycles. (c) CV curves for LiFePO4/Li cells with 1.0 M LiTFPFB and 1.0 M LiBF4
electrolytes after 200 cycles.
It can be seen from Figure S9a and S9b, after 5 cycles activation
process, the LiTFPFB based battery shows a lower overpotential (0.10 V)
compared with LiBF4 based electrolyte (0.12 V). After 200 cycles, both
the LiTFPFB and LiBF4 electrolytes based cells exhibit slightly
overpotential change compared with the 5th cycle. Moreover, the LiBF4
based battery shows a larger capacity fading (Figure S9b) and lower peak
current than those of LiTFPFB (Figure S9a and Figure S9c) after 200
cycles.
17
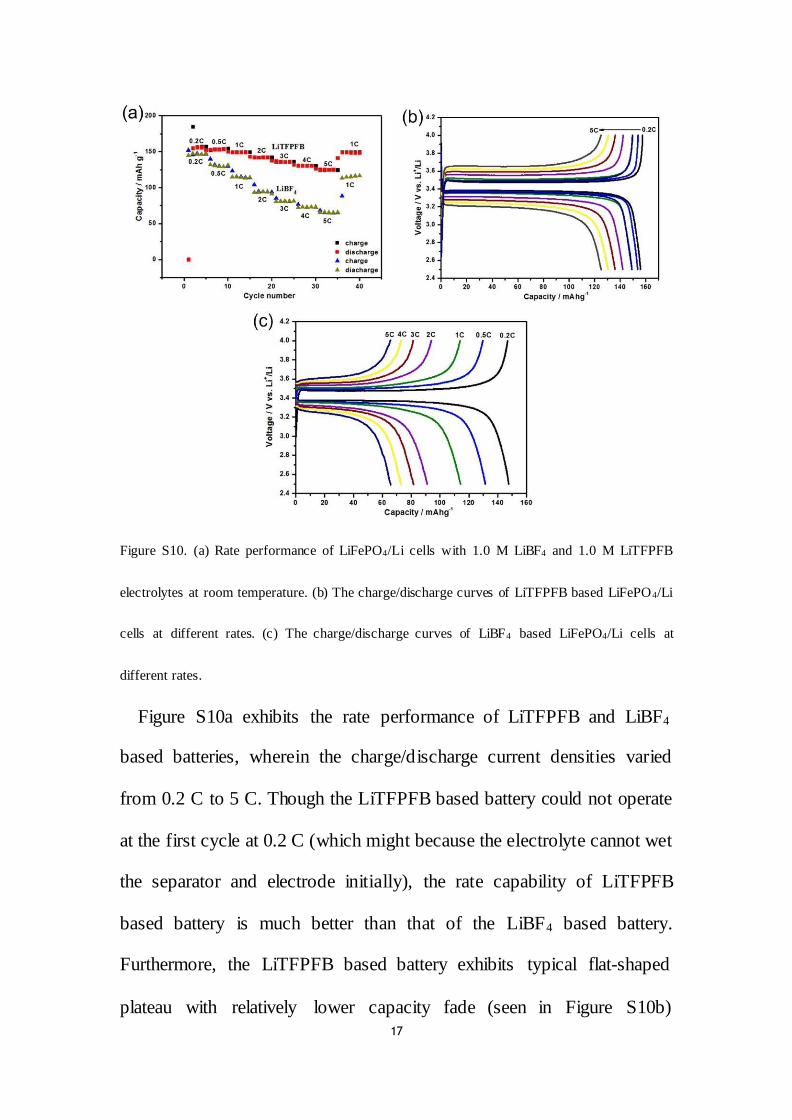
Figure S10. (a) Rate performance of LiFePO4/Li cells with 1.0 M LiBF4 and 1.0 M LiTFPFB
electrolytes at room temperature. (b) The charge/discharge curves of LiTFPFB based LiFePO4/Li
cells at different rates. (c) The charge/discharge curves of LiBF4 based LiFePO4/Li cells at
different rates.
Figure S10a exhibits the rate performance of LiTFPFB and LiBF4
based batteries, wherein the charge/discharge current densities varied
from 0.2 C to 5 C. Though the LiTFPFB based battery could not operate
at the first cycle at 0.2 C (which might because the electrolyte cannot wet
the separator and electrode initially), the rate capability of LiTFPFB
based battery is much better than that of the LiBF4 based battery.
Furthermore, the LiTFPFB based battery exhibits typical flat-shaped
plateau with relatively lower capacity fade (seen in Figure S10b)
18
compared with LiBF4 based battery (Figure S10c), indicating the fast
kinetics of lithium ion transport in the LiTFPFB based electrolyte. The
excellent rate performance demonstrates that LiTFPFB possesses
outstanding electrochemical stability and Li+ conduction ability. This
result can be attributed to the super-delocalized nature of the anion in
LiTFPFB, which could improve the lithium ion dissociation and increase
the number of free Li+ compared with LiBF4.
19
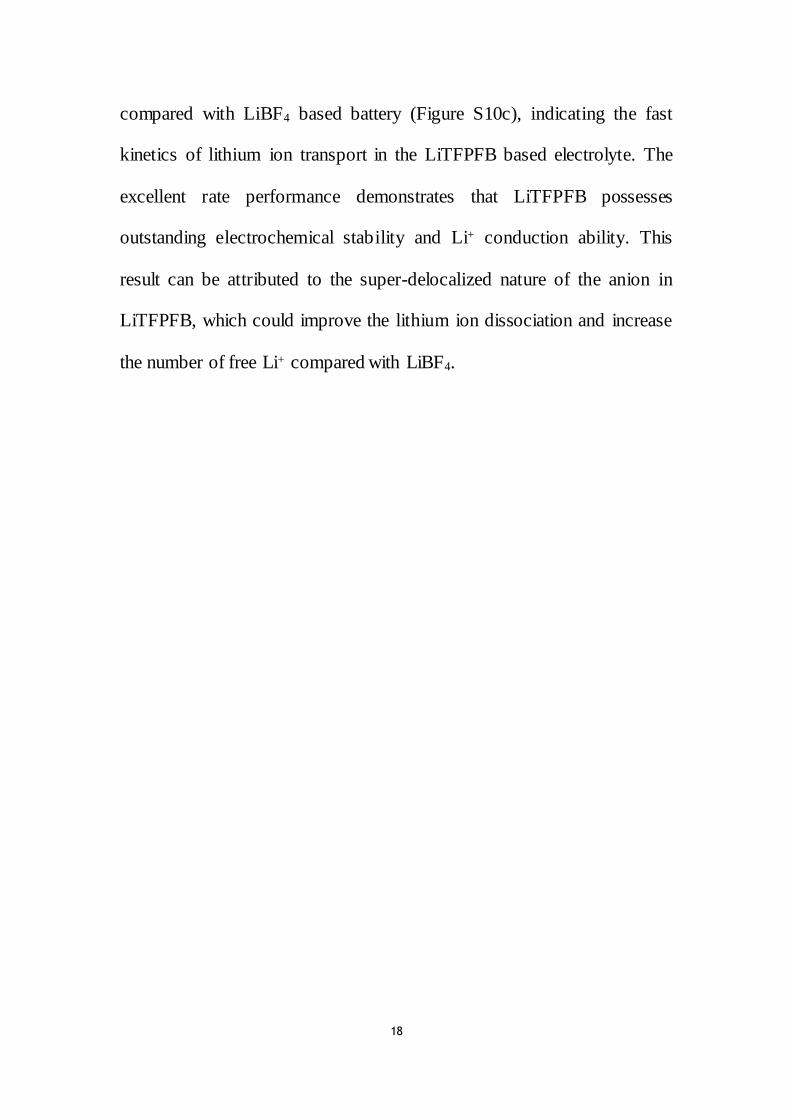
2.6 Impedance variation of the LiFePO4/Li cells using different
electrolytes
Figure S11.The equivalent circuit of the AC-impedance plots.
Table S1. The fitted Rb, RSEI and RCT results of the LiFePO4/Li cells
Electrolyte 1.0 M LiTFPFB in PC
1.0 M LiBF4 in PC
Resistance Rb (Ω) RSEI (Ω) RCT (Ω) Rb (Ω) RSEI (Ω) RCT (Ω)
1st cycle 2.6 3.0 10.0 10.4 13.1 11.0
50th cycle 2.3 3.4 11.8 13.0 26.0 9.0
100th cycle 5.4 6.5 7.6 6.3 31.8 7.9
200th cycle 3.8 8.5 8.6 7.1 41.8 38.4
20
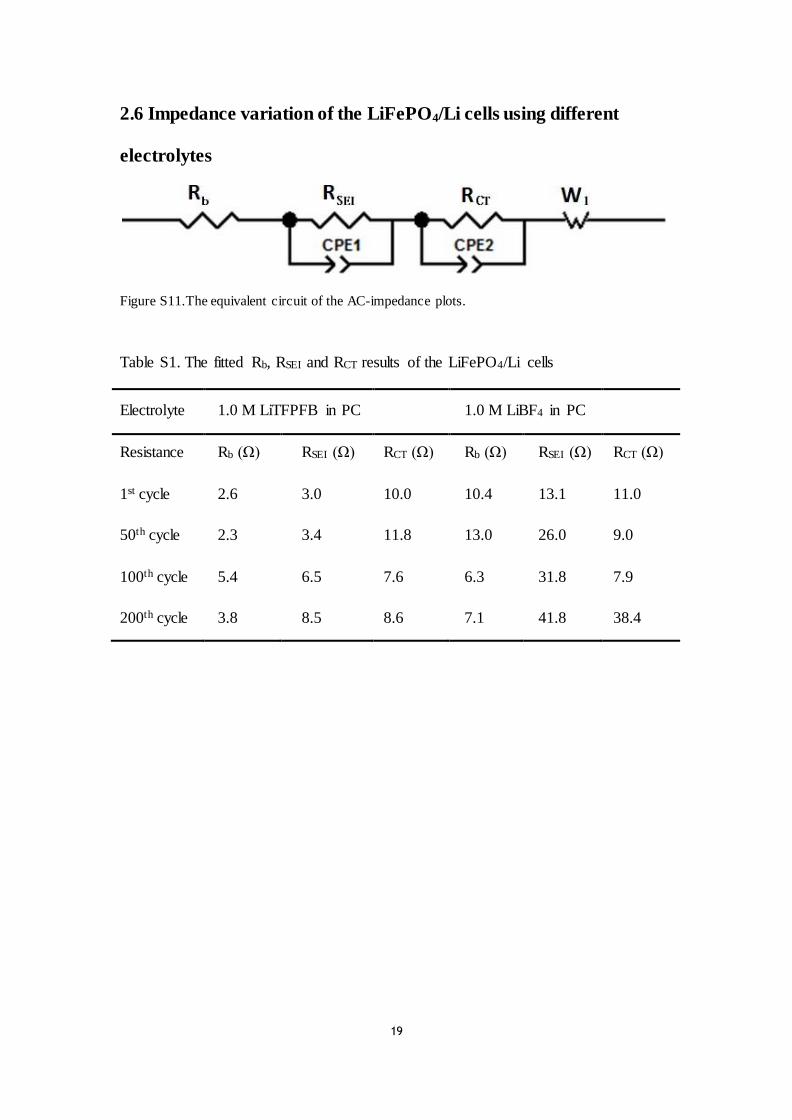
2.7 Low temperature performances of both electrolytes
Figure S12. (a) Cycling performance of the LiFePO4/Li metal cells using 1.0 M LiTFPFB/PC and
1.0 M LiBF4/PC electrolytes with a current rate of 0.2 C at -5 °C. (b, c) The 5th and 55th charge-
discharge profiles of the cells using LiTFPFB/PC and 1.0 M LiBF4/PC electrolytes, respectively.
As shown in Figure S12a, the LiFePO4/Li cell delivers an initial
discharge capacity of 90.2 mAh g-1 at 0.2 C at -5 °C and the
corresponding initial Coulombic efficiency is 70.6%, both of which are
much higher than those of LiBF4 based cell (67.9 mAh g-1 and 41.1%,
respectively). The 5th charge-discharge curve for LiTFPFB based cell is
plotted in Figure S12b, which shows improved charge-discharge capacity
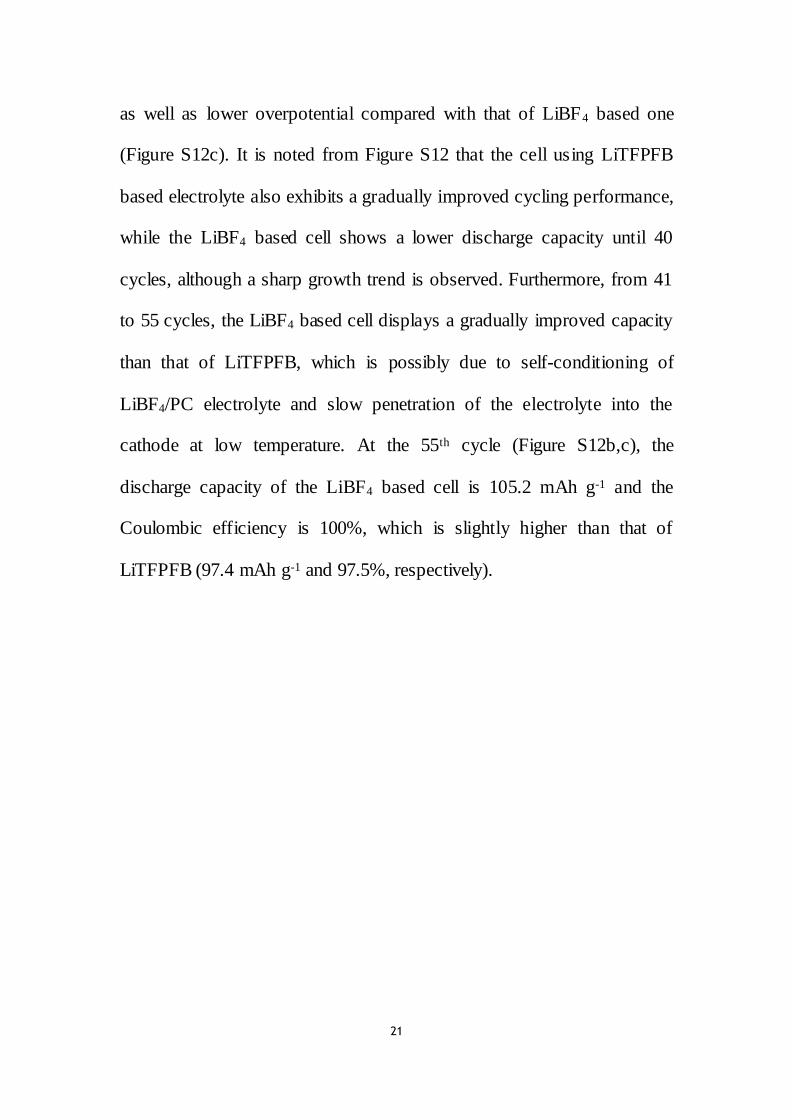
21
as well as lower overpotential compared with that of LiBF4 based one
(Figure S12c). It is noted from Figure S12 that the cell using LiTFPFB
based electrolyte also exhibits a gradually improved cycling performance,
while the LiBF4 based cell shows a lower discharge capacity until 40
cycles, although a sharp growth trend is observed. Furthermore, from 41
to 55 cycles, the LiBF4 based cell displays a gradually improved capacity
than that of LiTFPFB, which is possibly due to self-conditioning of
LiBF4/PC electrolyte and slow penetration of the electrolyte into the
cathode at low temperature. At the 55th cycle (Figure S12b,c), the
discharge capacity of the LiBF4 based cell is 105.2 mAh g-1 and the
Coulombic efficiency is 100%, which is slightly higher than that of
LiTFPFB (97.4 mAh g-1 and 97.5%, respectively).
22
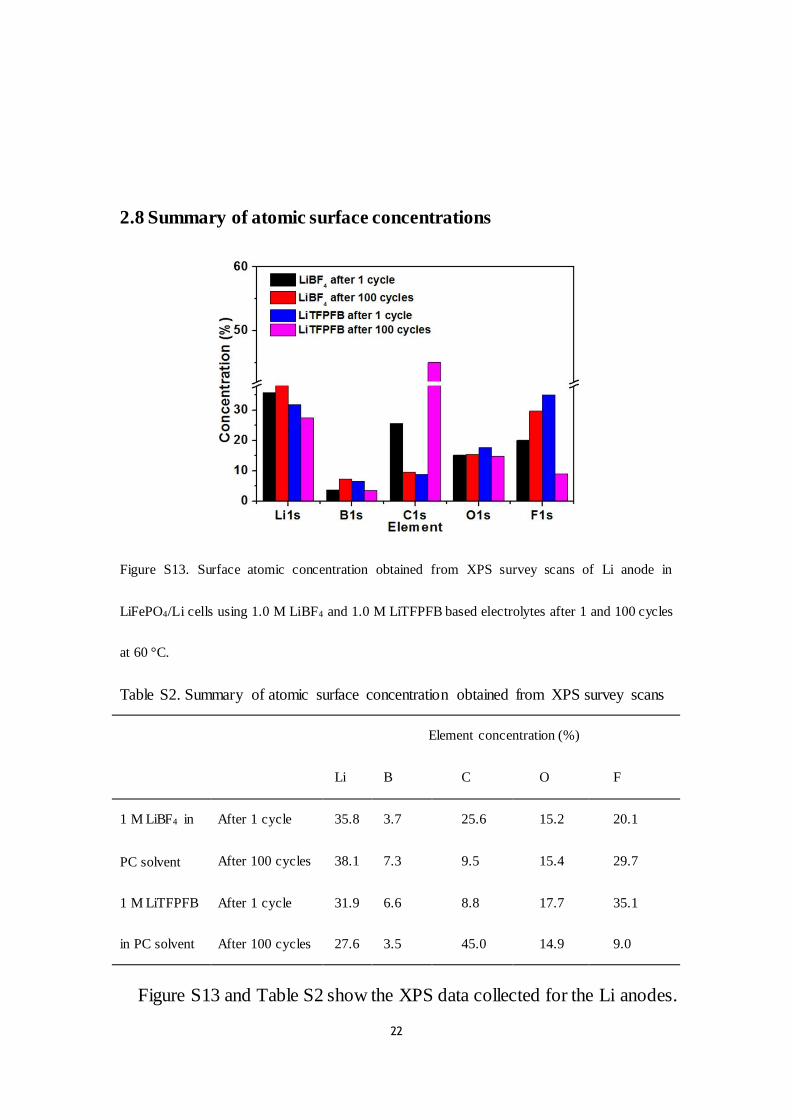
2.8 Summary of atomic surface concentrations
Figure S13. Surface atomic concentration obtained from XPS survey scans of Li anode in
LiFePO4/Li cells using 1.0 M LiBF4 and 1.0 M LiTFPFB based electrolytes after 1 and 100 cycles
at 60 °C.
Table S2. Summary of atomic surface concentration obtained from XPS survey scans
Element concentration (%)
Li B C O F
1 M LiBF4 in
PC solvent
After 1 cycle 35.8 3.7 25.6 15.2 20.1
After 100 cycles 38.1 7.3 9.5 15.4 29.7
1 M LiTFPFB
in PC solvent
After 1 cycle 31.9 6.6 8.8 17.7 35.1
After 100 cycles 27.6 3.5 45.0 14.9 9.0
Figure S13 and Table S2 show the XPS data collected for the Li anodes.

23
Analysis of the collected data reveals slight differences in the
concentration of reacted species on the anode surface. Particularly, the
dramatic concentration increase of C species and sharp decrease of F
species might verify the decomposition of TFPFB anion.