Electronic Supplementary InformationElectronic Supplementary Information Double spin transition in...
23
Electronic Supplementary Information Double spin transition in two dimensional Fe(II) coordination network Marek Weselski, a Maria Książek, b Dominika Rokosz, a Agnieszka Dreczko, a Joachim Kusz, b Robert Bronisz a* a Faculty of Chemistry, University of Wrocław, F. Joliot-Curie 14, 50-383, Wrocław, Poland. b Institute of Physics, University of Silesia, Uniwersytecka 4, 40-007 Katowice, Poland. Contents: Materials and methods (Table S1) 2 Synthesis of ligand and complex 1 3 Crystallographic data and parameters for 1 4 Crystallographic data for crystal structures determined at different temperatures (Table S2) 4 Selected distances and angles (Table S3) 6 Selected C-H…N and C-H···O interatomic contacts (Table S4) 7 Magnetic measurements 8 Unidirectional switching (Figure S1) 8 Mossbauer spectroscopy 9 HS(HS,LS)LS-I(HS,LS) LS-IIHS cycle 9 Table S5 9 Figure S2 10 HSLS-IIHS cycle 11 Table S6 11 Figure S3 12 Unidirectional LS-I(HS,LS) LS-II switching 13 Table S6 13 Figure S4 14 Temperature dependence of Fe-N distances as result of fast cooling of single crystal of 1 15 Figure S5 15 Comparison of structural differences between HS and LS-II forms 16 Figure S6 16 Figure S7 16 Alteration of intermolecular contacts during spin crossover 17 Comparison of intermolecular contacts in HS and LS-I phases 17 Figure S8 17 Figure S9 17 Comparison of intermolecular contacts in LS-I and LS-II phases 18 Figure S10 18 Figure S11 19 IR spectra of ebbtr (Figure S12) and 1 (Figure S13) 20 DSC curves (Figures S14 and S15) 21 Electronic Supplementary Material (ESI) for ChemComm. This journal is © The Royal Society of Chemistry 2018
Transcript of Electronic Supplementary InformationElectronic Supplementary Information Double spin transition in...

Electronic Supplementary Information
Double spin transition in two dimensional Fe(II) coordination network
Marek Weselski,a Maria Książek,b Dominika Rokosz,a Agnieszka Dreczko,a Joachim Kusz,b Robert Bronisza*
a Faculty of Chemistry, University of Wrocław, F. Joliot-Curie 14, 50-383, Wrocław, Poland.b Institute of Physics, University of Silesia, Uniwersytecka 4, 40-007 Katowice, Poland.
Contents:Materials and methods (Table S1) 2Synthesis of ligand and complex 1 3Crystallographic data and parameters for 1 4
Crystallographic data for crystal structures determined at different temperatures (Table S2) 4Selected distances and angles (Table S3) 6Selected C-H…N and C-H···O interatomic contacts (Table S4) 7
Magnetic measurements 8Unidirectional switching (Figure S1) 8
Mossbauer spectroscopy 9 HS(HS,LS)LS-I(HS,LS) LS-IIHS cycle 9
Table S5 9Figure S2 10
HSLS-IIHS cycle 11Table S6 11Figure S3 12
Unidirectional LS-I(HS,LS) LS-II switching 13Table S6 13Figure S4 14
Temperature dependence of Fe-N distances as result of fast cooling of single crystal of 1 15Figure S5 15
Comparison of structural differences between HS and LS-II forms 16Figure S6 16Figure S7 16
Alteration of intermolecular contacts during spin crossover 17Comparison of intermolecular contacts in HS and LS-I phases 17
Figure S8 17Figure S9 17
Comparison of intermolecular contacts in LS-I and LS-II phases 18Figure S10 18Figure S11 19
IR spectra of ebbtr (Figure S12) and 1 (Figure S13) 20
DSC curves (Figures S14 and S15) 21
Electronic Supplementary Material (ESI) for ChemComm.This journal is © The Royal Society of Chemistry 2018
2
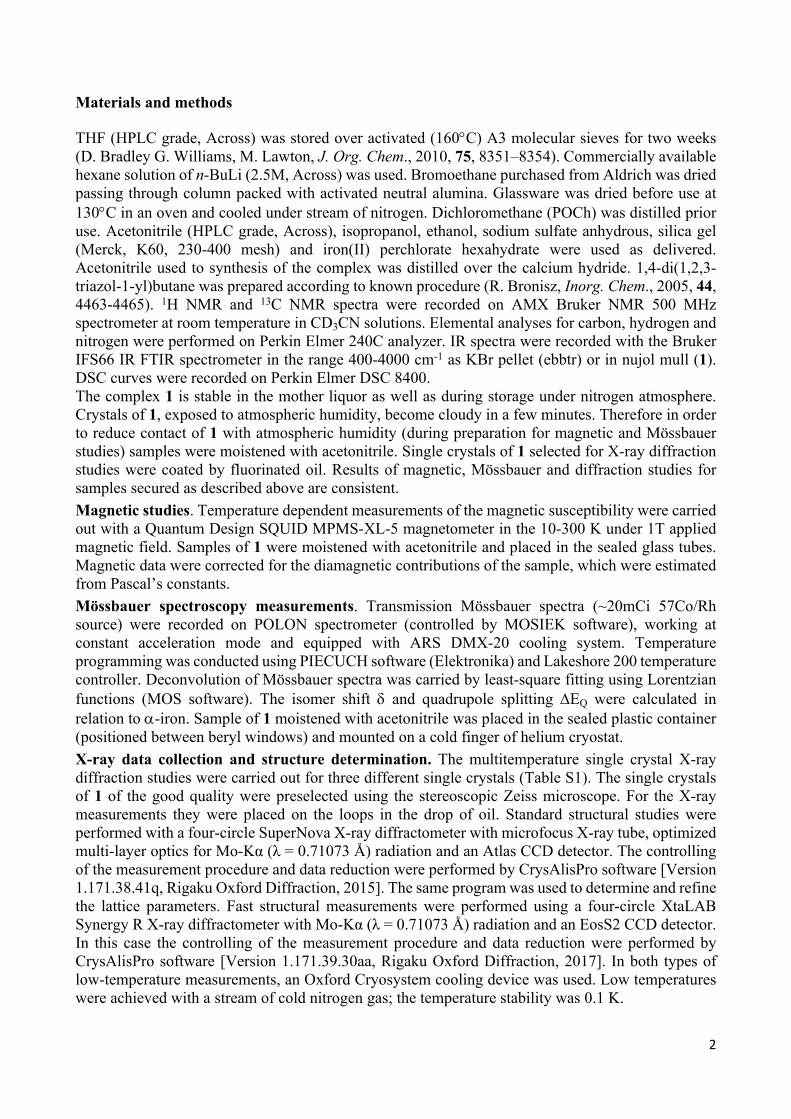
Materials and methods
THF (HPLC grade, Across) was stored over activated (160C) A3 molecular sieves for two weeks (D. Bradley G. Williams, M. Lawton, J. Org. Chem., 2010, 75, 8351–8354). Commercially available hexane solution of n-BuLi (2.5M, Across) was used. Bromoethane purchased from Aldrich was dried passing through column packed with activated neutral alumina. Glassware was dried before use at 130C in an oven and cooled under stream of nitrogen. Dichloromethane (POCh) was distilled prior use. Acetonitrile (HPLC grade, Across), isopropanol, ethanol, sodium sulfate anhydrous, silica gel (Merck, K60, 230-400 mesh) and iron(II) perchlorate hexahydrate were used as delivered. Acetonitrile used to synthesis of the complex was distilled over the calcium hydride. 1,4-di(1,2,3-triazol-1-yl)butane was prepared according to known procedure (R. Bronisz, Inorg. Chem., 2005, 44, 4463-4465). 1H NMR and 13C NMR spectra were recorded on AMX Bruker NMR 500 MHz spectrometer at room temperature in CD3CN solutions. Elemental analyses for carbon, hydrogen and nitrogen were performed on Perkin Elmer 240C analyzer. IR spectra were recorded with the Bruker IFS66 IR FTIR spectrometer in the range 400-4000 cm-1 as KBr pellet (ebbtr) or in nujol mull (1). DSC curves were recorded on Perkin Elmer DSC 8400.The complex 1 is stable in the mother liquor as well as during storage under nitrogen atmosphere. Crystals of 1, exposed to atmospheric humidity, become cloudy in a few minutes. Therefore in order to reduce contact of 1 with atmospheric humidity (during preparation for magnetic and Mössbauer studies) samples were moistened with acetonitrile. Single crystals of 1 selected for X-ray diffraction studies were coated by fluorinated oil. Results of magnetic, Mössbauer and diffraction studies for samples secured as described above are consistent.Magnetic studies. Temperature dependent measurements of the magnetic susceptibility were carried out with a Quantum Design SQUID MPMS-XL-5 magnetometer in the 10-300 K under 1T applied magnetic field. Samples of 1 were moistened with acetonitrile and placed in the sealed glass tubes. Magnetic data were corrected for the diamagnetic contributions of the sample, which were estimated from Pascal’s constants. Mössbauer spectroscopy measurements. Transmission Mössbauer spectra (~20mCi 57Co/Rh source) were recorded on POLON spectrometer (controlled by MOSIEK software), working at constant acceleration mode and equipped with ARS DMX-20 cooling system. Temperature programming was conducted using PIECUCH software (Elektronika) and Lakeshore 200 temperature controller. Deconvolution of Mössbauer spectra was carried by least-square fitting using Lorentzian functions (MOS software). The isomer shift and quadrupole splitting EQ were calculated in relation to -iron. Sample of 1 moistened with acetonitrile was placed in the sealed plastic container (positioned between beryl windows) and mounted on a cold finger of helium cryostat.X-ray data collection and structure determination. The multitemperature single crystal X-ray diffraction studies were carried out for three different single crystals (Table S1). The single crystals of 1 of the good quality were preselected using the stereoscopic Zeiss microscope. For the X-ray measurements they were placed on the loops in the drop of oil. Standard structural studies were performed with a four-circle SuperNova X-ray diffractometer with microfocus X-ray tube, optimized multi-layer optics for Mo-Kα (λ = 0.71073 Å) radiation and an Atlas CCD detector. The controlling of the measurement procedure and data reduction were performed by CrysAlisPro software [Version 1.171.38.41q, Rigaku Oxford Diffraction, 2015]. The same program was used to determine and refine the lattice parameters. Fast structural measurements were performed using a four-circle XtaLAB Synergy R X-ray diffractometer with Mo-Kα (λ = 0.71073 Å) radiation and an EosS2 CCD detector. In this case the controlling of the measurement procedure and data reduction were performed by CrysAlisPro software [Version 1.171.39.30aa, Rigaku Oxford Diffraction, 2017]. In both types of low-temperature measurements, an Oxford Cryosystem cooling device was used. Low temperatures were achieved with a stream of cold nitrogen gas; the temperature stability was 0.1 K.

3
The structure of 1 was solved using the SHELXS-2013 program and refined with the SHELXL-2014/7 program [G. M. Sheldrick, Acta Cryst. C, 2015, 71, 3-8]. Non-hydrogen atoms were refined with anisotropic thermal parameters. Hydrogen atoms were introduced to the structure by appropriate rigid body constraints (AFIX 23, AFIX 43 or AFIX 137) with temperature factors Uiso(H) equal to 1.2Ueq(C) for aromatic and methylene hydrogen atoms or 1.5Ueq(C) for methyl hydrogen atoms. CCDC 1573880-1573886 contain the supplementary crystallographic data for this paper. These data can be obtained free of charge from The Cambridge Crystallographic Data Centre via www.ccdc.cam.ac.uk/data_request/cif.
Table S1. CCDC numbers corresponding to measurement temperature, number of crystal and kind of diffractometer.
Column number
T [K]
1
250 KHS
2
130K(HS,LS)
3
80KLS-I
4
145(HS,LS)
5
180KLS-II
6
220 KHS
7
140 KLS-III
CCDC number 1573880 1573881 1573882 1573883 1573884 1573885 1573886Number of crystal 1 1 2 2 2 2 3Diffractometer XtaLAB
Synergy RXtaLAB
Synergy RSuper Nova
Super Nova
Super Nova
SuperNova
SuperNova
Synthesis of ligand and complex 1
1,4-di(5-ethyl-1,2,3-triazol-1-yl)butane (ebbtr). 1,4-di(1,2,3-triazol-1-yl)butane (1.747 g, 9.000 mmol) was added to THF (260 mL) stirred in three necked flask (0.25 dm3) equipped with thermometer, oil bubbler and septum. Over the resulted colorless solution slow stream of nitrogen was passed. The solution was cooled to -35C (dry ice/isopropanol/ethanol) and solution of n-BuLi (9.68 mL, 24.0 mmol) in THF (10 mL) was added dropwise. Temperature of reaction mixture was reduced to -70C and after 60 minutes ethyl bromide (5.880 g, 54.00 mmol) in THF (10 mL) was added. The resulted reaction mixture was stirred for 2 hours and then allowed to reach a room temperature. Then the solvents were evaporated under reduced pressure using rotary evaporator giving yellow oil. Product was isolated by column chromatography on silica gel using as eluent CH2Cl2:CH3CN:MeOH - 10:0.30:3 v/v/v (Rf=0.20). Yield 0.94 g (51 %) colorless crystals. 1H NMR (500 MHz, CD3CN) (ppm): 7.40 (s, 2H), 4.25 (m, 4H), 2.63 (m, 4H), 1.83 (m, 4H), 1.23 (t, J=7.5Hz, 6H); 13C NMR (500 MHz, CD3CN) (ppm): 140.55, 132.69, 48.10, 28.10, 17.73, 13.45; analysis (calcd., found for C12H20N6): C (58.0, 58.0), H (8.1, 8.3), N (33.8, 33.6).
[Fe(ebbtr)2(CH3CN)2](ClO4)24CH3CN (1). Syntheses of the complex was carried out under nitrogen atmosphere using the standard Schlenk technique. To the solution of ebbtr (0.0248 g, 0.100 mmol) in acetonitrile (6.0 mL) the solution of Fe(ClO4)26H2O (0.0181 g, 0.0500 mmol) in acetonitrile (3.0 mL) was added. The obtained colorless solution was left in the closed Schlenk flask. After one week colorless crystals were filtered off, washed with acetonitrile and dried in the stream of nitrogen. Yield 0.027 g (54 %). Analysis (calcd., found for FeC36H58N18Cl2O8): C (43.3, 43.1), H (5.9, 5.7), N (25.3, 25.1). Caution! Even though no problems were encountered it is worth to mention that complexes containing perchlorates are potentially explosive and should be synthesized in milligram scale and handled with care.

4
Crystallographic data and parameters for 1
Table S2. Crystallographic data for crystal structures of 1 determined at different temperatures. In tables S3 and S4 column numbers correspond to the same temperatures as in Table S1.
Column number
T [K]
1
250 KHS
2
130 K (HS, LS)
3
80 KLS-I
4
145 K (HS, LS)
Chemical formula C36H58Cl2FeN18O8
Formula mass 997.75Crystal system, space group Triclinic, P-1Z 1a [Å] 11.7696 (9) 11.4674 (7) 11.5506 (5) 11.4824 (4)b [Å] 11.6828 (8) 11.6318 (7) 11.5833 (5) 11.6432 (5)c [Å] 11.8805 (7) 11.8386 (7) 11.6586 (5) 11.8553 (4)α [°] 62.997 (7) 63.371 (6) 62.604 (4) 63.433 (4)β [°] 89.019 (6) 90.780 (5) 88.651 (3) 90.777 (3)γ [°] 62.634 (7) 63.371 (6) 62.157 (4) 63.339 (4)V [Å3] 1254.16 (18) 1215.56 (15) 1187.64 (10) 1220.53 (10)Absorption coefficient [mm-1] 0.471 0.486 0.498 0.484No. of measured reflections 4387 4202 9718 10391No. of independent reflections 4129 3958 4842 4990Theta range for data collection [º] 3.331 to 26.369 3.371 to 26.368 3.222 to 26.368 3.229 to 26.372Index ranges -12 ≤ h ≤ 14
-4 ≤ k ≤ 14-10 ≤ l ≤ 13
-11 ≤ h ≤ 14-4 ≤ k ≤ 14-10 ≤ l ≤ 13
-14 ≤ h ≤ 14-10 ≤ k ≤ 14-14 ≤ l ≤ 14
-13 ≤ h ≤ 14-14 ≤ k ≤ 14-14 ≤ l ≤ 14
Rint 0.0045 0.0053 0.0386 0.0234Final R1 values (I > 2σ(I)) 0.0827 0.0503 0.0618 0.0353Final wR(F2) values (I > 2σ(I)) 0.2379 0.1357 0.1602 0.0925Final R1 values (all data)a 0.0911, 0.0554 0.0755 0.0438Final wR(F2) values (all data)b 0.2533 0.1421 0.1732 0.0995Goodness-of-fit on F2 1.054 1.085 1.044 1.045Largest diff. peak and hole [eÅ-3] 1.430 and -0.630 0.607 and -0.411 2.032 and -0.774 0.576 and -0.363

5
Table S2 (cd). Crystallographic data for crystal structures of 1 determined at different temperatures. In tables S3 and S4 column numbers correspond to the same temperatures as in Table S1.
Column number
T [K]
5
180 KLS-II
6
220 KHS
7
140 KLS-III
Chemical formula C36H58Cl2FeN18O8
Formula mass 997.75Crystal system, space group Triclinic, P-1Z 1a [Å] 11.799 (2) 11.706 (2) 11.760 (3)b [Å] 11.225 (2) 11.680 (2) 11.193 (3)c [Å] 11.573 (2) 11.898 (2) 11.526 (3)α [°] 64.323 (19) 63.100 (19) 64.44 (2)β [°] 83.075 (16) 89.376 (16) 83.26 (2)γ [°] 62.158 (19) 62.860 (18) 62.29 (3)V [Å3] 1215.1 (5) 1251.2 (5) 1205.0 (6)Absorption coefficient [mm-1] 0.486 0.472 0.490No. of measured reflections 4903 5086 4947No. of independent reflections 2804 2886 2807Theta range for data collection [º] 3.432 to 24.459 3.325 to 24.495 3.439 to 24.569Index ranges -13 ≤ h ≤ 13
-11 ≤ k ≤ 11-12 ≤ l ≤ 13
-13 ≤ h ≤ 13-12 ≤ k ≤ 12-13 ≤ l ≤ 13
-13 ≤ h ≤ 13-11 ≤ k ≤ 11-12 ≤ l ≤ 13
Rint 0.0928 0.1140 0.1043Final R1 values (I > 2σ(I)) 0.0810 0.0949 0.0878Final wR(F2) values (I > 2σ(I)) 0.1925 0.2446 0.2163Final R1 values (all data)a 0.1470 0.1748 0.1561Final wR(F2) values (all data)b 0.2414 0.3115 0.2733Goodness-of-fit on F2 1.026 1.003 1.023Largest diff. peak and hole [eÅ-3] 0.747 and -0.418 1.056 and -0.487 0.804 and -0.512
6
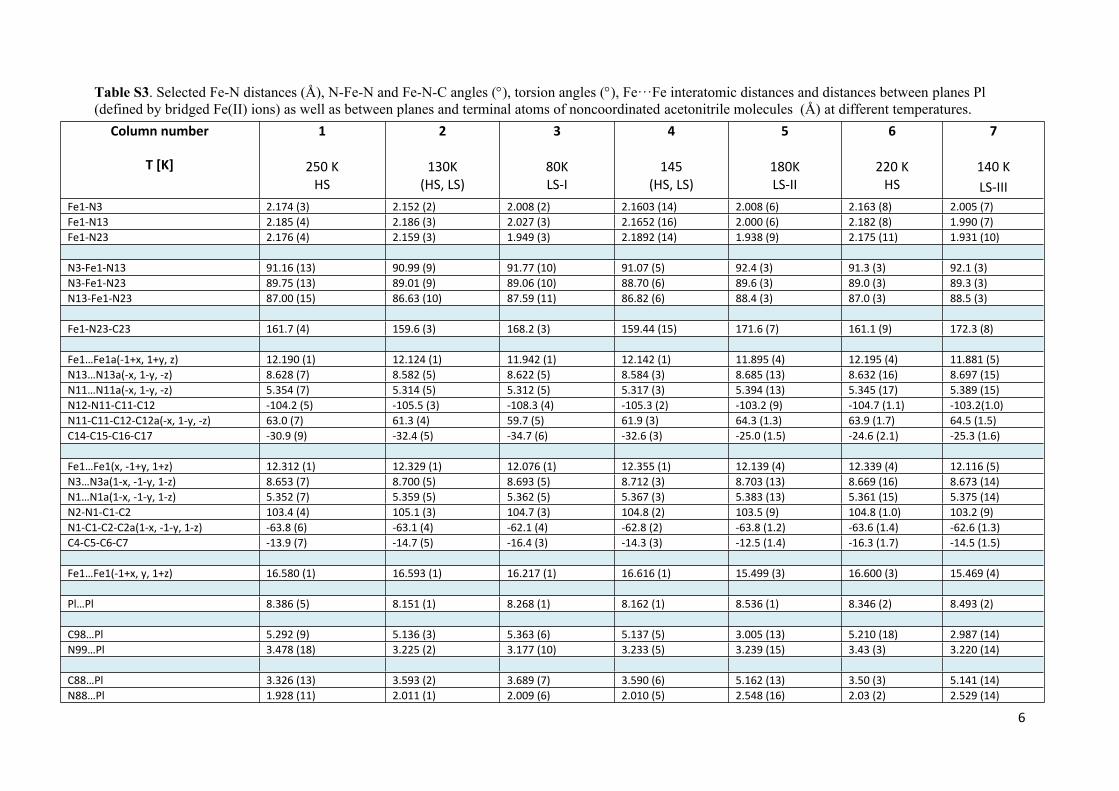
Table S3. Selected Fe-N distances (Å), N-Fe-N and Fe-N-C angles (), torsion angles (), Fe···Fe interatomic distances and distances between planes Pl (defined by bridged Fe(II) ions) as well as between planes and terminal atoms of noncoordinated acetonitrile molecules (Å) at different temperatures.
Column number
T [K]
1
250 KHS
2
130K(HS, LS)
3
80KLS-I
4
145(HS, LS)
5
180KLS-II
6
220 KHS
7
140 KLS-III
Fe1-N3 2.174 (3) 2.152 (2) 2.008 (2) 2.1603 (14) 2.008 (6) 2.163 (8) 2.005 (7)Fe1-N13 2.185 (4) 2.186 (3) 2.027 (3) 2.1652 (16) 2.000 (6) 2.182 (8) 1.990 (7)Fe1-N23 2.176 (4) 2.159 (3) 1.949 (3) 2.1892 (14) 1.938 (9) 2.175 (11) 1.931 (10)
N3-Fe1-N13 91.16 (13) 90.99 (9) 91.77 (10) 91.07 (5) 92.4 (3) 91.3 (3) 92.1 (3)N3-Fe1-N23 89.75 (13) 89.01 (9) 89.06 (10) 88.70 (6) 89.6 (3) 89.0 (3) 89.3 (3)N13-Fe1-N23 87.00 (15) 86.63 (10) 87.59 (11) 86.82 (6) 88.4 (3) 87.0 (3) 88.5 (3)
Fe1-N23-C23 161.7 (4) 159.6 (3) 168.2 (3) 159.44 (15) 171.6 (7) 161.1 (9) 172.3 (8)
Fe1…Fe1a(-1+x, 1+y, z) 12.190 (1) 12.124 (1) 11.942 (1) 12.142 (1) 11.895 (4) 12.195 (4) 11.881 (5)N13…N13a(-x, 1-y, -z) 8.628 (7) 8.582 (5) 8.622 (5) 8.584 (3) 8.685 (13) 8.632 (16) 8.697 (15)N11…N11a(-x, 1-y, -z) 5.354 (7) 5.314 (5) 5.312 (5) 5.317 (3) 5.394 (13) 5.345 (17) 5.389 (15)N12-N11-C11-C12 -104.2 (5) -105.5 (3) -108.3 (4) -105.3 (2) -103.2 (9) -104.7 (1.1) -103.2(1.0)N11-C11-C12-C12a(-x, 1-y, -z) 63.0 (7) 61.3 (4) 59.7 (5) 61.9 (3) 64.3 (1.3) 63.9 (1.7) 64.5 (1.5)C14-C15-C16-C17 -30.9 (9) -32.4 (5) -34.7 (6) -32.6 (3) -25.0 (1.5) -24.6 (2.1) -25.3 (1.6)
Fe1…Fe1(x, -1+y, 1+z) 12.312 (1) 12.329 (1) 12.076 (1) 12.355 (1) 12.139 (4) 12.339 (4) 12.116 (5)N3…N3a(1-x, -1-y, 1-z) 8.653 (7) 8.700 (5) 8.693 (5) 8.712 (3) 8.703 (13) 8.669 (16) 8.673 (14)N1…N1a(1-x, -1-y, 1-z) 5.352 (7) 5.359 (5) 5.362 (5) 5.367 (3) 5.383 (13) 5.361 (15) 5.375 (14)N2-N1-C1-C2 103.4 (4) 105.1 (3) 104.7 (3) 104.8 (2) 103.5 (9) 104.8 (1.0) 103.2 (9)N1-C1-C2-C2a(1-x, -1-y, 1-z) -63.8 (6) -63.1 (4) -62.1 (4) -62.8 (2) -63.8 (1.2) -63.6 (1.4) -62.6 (1.3)C4-C5-C6-C7 -13.9 (7) -14.7 (5) -16.4 (3) -14.3 (3) -12.5 (1.4) -16.3 (1.7) -14.5 (1.5)
Fe1…Fe1(-1+x, y, 1+z) 16.580 (1) 16.593 (1) 16.217 (1) 16.616 (1) 15.499 (3) 16.600 (3) 15.469 (4)
Pl…Pl 8.386 (5) 8.151 (1) 8.268 (1) 8.162 (1) 8.536 (1) 8.346 (2) 8.493 (2)
C98…Pl 5.292 (9) 5.136 (3) 5.363 (6) 5.137 (5) 3.005 (13) 5.210 (18) 2.987 (14)N99…Pl 3.478 (18) 3.225 (2) 3.177 (10) 3.233 (5) 3.239 (15) 3.43 (3) 3.220 (14)
C88…Pl 3.326 (13) 3.593 (2) 3.689 (7) 3.590 (6) 5.162 (13) 3.50 (3) 5.141 (14)N88…Pl 1.928 (11) 2.011 (1) 2.009 (6) 2.010 (5) 2.548 (16) 2.03 (2) 2.529 (14)

7
Table S4. Selected C-H…N and C-H···O interatomic contacts [Å] and angles [°] for 1 at different temperatures. D-H…A distances longer than 3.5 Å and angles lesser than 110 were included only for facilitate comparison of changes.
i: -x+1, -y, -z; ii: 1-x, -y, 1-z; iii: -x, -y+2, -z; iv: -x, -y, -z; v: x, y-1, z; vi: -x+2, -y-1, -z+1; vii: x+1, y-1, z; viii: -x,1-y,-z
Column number
T [K]
1
250KHS
2
130K(HS, LS)
3
80KLS-I
4
145K(HS, LS)
5
180KLS-II
6
220 KHS
7
140 KLS-III
C4-H4...O2i 3.492 (9) 167.3 3.430(5) 169.9 3.365(4) 169.6 3.500(16) 166.3 3.436(2) 169.2 3.353(15) 155.5 3.396(14) 156.7C231-H23A...O1 3.473(12) 169.0 3.454(5) 167.8 3.492(5) 163.0 3.459(19) 146.5 3.457(3) 166.7C231-H23C...O1ii 3.328(16) 175.5 3.283(15) 173.0C88-H88B...N12i 3.398(11) 143.3 3.371(5) 144.5 3.397(6) 141.4 3.42(3) 131.8 3.381(3) 143.0C98-H98A...N99iii 3.13(2) 142.4 3.390(6) 144.2 3.138(9) 143.9 3.06(3) 149.7 3.398(4) 144.8C98-H98B...N99iv 3.439(19) 135.5 3.434(18) 134.1C98-H98C...O4 3.190(12) 146.6 3.215(5) 146.9 3.178(5) 158.4 3.24(2) 151.3 3.210(3) 150.8C98-H98C...O4v 3.393(17) 138.6 3.446(18) 142.9C88-H88A...N88vi 3.495(14 148.2 3.467(6) 145.6 3.439(7) 143.7 3.38(3) 162.1 3.466(3) 148.0C88-H88B...O3vii 3.301(17) 127.0 3.310(18) 125.4C1-H1B...N88 3.293(9) 124.1 3.251(5) 116.7 3.190(5) 116.4 3.27(2) 126.6 3.256(3) 116.8C1-H1B...N88vi 3.369(15) 141.8 3.398(14) 142.7C14-H14...N2 3.286(5) 120.5 3.267(4) 119.4 3.111(4) 116.5 3.268(13) 122.2 3.274(2) 119.8 3.179(12) 119.7 3.183(10) 119.6C11-H11B...O3viii 3.44(2) 138.8 3.48(2) 139.5

8
Magnetic measurements (description of magnetic studies was placed in the main text)
Influence of rate of change of temperature in the cooling/heating mode.
Unidirectional switching.
a)
b)
Figure S1. MT(T) dependence for 1 shows that after cooling sample to 10 K (1 K/min, filled blue triangles) followed then by heating to 165 K (0.004 K/min above 130 K, filled red triangles), a second cooling (open blue triangles) (a) as well as subsequent heating (open red triangles) (b) does not involve formation of HS fraction below 150 K.

9
Mössbauer spectroscopy.
HS(HS,LS)LS-I(HS,LS)LS-IIHS cycle
Mössbauer spectra were recorded in the temperature range from 250 to 50 K. Selected spectra and their parameters (in relation to -iron) are presented on Figure S2 and in the Table S5, respectively. Lowering of temperature to 200 K does not involve change of the spin state. The spectrum recorded at 200 K shows symmetrical doublet with an isomer shift = 1.145(3) mm/s and quadrupole splitting EQ = 1.664(6) mm/s, that is typical for high spin iron(II). After completing measurement at 200 K in cooling mode the temperature was decreased to 136 K with rate 1 K/min. At 136 K appears second doublet with parameters characteristic for low spin phase of iron(II). The relative area of HS form (AHS/(AHS+ALS)) equals at 136 K 0.72 and at 130 K 0.74. Further lowering of temperature involves continuous reduction of relative area of HS component. At 50 K there is present only one slightly split doublet ( = 0.555(3) mm/s and EQ = 0.274(6) mm/s) characteristic for low spin form of iron(II). In the heating mode the participation of HS form increases up to reaching plateau at 130-136 K. The relative area of HS form at 136 K is equal to 0.69. Then temperature was increased to 145 K. It was found that at this temperature evolution of Mössbauer spectra occurs, depending on continuous reduction of HS component area, which lead to the formation of the low spin phase. The resulting low spin phase ( = 0.509(3) mm/s and EQ = 0.234(6) mm/s) is stable up to 195 K. Further elevation of temperature involves initially gradual and then very abrupt spin crossover. At 220 K one doublet with parameters characteristic for the high spin form ( = 1.139(3) mm/s and EQ = 1.636(6) mm/s) is observed.
Table S5. Mössbauer parameters for 1 at selected temperatures for HS and LS forms.
T / K / mms-1 EQ / mms-1 Γ/2 / mms-1 Assignment
cooling200 1.145(3) 1.664(6) 0.161(3) HS
130 1.181(6)0.50(1)
1.72(2)0.24(2)
0.158(7)0.14(2)
HSLS
50 0.555(3) 0.274(6) 0.148(4) LS
heating130 1.178(3)
0.514(8)1.744(6)0.21(2)
0.138(5)0.15(2)
HSLS
145 0.509(3) 0.234(6) 0.146(3) LS
195 0.494(4) 0.226(8) 0.155(7) LS
220 1.139(3) 1.636(6) 0.164(4) HS

10
Figure S2. Selected Mössbauer spectra (cooling – left column and heating – right column) recorded for 1, illustrating HS(HS,LS)LS-I(HS,LS)LS-IIHS cycle.

11
HSLS-IIIHS cycle
After cooling the sample to 200 K the Mössbauer spectrum was recorded. The parameters (in relation to -iron) are characteristic for HS phase of iron(II) (Table S6, Figure S3). In contrast to previously presented HS(HS,LS)LS-I(HS,LS)LS-IIHS cycle, the temperature was next decreased to 195 K. At this temperature evolution of spectrum is observed. The spectrum was recorded after finishing occurred changes. At 195 K appears second doublet characteristic for the low spin form of iron(II). Further measurements were performed in 5 K intervals according to the one described above for 195 K. At 145 K the HS doublet is practically absent and HSLS-III transition is finished. After cooling to 50 K the measurements in the heating mode were carried out. There is not observed the time dependence of Mössbauer spectra. At 200 K HS fraction starts to increase. Above 215 K spin crossover is very abrupt. At 220 K there is observed one doublet characteristic for HS form of iron(II). Thus, LS-IIIHS transition is finished.
Table S6. Mössbauer parameters for 1 at selected temperatures for HS and LS forms.
T / K / mms-1 EQ / mms-1 Γ/2 / mms-1 Assignment
cooling200 1.148(3) 1.660(6) 0.144(4) HS
185 1.139(4)0.505(3)
1.700(8)0.222(6)
0.134(6)0.123(5)
HSLS
160 1.138(8)0.506(2)
1.77(2)0.240(2)
0.08(1)0.133(2)
HSLS
50 0.519(2) 0.520(8) 0.138(4) LS
heating195 1.114(2)
0.498(2)1.82(1)0.234(4)
0.100(2)0.131(3)
HSLS
215 1.118(5)0.491(3)
1.81(1)0.112(2)
0.141(7)0.124(4)
HSLS
220 1.138(2) 1.654(2) 0.149(3) HS

12
Figure S3. Selected Mossbauer spectra (cooling – left column and heating – right column) recorded for 1, illustrating HSLS-IIIHS cycle.
13
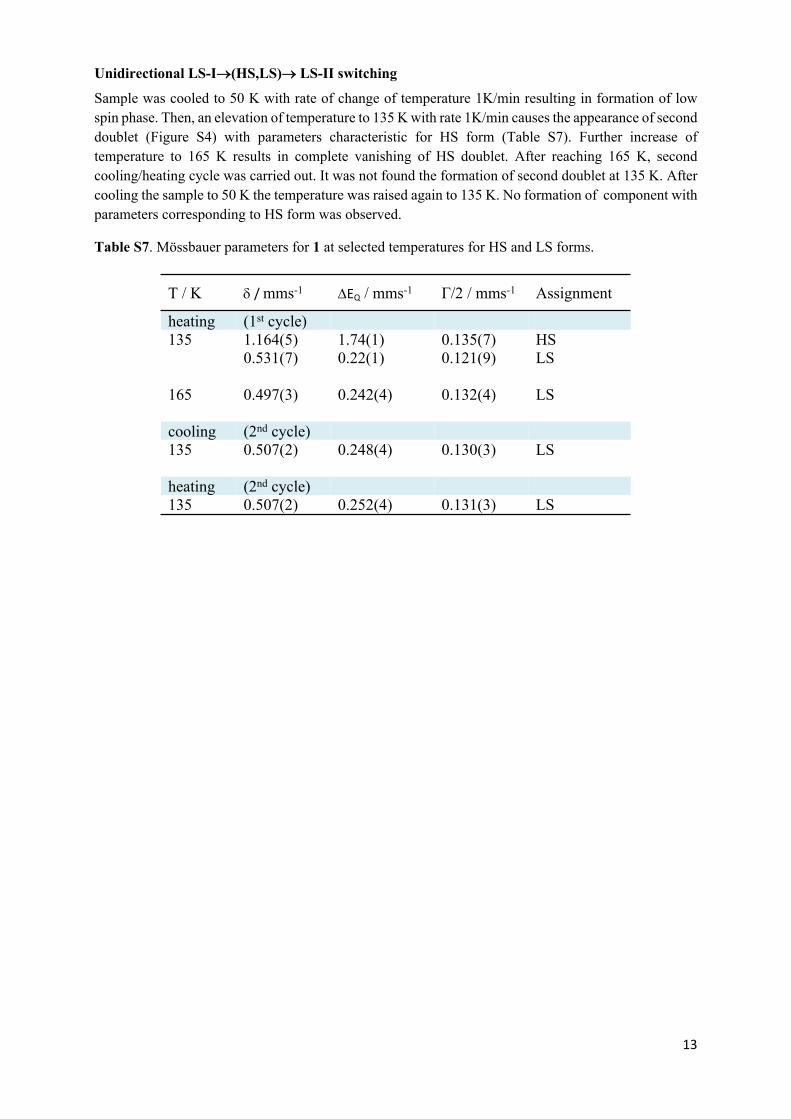
Unidirectional LS-I(HS,LS) LS-II switching
Sample was cooled to 50 K with rate of change of temperature 1K/min resulting in formation of low spin phase. Then, an elevation of temperature to 135 K with rate 1K/min causes the appearance of second doublet (Figure S4) with parameters characteristic for HS form (Table S7). Further increase of temperature to 165 K results in complete vanishing of HS doublet. After reaching 165 K, second cooling/heating cycle was carried out. It was not found the formation of second doublet at 135 K. After cooling the sample to 50 K the temperature was raised again to 135 K. No formation of component with parameters corresponding to HS form was observed.
Table S7. Mössbauer parameters for 1 at selected temperatures for HS and LS forms.
T / K / mms-1 EQ / mms-1 Γ/2 / mms-1 Assignment
heating (1st cycle)135 1.164(5)
0.531(7)1.74(1)0.22(1)
0.135(7)0.121(9)
HSLS
165 0.497(3) 0.242(4) 0.132(4) LS
cooling (2nd cycle)135 0.507(2) 0.248(4) 0.130(3) LS
heating (2nd cycle)135 0.507(2) 0.252(4) 0.131(3) LS

14
Figure S4. Mössbauer spectra recorded for 1 illustrating unidirectional LS-I(HS,LS) LS-II switching.

15
Temperature dependence of Fe-N distances
Figure S5. Temperature dependence of Fe-N distances as a result of fast cooling of single crystal of 1.

16
Comparison of structural differences between HS and LS-II forms
Figure S6. Superposition of the crystal structures of HS (250K, full lines) and LS-II (180 K, dashed lines) phases showing relative shift of polymeric layers at about 1.5Å. Different positions of noncoordinated acetonitrile molecules in HS and LS-II phases are marked by blue and red color, respectively. Hydrogen atoms were omitted for clarity.
Figure S7. Schematic presentation of hierarchical arrangement of structural events associated with formation of LS-II and LS-III structure in 1. (a) Shortening of Fe-N distance. (b) Reorientation of coordinated acetonitrile molecule. (c) Deformation of rhombic window within polymeric layer. (d) Relative shift of neighbouring polymeric layers. (e) Displacement of noncoordinated acetonitrile molecules.

17
Alteration of intermolecular contacts during spin crossover
Comparison of intermolecular contacts in HS and LS-I phases
In the initial HS phase (250 K) noncoordinated acetonitrile molecules form in the area between polymeric layers two kinds of dimers, in which molecules interact through C98-H98A···N99a (dimer 1) or C88-H88A···N88a (dimer 2) intermolecular contacts (Figure S8). Acetonitrile molecules creating “dimer 1” interact also with perchlorate anions (C98-H98c···O4) which form another C231-H23···O1 and C4-H4···O2 contacts with coordinated acetonitrile molecule and triazole ring, respectively. For comparison, molecules forming “dimer 2” do not interact with perchlorate anions but form C88-H88B···N12 and C1-H1B···N88 contacts with ebbtr molecules. Thus, network of intermolecular contacts binds adjacent polymeric layers (Figure S9). There is also present intramolecular contact C14-H14···N2 (Table S4).
Figure S8. Network of intermolecular contacts in HS and LS-I phase of 1 (at 250K). For clarity C2H5- substituents were removed from the picture. Intermolecular contacts involving noncoordinated acetonitrile molecules creating “dimer 1” are marked by blue dashed lines whereas red color was used for contacts involving acetonitrile molecules engaged in formation of “dimer 2”. Intramolecular contact C14-H14···N2 was not depicted.
Figure S9. Network of intermolecular contacts existing in HS and LS-I phase of 1 (at 250K). Intermolecular contacts involving noncoordinated acetonitrile molecules creating “dimer 1” are marked by blue dashed lines whereas red color was used for contacts involving acetonitrile molecules engaged in formation of “dimer 2”.

18
Fast lowering temperature to 130 and then to 80 K triggers HSLS-I transition but network of intermolecular contacts remains unchanged and only slight changes of parameters of intermolecular contacts are observed. Also further increasing of temperature from 80 K to 140 K does not involve any substantial changes.
Comparison of intermolecular contacts in LS-I and LS-II phases
Slow elevation of temperature from 80 K to 180 K leads to formation of LS-II phase which is accompanied by relocation of noncoordinated acetonitrile molecules and rotation of perchlorate anion. As a result severe changes in the net of intermolecular interactions takes place (Table S4). Disappearance of network involving C88-H88A···N88a and C1-H1B···N88 intermolecular contact takes place. Although C98-H98A···N99a contacts still bind noncoordinated acetonitrile molecules into dimeric structure, C98-H98C···O4 intermolecular contact vanishes. It means that network of intermolecular contacts tethering polymeric layers in HS and LS-I completely disappears. Instead, a network involving new C231-H23a···O1 and C11-H11B···O3 contacts as well as previously existing C4-H4···O2 appears (Figures S10 and S11).
Finally, LS-IIHS transition is accompanied by restoration of network of intermolecular interactions existing in the initial HS phase (Table S4).
Figure S10. Network of intermolecular contacts in LS-II phase of 1 (blue dashed lines) For clarity C2H5- substituents were removed from the picture. Intramolecular contact C14-H14···N2 was not depicted.

19
Figure S11. Network of intermolecular contacts (blue dashed lines) existing in LS-II phase in 1.
20
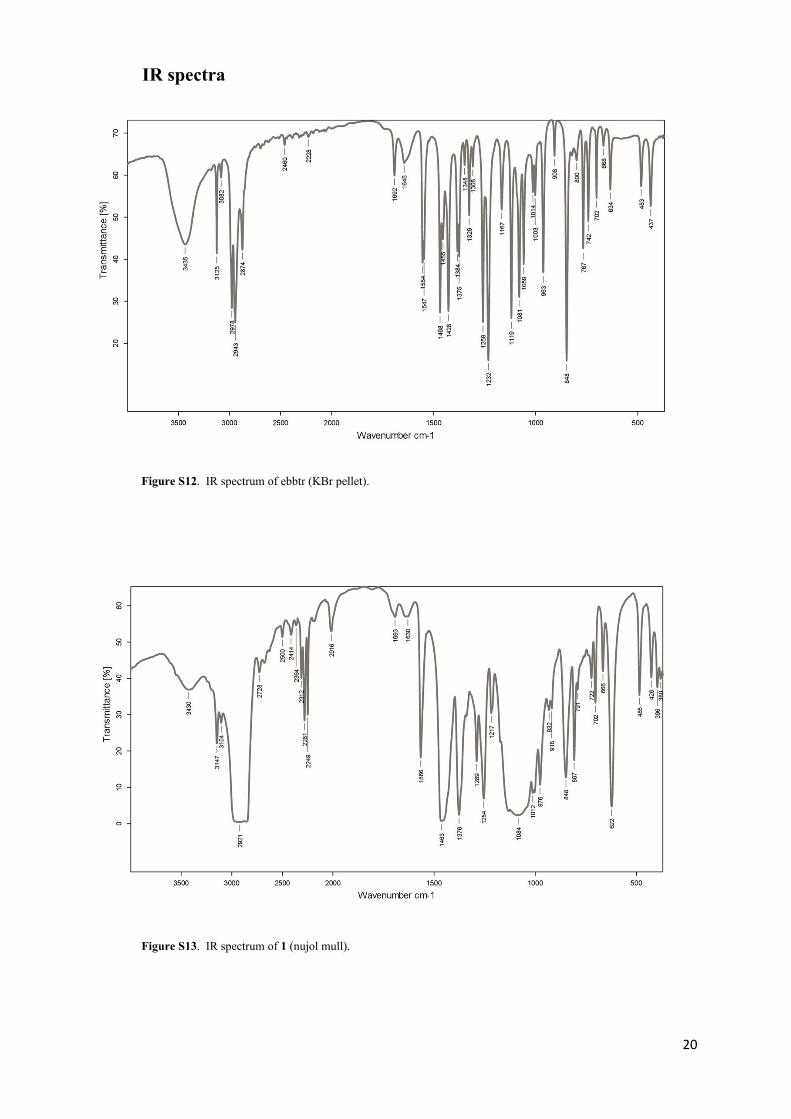
IR spectra
Figure S12. IR spectrum of ebbtr (KBr pellet).
Figure S13. IR spectrum of 1 (nujol mull).

21
DSC curves
DSC experiments carried out in the cooling mode (rates 1, 4, 10, 20 K/min) do not reveal any anomalies in DSC curves below 190 K (Fig. S14 and S15). This absence of anomalies may result from very gradual course of spin crossover below 190 K (at moderate and fast temperature scan rates) and its incompleteness up to 100 K. In the heating mode there are not observed any anomalies in the range 130 - 150 K which corresponds to (HS,LS)LS-II transition. It can be caused by a very slow process of such switching. In contrary to (HS,LS)LS-II transition, some anomalies are observed in the range 200 - 225 K corresponding to temperature range where transition from low spin to high spin form of the complex occurs (200 - 220 K).

22
Figure S14. DSC curves for 1 recoded at 1 and 4 K/min in cooling and heating mode.

23
Figure S15. DSC curves for 1 recoded at 10 and 20 K/min in cooling and heating mode. d