Electronic Supplementary Information ·
11
Electronic Supplementary Information Co-crystallized fullerene and mixed (phthalocyaninato)(porphyrinato) dysprosium double-decker SMM Hailong Wang, a Kang Qian, b Dongdong Qi, a Wei Cao, a Kang Wang, a Song Gao, b,* and Jianzhuang Jiang a,* Electronic Supplementary Material (ESI) for Chemical Science. This journal is © The Royal Society of Chemistry 2014
Transcript of Electronic Supplementary Information ·

Electronic Supplementary Information
Co-crystallized fullerene and mixed (phthalocyaninato)(porphyrinato)
dysprosium double-decker SMM
Hailong Wang,a Kang Qian,b Dongdong Qi,a Wei Cao,a Kang Wang,a Song Gao,b,*
and Jianzhuang Jianga,*
Electronic Supplementary Material (ESI) for Chemical Science.This journal is © The Royal Society of Chemistry 2014

Caption of Content
1. Figure S1. Molecular structures of 2-4 with the detailed π-π and C-H…π
interaction. Selected hydrogen atoms and all solvent molecules are omitted for clarity.
2. Figure S2. Temperature dependence of the in-phase (χ′) and out-of-phase (χ″) ac
susceptibility of 1 (A), 2 (B), 3 (C), and 4 (D) at the frequency from 10 to 997 Hz
under zero dc field.
3. Figure S3. Cole-Cole diagrams of 1 (A) and 4 (B) using the ac susceptibility data
at 3.0, 4.0, and 5.0 K under zero applied dc field.
4. Figure S4. Cole-Cole diagrams of 1 (A), 2 (B), 3 (C), and 4 (D) using the ac
susceptibility data at 5.0 K under 2000 Oe applied dc field.
5. Figure S5. Temperature dependence of χMT curves for 2-4.
6. Figure S6. The M vs. H curves for 2-4 at 2.0 K.
7. Figure S7. Packing diagram of 2-4 (A-C) with all hydrogen atoms and solvent
molecules omitted for clarity.
8. Figure S8. Mayer bond order of 1’ and 4’.
9. Table S1. Crystal data and structure refinement of complexes 2-4.

Figure S1. Molecular structures of 2-4 with the detailed C-H…π interaction. Selected
hydrogen atoms and all solvent molecules are omitted for clarity.

Figure S2. Temperature dependence of the in-phase (χ′) and out-of-phase (χ″) ac
susceptibility of 1 (A), 2 (B), 3 (C), and 4 (D) at the frequency from 10 to 997 Hz
under zero dc field.

Figure S3. Cole-Cole diagrams of 1 (A) and 4 (B) using the ac susceptibility data at
3.0, 4.0, and 5.0 K under zero applied dc field.

Figure S4. Cole-Cole diagrams of 1-4 using the ac susceptibility data at 5.0 K under
2000 Oe applied dc field.

0 50 100 150 200 250 3000
5
10
15
20
25
30
MTc
m K
mol-1
T/ K
2 3 4
Figure S5. Temperature dependence of χMT curves for 2-4.

0 1 2 3 4 5012345678
M /N
H /T
2 3 4
Figure S6. The M vs. H curves for 2-4 at 2.0 K.

Figure S7. Packing diagrams of 2-4 (A-C) with all hydrogen atoms and all solvent
molecules omitted for clarity.
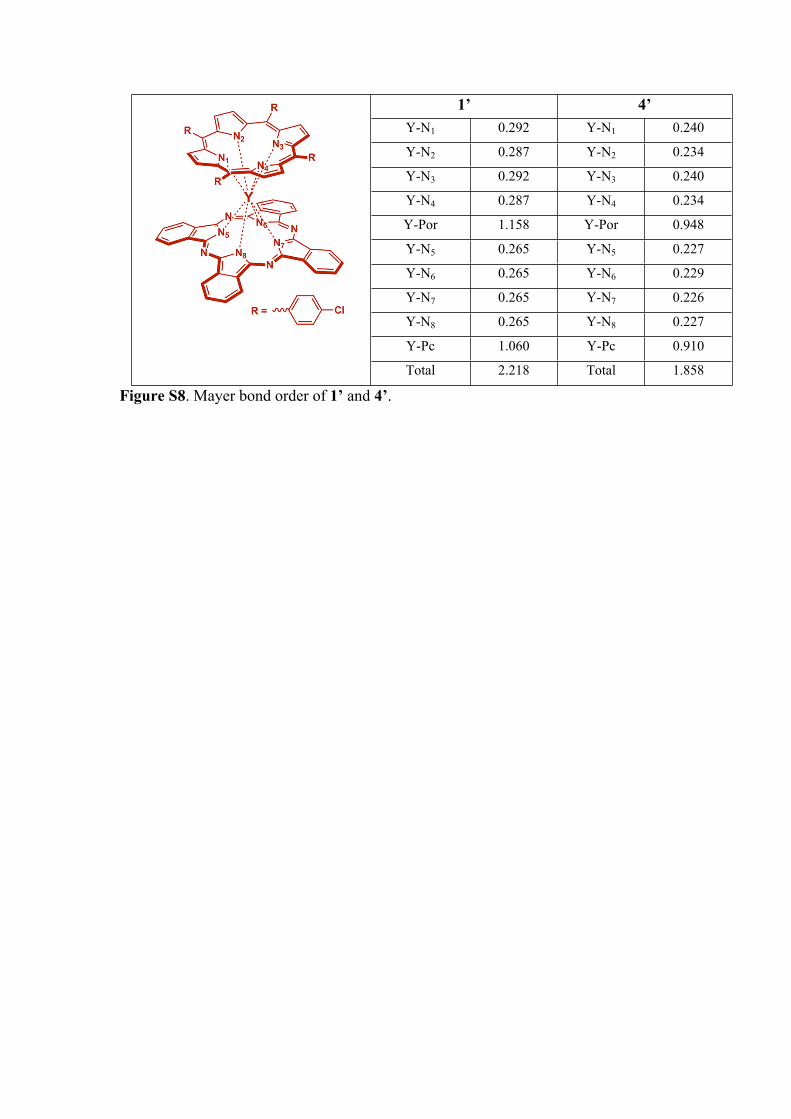
1’ 4’Y-N1 0.292 Y-N1 0.240
Y-N2 0.287 Y-N2 0.234
Y-N3 0.292 Y-N3 0.240
Y-N4 0.287 Y-N4 0.234
Y-Por 1.158 Y-Por 0.948
Y-N5 0.265 Y-N5 0.227
Y-N6 0.265 Y-N6 0.229
Y-N7 0.265 Y-N7 0.226
Y-N8 0.265 Y-N8 0.227
Y-Pc 1.060 Y-Pc 0.910
Total 2.218 Total 1.858
Figure S8. Mayer bond order of 1’ and 4’.

Table S1. Crystal data and structure refinement of complexes 2-4.complex 2 3 4Formula C217H87Cl23Dy2N24O C136H40Cl4DyN12 C220H40Cl8DyN14
F.W. 4186.59 2146.10 3324.8system monoclinic monoclinic orthorhombicspace group P21/c C2/c Pnmaa 16.6402(3) 22.5698(4) 24.7203(2)b 27.6773(7) 15.6246(2) 19.3998(2)c 39.7657(6) 24.1908(4) 28.3596(3)α 90 90 90β 90.466(2) 96.681(2) 90γ 90 90 90Z 4 4 4volume 18313.7(6) 8472.8(2) 13600.4(2)Dcald / g cm-3 1.518 1.682 1.624F000 8344 4296 6640Rint I>2θ 0.0977 0.0524 0.0936Rw2 I>2θ 0.2745 0.1268 0.2108Rint all 0.1192 0.0558 0.0960Rw2 all 0.2955 0.1312 0.2117S 1.061 1.041 1.175