Electron spin resonance study of Fe3+ and Mn2+ ions in 17-year-old nuclear-waste-glass simulants...
15
Electron spin resonance study of Fe 3+ and Mn 2+ ions in 17-year-old nuclear-waste-glass simulants containing PuO 2 with different degrees of 238 Pu substitution David L. Griscom a, ⁎, William J. Weber b a Impact Glass Research International, San Carlos, Sonora, México b Pacific Northwest National Laboratory Richland, WA 99352, USA abstract article info Article history: Received 27 August 2009 Received in revised form 4 November 2010 Available online 16 December 2010 Keywords: High level nuclear waste glasses; Electron paramagnetic resonance; Electron spin resonance; Plutonium immobilization; Radioisotope substitution; α-Recoil damage; Thermal spikes; Radiation vitrification; Speromagnetism; 238 Pu In 1982, three samples of a model nuclear waste glass, DRG-P1, P2, and P3, were prepared at Pacific Northwest National Laboratory with identical chemical compositions but respectively batched with 0.0, 0.1, and 0.9 wt.% of 238 PuO 2 (half life 87.8 years) partially replacing the 1.0 wt.% 239 PuO 2 (half life 2410 years) present in DRG-P1. In 1999, sub-samples of these three glasses were sent to the Naval Research Laboratory, where electron spin resonance (ESR) was to be used to search for self-irradiation effects due to 238 Pu α decay. However, no radiation- induced point defects associated with the aluminoborosilicate network were observed. Rather, profound α-decay-induced changes in the ESR spectra of the batched iron-group ions were found. The spectra recorded for DRG-P1 were shown by absolute spin counts to have ESR intensities equivalent to ~85% of the sum of the batched 8.28 mol% Fe 3+ and 2.79 mol% Mn 2+ , assuming that all of those ions behave as paramagnetic S =5/2 states at room temperature. (Only 1.7 mol% Ni 2+ was batched, and ion-for-ion this S = 1 specie is calculated to contribute only ~1/3 of the ESR intensity of an S = 5/2 ion.) Separate experiments and calculations ruled out the possibility of small-particle magnetite-like precipitates comprising even so much as 0.01% of the total iron. A relatively weak ESR spectral feature observed in all three of the DRG-Pn samples at g = 4.3 is the known signature of dilute Fe 3+ in glasses. By far the strongest ESR signal was found to be a broad line characterized by a first-derivative zero crossing at g = 2.06 and a peak-to-peak derivative linewidth of ~150 mT, both of which are shown to be virtually insensitive to temperature variations in the range 4.2 to 500 K and α-decay doses in the range provided by the 17-year aging of the three samples with differing 238 Pu contents. It was discovered that these broad line shapes could be accurately simulated as weighted sums of Lorentzian shape functions of differing widths but having the same g value. The absence of any measurable anisotropy in the broad line, coupled with the temperature invariance of its width, imply the existence of extremely strong exchange interactions within clusters of Fe 3+ , Fe 2+ , Mn 2+ , and Ni 2+ ions. The result is a speromagnetic system (amorphous antiferromagnet) characterized by progressive freezing out of like-ion pairs as the temperature is lowered, as opposed to exhibiting a distinct Néel temperature. Calculations that confirm this inference hinge on use of an equation previously derived by one of the authors [D.L. Griscom, V. Beltrán-López, C.I. Merzbacher, and E. Bolden, J. Non-Cryst. Solids 253 (1999) 1–22] that expresses the ESR intensity of ions behaving as non-interacting paramagnets as a function of their spin S, the spectrometer frequency ν, and the temperature T. The most evident ESR effect of 17 years of 238 Pu decay is the (irreversible) lowering of the intensity of the broad line in rough proportion to the amount of 238 Pu in the sample, with associated increases in the amplitude of the narrow g = 4.3 feature. It was additionally observed that cooling these glasses gives rise to reversible lowering of the broad-line intensity and increasing of the strength of the g =4.3 feature when compared with theoretical expectation for temperature dependence of non-interacting S=5/2 paramagnets. The ESR integrated intensity of the broad line as a function of 238 Pu α-decay dose proved to be accurately fitted by a simple saturating exponential function asymptotic to zero for infinite-time self irradiation. This result thus promises a precise means of extrapolating thousands of years into the future the process of “super vitrification” resulting from the creation and rapid quenching of “thermal spikes” due to α decay in glasses immobilizing 239 Pu or other actinide elements. In addition, because the ESR spectra of several very different candidate high-level nuclear waste (HLW) glass compositions containing even higher amounts of Fe 2 O 3 are also shown here to be decomposable into sums of pure Lorentzians, the analytical method we have devised should be applicable to these and many other HLW glasses containing both iron-group oxides and radionuclides. © 2010 Elsevier B.V. All rights reserved. Journal of Non-Crystalline Solids 357 (2011) 1437–1451 ⁎ Corresponding author. 3938 E Grant Rd #131, Tucson, AZ, 85712-2559 USA. Tel.: +1 520 829 4601. E-mail address: [email protected] (D.L. Griscom). 0022-3093/$ – see front matter © 2010 Elsevier B.V. All rights reserved. doi:10.1016/j.jnoncrysol.2010.11.017 Contents lists available at ScienceDirect Journal of Non-Crystalline Solids journal homepage: www.elsevier.com/ locate/ jnoncrysol
-
Upload
david-l-griscom -
Category
Documents
-
view
213 -
download
0
Transcript of Electron spin resonance study of Fe3+ and Mn2+ ions in 17-year-old nuclear-waste-glass simulants...

Journal of Non-Crystalline Solids 357 (2011) 1437–1451
Contents lists available at ScienceDirect
Journal of Non-Crystalline Solids
j ourna l homepage: www.e lsev ie r.com/ locate / jnoncryso l
Electron spin resonance study of Fe3+ and Mn2+ ions in 17-year-oldnuclear-waste-glass simulants containing PuO2 with different degrees of238Pu substitution
David L. Griscom a,⁎, William J. Weber b
a Impact Glass Research International, San Carlos, Sonora, Méxicob Pacific Northwest National Laboratory Richland, WA 99352, USA
⁎ Corresponding author. 3938 E Grant Rd #131, TucsoE-mail address: [email protected] (D.L. Gri
0022-3093/$ – see front matter © 2010 Elsevier B.V. Aldoi:10.1016/j.jnoncrysol.2010.11.017
a b s t r a c t
a r t i c l e i n f oArticle history:Received 27 August 2009Received in revised form 4 November 2010Available online 16 December 2010
Keywords:High level nuclear waste glasses;Electron paramagnetic resonance;Electron spin resonance;Plutonium immobilization;Radioisotope substitution;α-Recoil damage;Thermal spikes;Radiation vitrification;Speromagnetism;238Pu
In 1982, three samples of a model nuclear waste glass, DRG-P1, P2, and P3, were prepared at Pacific NorthwestNational Laboratory with identical chemical compositions but respectively batched with 0.0, 0.1, and 0.9 wt.% of238PuO2 (half life 87.8 years) partially replacing the 1.0 wt.% 239PuO2 (half life 2410 years) present in DRG-P1. In1999, sub-samples of these three glasses were sent to the Naval Research Laboratory, where electron spinresonance (ESR)was to be used to search for self-irradiation effects due to 238Puα decay. However, no radiation-induced point defects associated with the aluminoborosilicate network were observed. Rather, profoundα-decay-induced changes in the ESR spectra of the batched iron-group ionswere found. The spectra recorded forDRG-P1were shown by absolute spin counts to have ESR intensities equivalent to ~85% of the sumof the batched8.28 mol% Fe3+ and 2.79 mol% Mn2+, assuming that all of those ions behave as paramagnetic S=5/2 states atroom temperature. (Only 1.7mol% Ni2+was batched, and ion-for-ion this S=1 specie is calculated to contributeonly ~1/3 of the ESR intensity of an S=5/2 ion.) Separate experiments and calculations ruled out the possibility ofsmall-particle magnetite-like precipitates comprising even so much as 0.01% of the total iron. A relatively weakESR spectral feature observed in all three of theDRG-Pn samples at g=4.3 is theknownsignature of dilute Fe3+ inglasses. By far the strongest ESR signal was found to be a broad line characterized by a first-derivative zerocrossing at g=2.06 and a peak-to-peak derivative linewidth of ~150mT, both of which are shown to be virtuallyinsensitive to temperature variations in the range 4.2 to 500 K andα-decay doses in the range provided by the17-year aging of the three samples with differing 238Pu contents. It was discovered that these broad line shapescould be accurately simulated asweighted sums of Lorentzian shape functions of differing widths but having thesame g value. The absence of any measurable anisotropy in the broad line, coupled with the temperatureinvariance of its width, imply the existence of extremely strong exchange interactions within clusters of Fe3+,Fe2+, Mn2+, and Ni2+ ions. The result is a speromagnetic system (amorphous antiferromagnet) characterized byprogressive freezing out of like-ion pairs as the temperature is lowered, as opposed to exhibiting a distinct Néeltemperature. Calculations that confirm this inference hinge onuse of anequationpreviously derivedbyoneof theauthors [D.L. Griscom, V. Beltrán-López, C.I. Merzbacher, and E. Bolden, J. Non-Cryst. Solids 253 (1999) 1–22] thatexpresses the ESR intensity of ions behaving as non-interacting paramagnets as a function of their spin S, thespectrometer frequency ν, and the temperature T. The most evident ESR effect of 17 years of 238Pu decay is the(irreversible) lowering of the intensity of the broad line in rough proportion to the amount of 238Pu in the sample,with associated increases in the amplitude of thenarrow g=4.3 feature. It was additionally observed that coolingthese glasses gives rise to reversible lowering of the broad-line intensity and increasing of the strength of theg=4.3 feature when compared with theoretical expectation for temperature dependence of non-interacting S=5/2paramagnets. The ESR integrated intensity of the broad line as a function of 238Pu α-decay dose proved to beaccurately fitted by a simple saturating exponential function asymptotic to zero for infinite-time self irradiation.This result thus promises a precisemeans of extrapolating thousands of years into the future the process of “supervitrification” resulting from the creation and rapid quenching of “thermal spikes” due to α decay in glassesimmobilizing 239Pu or other actinide elements. In addition, because the ESR spectra of several very differentcandidate high-level nuclear waste (HLW) glass compositions containing even higher amounts of Fe2O3 are alsoshown here to be decomposable into sums of pure Lorentzians, the analyticalmethodwehave devised should beapplicable to these and many other HLW glasses containing both iron-group oxides and radionuclides.
n, AZ, 85712-2559 USA. Tel.: +1 520 829 4601.scom).
l rights reserved.
© 2010 Elsevier B.V. All rights reserved.

Table 2
n-Crystalline Solids 357 (2011) 1437–1451
1. Introduction
Measured initial isotopic compositions, initial activities, and accumulated internaldoses as of 27 July 1999 for the three reference glasses reported on in this study.Sample PuO2 content(wt.%)
Activity(Bq/g)
Dose(α-decays/g)
Dose(Gy)
DRG-P1 239PuO2 – 0.95 1.9×10⁷ 9.0×10¹⁵ 7.9×106238PuO2 – 0.00
DRG-P2 239PuO2 – 0.95 4.7×10⁸ 2.2×10¹⁷ 1.9×108238PuO2 – 0.08
DRG-P3 239PuO2 – 0.08 4.2×10⁹ 2.0×10¹⁸ 1.7×109238PuO2 – 0.77
In the United States alone there are ~100 million gallons of high-level nuclear wastes (HLW) from nuclear weapons production invarious chemical forms awaiting eventual disposal in geologic repos-itories [1], and much of these HLWs are intended to be immobilized byvitrification into borosilicate glasses (for a review, see, e.g. Ref. [2]).Vitrification of HLW from the reprocessing of spent fuel fromcommercial nuclear power reactors is also being pursued in a numberof countries [3], and vitrification may be employed in the immobiliza-tion of variouswaste streams associatedwith the advanced nuclear fuelcycle [4]. A virtue of HLW vitrification is the fact that the glass serves asan additional, non-geologic barrier to the dispersal of these radio-toxinsinto the environment. Given this goal, account must be taken of thepossible reduction of chemical durability against ground-water attackthat may result from self-irradiation of the glass by decay of thecontained radionuclides [2,5–8].
The Defense Reference Glasses (DRG) reported on here wereoriginally prepared in July 1982 to study the effect of α-radiolysis rateat the surface on glass dissolution [9] and the change in volume ofthe DRG-P3 glass [10]. In the mid-1990s, there was new interest invitrifying excess weapons plutonium [11–13], which inspired theretrieval of these samples in 1997 from the archive at the PacificNorthwest National Laboratory for characterization of the radiationdamage state from α decay [4,8,14,15]. In 1999, samples of theseglasses were sent to the Naval Research Laboratory (NRL) whereelectron spin resonance (ESR) methods were used to investigate thechanges in glass structure due to 17 years of 238Puα decay—which atthe time was equivalent to about 3600 years of α-particle and α-recoil damage by immobilized excess weapons plutonium (239Pu).While the experimental work was mostly completed in 1999, thesubsequent retirement of one of the authors (D.L.G.) from NRLdelayed a detailed analysis of the results until recently. However, theresults are still highly relevant to the behavior of already vitrifiedHLW and to future immobilization of HLW, excess plutonium, andother radionuclides from reprocessing in the advanced nuclear fuelcycle [4]. Further, the analytical methodology developed herepromises to be applicable to many otherwise-different HLW glassescontaining both iron-group oxides and radionuclides.
2. Samples
As described elsewhere [9], these glasses were originally preparedusing a glass frit representative of defensewaste glass compositions. The239Pu to 238Pu isotopic ratio in the PuO2 dopantwas varied for each glassto give different α activities. The PuO2 dopant was dissolved in nitricacid (with a small amount of hydrofluoric acid added) and mixed withthe finely crushed and sieved (b50 μm) glass frit. After drying, eachdopedglassmixturewasmeltedat1200 °C, poured into bars, and stress-
1438 D.L. Griscom, W.J. Weber / Journal of No
Table 1Chemical compositions of the DRG-Pn glasses of this study.
Oxide Mol% Wt.%
SiO2 55.66 50.6B2O3 6.65 7.0Al2O3 3.89 6.0Li2O 10.84 4.9Na2O 9.70 9.1Cs2O 0.11 0.5CaO 2.36 2.0MgO 1.15 0.7SrO 0.32 0.5Fe2O3 4.14 10.0MnO 2.79 3.0NiO 1.77 2.0PuO2 0.39 1.0U3O8 0.24 3.0
relieved at 500 °C for 1 h. Each glasswas intended to have 1.0 wt.% PuO2,and glasses DRG-P1, P2, and P3 were originally batched to contain 0.0,0.1, and 1.0 wt.% 238PuO2, respectively. Table 1 gives the nominalcomposition of the DRG-Pn glasses, while Table 2 presents their actualmeasured isotopic compositions after preparation, their initial activities,and their accumulated doses as of July 1999.
3. Experimental details
Most ESR spectra were recorded at X band (9.4 GHz) on an analogBruker ER200 spectrometer fitted with N2 flow-through glasswareused to vary sample temperatures from 100 to 490 K. However, oneset of spectra in the range 4.2 to 78 K was run on a computer-controlled Bruker ED300 spectrometer (9.5 GHz). In both cases, themagnetic field scan range was 0 to 1000 mT, the magnetic-field wasmodulated at 100 kHz, and spectra were lock-in detected andrecorded as the first derivative of absorption.
All three crucial spectra of Fig. 1, plus the sloping empty-cavitybaseline, were consecutively recorded on 9 August 1999 on the analogspectrometer under identical conditions: room temperature, micro-wave power 2.5 mW, and field modulation amplitude 0.8 mT. The gvalue of the zero crossing of the broad derivative spectrum wasdetermined with reference to a Varian strong-pitch sample having a gvalue of 2.0028 [16]. This standard sample is claimed by themanufacturer to contain (3±0.75)×1015 spin-1/2 (S=1/2) electronsper linear centimeter of sample height [16]. Absolute spin concentra-tions in the DPG-Pn glasses were calculated with reference to thisstandard sample, which in turn had been verified by comparison with
Fig. 1. X-band ESR spectra recorded consecutively on 9 August 1999 at room temperatureunder identical spectrometer conditions for virtually equal masses of candidate nuclear-waste-immobilization glasses DRG-P1, P2, and P3, of identical chemical composition(Table 1) but differing in the degree to which the α-decaying isotope 239Pu (half life2410 years) present in the batched 1.0 wt.% PuO2 had been partially replaced 17 yearsearlier by 0.00, 0.08, and 0.77 wt.% 238Pu (half life 87.8 years), respectively. The netα-decay self-irradiation doses suffered by these samples as of July 1999 are listed inTable 2. Circles indicate a pointwhere two spectra crossover andwhere a secondcrossoverwould have taken place had the scan not been stopped.

Fig. 2. X-band ESR spectra recorded for sample DRG-P1 on a single pen-recorder chart ofan analog spectrometer at a series of temperatures ranging from 320 K down to 100 K.Shown as the hollow circles is a simulation of the “broad-line” spectrum recorded at 100 K(the feature at g=4.3 is ignored) achieved by a cut-and-try procedure as a weighted sum
1439D.L. Griscom, W.J. Weber / Journal of Non-Crystalline Solids 357 (2011) 1437–1451
a precision linear standard sample of a ZrF2-based glass doped with100 ppm Mn2+ that was estimated to be accurate to ±4% [17].1 Theprecision of the relative intensitymeasurements of the three glasses tobe described below is deemed to be ±1%.
The DRG-Pn (n=1, 2, or 3) glasses of this study comprised sand-size grains summing to 51, 52, and 50 mg, respectively; and eachfilled its respective sample tube to a height of ~6 mm. In each case,this ~6-mm column was carefully centered in the microwave cavity.According to Ref. [16], 1 cm is the “effective sample length” of therectangular TE102 X-band cavity used here, “which is to say that onegets the same signal intensity from a line sample with x spins percentimeter as he would from a point sample with x spins at the centerof the cavity.” However, given that the microwave power absorptionis proportional toH1
2, where themicrowave fieldH1 varies sinusoidallyfrom zero at the top and bottom of the cavity to its maximum at thecavity center (e.g., [20]), treating these DRG-Pn samples as “pointsamples” is calculated to underestimate their spin densities by ~6%.This correction is included in all spin concentrations reported here.Other issues relating the absolute accuracy of the measured spinconcentrations will be treated in greater detail in Section 6.4.
of Lorentzian functions of different widths σ (peak-to-peak derivative) but fixed g value(=2.06). The specificweights used in this simulation are illustrated as the bar graph in theinset, where the dotted curve is a Gaussian fit to the bars.
4. Experimental results
The key experimental spectra for samples DRG-Pn, obtained underidentical experimental conditions, are shown in Fig. 1. Here we see a“broad line” with first-derivative zero crossing at g=2.06 and anamplitude that decreases with increasing 238Pu substitution in thesethen-17-year-old glasses. There is also a weaker sharp line at g=4.3,the amplitude of which increases with increasing 238Pu substitution.In Fig. 1, the spectra of DRG-P1and P2 are seen to cross one anothernear 635 mT (circled), while the spectrum of DRG-P3 appeared readyto cross both of the others near 770 mT (also circled) just before thescan was halted to avoid confusion.
Fig. 2 shows that the peak-to-peak derivative width of the broadline at g=2.06 recorded for DRG-P1 is virtually temperatureindependent from 320 K down to 100 K, whereas its peak-to-peakamplitude increases monotonically. This trend of increasing intensitywith decreasing temperature without significant line-shape variationis seen in Fig. 3 to continue in the range 78 K down to ~10 K. However,as also seen in Fig. 3, the shape and zero crossing of the broad line,which crosses zero at g=2.06 for T≥10.8 K, are noticeably alteredupon further lowering of the temperature to 4.2 K.
Otherwise, the amplitude of the line at g=4.3 increases monoton-ically, both absolutely and particularlywith respect to the amplitude of the
1 Mn2+ is an S=5/2 transition group ion, as is also Fe3+, the ion of principal interestin the present case; so ideally the present samples would have been compared directlyto this Mn2+ sample. But for reasons long since forgotten, it wasn't. However, one of us(D.L.G.) developed the mathematics for calculating relative ESR intensities as functionsof temperature T, microwave frequency ν, and spin S [18,19]. By use of Eq. (2) of Ref.[19], D.L.G. (unpublished) has shown the precision Mn2+-doped glass sample of Ref.[17] to agree within 6% with the particular Varian strong-pitch reference used in thepresent experiment (implying the latter is far more accurate than the ±25% claimed in[16]). Ironically, the rigorous formula of Ref. [18] was published eight years before thepublication of Ref. [17], yet it was not used in Ref. [17] (likely because the onlyprogramming of this complex formula was on a memory card for a hand calculatorthat no longer functioned). Rather, a commonly used approximate relationship [20]between the specific ESR absorption intensities of S=5/2 and S=1/2 species wasemployed instead, leading to the erroneous conclusion in Ref. [17] that the very sameVarian strong-pitch sample must contain only 67% of the claimed number of spins.Fortunately, this error did not affect any of the conclusions of Ref. [17], since thequantities of (S=5/2) Fe3+ reported there were determined by direct comparisonwith the precision (S=5/2) Mn2+ sample especially created for that purpose.Nevertheless, this bizarre episode emphasizes the importance of using the formalismfirst reported in Ref. [18] – and elaborated in more useful detail in Ref. [19] –wheneverthe need may arise to precisely determine spin concentrations of paramagneticspecies with spin SN1/2 by comparing their integrated ESR intensities with that of thewidely used S=1/2 Varian pitch standard sample.
broad line at g=2.06, as the temperature is lowered over the entirerange from 320 K to 4.2 K.
5. Line shape analyses
5.1. The broad line centered at g=2.06
In Fig. 2, the small open circles represent a simulation of the broadline recorded for DRG-P1 at 100 K performed as a sum of broadLorentzian functions, each characterized by a g value of 2.06, but havingdiffering linewidths weighted according to a quasi-bell-shaped distri-bution function (inset) determined by a “cut-and-try” procedure to bedescribed in greater detail below. The dotted curve in the inset is aGaussian fit to the empirically-determined weighting factors repre-sented by the bar graph. Each simulation took into account the slopingbaseline recorded in Fig. 1, presuming it to be a spurious addition to allspectra recorded under these conditions. Therefore, the same slopingbaseline was added to each Lorentzian component of each simulationbefore comparing the sum of these component Lorentzians with thecorresponding experimental spectrum.
Fig. 3. X-band ESR spectra recorded digitally on a computer-driven spectrometer forsample DRG-P1 at a sequence of temperatures from 78 K down to 4.2 K. For reasonsdescribed in Section 6.1, the raw spectra were translated vertically by various amounts toforce each one to begin with zero amplitude at zero field. The shaded vertical arrows callattention to a qualitativedifferencebetween the spectrumrecordedat 4.2 K andall the rest.

Fig. 4. Depiction of a calculated “super-broad” Lorentzian ESR spectrum. (a) The trueabsorption curve (thick unbroken curve) is seen to comprise the sum of one “classical”Lorentzian function calculated as per Eq. (1) centered on the positive magnetic-fieldaxis (thin unbroken curve) and its “mirror image” centered on the negative field axis(thin dashed curve). (b) The true first-derivative curve (thick unbroken curve) issimilarly comprised of a Lorentzian first-derivative curve calculated as per Eq. (2)centered on the positive field axis and its “mirror image” on the negative field axis. Notethat the true first-derivative curve passes through zero at zero field.
3 Here (and in other publications by D.L.G.) the convention that is used is to displaythe ESR first-derivative curve beginning at the lowest scanned value of magnetic fieldon the x axis, Hmin, as a zero or positive quantity on the y axis. Thus, for a single-peakedresonance line, the magnitude of this first derivative initially increases as the magneticfield strength increases above Hmin, passes through zero at the field value H0
coincident with the position of the peak of the absorption curve, and becomes negative
1440 D.L. Griscom, W.J. Weber / Journal of Non-Crystalline Solids 357 (2011) 1437–1451
5.2. The narrow line at g=4.3
The asymmetric line at g=4.3 in Figs. 1–3 has long been knownto comprise the most intense feature of isolated (i.e., weakly-interacting) Fe3+ ions in glasses and was shown by Castner et al.[21] to arise from a large orthorhombic fine-structure splitting (seeRef. [22] for a condensed overview of relevant ESR theory). A distinctshoulder at g=9.7 was also predicted [21] and has been frequentlyseen, whereas two weaker features also predicted in Ref. [21] atg=0.87 and 0.61 are rarely reported. In fact, g values of 1.31 and 1.01were reported in Ref. [23], where their originwas shown to be due to adeviation from the case extreme orthorhombic symmetry treated inRef. [21]. However, Castner et al. [21] also exhibited an experimentalspectrum of an Fe3+-doped silicate glass which includes anasymmetric feature near g=2, which is not predicted by either model.
There exists a free computer program [24] suitable for rigoroussimulation of all ESR spectral features arising fromweakly-interactingFe3+ ions in glasses, including but not limited to the situations treatedin Refs. [21] and [23] (both of which pertain to special cases where thecrystal-field splittings greatly exceed the Zeeman energy [21–23]).We have not yet found the time to employ this program but hope thereader will.
Nevertheless, in the present case the intensity of the isolated-Fe3+
spectrum at g=4.3 is quite weak in comparison to the broad line, atleast when recorded at temperatures of 100 K and above. Therefore,neglect of the g=4.3 signal (and the still-weaker features associatedwith it) is tentatively regarded as having a negligible effect on the spinconcentrations determined in this temperature range by simulating thebroad g=2.06 line alone (e.g., the small circles in Fig. 2). Conversely,however, it will be demonstrated in Section 7.2 that spectral contribu-tions of weakly-interacting Fe3+ ions near g=2.0 (reported by Castneret al. but not accounted for by their theory [21]) do perturb oursimulations of the shape of the broad line to a noticeable degree.
6. Quantitative ESR intensity analyses
6.1. Issues that must be understood from the beginning
In order to correctly determine and interpret the ESR intensities ofthe spectra illustrated in Figs. 1–3, the natures of extremely broad ESRlines with statistical shapes (generally composed of Gaussians orLorentzians) need to be better understood than one typically learns intextbooks. Most importantly, it must be recognized that anystatistically determined quantity can be represented by its probabilityof occurrence plotted on the y axis versus its physically measurablevariable plotted on the x axis. Therefore, in instances when themeasured quantity is insensitive to the algebraic sign of the physicalvariable, the probability (which is always a positive number) must bean even function of that physical variable. This principle applies to thepresent case,2 where the measurable quantity is paramagnetic ESRabsorption and the physical variable is the magnitude of an appliedmagnetic field, H — which can be made positive or negative withoutchanging the magnitude of the absorption of microwaves.
Thus, for Lorentzian linewidths comparable to, or broader than, themagnetic field value of the absorption peak, the correct ESR line shapemust always be treated as the sum of a textbook Lorentzian functioncorrectly centered at +H0 on the positive magnetic-field scale axis(Fig. 4(a) thin solid curve) and its “mirror image” centered at −H0 onthe negative extension of this magnetic field axis (Fig. 4(a) thindashed curve). Hence, in the example of Fig. 4(a), the thick unbrokencurve representing the sum of the positive-axis Lorentzian and its
2 This principle does not apply in the case of ESR absorption by precipitated ferro- orferri-magnetic particles, which when present in multi-domain sizes typically give riseto hysteretic absorption, manifested near zero field when the spectrum is scanned asecond time after an initial scan to a sufficiently high value of H [25].
negative-axis “mirror image” is the correct line shape to be expectedexperimentally. In fact, it is this line shape that must be integrated (atleast in one half-space) to obtain the ESR intensity as the area underthe absorption curve. There is only one way to perform this integralcorrectly, and many ways to botch the job (see Appendix A).
The first derivative curves corresponding to the absorption curvesof Fig. 4(a) are shown in Fig. 4(b). Note that the correct first-derivativecurve to be expected experimentally for this situation (Fig. 4(b) thickunbroken curve) is an odd function of the magnetic field, i.e., thederivative amplitude passes through zero when the applied field isincreased from negative magnetic field values to zero field andonward to positive values of H.3
Of course, there is no point in recording a paramagnetic resonancespectrumbeginning at themaximum negative laboratoryfield, scanning
at all higher fields. Any spectrum can be recorded in this way by suitable adjustment ofthe lock-in amplifier. Thus, this convention is purely the investigator's choice, and nophysics is lost no matter which convention he/she chooses. However, in cases of morecomplicated spectra, the reader's ability to comprehend a spectrum shown in a figurecan be compromised if the author fails to adhere to a consistent convention.

Fig. 5. The same room-temperature ESR spectra as shown in Fig. 1 are reproduced herewith superimposed computer simulations comprising weighted sums of super-broad
1441D.L. Griscom, W.J. Weber / Journal of Non-Crystalline Solids 357 (2011) 1437–1451
through zero field, and then up to the maximum positive field, since(barring the presence of ferri- or ferromagnetic particles, footnote 2)weknow that they are related by mirror symmetry. However, in caseswhere one is uncertain of the baseline of a very broad spectrum, the factthat all first-derivative curves of pure Lorentzian (or pure Gaussian)shapes pass through zero at zero field can be used as a guide post. In thepresent case,we see that the temperaturedependence of the broadfirst-derivative spectra in Fig. 2 appears to be confined mainly to its overallamplitude (its shape resting virtually invariant). And at all temperaturesthis spectrumemanates froma commonpoint at zerofield, which is exactlywhat is expected when a spectrum is comprised of pure Lorentzians.4
The common shapes and “baseline zeros”of all spectra of Figs. 1 and 2–when combined with the successful fit of the 100-K spectrum as a sumof Lorentzian functions of differingwidths but having identical derivativezero crossings (circled in Fig. 2, where it corresponds also to the g value of2.06 that was used for each simulation) – implies that the ESR signaturesof the unpaired spins giving rise to these spectra are likely determined byLorentzian broadening alone, with negligible or zero contributions fromthe usual spin-Hamiltonian anisotropies (see Section 9.2).
By contrast, regarding the raw spectrum recorded at 78 K on thecomputer-driven spectrometer (not shown), the first-derivative spec-trumbegan at a positive (non-zero) y-axis value at zero field (H=0, thebeginning point of the scan), and each spectrum subsequently recordedat a still lower temperature began at a still higher positive y-axis valueat zero field. On the assumption that these were rigid shifts that tookplace in step-like fashion from spectrum to spectrum (presumablysomehow related to the temperature change), itwasdecided to subtractfrom each digitized raw spectrum a field-independent (horizontal)baseline equal the corresponding y-axis zero-field value of the rawspectrum, in order to match the prediction of Fig. 4(b). These digitally-recorded spectra after making this rigid-shift correction are displayed inFig. 3, where they show excellent consistency with the as-recordeddrift-free analog spectra of Fig. 2.
6.2. Fitting the experimental spectra with Lorentzian functions
The Lorentzian function, normalized to unit area for all values ofthe parameters is given by (e.g., Ref. [26])
F H−H0ð Þ = 1=π 2=σLð Þ2=σLð Þ2 H−H0ð Þ2 + 1
; ð1Þ
where H is the applied magnetic field, H0 is the field value of thecenter of this symmetric “bell curve,” and σL is its half width at halfmaximum. The first derivative of Eq. (1) is given by
dF H−H0ð ÞdH
= −2=πd 2=σLð Þ3d H−H0ð Þ2=σLð Þ2 H−H0ð Þ2 + 1
� � : ð2Þ
The “peak-to-peak” width separating the positive and negativefirst-derivative peaks (which is easily measured in ESR) is given by[26]
σ peak� to� peak derivativeð Þ = σL =ffiffiffi3
p: ð3Þ
The linewidths shown on the abscissa of the bar-chart insert ofFig. 2, and all similar charts appearing in subsequent figures, are peak-to-peak derivative widths as defined by Eq. (3).
A spreadsheet was set up to calculate the first derivatives ofLorentzian functions of different widths. When it became apparentthat no single Lorentzian was capable of fitting any of the broad-line
4 In Fig. 2, all spectra actually emanate from a point ~7 mT greater than zero, but thisis certainly due to hysteresis in the laboratory electromagnet and can be neglected.Thus, the Lorentzian fits performed here all pass through zero at exactly H=0,ignoring the spectrometer's inability to reach there.
(g=2.06) spectra of Figs. 1–3, a system was set up to fit the threeroom-temperature spectra of Fig. 1 (and also 100-K spectrum ofFig. 2) as linear combinations of Lorentzian first-derivative curves,determined from Eq. (2) by using a fixed g value of 2.06 and steppedvalues of σ (peak-to-peak derivative), taking care to include the“mirror image” of each of these component Lorentzian functions asper Fig. 4(b). Steps of 50 mT were selected, and the results ofdifferently weighted linear combinations of these curves were testedby direct comparison with the experimental spectra, after adding thesloping baseline correction to each member of the constellation ofLorentzian component simulations.
The final results for fitting the room temperature spectra of Fig. 1are shown in Fig. 5. The most stunning result is the qualitativedifference between the Lorentzian linewidth distribution that best fitDRG-P3 and those that best fit DRG-P1 and P2. That is, the broad, quasiGaussian distributions of Lorentzian linewidths that best fit DRG-P1and P2 are seen in Fig. 5 not to apply to DRG-P3, which was fit insteadby three very narrow peaks (for better viewing, the overlapping barcharts of Fig. 5 are reproduced separately in Fig. 6). An almost-as-goodfit for DRG-P3 was obtained by slight broadening of the two principalpeaks for DRG-P3, so it is by no means certain that the true spectrumis dominated by perfect delta functions. Nevertheless, what is certainis that the 17-year results from the decays of the 0.3 mol% 238Pucontained in DRG-P3 has caused the broad distribution of Lorentzianlinewidths peaking at σ (peak-to-peak derivative)=350 mT thatcharacterizes the ESR broad line of the as-fabricated DRG-P1 glass(and presumably also characterized as-manufactured DRG-P317 years earlier) to bifurcate into two relatively narrow componentsat σ (peak-to-peak derivative) values ~300 and ~950 mT, plus a muchweaker one at ~100 mT (which may be spurious; see Section 7.3).
6.3. Comparison to other candidate HLW glasses with high ferric-ironcontents
Fig. 7 presents the room-temperature ESR spectra recorded for a pairof identically batched binary iron-phosphate glasses of molar compo-sition 40Fe2O3–60P2O5 (also candidate glasses for Pu immobilization),whichweremelted at different temperatures and under different redoxconditions, as described in Ref. [27]. The open circles represent the first-ever attempts to fit these previously published spectra [27] asweightedsums of pure Lorentzian derivative curves, achieved here by cut-and-trymethods. The distributions yielding the fits illustrated in Fig. 7 areshown as the inset bar graphs. For reference, the small black squares in
Lorentzian first-derivative curves of the type shown in Fig. 4(b); (features at g=4.3 dueto isolated Fe3+ ions are deliberately ignored). These simulations were accomplishedby a cut-and-try process which iterated to the weighting factors shown in the inset. Thesamples containing 0.77 wt.%, 0.08 wt.%, and 0 wt.% 238Pu are denoted DRG-P3, DRG-P2,and DRG-P1, respectively.

Fig. 7. X-band ESR first-derivative spectra recorded at room temperature for twoidentically batched binary iron phosphate glasses of composition 40Fe2O3–60P2O5
subjected to very different melting temperatures and atmospheres originally publishedinRef. [27]. Thehollowcircles arenever-before-published line-shape simulationsbasedonweighted sums of super-broad Lorentzian functions specified by the respectively inset bargraphs. For comparison, the small solid squares in both of these insets represent thedistribution that optimized the simulation of the spectrum of DRG-P1 at 100 K (Fig. 2).
Fig. 6. The bar charts from the inset in Fig. 5 are reproduced here as separate graphs. Thesebarsdisplay theweighting factors determined by cut-and-tryfitting ofmultiple Lorentzianfirst-derivative curves to the spectra of Fig. 5 recorded at room temperature for then-17-year-old samples containing (a) 0.00 wt.%, (b) 0.08 wt.%, and (c) 0.77 wt.% 238Pu. Forcomparison purposes, the small solid squares in (a) recapitulate the distribution ofLorentzian linewidths of Fig. 2, which optimized the fit of the spectrum of this samesample, DRG-P1, recorded at 100 K. The small open squares in (b) simply recapitulate thebar chart of (a), again for comparison purposes.
5 Clearly, even better accuracy is possible by using the known integrals to infinity of theLorentzian functions used to perform the present fits. Therefore, we took the normalizedLorentzian function corresponding to each 50-mT step and determined the fractional partof its total integral obtained by integratingmerely from−2000mT to zero. Inverting thesenumbers gave the correction factors to extrapolate to infinity each integral that we hadperformed from −2000 mT to zero. We then applied these factors to calculate averagecorrections to the bar graphs of Fig. 6(a), (b), and (c), representing DRG-P1, P2, and P3,respectively, leading to multiplicative correction factors of 1.103, 1.105, and 1.171, whichwe applied to the −2000-mT-to-zero integrations of the spectra of DRG-P1, P2, and P3,respectively. However, this potential increase in accuracy is offset by the fact that thespectrum of the Varian of the strong-pitch sample [16] (to which these determinationswere compared) was itself integrated out to 4 peak-to-peak derivative widths but, due tothe fact that its line shape isneither pure Lorentziannor pureGaussian [16], the amount bywhich it was underestimated by not integrating to infinity, though surely small, has notbeen estimated.
1442 D.L. Griscom, W.J. Weber / Journal of Non-Crystalline Solids 357 (2011) 1437–1451
both of these insets recapitulate the distribution of linewidths that bestfit the spectrum of DRG-P1 at 100 K (Fig. 2).
It can be seen that the 40Fe2O3–60P2O5 glass of Fig. 7(a) has aboutthe same distribution of Lorentzian widths as that of DRG-P1 butnearly double its central value. Conversely, the very differently melted[27] 40Fe2O3–60P2O5 glass of Fig. 7(b) has amuchnarrower distributionwidth than DRG-P1, but shares very nearly the same central value.
Notably, however, both fits of Fig. 7 were carried out usingg=2.00, in contrast with the use of g=2.06 in the fits of the DRG-Pnsamples of Figs. 2 and 5.
6.4. Determinations of spin concentrations by numerical integration ofthe Lorentzian fits
The spin concentrations of greatest interest to this study are those oftheDRG-P1, P2, and P3 glasses recorded on the same chart on the analogspectrometer. Normally, this measurement would require manuallydigitizing these spectra, which was indeed done. However, becausethese spectra have now been fitted as weighted sums of Lorentzians,the fits are already digitized on the spread sheets where they werecreated. Therefore, the simulations themselves canbe doubly integrated.
But there is one more twist. Ordinarily, the conservative way tointegrate a very broad spectrum is to begin at the highest magnitudemagnetic field value reached in the experiment, |Hmax|, andintegrate the first derivative back to zero field to obtain the absorption
curve, and then integrate the area under this absorption curve toobtain a number proportional to the spin concentration (providedthat the baseline is known and both the first and second integrals areperformed correctly; see Appendix A). This procedure neglectspossible – but often likely – intensity at still higher fields thanexperimentally reached, on the normally valid grounds that theresearcher usually has no basis to speculate on what the spectrumlooks like at higher fields. But in the present case, it is clear that theintensity at higher fields contains at least the high-field tails of theLorentzians used to fit the experimentally recorded parts of the spectra.
To appreciate the importance of this insight, the reader is directedto Fig. 8, where the first integral of experimental room-temperaturefirst-derivative spectrum of DRG-P1 (same as the 0.00% 238Puspectrum of Figs. 1 and 5) is shown as integrated in the conventionalway from −1000 mT (= −|Hmax|) to zero field (open circles). Thecontinuous curve nearly coincident with open circles represents thefirst integral of our best-fit Lorentzian first-derivative spectrum forDRG-P1, also begun at−1000 mT. Additionally shown in this figure isthe first integral of the very same best-fit Lorentzian first-derivativesimulation for DRG-P1, but this time integrated from −2000 mT tozero field. The area under the latter was determined to be 1.315 timesgreater than the virtually identical areas under the first two curvesand is surely far more accurate.5

Fig. 8. Numerical integration of the first-derivative ESR spectrum of sample DRG-P1recorded at room-temperature (open circles), comparedwith numerical integrations ofthe best-fit Lorentzian simulation of this spectrum (see Figs. 5 and 6) integratedfrom −1000 mT to zero (continuous curve underlying the circles) and alsofrom −2000 mT to zero (upper continuous curve). The area under the latter curve is1.315 times greater than that under the former and represents a more accuratedetermination of the actual experimental ESR absorption, the recording of which wasinstrumentally constrained to extend only from 1000 mT to zero (see Section 6.4).
Fig. 9. X-band (ν=9.4 GHz) ESR intensity curves as functions of temperature for non-interacting S=1/2 and S=5/2 paramagnetic species (continuous curves) and non-interacting small spherical particles of magnetite of diameters d (dashed curves). All ofthese curves were calculated by means of Eq. (2) of Ref. [19] and are normalized tounity at 0 K.
1443D.L. Griscom, W.J. Weber / Journal of Non-Crystalline Solids 357 (2011) 1437–1451
Supposing for the sake of argument that the only ions contributingto the broad lines of the DRG-Pn glasses are non-interacting Fe3+ andMn2+
, we used Eq. (2) of Ref. [19] to calculate how many of theseof S=5/2 ions there appears to be in DRG-P1, by comparing itsintegrated room-temperature ESR intensity with that of our (S=1/2)Varian strong-pitch standard sample. In the first approximation, weused the area under the simulation in Fig. 8 beginning at −1000 mT,leading to a value of 7.38 wt.% for the amount of Fe2O3 necessary toproduce this integrated ESR intensity (assuming for the sake ofargument that all iron ions are trivalent and paramagnetic). Thenmultiplying this number by the factor of 1.315 relating the area underthe successful multi-Lorentzian curve fit extended to −2000 mT inFig. 8 to the area under the same fit restricted to beginning at −1000mT yields a more accurate value of 9.7 wt.%. Next multiplying thisnumber by the “point-sample” correction (Section 3) raises the resultto 10.3 wt.%, and finally multiplying again by the extrapolated-to-infinity factor of 1.103 (footnote 5) yields 11.3 wt.% Fe2O3 — only 13%larger than the originally batched Fe2O3 content of the DRG-P glasses(10.0 wt.%) but not nearly enough to also account for the batchedMnO (see discussion in Section 9). Moreover, up to this point we havenot ruled out the possibility of a significant part of the ESR intensity ofDRG-P1 being due to precipitated ferrimagnetic particles, an impor-tant issue that will be addressed in Section 7.
7. Temperature dependencies of ESR (and FMR) intensities andline shapes
7.1. Paramagnetic, paramagnetic-plus-ferrimagnetic-precipitates, orsperomagnetic?
Small particles of ferro- or ferri-magnetic materials are capable ofproducing room-temperature ESR signals that are much stronger thanthose due to an equivalent number of the same species behavingparamagnetically [18,19,28,29]. Perhaps the most common ferrimag-netic mineral known to precipitate in glasses is magnetite, Fe3O4 —
which can be discriminated from the most common ferromagneticprecipitate, metallic iron, on the basis of differences the temperaturedependencies of their line shapes, linewidths, and integratedintensities [18,19,28,29]. When such particles are studied by ESR,the experiment is termed ferromagnetic resonance, or FMR.
Magnetite is a mineral having the spinel structure and containingboth Fe3+ and Fe2+ ions, with all Fe3+ being one-for-one antiferro-magnetically aligned, leaving the Fe2+ responsible for the ferrimag-netism (e.g., [30,31]). It turns out that Eq. (2) of Ref. [19] can also beused to quantify the temperature dependence of the FMR intensity ofsmall, non-interacting particles of magnetite or other magneticminerals for any particle diameter d, by first calculating [19] theeffective spin value J (generally JNNS=5/2) pertaining to each trialparticle size of the suspected mineral, utilizing its known number ofBohr magnetons per formula unit in the bulk.
Fig. 9 compares the theoretical temperature dependencies of theintensities (normalized to 1.0 at T=0 K) of (i) non-interacting S=1/2states, (ii) non-interacting S=5/2 states (as for isolated Fe3+ orMn2+),and (iii) small spherical particles ofmagnetite (Fe3O4) for several valuesof d. Note that a hypothetical groupof isolated S=5/2 Fe3+ ions selectedas having the same ESR intensity at T=0 as a 10-nmmagnetite particle,would display a room-temperature intensity ~700 times weaker thanthat magnetite particle. Yet, if no temperature dependence study wereto be performed, it is conceivable that one could be mistaken for theother if, as is frequently true (e.g., [18,19,28,29]), their line shapes andwidths should be similar.
In Fig. 10, the g=2.06 “broad-line” amplitudes for DRG-P1 (opencircles) and DRG-P3 (solid circles) are fit for temperatures N100 K as99.93 mol% isolated S=5/2 states, 0.066 mol% 10-nm magnetite and99.86 mol% isolated S=5/2 states, 0.14 mol% 10-nm magnetite,respectively. However, if these fits were truly meaningful, dataacquired at still lower temperatures would follow the fitted curves(the thin dashed curves passing through the points and effectivelymerging with thick continuous curve near 20 K). But they do not. Infact, the numerically integrated spectra for DRG-P1 obtained from 78 Kdown to 4.2 K (circles with dot in center, which have been “grafted”onto the amplitude data for 100 K and higher) clearly deviate belowthe thick curve representing the 99.93% isolated S=5/2 statespertaining to the tested DRG-P1 model for Tb50 K.
Accordingly, the very same data for DRG-P1 and DRG-P3 have beenre-plotted (this time on a linear-linear scale) in Fig. 11 in a way thatsupposes that all data approach the idealized curve for non-interactingS=5/2 states at the highest temperatures but fall below this curve as the

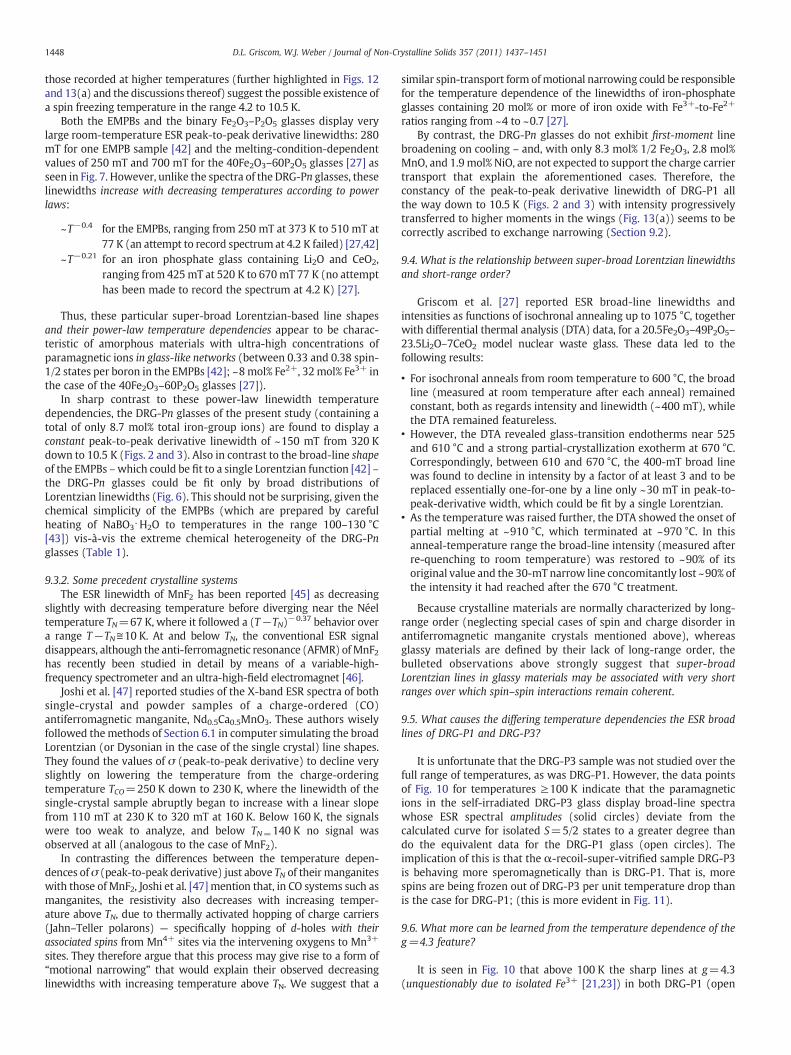
Fig. 10. Temperature dependent ESR intensity data for samples DRG-P1 (open symbols)and DRG-P3 (solid symbols) are shown in relation to the theoretical curve for non-interacting S=5/2 paramagnetic species normalized to unity at absolute zero (thickblack line). Because no data could be taken at absolute zero, each data set can bearbitrarily translated up or down on this semi-log plot in search of a possible fit. Herethe “broad-line” amplitude data acquired for temperatures ≥100 K (solid and opencircles), have been matched to the thin dashed curves, which represent linearcombinations of the normalized theoretical curve for non-interacting S=5/2 stateswith tiny admixtures of the theoretical curve for 10-nm magnetite (see Fig. 9). Asdescribed in Section 7.1, the success of these fits proves to be accidental. The broad-lineintensities determined by double numerical integration of DRG-P1 spectra acquiredbelow 100 K (open circles with dots) are here “grafted” onto the correspondingamplitude data for T≥100 K (open circles). Because the g=4.3 feature is known forcertain to arise from isolated (S=5/2) Fe3+ ions [21,23], the solid and open squarescannot be attributed to 3-nm magnetite particles [19], despite their sharing similarslopes on this plot. On the other hand, the g=4.3 data do not fit prediction for isolatedFe3+ ions either (see Section 9.6 for the likely reason why they don't).
Fig. 11. The “broad-line” data of Fig. 10 are replotted on this linear–linear graph withdifferent trial registrations with respect to the curve labeled “isolated S=5/2 states.”These registrations are chosen to illustrate the authors' interpretation of these data asarising from clusters of (mostly S=5/2) ions behaving speromagnetically — whichmeans they behave as isolated paramagnetic ions at sufficiently high temperatures, butprogressively lose intensity to antiferromagnetic ordering as the temperature islowered. The gray area represents this lost intensity, under the unproven assumptionthat 425 K (where the data and theory are merged in this figure) is a “sufficiently hightemperature” to overcome most antiferromagnetic ordering. As in Fig. 10, the curvelabeled isolated S=5/2 states was calculated by means of Eq. (2) of Ref. [19] and isalways normalized to 1.0 on the y axis at T=0.
Fig. 12. Amplitudes of the “broad line” and the g=4.3 feature, plus the overallintegrated ESR intensities determined for the DRG-P1 ESR spectra of Fig. 3, have beenseparately divided by the theoretical X-band (ν=9.4 Ghz) ESR intensity of non-interacting S=5/2 paramagnetic states [19] corresponding to each measurementtemperature T. These data-to-theory ratios were then plotted versus temperature afterrenormalizing each curve to unity at the lowest experimental temperature, 4.2 K.Plotted in this way, ESR intensity data for totally non-interacting S=5/2 ions wouldfollow perfectly horizontal lines. Therefore, the concave-downward curvatures of thebroad-line amplitude-to-theory ratio (open squares) and the overall (broad-line plusg=4.3) integrated intensity-to-theory ratio (small solid squares) are here interpretedas representing ever-accelerating rate of antiferromagnetic ordering per unittemperature step as the temperature is lowered from 78 K to 4.2 K. By contrast, theamplitude-to-theory ratio of the g=4.3 line (large solid circles) is nearly temperatureindependent, showing this feature to truly arise from weakly-interacting Fe3+ ions, atleast from 78 K down to 10.8 K.
1444 D.L. Griscom, W.J. Weber / Journal of Non-Crystalline Solids 357 (2011) 1437–1451
temperature is lowered, presumably due to progressively increasingantiferromagnetic couplingof spins (termed speromagnetism[32,33])—as contrastedwith crystalline antiferromagnets that are characterized bywell-defined Curie temperatures (e.g., [30]). The gray shaded area inFig. 11 calls attention to the degree to which the experimental data forDRG-P1 (open circles) are depressed below the ideal case of non-interacting S=5/2 states in this model.
To further test this model in a way that avoids “grafting” togetherdifferently obtained data in different temperature ranges, only thespectra consecutively obtained at 78 K or lower (see Fig. 3) wereconsidered in doing the following: For each temperature, measure-ments were made of (a) the g=2.06 “broad-line” amplitude, (b) theg=4.3 “sharp line” amplitude, and (c) the overall numericallyintegrated intensity. Each of these three quantities was then dividedby the non-interacting-S=5/2-state ESR-intensity calculation [19]pertinent to the corresponding measurement temperature and the(fixed) microwave frequency, and the results were plotted as shownin Fig. 12 (where they have been arbitrarily normalized to unity at4.2 K). By construction, these data reveal the ratio of the experimentaltemperature dependence to the calculated temperature dependenceof non-interacting S=5/2 states — which in the limit of perfectagreement would be a horizontal line in each case.
From inspection of the actual data points in Fig. 12, we infer thateach curve can be, and likely is, asymptotic to a horizontal line athigher temperatures, though we do not know the exact positions ofthese asymptotes. Thus, as in Fig. 11, the gray shaded area in Fig. 12 isproportional to the numbers of (presumed S=5/2) paramagneticstates extant at high temperature that are progressively pair-wise
removed by antiferromagnetic ordering as the temperature islowered. (The particular gray shaded area shown here is referencedto the open squares and assumes that the asymptote appropriate tothese particular data lies at or above 6.5 on the y axis.)

Fig. 13. (a) Subtraction spectrum (noisy unbroken curve) developed from the spectra ofFig. 3 as described in Section 7.2. The small circles constitute a simulation of the broadparts of this spectrum as a weighted sum of Lorentzian first-derivative functions. Thedifference between the subtraction spectrum and the simulation is inferred to arisefrom weakly-interacting Fe3+ ions — including the shaded asymmetric feature nearg=2.0 (see Section 7.2). (b) ESR spectrum of a 65-million-year-old impact glass fromHaiti created by the asteroidal impact believed to have caused the extinction of thedinosaurs (see Ref. [19]); this spectrum arises largely from weakly-interacting Fe3+
ions, although Mn2+ likely contributes to the part near g=2.0 [19]. (c) A different sub-sample of the material of (b) which has been shown to contain 3-nm magnetiteprecipitates [19]; (ESR intensity versus temperature data for this sample are illustratedin Fig. 10).
1445D.L. Griscom, W.J. Weber / Journal of Non-Crystalline Solids 357 (2011) 1437–1451
Not surprisingly, the overall integrated intensity plotted in this way(small solid squares) falls between the curves for the amplitudes of thetwo spectral components that it fully subsumes. Within the accuracy ofusing the g=4.3 amplitude to represent its spin concentration, thispresumed weakly-interacting-Fe3+ signal is seen in Fig. 12 (solidcircles) to obey the non-interacting S=5/2 theory rather well between10 K and 78 K (i.e., a horizontal line lying between ~1.4 and 1.5 on the yaxis). By contrast, the broad-line amplitude and the total integratedintensity both fall away from the non-interacting-S=5/2 behavior (thepresumed horizontal line asymptotes at high temperature) withincreasing rapidity as the temperature is lowered toward 4.2 K.Therefore it is reasonably concluded that the “broad line” recorded forDRG-P1 is behaving speromagnetically and that there is negligible(indeed, most likely zero) contribution of precipitated magnetiteparticles to these spectra.
7.2. Is there an asymmetric g=2.0 line associated with the g=4.3 line?
There is abounding, if anecdotal, evidence that the g=4.3 featuredue to Fe3+ in glasses may be generally associated with anasymmetric signal of sample-dependent shape and amplitude nearg=2.0 (e.g., [17,19,21,34,35]). The true nature of this line will not befully understood until computer line-shape simulations are per-formed (likely using the software developed in [24]) to rigorouslydetermine the distributions and magnitudes of the axial andorthorhombic fine-structure terms in the spin Hamiltonian respon-sible for the observed combinations of spectral features (for theory ofESR in crystals see, e.g., [36,37] or for glasses see Refs. [22,38]).However, it will be shown below that there is an experimental way todivine the spectral nature of this enigmatic signal as it appears to existin the DRG-Pn glasses.
The spectrum of Fig. 13(b) is an example of a relatively robustasymmetric g=2.0 feature accompanying the g=4.3 signal. Thisspectrum was recorded for an iron-oxide-containing calcium alumi-nosilicate glass of geological origin [19]. It is not atypical. However, itis only one of the continuum of shapes and relative amplitudes likelypossible (see particularly Fig. 2 of Ref. [17]).
The data points of Fig. 12 show that the amplitude of the broad lineat g=2.06 decreases by a factor of ~2.75 relative to the predictedbehavior of non-interacting S=5/2 states (against which the experi-mental data were normalized) on cooling from 78 K to 10.5 K,whereas the identically normalized data for the g=4.3 amplitudestays constant within experimental error (although its slight increasewith decreasing temperature is likely a real effect, which will bediscussed in Section 9.6). This suggests that subtracting somemultipleof a high-temperature spectrum (containing a relatively strongerg=2.06 component) from a low temperature spectrum (containingrelatively weaker g=2.06 component) would result in a differencespectrum characterized by a greatly depleted broad line and arelatively enhanced in the g=4.3 line, together with its associatedcomponent at g=2.0, if any.
As seen in Fig. 3, both the positive and negative derivativeamplitudes of the un-normalized broad-line spectra increase mono-tonically on cooling from 78 K to 10.5 K (light gray arrows), whereasfrom 10.5 K to 4.2 K only the negative derivative amplitude increases(dark gray arrow). Because of this anomaly, we chose to subtractvarious multiples of the 78-K spectrum from the 10.5-K spectrum(instead of from the 4.2 K spectrum). By a cut-and-try process weconcluded that multiplication of the 78-K spectrum by a factor of 2.5yielded the most physically plausible result, i.e., the subtractionspectrum shown as the noisy unbroken curve in Fig. 13(a).
Still, it appears that the difference spectrum of Fig. 13(a) includessome sort of a broad-line spectrum. This remnant broad component isqualitatively very different from any of the non-subtracted spectra ofFig. 3 above 4.2 K, in that the “broad line” of width ~150mT seen in allthose spectra is now absent! So the question naturally arises: Is the
remnant broad-line part of the subtraction spectrum of Fig. 13(a) anon-physical artifact ...or is it possible that it too can be simulated as adistribution of Lorentzian functions? This question was easy toanswer, since the fit to the broad part of the spectrum shown inFig. 13(a) (small open circles) was achieved by simply reusing thesimulation represented by the open circles in Fig. 7(a) after suitablecompression along the y axis. Accordingly, it is concluded that:
(1) The shape of broad line at g=2.06 measured for DRG-P1 at10.5 K differs from the shape broad line measured at 78 K bythe addition of a much broader line, which happens to be wellcharacterized by the bar-graphed peak-to-peak linewidthdistribution shown as the inset to Fig. 7(a) — which in turn isseen to be similar in shape but dramatically different inposition vis-à-vis the linewidth distribution that optimizedsimulation of the broad line of DRG-P1 at 100 K (recapitulatedas the small squares in inset to Fig. 7(a)).
(2) The gray-shaded differences between the subtraction spectrumof Fig. 13(a) (continuous curve) and the multi-Lorentziansimulation of the broad-band component (small circles) is thenvery likely to be the (clearly asymmetric) g=2.0 componentthat is associated with the g=4.3 feature of DRG-P1. That is,these two features taken together are inferred to comprise therelatively complete spectrum below ~700 mT of the weakly-interacting Fe3+ ions in DRG-P1.
7.3. It is unfortunate that this wasn't discovered sooner
Conclusion (2) above explains why the Lorentzian line-shapesimulations of Figs. 2 and 5 are discrepant in the magnetic-field range

1446 D.L. Griscom, W.J. Weber / Journal of Non-Crystalline Solids 357 (2011) 1437–1451
~240 to 320 mT. That is, our approach to fitting the broad-line spec-trumplaced a premiumonfitting the negative first-derivative peaknear380 mT by employing only (symmetrical) Lorentzian functions ...whereas it is now seen that the asymmetric spectral componentrepresented by the gray shaded features in Fig. 13(a) – having a verydifferent origin than the broad line – likely contributes significantly to theshape andmagnitude of the negative derivative peak at ~380mT in ourexperimental spectra. Nevertheless, the errors in our fits due to thisprocedural mistake are likely not very large in terms of integratedintensity, and should affect the Lorentzian linewidth distributionfunctions only in the range ~50 to 150 mT in Fig. 6 and the insets toFigs. 2 and 5. Indeed, we suggest that the bar graphs in Fig. 6(a) and(b)maydeviate from the classic Gaussian shape in the range 50–150mTmainly because of this procedural mistake— and that the bar at 100mTin Fig. 6(c) may possibly be artifactual for the very same reason.
8. Extrapolating self-irradiation effects
The absolute broad-line ESR intensities corresponding to thespectra of the three samples of Fig. 3 (DRG-P1, P2, and P3) weredetermined by numerical integrations of the illustrated best-fitLorentzian simulations and applying several corrections as describedin Section 6.4. These data, normalized to 1.0 for DRG-P1, are plotted inFig. 14 (open circles) as a function of the experimentally determined238PuO2 contents listed in Table 2. Also shown in Fig. 14 are the lessrigorously determined ESR amplitudes of the g=4.3 “sharp line,”normalized to its largest value, i.e., that belonging to DRG-P3. Thecurves passing through these data points are fitted saturatingexponentials, which can be extrapolated farther along the abscissaof Fig. 14, by extending the time scale shown at the bottom. That is,the greater amounts of self-irradiation damage to be expected duringmany thousands of years of 239Pu α decay can be extrapolated fromthe presently reported 17 years of 238Pu decays in DRGs-P1, 2, and 3.
The illustrated curve passed through the “broad-line” data points ofFig. 14 (open circles) fits all three data points to within an RMS errorof ±0.04% — while at the same time extrapolating (by construction)precisely to zero at infinite time. This outcome is particularly interesting,given that there is no a priori general principle that even suggests that
Fig. 14. ESR intensity data for samples DRG-P1, P2, and P3 plotted versus degree of238Pu (half life 87.8 years) substitution for 239P (half life 2410 years), which in turn isproportional to the α-decay self-irradiation dose imparted in 17 years time. Anadditional horizontal scale is affixed to illustrate the inferred effects of 239Puα decays inthe DRG-P1 glass after a period of 3600 years. As described in Section 8, the curve fittedto the open circles can be extrapolated to predict the degree of “super vitrification” farinto the future.
the broad-line signal might totally disappear as a result of infinite-timeα-decay self irradiation.
9. Discussion
Sections 5 through 8 describe in detail various analyses that wereperformed on the presently obtained data. While some solidconclusions have already been reached there, a few serious questionshave arisen that will now be addressed.
9.1. What are the meanings of the ESR intensity measurements?
In Section 6.4, our precise spin concentration measurement forDRG-P1 equaled 113% of the total batched iron-ion content as Fe3+
(S=5/2). But this is equivalent to just ~85% of the sum of the batched8.28 mol% Fe3+ plus 2.79 mol% Mn2+, assuming both of these tobehave as paramagnetic S=5/2 states at room temperature. Accord-ing to evidence presented in Ref. [14], ~100% of the iron in the DRG-Pnglasses is indeed in the trivalent state. However, the presence of minoramounts of the iron as Fe2+ cannot be ruled out – and the Fe2+ ion iscommonly found [39,40] to have an effective spin of S′=1/2, which iscalculated (Eq. [2] of [19]) to give a room-temperature ESR intensityjust ~12% of an S=5/2 (Fe3+) ion. Thus, the presence of a sufficientfraction of the iron as Fe2+ could lower the expected spin counttowards equality with the measurement, but this ad hoc assumptionwould still neglect the influence of the NiO, batched at 1.7 mol%.6 Inany event, whether or not the measured ESR intensity of DRG-P1matches the expected intensity for all of the paramagnetic ions that itis known to contain, the considerably smaller intensities measured forDRG-P2 and DRG-P3 surely do not. Therefore, it is perfectly clear thatsome ESR intensity has somehow been “lost,” at least in the latter twocases.
So where does the ESR intensity go to when it is “lost”? Well, itmay well be still present, but in the form of Lorentzian linescharacterized by values of σ (peak-to-peak derivative) exceeding thefield-scan range of the spectrometer. Note that all empiricallydetermined linewidth distributions of Fig. 6 fall completely withinthe experimental scan range available to us, 0–1000 mT. Thus, whileour fits could be validly extrapolated to 2000 mT and beyond, weremain totally ignorant of any lines characterized by σ (peak-to-peakderivative)N1000 mT. Only by actually scanning the spectra to stillhigher magnetic fields can (at least some of) the “lost” intensity beretrieved.
Given that the saturating-exponential-function fit to the opencircles of Fig. 14 was successfully constructed to extrapolate to zero atinfinite time, it can be supposed that plutonium α decays might be
6 How can one decide which species are giving rise to the broad-line components ofthe spectra Figs. 1–3? Conceivably the observed average g value of the broad line(2.06) might be a clue. The g-value ranges reported for Fe3+, Mn2+, and Ni2+ incrystals are 2.003–2.004, 1.997–2.002, and 2.24–2.29, respectively [36,39–41]. But byweighting the mean values of these three g-value ranges by the corresponding molepercentages of the paramagnetic ions respectively batched into the DRG-Pn glasses, abroad-line g value of just 2.039 is “predicted.” This actually eliminates Ni2+ as thecause, given that a single S=1 Ni2+ ion is calculated (Eq. (2) of [19]) to have an ESRintensity only ~1/3 of that of a single S=5/2 ion and this fact was not included in theabove g value calculation. Therefore, the large discrepancy between g values of Fe3+
and Mn2+ in crystals and those apparent in the DRG-Pn glasses must have some otherexplanation. Accordingly, it is speculated here that the rather large g shift of +0.06represents the residual isotropic fine structure left after the anisotropic parts wereaveraged to zero by exchange interactions (see Section 9.2). In fact, we know that thefine-structure interactions affecting Fe3+ are large in the DRG-Pn glasses by the veryexistence of the g=4.3 feature [21–23]. In strong support of our speculation, thebinary iron-phosphate glasses of Fig. 7 [27] show no g=4.3 component at all, and theirbroad lines are simulated in this figure as sums of Lorentzians centered on the freeelectron g value (g=2.0023).

1447D.L. Griscom, W.J. Weber / Journal of Non-Crystalline Solids 357 (2011) 1437–1451
remaking the DRG-P glasses into a (surely more disordered) “supervitrified” form wherein the speromagnetic coupling of the containedparamagnetic ions gives rise to σ (peak-to-peak derivative) Lorent-zian linewidths that become increasingly broader than 1000 mT withthe passage of time at a fixed decay rate. (Another property of thissuper vitrification is the nearly 1% increase in volume reported for theDRG-P3 glass after 17 years [15].) Thus, as time approaches infinity,either (1) all peak-to-peak derivative linewidths all become NN1000mT or (2) spins are removed pair-wise by antiferromagneticcancellation (or both, in the event that these turn out to be twodifferent descriptions of the same phenomenon).
Indeed, returning to the (reversible) intensity changes observed oncooling, if two spins are perfectly antiferromagnetically aligned, theirparamagnetism, and their ESR signal, would be lost under the presentobservational conditions (X band, maximum field scan 1000 mT).However, in amorphous materials perfect anti-alignments of spinsshould be greatly frustrated by strong fine-structure splittings, whichvary in magnitudes and principal-axis orientations from site to site.Therefore, it can be speculated that reversible losses in the ESR intensityobserved upon lowering the temperature may result mainly from ESRline broadening into ranges outside of the range of the experimentallyscanned magnetic field. This could explain much, if not all, of theobserved loss of intensity in Fig. 12 labeled “antiferromagneticordering.” This explanation is explicitly supported by the line-shape-difference analysis of Fig. 13(a) (see Section 7.2), which reveals loss ofspectral intensity at the peak of the broad line characterized byσ (peak-to-peak derivative)≈150 mT, accompanied by growth of intensity in thehigh-field wings — both effects being consequent to lowering thetemperature from 78 to 10.5 K. This broadening in the wings at theexpense of the central line with lowering temperature can also beperceived in Fig. 3, by focusing on the temperature dependence of thestrengthsof highfield tails rather than the invariance ofσ (peak-to-peakderivative).
9.2. Why is the “broad line” broad? And why is its peak-to-peak widthinvariant?
The short answer to the first question is spin–spin interactionsbetween paramagnetic ions situated in a rigid lattice or network. Incrystals, spin–spin line broadening typically shows no dependence ontemperature above the Curie point and can only be reduced bydiluting the numbers of contained paramagnetic dipoles [36]. Thereare two main types of interactions between paramagnetic ions thathave been recognized: dipole–dipole and exchange. The former shiftsthe resonance field of any given ion by an amount representing theaverage magnetic fields (both static and dynamic) that it experiencesdue to all the other magnetic ions in the solid. This is termedinhomogeneous broadening and often results in a Gaussian line shape.
Exchange interactions result from what may be viewed as mutualspin flipping, which under some circumstances can tend to averageout the local dipolar fields, leading to line narrowing. In the simplesttheoretical treatment, “the phenomenon of exchange narrowingdepends on the property that the isotropic exchange interactiondoes not contribute to the second moment when we have a system ofidentical ions ([36] p. 529; emphasis added).” However, Abragam andBleaney [36] go on to point out that even “ions of the same species areessentially not identical” under certain conditions, including whenthere are g tensors that are differently oriented and/or there existshyperfine and/or fine structure— all of which are operative in the DRG-Pn glasses, in addition to there being three different species ofparamagnetic ions! Nevertheless, when the exchange interactionbecomes larger than the separations between individual resonancelines caused by any or all of the aforementioned factors, “exchangenarrowing then sets in Ref. ([36] p. 529).” So is this the case for theDRG-Pn glasses?
Well, it seems conceivable that the Gaussian, or near Gaussian,distributions in Lorentzian linewidths reported here for the DRG-Pnglasses in Figs. 2, 5, and 6, are causally related to inhomogeneous(dipole–dipole) broadening. However, in the “normal” case of inhomo-geneous broadening, there would be a distribution of resonance fieldsH0(1),H0(2), ...H0(n) (perhapsGaussian in shape), each ofwhichwouldthen need to be convoluted by a Lorentzian to fully simulate thespectrum. But given our success in simulating the spectra of the DRG-Pnglasses as weighted sums Lorentzians of different widths all centered atone fixed value ofH0 (i.e., a δ-function distribution ofH0),we suggest thatany broadening (Gaussian or other) that would naturally arise from thesystem average of all the anisotropic interactions mentioned in thepreceding paragraph has been averaged to a virtual δ function valuecentered atH0by anexchange interaction that is greater inmagnitude thanthe overall strengths of the anisotropies to be expected in the absence ofexchange ([36] p. 529).
Thus, we propose the ESR spectra of the DRG-Pn glasses to beexchange narrowed, thereby substantially preserving the secondmoment (which determines the 150-mT peak-to-peak derivativewidth) against changes due to experimentally varying either glassstructure (via α-decay damage) or measurement temperature. Whatdoes change, however, is the distribution ESR intensity between themostly unvarying second moment and the higher moments thatcomprise “thewings.”Wehave shownunequivocally that both loweringthe temperature (reversibly) and α-decay damage (irreversibly) resultin the switching of ESR intensity from the central region, defined by σ(peak-to-peak derivative)≈150 mT, into the wings.
9.3. Are there any precedents for these phenomena?
9.3.1. Some precedent amorphous systemsOne of us (D.L.G.) has researched several amorphous materials
displaying super-broad Lorentzian ESR lines, i.e., σ (peak-to-peakderivative)≥150mT. These studies have included two fundamentallydifferent material systems: (i) the transition-ion-free amorphous“effervescent magnetic peroxyborates” (EMPBs) [42,43] and (ii) thebinary Fe2O3–P2O5 glasses (Ref. [27], from which the spectra of Fig. 7were taken). The magnetic ions in the EMPBs are most likelysuperoxide ions, O2
−, bonded into the amorphous network[27,42,43], whereas the magnetic ions in the Fe2O3–P2O5 glasses areFe2+ and Fe3+ in various ratios depending on the batch reagents andmelting temperatures and atmospheres (see Ref. [27] for a number ofspecific examples).
The linear magnetic susceptibilities, χ, of both the EMPBs [43] andthe binary Fe2O3–P2O5 glasses [33] have been shown to obey theCurie–Weiss equation (e.g., [30])
χ =MH
=C
T−θa; ð4Þ
whereM is themagnetization at a given fieldH, C is the Curie constant,and θa is the asymptotic Curie temperature. Both the EMPBs and thebinary Fe2O3–P2O5 glasses exhibit negative values of θa (rangingfrom −17 to −35 K [43] and −36.6 to −149 K [33], respectively),thus showing both to be amorphous antiferromagnets. Shaw et al.[33] also demonstrated that six different binary Fe2O3–P2O5 glasses(including the 40Fe2O3–60P2O5 composition of Fig. 7) display spinfreezing-temperature cusps Tf in the range 3.09 to 6.59 K, thusproving them to be spin-glass-like systems.
Mydosh [44] defines a spin glass as “a random, mixed-interacting,magnetic systemcharacterized by a random, yet cooperative, freezingofspins at awell-defined temperature Tf belowwhichahighly irreversible,metastable frozen state occurs without the usual long-range spatialorder.”Whilewehavenot clearlydemonstrated that theDRG-Pnglassesare characterized by such a Tf, the anomalous differences discerned inFig. 3 when comparing the DRG-P1 spectrum recorded at 4.2 K to all
1448 D.L. Griscom, W.J. Weber / Journal of Non-Crystalline Solids 357 (2011) 1437–1451
those recorded at higher temperatures (further highlighted in Figs. 12and 13(a) and the discussions thereof) suggest the possible existence ofa spin freezing temperature in the range 4.2 to 10.5 K.
Both the EMPBs and the binary Fe2O3–P2O5 glasses display verylarge room-temperature ESR peak-to-peak derivative linewidths: 280mT for one EMPB sample [42] and the melting-condition-dependentvalues of 250 mT and 700 mT for the 40Fe2O3–60P2O5 glasses [27] asseen in Fig. 7. However, unlike the spectra of the DRG-Pn glasses, theselinewidths increase with decreasing temperatures according to powerlaws:
~T−0.4 for the EMPBs, ranging from 250 mT at 373 K to 510 mT at77 K (an attempt to record spectrum at 4.2 K failed) [27,42]
~T−0.21 for an iron phosphate glass containing Li2O and CeO2,ranging from 425mT at 520 K to 670mT 77 K (no attempthas been made to record the spectrum at 4.2 K) [27].
Thus, these particular super-broad Lorentzian-based line shapesand their power-law temperature dependencies appear to be charac-teristic of amorphous materials with ultra-high concentrations ofparamagnetic ions in glass-like networks (between 0.33 and 0.38 spin-1/2 states per boron in the EMPBs [42]; ~8mol% Fe2+, 32mol% Fe3+ inthe case of the 40Fe2O3–60P2O5 glasses [27]).
In sharp contrast to these power-law linewidth temperaturedependencies, the DRG-Pn glasses of the present study (containing atotal of only 8.7 mol% total iron-group ions) are found to display aconstant peak-to-peak derivative linewidth of ~150 mT from 320 Kdown to 10.5 K (Figs. 2 and 3). Also in contrast to the broad-line shapeof the EMPBs –which could be fit to a single Lorentzian function [42] –the DRG-Pn glasses could be fit only by broad distributions ofLorentzian linewidths (Fig. 6). This should not be surprising, given thechemical simplicity of the EMPBs (which are prepared by carefulheating of NaBO3⋅H2O to temperatures in the range 100–130 °C[43]) vis-à-vis the extreme chemical heterogeneity of the DRG-Pnglasses (Table 1).
9.3.2. Some precedent crystalline systemsThe ESR linewidth of MnF2 has been reported [45] as decreasing
slightly with decreasing temperature before diverging near the Néeltemperature TN=67 K, where it followed a (T−TN)−0.37 behavior overa range T−TN≅10 K. At and below TN, the conventional ESR signaldisappears, although the anti-ferromagnetic resonance (AFMR) ofMnF2has recently been studied in detail by means of a variable-high-frequency spectrometer and an ultra-high-field electromagnet [46].
Joshi et al. [47] reported studies of the X-band ESR spectra of bothsingle-crystal and powder samples of a charge-ordered (CO)antiferromagnetic manganite, Nd0.5Ca0.5MnO3. These authors wiselyfollowed themethods of Section 6.1 in computer simulating the broadLorentzian (or Dysonian in the case of the single crystal) line shapes.They found the values of σ (peak-to-peak derivative) to decline veryslightly on lowering the temperature from the charge-orderingtemperature TCO=250 K down to 230 K, where the linewidth of thesingle-crystal sample abruptly began to increase with a linear slopefrom 110 mT at 230 K to 320 mT at 160 K. Below 160 K, the signalswere too weak to analyze, and below TN=140 K no signal wasobserved at all (analogous to the case of MnF2).
In contrasting the differences between the temperature depen-dences of σ (peak-to-peak derivative) just above TN of their manganiteswith those of MnF2, Joshi et al. [47] mention that, in CO systems such asmanganites, the resistivity also decreases with increasing temper-ature above TN, due to thermally activated hopping of charge carriers(Jahn–Teller polarons) — specifically hopping of d-holes with theirassociated spins from Mn4+ sites via the intervening oxygens to Mn3+
sites. They therefore argue that this process may give rise to a form of“motional narrowing” that would explain their observed decreasinglinewidths with increasing temperature above TN. We suggest that a
similar spin-transport form ofmotional narrowing could be responsiblefor the temperature dependence of the linewidths of iron-phosphateglasses containing 20 mol% or more of iron oxide with Fe3+-to-Fe2+
ratios ranging from ~4 to ~0.7 [27].By contrast, the DRG-Pn glasses do not exhibit first-moment line
broadening on cooling – and, with only 8.3 mol% 1/2 Fe2O3, 2.8 mol%MnO, and 1.9 mol% NiO, are not expected to support the charge carriertransport that explain the aforementioned cases. Therefore, theconstancy of the peak-to-peak derivative linewidth of DRG-P1 allthe way down to 10.5 K (Figs. 2 and 3) with intensity progressivelytransferred to higher moments in the wings (Fig. 13(a)) seems to becorrectly ascribed to exchange narrowing (Section 9.2).
9.4. What is the relationship between super-broad Lorentzian linewidthsand short-range order?
Griscom et al. [27] reported ESR broad-line linewidths andintensities as functions of isochronal annealing up to 1075 °C, togetherwith differential thermal analysis (DTA) data, for a 20.5Fe2O3–49P2O5–
23.5Li2O–7CeO2 model nuclear waste glass. These data led to thefollowing results:
• For isochronal anneals from room temperature to 600 °C, the broadline (measured at room temperature after each anneal) remainedconstant, both as regards intensity and linewidth (~400 mT), whilethe DTA remained featureless.
• However, the DTA revealed glass-transition endotherms near 525and 610 °C and a strong partial-crystallization exotherm at 670 °C.Correspondingly, between 610 and 670 °C, the 400-mT broad linewas found to decline in intensity by a factor of at least 3 and to bereplaced essentially one-for-one by a line only ~30 mT in peak-to-peak-derivative width, which could be fit by a single Lorentzian.
• As the temperature was raised further, the DTA showed the onset ofpartial melting at ~910 °C, which terminated at ~970 °C. In thisanneal-temperature range the broad-line intensity (measured afterre-quenching to room temperature) was restored to ~90% of itsoriginal value and the 30-mT narrow line concomitantly lost ~90% ofthe intensity it had reached after the 670 °C treatment.
Because crystalline materials are normally characterized by long-range order (neglecting special cases of spin and charge disorder inantiferromagnetic manganite crystals mentioned above), whereasglassy materials are defined by their lack of long-range order, thebulleted observations above strongly suggest that super-broadLorentzian lines in glassy materials may be associated with very shortranges over which spin–spin interactions remain coherent.
9.5. What causes the differing temperature dependencies the ESR broadlines of DRG-P1 and DRG-P3?
It is unfortunate that the DRG-P3 sample was not studied over thefull range of temperatures, as was DRG-P1. However, the data pointsof Fig. 10 for temperatures ≥100 K indicate that the paramagneticions in the self-irradiated DRG-P3 glass display broad-line spectrawhose ESR spectral amplitudes (solid circles) deviate from thecalculated curve for isolated S=5/2 states to a greater degree thando the equivalent data for the DRG-P1 glass (open circles). Theimplication of this is that the α-recoil-super-vitrified sample DRG-P3is behaving more speromagnetically than is DRG-P1. That is, morespins are being frozen out of DRG-P3 per unit temperature drop thanis the case for DRG-P1; (this is more evident in Fig. 11).
9.6. What more can be learned from the temperature dependence of theg=4.3 feature?
It is seen in Fig. 10 that above 100 K the sharp lines at g=4.3(unquestionably due to isolated Fe3+ [21,23]) in both DRG-P1 (open

1449D.L. Griscom, W.J. Weber / Journal of Non-Crystalline Solids 357 (2011) 1437–1451
squares) and DRG-P3 (solid squares) grow faster with decreasingtemperature than the predicted behavior for isolated S=5/2 species(thick unbroken curve). No matter what the explanation of the smalldifference between DRG-P1 and DRG-P3 in this regard, the underlyingphenomenon can only be explained if the number of isolated Fe3+ ionswith g=4.3 signatures increases with decreasing temperature in bothcases. And the only way this can be rationalized is by presuming thatthe pair-wise antiferromagnetic cancellation of the magneticmoments of paramagnetic ions required to explain the speromagneticfreezing out of the broad lines must somehow be generating additionalisolated Fe3+ ions. And the way this would happen must certainlyrelate to the fact that about half of the short-range-interacting clusterscontributing to the portion of the broad line that is frozen out in anygiven temperature decrement would contain an odd number ofparamagnetic ions. So whenever the “odd man out” in such an odd-number-cluster freeze-out should happen to be an Fe3+ ion (ratherthan an Fe2+, Mn2+, or Ni2+), the strength of the g=4.3 line would beenhanced relative to its expected behavior in a dilute sample, which isspecified by the rigorous theory of Eq. (2) of Ref. [19] and is plotted asthe thick unbroken curve in Fig. 10 and the unbroken curve in Fig. 11.
In Fig. 10, the data for the amplitudes of the g=4.3 feature in DRG-P1 and DRG-P3 (open and solid squares, respectively) have beennormalized in a manner suggestive that they may both join the idealbehavior of isolated S=5/2 ions (thick continuous curve) near andbelow 100 K. And, in fact, the ratio of amplitude data for the g=4.3feature of DRG-P1 to the calculated ideal behavior of isolated S=5/2ions at temperatures below 100 K is seen in Fig. 12 (solid circles) tovery nearly match a horizontal straight line, thus appearing tojustifying the normalization of Fig. 10. At face value, this would meanthat, in DRG-P1, most odd-member paramagnetic-ion clusterscontaining “odd man out” Fe3+ ions are (reversibly) frozen out bythe time temperature is lowered to ~100 K.
Regarding the effects of super vitrification on the g=4.3 feature, itis not possible to say whether or not the curve fitted to the hollowtriangles in Fig. 14 is meaningful. While it is conceivable that thisweakly-interacting Fe3+ has actually reached a near-steady state inDRG-P3 after 17 years by some radiation-damage analogy to thethermal “odd man out” mechanism described above, it is importantto note that the volume change in this glass had not yet reacheda steady state [15]. In any event, it is worth remembering that theDRG-Pn glasses are presently 28 years old, so this and other questionsmight be answered by any investigator presently interested inextending the studies reported here.
Finally, the precise numbers of spins contributing to the g=4.3signals of the DRG-Pn samples have not been quantified here. Thisis because the parts of this spectrum extending to magnetic fieldvalues ≥700 mT are totally unknown. For the moment, we havepresumed the g=4.3 signal and its asymmetric companion nearg=2.00 (partially revealed Fig. 13(a)) to amount to no more than asmall fraction of the number of spins that make up the g=2.06broad line. More research is needed to decide to what degree ourassumption may be justified.
10. Conclusions
It is clear from Figs. 5, 6, and 14 that the ESR spectrum of a multi-component candidate nuclear waste glass, DRG-P3, was profoundlyaffected by 17 years of 238Pu α decay. Indeed, the α-recoil componentof 238Pu decay is known to cause local “thermal spikes” [48–51],which generally reach higher temperatures than employed inindustrial glass melting. Moreover, these locally-melted regions arerapidly quenched by heat transfer to adjacent cold material. For thisreason, α-recoil damage is likely to result in far more disorderedglassy forms than those present in the same glasses as originallymelted, quenched, and annealed according schedules developed tooptimize the fabrication of large mechanically stable glass “logs” for
nuclear waste immobilization and storage. In this paper we havetermed the process of glass modification by α-recoil damage “supervitrification.”
The as-fabricated DRG-Pn glasses, despite all efforts to homogenizethem in the manufacturing process and the general absence ofexperimental evidence of inhomogeneities [14], are still likely tocontain micro regions wherein particular types of paramagnetic ionstend to cluster more tightly than elsewhere. To the degree that microregions segregate Fe3+, Fe2+, Mn2+, or Ni2+, either as homo- orhetero-clusters, such clusters would certainly determine the principalspin–spin interactions among paramagnetic species responsible forthe broad-line ESR spectra recorded for DRG-P1 (and presumablywould have been recorded also for DRG-P2 and P3 when they wereoriginally fabricated).
We suggest that the empirically determined distributions ofLorentzian linewidths shown in Fig. 6(a) are in some way related tothe distribution of ion clusters present in the as-fabricated glasses. Ifso, then the differences between the linewidth distribution of DRG-P1and those of DRG-P2 and DRG-P3 (Fig. 6(b) and (c), respectively)represent the results of 17 years of 238Pu α decays super-vitrifyingminor amounts of DRG-P2 and a much larger volume of DRG-P3. Inthis view, the δ-function-like spikes in distribution of Fig. 6(c) areindicative of the (apparently high) degree to whichα-recoil ions havehomogenized this highly- 238Pu-substituted DRG-P glass in the courseof 17 years.
Otherwise, we have learned from the broad-line ESR spectra thatthe peak-to-peak derivative linewidth is virtually unaffected by17 years of this super-vitrification process. Yet our careful simulationsof the shapes of these broad-line spectra as weighted sums ofLorentzian functions have revealed that ESR intensity is progressivelytransferred from the central region (near and within σ (peak-to-peakderivative)≅150 mT) into the far wings, i.e., HNN [H0+½ σ (peak-to-peak derivative)], as the α-decay damage accumulates (and to asmaller degree also as a reversible process as the measurementtemperature is lowered). To the extent that we may be able togeneralize from the evidence discussed in Section 9, we suggest thatthis kind of a change in the ESR line shape results from the local orderbecoming shorter and shorter range on the scale that determines thedominant magnetic dipole–dipole interactions. By contrast, we inferthe exchange interaction to be substantially larger than the strengthsof all of those dipole–dipole interactions, both initially and throughoutthe super-vitrification process.
In general, we have shown that the ESR technique – whencombined with rigorous calculations [19] of the dependencies of ESRintensities of non-interacting paramagnetic species on temperature T,spectrometer frequency ν, and electronic spin S – is a powerful tool forassessing the effects of accelerated testing of candidate high-levelnuclear waste glasses by means of substitution of radioisotopes withmuch shorter decay times than the isotopes to be immobilized. Whilethe ESR technique was applied to Pu-containing glasses in the presentstudy, the sensitivity of the technique to changes in short-range orderin glasses could also prove extremely valuable in new studies of glassor ceramic waste forms tailored to specific waste streams from theadvanced nuclear fuel cycle [4], where transmutation effects andcharge compensation mechanisms are important.
Acknowledgements
Most of the ESR experiments reported here were carried out in1999 at the Naval Research Laboratory (NRL) pursuant to a program“Chemical Decomposition of High-Level Nuclear Waste Storage/Disposal Glasses under Irradiation” funded by the U.S. Department ofEnergy under Grant Number DE-AI07-96ER45619. One of us (D.L.G.)thanks Bill Powers and Joe Palovich of the NRL's Health Physics Branchfor receiving and unpacking the shipment of these radioactivesamples, kindly helping him to load and seal them into fused silica

1450 D.L. Griscom, W.J. Weber / Journal of Non-Crystalline Solids 357 (2011) 1437–1451
sample tubes, and approving his plan for securely storing thembetween experiments. He also thanks Bill Carlos, formerly of NRL'sElectronics Science&TechnologyDivision, formaking available his ESRspectrometer and kindly assisting in the acquisition of the spectra ofFig. 3. One of us (W.J.W.) thanks theUSDepartment of Energy, Office ofBasic Energy Sciences for support in the preparation of thismanuscript.
Appendix A
It is well known to practitioners of ESR spectrometry thatdouble numerical integration of ESR first-derivative spectra isnecessary determine the concentrations of resonating magneticspecies (often termed “spin concentrations”). Still, the lore of actuallyperforming this operation is not generally found in books. In whatmay be the only exception, Ayscough describes the method in somedetail in Appendix 5 of his book [52]. It goes like this (assuming forpresent purposes a simple Gaussian or Lorentzian line with nohyperfine structure): One first chooses a point on the first-derivativespectrum where it is extremely weak and then proceeds tonumerically integrate it with respect to a baseline up to and beyondits strong positive and negative peaks flanking the zero crossing untilfinally stopping at a comparably weak extremal point at the other endof the spectrum. The result is usually the desired absorption spectrum,which rises from zero at the starting point, peaks at the position of thefirst-derivative zero crossing, and in principle returns to zero at theother end. However, the first integral rarely returns exactly to zerobecause the experimenter sometimes fails to obtain the empty-cavitybaseline and/or fails to select symmetric starting and ending points.To correct for such errors, it is customary to add to, or subtract from,each point of any “tilted” first integral a straight line joining thestarting and ending points of this tilted first integral. This procedure iscolloquially referred to as the “wedge correction” and is mathemat-ically described by Ayscough [52]. In Fig. 15, the gray-shadedtriangular “wedge” on the right side has been subtracted from thethick dashed first integral, to obtain a “leveled out” absorption curve(thick unbroken curve). Once having done this, the experimenter nextperforms a second integration to obtain the area under this absorptioncurve (vertical hatch in figure), which in the cases of relatively narrowESR lines generally results in a number accurately proportional to thenumber of resonating magnetic species.
However, this process is not valid for any ESR spectrum whose peak-to-peak first-derivative linewidth σ is comparable to or larger than thevalue of the center field (= the derivative zero crossing). For suchsuper-wide spectra, one must always choose the first extremal pointto be either (i) a highmagnetic field value where themagnitude of thefirst derivative spectrum declines to just a few percent of its peakvalue or (ii) the highest laboratory field possible. Then the other
Fig. 15. Correct (left) and incorrect (right) ways to determine accurate spin densities bydouble numerical integration of ESR first-derivative spectra taking the form of super-broad Lorentzian lines (see Appendix A).
extremal point must be taken to be zero field. The “wedge correction”should never be applied in such cases because, as visually demonstratedin Fig. 15, significant non-zero absorption at zero field is to be expectedfor super-wide spectra. And in that event the “wedge correction,”rather than correcting, actually throws away the very real ESRintensity at and near zero field. Thus, the right-hand side of Fig. 15shows the abysmal outcome of attempting to integrate a super-broadLorentzian curve from zero field to 1000 mT using the “wedgecorrection.” By contrast, the left-hand side of Fig. 15 shows the correctway to do the first integral in such cases ...and it also illustrates the factthat the ESR intensity missed due to the cut-off field imposed by thelaboratory electromagnet can be deduced and added back into thesecond integral, in the fortuitous event that the line shape is proven tobe purely composed of Lorentzians (as shown here) or Gaussians.
References
[1] Closing the Circle on the Splitting of the Atom, U.S. Department of Energy, Office ofEnvironmental Management, Washington, DC, 1995.
[2] W.J. Weber, R.C. Ewing, C.A. Angell, G.W. Arnold, A.N. Cormack, J.M. Delaye, D.L.Griscom, L.W. Hobbs, A. Navrotsky, D.L. Price, A.M. Stoneham, M. Weinberg, J.Mater. Res. 12 (1997) 1946–1978.
[3] B. Grambow, Elements 2 (2006) 357–364.[4] W.J. Weber, A. Navrotsky, S. Stefanovsky, E.R. Vance, E. Vernaz, MRS Bull. 34
(2009) 46–53.[5] R.C. Ewing, J. Nucl. Mater. 190 (1992) 7.[6] J.C. Cunnane, J.M. Allison, in: A. Barkatt, Van KroynenburgR.A. (Eds.), Scientific
Basis for NuclearWaste Management XVII, Materials Research Society, Pittsburgh,PA, 1994, p. 3.
[7] K.D. Crowley, Phys. Today 50 (1997) 32.[8] D.M. Wellman, J.P. Icenhower, W.J. Weber, J. Nucl. Mater. 340 (2005) 149–162.[9] J.W. Wald, W.J. Weber, J. Am. Ceram. Soc. 68 (1985) C253–C255.
[10] W.J. Weber, Nucl. Instrum. Methods Phys. Res. B32 (1988) 471–472.[11] Management and Disposition of Excess Weapons Plutonium, National Academy
Press, Washington, DC, 1994.[12] Management and Disposition of Excess Weapons Plutonium — Reactor-Related-
Options, National Academy Press, Washington, DC, 1995.[13] Storage and Disposition of Weapons-Usable Fissile Materials Draft Programmatic
Environmental Impact Statement, DOE/EIS-0229D, U.S. Department of Energy,Washington, DC, 1996.
[14] N.J. Hess, W.J. Weber, S.D. Conradson, J. Nucl. Mater. 254 (1998) 175–184.[15] I. Mueller, W.J. Weber, MRS Bull. 26 (2001) 698.[16] J.S. Hyde, ESR Standard Sample Data, Varian Associates, Sept. 18, 1961.[17] D.L. Griscom, R.J. Ginther, J. NonCryst. Solids 113 (1989) 146–160.[18] D.L. Griscom, IEEE Trans. Magn. MAG-17 (1981) 2718–2720.[19] D.L. Griscom, V. Beltrán-López, C.I. Merzbacher, E. Bolden, J. NonCryst. Solids 253
(1999) 1–22.[20] C.P. Poole Jr., Electron Spin Resonance — A Comprehensive Treatise on
Experimental Techniques, John Wiley, New York, 1983, pp. 156–174.[21] T. Castner, G.S. Newell, W.C. Holton, C.P. Slichter, J. Chem. Phys. 32 (1960) 668.[22] D.L. Griscom, Encyclopedia of Materials: Science and Technology, Elsevier Science
Ltd, 2001, pp. 179–186.[23] H.H. Wickman, M.P. Klein, D.A. Shirley, J. Chem. Phys. (1965) 2113–2117.[24] G. Morin, D. Bonnin, J. Magn. Res. 136 (1999) 176–199.[25] D.L. Griscom, C.L. Marquardt, E.J. Friebele, D.J. Dunlop, Earth Planet. Sci. Lett. 24
(1974) 78–86.[26] P.C. Taylor, P.J. Bray, J. Magn. Res. 2 (1970) 305–331.[27] D.L. Griscom, C.I. Merzbacher, N.E. Bibler, H. Imagawa, S. Uchiyama, A. Namiki, G.K.
Marasinghe, M. Mesko, M. Karabulut, Nucl. Inst. Methods B 141 (1998) 600–615.[28] D.L. Griscom, C.L. Marquardt, E.J. Friebele, J. Geophys. Res. 80 (1975) 2935–2946.[29] D.L. Griscom, J. NonCryst. Solids 67 (1984) 81–118.[30] J. Smit, H.P.J. Wijn, Ferrites, John Wiley & Sons, Eindhoven, 19598 369 pp.[31] P.I. Slick, in: E.P. Wohlfarth (Ed.), Ferromagnetic Materials, Vol. 2, North Holland
Publishing Company, Amsterdam, 1980, pp. 191–242.[32] F.A. Wedgwood, A.C. Wright, J. NonCryst. Solids 21 (1976) 95–105.[33] J.L. Shaw, A.C. Wright, R.N. Sinclair, G.K. Marasinghe, D. Holland, M.R. Lees, C.R.
Scales, J. NonCryst. Solids 345&346 (2004) 245–250.[34] R.F. Fudali, M.D. Dyar, D.L. Griscom, H.D. Schreiber, Geochim. Cosmochim. Acta 51
(1987) 2749–2756.[35] C.M. Schlinger, D.L. Griscom, G. Papaefthymiou, D.R. Veblen, R.M. Smith, J.
Geophys. Res. 93 (1987) 9137–9156.[36] A. Abragam, B. Bleaney, Electron Paramagnetic Resonance of Transition Ions,
Oxford University Press, Belfast, 19708 911 pp.[37] J.A. Weil, J.R. Bolton, J.E. Wertz, Electron Paramagnetic Resonance: Elemental
Theory and Practical Applications, Wiley, New York, 1996.[38] D.L. Griscom, in: D.R. Uhlmann, N.J. Kreidl (Eds.), Glass Science and Technology,
Vol. 4B, Advances in Structural Analysis, Academic Press, New York, 1990,pp. 151–251.
[39] K.D. Bowers, J. Owen, Paramagnetic Resonance II, Rep. Prog. Phys. XVIII (1955)304–373.
[40] J.W. Orton, Paramagnetic Resonance Data, Rep. Prog. Phys. XXII (1959) 204–240.

1451D.L. Griscom, W.J. Weber / Journal of Non-Crystalline Solids 357 (2011) 1437–1451
[41] B. Bleaney, K.W.H. Stevens, Paramagnetic Resonance, Rep. Prog. Phys. XVI (1953)108–159.
[42] D.L. Griscom, Ph.D. Thesis, Dept. Physics, Brown University, 1966.[43] J.O. Edwards, D.L. Griscom, R.B. Jones, K.L. Waters, R.A.Weeks, J. Am. Chem. Soc. 91
(1969) 1095–1103.[44] J.A. Mydosh, Spin Glasses: An Experimental Introduction, Taylor & Francis,
London, 1995, p. 256.[45] J.C. Burgiel, M.W.P. Strandberg, J. Phys. Chem. Solids 26 (1965) 865.[46] M. Hagiwara, K. Katsumata, RIKEN Rev. 24 (1999) 13–14.
[47] J.P. Joshi, R. Gupta, A.K. Sood, S.V. Bhat, A.R. Raju, C.N.R. Rao, Phys. Rev. B 65 (2001)024410.
[48] F. Seitz, J.S. Koehler, Solid State Phys. 2 (1956) 305.[49] W.J. Weber, J. Am. Ceram. Soc. 65 (1982) 544–548.[50] H. Trinkaus, J. Nucl. Mater. 246 (1997) 244–246.[51] B. Park, J. Appl. Phys. 82 (1997) 4219.[52] P.B. Ayscough, Electron Spin Resonance in Chemistry, Methuen, London, 19678
451 pp.