Electron Ionization Source Parameters in GC-MS Ionization Source Parameters in GC-MS. 2 ... charge...
41
The world leader in serving science Inge De Dobbeleer Regional Marketing Manager GC and GC-MS, EMEA Thermo Fisher Scientific, Breda/The Netherlands Electron Ionization Source Parameters in GC-MS
Transcript of Electron Ionization Source Parameters in GC-MS Ionization Source Parameters in GC-MS. 2 ... charge...

The world leader in serving science
Inge De Dobbeleer Regional Marketing Manager GC and GC-MS, EMEA Thermo Fisher Scientific, Breda/The Netherlands
Electron Ionization Source Parameters in GC-MS

2
Content
Common source parameters for electron impact ionization
Setting up a SIM method
Setting up a MS/MS method
Sensitivity and selectivity: Choosing the right technology
Troubleshooting tips and tricks
3
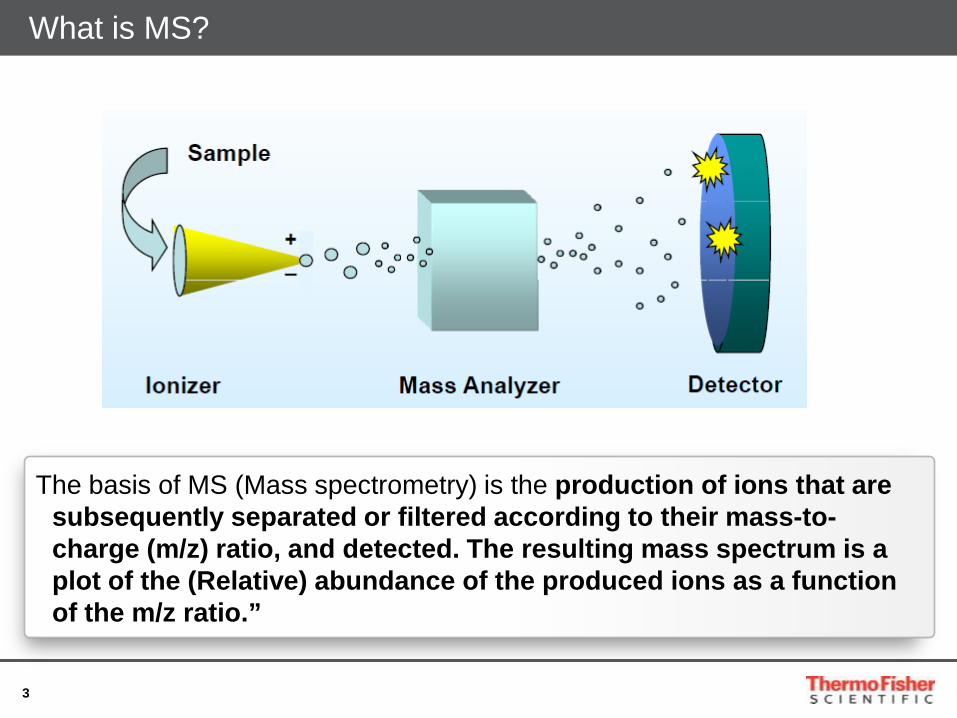
The basis of MS (Mass spectrometry) is the production of ions that are subsequently separated or filtered according to their mass-to-charge (m/z) ratio, and detected. The resulting mass spectrum is a plot of the (Relative) abundance of the produced ions as a function of the m/z ratio.”
What is MS?
4
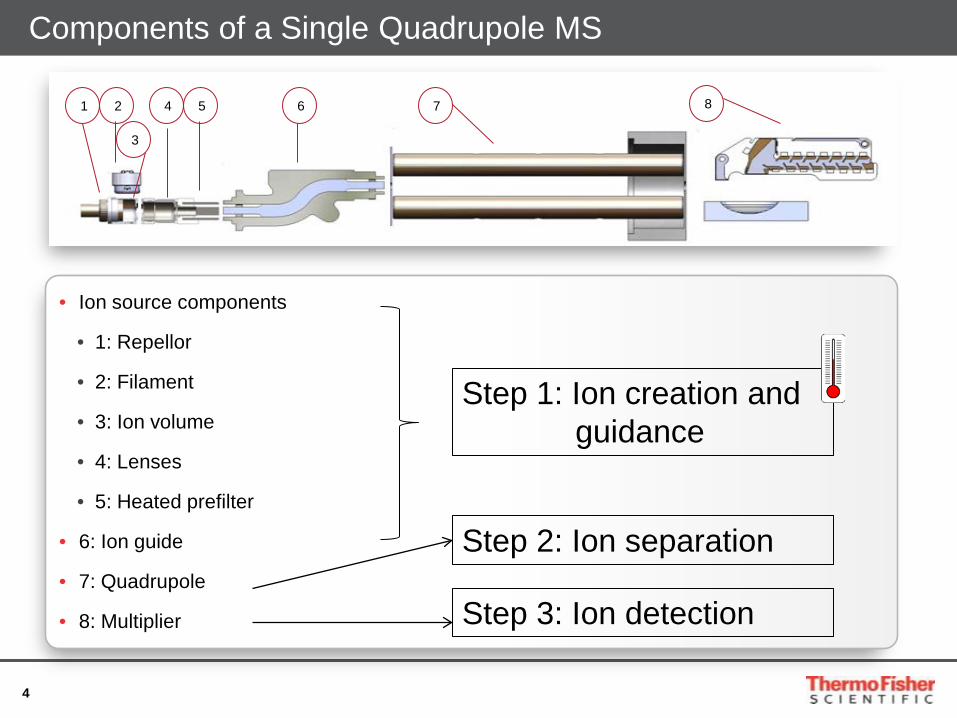
• Ion source components
• 1: Repellor
• 2: Filament
• 3: Ion volume
• 4: Lenses
• 5: Heated prefilter
• 6: Ion guide
• 7: Quadrupole
• 8: Multiplier
Components of a Single Quadrupole MS
1 2 4 5 6 7 8
Step 1: Ion creation and guidance
Step 2: Ion separation
Step 3: Ion detection
3
5
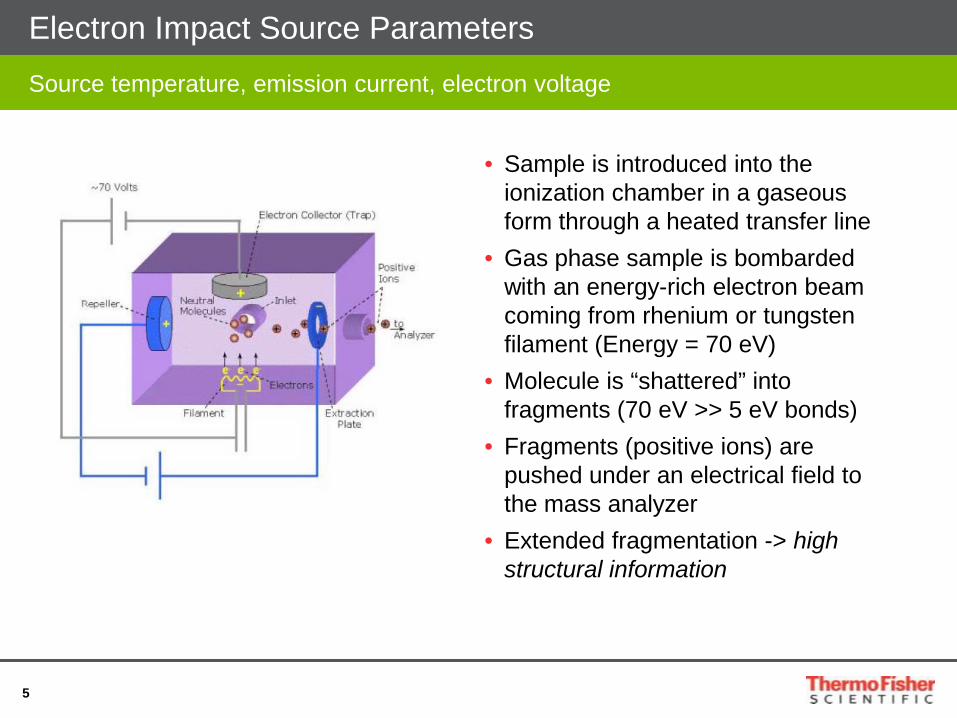
Electron Impact Source Parameters Source temperature, emission current, electron voltage
• Sample is introduced into the ionization chamber in a gaseous form through a heated transfer line
• Gas phase sample is bombarded with an energy-rich electron beam coming from rhenium or tungsten filament (Energy = 70 eV)
• Molecule is “shattered” into fragments (70 eV >> 5 eV bonds)
• Fragments (positive ions) are pushed under an electrical field to the mass analyzer
• Extended fragmentation -> high structural information

7
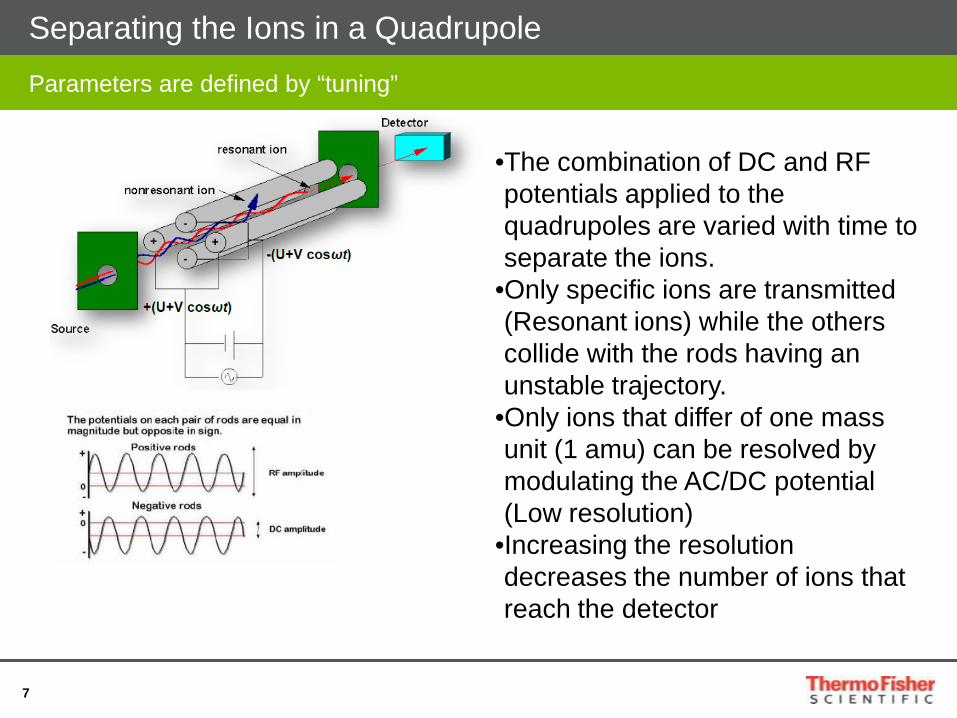
Separating the Ions in a Quadrupole Parameters are defined by “tuning”
•The combination of DC and RF potentials applied to the quadrupoles are varied with time to separate the ions.
•Only specific ions are transmitted (Resonant ions) while the others collide with the rods having an unstable trajectory.
•Only ions that differ of one mass unit (1 amu) can be resolved by modulating the AC/DC potential (Low resolution)
•Increasing the resolution decreases the number of ions that reach the detector

8
Electron Multiplier and Gain


12
Single Quad Measurements: FullScan and SIM
Standard solution of trichlorobenzenes
in FS (Left) and SIM (Right)
Sample extract showing
trichlorobenzenes In FS (Left) and SIM
(Right)

13
Why is Scan Speed Important – Part 1
• You can….. …speed up your chromatography …use narrower columns
• Narrower peaks = Better S/N= Better sensitivity
• Faster run times and faster run to run times = More productivity
RT: 3.39 - 3.42
3.390 3.392 3.394 3.396 3.398 3.400 3.402 3.404 3.406 3.408 3.410 3.412 3.414 3.416 3.418 3.420Time (min)
0
5
10
15
20
25
30
35
40
45
50
55
60
65
70
75
80
85
90
95
100
Relat
ive Ab
unda
nce
6869
6871
6867
6866
6873
6875
6863
6878
6860
6881
6857
6884
6854
6887
6851
6890
6848
6893
6847
6896
6844
6897
6843
6900
6840
6901
6839
6837
6904
6905
6834
6907
6833
6910
6830
6911
6829
6827
6914
6824
6917
6919
6821
6922
6818
6925
6815
6928
6812
6931
6809
6934
6806
6937
6803
6940
6800
6943
6797
6946
6794
6949
6791
6952
6788
6955
6785
6958
6782
6961
6778
6965
6774
6772
6768
6969
6766
6971
6762
6760
6756
6975
6983
6977
NL:5.01E6TIC MS 235120
ISQ QD GC.MS FullScan data over 50 u mass range with 127 scans/s written to disk

14
Why is Scan Speed Important – Part 2
10.6 10.8 11.0 11.2 11.4 11Time (min)
0
20
40
60
80
100
Rel
ativ
e A
bund
ance
0
20
40
60
80
100
Rel
ativ
e A
bund
ance
0
20
40
60
80
100
Rel
ativ
e A
bund
ance
11.06
10.53 11.4410.69 11.5410.74 10.91 11.20
RT: 11.06SN: 303RMS
RT: 11.06SN: 26758RMS
RT: 11.55SN: 546R
10.8 11.0 11.2 11.4Time (min)
RT: 11.06SN: 303RMS
RT: 11.06SN: 26758RMS
RT: SN:
Simultaneous FullScan and SIM: One injection only with • Screening of unknowns • Quantitation of known compounds at low level
FullScan
Selected ion 49 in FS S/N 303
SIM mode m/z49 S/N 26758
Datapoints In SIM: Approx 20 In FS: Approx 20

15
Going from Single to Triple Quadrupole
Some reasons to consider using QQQ

16
SIM Measurement in Heavy Matrix
• Matrix and analyte ions are isobaric, so the response contains analyte ions and matrix ions possibly leading to • No ion ration confirmation (3 ions are not in the correct ratio), false negative • Or increased detection limits

17
SRM or Triple Quad measurement in Heavy Matrix
• The second fragmentation in the collison cell yields in a selective and more unique ion, and eliminates the isobaric matrix ion. • Ion ration confirmation OK • Better noise reduction, increased S/N • Lower detection limints
18
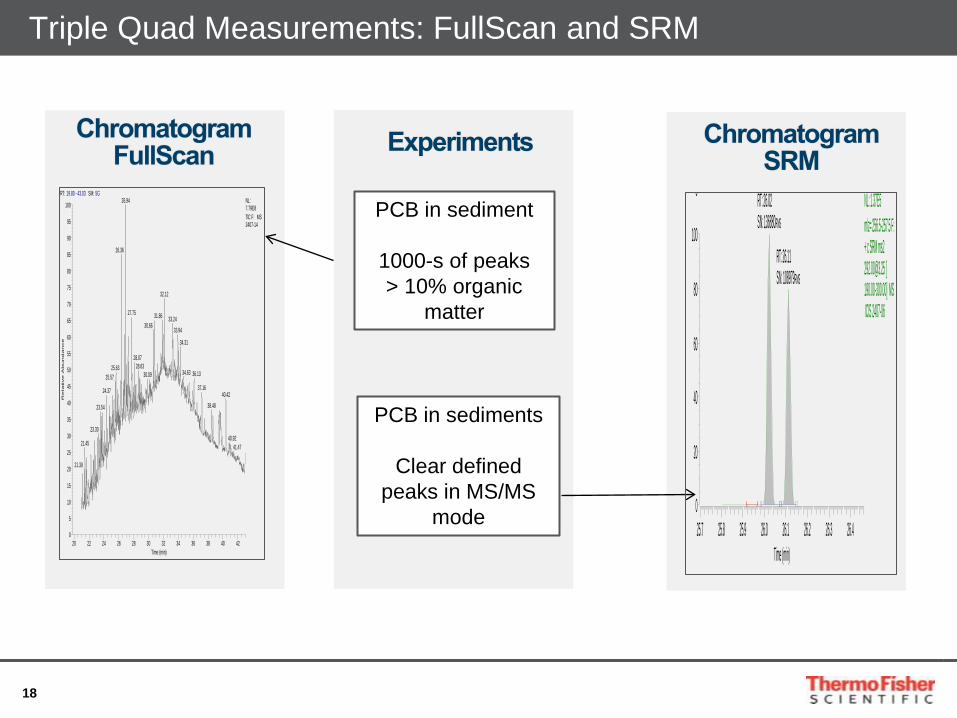
Triple Quad Measurements: FullScan and SRM
PCB in sediment
1000-s of peaks > 10% organic
matter
PCB in sediments
Clear defined peaks in MS/MS
mode
RT: 19.80 - 43.03 SM: 5G
20 22 24 26 28 30 32 34 36 38 40 42Time (min)
0
5
10
15
20
25
30
35
40
45
50
55
60
65
70
75
80
85
90
95
100
Re
lative
Ab
un
da
nce
26.94
26.36
32.12
27.75 31.86 33.2430.66
33.94
34.31
28.0728.6325.63
34.63 36.1330.0925.5737.1624.37 40.42
38.4823.54
23.3040.92
21.45 41.47
21.39
NL:7.79E8TIC F: MS 2407-14
25.7 25.8 25.9 26.0 26.1 26.2 26.3 26.4Time (min)
0
20
40
60
80
100
0
RT: 26.02SN: 136880RMS
RT: 26.11SN: 108979RMS
NL: 1.37E5m/z= 256.5-257.5 F: + c SRM ms2 [email protected] [ 190.00-300.00] MS ICIS 2407-06

20
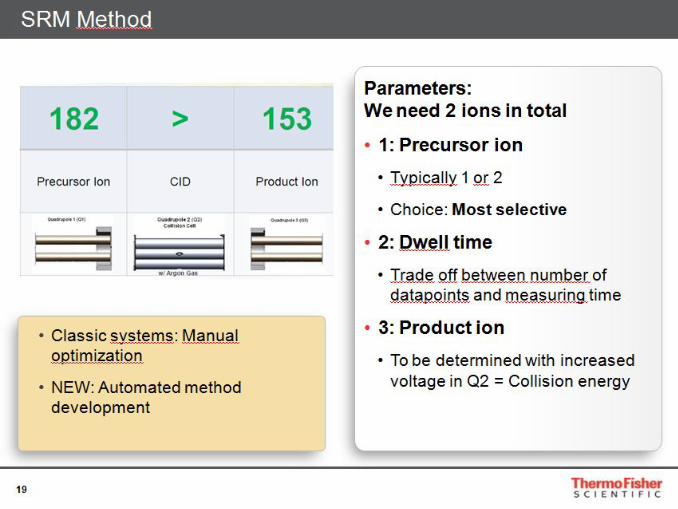
Timed SIM and Timed SRM
Classical ways of SIM and SRM methods
Timed SIM/SRM


23
• Timed scanning: Overall higher dwell times, for more sensitivity
• Timed scanning: Peaks are not cut off near segment break
ISQ and TSQ 8000 GC-MS Series: Timed SIM and SRM Benefits
Wasted dwell time

24
A Practical Example of Multiresidue Analysis
• Segmented SRM • Closest compound to segment
break: 5 seconds • Average number of simultaneous
transitions: 55
• Timed SRM • Closest compound to segment
break: 15 seconds
• Average number of simultaneous transitions:
15 (4X higher dwell times)

25
Automated Method Development
Auto SIM and Auto SRM
"Give a man a fish, feed him for a day. Teach a man to fish, feed him for a lifetime“ Lao Tzu circa 5th Century BC
26
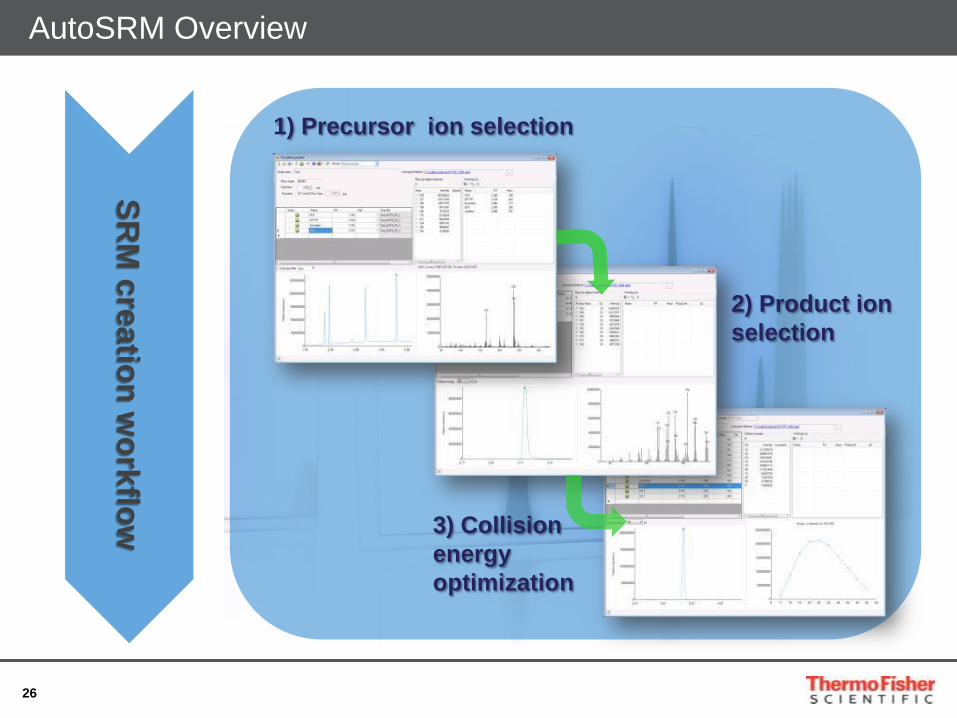
AutoSRM Overview
1) Precursor ion selection
2) Product ion selection
3) Collision energy optimization
SRM
creation workflow

27
AutoSRM Use Case
• Created and optimized > 250 transitions for > 80 compounds
• Minimal user interaction over 24 hours

28
Export form AutoSRM to Instrument Method
29
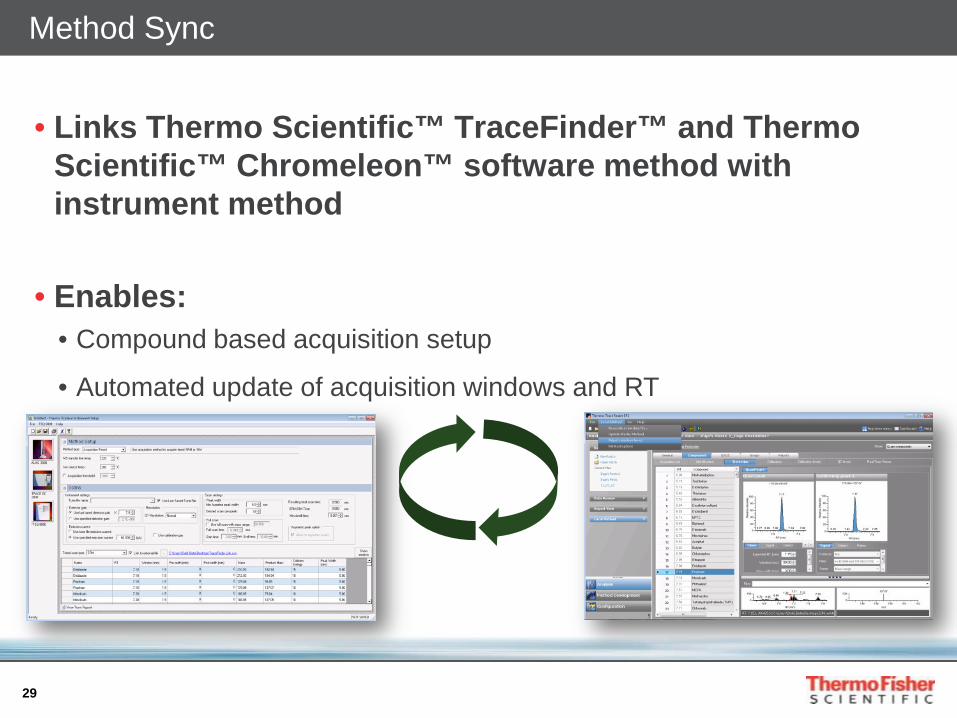
Method Sync
• Links Thermo Scientific™ TraceFinder™ and Thermo Scientific™ Chromeleon™ software method with instrument method
• Enables: • Compound based acquisition setup
• Automated update of acquisition windows and RT
30
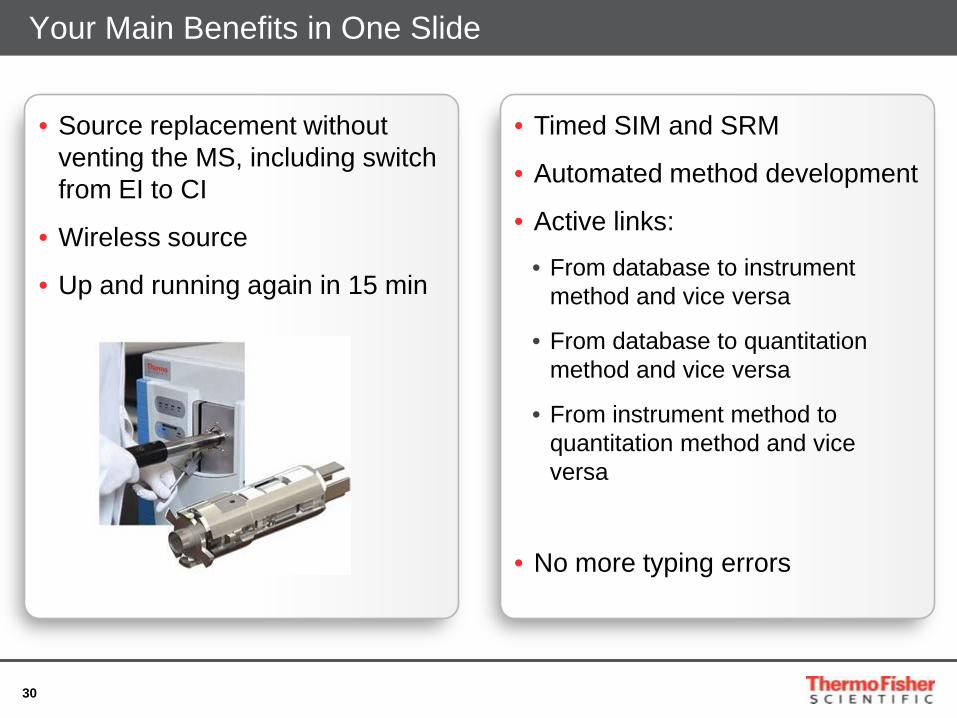
• Timed SIM and SRM
• Automated method development
• Active links:
• From database to instrument method and vice versa
• From database to quantitation method and vice versa
• From instrument method to quantitation method and vice versa
• No more typing errors
• Source replacement without venting the MS, including switch from EI to CI
• Wireless source
• Up and running again in 15 min
Your Main Benefits in One Slide

31
Troubleshooting
Overall most common problems in a GC-MS system, one year of support gathered
Autosampler, vials, syringes
14%
Injection port 72%
Column 3% Source
10%
Analyzer 1%

32
Two Troubleshooting Tools
• Air duster spray with freon gas • Check for m/z 69 and 83 • Cost 5-10 euro
• Column test mix (E.g. Grob mix) • Cost 40 euro approx

33
Air/Water Background
• A cheap investment in air duster spray will help you enormously • Scan for m/z69 and 85 • Spray on the suspect points: If there is a leak this will show up • Leaks will cause (Next to bad analysis):
• Reduced lifetime of the filament • Reduced lifetime of the multiplier
NEVER use a soap solution inside the GC
34
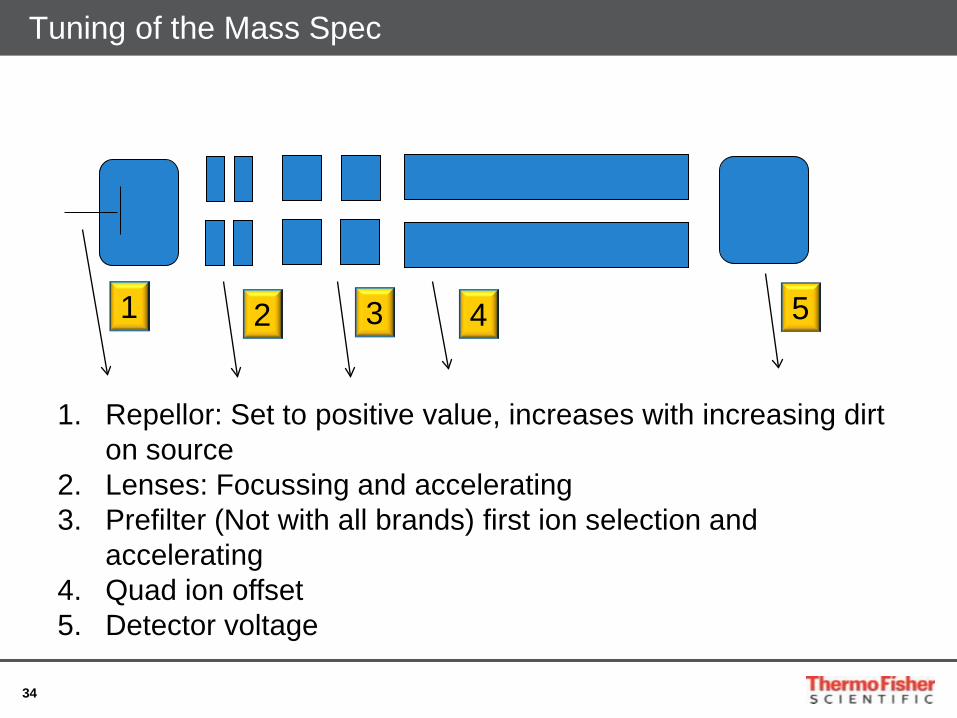
Tuning of the Mass Spec
1. Repellor: Set to positive value, increases with increasing dirt on source
2. Lenses: Focussing and accelerating 3. Prefilter (Not with all brands) first ion selection and
accelerating 4. Quad ion offset 5. Detector voltage
1 2 3 4 5
35
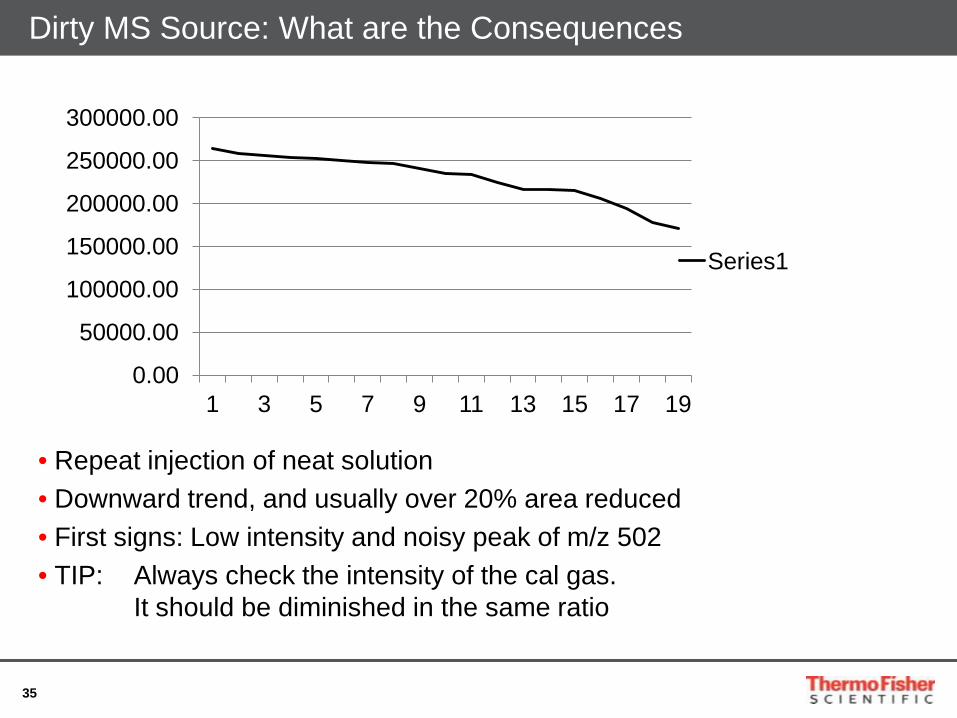
Dirty MS Source: What are the Consequences
0.00
50000.00
100000.00
150000.00
200000.00
250000.00
300000.00
1 3 5 7 9 11 13 15 17 19
Series1
• Repeat injection of neat solution • Downward trend, and usually over 20% area reduced • First signs: Low intensity and noisy peak of m/z 502 • TIP: Always check the intensity of the cal gas. It should be diminished in the same ratio

36
How to Clean an MS Source?
Parts that always need cleaning are: Repellor, lens 2 and ion volume Typically only parts with ion burn are cleaned
Step 1: Clean with a cotton tip dipped in a slurry of glycerol and aluminiumoxide Step 2: Rinse thoroughly under tap water Step 3: Put the parts in detergent and sonicate for 15 min, rinse again Step 4: Sonicate in MeOH for 15 min, let dry Step 5: Assemble wearing dust free gloves Inspect the cleaned dry parts for “grey”hue. This means aluminiumoxide is still there.
Read the guidelines in the manual first!

37
Column Bleed – Most Common Cause
RT: 0.00 - 44.89
0 5 10 15 20 25 30 35 40Time (min)
0
2
4
6
8
10
12
14
16
18
20
22
24
Relati
ve Ab
undanc
e
32.60 42.56
30.59
29.01
26.7923.94
22.99
22.7412.52 18.5017.1910.9912.78
NL:1.20E9TIC MS 0503-06
• Chromatogram in FullScan mode ia showing excessive column bleed. • Normal column bleed has intensities below 1e7.
• Column bleed will end up in the MS Source and dirty it up quickly. • It is not visible in SIM or in MS/MS, so often this is a “hidden” problem.

38
Grob Test Mix - From 1978 Still Used Today
Use for monitoring column quality but offers more uses……
39
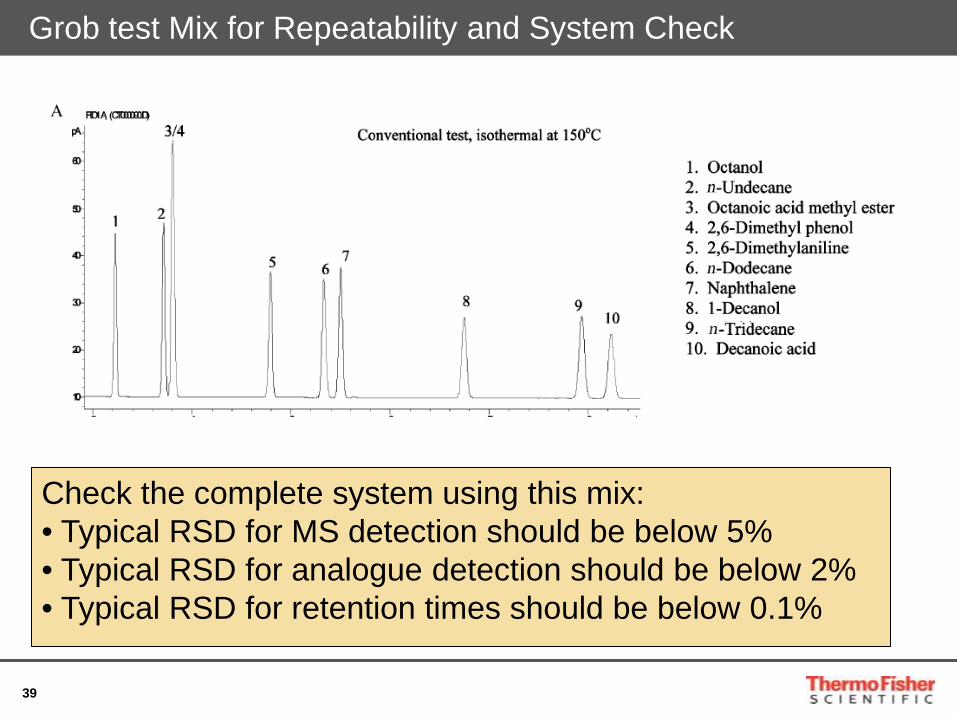
Grob test Mix for Repeatability and System Check
Check the complete system using this mix: • Typical RSD for MS detection should be below 5% • Typical RSD for analogue detection should be below 2% • Typical RSD for retention times should be below 0.1%
40
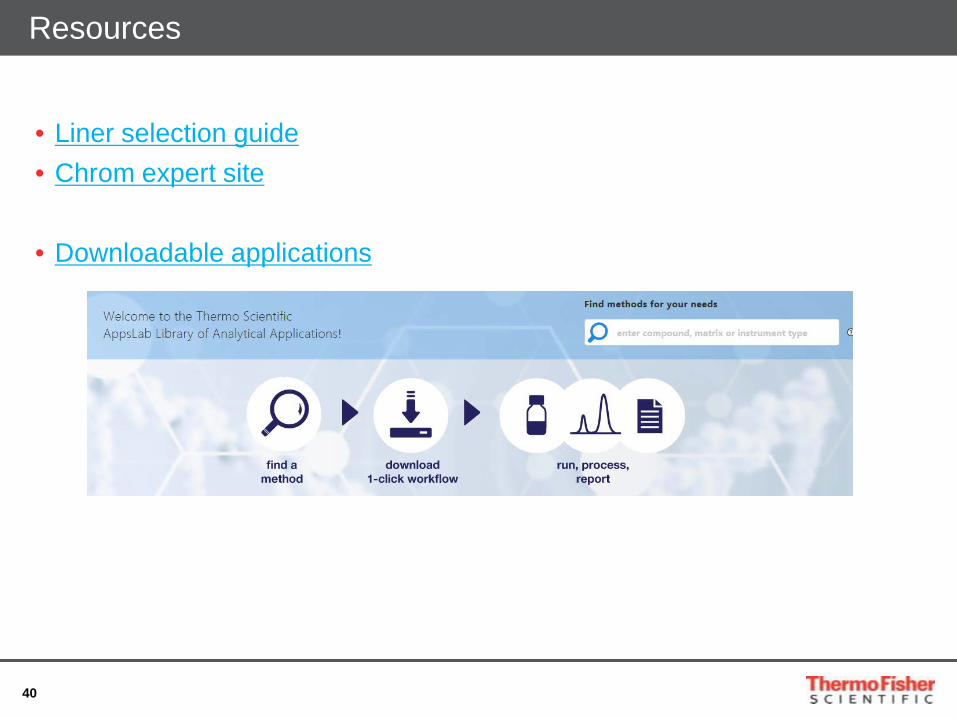
• Liner selection guide • Chrom expert site
• Downloadable applications
Resources

41
Any Questions?
Do you have additional questions or do you want to talk to an expert from Thermo Fisher Scientific? Please send an E-Mail to [email protected] and we will get back to you.