
Probabilistic Methods for Interpreting Electron-Density Maps

Electron Density Measurements Using USPR
FUSION Diagnostics Program Review (Virtual)March 5, 2021
N.C. Luhmann, Jr., University of California at Davis
C.W. Domier, University of California at Davis

Team members and roles
1
Neville C. Luhmann, Jr.Distinguished Professor
Overall project management
Calvin W. DomierProject Scientist
Fabrication, character-ization, installation and
commissioning
Logan HimesDevelopment Engineer
Aid in diagnostic installation on ARPA-E
devices
Jon DannenbergDevelopment EngineerAid in designing and
fabricating port interfaces devices
Ultrashort Pulse Reflectometry (USPR) Diagnostic Overview
2
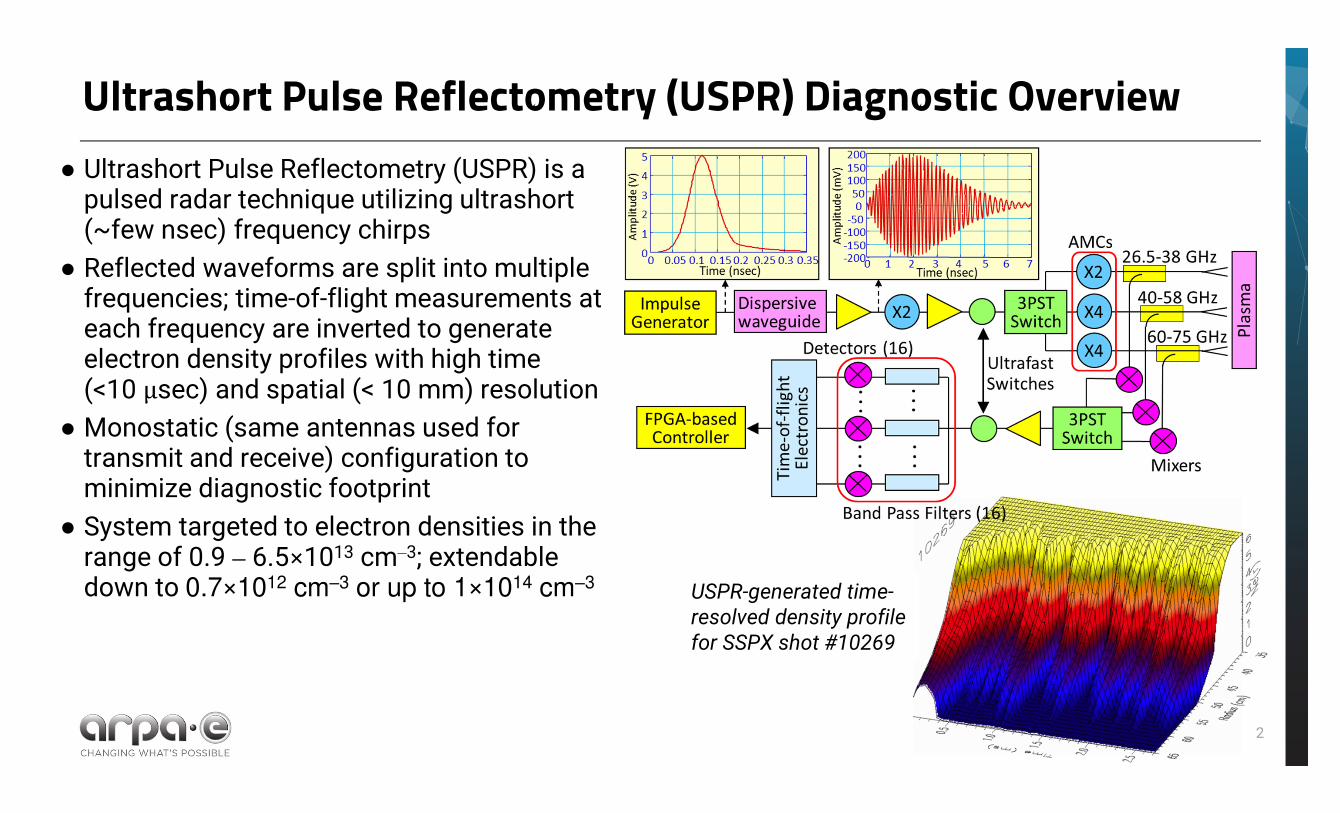
● Ultrashort Pulse Reflectometry (USPR) is a pulsed radar technique utilizing ultrashort (~few nsec) frequency chirps
● Reflected waveforms are split into multiple frequencies; time-of-flight measurements at each frequency are inverted to generate electron density profiles with high time(<10 µsec) and spatial (< 10 mm) resolution
● Monostatic (same antennas used for transmit and receive) configuration to minimize diagnostic footprint
● System targeted to electron densities in the range of 0.9 – 6.5×1013 cm‒3; extendable down to 0.7×1012 cm‒3 or up to 1×1014 cm‒3 USPR-generated time-
resolved density profile for SSPX shot #10269

USPR is a Compact, Highly Portable Density Profile Diagnostic
3
Self-contained data acquisition and system control using a field-programmable gate array (FPGA)
Low data load (16 Msample/sec), allowing both pre- and post-analysis data to be easily stored
FPGA programmed not only to acquire data but also to invert time-of-flight data into time-resolved electron density profiles
System calibration performed in the laboratory prior to installation – no on-site calibration required
USPR transmitter and receiver are arranged in compact rack-mount enclosure boxes
The transmitter and receiver connect to mm-wave assemblies (placed close to the vacuum vessel) via low-loss coaxial cables whose lengths (6 ‒ 20 feet) can be tailored to each plasma device
Monostatic (same antenna for transmit and receive) minimizes the diagnostic footprint on the device
USPR FPGA
USPR Receiver
USPR Transmitter

USPR Diagnostic to be Employed on HIT-SIU and PFRC
4
A lower frequency, two waveguide assembly will be used on the PFRC device, due to its significantly lower density plasmas
The two horns will be placed on adjacent ports, viewing the plasma through lexan windows
Three mm-wave band assemblies will be employed on the HIT-SIU spheromak, spanning 26.5 to 75 GHz
Each horn views the plasma through in-vacuum louvres, with mm-wave assemblies connected through vacuum windows attached to a 36 inch length of waveguide
Key USPR Subsystems (Transmitter and TOF Electronics) Completed
5
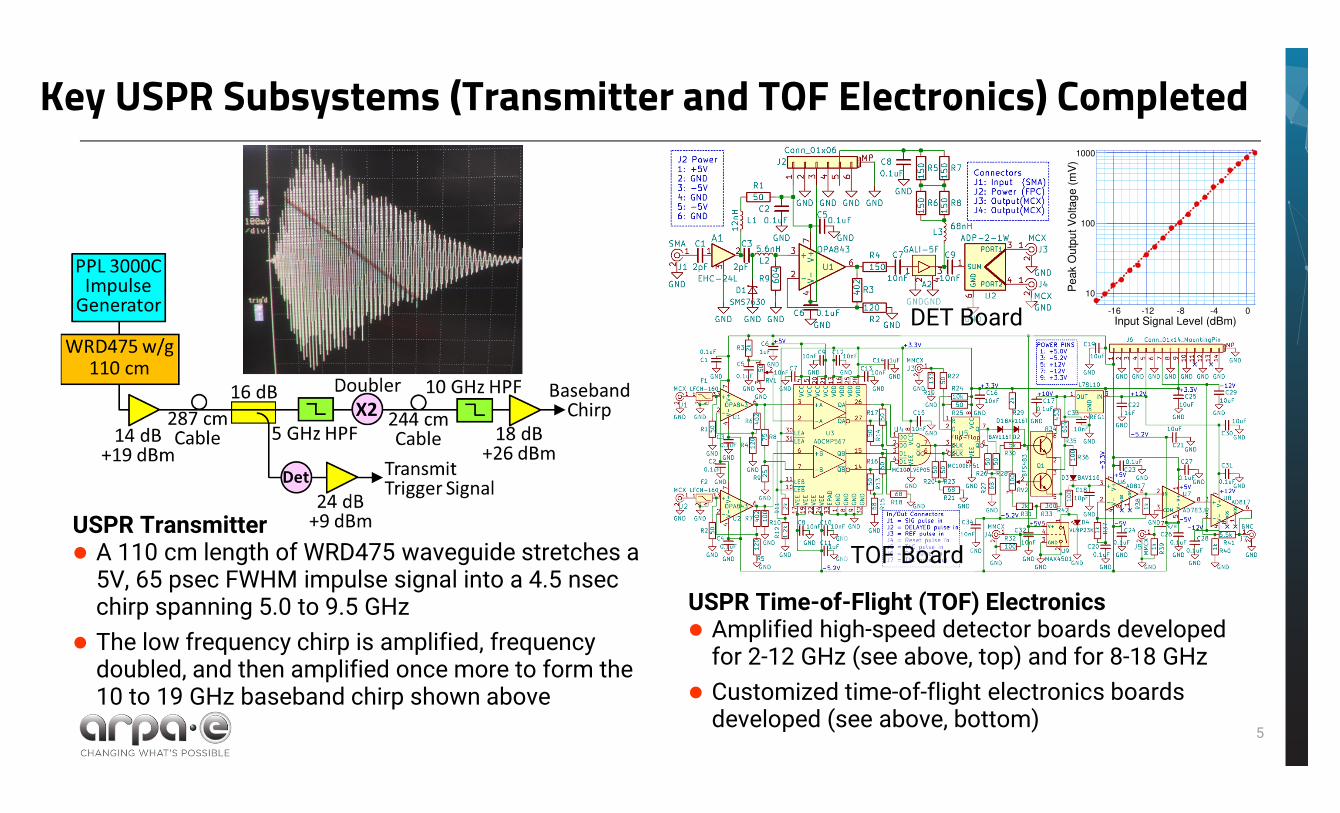
USPR Time-of-Flight (TOF) Electronics Amplified high-speed detector boards developed
for 2-12 GHz (see above, top) and for 8-18 GHz
Customized time-of-flight electronics boards developed (see above, bottom)
10
100
1000
-16 -12 -8 -4 0
Pe
ak O
utp
ut
Vo
lta
ge
(m
V)
Input Signal Level (dBm)
USPR Transmitter A 110 cm length of WRD475 waveguide stretches a
5V, 65 psec FWHM impulse signal into a 4.5 nsec chirp spanning 5.0 to 9.5 GHz
The low frequency chirp is amplified, frequency doubled, and then amplified once more to form the 10 to 19 GHz baseband chirp shown above
DET Board
TOF Board

Future Plans for USPR Beyond ARPA-E Funding, and Opportunities to Provide Millimeter-Wave Diagnostic Support to ARPA-E and Others
6
A non-disclosure agreement has been signed with Lockheed Martin CFR in preparation for a possible test on their device
Originally planned for after testing is complete on the two ARPA-E funded devices; this could take place first depending on COVID-19 travel restrictions as laboratory testing comes to a close
UC Davis has an active program in millimeter-wave and THz diagnostics available to ARPA-E and others in the magnetic fusion plasma community
Electron cyclotron emission (ECE) imaging for 2-D time-resolved Te fluctuations
Microwave imaging reflectometry (MIR) for 2-D time-resolved low-k ne fluctuations
Collective scattering for high-k ne
fluctuations
Interferometry for chord-averaged ne
measure-ments and real-time density feedback control

Opportunities to Provide Millimeter-Wave Diagnostics
7
Optics
W/F-band SoC receiver sensor array(20)
Electronics
Database
2���
Major Radius
��� & �� images
V-band SoC receiver sensor array(12)
V-band SoC transmitter sensor array(1)
High resolution images:
cm and �s resolution Temperature fluctuation Absolute temperature Density fluctuation
Active & passive millimeter-wave imaging diagnostics have been developed for highresolution density and temperature fluctuation measurements by phase/amplitudedetections (DIII-D, San Diego, CA). System-on-Chip (SoC) millimeter wave integratedcircuit technology has been employed.
1. Nuclear Fusion 57.7 (2017): 0720072. IEEE Transactions on Plasma
Science 47.5 (2019): 2110-2130.3. Review of Scientific Instruments 91.9
(2020): 093504. [Editor Pick]
Selected References
Developed with the support of DOE Grant
No. DE-FG02-99ER54531

Opportunities to Provide Millimeter-Wave Diagnostics
8
Optics
W/F-band SoC receiver
sensor array(20)
Electronics
Database
2�
Major Radius
�
�
& ��
images
V-band SoC receiver
sensor array(12)
V-band SoC transmitter
sensor array(1)
RF
LO
IF
In your POCKETWire bonding for
signals & DC biases
Receiver chip diagram Portable receiver module
Transmitter chip diagram Transmitter chip enclosure
The SoC approach has been developed and successfullyapplied on high temperature plasma diagnostics, with wideworking frequency bands from 55 to 140 GHz.
The landmark improvements include, enhanced SNR, noisesuppression, shielding, reduced complexity, compact size,ability to operate in harsh environments, and cost reduction.
The SoC approach enhances the measurements’ capabilitieson MHD instabilities, turbulence behavior during ELMsuppression, and magnetic islands.
Developed with the support of DOE Grant No. DE-FG02-99ER54531


