Electromyograph and Keystroke Dynamics for Spoof...
10
Electromyograph and Keystroke Dynamics for Spoof-Resistant Biometric Authentication Shreyas Venugopalan * , Felix Juefei-Xu * , Benjamin Cowley, and Marios Savvides CyLab Biometrics Center, Electrical and Computer Engineering Carnegie Mellon University, Pittsburgh, PA 15213, USA {svenugop,juefeix,bcowley}@andrew.cmu.edu, [email protected] Abstract Biometrics has come a long way over the past decade in terms of technologies and devices that are used to verify user identities. Three of the more well studied modalities in this field are the face, iris and fingerprint, with the latter two reporting very high user identification/verification rates. In the biometric community there has been little work in study- ing biomedical signals for user recognition purposes. In this paper, we propose using electromyograph (EMG) sig- nals as a person’s biometric signature. The EMG records the motor unit action potentials (MUAP) during any phys- ical motion. Our study is done within the context of a per- son using a keyboard to type a password or any other fixed phrase. Along with EMG signals, we log key press times for the user and study the feasibility of using this data too as a biometric feature. Keypress timings alone if used as a bio- metric, are very easy to spoof and hence we fuse this modal- ity with EMG signals. In order to classify these features, we use subspace modeling as well as Bayesian classifiers. The experiments have been performed within the context of a user typing a fixed pass phrase at a workstation. The idea is to monitor both biometric modalities when this action is performed and study user verification across data capture sessions and within capture sessions. Our approach yields high values of verification rates, which shows the promise of using these modalities as user specific biometric signatures. 1. Introduction The field of biomedical signal processing has taken great strides in the past two decades due to significant ad- vances in biomedical measuring devices and instrumenta- tion. Biomedical modalities such as Magnetic Resonance Imaging (MRI) and Positron Emission Tomography (PET) * These authors contribute equally to this work, and should be consid- ered co-first authors. Keyboard Entry BioRadio System Feature Extraction & Classification User User ID ... Keystroke Dynamics 8 Channel EMG Signals Score Level Fusion Feature Extraction & Classification Figure 1. Our proposed experimental setup. We gather both EMG as well as keystroke dynamic data as the user types a fixed phrase on a keyboard. Various features are extracted from this data as detailed in later sections. We report user identification/verification scores when using either modality as a biometric. enable physicians to visualize organ structures in three di- mensions and perform diagnoses based on these images. Electroencephalography (EEG) signals monitor brain activ- ity and have provided insights into human cognition and into neuro-science in general. There has also been a lot of work in the field of human computer interaction, using these signals. Another signal of interest is the electrocardiogram (ECG), which measures the electrical activity of the heart over a period of time. These signals have been used suc- cessfully to diagnose irregularities in the functioning of the heart. The use of biomedical signals for user identification however is a relatively less explored area. ECG alone has been explored as a biometric modality [30, 37]. Besides these, there has been little work in the use of biomedical signals for biometric based identify verification. This article details our initial study on the use of the elec- tromyograph (EMG) as a biometric, along with keystroke timing dynamics. The former refers to electric impulses measured from motor neurons, that initiate muscle activity, while the latter refers to timing information when striking the keys of a keyboard. Both of these are recorded as a user types on a keyboard. We also explore the possibility of fusion of information from both modalities. The data cap- tured from every user is limited to a fixed text phrase typed on a keyboard (we operate under the assumption that the subject has to type in a password before accessing informa- tion from a workstation - both keystroke timings and EMG
Transcript of Electromyograph and Keystroke Dynamics for Spoof...
Electromyograph and Keystroke Dynamics for Spoof-Resistant BiometricAuthentication
Shreyas Venugopalan∗ , Felix Juefei-Xu∗, Benjamin Cowley, and Marios SavvidesCyLab Biometrics Center, Electrical and Computer Engineering
Carnegie Mellon University, Pittsburgh, PA 15213, USA{svenugop,juefeix,bcowley}@andrew.cmu.edu, [email protected]
Abstract
Biometrics has come a long way over the past decadein terms of technologies and devices that are used to verifyuser identities. Three of the more well studied modalities inthis field are the face, iris and fingerprint, with the latter tworeporting very high user identification/verification rates. Inthe biometric community there has been little work in study-ing biomedical signals for user recognition purposes. Inthis paper, we propose using electromyograph (EMG) sig-nals as a person’s biometric signature. The EMG recordsthe motor unit action potentials (MUAP) during any phys-ical motion. Our study is done within the context of a per-son using a keyboard to type a password or any other fixedphrase. Along with EMG signals, we log key press times forthe user and study the feasibility of using this data too as abiometric feature. Keypress timings alone if used as a bio-metric, are very easy to spoof and hence we fuse this modal-ity with EMG signals. In order to classify these features, weuse subspace modeling as well as Bayesian classifiers. Theexperiments have been performed within the context of auser typing a fixed pass phrase at a workstation. The ideais to monitor both biometric modalities when this action isperformed and study user verification across data capturesessions and within capture sessions. Our approach yieldshigh values of verification rates, which shows the promise ofusing these modalities as user specific biometric signatures.
1. IntroductionThe field of biomedical signal processing has taken
great strides in the past two decades due to significant ad-vances in biomedical measuring devices and instrumenta-tion. Biomedical modalities such as Magnetic ResonanceImaging (MRI) and Positron Emission Tomography (PET)
∗These authors contribute equally to this work, and should be consid-ered co-first authors.
Keyboard Entry
BioRadio System
FeatureExtraction &
Classification
User User ID
...
Keystroke Dynamics
8 Channel EMG Signals
Score Level FusionFeature
Extraction & Classification
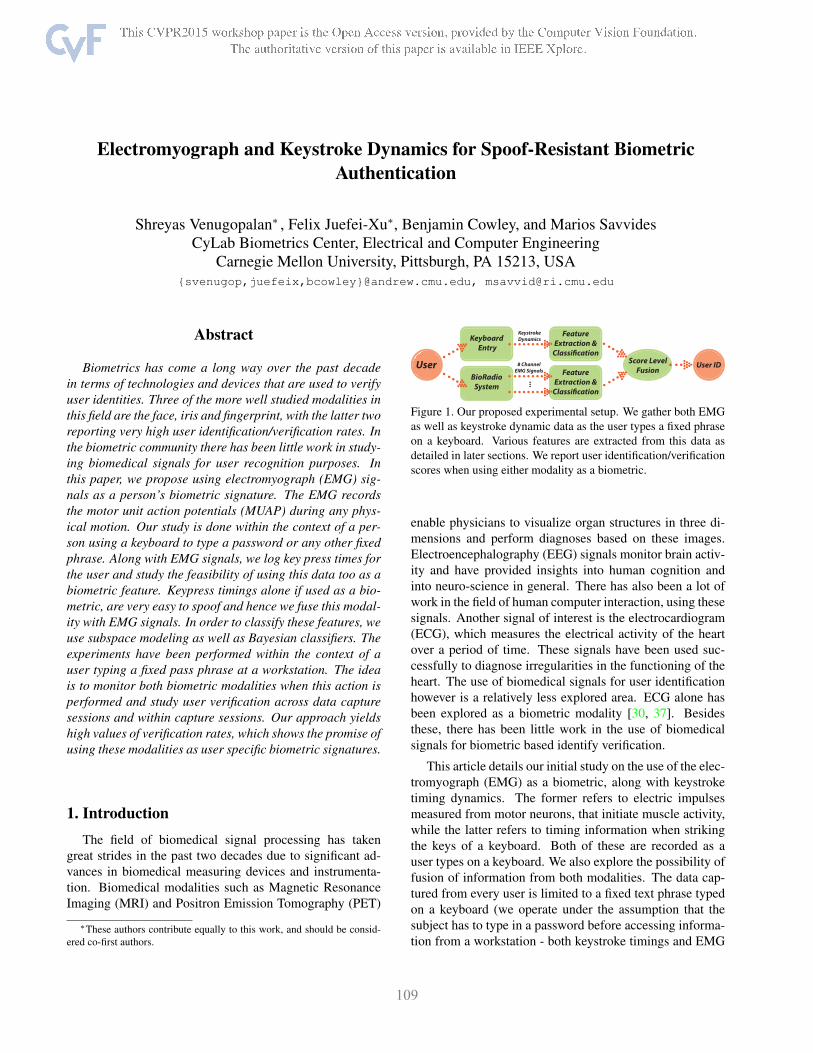
Figure 1. Our proposed experimental setup. We gather both EMGas well as keystroke dynamic data as the user types a fixed phraseon a keyboard. Various features are extracted from this data asdetailed in later sections. We report user identification/verificationscores when using either modality as a biometric.
enable physicians to visualize organ structures in three di-mensions and perform diagnoses based on these images.Electroencephalography (EEG) signals monitor brain activ-ity and have provided insights into human cognition andinto neuro-science in general. There has also been a lot ofwork in the field of human computer interaction, using thesesignals. Another signal of interest is the electrocardiogram(ECG), which measures the electrical activity of the heartover a period of time. These signals have been used suc-cessfully to diagnose irregularities in the functioning of theheart. The use of biomedical signals for user identificationhowever is a relatively less explored area. ECG alone hasbeen explored as a biometric modality [30, 37]. Besidesthese, there has been little work in the use of biomedicalsignals for biometric based identify verification.
This article details our initial study on the use of the elec-tromyograph (EMG) as a biometric, along with keystroketiming dynamics. The former refers to electric impulsesmeasured from motor neurons, that initiate muscle activity,while the latter refers to timing information when strikingthe keys of a keyboard. Both of these are recorded as auser types on a keyboard. We also explore the possibility offusion of information from both modalities. The data cap-tured from every user is limited to a fixed text phrase typedon a keyboard (we operate under the assumption that thesubject has to type in a password before accessing informa-tion from a workstation - both keystroke timings and EMG
signals are recorded as he/she types in this password). Anoutline of our experimental setup is shown in Figure 1. Typ-ically, a muscle is composed of several motor units (MUs).Any EMG measurement performed using surface electrodeson the skin, as done in our work, picks up the Motor UnitAction Potentials (MUAPs). These signals are currentlyused non-medically for gesture recognition [10] [33] andgeneral signal classification [2]. They are also used in awide range of medical fields of study, including neuromus-cular diseases, kinesiology, and motor control disorders. Inthe next section, we list some of the past literature on theuse of EMG as well as keystroke dynamics for various pur-poses, following which in section 3 we describe our dataacquisition setup as well as the database used in our study.Section 4 describes the various features that were extractedfrom the EMG measurements as well as from the keystroketiming measurements. In section 5 we present results foruser identification/verification experiments using both thesefeature sets. Finally, in section 6 we provide a summaryand a few concluding remarks including directions for fu-ture work.
2. Previous WorkAs mentioned earlier, the EMG signal is an electrical
representation of neuromuscular activation during the con-traction/relaxation of muscles. The EMG signals can be cat-egorized into surface EMG and intramuscle EMG [25]. Thesurface myoelectric signal shows effectiveness in control-ling powered upper limb prostheses. Most commerciallyavailable systems utilize the surface EMG signal. Morerecently, studies on using an implantable myoelectric sen-sor which measures the internal (intramuscular) EMG havebeen published. Hargrove et al. in [8] have shown compar-isons of surface and intramuscular EMG signal based clas-sification. EMG signal processing and classification tech-niques have gone through tremendous improvements sincethe early 1980s. Saridis and Gootee [34] published one ofthe earliest works on EMG pattern analysis and classifica-tion for a prosthetic arm. Their algorithm was able to de-compose the composite motion to the 6 primitive motionsi.e. humeral rotation - in and out, elbow flexion and exten-sion, and wrist pronation and supination. Other early workson EMG-aided arm prosthesis can be found in [5, 4]. Morerecently, Martelloni et al. [28] proposed that different ob-jects can be identified using the EMG signal recorded fromproximal arm muscles and they showed that the activationof proximal muscles can be statistically different for dif-ferent grip types. Huang et al. [9] introduced the use ofGaussian Mixture Models (GMMs) for multiple limb mo-tion classification using continuous myoelectric signals andshow exceptional classification accuracy compared to lineardiscriminant analysis, linear perceptron network and multi-layer perceptron neural network.
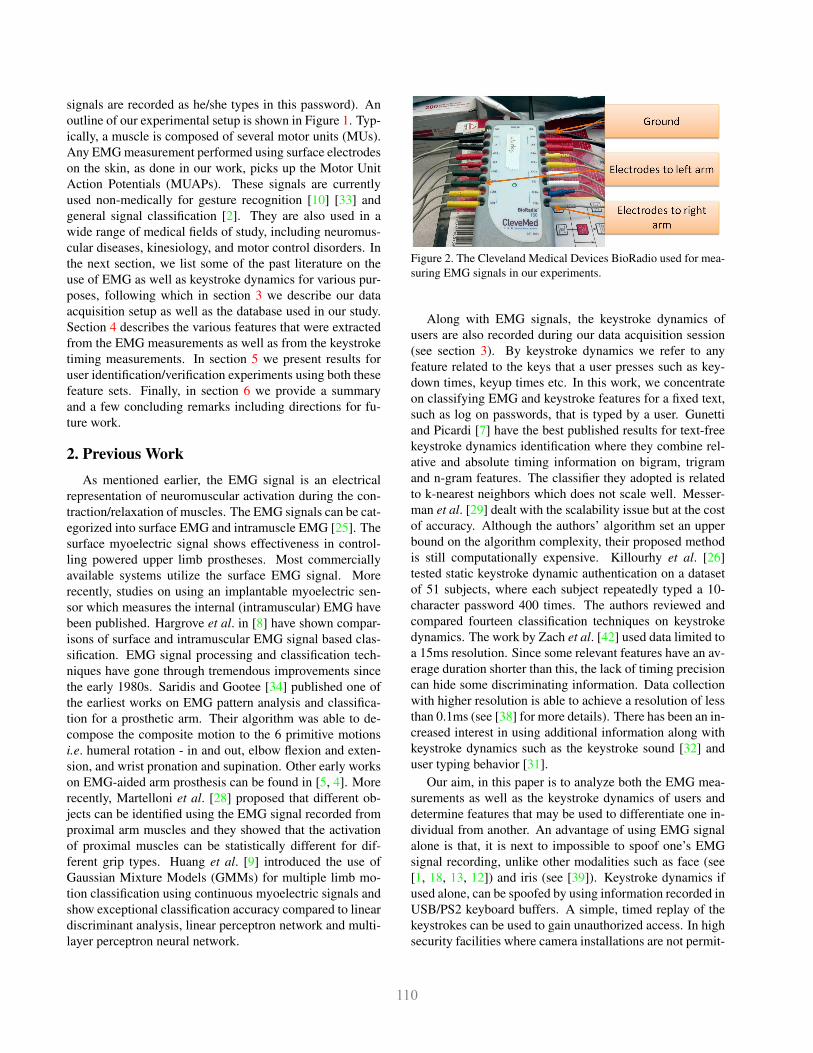
Figure 2. The Cleveland Medical Devices BioRadio used for mea-suring EMG signals in our experiments.
Along with EMG signals, the keystroke dynamics ofusers are also recorded during our data acquisition session(see section 3). By keystroke dynamics we refer to anyfeature related to the keys that a user presses such as key-down times, keyup times etc. In this work, we concentrateon classifying EMG and keystroke features for a fixed text,such as log on passwords, that is typed by a user. Gunettiand Picardi [7] have the best published results for text-freekeystroke dynamics identification where they combine rel-ative and absolute timing information on bigram, trigramand n-gram features. The classifier they adopted is relatedto k-nearest neighbors which does not scale well. Messer-man et al. [29] dealt with the scalability issue but at the costof accuracy. Although the authors’ algorithm set an upperbound on the algorithm complexity, their proposed methodis still computationally expensive. Killourhy et al. [26]tested static keystroke dynamic authentication on a datasetof 51 subjects, where each subject repeatedly typed a 10-character password 400 times. The authors reviewed andcompared fourteen classification techniques on keystrokedynamics. The work by Zach et al. [42] used data limited toa 15ms resolution. Since some relevant features have an av-erage duration shorter than this, the lack of timing precisioncan hide some discriminating information. Data collectionwith higher resolution is able to achieve a resolution of lessthan 0.1ms (see [38] for more details). There has been an in-creased interest in using additional information along withkeystroke dynamics such as the keystroke sound [32] anduser typing behavior [31].
Our aim, in this paper is to analyze both the EMG mea-surements as well as the keystroke dynamics of users anddetermine features that may be used to differentiate one in-dividual from another. An advantage of using EMG signalalone is that, it is next to impossible to spoof one’s EMGsignal recording, unlike other modalities such as face (see[1, 18, 13, 12]) and iris (see [39]). Keystroke dynamics ifused alone, can be spoofed by using information recorded inUSB/PS2 keyboard buffers. A simple, timed replay of thekeystrokes can be used to gain unauthorized access. In highsecurity facilities where camera installations are not permit-
ted, this problem assumes a higher significance. RecordingEMG signals along with the keystroke timings, allows us toperform a liveness test on the person entering the password,in addition to gaining a different biometric modality.
3. Acquisition of EMG DataIn this section, we present a description of how our data
was acquired, as well as of the database built, for use in ourexperiments.
3.1. Data Acquisition Sessions
The data was collected from a total of 14 participants.The acquisition process for a participant consisted of twosessions, which we will henceforth refer to as session I andsession II. Each session consists of individual trials. Duringa trial, the participant types in the phrase “Hello, world.#18”followed by the ‘return’ key on a standard QWERTY key-board. For every key press, using a custom built keylogger,we recorded the key pressed as well as the CPU time instantfor key press and release. In addition, every time the partic-ipant types in the phrase, electrodes attached to his/her armrecord the EMG signal using a BioRadio (see section 3.2for a description). In this manner, during session I, 50 suchtrials were recorded. Session II was recorded more than 30minutes after session I and includes 100 such trials fromthe same 14 participants. The keystroke features extractedinclude the keydown-to-keydown time, keyup-to-keydowntime, and key hold time for each key in the typed phrase.For each trial, features were extracted and concatenated intoa feature vector
3.2. Recording EMG Activity Using BioRadio
The BioRadio device, shown in Figure 2, manufacturedby Cleveland Medical Devices, Inc. was used to record theEMG signal during each participant’s trial as mentioned.BioRadio includes: (1) a wireless radio with USB interfaceto record the signal. (2) 17 snap MVAP II electrodes with17 insulated snap leads. A pair of electrodes measures onechannel of EMG data. 8 such channels (4 channels fromeach arm) were recorded by placing the electrodes on vari-ous portions of the arm. An additional electrode was used toground the BioRadio. (3) a digital 5Hz high pass filter with60 Hz notch filters on each channel. The filters are imple-mented on the BioLite software package available with theBioRadio device. Electrodes were placed on the skin abovethe hypothenar eminence, the thenar eminence, the exten-sor carpi ulnaris and anconeus, and the flexor carpi radialusand palmaris longus. Figure 3 shows the electrode place-ments for a participant. Using these, the surface voltageswere recorded in mV at 960 Hz with a maximum voltage of3V by the BioRadio.
The electrode pair recording the activity of the thenareminence was intended to record much of the EMG data
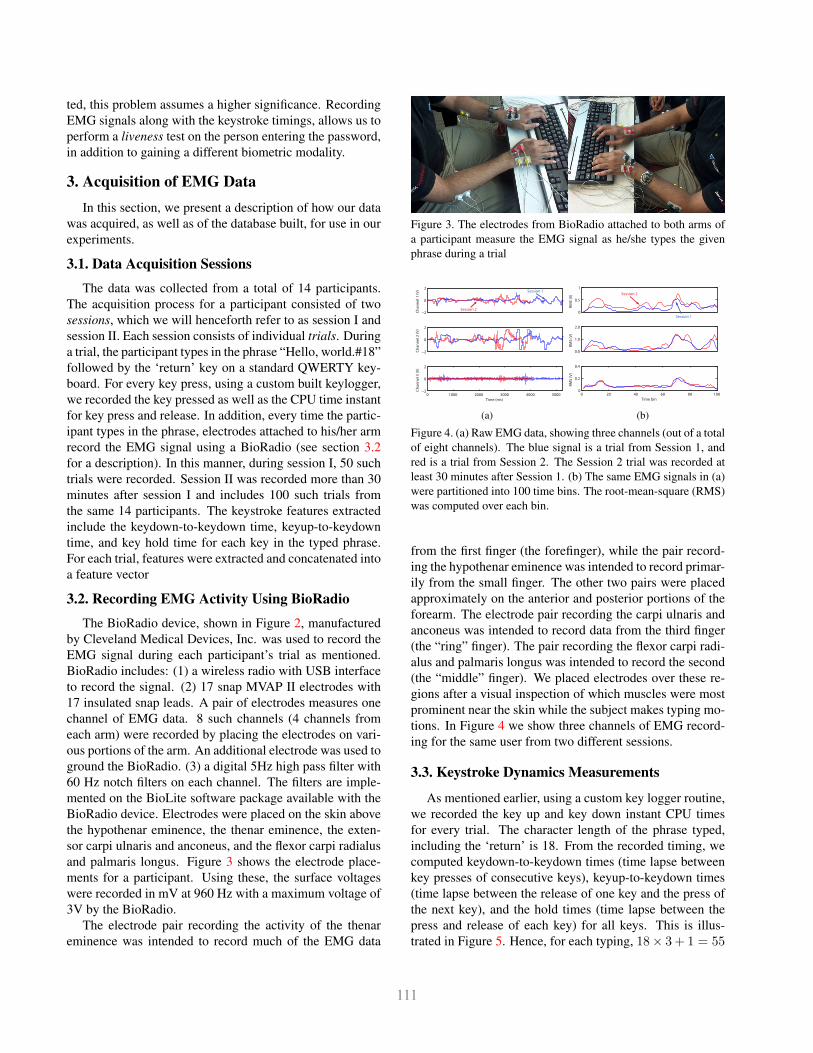
Figure 3. The electrodes from BioRadio attached to both arms ofa participant measure the EMG signal as he/she types the givenphrase during a trial
−2
0
2
Chan
nel 1
(V)
−2
0
2
Chan
nel 2
(V)
0 1000 2000 3000 4000 5000−2
0
2
Chan
nel 3
(V)
Time (ms)
Session 1
Session 2
(a)
0
0.5
1
RMS
(V)
0.0
1.0
2.0
RMS
(V)
0 20 40 60 80 1000
0.2
0.4
RMS
(V)
Time bin
Session 1
Session 2
(b)
Figure 4. (a) Raw EMG data, showing three channels (out of a totalof eight channels). The blue signal is a trial from Session 1, andred is a trial from Session 2. The Session 2 trial was recorded atleast 30 minutes after Session 1. (b) The same EMG signals in (a)were partitioned into 100 time bins. The root-mean-square (RMS)was computed over each bin.
from the first finger (the forefinger), while the pair record-ing the hypothenar eminence was intended to record primar-ily from the small finger. The other two pairs were placedapproximately on the anterior and posterior portions of theforearm. The electrode pair recording the carpi ulnaris andanconeus was intended to record data from the third finger(the “ring” finger). The pair recording the flexor carpi radi-alus and palmaris longus was intended to record the second(the “middle” finger). We placed electrodes over these re-gions after a visual inspection of which muscles were mostprominent near the skin while the subject makes typing mo-tions. In Figure 4 we show three channels of EMG record-ing for the same user from two different sessions.
3.3. Keystroke Dynamics Measurements
As mentioned earlier, using a custom key logger routine,we recorded the key up and key down instant CPU timesfor every trial. The character length of the phrase typed,including the ‘return’ is 18. From the recorded timing, wecomputed keydown-to-keydown times (time lapse betweenkey presses of consecutive keys), keyup-to-keydown times(time lapse between the release of one key and the press ofthe next key), and the hold times (time lapse between thepress and release of each key) for all keys. This is illus-trated in Figure 5. Hence, for each typing, 18× 3 + 1 = 55

Keydown-Keydown Time (Di)Keyup-Keydown Time (Ui)Hold Time (Hi)
D1 D2 D3 D4 D5
H1 H2 H3 H4 H5U1 U2 U3 U4 U5
Extracted Keystroke Dynamics Feature:D1H1U1D2H2U2D3H3U3D4H4U4D5H5U5...
Figure 5. Example of keystroke dynamics features.
timing features were extracted and concatenated into a fea-ture vector. These features are used independent of EMGdata to identify participants in our experiments.
4. Methods for EMG/Keystroke Classification
In this section we outline the various features extractedfrom the EMG signals for user identification. As mentionedin 3, all the data was collected in two sessions, with the per-son typing a fixed phrase on a keyboard. Each EMG trialwithin a session is segmented out using the timing informa-tion recorded by the keylogger. The experiments describedin this paper were meant to: (1) study the variation in theEMG signal for a given subject, in a given session and ex-tract features from all trials within a session, for the purposeof user identification. Higher identification rates in theseexperiments will make these features useful in continuousauthentication scenarios. Since there are two recording ses-sions, two sets of equivalent experiments will be performedin each case. Any experiment using samples from sessionI alone will henceforth be termed E1 and those involv-ing samples solely from session II will be termed E2. (2)study the user identification rates when samples are com-pared across capture sessions. In this set of experiments,we have used data (either all or a subset) from session I astraining samples. User identification was then performed onsamples drawn from session II. These experiments will betermed as E3.
In most of our experiments, we have used all trials fromsession I (which has fewer trials per user) as the trainingdata for our supervised learning classifiers and trials fromsession II as the testing data. One of the intrinsic problemswe faced during our experiments was that, trials for a sub-ject are not of equal length (since the user does not type thesame sequence in the same amount of time each trial). Oneway to overcome this issue is to crop every trial to the short-est trial’s length. However, this method is not favorable,as it assumes the user has finished most of the keystrokeswithin that time. Our solution was to divide the trial intoM non-overlapping bins. We then compute the root-mean-
square (RMS) value for each bin. Hence, for eight channels,we are left with an 8M feature for each trial. This methodhas multiple advantages: (1) every trial (within a class andacross classes) has the same number of time bins, and (2)trials are better aligned. Additionally, the RMS value alsoserves a denoising purpose. In the following sections, everytrial has been represented in this manner. Figure 4 showsthree channels from the EMG of a user, from two differentsessions, overlayed on each other. As is evident from thefigure, binning the data helps in smoothing out the variationand make the data from different sessions look more similarto each other.
4.1. Using the Raw EMG Signal
Our first experiment, used the data samples such as thoseshown in Figure 4(b), as features. A distance matrix, whichwe call a similarity matrix with one-to-one Euclidean dis-tance between every pair of samples was generated. Fol-lowing this, each sample A was classified as belonging tothe class represented by the sample B to which it is closest.More formally, if S is our similarity matrix, si,j representsthe Euclidean distance between samples i and j. In orderto classify for instance, the first sample, we find a samplel such that sl,1 = min {sj,1|j = 1, 2, . . . , N}. We classifythe first sample as the class to which l belongs. Followingthis approach, the identification rates for the experimentsE1, E2 and E3 are reported in Table 1.
4.2. Bayesian Classifiers
As mentioned in section 3 we collected data from eachuser over the course of two sessions - 50 trials in session Iand 100 trials in session II. In this section we estimate theProbability Density Function (PDF) corresponding to eachuser (we use the terms ‘user’ and ‘class’ interchangeablyin the following text) using all the samples from session I.Given these PDFs, for every sample in session II, we canestimate a likelihood value and can then assign a class labelto it based on the maximum likelihood estimate (MLE). Weadopt two approaches to density estimation in this work -a non-parameteric approach using the k-Nearest Neighbor(k-NN) method (see [6]) and a parameteric approach wherewe fit a Gaussian distribution to the samples in session I.
Non-parametric Density Estimation Using k-NNIn our approach, rather than computing the density estimatefor every point in the feature space, we associate a likeli-hood function with each data sample in session II, based onits k nearest neighbors form session I. Consider a ‘test’ datasample xi, from session II. Among its k nearest neighborslet {k1, k2, ..., kN} be the number of neighbors belongingto classes λ1, λ2, . . . , λN respectively. We define the likeli-hood of xi belonging to class λl as
P (x = xi|λ = λl) =klk
(1)

Now, consider the expression for Bayes rule,
P (λ = λl|x = xi) =P (x = xi|λ = λl)P (λ = λl)
P (x = xi)
where P (λ|x) is the posterior probability (i.e. of theclass given the observations), P (x|λ) is the likelihood (i.e.of the observations given the class), P (λ) is the prior distri-bution of the class and P (x) is the evidence (i.e. the prob-ability of the observations). In order to classify a giventest sample xi, we will pick the class λl that maximizesP (λ = λl|x = xi) based on our observations. In our exper-iments we assume a uniform prior over all classes and hencethis problem degenerates to a maximum likelihood classifieri.e. we pick the class that maximizes P (x = xi|λ = λl).Hence, the class with the maximum likelihood (ML) towhich x belongs is given by
λ̂ = argminl∈{1,2,...,N}
P (x = xi|λ = λl)
= argminl∈{1,2,...,N}
klk
(2)
Fitting a Gaussian DistributionIf we assume the d dimensional samples, x, from every
class has a Gaussian distribution (shown in eqn. (3)),
N (x|µ,Σ) =1
(2π|Σ|)d/2exp
((x− µ)TΣ−1(x− µ)
2
)(3)
then from the data in session I, we can estimate the den-sity function parameters. Formally, for a given sample xi,P (x = xi|λ = λl) = N (x = xi|µc,Σc) where N (µ,Σ)denotes a Gaussian distribution with mean µ and covarianceΣ. For each class λl, with Kl samples in session I, we canestimate the parameters as,
µl =1
Kl
Kl∑i=1
xi (4)
Σl =1
Kl
Kl∑i=1
(xi − µl)(xi − µl)T (5)
The ML estimate of the class label for a given data samplefrom session II is given by,
λ̂ = argminl∈{1,2,...,N}
N (x = xi|µl,Σl) (6)
4.3. Linear Subspace Modeling
In addition, we have utilized the following three linearsubspace learning methods: Principal Component Analy-sis (PCA), Unsupervised Discriminant Projection (UDP)[41, 16, 22, 20] and Class-Dependent Feature Analysis(CFA) [40, 19, 14, 15] for modeling the signals in variouslinear subspaces and perform matching tasks using the cor-responding subspace features.
Using EMG
Raw Signal PCA SOSE1 98.67 96.33 82.83E2 96.94 96.43 81.28E3 40.00 - 32.26
Table 1. Rank 1 ID Rates when performing one-to-one compar-isons between subject trials using recorded EMG data alone from14 participants.
5. Experiments and ResultsIn this section we present the results obtained during our
identification and verification experiments, using the fea-tures that were described in the previous section. We usedata from two acquisition sessions, as mentioned in the pre-vious section. We will refer to users as ‘classes’ in the fol-lowing text (short for ‘user classes’). Session I contains 600samples in total, of both EMG data and keystroke dynam-ics data, while session II contains 1175 samples from bothmodalities.
5.1. Using Trials from a Single Capture Session
A one-to-one comparison using the euclidean distancemetric was performed. Rank 1 identification rates obtainedare shown in Table 1. As described in section 4,E1 refers toone-to-one comparisons using only session I data, E2 refersto comparisons using only session II data. E3 refers to theexperiment when samples in session II were compared withsamples in session I and classified accordingly. For PCAexperiment E1, a subspace was built with samples in ses-sion II and session I samples were projected onto this spacebefore one-to-one comparisons; vice versa for PCA experi-ment E2. In this table, we also explore the possibility of us-ing the Second Order Statistics (SOS) of the trials for classi-fication purposes. Specifically,we use the power spectra ofthe signals as features for this purpose. Ideally, we wouldexpect the power spectra of samples corresponding to a userwithin a single session to resemble each other. We see thatthis is indeed the case as shown by the results of the E1
and E2 experiments. However the identification rate dropswhen comparing power spectra across sessions.
From the identification rates obtained, it is evident thatwithin a given session, the recorded signals are very simi-lar to each other. The challenge is to identify users acrosssessions, which is discussed next. By just comparing theraw signals themselves, we get an identification rate of 40%as seen in Table 1. Next, we performed a set of verifica-tion experiments, in which we set a threshold for the sim-ilarity scores between samples and found the rate of falseaccepts and genuine accepts. The result is visualized usinga set of Receiver Operating Characteristic (ROC) curves. InFigure 6(a) we show the ROC curves when classifying theEMG signals using various subspace modeling techniquespresented in the previous section. We built subspace models
Using EMG Signals
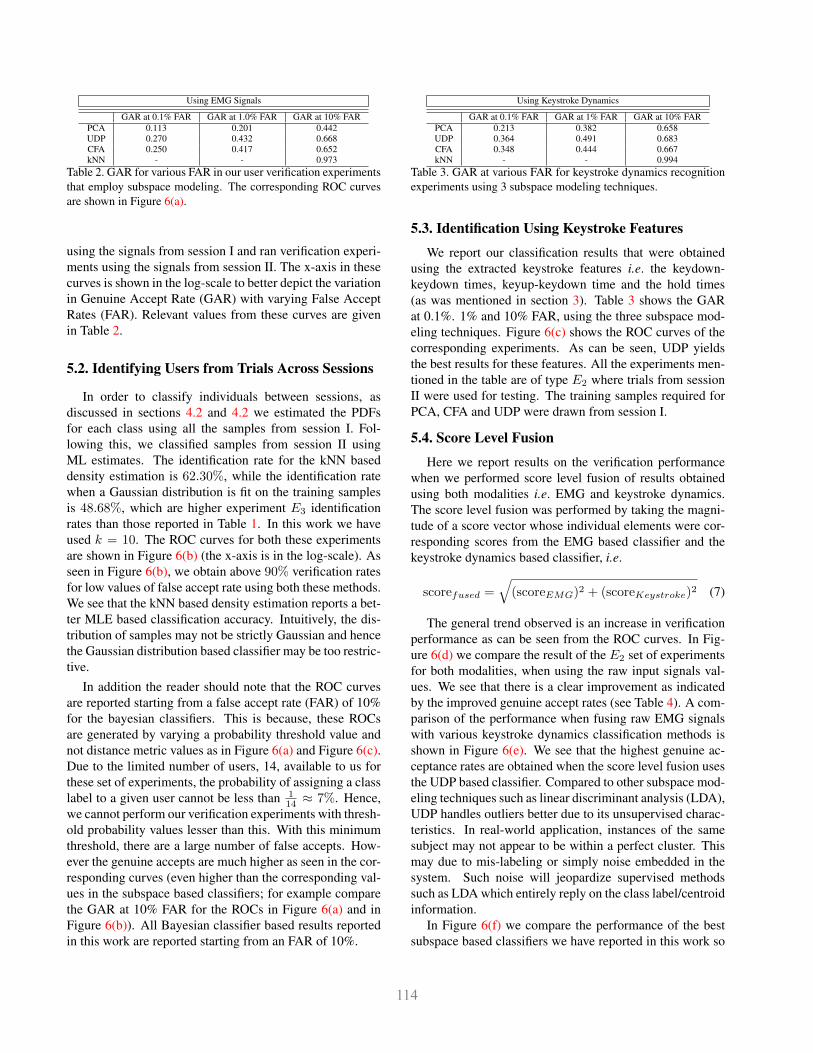
GAR at 0.1% FAR GAR at 1.0% FAR GAR at 10% FARPCA 0.113 0.201 0.442UDP 0.270 0.432 0.668CFA 0.250 0.417 0.652kNN - - 0.973
Table 2. GAR for various FAR in our user verification experimentsthat employ subspace modeling. The corresponding ROC curvesare shown in Figure 6(a).
using the signals from session I and ran verification experi-ments using the signals from session II. The x-axis in thesecurves is shown in the log-scale to better depict the variationin Genuine Accept Rate (GAR) with varying False AcceptRates (FAR). Relevant values from these curves are givenin Table 2.
5.2. Identifying Users from Trials Across Sessions
In order to classify individuals between sessions, asdiscussed in sections 4.2 and 4.2 we estimated the PDFsfor each class using all the samples from session I. Fol-lowing this, we classified samples from session II usingML estimates. The identification rate for the kNN baseddensity estimation is 62.30%, while the identification ratewhen a Gaussian distribution is fit on the training samplesis 48.68%, which are higher experiment E3 identificationrates than those reported in Table 1. In this work we haveused k = 10. The ROC curves for both these experimentsare shown in Figure 6(b) (the x-axis is in the log-scale). Asseen in Figure 6(b), we obtain above 90% verification ratesfor low values of false accept rate using both these methods.We see that the kNN based density estimation reports a bet-ter MLE based classification accuracy. Intuitively, the dis-tribution of samples may not be strictly Gaussian and hencethe Gaussian distribution based classifier may be too restric-tive.
In addition the reader should note that the ROC curvesare reported starting from a false accept rate (FAR) of 10%for the bayesian classifiers. This is because, these ROCsare generated by varying a probability threshold value andnot distance metric values as in Figure 6(a) and Figure 6(c).Due to the limited number of users, 14, available to us forthese set of experiments, the probability of assigning a classlabel to a given user cannot be less than 1
14 ≈ 7%. Hence,we cannot perform our verification experiments with thresh-old probability values lesser than this. With this minimumthreshold, there are a large number of false accepts. How-ever the genuine accepts are much higher as seen in the cor-responding curves (even higher than the corresponding val-ues in the subspace based classifiers; for example comparethe GAR at 10% FAR for the ROCs in Figure 6(a) and inFigure 6(b)). All Bayesian classifier based results reportedin this work are reported starting from an FAR of 10%.
Using Keystroke Dynamics
GAR at 0.1% FAR GAR at 1% FAR GAR at 10% FARPCA 0.213 0.382 0.658UDP 0.364 0.491 0.683CFA 0.348 0.444 0.667kNN - - 0.994
Table 3. GAR at various FAR for keystroke dynamics recognitionexperiments using 3 subspace modeling techniques.
5.3. Identification Using Keystroke Features
We report our classification results that were obtainedusing the extracted keystroke features i.e. the keydown-keydown times, keyup-keydown time and the hold times(as was mentioned in section 3). Table 3 shows the GARat 0.1%. 1% and 10% FAR, using the three subspace mod-eling techniques. Figure 6(c) shows the ROC curves of thecorresponding experiments. As can be seen, UDP yieldsthe best results for these features. All the experiments men-tioned in the table are of type E2 where trials from sessionII were used for testing. The training samples required forPCA, CFA and UDP were drawn from session I.
5.4. Score Level Fusion
Here we report results on the verification performancewhen we performed score level fusion of results obtainedusing both modalities i.e. EMG and keystroke dynamics.The score level fusion was performed by taking the magni-tude of a score vector whose individual elements were cor-responding scores from the EMG based classifier and thekeystroke dynamics based classifier, i.e.
scorefused =√
(scoreEMG)2 + (scoreKeystroke)2 (7)
The general trend observed is an increase in verificationperformance as can be seen from the ROC curves. In Fig-ure 6(d) we compare the result of the E2 set of experimentsfor both modalities, when using the raw input signals val-ues. We see that there is a clear improvement as indicatedby the improved genuine accept rates (see Table 4). A com-parison of the performance when fusing raw EMG signalswith various keystroke dynamics classification methods isshown in Figure 6(e). We see that the highest genuine ac-ceptance rates are obtained when the score level fusion usesthe UDP based classifier. Compared to other subspace mod-eling techniques such as linear discriminant analysis (LDA),UDP handles outliers better due to its unsupervised charac-teristics. In real-world application, instances of the samesubject may not appear to be within a perfect cluster. Thismay due to mis-labeling or simply noise embedded in thesystem. Such noise will jeopardize supervised methodssuch as LDA which entirely reply on the class label/centroidinformation.
In Figure 6(f) we compare the performance of the bestsubspace based classifiers we have reported in this work so
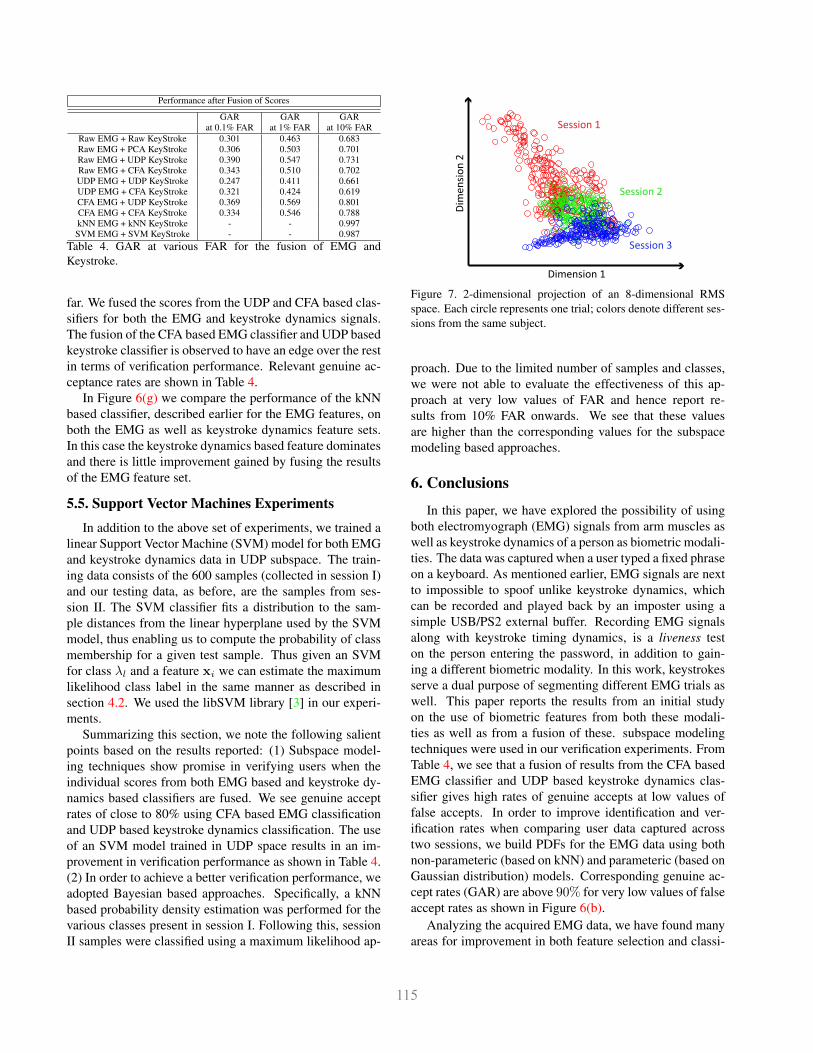
Performance after Fusion of Scores
GAR GAR GARat 0.1% FAR at 1% FAR at 10% FAR
Raw EMG + Raw KeyStroke 0.301 0.463 0.683Raw EMG + PCA KeyStroke 0.306 0.503 0.701Raw EMG + UDP KeyStroke 0.390 0.547 0.731Raw EMG + CFA KeyStroke 0.343 0.510 0.702UDP EMG + UDP KeyStroke 0.247 0.411 0.661UDP EMG + CFA KeyStroke 0.321 0.424 0.619CFA EMG + UDP KeyStroke 0.369 0.569 0.801CFA EMG + CFA KeyStroke 0.334 0.546 0.788kNN EMG + kNN KeyStroke - - 0.997SVM EMG + SVM KeyStroke - - 0.987
Table 4. GAR at various FAR for the fusion of EMG andKeystroke.
far. We fused the scores from the UDP and CFA based clas-sifiers for both the EMG and keystroke dynamics signals.The fusion of the CFA based EMG classifier and UDP basedkeystroke classifier is observed to have an edge over the restin terms of verification performance. Relevant genuine ac-ceptance rates are shown in Table 4.
In Figure 6(g) we compare the performance of the kNNbased classifier, described earlier for the EMG features, onboth the EMG as well as keystroke dynamics feature sets.In this case the keystroke dynamics based feature dominatesand there is little improvement gained by fusing the resultsof the EMG feature set.
5.5. Support Vector Machines Experiments
In addition to the above set of experiments, we trained alinear Support Vector Machine (SVM) model for both EMGand keystroke dynamics data in UDP subspace. The train-ing data consists of the 600 samples (collected in session I)and our testing data, as before, are the samples from ses-sion II. The SVM classifier fits a distribution to the sam-ple distances from the linear hyperplane used by the SVMmodel, thus enabling us to compute the probability of classmembership for a given test sample. Thus given an SVMfor class λl and a feature xi we can estimate the maximumlikelihood class label in the same manner as described insection 4.2. We used the libSVM library [3] in our experi-ments.
Summarizing this section, we note the following salientpoints based on the results reported: (1) Subspace model-ing techniques show promise in verifying users when theindividual scores from both EMG based and keystroke dy-namics based classifiers are fused. We see genuine acceptrates of close to 80% using CFA based EMG classificationand UDP based keystroke dynamics classification. The useof an SVM model trained in UDP space results in an im-provement in verification performance as shown in Table 4.(2) In order to achieve a better verification performance, weadopted Bayesian based approaches. Specifically, a kNNbased probability density estimation was performed for thevarious classes present in session I. Following this, sessionII samples were classified using a maximum likelihood ap-
Session 1
Session 2
Session 3
Dimension 1
Dim
ensio
n 2
Figure 7. 2-dimensional projection of an 8-dimensional RMSspace. Each circle represents one trial; colors denote different ses-sions from the same subject.
proach. Due to the limited number of samples and classes,we were not able to evaluate the effectiveness of this ap-proach at very low values of FAR and hence report re-sults from 10% FAR onwards. We see that these valuesare higher than the corresponding values for the subspacemodeling based approaches.
6. Conclusions
In this paper, we have explored the possibility of usingboth electromyograph (EMG) signals from arm muscles aswell as keystroke dynamics of a person as biometric modali-ties. The data was captured when a user typed a fixed phraseon a keyboard. As mentioned earlier, EMG signals are nextto impossible to spoof unlike keystroke dynamics, whichcan be recorded and played back by an imposter using asimple USB/PS2 external buffer. Recording EMG signalsalong with keystroke timing dynamics, is a liveness teston the person entering the password, in addition to gain-ing a different biometric modality. In this work, keystrokesserve a dual purpose of segmenting different EMG trials aswell. This paper reports the results from an initial studyon the use of biometric features from both these modali-ties as well as from a fusion of these. subspace modelingtechniques were used in our verification experiments. FromTable 4, we see that a fusion of results from the CFA basedEMG classifier and UDP based keystroke dynamics clas-sifier gives high rates of genuine accepts at low values offalse accepts. In order to improve identification and ver-ification rates when comparing user data captured acrosstwo sessions, we build PDFs for the EMG data using bothnon-parameteric (based on kNN) and parameteric (based onGaussian distribution) models. Corresponding genuine ac-cept rates (GAR) are above 90% for very low values of falseaccept rates as shown in Figure 6(b).
Analyzing the acquired EMG data, we have found manyareas for improvement in both feature selection and classi-
10−3 10−2 10−1 1000
0.1
0.2
0.3
0.4
0.5
0.6
0.7
0.8
0.9
1
False Accept Rate
Gen
uine
Acc
ept R
ate
PCA EMGUDP EMGCFA EMG
(a)
0.1 0.2 0.3 0.4 0.5 0.6 0.7 0.80.9 10.8
0.82
0.84
0.86
0.88
0.9
0.92
0.94
0.96
0.98
1
False Accept Rate
Gen
uine
Acc
ept R
ate
kNNgaussian MLE
(b)
10−3 10−2 10−1 1000
0.1
0.2
0.3
0.4
0.5
0.6
0.7
0.8
0.9
1
False Accept Rate
Gen
uine
Acc
ept R
ate
Keystroke Dynamics RawKeystroke Dynamics PCAKeystroke Dynamics CFAKeystroke Dynamics UDP
(c)
10−3 10−2 10−1 1000
0.1
0.2
0.3
0.4
0.5
0.6
0.7
0.8
0.9
1
False Accept Rate
Gen
uine
Acc
ept R
ate
EMGKey strokeFusion
(d)
10−3 10−2 10−1 1000.1
0.2
0.3
0.4
0.5
0.6
0.7
0.8
0.9
1
False Accept Rate
Gen
uine
Acc
ept R
ate
raw EMG + raw Keyraw EMG + PCA Keyraw EMG + UDP Keyraw EMG + CFA Key
(e)
10−3 10−2 10−1 1000.2
0.3
0.4
0.5
0.6
0.7
0.8
0.9
1
False Accept Rate
Gen
uine
Acc
ept R
ate
UDP EMG + UDP KeyUDP EMG + CFA KeyCFA EMG + UDP KeyCFA EMG + CFA Key
(f)
0.1 0.2 0.3 0.4 0.5 0.6 0.7 0.80.9 10.8
0.82
0.84
0.86
0.88
0.9
0.92
0.94
0.96
0.98
1
False Accept Rate
Gen
uine
Acc
ept R
ate
EMGKeystroke DynamicsFusion
(g)
0.1 0.2 0.3 0.4 0.5 0.6 0.7 0.80.9 10.96
0.97
0.98
0.99
1
False Accept Rate
Gen
uine
Acc
ept R
ate
SVM EMGSVM KeyStrokeFusion
(h)
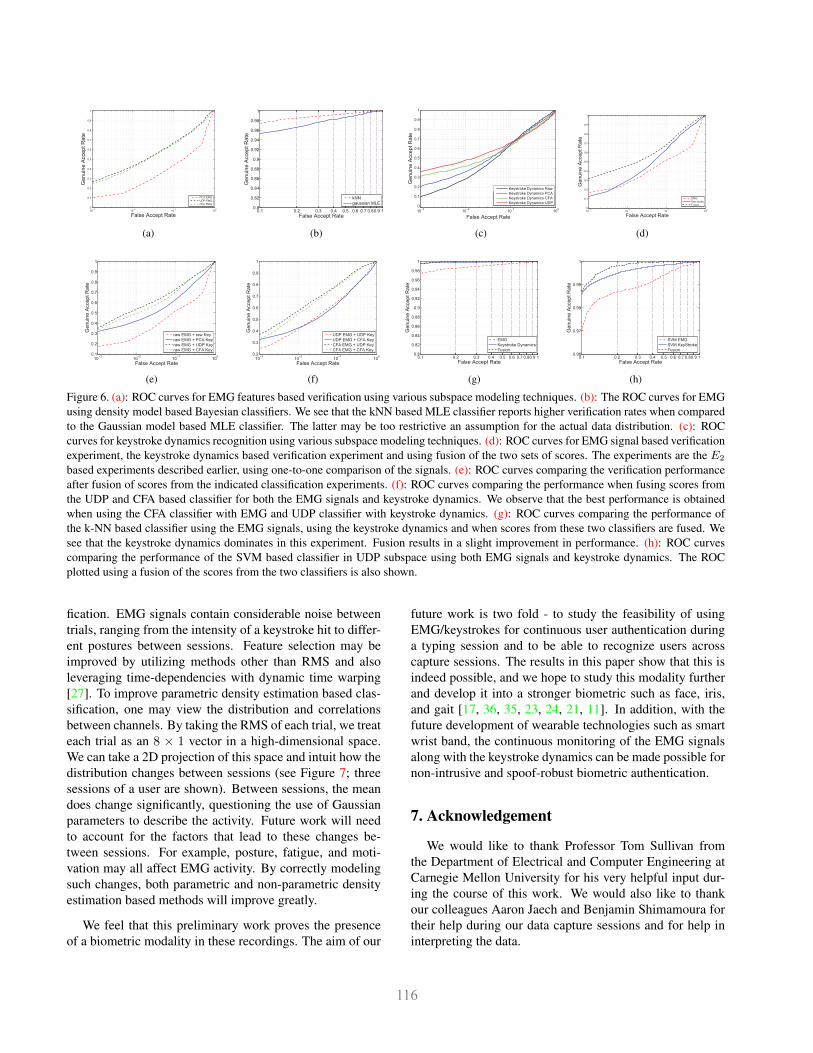
Figure 6. (a): ROC curves for EMG features based verification using various subspace modeling techniques. (b): The ROC curves for EMGusing density model based Bayesian classifiers. We see that the kNN based MLE classifier reports higher verification rates when comparedto the Gaussian model based MLE classifier. The latter may be too restrictive an assumption for the actual data distribution. (c): ROCcurves for keystroke dynamics recognition using various subspace modeling techniques. (d): ROC curves for EMG signal based verificationexperiment, the keystroke dynamics based verification experiment and using fusion of the two sets of scores. The experiments are the E2
based experiments described earlier, using one-to-one comparison of the signals. (e): ROC curves comparing the verification performanceafter fusion of scores from the indicated classification experiments. (f): ROC curves comparing the performance when fusing scores fromthe UDP and CFA based classifier for both the EMG signals and keystroke dynamics. We observe that the best performance is obtainedwhen using the CFA classifier with EMG and UDP classifier with keystroke dynamics. (g): ROC curves comparing the performance ofthe k-NN based classifier using the EMG signals, using the keystroke dynamics and when scores from these two classifiers are fused. Wesee that the keystroke dynamics dominates in this experiment. Fusion results in a slight improvement in performance. (h): ROC curvescomparing the performance of the SVM based classifier in UDP subspace using both EMG signals and keystroke dynamics. The ROCplotted using a fusion of the scores from the two classifiers is also shown.
fication. EMG signals contain considerable noise betweentrials, ranging from the intensity of a keystroke hit to differ-ent postures between sessions. Feature selection may beimproved by utilizing methods other than RMS and alsoleveraging time-dependencies with dynamic time warping[27]. To improve parametric density estimation based clas-sification, one may view the distribution and correlationsbetween channels. By taking the RMS of each trial, we treateach trial as an 8 × 1 vector in a high-dimensional space.We can take a 2D projection of this space and intuit how thedistribution changes between sessions (see Figure 7; threesessions of a user are shown). Between sessions, the meandoes change significantly, questioning the use of Gaussianparameters to describe the activity. Future work will needto account for the factors that lead to these changes be-tween sessions. For example, posture, fatigue, and moti-vation may all affect EMG activity. By correctly modelingsuch changes, both parametric and non-parametric densityestimation based methods will improve greatly.
We feel that this preliminary work proves the presenceof a biometric modality in these recordings. The aim of our
future work is two fold - to study the feasibility of usingEMG/keystrokes for continuous user authentication duringa typing session and to be able to recognize users acrosscapture sessions. The results in this paper show that this isindeed possible, and we hope to study this modality furtherand develop it into a stronger biometric such as face, iris,and gait [17, 36, 35, 23, 24, 21, 11]. In addition, with thefuture development of wearable technologies such as smartwrist band, the continuous monitoring of the EMG signalsalong with the keystroke dynamics can be made possible fornon-intrusive and spoof-robust biometric authentication.
7. Acknowledgement
We would like to thank Professor Tom Sullivan fromthe Department of Electrical and Computer Engineering atCarnegie Mellon University for his very helpful input dur-ing the course of this work. We would also like to thankour colleagues Aaron Jaech and Benjamin Shimamoura fortheir help during our data capture sessions and for help ininterpreting the data.
References[1] A. Adler. Images can be regenerated from quantized biomet-
ric match score data. In Electrical and Computer Engineer-ing, 2004. Canadian Conference on, volume 1, pages 469 –472 Vol.1, may 2004. 2
[2] M. Ahsan, M. Ibrahimy, and O. Khalifa. EMG signal classifi-cation for human computer interaction: A review. EuropeanJournal of Scientific Research, 33(3):480–501, 2009. 2
[3] C.-C. Chang and C.-J. Lin. LIBSVM: A library forsupport vector machines. ACM Transactions on Intelli-gent Systems and Technology, 2:27:1–27:27, 2011. Soft-ware available at http://www.csie.ntu.edu.tw/~cjlin/libsvm. 7
[4] D. C. Dening, F. G. Gray, and R. M. Haralick. Prosthesiscontrol using a nearest neighbor electromyographic patternclassifier. Biomedical Engineering, IEEE Transactions on,BME-30(6):356–360, june 1983. 2
[5] P. C. Doerschuk, D. E. Gustafon, and A. S. Willsky. Up-per extremity limb function discrimination using emg signalanalysis. Biomedical Engineering, IEEE Transactions on,BME-30(1):18–29, jan. 1983. 2
[6] R. O. Duda, P. E. Hart, and D. G. Stork. Pattern Classifica-tion (2nd Edition). Wiley-Interscience, 2 edition, Nov. 2001.4
[7] D. Gunetti and C. Picardi. Keystroke analysis of free text.ACM Transactions on Information and System Security (TIS-SEC), 8(3):312–347, aug 2005. 2
[8] L. Hargrove, K. Englehart, and B. Hudgins. A comparison ofsurface and intramuscular myoelectric signal classification.Biomedical Engineering, IEEE Transactions on, 54(5):847–853, may 2007. 2
[9] Y. Huang, K. Englehart, B. Hudgins, and A. Chan. A gaus-sian mixture model based classification scheme for myoelec-tric control of powered upper limb prostheses. BiomedicalEngineering, IEEE Transactions on, 52(11):1801–1811, nov.2005. 2
[10] P. Ju, L. P. Kaelbling, and Y. Singer. State-based classifica-tion of finger gestures from electromyographic signals. In InICML, pages 439–446, 2000. 2
[11] F. Juefei-Xu, C. Bhagavatula, A. Jaech, U. Prasad, andM. Savvides. Gait-ID on the Move: Pace IndependentHuman Identification Using Cell Phone Accelerometer Dy-namics. In Biometrics: Theory, Applications and Systems(BTAS), 2012 IEEE Fifth International Conference on, pages8–15, Sept 2012. 8
[12] F. Juefei-Xu, M. Cha, J. L. Heyman, S. Venugopalan, R. Abi-antun, and M. Savvides. Robust Local Binary Pattern Fea-ture Sets for Periocular Biometric Identification. In Biomet-rics: Theory Applications and Systems (BTAS), 4th IEEEInt’l Conf. on, pages 1–8, sep 2010. 2
[13] F. Juefei-Xu, M. Cha, M. Savvides, S. Bedros, and J. Tro-janova. Robust Periocular Biometric Recognition UsingMulti-level Fusion of Various Local Feature Extraction Tech-niques. In IEEE 17th International Conference on DigitalSignal Processing (DSP), 2011. 2
[14] F. Juefei-Xu, K. Luu, M. Savvides, T. Bui, and C. Suen. In-vestigating Age Invariant Face Recognition Based on Peri-
ocular Biometrics. In Biometrics (IJCB), 2011 InternationalJoint Conference on, pages 1–7, Oct 2011. 5
[15] F. Juefei-Xu, D. K. Pal, and M. Savvides. Hallucinatingthe Full Face from the Periocular Region via DimensionallyWeighted K-SVD. In Computer Vision and Pattern Recogni-tion Workshops (CVPRW), 2014 IEEE Conference on, June2014. 5
[16] F. Juefei-Xu, D. K. Pal, and M. Savvides. NIR-VIS Hetero-geneous Face Recognition via Cross-Spectral Joint Dictio-nary Learning and Reconstruction. In Computer Vision andPattern Recognition Workshops (CVPRW), 2015 IEEE Con-ference on, June 2015. 5
[17] F. Juefei-Xu, D. K. Pal, K. Singh, and M. Savvides. APreliminary Investigation on the Sensitivity of COTS FaceRecognition Systems to Forensic Analyst-style Face Pro-cessing for Occlusions. In Computer Vision and PatternRecognition Workshops (CVPRW), 2015 IEEE Conferenceon, June 2015. 8
[18] F. Juefei-Xu and M. Savvides. Can Your Eyebrows Tell MeWho You Are? In Signal Processing and CommunicationSystems (ICSPCS), 2011 5th International Conference on,pages 1–8, Dec 2011. 2
[19] F. Juefei-Xu and M. Savvides. Unconstrained PeriocularBiometric Acquisition and Recognition Using COTS PTZCamera for Uncooperative and Non-cooperative Subjects. InApplications of Computer Vision (WACV), 2012 IEEE Work-shop on, pages 201–208, Jan 2012. 5
[20] F. Juefei-Xu and M. Savvides. An Augmented Linear Dis-criminant Analysis Approach for Identifying Identical Twinswith the Aid of Facial Asymmetry Features. In ComputerVision and Pattern Recognition Workshops (CVPRW), 2013IEEE Conference on, pages 56–63, June 2013. 5
[21] F. Juefei-Xu and M. Savvides. An Image Statistics Approachtowards Efficient and Robust Refinement for Landmarks onFacial Boundary. In Biometrics: Theory, Applications andSystems (BTAS), 2013 IEEE Sixth International Conferenceon, pages 1–8, Sept 2013. 8
[22] F. Juefei-Xu and M. Savvides. Subspace Based DiscreteTransform Encoded Local Binary Patterns Representationsfor Robust Periocular Matching on NIST’s Face Recogni-tion Grand Challenge. IEEE Trans. on Image Processing,23(8):3490–3505, aug 2014. 5
[23] F. Juefei-Xu and M. Savvides. Facial Ethnic AppearanceSynthesis. In Computer Vision - ECCV 2014 Workshops,volume 8926 of Lecture Notes in Computer Science, pages825–840. Springer International Publishing, 2015. 8
[24] F. Juefei-Xu and M. Savvides. Weight-Optimal Local Bi-nary Patterns. In Computer Vision - ECCV 2014 Workshops,volume 8926 of Lecture Notes in Computer Science, pages148–159. Springer International Publishing, 2015. 8
[25] E. Kamavuako, K. Englehart, W. Jensen, and D. Farina. Si-multaneous and proportional force estimation in multiple de-grees of freedom from intramuscular emg. Biomedical Engi-neering, IEEE Transactions on, 59(7):1804–1807, july 2012.2
[26] K. S. Killourhy and R. A. Maxion. Comparing anomaly-detection algorithms for keystroke dynamics. In Proceed-
ings of the IEEE International Conferenec on DependableSystems and Networks (DSN), pages 125–134, jun 2009. 2
[27] G. Li, Y. Wang, M. Li, and Z. Wu. Similarity match intime series streams under dynamic time warping distance. InComputer Science and Software Engineering, 2008 Interna-tional Conference on, volume 4, pages 399 –402, dec. 2008.8
[28] C. Martelloni, J. Carpaneto, and S. Micera. Characterizationof emg patterns from proximal arm muscles during object-and orientation-specific grasps. Biomedical Engineering,IEEE Transactions on, 56(10):2529–2536, oct. 2009. 2
[29] A. Messerman, T. Mustafic, S. A. Camtepe, and S. Albayrak.Continuous and non-intrusive identity verification in real-time environments based on free-text keystroke dynamics.In Proceedings of the IEEE International Joint Conf. on Bio-metrics (IJCB), pages 1–8, oct 2011. 2
[30] K. Plataniotis, D. Hatzinakos, and J. Lee. Ecg biometricrecognition without fiducial detection. In Biometric Consor-tium Conference, 2006 Biometrics Symposium: Special Ses-sion on Research at the, pages 1 –6, 19 2006-aug. 21 2006.1
[31] J. Roth, X. Liu, and D. Metaxas. On Continuous User Au-thentication via Typing Behavior. IEEE Trans. on Image Pro-cessing, 23(10):4611–4624, oct 2014. 2
[32] J. Roth, X. Liu, A. Ross, and D. Metaxas. Investigat-ing the Discriminative Power of Keystroke Sound. IEEETransactions on Information Forensics And Security (TIFS),10(2):333–345, Feb 2015. 2
[33] T. S. Saponas, D. S. Tan, D. Morris, J. Turner, and J. A. Lan-day. Making muscle-computer interfaces more practical. InProceedings of the 28th international conference on Humanfactors in computing systems, CHI ’10, pages 851–854, NewYork, NY, USA, 2010. ACM. 2
[34] G. N. Saridis and T. P. Gootee. Emg pattern analysis andclassification for a prosthetic arm. Biomedical Engineering,IEEE Transactions on, BME-29(6):403–412, june 1982. 2
[35] M. Savvides and F. Juefei-Xu. Image Matching UsingSubspace-Based Discrete Transform Encoded Local BinaryPatterns, Sept. 2013. US Patent US 2014/0212044 A1. 8
[36] K. Seshadri, F. Juefei-Xu, D. K. Pal, and M. Savvides. DriverCell Phone Usage Detection on Strategic Highway ResearchProgram (SHRP2) Face View Videos. In Computer Visionand Pattern Recognition Workshops (CVPRW), 2015 IEEEConference on, June 2015. 8
[37] T. Shen, W. Tompkins, and Y. Hu. One-lead ecg for identityverification. In Engineering in Medicine and Biology, 2002.24th Annual Conference and the Annual Fall Meeting of theBiomedical Engineering Society EMBS/BMES Conference,2002. Proceedings of the Second Joint, volume 1, pages 62 –63 vol.1, 2002. 1
[38] S. J. Shepherd. Continuous authentication by analysis of key-board typing characteristics. In European Convention on Se-curity and Detection, pages 111–114, may 1995. 2
[39] S. Venugopalan and M. Savvides. How to generate spoofedirises from an iris code template. Information Forensics andSecurity, IEEE Transactions on, 6(2):385 –395, June 2011.2
[40] B. V. K. Vijaya Kumar, M. Savvides, and C. Xie. Correlationpattern recognition for face recognition. Proc. of the IEEE,94(11):1963–1976, nov 2006. 5
[41] J. Yang, D. Zhang, J. Yang, and B. Niu. Globally maximiz-ing, locally minimizing: Unsupervised discriminant projec-tion with applications to face and palm biometrics. IEEETrans. Pattern Analysis and Machine Intelligence (TPAMI),29:650–664, 2007. 5
[42] R. S. Zack, C. C. Tappert, and S. H. Cha. Performance ofa long-text-input keystroke biometric authentication systemusing an improved k-nearest-neighbor classification method.In Proceedings of the Fourth IEEE International Conferenceon Biometrics: Theory Applications and Systems (BTAS),pages 1–6, sep 2010. 2