Electrodeposition of cobalt–yttrium hydroxide/oxide...
9
Electrochimica Acta 56 (2011) 5142–5150 Contents lists available at ScienceDirect Electrochimica Acta journal homepage: www.elsevier.com/locate/electacta Electrodeposition of cobalt–yttrium hydroxide/oxide nanocomposite films from particle-free aqueous baths containing chloride salts K.M. Sivaraman a , O. Ergeneman a , S. Pané a,∗ , E. Pellicer b,∗∗ , J. Sort c , K. Shou a , S. Suri ˜ nach b , M.D. Baró b , B.J. Nelson a a Institute of Robotics and Intelligent Systems (IRIS), ETH Zürich, CH-8092 Zürich, Switzerland b Departament de Física, Facultat de Ciències, Universitat Autònoma de Barcelona, E-08193 Bellaterra, Spain c Institució Catalana de Recerca i Estudis Avanc ¸ ats (ICREA) and Departament de Física, Universitat Autònoma de Barcelona, E-08193 Bellaterra, Spain article info Article history: Received 11 December 2010 Received in revised form 13 March 2011 Accepted 14 March 2011 Available online 22 March 2011 Keywords: Nanocomposite Cobalt Yttrium hydroxide/oxide Pulse deposition X-ray photoelectron spectroscopy abstract The feasibility of growing nanostructured films composed of cobalt and yttrium hydroxide/oxide phases by electrodeposition is demonstrated. Particle-free aqueous solutions containing YCl 3 and CoCl 2 salts and glycine were used. The incorporation of yttrium compounds into the cobalt deposit was achieved using pulse deposition (t on = 0.1 ms, t off = 0.9 ms) and for cathodic pulses higher than −500 mA cm −2 . Deposits obtained were crack-free, typically with 1–5 wt% yttrium, and exhibited morphologies markedly differ- ent from the ones shown by pure cobalt deposits. Moreover, yttrium-rich films (up to 30 wt% Y) could be deposited under certain conditions, though incipient cracking developed in this case. X-ray photoelec- tron spectroscopy analyses revealed that Y(OH) 3 /Y 2 O 3 compounds were present in the films. From the structural viewpoint, the composites exhibited a partially amorphous/nanocrystalline character, with the crystalline fractions originating from the hexagonal-close packed structure of -Co. A refinement of the -Co crystallite size was observed in deposits containing higher weight percentage of yttrium com- pounds. Nanoindentation tests revealed that hardness increased with the yttrium content. This result can be explained by taking into account both the presence of intrinsically hard oxide phases and the effects promoted by incorporation of yttrium hydroxides/oxides on the -Co matrix (namely, grain-refining and higher concentration of stacking faults). © 2011 Elsevier Ltd. All rights reserved. 1. Introduction Nanocomposite coatings consisting of ultra-fine ceramic parti- cles (e.g., Al 2 O 3 , SiO 2 , SiC, TiN, AlN) embedded in a metal matrix have become the focus of widespread research in recent years due to their superior properties compared to purely metallic films. Benefits include high specific heat, optical non-linearity, novel magnetic properties, enhanced mechanical behavior (large hard- ness and wear resistance) and good corrosion resistance, amongst others [1–5]. Nanocomposite coatings can be produced by various meth- ods, including electrodeposition. Electrodeposited nanocomposite coatings are generally obtained by suspending charged ceramic nanoparticles in the electrolyte and co-depositing them with the metal [1–5]. However, this method suffers from some drawbacks. Nanoparticles can easily agglomerate due to the compressive effect caused by the high ionic strength on the diffuse double layer ∗ Corresponding author. Tel.: +41 44 632 33 12. ∗∗ Corresponding author. Tel.: +34 93 581 14 01; fax: +34 93 581 21 55. E-mail addresses: [email protected] (S. Pané), [email protected] (E. Pellicer). surrounding the particles [6]. As a consequence, the anticipated advantageous chemical and/or physical properties of the com- posite coatings are often not obtained. Furthermore, hydration forces can also hinder particle co-deposition [7]. Suitable surfac- tants can improve the stability of the suspension by increasing the wettability of suspended particles, while enhancing the electro- static adsorption of the dispersed particles on the cathode surface by increasing their positive charge [8]. Nevertheless, there are also drawbacks associated with the use of surface-active agents. Surfactants can get adsorbed on the cathode surface leading to unfavorable changes in the mechanical properties of the electrode- posit, such as high internal residual stress or brittleness [9]. Due to these reasons, the search for new approaches for synthesizing heterogeneous, multi-phase deposits with enhanced and tunable properties is highly desirable. Cathodic electrodeposition of certain ceramic materials from their metal salts, including metal oxides/hydroxides or complex oxide compounds, has been demonstrated over the last few years [10–14]. In particular, deposition of yttrium hydroxide has received particular attention because it enhances the corrosion resistance of several metals and alloys such as carbon steel, stainless steel, zinc, bronze, aluminium and magnesium alloys [15]. Research on Y(OH) 3 0013-4686/$ – see front matter © 2011 Elsevier Ltd. All rights reserved. doi:10.1016/j.electacta.2011.03.058
-
Upload
truonghanh -
Category
Documents
-
view
220 -
download
0
Transcript of Electrodeposition of cobalt–yttrium hydroxide/oxide...

Ep
KMa
b
c
a
ARRAA
KNCYPX
1
chdBmno
ocnmNc
0d
Electrochimica Acta 56 (2011) 5142–5150
Contents lists available at ScienceDirect
Electrochimica Acta
journa l homepage: www.e lsev ier .com/ locate /e lec tac ta
lectrodeposition of cobalt–yttrium hydroxide/oxide nanocomposite films fromarticle-free aqueous baths containing chloride salts
.M. Sivaramana, O. Ergenemana, S. Panéa,∗, E. Pellicerb,∗∗, J. Sort c, K. Shoua, S. Surinachb,.D. Barób, B.J. Nelsona
Institute of Robotics and Intelligent Systems (IRIS), ETH Zürich, CH-8092 Zürich, SwitzerlandDepartament de Física, Facultat de Ciències, Universitat Autònoma de Barcelona, E-08193 Bellaterra, SpainInstitució Catalana de Recerca i Estudis Avancats (ICREA) and Departament de Física, Universitat Autònoma de Barcelona, E-08193 Bellaterra, Spain
r t i c l e i n f o
rticle history:eceived 11 December 2010eceived in revised form 13 March 2011ccepted 14 March 2011vailable online 22 March 2011
eywords:anocompositeobalt
a b s t r a c t
The feasibility of growing nanostructured films composed of cobalt and yttrium hydroxide/oxide phasesby electrodeposition is demonstrated. Particle-free aqueous solutions containing YCl3 and CoCl2 salts andglycine were used. The incorporation of yttrium compounds into the cobalt deposit was achieved usingpulse deposition (ton = 0.1 ms, toff = 0.9 ms) and for cathodic pulses higher than −500 mA cm−2. Depositsobtained were crack-free, typically with 1–5 wt% yttrium, and exhibited morphologies markedly differ-ent from the ones shown by pure cobalt deposits. Moreover, yttrium-rich films (up to 30 wt% Y) could bedeposited under certain conditions, though incipient cracking developed in this case. X-ray photoelec-tron spectroscopy analyses revealed that Y(OH)3/Y2O3 compounds were present in the films. From the
ttrium hydroxide/oxideulse deposition-ray photoelectron spectroscopy
structural viewpoint, the composites exhibited a partially amorphous/nanocrystalline character, withthe crystalline fractions originating from the hexagonal-close packed structure of �-Co. A refinement ofthe �-Co crystallite size was observed in deposits containing higher weight percentage of yttrium com-pounds. Nanoindentation tests revealed that hardness increased with the yttrium content. This result canbe explained by taking into account both the presence of intrinsically hard oxide phases and the effectspromoted by incorporation of yttrium hydroxides/oxides on the �-Co matrix (namely, grain-refining and
tackin
higher concentration of s. Introduction
Nanocomposite coatings consisting of ultra-fine ceramic parti-les (e.g., Al2O3, SiO2, SiC, TiN, AlN) embedded in a metal matrixave become the focus of widespread research in recent yearsue to their superior properties compared to purely metallic films.enefits include high specific heat, optical non-linearity, novelagnetic properties, enhanced mechanical behavior (large hard-
ess and wear resistance) and good corrosion resistance, amongstthers [1–5].
Nanocomposite coatings can be produced by various meth-ds, including electrodeposition. Electrodeposited nanocompositeoatings are generally obtained by suspending charged ceramic
anoparticles in the electrolyte and co-depositing them with theetal [1–5]. However, this method suffers from some drawbacks.anoparticles can easily agglomerate due to the compressive effectaused by the high ionic strength on the diffuse double layer∗ Corresponding author. Tel.: +41 44 632 33 12.∗∗ Corresponding author. Tel.: +34 93 581 14 01; fax: +34 93 581 21 55.
E-mail addresses: [email protected] (S. Pané), [email protected] (E. Pellicer).
013-4686/$ – see front matter © 2011 Elsevier Ltd. All rights reserved.oi:10.1016/j.electacta.2011.03.058
g faults).© 2011 Elsevier Ltd. All rights reserved.
surrounding the particles [6]. As a consequence, the anticipatedadvantageous chemical and/or physical properties of the com-posite coatings are often not obtained. Furthermore, hydrationforces can also hinder particle co-deposition [7]. Suitable surfac-tants can improve the stability of the suspension by increasing thewettability of suspended particles, while enhancing the electro-static adsorption of the dispersed particles on the cathode surfaceby increasing their positive charge [8]. Nevertheless, there arealso drawbacks associated with the use of surface-active agents.Surfactants can get adsorbed on the cathode surface leading tounfavorable changes in the mechanical properties of the electrode-posit, such as high internal residual stress or brittleness [9]. Dueto these reasons, the search for new approaches for synthesizingheterogeneous, multi-phase deposits with enhanced and tunableproperties is highly desirable.
Cathodic electrodeposition of certain ceramic materials fromtheir metal salts, including metal oxides/hydroxides or complex
oxide compounds, has been demonstrated over the last few years[10–14]. In particular, deposition of yttrium hydroxide has receivedparticular attention because it enhances the corrosion resistance ofseveral metals and alloys such as carbon steel, stainless steel, zinc,bronze, aluminium and magnesium alloys [15]. Research on Y(OH)3
chimica Acta 56 (2011) 5142–5150 5143
dCgtYvYocrhta
esat[tofiubc
ioioeylcoom
otaniad[at
2
tisteawenaeht
Table 1Detailed composition of the employed baths, in mol dm−3.
Bath YCl3·6H2O CoCl2·6H2O Glycine (C2H5NO2) KCl H3BO3
1 0 0.1
weight percentages of cobalt and yttrium elements (without con-sidering the oxygen content) normalized to 100%. For cross-sectionSEM images, the films were embedded in epoxy resin and pol-ished to a mirror-like appearance using diamond paste. X-ray
K.M. Sivaraman et al. / Electro
eposition has been primarily motivated by the need to replacer(VI) based corrosion inhibitors by eco-friendly protective layers,iven that Cr(VI) is extremely toxic and carcinogenic [16]. In addi-ion to the corrosion inhibiting performance, electrodeposition of(OH)3 has also been a topic of research because it can be con-erted into Y2O3 (yttria) after an appropriate thermal treatment.ttria is highly resistant to most chemicals and has a melting pointf approximately 2400 ◦C. It also exhibits a low vapor pressure, opti-al transparency in the infrared region, high corrosion and thermalesistance, and high strength and fracture toughness [17–20]. Thisas prompted the use of yttria in a variety of industrial applica-ions, including optical sensors, cutting tools, protective coatings,nd solid oxide fuel cell (SOFC) interconnects [20–23].
Cathodic electrodeposition of Y(OH)3 can be performed fromither organic (typically, water–alcohol mixtures) or fully aqueousolvents. According to the early work by Switzer, the formation ofn electrogenerated base leads to the precipitation of Y(III) fromhe electrolyte as a hydroxide film on the surface of the cathode24]. From ecological and health perspectives, fully aqueous elec-rolytes are certainly more desirable. However, there is a dearthf literature concerning the aqueous electrodeposition of Y(OH)3lms. In [25,26], Y(NO3)3 and YCl3 salts dissolved in water weresed to cathodically deposit Y(OH)3 thin films and nanospheres. Inoth works, Y(OH)3 was thermally treated at 600 ◦C in air to obtainrystalline yttria.
To date, attempts to incorporate yttrium oxides/hydroxidesnto metallic electrodeposits have proven difficult. The productionf nickel–yttria composite coatings by direct current electroplat-ng from a Watts nickel plating bath containing variable amountsf micron-sized yttria particles suspended in the electrolyte wasxplored by McCormack et al. [27]. However, there was little or nottria inclusion in the deposits for the investigated range of yttriaoadings (1–5 g dm−3). The authors reported only on the effectsaused by the presence of yttria dispersed in the electrolytic bathn the Ni deposit texture and morphology. Hence, incorporationf a useful amount of yttrium-based compounds into electroplatedetallic films remains a challenge and requires investigation.The aim of the present work is to demonstrate the feasibility
f producing yttrium-containing cobalt films by electrodeposi-ion from aqueous solutions. The novelty of the present syntheticpproach relies on incorporating yttrium oxides/hydroxides intoanocrystalline Co films from a fully aqueous electrolyte contain-
ng both YCl3 and CoCl2 salts. Glycine was chosen as a complexinggent since it shows high buffering properties and favors the co-eposition of iron-group (Fe, Co and Ni) with rare earth (RE) metals28]. In order to induce both nanocrystallinity of the Co matrix andn effective inclusion of yttrium oxide/hydroxide into the deposits,he pulse plating technique was utilized.
. Experimental
The electrodeposition was performed in a one-compartmenthree-electrode cell. A 100 ml of bath was used in the electrochem-cal cell. Distilled water from a Julabo ED-5 thermostat-circulatorystem was circulated in the outer jacket of the cell to maintainhe required working temperature. A double junction Ag|AgCl ref-rence electrode was used with 3 mol dm−3 KCl inner solution andn outer solution made of 1 mol dm−3 NaCl. An insoluble platinumire mesh acted as counter electrode. An inert atmosphere was
nsured inside the electrochemical cell by maintaining a blanket of
itrogen gas on top of the solution. The level of water in the cellnd the pH of the bath were checked at the beginning and end ofach deposition. The required acidity was maintained using sodiumydroxide and hydrochloric acid. To study the feasibility of elec-rodepositing yttrium-containing films, a set of baths was prepared0.15 1 0.162 1 0.053 1 0.14 1.5 0.1
wherein the [Co(II)] was much smaller than the [Y(III)] (Table 1). KClwas used as a supporting electrolyte and boric acid as a bufferingagent. The working temperature was 60 ◦C. This temperature wasselected on the basis that yttrium chemically behaves as a RE ele-ment. RE metal deposition is generally more favorable above roomtemperature [28]. The pH was kept at 4 for all the electrodepositionexperiments.
The working electrode consisted of 5 mm × 6 mm silicon chips(crystal orientation 1 0 0), on top of which a titanium adhesionlayer of 50 nm and a copper seed-layer of 500 nm had been suc-cessively deposited through e-beam evaporation. Evaporation wasperformed using an E306A coating apparatus controlled by an e-Vap CVS-6 system. Before being used for electrodeposition, thecopper surface was degreased by first dipping it in acetone followedby iso-propanol and then stripped of oxide and organic residuesby dipping in 10% H2SO4 solution. The three electrodes were con-nected to a Gamry Reference 3000 potentiostat/galvanostat whichwas controlled by the Gamry Framework software during gal-vanostatic and linear sweep voltammetry (LSV) experiments andby the Gamry VFP-600 software during pulsed electrodeposition.The charge density was kept at 20 C cm−2 across all depositions.Deposits were obtained by galvanostatic pulse plating with acathodic pulse (CP) (from −50 to −1500 mA cm−2) with a durationof ton = 0.1 ms followed by an open circuit potential (OCP) with aduration of toff = 0.9 ms (Fig. 1). The data acquisition frequency was10 kHz which provided 10 data points for each cycle. The depositionwas carried out under quiescent conditions.
The morphology of the deposits was observed using Zeiss NVi-sion 40 and Zeiss Merlin scanning electron microscopes (SEM).The chemical composition of the deposits was analyzed by energydispersive X-ray spectroscopy (EDX). Data reported are based onthe averaging of four measurements on three replicas per sam-ple. The yttrium content is calculated by taking into account the
Fig. 1. Plot of the galvanostatic pulse with a CP of 0.1 ms and an OCP of 0.9 ms.

5144 K.M. Sivaraman et al. / Electrochimica Acta 56 (2011) 5142–5150
Ft
pa(1aa3daBwooDs
3
3
ibbtwsoipiaprioTf
ppgtstd
Table 2Y content in the deposits as a function of applied CP for Baths 2–4. Note that the Ycontent is given taking into account the weight percentages of Co and Y (withoutconsidering O), normalized to 100%.
−j (mA cm−2) wt% Y
Bath 2 Bath 3 Bath 4
750 3 2 2
ig. 2. Linear sweep voltammetries of Baths 1–4 recorded under quiescent condi-ions, at a scan rate of 50 mV s−1.
hotoelectron spectroscopy (XPS) analyses were carried out onPHI equipment 5500 Multitechnique using the Al K� radiation
1486.6 eV), after sputtering the sample surface with Ar ions formin. All spectral positions have been corrected taking C 1s peakt 284.5 eV. X-ray diffraction (XRD) patterns were obtained withPhilips X’Pert diffractometer using the Cu K� radiation in the
5–100◦ 2� range (0.03◦ step size, 10 s holding time). Nanoin-entation tests were carried out in the load control mode usingUMIS device from Fischer-Cripps Laboratories equipped with
erkovich pyramid-shaped diamond tip. The load–unload curvesere taken on the films’ cross-section applying a maximum force
f 20 mN. Hardness (H) values were obtained applying the methodf Oliver and Pharr [29] at the beginning of the unloading curve.ata reported corresponds to the averaging of 20 indentations per
ample.
. Results and discussion
.1. Linear sweep voltammetry and pulse galvanostatic transients
During the design and development of electrolytic solutions forncorporating yttrium into cobalt deposits, considering bath sta-ility was essential. In this context, at 25 ◦C all glycine-containingaths were stable from pH 3 through pH 5. However, at 60 ◦C,he baths at pH 5 were not stable. Turbidity was observed butas reversible on bringing the pH to 4. Hence, pH 4 was cho-
en to synthesize the cobalt electrodeposits containing yttriumxides/hydroxides. It can be conjectured that, the formation ofnsoluble species of Y3+ is promoted at pH 5. Tkachenko et al. [30]oint out that, in the presence of boric acid and ammonium hydrox-
de, there is a possibility of formation of yttrium orthoborate saltsround pH 5. Therefore, the observed turbidity might be due to theresence of both boric acid and the ammonium group in glycine. Atoom temperature, the baths exhibited a pink coloration character-stic of octahedral aqua complexes of Co2+. When the temperaturef the solution was increased, the bath became violet-blue in color.his can be attributed to the fact that a fraction of the Co(II) ionsorm tetrahedral chloride [CoCl4]2− complexes.
The characteristics of cobalt–yttrium electrodeposition in theresence of glycine at pH 4 were investigated by LSV. On com-aring the response of Baths 1, 3 and 4, it can be seen that, for a
iven Co(II) concentration, the onset of deposition remains almosthe same when Y(III) is added to the bath (cf. Baths 1 and 3), butlightly shifts towards more positive potentials when Y(III) concen-ration is further increased (Bath 4) (Fig. 2). Simultaneously, theiffusion-controlled reduction peak is also shifted towards more1000 2 3 21200 5 3 31500 3 2 2
positive potentials and its height decreases, suggesting changes inthe diffusion/charge controlling factors. As expected, for a constantY(III) concentration, a decrease in the concentration of Co(II) (Baths2 and 3) causes a delay in the onset of deposition and also a decreasein the height of the reduction peak (Fig. 2). These trends suggestthat addition of Y(III) species to cobalt(II)–glycine solutions causeschanges in the electrolyte solution which ultimately might affectthe characteristics of the reduction process.
Fig. 3 shows the galvanostatic cathodic pulses for the initialand the final cycles at each current density. Especially for the finalcycles, the potentials corresponding to the pulse are clearly differ-entiated by the applied current density. The system reaches morenegative potentials as the cathodic pulse is increased. For the lastcycles, the potentials corresponding to the relaxation time seemto converge to a similar potential value. The regular pattern ofthe CP–OCP cycles suggests that deposition proceeds in a well-controlled manner.
3.2. Morphology and composition of yttrium-containing cobaltdeposits
Table 2 shows the composition of the deposits obtained fromBaths 2 to 4. Yttrium content varied between 1 and 5 wt%, and Ywas detected only in deposits obtained using galvanostatic pulsesmore negative than −500 mA cm−2. Upon unaided visual inspec-tion, all the films appeared matte dark and well adherent to thesubstrate. Most importantly, yttrium incorporation was almostnegligible under direct current electroplating conditions. The pulseplating mode allowed the application of very high peak current den-sities, which could be the key factor in enabling Y incorporation.The results show random variability in the yttrium content, withno clear tendency observed with respect to both the applied currentdensity and the [Y(III)]/[Co(II)] ratio in solution, though maximumY incorporation was usually attained at CP of −1200 mA cm−2.
Though levels of Y incorporation were not very high, clearchanges in morphology were observed with respect to pure cobaltdeposits (Fig. 4), indicating a clear influence of Y on the morphologyof the deposits. Yttrium-free cobalt films displayed rounded grainswhich looked highly facetted at higher magnification (Fig. 4(a) and(b)), whereas elongated grains were observed when Y was incor-porated in the deposits (Fig. 4(c) and (e)). The distinctive feature ofthese grains was the presence of ridge-like structures on their sur-face, which gave them a seashell-like appearance (Fig. 4(d) and (f)).The width of these ridge-like structures was in the range of a fewnanometers (roughly around 10–20 nm). Also, the trends observedin the surface morphology of these deposits were independent ofthe [Co(II)] in their deposition baths. Significantly, as opposed to thedeposits mentioned in [31], these deposits were completely free ofmicro-cracks. This can also be attributed to the use of the pulse
plating technique [32]. For a given bath, the grains became slightlyfiner with an increase in the applied current density. On the otherhand, an increase of Y(III) concentration in solution (Bath 4) madethe grains evolve to more rounded shapes, but they still displayedcharacteristic ridge-like features on their surface as in the deposits
K.M. Sivaraman et al. / Electrochimica Acta 56 (2011) 5142–5150 5145
ath 3
ps
a
F(
Fig. 3. Galvanostatic cathodic pulses for the initial and final cycles for B
repared from Bath 3. The pure cobalt deposits were always free ofuch ridge-like features.
Yttrium-rich deposits (with Y percentages larger than 5 wt% onverage) could be obtained after a number of successive depositions
ig. 4. SEM images (secondary electrons) of deposits: (a and b) from Bath 1 ([Co(II)] =[Co(II)] = 0.1 mol dm−3, [Y(III)] = 1 mol dm−3) at j = −750 mA cm−2; (e and f) from Bath 3 a
([Co(II)] = 0.1 mol dm−3, [Y(III)] = 1 mol dm−3) and quiescent conditions.
from a given bath, typically after depositing 10–15 films, and forCPs more negative than j = −750 mA cm−2. The mechanism behindthe growth of such yttrium-richer deposits is not yet fully under-stood. Since the depletion of Co(II) ions in solution could intuitively
0.1 mol dm−3, [Y(III)] = 0 mol dm−3) at j = −1500 mA cm−2; (c and d) from Bath 3t j = −1500 mA cm−2.
5146 K.M. Sivaraman et al. / Electrochimica Acta 56 (2011) 5142–5150
F t% Yj ol dmf
ecosawtescrldodttyoN
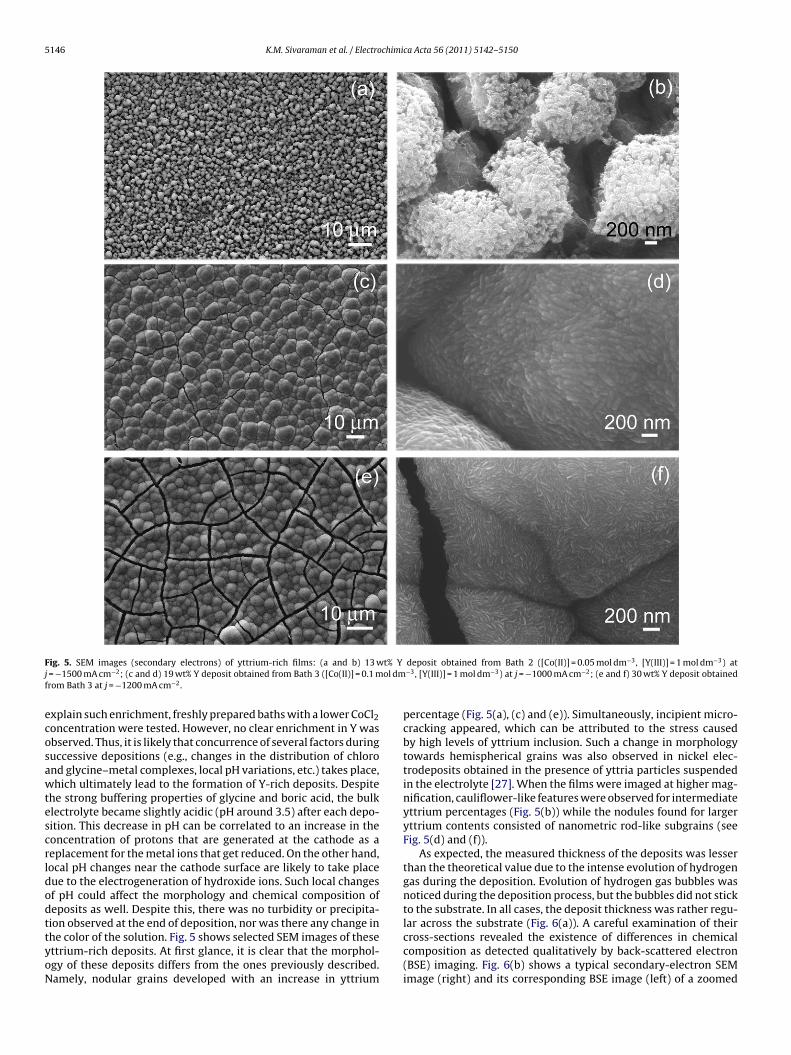
ig. 5. SEM images (secondary electrons) of yttrium-rich films: (a and b) 13 w= −1500 mA cm−2; (c and d) 19 wt% Y deposit obtained from Bath 3 ([Co(II)] = 0.1 mrom Bath 3 at j = −1200 mA cm−2.
xplain such enrichment, freshly prepared baths with a lower CoCl2oncentration were tested. However, no clear enrichment in Y wasbserved. Thus, it is likely that concurrence of several factors duringuccessive depositions (e.g., changes in the distribution of chlorond glycine–metal complexes, local pH variations, etc.) takes place,hich ultimately lead to the formation of Y-rich deposits. Despite
he strong buffering properties of glycine and boric acid, the bulklectrolyte became slightly acidic (pH around 3.5) after each depo-ition. This decrease in pH can be correlated to an increase in theoncentration of protons that are generated at the cathode as aeplacement for the metal ions that get reduced. On the other hand,ocal pH changes near the cathode surface are likely to take placeue to the electrogeneration of hydroxide ions. Such local changesf pH could affect the morphology and chemical composition ofeposits as well. Despite this, there was no turbidity or precipita-
ion observed at the end of deposition, nor was there any change inhe color of the solution. Fig. 5 shows selected SEM images of thesettrium-rich deposits. At first glance, it is clear that the morphol-gy of these deposits differs from the ones previously described.amely, nodular grains developed with an increase in yttriumdeposit obtained from Bath 2 ([Co(II)] = 0.05 mol dm−3, [Y(III)] = 1 mol dm−3) at−3, [Y(III)] = 1 mol dm−3) at j = −1000 mA cm−2; (e and f) 30 wt% Y deposit obtained
percentage (Fig. 5(a), (c) and (e)). Simultaneously, incipient micro-cracking appeared, which can be attributed to the stress causedby high levels of yttrium inclusion. Such a change in morphologytowards hemispherical grains was also observed in nickel elec-trodeposits obtained in the presence of yttria particles suspendedin the electrolyte [27]. When the films were imaged at higher mag-nification, cauliflower-like features were observed for intermediateyttrium percentages (Fig. 5(b)) while the nodules found for largeryttrium contents consisted of nanometric rod-like subgrains (seeFig. 5(d) and (f)).
As expected, the measured thickness of the deposits was lesserthan the theoretical value due to the intense evolution of hydrogengas during the deposition. Evolution of hydrogen gas bubbles wasnoticed during the deposition process, but the bubbles did not stickto the substrate. In all cases, the deposit thickness was rather regu-
lar across the substrate (Fig. 6(a)). A careful examination of theircross-sections revealed the existence of differences in chemicalcomposition as detected qualitatively by back-scattered electron(BSE) imaging. Fig. 6(b) shows a typical secondary-electron SEMimage (right) and its corresponding BSE image (left) of a zoomed
K.M. Sivaraman et al. / Electrochimica Acta 56 (2011) 5142–5150 5147
F 2, j = −1500 mA cm−2). (b) Backscattered-electrons (BSE) (left) and secondary-electronsS ’s cross-section. The profile of one of the indentations is indicated with a dotted line.
rtHoatItwcg
Table 3Yttrium and cobalt weight percentages (normalized to 100%) determined by EDX-spot analyses at the regions indicated in Fig. 7(a).
Region wt% Co wt% Y
1 97 32 87 133 81 19
FLct
ig. 6. (a) Cross-sectional SEM image of a 5 �m thick deposit with 13 wt% Y (BathEM (right) images of a zoomed area. (c) Detail of two nanoindentations on deposit
egion. Notice that the BSE image is not affected by topological fea-ures (e.g., changes in surface flatness due to polishing scratches).ence, the phase contrast is linked to variations in composition. Inrder to gain a better understanding on such differences, EDX-spotnalyses were carried out (see Fig. 7(a) and Table 3). It was observedhat yttrium is distributed across the entire thickness of the films.nterestingly, the regions enriched in yttrium coincide with deple-
ion in cobalt content. Conversely, larger cobalt contents coincideith a decrease in yttrium percentage. If only an alloy or a mixedobalt–yttrium oxide had formed throughout the film, then homo-eneous distribution of Co, Y (and O) elements would have been
ig. 7. (a) Cross-sectional secondary-electrons SEM image of a deposit with 13 wt% Y (B�1 and (d) O K energies. Cobalt- and yttrium-rich zones are indicated by green and red aobalt. Conversely, yttrium-depleted regions coincide with cobalt enrichment. (For interhe web version of the article.)
4 94 6
ath 2, j = −1500 mA cm−2). EDX mappings taken on this area for (b) Co K�1, (c) Yrrows, respectively. Notice that yttrium-enriched zones coincide with depletion ofpretation of the references to color in this figure caption, the reader is referred to

5148 K.M. Sivaraman et al. / Electrochimica Acta 56 (2011) 5142–5150
Fj
otw
3
ictwEwCteibpC[aacfsobiOcgtpgYvd(
2
Y
ig. 8. XPS survey spectrum of an yttrium-containing Co deposit obtained at CP of= −750 mA cm−2 from Bath 3 ([Co(II)] = 0.1 mol dm−3, [Y(III)] = 1 mol dm−3).
bserved. Complementary EDX mappings confirmed this observa-ion (see Fig. 7(b)–(d)). The oxygen content as determined by EDXas found to be significant and increased in yttrium-rich films.
.3. XPS analyses
Fig. 8 shows a typical XPS survey spectrum of a deposit contain-ng low amounts of yttrium, featuring the characteristic peaks ofobalt and yttrium elements. Copper and carbon peaks, belongingo the copper seed-layer and surface contaminants, respectively,ere also identified. Oxygen was also detected, in agreement with
DX analyses, suggesting that either oxide or hydroxide groupsere present in the deposits. The corresponding core-level Y3d,o2p and O1s spectra are displayed in Fig. 9. The Co2p spec-rum shows a complex structure broadened by multiplet splittingffects, the sharpest peaks at 778.5 and 793.8 eV being character-stic of metallic cobalt [33,34]. On the other hand, less intense androadened peaks denoted by an asterisk are attributed to Co2+ com-ounds. According to the literature, the Co2+ binding energies inoOOH and Co(OH)2 are about ∼780 and ∼781 eV, respectively35]. Likewise, CoO displays characteristic reflections at around 781nd 797 eV [36]. Hence, it can be concluded that metallic cobalt isccompanied by small amounts of oxidized cobalt. This is indeedorroborated on analyzing the O1s signal. Namely, the dominanteature in the O1s spectrum at around 532.4 eV can be assigned totructure water, which is commonly detected in electrodepositedxides and hydroxides [37]. Also, the shoulder located at lowerinding energies can be deconvoluted, according to the literature,
nto the contributions of hydroxide OH− (531.5 eV) and lattice oxide2− ions (530 eV). Concerning the Y3d spectrum, the two peaksentered at 158.6 eV and 156.7 eV match with the binding ener-ies expected for Y–OH and Y–O bindings [38,39]. This leads tohe hypothesis that yttrium incorporation into cobalt films chieflyroceeds via hydrolysis of Y(III) species in solution by an electro-enerated base such as OH− (Eq. (1)) [26]. As a result, colloidal(OH)3 forms (Eq. (2)), which tend to accumulate at the cathodeicinity and become entrapped into the growing cobalt deposituring electrodeposition, rendering a nanocomposite structure (Eq.
3)):H2O + 2e− → 2 OH−(aq) + H2(g) (1)
3+(aq) + 3OH−(aq) → Y(OH)3(ads) (2)
Fig. 9. Co2p, O1s and Y3d spectra of same deposit in Fig. 8. Note that the symbol *in cobalt spectrum indicates weak peaks corresponding to Co2+ compounds.
K.M. Sivaraman et al. / Electrochimica Acta 56 (2011) 5142–5150 5149
Fap
C
ssioSadorYw
3
r(adatpl5efdwF
Table 5Hardness values, evaluated by nanoindentation on the cross-section of variousdeposits, as a function of yttrium content.
wt% Y H (GPa) (±0.2 GPa)
0 1.93 2.25 2.6
TF
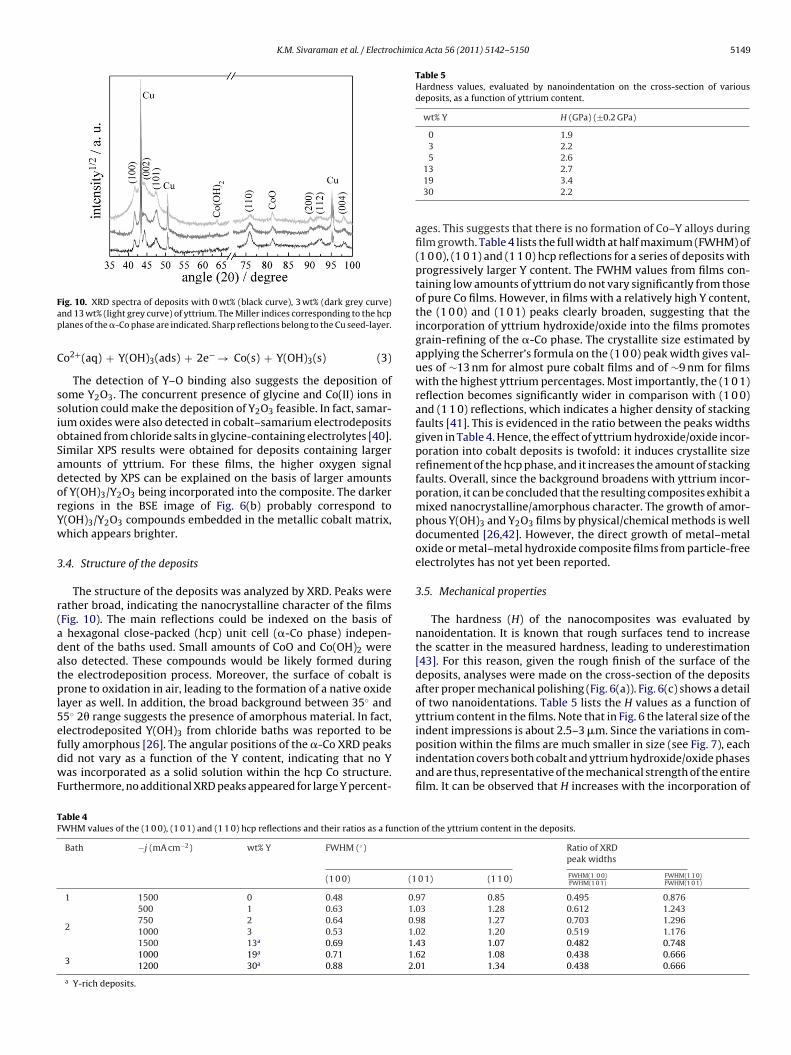
ig. 10. XRD spectra of deposits with 0 wt% (black curve), 3 wt% (dark grey curve)nd 13 wt% (light grey curve) of yttrium. The Miller indices corresponding to the hcplanes of the �-Co phase are indicated. Sharp reflections belong to the Cu seed-layer.
o2+(aq) + Y(OH)3(ads) + 2e− → Co(s) + Y(OH)3(s) (3)
The detection of Y–O binding also suggests the deposition ofome Y2O3. The concurrent presence of glycine and Co(II) ions inolution could make the deposition of Y2O3 feasible. In fact, samar-um oxides were also detected in cobalt–samarium electrodepositsbtained from chloride salts in glycine-containing electrolytes [40].imilar XPS results were obtained for deposits containing largermounts of yttrium. For these films, the higher oxygen signaletected by XPS can be explained on the basis of larger amountsf Y(OH)3/Y2O3 being incorporated into the composite. The darkeregions in the BSE image of Fig. 6(b) probably correspond to(OH)3/Y2O3 compounds embedded in the metallic cobalt matrix,hich appears brighter.
.4. Structure of the deposits
The structure of the deposits was analyzed by XRD. Peaks wereather broad, indicating the nanocrystalline character of the filmsFig. 10). The main reflections could be indexed on the basis of
hexagonal close-packed (hcp) unit cell (�-Co phase) indepen-ent of the baths used. Small amounts of CoO and Co(OH)2 werelso detected. These compounds would be likely formed duringhe electrodeposition process. Moreover, the surface of cobalt isrone to oxidation in air, leading to the formation of a native oxide
ayer as well. In addition, the broad background between 35◦ and5◦ 2� range suggests the presence of amorphous material. In fact,
lectrodeposited Y(OH)3 from chloride baths was reported to beully amorphous [26]. The angular positions of the �-Co XRD peaksid not vary as a function of the Y content, indicating that no Yas incorporated as a solid solution within the hcp Co structure.urthermore, no additional XRD peaks appeared for large Y percent-
able 4WHM values of the (1 0 0), (1 0 1) and (1 1 0) hcp reflections and their ratios as a function
Bath −j (mA cm−2) wt% Y FWHM (◦)
(1 0 0) (1
1 1500 0 0.48 0.
2
500 1 0.63 1.750 2 0.64 0.1000 3 0.53 1.1500 13a 0.69 1.
31000 19a 0.71 1.1200 30a 0.88 2.
a Y-rich deposits.
13 2.719 3.430 2.2
ages. This suggests that there is no formation of Co–Y alloys duringfilm growth. Table 4 lists the full width at half maximum (FWHM) of(1 0 0), (1 0 1) and (1 1 0) hcp reflections for a series of deposits withprogressively larger Y content. The FWHM values from films con-taining low amounts of yttrium do not vary significantly from thoseof pure Co films. However, in films with a relatively high Y content,the (1 0 0) and (1 0 1) peaks clearly broaden, suggesting that theincorporation of yttrium hydroxide/oxide into the films promotesgrain-refining of the �-Co phase. The crystallite size estimated byapplying the Scherrer’s formula on the (1 0 0) peak width gives val-ues of ∼13 nm for almost pure cobalt films and of ∼9 nm for filmswith the highest yttrium percentages. Most importantly, the (1 0 1)reflection becomes significantly wider in comparison with (1 0 0)and (1 1 0) reflections, which indicates a higher density of stackingfaults [41]. This is evidenced in the ratio between the peaks widthsgiven in Table 4. Hence, the effect of yttrium hydroxide/oxide incor-poration into cobalt deposits is twofold: it induces crystallite sizerefinement of the hcp phase, and it increases the amount of stackingfaults. Overall, since the background broadens with yttrium incor-poration, it can be concluded that the resulting composites exhibit amixed nanocrystalline/amorphous character. The growth of amor-phous Y(OH)3 and Y2O3 films by physical/chemical methods is welldocumented [26,42]. However, the direct growth of metal–metaloxide or metal–metal hydroxide composite films from particle-freeelectrolytes has not yet been reported.
3.5. Mechanical properties
The hardness (H) of the nanocomposites was evaluated bynanoidentation. It is known that rough surfaces tend to increasethe scatter in the measured hardness, leading to underestimation[43]. For this reason, given the rough finish of the surface of thedeposits, analyses were made on the cross-section of the depositsafter proper mechanical polishing (Fig. 6(a)). Fig. 6(c) shows a detailof two nanoidentations. Table 5 lists the H values as a function ofyttrium content in the films. Note that in Fig. 6 the lateral size of the
indent impressions is about 2.5–3 �m. Since the variations in com-position within the films are much smaller in size (see Fig. 7), eachindentation covers both cobalt and yttrium hydroxide/oxide phasesand are thus, representative of the mechanical strength of the entirefilm. It can be observed that H increases with the incorporation ofof the yttrium content in the deposits.
Ratio of XRDpeak widths
0 1) (1 1 0) FWHM(1 0 0)FWHM(1 0 1)
FWHM(1 1 0)FWHM(1 0 1)
97 0.85 0.495 0.87603 1.28 0.612 1.24398 1.27 0.703 1.29602 1.20 0.519 1.17643 1.07 0.482 0.74862 1.08 0.438 0.66601 1.34 0.438 0.666

5 chimi
yfiYnbcpTcitcIdottfsawc1a(whrdYkostimhfi
4
iftaoctapaadpm
A
S
[[[[
[
[[[
[[[
[[
[
[[[
[
[[[
[
[[
[[[
[
[
[
[[41] G.B. Mitra, N.C. Halder, Acta Cryst. 17 (1964) 817.
150 K.M. Sivaraman et al. / Electro
ttrium oxide/hydroxide. In particular, H increases from 1.9 GPa (inlms without Y incorporation) to 3.4 GPa in films containing 19 wt%. This could be due, at least in part, to the intrinsically large hard-ess of yttrium oxide and the mechanical interactions occurringetween the yttrium hydroxide/oxide and hcp-Co phase during theourse of nanoindentation experiments. The Vickers hardness ofure Co is around 1 GPa, whereas that of Y2O3 exceeds 9 GPa [21].herefore, it is likely that the incorporation of Y(OH)3 and Y2O3auses an increase of mechanical strength. In addition, such anncrease in hardness can be explained by taking into account bothhe grain refining effect and the higher density of stacking faultsaused by yttrium hydroxide/oxide incorporation into the films.n crystallites with small sizes, the motion of dislocations is hin-ered to a large extent by grain boundaries. This leads to piling upf dislocations, and, consequently to an increase in stress concen-ration and hardness. Apart from the presence of grain boundaries,he increase in hardness can be due to the presence of stackingaults as well. In terms of disrupting the motion of dislocations,tacking faults play a role similar to that of high-angle grain bound-ries [44,45]. The decrease in hardness in deposits with a higher Yt% (∼30%) is probably due to an increase in the density of micro-
racks. Indeed, if one compares the SEM images of samples with3 wt% Y (Fig. 5 panels (a) and (b)), 19 wt% Y [panels (c) and (d)]nd 30 wt% Y [panels (e) and (f)] it is clear that the most dense filmwith less porosity and lower density of micro-cracks) is the oneith 19 wt%, which corresponds to the sample with largest value ofardness. The sample with 13 wt% Y shows enhanced porosity withespect to the one with 19 wt% Y (and, concomitantly, the hardnessecreases from 3.4 GPa to 2.7 GPa). In turn, the film with 30 wt%shows a higher density of micro-cracks. Such micro-cracks are
nown to have a detrimental effect on the mechanical propertiesf films (e.g., hardness), particularly when the indentation impres-ion is performed near or on top of a micro-crack. This is probablyhe reason for the lower value of hardness (2.2 GPa) obtainedn this film. Hence, a combination of both compositional and
icrostructural effects needs to be taken into account to explain theardness variations observed in the electroplated nanocompositelms.
. Conclusions
The synthesis of cobalt–yttrium hydroxide/oxide nanocompos-tes has been accomplished by galvanostatic pulse plating directlyrom chloride salts. Incorporation of these yttrium compounds intohe cobalt films brings about significant changes at morphologicalnd structural levels, even for small yttrium percentages. In spitef the high current densities applied, the composites were mostlyrack-free and adhered well to the substrate. XRD analyses revealedhat the films displayed mixed nanocrystalline/amorphous char-cter. Incorporating yttrium oxides/hydroxides into the electrode-osits promoted grain size refinement of the �-Co matrix phase,nd increased the quantity of stacking faults. Both effects playkey role on the mechanical behavior of the composites, which
isplayed larger hardness compared to pure cobalt coatings. Thisarticle-free electrodeposition paves the way for synthesizing newetal–ceramic nanocomposites.
cknowledgements
This work is supported by the NCCR Co-Me of the Swiss Nationalcience Foundation. E.P., J.S., S.S. and M.D.B. acknowledge fund-
[[[
[
ca Acta 56 (2011) 5142–5150
ing from the Generalitat de Catalunya through the 2009-SGR-1292project and from the Spanish Ministry of Science and Innova-tion (MICINN) through MAT2007-61629. The authors sincerelyacknowledge the staff from the Servei de Microscòpia of the Uni-versitat Autònoma de Barcelona for their assistance with SEMcharacterization. E.P. is indebted to the Generalitat de Catalunyafor the Beatriu de Pinós postdoctoral fellowship. M.D.B. was par-tially supported by an ICREA Academia award. S.P. acknowledges apostdoctoral fellowship from MICINN.
References
[1] A. Hovestad, L.J.J. Janssen, J. Appl. Electrochem. 25 (1995) 519.[2] M. Musiani, Electrochim. Acta 45 (2000) 3397.[3] L. Benea, P.L. Bonora, A. Borello, S. Martelli, F. Wenger, P. Ponthiaux, J. Galland,
J. Electrochem. Soc. 148 (2001) C461.[4] S. Arai, T. Saito, M. Endo, J. Electrochem. Soc. 157 (2010) D147.[5] D. Thiemig, A. Bund, J.B. Talbot, Electrochim. Acta 54 (2009) 2491.[6] J. Fransaer, E. Leunis, T. Hirato, J.-P. Celis, J. Appl. Electrochem. 32 (2002) 123.[7] J. Fransaer, J.P. Celis, J.R. Roos, J. Electrochem. Soc. 139 (1992) 413.[8] M.D. Ger, Mater. Chem. Phys. 87 (2004) 67.[9] T.J. Tuaweri, G.D. Wilcox, Surf. Coat. Technol. 200 (2006) 5921.10] A.R. Boccaccini, I. Zhitomirsky, Curr. Opin. Solid State Mater. Sci. 6 (2002) 251.11] S.H. Baeck, T. Jaramillo, G.D. Stucky, E.W. McFarland, Nano Lett. 2 (2002) 831.12] E. Gómez, E. Pellicer, E. Vallés, J. Electroanal. Chem. 580 (2005) 238.13] C. Lepiller, S. Poissonnet, P. Bonnaillie, G. Giunchi, F. Legendre, J. Electrochem.
Soc. 151 (2004) D13.14] X. Xia, I. Zhitomirsky, J.R. McDermid, J. Mater. Process. Technol. 209 (2009)
2632.15] M. Tran, D. Mohammedi, C. Fiaud, E.M.M. Sutter, Corros. Sci. 48 (2006) 4257.16] L. Nylén, J. Gustavsson, A. Cornell, J. Electrochem. Soc. 155 (2008) E136.17] R. Siab, G. Bonnet, J.M. Brossard, J. Balmain, J.-F. Dinhut, Appl. Surf. Sci. 253
(2007) 3425.18] T. Ikegami, J.-G. Li, T. Mori, J. Am. Ceram. Soc. 85 (2002) 1725.19] J. Al-Haidary, M. Al-Haidari, S. Qrunfuleh, Biomed. Mater. 3 (2008) 015005.20] G.Y. Chen, G. Somesfalean, Z.G. Zhang, Q. Sun, F.P. Wang, Opt. Lett. 32 (2007)
87.21] A.S. Kumar, A.R. Durai, T. Sornakumar, Mater. Lett. 58 (2004) 1808.22] J.-M. Brossard, J. Balmain, J. Creus, G. Bonnet, Surf. Coat. Technol. 185 (2004)
275.23] E. Tondo, M. Boniardi, D. Cannoletta, M.F. De Riccardis, B. Bozzini, J. Power
Sources 195 (2010) 4772.24] J.A. Switzer, Am. Ceram. Soc. Bull. 66 (1987) 1521.25] I. Zhitomirsky, A. Petric, J. Mater. Chem. 10 (2000) 1215.26] M. Aghazadeh, A. Nozad, H. Adelkhani, M. Ghaemi, J. Electrochem. Soc. 157
(2010) D519.27] A.G. McCormack, M.J. Pomeroy, V.J. Cunnane, J. Electrochem. Soc. 150 (2003)
C356.28] M. Schwartz, N.V. Myung, K. Nobe, J. Electrochem. Soc. 151 (2004) C468.29] W.C. Oliver, G.M. Pharr, J. Mater. Res. 7 (1992) 1564.30] E.A. Tkachenko, R. Mahiou, G. Chadeyron, D. Boyer, P.P. Fedorov, S.V. Kuznetsov,
Russ. J. Inorg. Chem. 52 (2007) 829.31] S. Pané, O. Ergeneman, K. Sivaraman, E. Pellicer, M.D. Baró, B.J. Nelson, Meet.
Abstr. - Electrochem. Soc. 902 (2009) 3132.32] E. Pellicer, E. Gómez, E. Vallés, Surf. Coat. Technol. 201 (2006) 2351.33] F. Allegretti, G. Parteder, M.G. Ramsey, S. Surnev, F.P. Netzer, Surf. Sci. 601 (2007)
L73.34] P.R. Sajanlal, T. Pradeep, J. Phys. Chem. C 114 (2010) 16051.35] I.G. Casella, M.R. Guascito, J. Electroanal. Chem. 476 (1999) 54.36] W. Chu, P.A. Chernavskii, L. Gengembre, G.A. Pankina, P. Fongarland, A.Y. Kho-
dakov, J. Catal. 252 (2007) 215.37] J.-K. Chang, M.-T. Lee, C.-H. Huang, W.-T. Tsai, Mater. Chem. Phys. 108 (2008)
124.38] V. Bondarenka, S. Grebinskij, S. Kaciulis, G. Mattogno, S. Mickevicius, H. Tvar-
dauskas, V. Volkov, G. Zakharova, J. Electron. Spectrosc. Relat. Phenom. 120(2001) 131.
39] NIST X-ray Photoelectron Spectroscopy Database: http://srdata.nist.gov/xps/Default.aspx.
40] J.C. Wei, M. Schwartz, K. Nobe, J. Electrochem. Soc. 155 (2008) D660.
42] S.N. Mukherjee, C.R. Aita, J. Vac. Sci. Technol. A 10 (1992) 2723.43] M.S. Bobji, S.K. Biswas, J. Mater. Res. 14 (1999) 2259.44] J. Sort, A. Zhilyaev, M. Zielinska, J. Nogués, S. Surinach, J. Thibault, M.D. Baró,
Acta Mater. 51 (2003) 6385.45] L. Lu, Y. Shen, X. Chen, L. Qian, K. Lu, Science 304 (2004) 422.