Electrode materials for Na-ion batteries: a new route … materials for Na-ion batteries: a new...
85
Electrode materials for Na-ion batteries: a new route for low-cost energy storage. Valentina Massaccesi Dissertação para obtenção do Grau de Mestre em Química Orientadores: Prof a . Maria de Fátima Grilo da Costa Montemor Dr.Francesco Nobili Júri Presidente: Profª. Maria Matilde Soares Duarte Marques Orientador: Prof a . Maria de Fátima Grilo da Costa Montemor Vogais: Prof. António Pedro dos Santos Lopes Castela Prof. Corrado Bacciocchi Janeiro de 2016
Transcript of Electrode materials for Na-ion batteries: a new route … materials for Na-ion batteries: a new...
Electrode materials for Na-ion batteries: a new route for low-cost energy storage.
Valentina Massaccesi
Dissertação para obtenção do Grau de Mestre em
Química
Orientadores: Profa. Maria de Fátima Grilo da Costa Montemor
Dr.Francesco Nobili
Júri
Presidente: Profª. Maria Matilde Soares Duarte Marques
Orientador: Profa. Maria de Fátima Grilo da Costa Montemor
Vogais: Prof. António Pedro dos Santos Lopes Castela
Prof. Corrado Bacciocchi
Janeiro de 2016

Abstract:
With the exhaustion of fossil fuel resources and increasing environmental problems, a variety of
renewable energy sources, such as the wind and sun, are growing rapidly. The use of these energy
sources requires a large-scale energy storage system (ESS) to shift electrical energy from peak to off-
peak periods, with the aim to achieve smart grid management. Room-temperature stationary
sodium-ion batteries have attracted great attention particularly in large scale electric energy storage
applications for renewable energy and smart grid because of the huge abundant sodium resources
and low cost.
The research work presented in this thesis deals with the investigation of electrochemical properties
of electrode materials for this tipe of batteries, in particular NaxCoO2 as the cathodic component.
In the first part of this thesis, several synthetic routes have been studied. The active materials
obtained have been investigated by X-Ray Diffraction (XRD) and Inductively Coupled Plasma Mass
Spectrometry (ICP-MS) analysis to evaluate the correlation between stoichiometry and crystal
structure. A morphological characterization was conducted by Scanning Electron Microscopy (SEM).
In the second part of this thesis, the materials have been tested electrochemically by Galvanostatic
Cycling with Potential Limitation (GCPL), Cyclic Voltammetry (CV) and Electrochemical Impedance
Spectroscopy (EIS). Finally an optimization of the system was conducted, evaluating the use of
different elecrolytes and binders.
Key words: Na-Ion Batteries, NaxCoO2 Cathode, XRD, PEIS

Resumo:
Com a exaustão dos recursos de combustíveis fósseis e problemas ambientais crescentes, tem-se
assistido a um rápido incremento do interesse nas energias renováveis, como a solar e a eólica. O uso
destas fontes de energia requer um sistema de armazenamento em larga escala para transferir a
energia elétrica entre períodos de pico e períodos de menor utilização, de modo a conseguir uma
gestão inteligente da rede. As baterias estacionárias de ião sódio funcionando à temperatura
ambiente têm atraído grande atenção, particularmente em aplicações de larga escala como fonte de
energia renovável, permitindo uma gestão inteligente das redes devido aos abundantes recursos em
sódio e ao seu baixo custo.
O trabalho apresentado nesta tese é uma investigação das propriedades eletroquímicas de materiais
adequados como elétrodos para este tipo de baterias, explorando-se em particular NaxCoO2 como
componente catódica.
Na primeira parte da tese foram estudadas várias vias sintéticas. Os materiais ativos obtidos foram
analisados por Difração de Raios-X (XRD) e Espectrometria de Massa com Plasma Acoplado (ICP-MS)
para elucidar a correlação entre a estequiometria e a estrutura cristalina. Foi ainda realizada uma
caracterização morfológica por Microscopia Eletrónica de Varrimento (SEM).
Na segunda parte da tese foi testada a eletroquímica dos materiais produzidos por GCPL, Voltametria
Cíclica (CV) e Espectroscopia de Impedância Eletroquímica (EIS). Finalmente, procedeu-se a uma
otimização, com avaliação de diferentes electrólitos e agentes ligantes.
Palavras-chave: Baterias de sódio, Cátodo de NaxCoO2, XRD, PEIS

Index:
1. Introduction __________________________________________________________ 1
1.1 Basic concepts of batteries ______________________________________________ 3
1.2 Batteries typologies _________________________________________________ 5
1.2.1 Primary Batteries __________________________________________________________ 5
1.2.2 Secondary Batteries _______________________________________________________ 6
1.2.3 Flow Batteries _____________________________________________________________ 8
1.2.4 Fuel cells ________________________________________________________________ 10
1.2.5 Supercapacitors __________________________________________________________ 11
2. Sodium energy storage batteries ______________________________________ 13
2.1 Molten sodium cells ____________________________________________________ 13
2.1.1 Na–S batteries ____________________________________________________________ 13
2.1.2 Sodium–air (Na–O2) cells __________________________________________________ 14
2.1.3 ZEBRA cells ______________________________________________________________ 16
2.2 Sodium Ion-Batteries ___________________________________________________ 17
2.2.1 Na-ion aqueous batteries __________________________________________________ 18
2.2.2 Na-ion non-aqueous batteries. _____________________________________________ 19
2.2.2.1 Anodic materials _______________________________________________________ 19
2.2.2.2 Cathodic materials _____________________________________________________ 20
2.2.2.2.1 NaxCoO2 cathode material ___________________________________________ 22
2.2.3 Electrolytes ______________________________________________________________ 24
2.2.4 Binders __________________________________________________________________ 25
3 Aim of the research __________________________________________________ 27
4 Experimental procedures and techniques ______________________________ 28
4.1. Synthetic techniques ___________________________________________________ 28
4.1.1 Solid State reaction _______________________________________________________ 28
4.1.2 High energy ball milling and post firing _____________________________________ 28
4.1.3 Sol- gel technique ________________________________________________________ 29
4.2 Chemical, structural and morphological characterization techniques ______ 30
4.2.1 X-Ray Powder Diffraction (XRD)____________________________________________ 30
4.2.2 Scanning Electron Microscopy (SEM) ______________________________________ 32
4.2.3 Inductively Coupled Plasma Mass Spectrometry (ICP-MS) ___________________ 36
4.3 Electrochemical Principles _____________________________________________ 40
4.3.1 Faraday’s Law ____________________________________________________________ 40
4.3.2 Nernst’s equation _________________________________________________________ 41
4.4 Electrochemical characterization techniques. ____________________________ 42
4.4.1 Cyclic Voltammetry _______________________________________________________ 42
4.4.2 Galvanostatic Charge/Discharge cycles ____________________________________ 45
4.4.3 Electrochemical Impedance spectroscopy (EIS) _____________________________ 45
5 Results and discussion _______________________________________________ 49
5.1 Morphological characterization _________________________________________ 50

5.2 Chemical characterization ______________________________________________ 51
5.3 Structural characterization _____________________________________________ 51
5.4 Electrodes processing procedure _______________________________________ 55
5.5 Electrochemical characterization ________________________________________ 57
5.5.1 Sample 1: Ball-Milling and post firing synthesis - Na0.83CoO2 _________________ 57
5.5.2 Sample 2: Solid State reaction synthesis - Na0.65CoO2________________________ 63
5.5.3 Sample 3: Sol-gel Method synthesis - Na0.28CoO2 ____________________________ 66
5.5.4 Cyclic Voltammetry _________________________________________________________ 66
5.5.5 Electrochemical Impedance Spectroscopy __________________________________ 70
6 Conclusions and future developments _________________________________ 74

Index of Schemes and Figures:
Figure 1: Main characteristics of Na and Li materials ..........................................................................2
Figure 2:Scheme of the fundamental part of a cell. .............................................................................4
Figure 3:Scheme of a Dry Cell............................................................................................................5
Figure 4:Scheme of a flow battery. .....................................................................................................8
Figure 5: Comparison between a secondary cell and a flow battery. ...................................................9
Figure 6: Scheme of a Fuel cell. ....................................................................................................... 10
Figure 7: Scheme of a Supercapacitor.............................................................................................. 11
Figure 8:Schematic representation of the sodium sulphur cell. .......................................................... 13
Figure 9:representation of voltage profile for Na-S cell. ..................................................................... 14
Figure 10:Schematic representation of Na-O2 battery on discharge20
. .............................................. 15
Figure 11:voltage profile for Na-O2 battery on first discharge cycle ................................................... 16
Figure 12:Schematic representation of Na-NiCl2 (ZEBRA) cell on discharge. .................................... 17
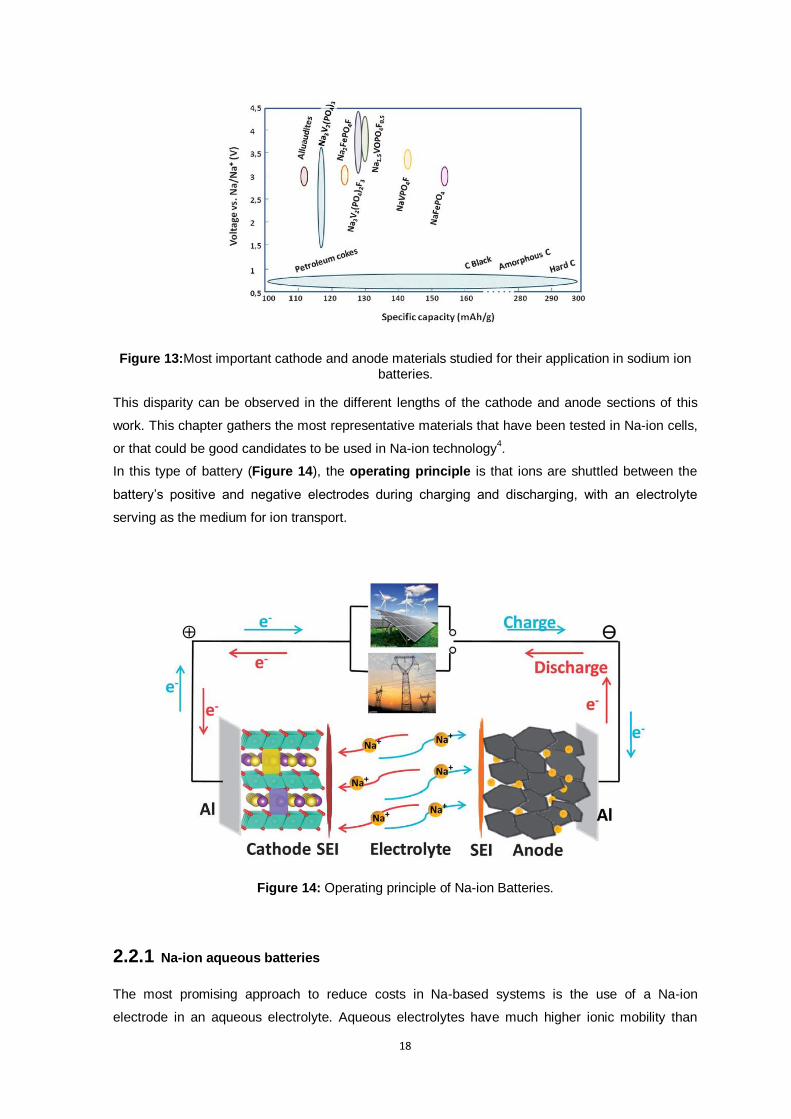
Figure 13:Most important cathode and anode materials studied for their application in sodium ion
batteries. ............................................................................................................................ 18
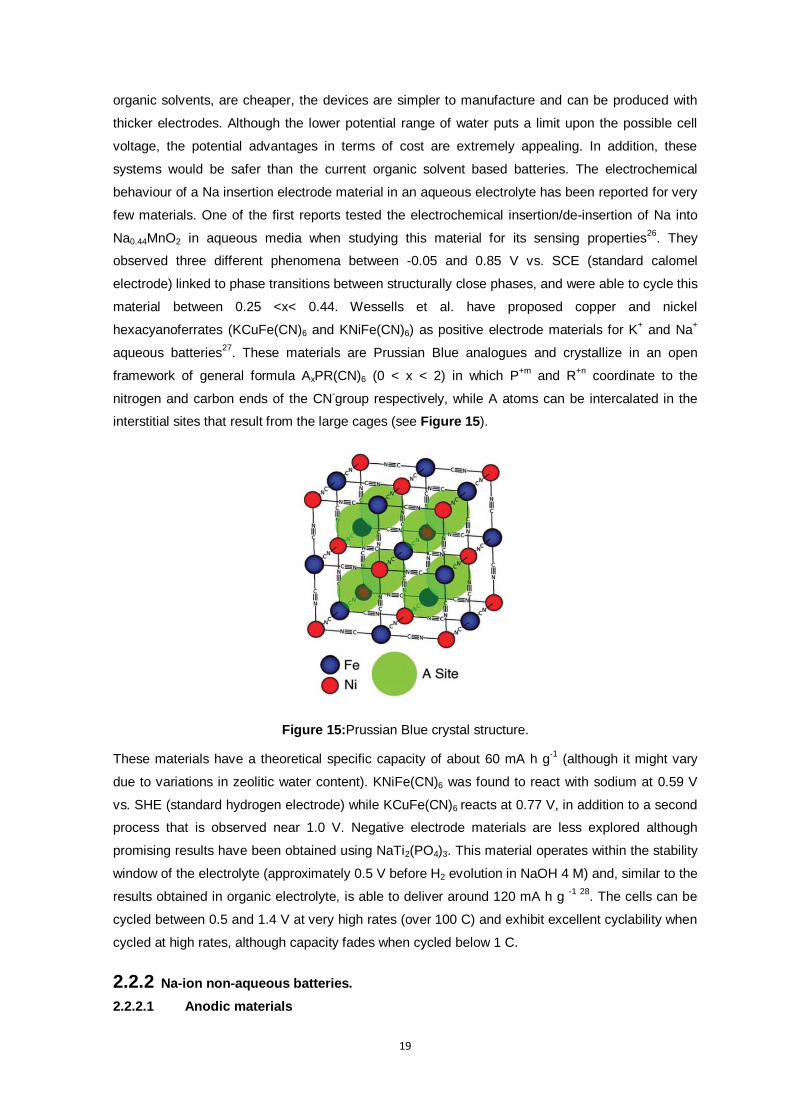
Figure 14: Operating principle of Na-ion Batteries............................................................................. 18
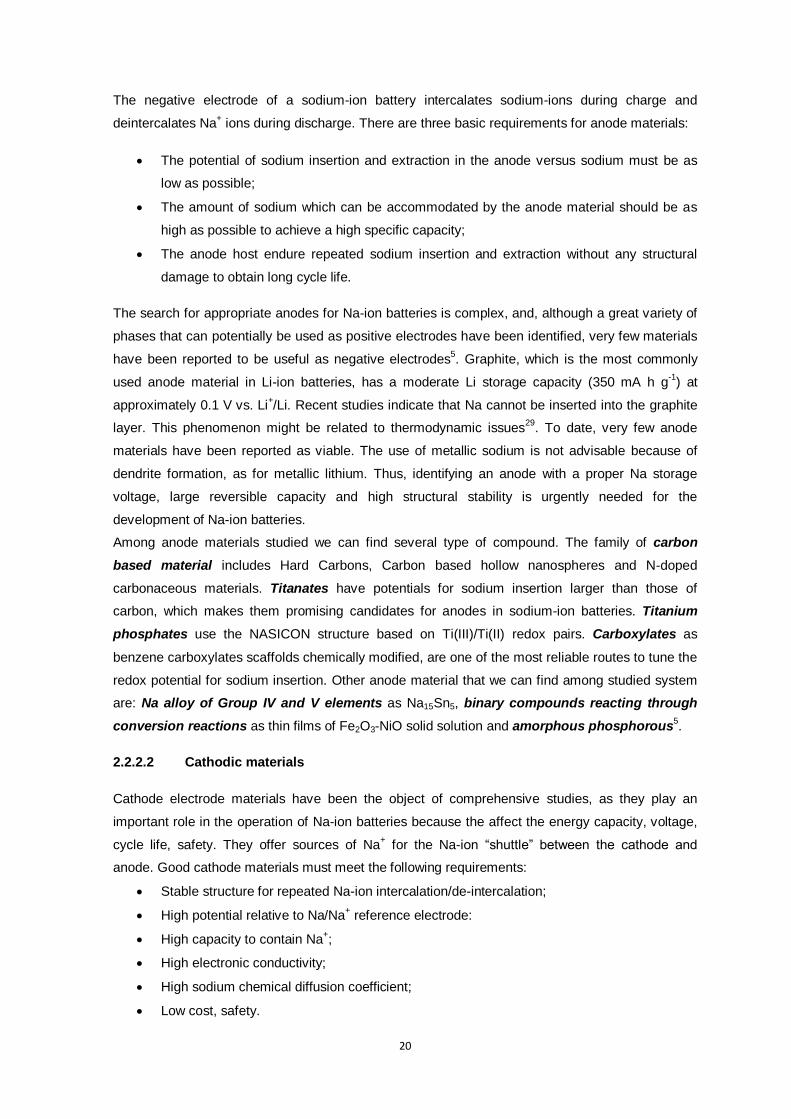
Figure 15:Prussian Blue crystal structure.......................................................................................... 19
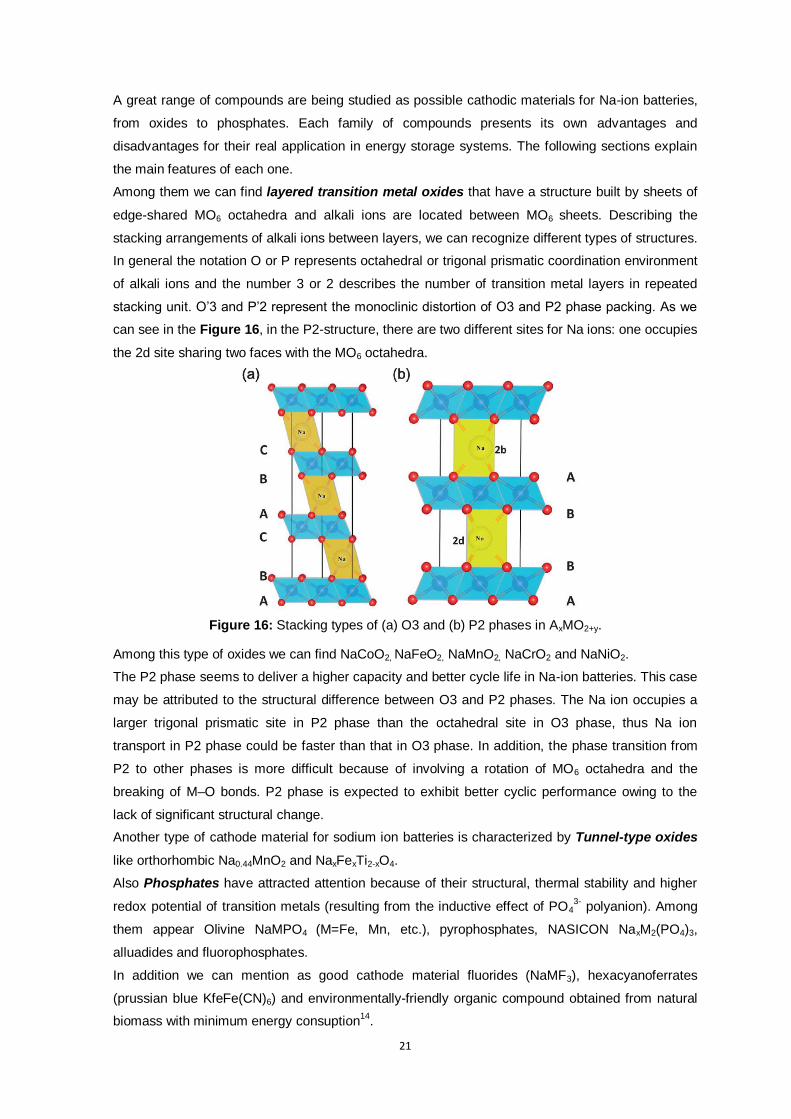
Figure 16: Stacking types of (a) O3 and (b) P2 phases in AxMO2+y.................................................... 21
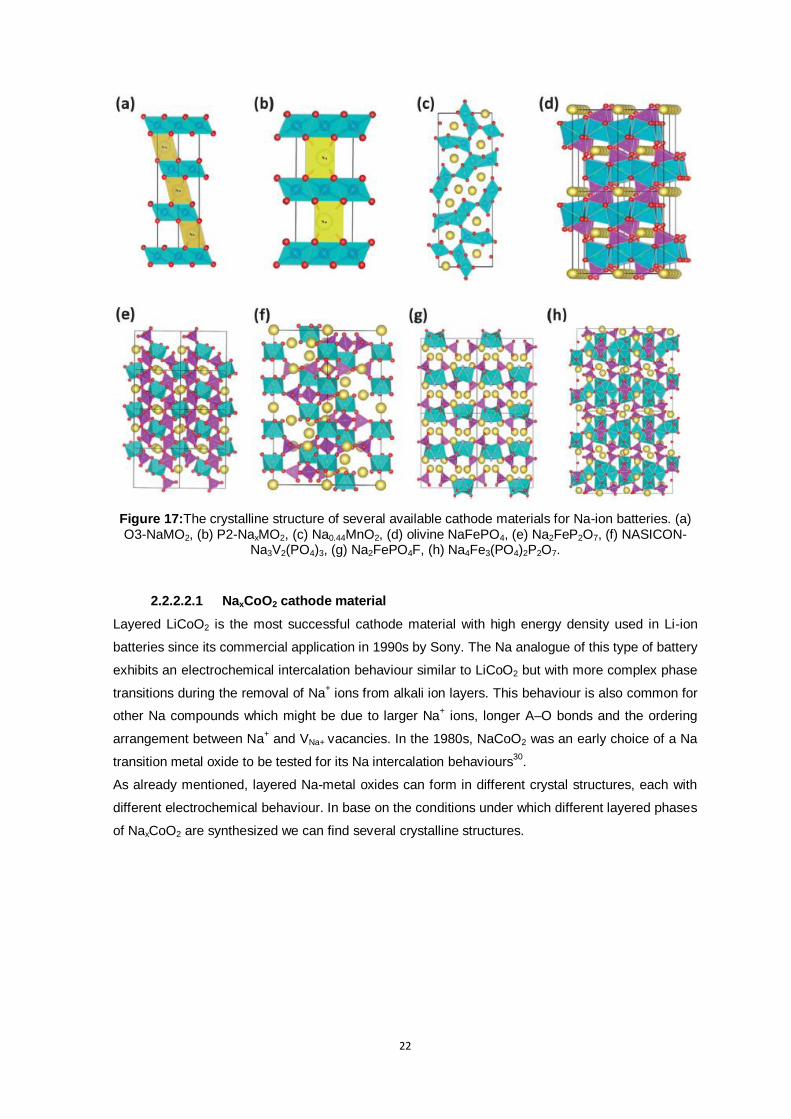
Figure 17:The crystalline structure of several available cathode materials for Na-ion batteries. (a) O3-
NaMO2, (b) P2-NaxMO2, (c) Na0.44MnO2, (d) olivine NaFePO4, (e) Na2FeP2O7, (f) NASICON-
Na3V2(PO4)3, (g) Na2FePO4F, (h) Na4Fe3(PO4)2P2O7. ......................................................... 22
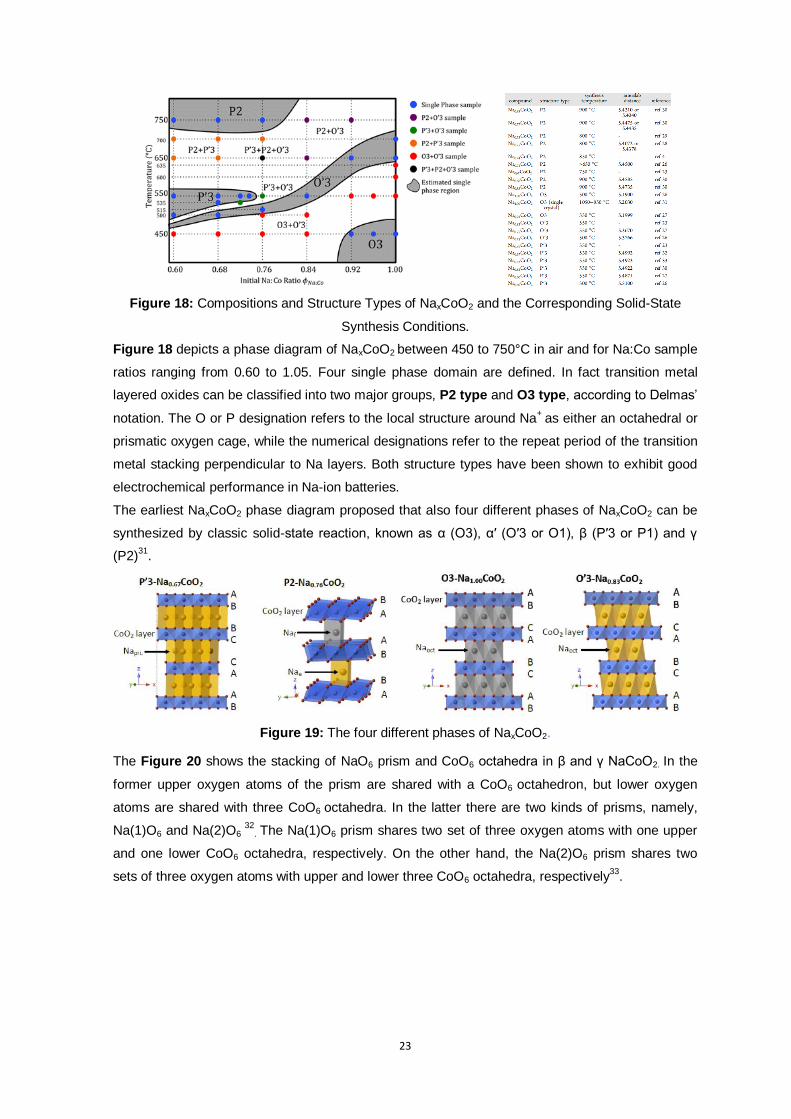
Figure 18: Compositions and Structure Types of NaxCoO2 and the Corresponding Solid-State
Synthesis Conditions. ......................................................................................................... 23
Figure 19: The four different phases of NaxCoO2. ............................................................................. 23
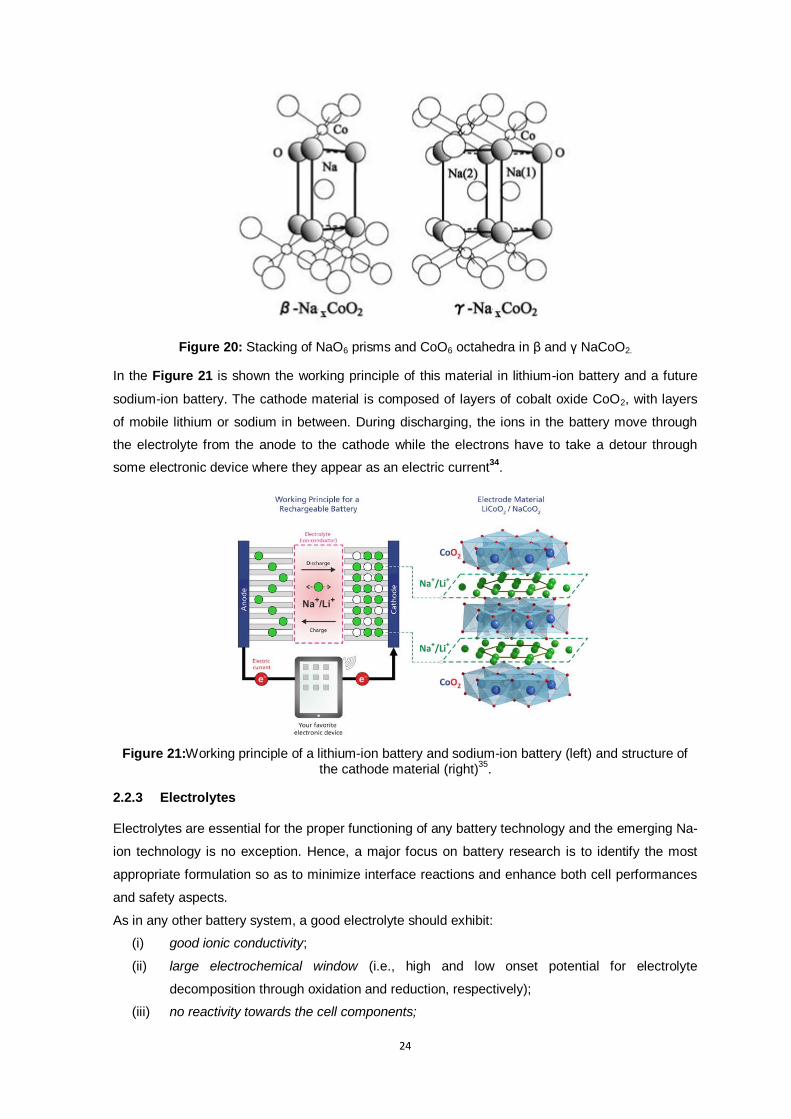
Figure 20: Stacking of NaO6 prisms and CoO6 octahedra in β and γ NaCoO2. ................................... 24
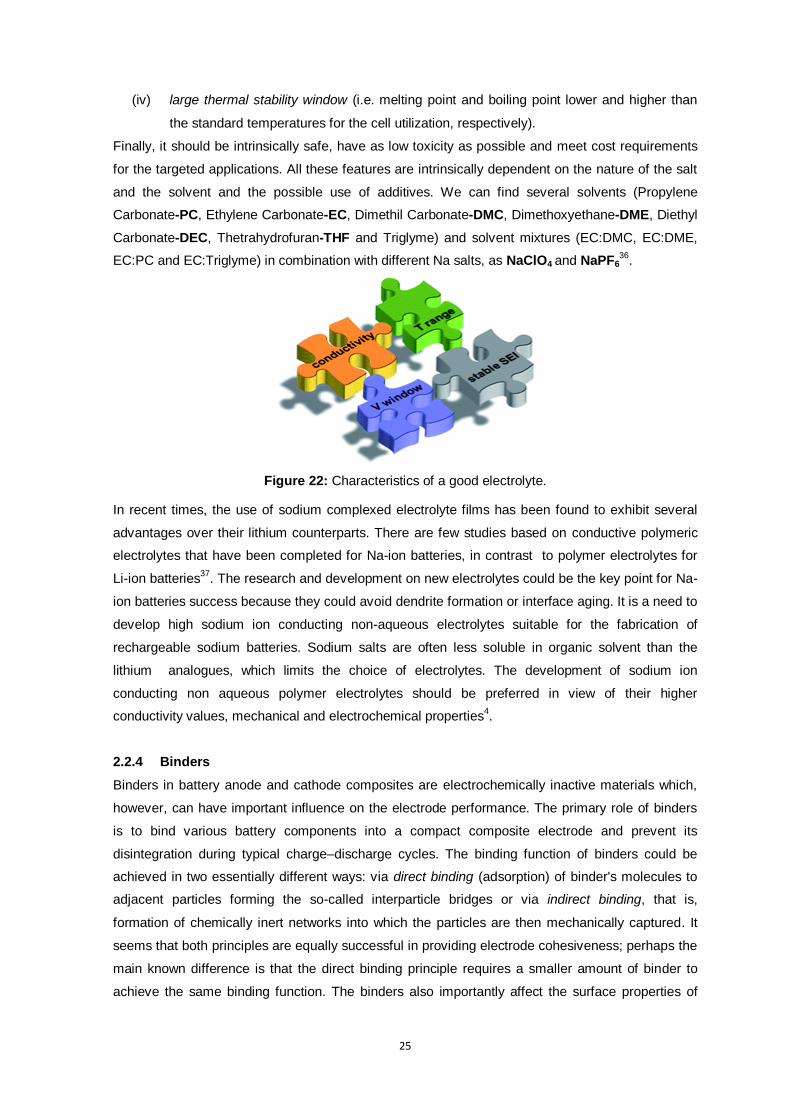
Figure 21:Working principle of a lithium-ion battery and sodium-ion battery (left) and structure of the
cathode material (right). .................................................................................................................... 24
Figure 22: Characteristics of a good electrolyte. ............................................................................... 25
Figure 23:Two different binding principles that can be used for preparation of composite (a) direct
binding; (b) Indirect binding. ............................................................................................... 26
Figure 24: Most used binders: Polyvivnyldene Fluoride (PVdF), Sodium Carboxymethyl Cellulose (Na-
CMC) and Polyacrylic Acid (PAA). ...................................................................................... 26
Figure 25:Representation of a Ball Mill. ............................................................................................ 29
Figure 26: Sol-gel methods main steps. ............................................................................................ 29
Figure 27: Representation of a unit cell and lattice. ........................................................................... 30
Figure 28: Representation of the X-Ray tube .................................................................................... 30
Figure 29: Basic Features of Typical XRD Experiment: production, diffraction, detection, interpretation
.......................................................................................................................................... 31
Figure 30: Geometrical representation of Brag law, reflection of X-rays from two planes of atoms in a
solid.. ................................................................................................................................. 32
Figure 31:Representation of a constructive interference. .................................................................. 32
Figure 32:Two points showing the limits of detection. ....................................................................... 33
Figure 33: Schematic representation of SEM. ................................................................................... 34
Figure 34: Sample- electron interaction. ........................................................................................... 35
Figure 35: Approximate detection capabilities of quadrupole ICP-MS. .............................................. 36
Figure 36: The ICP Torch showing the fate of the sample. ................................................................ 37
Figure 37:The interface region of an ICP-MS. ................................................................................... 38
Figure 38: Schematic of quadrupole mass filter. ............................................................................... 38
Figure 39:Schematic representation of a T-cell. ................................................................................ 42
Figure 40: CV Excitation Signal. ....................................................................................................... 43
Figure 41: Voltammogram of a Single electron oxidation-reduction. .................................................. 43
Figure 42:Repeated GCPL: (a) current excitation plot and (b) corresponding voltage variation. ......... 45
Figure 43: Nyquist plot and corresponding equivalent circuit with RC parallel element. ..................... 47
Figure 44: Bode Plots for the equivalent circuit with RC parallel element. ......................................... 47
Figure 45: (a) Randles circuit and (b) its Nyquist plot. ....................................................................... 48
Figure 46:(a) Equivalent circuit including the Warburg element and (b) the typical shape of its Nyquist
plot. ................................................................................................................................. 48
Figure 47: Nyquist plots for (a) a capacitor, (b) a capacitor in series with a resistor, (c) a capacitor in
parallel with a resistor, and (d) a resistor in series with a parallel RC-circuit. ..................... 49
Figure 48: SEM images of Sample 1 powder at different magnifications (32100 X on the left and 5060
X on the right) .................................................................................................................. 50
Figure 49:SEM images of Sample 2 powder at different magnifications (32840 X on the left and 5000
X on the right). ................................................................................................................. 50
Figure 50: SEM images of Sample 3 powder at different magnifications (33070 X on the left and 5000
X on the right). ................................................................................................................. 51
Figure 51:Comparison of XRD pattern obtained by the three different synthesis. .............................. 52
Figure 52: NaxCoO2 phase diagram and identification of Sample 1 (*red) and Sample 2 (*yellow). .... 52
Figure 53:XRD pattern of Sample 1. ................................................................................................. 53
Figure 54: XRD pattern of Sample 2. ................................................................................................ 53
Figure 55: XRD pattern of Sample 3. ................................................................................................ 54
Table 56: Percentage composition of Co01, Co02 and Co03 layers. ................................................. 55
Table 57: Percentage composition of Co11, Co12 and Co13 layers. ................................................. 56
Table 58: Percentage composition of Co21, Co22 and Co23 layers. ................................................. 57
Figure 59: Comparison of specific capacity vs cycle number between Co01A (pressed) and Co01B
(non-pressed). ................................................................................................................. 58
Figure 60: Galvanostatic curves of Co01B at different rate................................................................ 58
Figure 61: dQ/dE vs E curves of Co01A at different rate. .................................................................. 59
Figure 62: Comparison of specific capacity vs cycle number between Co01A (pressed), Co01B (non-
pressed), using NaPF6 and NaClO4.................................................................................. 60

Figure 63: Comparison of specific capacity vs cycle number of Co11B/NaPF6/Na and
Co11B/NaClO4/Na cells. .................................................................................................. 61
Figure 64: Comparison of specific capacity vs cycle number of Co21A/NaPF6/Na and
Co21A/NaClO4/Na cells. .................................................................................................. 62
Figure 65: Comparison of specific capacity vs cycle number of Co02A/B layers with NaPF6 and
NaClO4. ........................................................................................................................... 63
Figure 66: Specific capacity vs cycle number of Co12B/NaPF6/Na.................................................... 64
Figure 67: Comparison of specific capacity vs cycle number of Co22A with NaPF6 and NaClO4........ 65
Figure 68: Specific capacity vs cycle number of Co03B/NaPF6/Na cell. ............................................ 66
Figure 69:Cyclic voltagram for Co01B/NaPF6/Na cell between 2-3.8 V. ............................................ 67
Figure 70: Cyclic voltagram for Co02B/NaPF6/Na cell between 2-4.2 V. ........................................... 67
Figure 71: The three hexagonal structure types found for NaxCoO2. ................................................. 68
Figure 72: On the left, the general structural characteristics and compositional stability regions of the
four NaxCoO2 phases, designated as H1, H2,H3, and O1. On the right, upper panel,
thickness of the NaO2 layers as a function of Na content, middle panel, thickness of the
CoO2 layer and variation in O-Co-O bond angle as a function of Na content, lower panel,
the corresponding variation in Co-O bond length. ............................................................. 69
Figure 73: Charge/discharge phase modifications. ........................................................................... 70
Figure 74: Nyquist plots of Co01A oxidation and reduction. .............................................................. 71
Figure 75: Nyquist plots of Co02A oxidation and reduction. .............................................................. 72
Figure 76: a) Resistance due to SEI and electrolyte; b) Resistance related to Charge Transfer; c)
Electronic Resistance (Co01A layer in oxidation). ............................................................ 73
1
1. Introduction
Energy storage has become a growing global concern over the past decade as a result of
increased energy demand, combined with drastic increases in the price of refined fossil fuels and
the environmental consequences of their use. This has increased the call for environmentally
responsible alternative sources for both energy generation and storage. Although wind and solar
generated electricity is becoming increasingly popular in several industrialized countries, these
sources provide intermittent energy; thus energy storage systems are required for load-levelling.
Portable energy solutions that realize the practical use of hybrid electric vehicles HEVs, plug-in
hybrid electric vehicles PHEVs and purely electric vehicles EVs will further reduce dependence on
fossil fuels. Lithium-ion batteries, the most common type of secondary cells found in almost all
portable electronic devices, are a possible solution to these larger global concerns 1. Lithium based
electrochemistry offers several appealing attributes: lithium is the lightest metallic element and has
a very low redox potential (E°Li+/Li=-3.04V versus standard hydrogen electrode), which enables cells
with high voltage and high energy density. Furthermore, Li+ has a small ionic radius which is
beneficial for diffusion in solids. Coupled with its long cycle life and rate capability, these properties
have enabled Li-ion technology to capture the portable electronics market. The demand for lithium-
ion batteries as a major power source in portable electronic devices and vehicles is rapidly
increasing: lithium-ion batteries are regarded as the battery of choice for powering future
generations of HEV and PHEVs. With the likelihood of enormous demands on available global
lithium resources, concerns over lithium supply, but mostly its cost, have arisen. Many global
lithium reserves are located in remote or in politically sensitive areas2. Even if extensive battery
recycling programs were established, it is possible that recycling could not prevent this resource
depletion in time. Furthermore, increasing lithium utilization in medium-scale automotive batteries
will ultimately push up the price of lithium compounds, thereby making large-scale storage
prohibitively expensive. While the debate over the feasibility and environmental impact of lithium
carbonate production continues, sodium-based compounds are under consideration as options for
large scale energy storage coupled to renewable energy sources, for example. Expansion of
battery research into alternative materials may accelerate the ability to work through both the
scaling and cost challenges inherent in long-term planning for battery energy storage, therefore it is
imperative to seek low-cost alternatives that are not resource-limited.
With sodium’s high abundance and low cost, and very suitable redox potential (E°Na+
/Na=-
2.71 V versus standard hydrogen electrode, only 0.3 V above that of lithium), rechargeable
electrochemical cells based on sodium also hold much promise for energy storage applications3.
This alkali holds promise for being a complement or substituting Li-based technology. Its natural
abundance, easy access to sodium sources and, consequently, lower price; suitable redox
potential and similar intercalation chemistry to Li, make this element strategic in innovative
research of energy storage systems4. The use of Na instead of Li in rocking chair batteries could
mitigate the feasible shortage of lithium in an economic way, due to the unlimited sodium sources,
the ease to recover it, and its lower price.

2
Figure 1:Main characteristics of Na and Li materials
Moreover, for positive electrode materials sodium intercalation chemistry is very similar to Li, thus
making it possible to use very similar compounds for both kinds of systems. Furthermore, if a
rechargeable sodium-ion battery with good performance characteristics could be developed, it
could have the advantage of using electrolyte systems of lower decomposition potential due to the
higher half-reaction potential for sodium relative to lithium. This low voltage operation would make
Na-ion cells cheaper, because water-based electrolytes could be used instead of organic ones. It
must be pointed out that electrochemical Na-ion cells will always fall short of meeting energy
densities compared to Li-ion batteries. First, because equivalent weight of Na is higher than Li, and
second because the size of the alkali metal is bigger. The ionic diameter decreases from 4 A to 2 A
for the same series. Thus, Na-based cells will have difficulties competing with Li based cells in
terms of energy density. However, they can be considered for use in applications where the weight
and footprint requirement is less drastic, such as storage of off-peak and essentially fluctuating
renewable energies, such as wind and solar farms. In spite of these considerations, there exists
growing interest on Na-ion technology5.
3
1.1 Basic concepts of batteries
A battery is a device that converts the chemical energy contained in its active materials directly into
electric energy by means of an electrochemical oxidation-reduction (redox) reaction. The redox
reaction involves the transfer of electrons from one material to another through an electric circuit
and the restoring of charge neutrality through electrolyte migration. While the term “battery” is often
used, the basic electrochemical unit being referred to is the “cell”. A battery consist of one or more
of these cells, connected in series or parallel, or both, depending on the desired output voltage and
capacity.
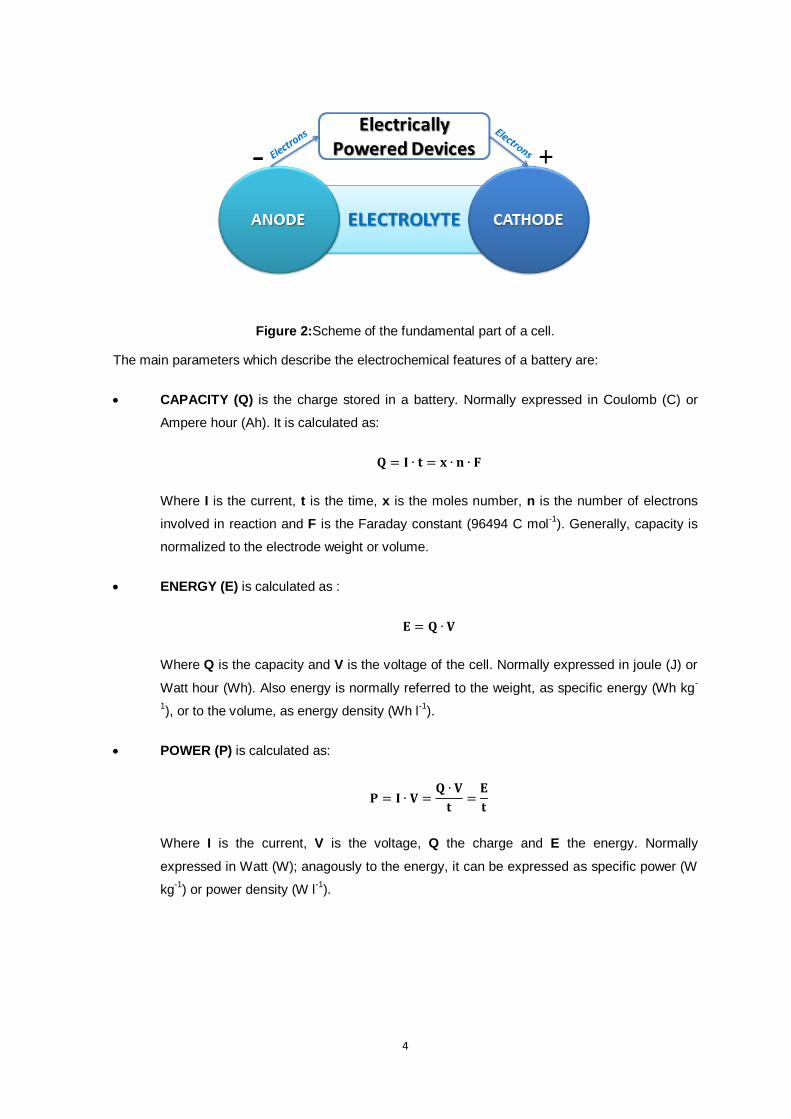
The cell consist of three major components (Figure 2):
1. The ANODE or negative electrode (reducing electrode) which gives up electrons to the
external circuit and is oxidized during the electrochemical reaction. Generally, the anode is
selected with the following properties: efficiency as a reducing agent, high coulombic output (Ah/
g), good conductivity, stability, ease of fabrication, and low cost.
2. The CATHODE or positive electrode (oxidizing electrode) which accepts electrons from the
external circuit and is reduced during the electrochemical reaction. It must be an efficient oxidizing
agent, stable when in contact with the electrolyte, and have a useful working voltage.
3. The ELECTROLYTE (ionic conductor) which provides the medium for transfer of charge,
as ions, inside the cell between the anode and the cathode. The electrolyte is typically a liquid,
such as water or other solvents with dissolved salts, acids or alkalis to impart ionic conductivity.
Some batteries use solid electrolytes, which are ionic conductors at the operating temperature of
the cell. The electrolyte must have good ionic conductivity but not be electronically conductive, as
this would cause internal short-circuiting. Other important characteristics are non-reactivity with the
electrode materials, little change in properties with change in temperature, safety in handling, and
low cost.
Physically the anode and the cathode are electronically insulated in a cell to prevent internal short-
circuiting, but are surrounded by the electrolyte. In practical cell designs a separator material is
used to separate the anode and the cathode electrodes mechanically. The separator, however, is
permeable to the electrolyte in order to maintain the desired ionic conductivity. Electrically
conducting grid structures or materials may also be added to the electrodes to reduce internal
resistance6.
4
Figure 2:Scheme of the fundamental part of a cell.
The main parameters which describe the electrochemical features of a battery are:
CAPACITY (Q) is the charge stored in a battery. Normally expressed in Coulomb (C) or
Ampere hour (Ah). It is calculated as:
𝐐 = 𝐈 ∙ 𝐭 = 𝐱 ∙ 𝐧 ∙ 𝐅
Where I is the current, t is the time, x is the moles number, n is the number of electrons
involved in reaction and F is the Faraday constant (96494 C mol-1
). Generally, capacity is
normalized to the electrode weight or volume.
ENERGY (E) is calculated as :
𝐄 = 𝐐 ∙ 𝐕
Where Q is the capacity and V is the voltage of the cell. Normally expressed in joule (J) or
Watt hour (Wh). Also energy is normally referred to the weight, as specific energy (Wh kg-
1), or to the volume, as energy density (Wh l
-1).
POWER (P) is calculated as:
𝐏 = 𝐈 ∙ 𝐕 =𝐐 ∙ 𝐕
𝐭=
𝐄
𝐭
Where I is the current, V is the voltage, Q the charge and E the energy. Normally
expressed in Watt (W); anagously to the energy, it can be expressed as specific power (W
kg-1
) or power density (W l-1
).
5
1.2 Batteries typologies
Batteries are divided into three general classes: primary batteries that are discharged once and
discared; secondary batteries, rechargeable batteries that can be discharged and then restored to
their original condition by reversing the current flow through the cell; and specialty batteries that
are designed to fulfil a specific purpose7.
1.2.1 Primary Batteries
These batteries are not capable of being easily or effectively recharged electrically and, hence, are
discharged once and discarded. Generally primary batteries have a higher capacity and initial
voltage than secondary batteries, a sloping discharge curve and high energy density according to
the ratio weight/volume.
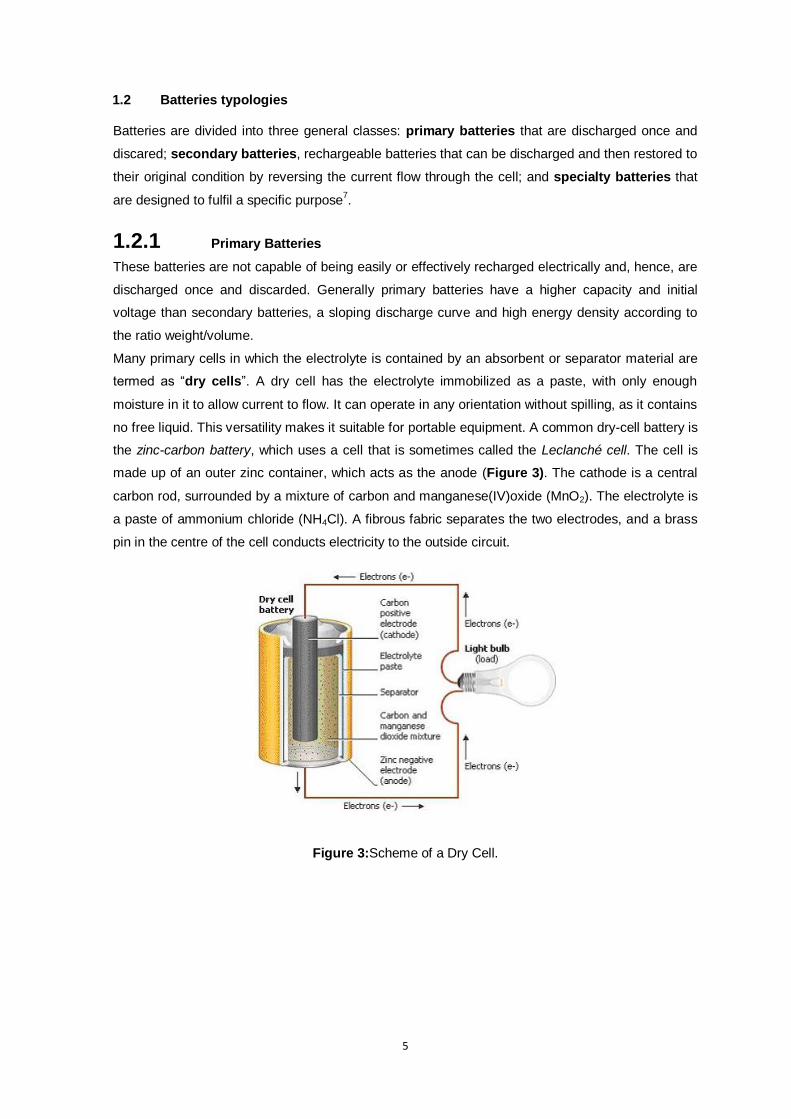
Many primary cells in which the electrolyte is contained by an absorbent or separator material are
termed as “dry cells”. A dry cell has the electrolyte immobilized as a paste, with only enough
moisture in it to allow current to flow. It can operate in any orientation without spilling, as it contains
no free liquid. This versatility makes it suitable for portable equipment. A common dry-cell battery is
the zinc-carbon battery, which uses a cell that is sometimes called the Leclanché cell. The cell is
made up of an outer zinc container, which acts as the anode (Figure 3). The cathode is a central
carbon rod, surrounded by a mixture of carbon and manganese(IV)oxide (MnO2). The electrolyte is
a paste of ammonium chloride (NH4Cl). A fibrous fabric separates the two electrodes, and a brass
pin in the centre of the cell conducts electricity to the outside circuit.
Figure 3:Scheme of a Dry Cell.

6
Chemical reactions occur in every part of the battery to allow for energy storage; the reactions can
be described using balanced chemical equations that delineate the electron flow. Another example
of a dry-cell battery is the alkaline battery. They are almost the same as zinc-carbon batteries,
except that the electrolyte used is potassium hydroxide (KOH) rather than ammonium chloride.8
1.2.2 Secondary Batteries
These type of batteries consist of reversible cell reactions that allow them to recharge, or regain
their cell potential, through the work done by passing currents of electricity. As opposed to primary
cells , rechargeable batteries can charge and discharge numerous times. Secondary batteries are
storage devices for electric energy and are known also as “storage batteries” or “accumulators”.
Different secondary batteries provide various functions. For long-term use , long storage time when
not in use, remote activation, and use under harsh weather conditions are just a few obstacles of
creating such secondary cells. Unfortunately, there are no batteries that are capable of
encompassing all functions mentioned above. Therefore, the user must decide which application is
the most important for a specific task in order to determine the most compatible version of
rechargeable batteries. The application of secondary batteries fall into two main categories9:
Applications in which the secondary battery is used as an energy-storage device,
generally being electrically connected to and charged by a prime energy source
and delivering its energy to the load on demand. Examples are automotive and
aircraft systems, uninterruptible power supply (UPS) and hybrid electric vehicles.
Application in which the secondary battery is used or discharged essentially as
a primary battery, but recharged after use rather than being discared. Secondary
are used in this manner as, for example, in portable consumer electronics, power
tools, electric vehicles, etc., for cost savings (as they can be recharged rather than
replaced), and in applications requiring power drains beyond the capability of
primary batteries.
The most common secondary batteries are:
Lead-Acid Batteries that are one of the most common secondary batteries, used primarily for
storing large cell potential. These are commonly found in automobile engines. Its advantages
include low cost, high voltage and large storage of cell potential; and disadvantages include heavy
mass, incompetence under low-temperatures, and inability to maintain its potential for long periods
of time through disuse. The reactions of a lead-acid battery are shown below:
Reduction: PbO2(s) + 3H+(aq) + HSO4
-(aq) + 2e
- → PbSO4(s) + 2H2O(l)
Oxidation: Pb(s) + HSO4-(aq) → PbSO4(s) + H+(aq) + 2e
-
_________________________________________________________________
Overall: PbO2(s) + Pb(s) + 2H+(aq) + 2HSO4
-(aq) → 2PbSO4(s) + 2H2O (l)
7
Discharging occurs when the engine is started and where the cell potential equals 2.02 V. Charging
occurs when the car is in motion and where the electrode potential equals -2.02 V, a non-
spontaneous reaction which requires an external electrical source. The reverse reaction takes
place during charging.
The nickel-cadmium Battery (NiCd) is another common secondary battery that is suited for low-
temperature conditions with a long shelf life. However, the nickel-cadmium batteries are more
expensive and their capacity in terms of watt-hours per kilogram is less than that of the nickel-zinc
rechargeable batteries.
Reduction: NiO2(s)+H2O(l)+2e−→Ni(OH)2(s)+OH
−(l)
Oxidation: Cd(s)+2OH−(aq)→Cd(OH)2(s)+2e
−
_________________________________________________________________
Overall: Cd(s)+NiO2(s)+2H2O(l)→Ni(OH)2(s)+Cd(OH)2(s)
Advantages of the nickel-zinc battery are its long life span, high voltage, and the sufficient energy
to mass to volume ratio. These characteristics make the nickel-zinc battery more attractive than
some. However, it is not yet made in sealed form.
Silver-zinc batteries, a less commonly used rechargeable battery, is capable of providing high
currents, high voltage, and is equivalent in watt-hour capacity to six lead-acid batteries. These are
commonly seen as the little silver buttons in hearing aids, tiny flash lights and so on. Because of its
high energy density, silver-zinc batteries are used in missiles and torpedoes, electronics, satellites,
and compact portable devices. Although it can provide high energy with a rather small mass, can
be used in a low-temperature condition, and encompasses a sufficient shelf life, it is expensive and
has a shorter use time compared to other secondary batteries. In most cases, the silver-zinc
battery is used when space and weight are the most important. Overall, the silver-cadmium battery
is high energy, smaller in size and weight, and resistance to overcharge. But its big disadvantage is
its high cost. Silver-cadmium batteries are often found in satellites where space and weight are
important factors10
.
8
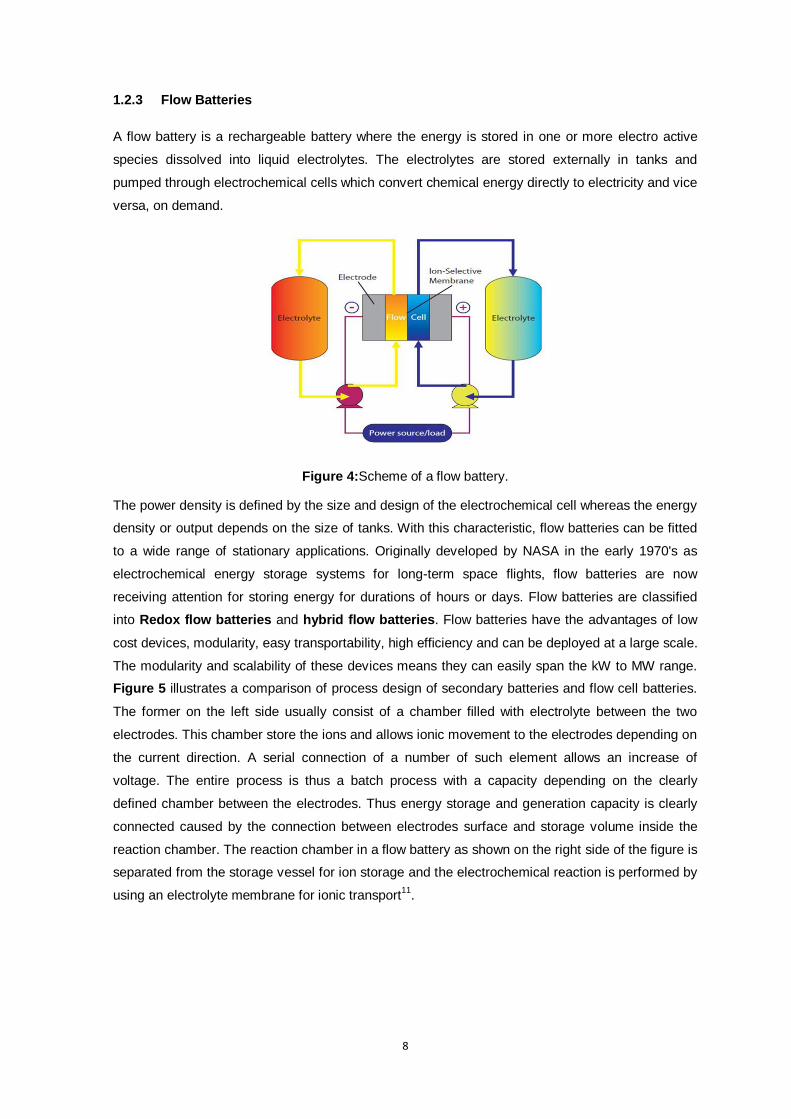
1.2.3 Flow Batteries
A flow battery is a rechargeable battery where the energy is stored in one or more electro active
species dissolved into liquid electrolytes. The electrolytes are stored externally in tanks and
pumped through electrochemical cells which convert chemical energy directly to electricity and vice
versa, on demand.
Figure 4:Scheme of a flow battery.
The power density is defined by the size and design of the electrochemical cell whereas the energy
density or output depends on the size of tanks. With this characteristic, flow batteries can be fitted
to a wide range of stationary applications. Originally developed by NASA in the early 1970's as
electrochemical energy storage systems for long-term space flights, flow batteries are now
receiving attention for storing energy for durations of hours or days. Flow batteries are classified
into Redox flow batteries and hybrid flow batteries. Flow batteries have the advantages of low
cost devices, modularity, easy transportability, high efficiency and can be deployed at a large scale.
The modularity and scalability of these devices means they can easily span the kW to MW range.
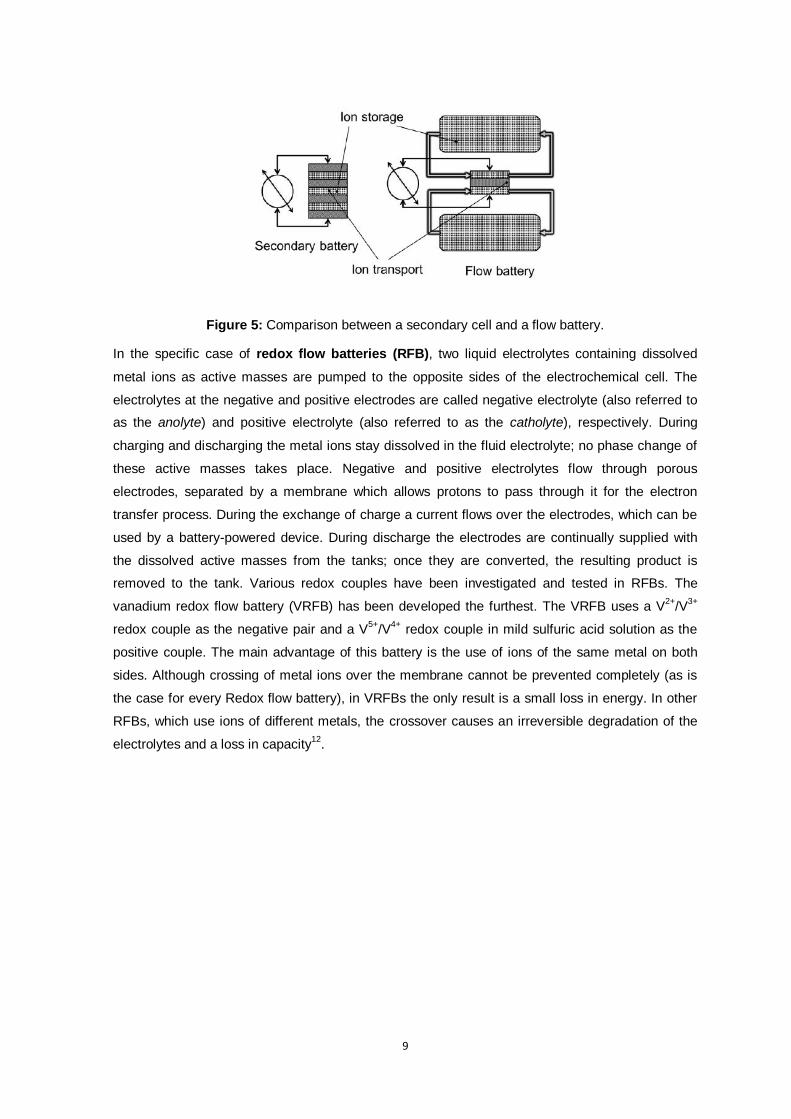
Figure 5 illustrates a comparison of process design of secondary batteries and flow cell batteries.
The former on the left side usually consist of a chamber filled with electrolyte between the two
electrodes. This chamber store the ions and allows ionic movement to the electrodes depending on
the current direction. A serial connection of a number of such element allows an increase of
voltage. The entire process is thus a batch process with a capacity depending on the clearly
defined chamber between the electrodes. Thus energy storage and generation capacity is clearly
connected caused by the connection between electrodes surface and storage volume inside the
reaction chamber. The reaction chamber in a flow battery as shown on the right side of the figure is
separated from the storage vessel for ion storage and the electrochemical reaction is performed by
using an electrolyte membrane for ionic transport11
.
9
Figure 5: Comparison between a secondary cell and a flow battery.
In the specific case of redox flow batteries (RFB), two liquid electrolytes containing dissolved
metal ions as active masses are pumped to the opposite sides of the electrochemical cell. The
electrolytes at the negative and positive electrodes are called negative electrolyte (also referred to
as the anolyte) and positive electrolyte (also referred to as the catholyte), respectively. During
charging and discharging the metal ions stay dissolved in the fluid electrolyte; no phase change of
these active masses takes place. Negative and positive electrolytes flow through porous
electrodes, separated by a membrane which allows protons to pass through it for the electron
transfer process. During the exchange of charge a current flows over the electrodes, which can be
used by a battery-powered device. During discharge the electrodes are continually supplied with
the dissolved active masses from the tanks; once they are converted, the resulting product is
removed to the tank. Various redox couples have been investigated and tested in RFBs. The
vanadium redox flow battery (VRFB) has been developed the furthest. The VRFB uses a V2+
/V3+
redox couple as the negative pair and a V5+
/V4+
redox couple in mild sulfuric acid solution as the
positive couple. The main advantage of this battery is the use of ions of the same metal on both
sides. Although crossing of metal ions over the membrane cannot be prevented completely (as is
the case for every Redox flow battery), in VRFBs the only result is a small loss in energy. In other
RFBs, which use ions of different metals, the crossover causes an irreversible degradation of the
electrolytes and a loss in capacity12
.
10
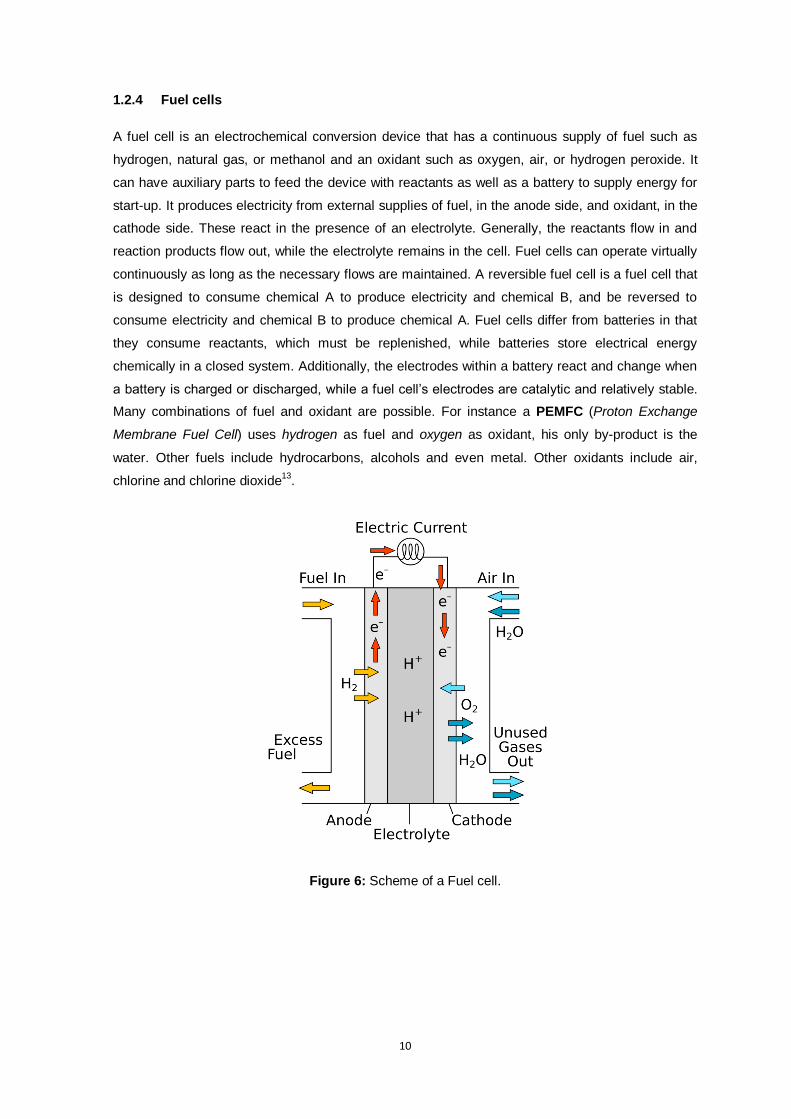
1.2.4 Fuel cells
A fuel cell is an electrochemical conversion device that has a continuous supply of fuel such as
hydrogen, natural gas, or methanol and an oxidant such as oxygen, air, or hydrogen peroxide. It
can have auxiliary parts to feed the device with reactants as well as a battery to supply energy for
start-up. It produces electricity from external supplies of fuel, in the anode side, and oxidant, in the
cathode side. These react in the presence of an electrolyte. Generally, the reactants flow in and
reaction products flow out, while the electrolyte remains in the cell. Fuel cells can operate virtually
continuously as long as the necessary flows are maintained. A reversible fuel cell is a fuel cell that
is designed to consume chemical A to produce electricity and chemical B, and be reversed to
consume electricity and chemical B to produce chemical A. Fuel cells differ from batteries in that
they consume reactants, which must be replenished, while batteries store electrical energy
chemically in a closed system. Additionally, the electrodes within a battery react and change when
a battery is charged or discharged, while a fuel cell’s electrodes are catalytic and relatively stable.
Many combinations of fuel and oxidant are possible. For instance a PEMFC (Proton Exchange
Membrane Fuel Cell) uses hydrogen as fuel and oxygen as oxidant, his only by-product is the
water. Other fuels include hydrocarbons, alcohols and even metal. Other oxidants include air,
chlorine and chlorine dioxide13
.
Figure 6: Scheme of a Fuel cell.
11
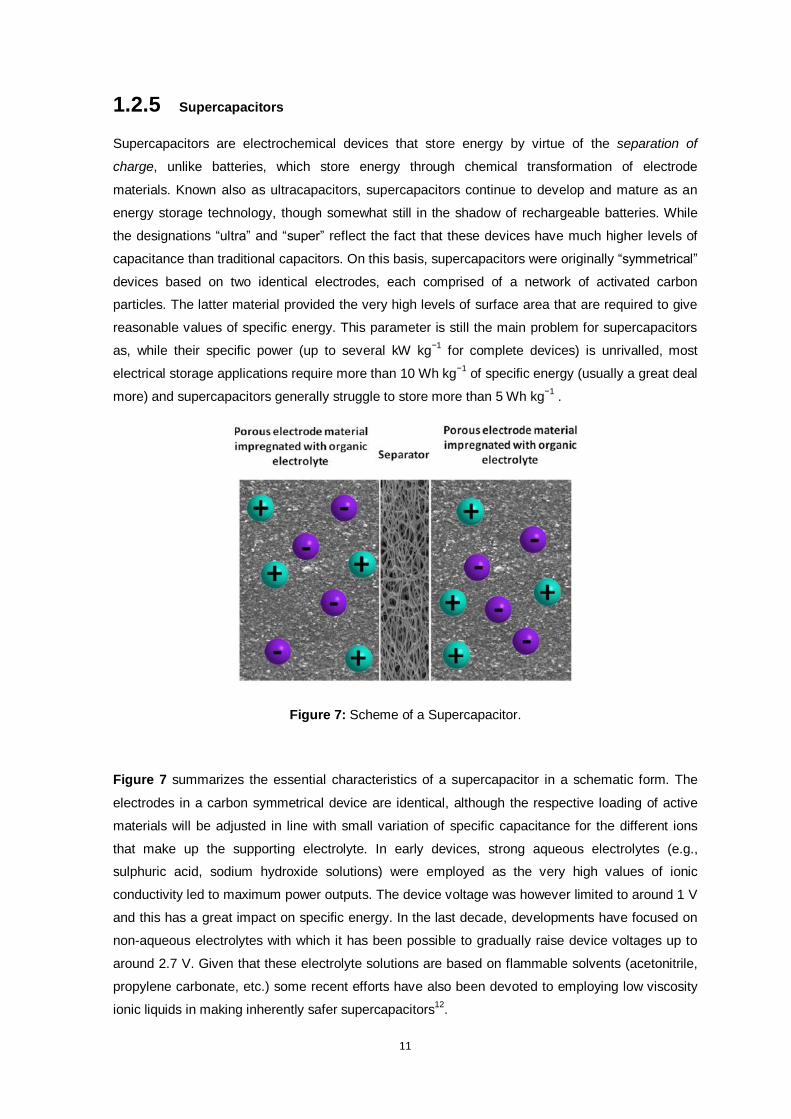
1.2.5 Supercapacitors
Supercapacitors are electrochemical devices that store energy by virtue of the separation of
charge, unlike batteries, which store energy through chemical transformation of electrode
materials. Known also as ultracapacitors, supercapacitors continue to develop and mature as an
energy storage technology, though somewhat still in the shadow of rechargeable batteries. While
the designations “ultra” and “super” reflect the fact that these devices have much higher levels of
capacitance than traditional capacitors. On this basis, supercapacitors were originally “symmetrical”
devices based on two identical electrodes, each comprised of a network of activated carbon
particles. The latter material provided the very high levels of surface area that are required to give
reasonable values of specific energy. This parameter is still the main problem for supercapacitors
as, while their specific power (up to several kW kg−1
for complete devices) is unrivalled, most
electrical storage applications require more than 10 Wh kg−1
of specific energy (usually a great deal
more) and supercapacitors generally struggle to store more than 5 Wh kg−1
.
Figure 7: Scheme of a Supercapacitor.
Figure 7 summarizes the essential characteristics of a supercapacitor in a schematic form. The
electrodes in a carbon symmetrical device are identical, although the respective loading of active
materials will be adjusted in line with small variation of specific capacitance for the different ions
that make up the supporting electrolyte. In early devices, strong aqueous electrolytes (e.g.,
sulphuric acid, sodium hydroxide solutions) were employed as the very high values of ionic
conductivity led to maximum power outputs. The device voltage was however limited to around 1 V
and this has a great impact on specific energy. In the last decade, developments have focused on
non-aqueous electrolytes with which it has been possible to gradually raise device voltages up to
around 2.7 V. Given that these electrolyte solutions are based on flammable solvents (acetonitrile,
propylene carbonate, etc.) some recent efforts have also been devoted to employing low viscosity
ionic liquids in making inherently safer supercapacitors12
.

12
13
2. Sodium energy storage batteries
Na-based batteries are not new. From the 1970s to the 1980s, Na-ion and Li-ion batteries were
investigated in parallel. The investigation of Na-ion batteries was significantly decreased after the
success of the commercial application of Li-ion batteries in the 1990s. Moreover, Na–S battery has
already been commercially demonstrated. Nevertheless, the safety issue of molten Na and sulphur
at 300–350 °C in Na–S batteries is still a tough problem for large-scale applications. Recently,
research interest in Na-ion batteries operated at room-temperature is renewed because of the
abundance and low cost of Na. However, searching for new electrode materials (cathode and
anode) and new stable electrolytes (liquid and solid) for Na-ion battery system is necessary14
. In
this chapter all type of sodium batteries and material are summarized.
2.1 Molten sodium cells
Molten salt batteries are a class of battery that uses molten salts as an electrolyte and offers both a
high energy density and a high power density. These include: molten sodium cells, sodium sulphur
batteries, sodium-air cells and ZEBRA cells.
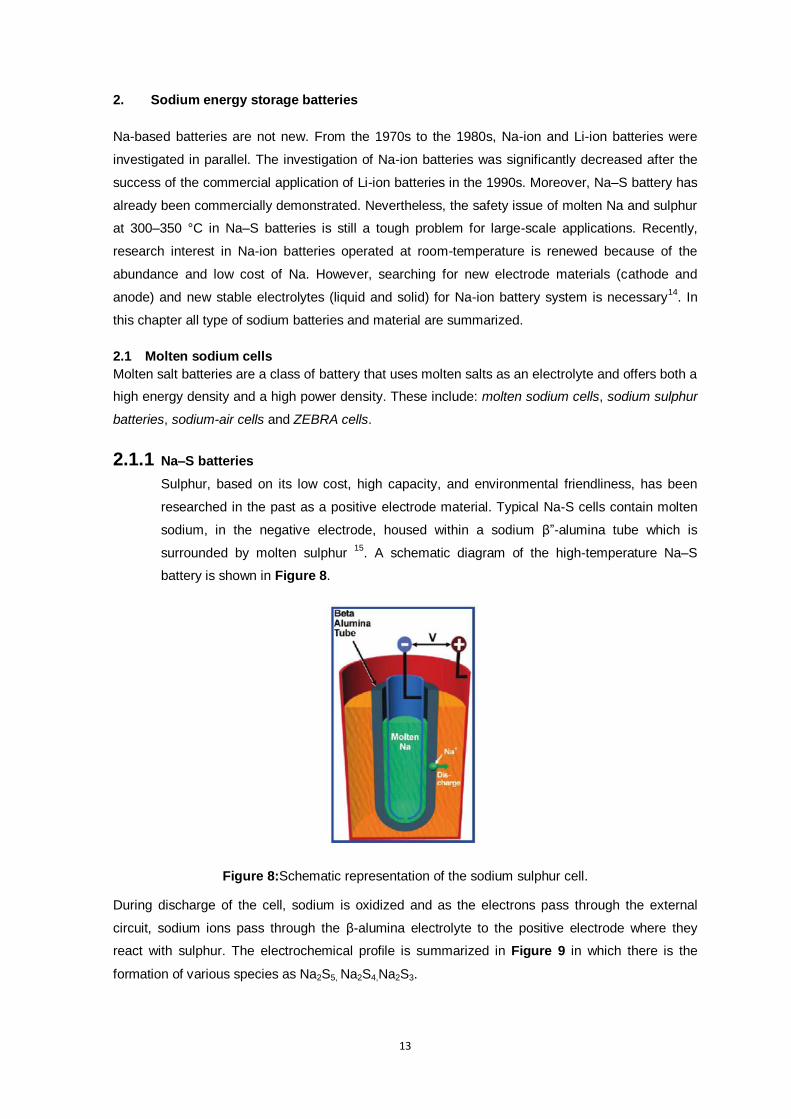
2.1.1 Na–S batteries
Sulphur, based on its low cost, high capacity, and environmental friendliness, has been
researched in the past as a positive electrode material. Typical Na-S cells contain molten
sodium, in the negative electrode, housed within a sodium β”-alumina tube which is
surrounded by molten sulphur 15
. A schematic diagram of the high-temperature Na–S
battery is shown in Figure 8.
Figure 8:Schematic representation of the sodium sulphur cell.
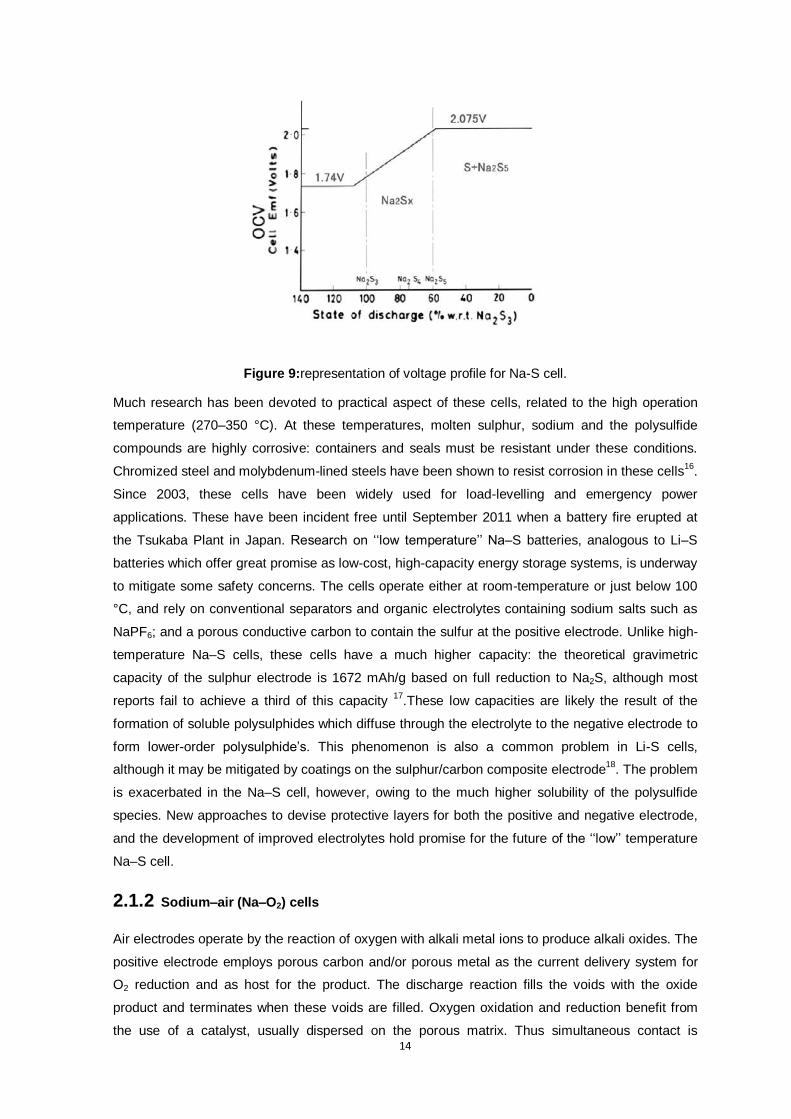
During discharge of the cell, sodium is oxidized and as the electrons pass through the external
circuit, sodium ions pass through the β-alumina electrolyte to the positive electrode where they
react with sulphur. The electrochemical profile is summarized in Figure 9 in which there is the
formation of various species as Na2S5, Na2S4,Na2S3.
14
Figure 9:representation of voltage profile for Na-S cell.
Much research has been devoted to practical aspect of these cells, related to the high operation
temperature (270–350 °C). At these temperatures, molten sulphur, sodium and the polysulfide
compounds are highly corrosive: containers and seals must be resistant under these conditions.
Chromized steel and molybdenum-lined steels have been shown to resist corrosion in these cells16
.
Since 2003, these cells have been widely used for load-levelling and emergency power
applications. These have been incident free until September 2011 when a battery fire erupted at
the Tsukaba Plant in Japan. Research on ‘‘low temperature’’ Na–S batteries, analogous to Li–S
batteries which offer great promise as low-cost, high-capacity energy storage systems, is underway
to mitigate some safety concerns. The cells operate either at room-temperature or just below 100
°C, and rely on conventional separators and organic electrolytes containing sodium salts such as
NaPF6; and a porous conductive carbon to contain the sulfur at the positive electrode. Unlike high-
temperature Na–S cells, these cells have a much higher capacity: the theoretical gravimetric
capacity of the sulphur electrode is 1672 mAh/g based on full reduction to Na2S, although most
reports fail to achieve a third of this capacity 17
.These low capacities are likely the result of the
formation of soluble polysulphides which diffuse through the electrolyte to the negative electrode to
form lower-order polysulphide’s. This phenomenon is also a common problem in Li-S cells,
although it may be mitigated by coatings on the sulphur/carbon composite electrode18
. The problem
is exacerbated in the Na–S cell, however, owing to the much higher solubility of the polysulfide
species. New approaches to devise protective layers for both the positive and negative electrode,
and the development of improved electrolytes hold promise for the future of the ‘‘low’’ temperature
Na–S cell.
2.1.2 Sodium–air (Na–O2) cells
Air electrodes operate by the reaction of oxygen with alkali metal ions to produce alkali oxides. The
positive electrode employs porous carbon and/or porous metal as the current delivery system for
O2 reduction and as host for the product. The discharge reaction fills the voids with the oxide
product and terminates when these voids are filled. Oxygen oxidation and reduction benefit from
the use of a catalyst, usually dispersed on the porous matrix. Thus simultaneous contact is
15
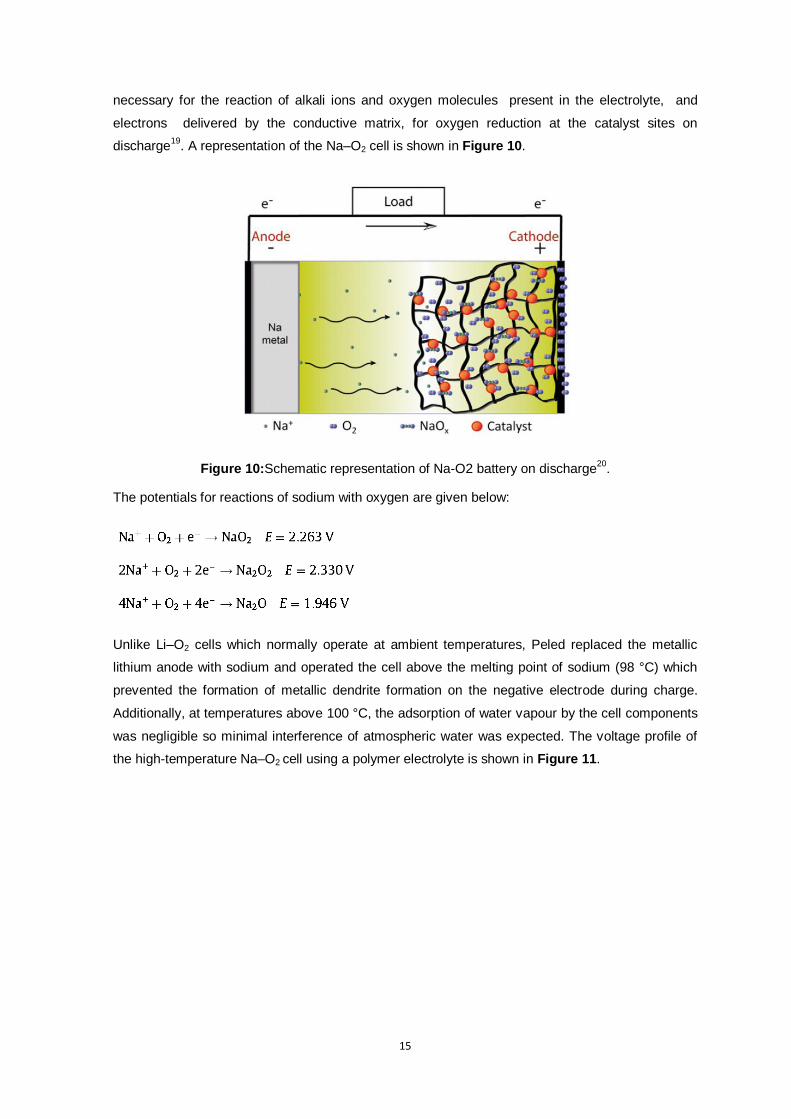
necessary for the reaction of alkali ions and oxygen molecules present in the electrolyte, and
electrons delivered by the conductive matrix, for oxygen reduction at the catalyst sites on
discharge19
. A representation of the Na–O2 cell is shown in Figure 10.
Figure 10:Schematic representation of Na-O2 battery on discharge20
.
The potentials for reactions of sodium with oxygen are given below:
Unlike Li–O2 cells which normally operate at ambient temperatures, Peled replaced the metallic
lithium anode with sodium and operated the cell above the melting point of sodium (98 °C) which
prevented the formation of metallic dendrite formation on the negative electrode during charge.
Additionally, at temperatures above 100 °C, the adsorption of water vapour by the cell components
was negligible so minimal interference of atmospheric water was expected. The voltage profile of
the high-temperature Na–O2 cell using a polymer electrolyte is shown in Figure 11.
16
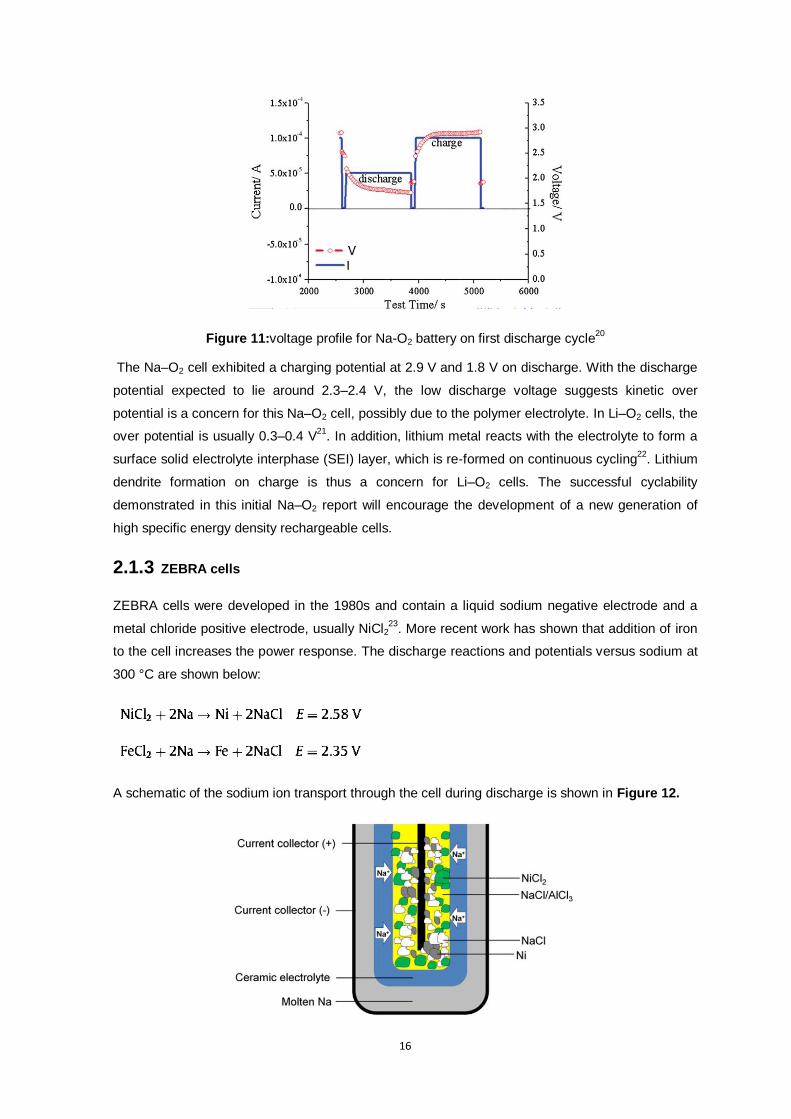
Figure 11:voltage profile for Na-O2 battery on first discharge cycle20
The Na–O2 cell exhibited a charging potential at 2.9 V and 1.8 V on discharge. With the discharge
potential expected to lie around 2.3–2.4 V, the low discharge voltage suggests kinetic over
potential is a concern for this Na–O2 cell, possibly due to the polymer electrolyte. In Li–O2 cells, the
over potential is usually 0.3–0.4 V21
. In addition, lithium metal reacts with the electrolyte to form a
surface solid electrolyte interphase (SEI) layer, which is re-formed on continuous cycling22
. Lithium
dendrite formation on charge is thus a concern for Li–O2 cells. The successful cyclability
demonstrated in this initial Na–O2 report will encourage the development of a new generation of
high specific energy density rechargeable cells.
2.1.3 ZEBRA cells
ZEBRA cells were developed in the 1980s and contain a liquid sodium negative electrode and a
metal chloride positive electrode, usually NiCl223
. More recent work has shown that addition of iron
to the cell increases the power response. The discharge reactions and potentials versus sodium at
300 °C are shown below:
A schematic of the sodium ion transport through the cell during discharge is shown in Figure 12.
17
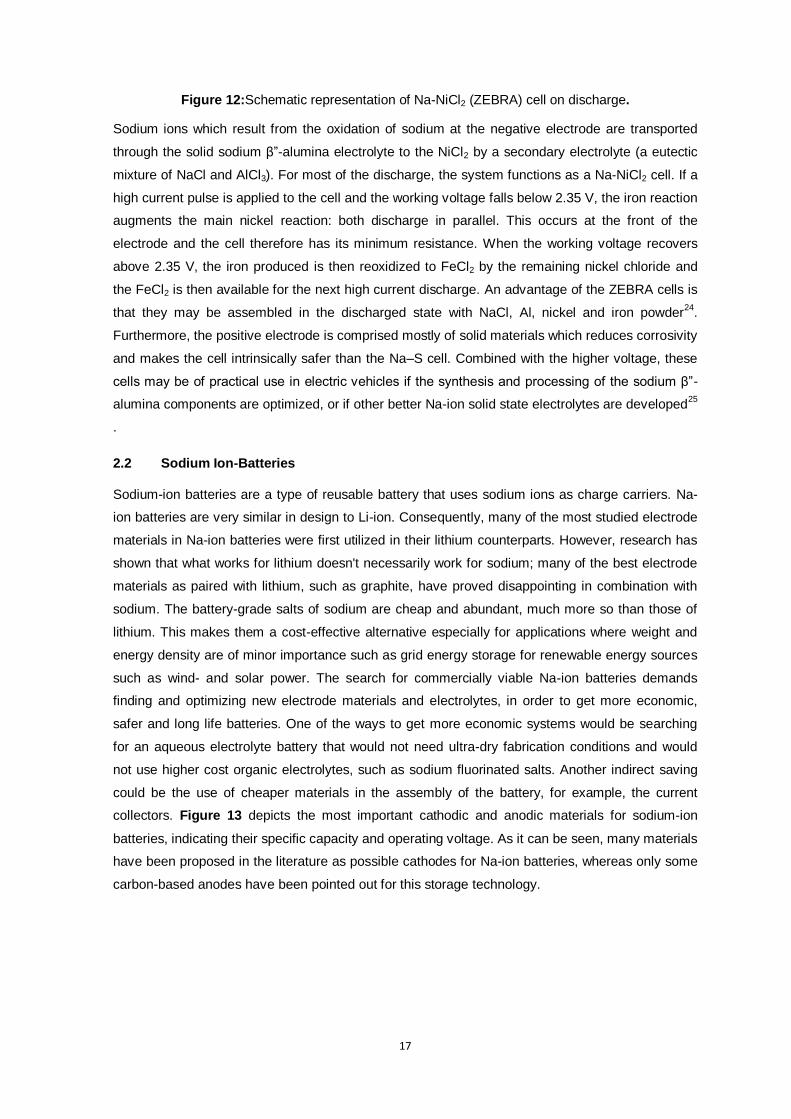
Figure 12:Schematic representation of Na-NiCl2 (ZEBRA) cell on discharge.
Sodium ions which result from the oxidation of sodium at the negative electrode are transported
through the solid sodium β”-alumina electrolyte to the NiCl2 by a secondary electrolyte (a eutectic
mixture of NaCl and AlCl3). For most of the discharge, the system functions as a Na-NiCl2 cell. If a
high current pulse is applied to the cell and the working voltage falls below 2.35 V, the iron reaction
augments the main nickel reaction: both discharge in parallel. This occurs at the front of the
electrode and the cell therefore has its minimum resistance. When the working voltage recovers
above 2.35 V, the iron produced is then reoxidized to FeCl2 by the remaining nickel chloride and
the FeCl2 is then available for the next high current discharge. An advantage of the ZEBRA cells is
that they may be assembled in the discharged state with NaCl, Al, nickel and iron powder24
.
Furthermore, the positive electrode is comprised mostly of solid materials which reduces corrosivity
and makes the cell intrinsically safer than the Na–S cell. Combined with the higher voltage, these
cells may be of practical use in electric vehicles if the synthesis and processing of the sodium β”-
alumina components are optimized, or if other better Na-ion solid state electrolytes are developed25
.
2.2 Sodium Ion-Batteries
Sodium-ion batteries are a type of reusable battery that uses sodium ions as charge carriers. Na-
ion batteries are very similar in design to Li-ion. Consequently, many of the most studied electrode
materials in Na-ion batteries were first utilized in their lithium counterparts. However, research has
shown that what works for lithium doesn't necessarily work for sodium; many of the best electrode
materials as paired with lithium, such as graphite, have proved disappointing in combination with
sodium. The battery-grade salts of sodium are cheap and abundant, much more so than those of
lithium. This makes them a cost-effective alternative especially for applications where weight and
energy density are of minor importance such as grid energy storage for renewable energy sources
such as wind- and solar power. The search for commercially viable Na-ion batteries demands
finding and optimizing new electrode materials and electrolytes, in order to get more economic,
safer and long life batteries. One of the ways to get more economic systems would be searching
for an aqueous electrolyte battery that would not need ultra-dry fabrication conditions and would
not use higher cost organic electrolytes, such as sodium fluorinated salts. Another indirect saving
could be the use of cheaper materials in the assembly of the battery, for example, the current
collectors. Figure 13 depicts the most important cathodic and anodic materials for sodium-ion
batteries, indicating their specific capacity and operating voltage. As it can be seen, many materials
have been proposed in the literature as possible cathodes for Na-ion batteries, whereas only some
carbon-based anodes have been pointed out for this storage technology.
18
Figure 13:Most important cathode and anode materials studied for their application in sodium ion batteries.
This disparity can be observed in the different lengths of the cathode and anode sections of this
work. This chapter gathers the most representative materials that have been tested in Na-ion cells,
or that could be good candidates to be used in Na-ion technology4.
In this type of battery (Figure 14), the operating principle is that ions are shuttled between the
battery’s positive and negative electrodes during charging and discharging, with an electrolyte
serving as the medium for ion transport.
Figure 14: Operating principle of Na-ion Batteries.
2.2.1 Na-ion aqueous batteries
The most promising approach to reduce costs in Na-based systems is the use of a Na-ion
electrode in an aqueous electrolyte. Aqueous electrolytes have much higher ionic mobility than
19
organic solvents, are cheaper, the devices are simpler to manufacture and can be produced with
thicker electrodes. Although the lower potential range of water puts a limit upon the possible cell
voltage, the potential advantages in terms of cost are extremely appealing. In addition, these
systems would be safer than the current organic solvent based batteries. The electrochemical
behaviour of a Na insertion electrode material in an aqueous electrolyte has been reported for very
few materials. One of the first reports tested the electrochemical insertion/de-insertion of Na into
Na0.44MnO2 in aqueous media when studying this material for its sensing properties26
. They
observed three different phenomena between -0.05 and 0.85 V vs. SCE (standard calomel
electrode) linked to phase transitions between structurally close phases, and were able to cycle this
material between 0.25 <x< 0.44. Wessells et al. have proposed copper and nickel
hexacyanoferrates (KCuFe(CN)6 and KNiFe(CN)6) as positive electrode materials for K+ and Na
+
aqueous batteries27
. These materials are Prussian Blue analogues and crystallize in an open
framework of general formula AxPR(CN)6 (0 < x < 2) in which P+m
and R+n
coordinate to the
nitrogen and carbon ends of the CN-group respectively, while A atoms can be intercalated in the
interstitial sites that result from the large cages (see Figure 15).
Figure 15:Prussian Blue crystal structure.
These materials have a theoretical specific capacity of about 60 mA h g-1
(although it might vary
due to variations in zeolitic water content). KNiFe(CN)6 was found to react with sodium at 0.59 V
vs. SHE (standard hydrogen electrode) while KCuFe(CN)6 reacts at 0.77 V, in addition to a second
process that is observed near 1.0 V. Negative electrode materials are less explored although
promising results have been obtained using NaTi2(PO4)3. This material operates within the stability
window of the electrolyte (approximately 0.5 V before H2 evolution in NaOH 4 M) and, similar to the
results obtained in organic electrolyte, is able to deliver around 120 mA h g -1 28
. The cells can be
cycled between 0.5 and 1.4 V at very high rates (over 100 C) and exhibit excellent cyclability when
cycled at high rates, although capacity fades when cycled below 1 C.
2.2.2 Na-ion non-aqueous batteries.
2.2.2.1 Anodic materials
20
The negative electrode of a sodium-ion battery intercalates sodium-ions during charge and
deintercalates Na+ ions during discharge. There are three basic requirements for anode materials:
The potential of sodium insertion and extraction in the anode versus sodium must be as
low as possible;
The amount of sodium which can be accommodated by the anode material should be as
high as possible to achieve a high specific capacity;
The anode host endure repeated sodium insertion and extraction without any structural
damage to obtain long cycle life.
The search for appropriate anodes for Na-ion batteries is complex, and, although a great variety of
phases that can potentially be used as positive electrodes have been identified, very few materials
have been reported to be useful as negative electrodes5. Graphite, which is the most commonly
used anode material in Li-ion batteries, has a moderate Li storage capacity (350 mA h g-1
) at
approximately 0.1 V vs. Li+/Li. Recent studies indicate that Na cannot be inserted into the graphite
layer. This phenomenon might be related to thermodynamic issues29
. To date, very few anode
materials have been reported as viable. The use of metallic sodium is not advisable because of
dendrite formation, as for metallic lithium. Thus, identifying an anode with a proper Na storage
voltage, large reversible capacity and high structural stability is urgently needed for the
development of Na-ion batteries.
Among anode materials studied we can find several type of compound. The family of carbon
based material includes Hard Carbons, Carbon based hollow nanospheres and N-doped
carbonaceous materials. Titanates have potentials for sodium insertion larger than those of
carbon, which makes them promising candidates for anodes in sodium-ion batteries. Titanium
phosphates use the NASICON structure based on Ti(III)/Ti(II) redox pairs. Carboxylates as
benzene carboxylates scaffolds chemically modified, are one of the most reliable routes to tune the
redox potential for sodium insertion. Other anode material that we can find among studied system
are: Na alloy of Group IV and V elements as Na15Sn5, binary compounds reacting through
conversion reactions as thin films of Fe2O3-NiO solid solution and amorphous phosphorous5.
2.2.2.2 Cathodic materials
Cathode electrode materials have been the object of comprehensive studies, as they play an
important role in the operation of Na-ion batteries because the affect the energy capacity, voltage,
cycle life, safety. They offer sources of Na+ for the Na-ion “shuttle” between the cathode and
anode. Good cathode materials must meet the following requirements:
Stable structure for repeated Na-ion intercalation/de-intercalation;
High potential relative to Na/Na+ reference electrode:
High capacity to contain Na+;
High electronic conductivity;
High sodium chemical diffusion coefficient;
Low cost, safety.
21
A great range of compounds are being studied as possible cathodic materials for Na-ion batteries,
from oxides to phosphates. Each family of compounds presents its own advantages and
disadvantages for their real application in energy storage systems. The following sections explain
the main features of each one.
Among them we can find layered transition metal oxides that have a structure built by sheets of
edge-shared MO6 octahedra and alkali ions are located between MO6 sheets. Describing the
stacking arrangements of alkali ions between layers, we can recognize different types of structures.
In general the notation O or P represents octahedral or trigonal prismatic coordination environment
of alkali ions and the number 3 or 2 describes the number of transition metal layers in repeated
stacking unit. O’3 and P’2 represent the monoclinic distortion of O3 and P2 phase packing. As we
can see in the Figure 16, in the P2-structure, there are two different sites for Na ions: one occupies
the 2d site sharing two faces with the MO6 octahedra.
Figure 16: Stacking types of (a) O3 and (b) P2 phases in AxMO2+y.
Among this type of oxides we can find NaCoO2, NaFeO2, NaMnO2, NaCrO2 and NaNiO2.
The P2 phase seems to deliver a higher capacity and better cycle life in Na-ion batteries. This case
may be attributed to the structural difference between O3 and P2 phases. The Na ion occupies a
larger trigonal prismatic site in P2 phase than the octahedral site in O3 phase, thus Na ion
transport in P2 phase could be faster than that in O3 phase. In addition, the phase transition from
P2 to other phases is more difficult because of involving a rotation of MO6 octahedra and the
breaking of M–O bonds. P2 phase is expected to exhibit better cyclic performance owing to the
lack of significant structural change.
Another type of cathode material for sodium ion batteries is characterized by Tunnel-type oxides
like orthorhombic Na0.44MnO2 and NaxFexTi2-xO4.
Also Phosphates have attracted attention because of their structural, thermal stability and higher
redox potential of transition metals (resulting from the inductive effect of PO43-
polyanion). Among
them appear Olivine NaMPO4 (M=Fe, Mn, etc.), pyrophosphates, NASICON NaxM2(PO4)3,
alluadides and fluorophosphates.
In addition we can mention as good cathode material fluorides (NaMF3), hexacyanoferrates
(prussian blue KfeFe(CN)6) and environmentally-friendly organic compound obtained from natural
biomass with minimum energy consuption14
.
22
Figure 17:The crystalline structure of several available cathode materials for Na-ion batteries. (a) O3-NaMO2, (b) P2-NaxMO2, (c) Na0.44MnO2, (d) olivine NaFePO4, (e) Na2FeP2O7, (f) NASICON-
Na3V2(PO4)3, (g) Na2FePO4F, (h) Na4Fe3(PO4)2P2O7.
2.2.2.2.1 NaxCoO2 cathode material
Layered LiCoO2 is the most successful cathode material with high energy density used in Li-ion
batteries since its commercial application in 1990s by Sony. The Na analogue of this type of battery
exhibits an electrochemical intercalation behaviour similar to LiCoO2 but with more complex phase
transitions during the removal of Na+ ions from alkali ion layers. This behaviour is also common for
other Na compounds which might be due to larger Na+ ions, longer A–O bonds and the ordering
arrangement between Na+ and VNa+ vacancies. In the 1980s, NaCoO2 was an early choice of a Na
transition metal oxide to be tested for its Na intercalation behaviours30
.
As already mentioned, layered Na-metal oxides can form in different crystal structures, each with
different electrochemical behaviour. In base on the conditions under which different layered phases
of NaxCoO2 are synthesized we can find several crystalline structures.
23
Figure 18: Compositions and Structure Types of NaxCoO2 and the Corresponding Solid-State
Synthesis Conditions.
Figure 18 depicts a phase diagram of NaxCoO2 between 450 to 750°C in air and for Na:Co sample
ratios ranging from 0.60 to 1.05. Four single phase domain are defined. In fact transition metal
layered oxides can be classified into two major groups, P2 type and O3 type, according to Delmas’
notation. The O or P designation refers to the local structure around Na+
as either an octahedral or
prismatic oxygen cage, while the numerical designations refer to the repeat period of the transition
metal stacking perpendicular to Na layers. Both structure types have been shown to exhibit good
electrochemical performance in Na-ion batteries.
The earliest NaxCoO2 phase diagram proposed that also four different phases of NaxCoO2 can be
synthesized by classic solid-state reaction, known as α (O3), α′ (O′3 or O1), β (P′3 or P1) and γ
(P2)31
.
Figure 19: The four different phases of NaxCoO2.
The Figure 20 shows the stacking of NaO6 prism and CoO6 octahedra in β and γ NaCoO2. In the
former upper oxygen atoms of the prism are shared with a CoO6 octahedron, but lower oxygen
atoms are shared with three CoO6 octahedra. In the latter there are two kinds of prisms, namely,
Na(1)O6 and Na(2)O6 32
. The Na(1)O6 prism shares two set of three oxygen atoms with one upper
and one lower CoO6 octahedra, respectively. On the other hand, the Na(2)O6 prism shares two
sets of three oxygen atoms with upper and lower three CoO6 octahedra, respectively33
.
24
Figure 20: Stacking of NaO6 prisms and CoO6 octahedra in β and γ NaCoO2.
In the Figure 21 is shown the working principle of this material in lithium-ion battery and a future
sodium-ion battery. The cathode material is composed of layers of cobalt oxide CoO2, with layers
of mobile lithium or sodium in between. During discharging, the ions in the battery move through
the electrolyte from the anode to the cathode while the electrons have to take a detour through
some electronic device where they appear as an electric current34
.
Figure 21:Working principle of a lithium-ion battery and sodium-ion battery (left) and structure of the cathode material (right)
35.
2.2.3 Electrolytes
Electrolytes are essential for the proper functioning of any battery technology and the emerging Na-
ion technology is no exception. Hence, a major focus on battery research is to identify the most
appropriate formulation so as to minimize interface reactions and enhance both cell performances
and safety aspects.
As in any other battery system, a good electrolyte should exhibit:
(i) good ionic conductivity;
(ii) large electrochemical window (i.e., high and low onset potential for electrolyte
decomposition through oxidation and reduction, respectively);
(iii) no reactivity towards the cell components;
25
(iv) large thermal stability window (i.e. melting point and boiling point lower and higher than
the standard temperatures for the cell utilization, respectively).
Finally, it should be intrinsically safe, have as low toxicity as possible and meet cost requirements
for the targeted applications. All these features are intrinsically dependent on the nature of the salt
and the solvent and the possible use of additives. We can find several solvents (Propylene
Carbonate-PC, Ethylene Carbonate-EC, Dimethil Carbonate-DMC, Dimethoxyethane-DME, Diethyl
Carbonate-DEC, Thetrahydrofuran-THF and Triglyme) and solvent mixtures (EC:DMC, EC:DME,
EC:PC and EC:Triglyme) in combination with different Na salts, as NaClO4 and NaPF636
.
Figure 22: Characteristics of a good electrolyte.
In recent times, the use of sodium complexed electrolyte films has been found to exhibit several
advantages over their lithium counterparts. There are few studies based on conductive polymeric
electrolytes that have been completed for Na-ion batteries, in contrast to polymer electrolytes for
Li-ion batteries37
. The research and development on new electrolytes could be the key point for Na-
ion batteries success because they could avoid dendrite formation or interface aging. It is a need to
develop high sodium ion conducting non-aqueous electrolytes suitable for the fabrication of
rechargeable sodium batteries. Sodium salts are often less soluble in organic solvent than the
lithium analogues, which limits the choice of electrolytes. The development of sodium ion
conducting non aqueous polymer electrolytes should be preferred in view of their higher
conductivity values, mechanical and electrochemical properties4.
2.2.4 Binders
Binders in battery anode and cathode composites are electrochemically inactive materials which,
however, can have important influence on the electrode performance. The primary role of binders
is to bind various battery components into a compact composite electrode and prevent its
disintegration during typical charge–discharge cycles. The binding function of binders could be
achieved in two essentially different ways: via direct binding (adsorption) of binder's molecules to
adjacent particles forming the so-called interparticle bridges or via indirect binding, that is,
formation of chemically inert networks into which the particles are then mechanically captured. It
seems that both principles are equally successful in providing electrode cohesiveness; perhaps the
main known difference is that the direct binding principle requires a smaller amount of binder to
achieve the same binding function. The binders also importantly affect the surface properties of
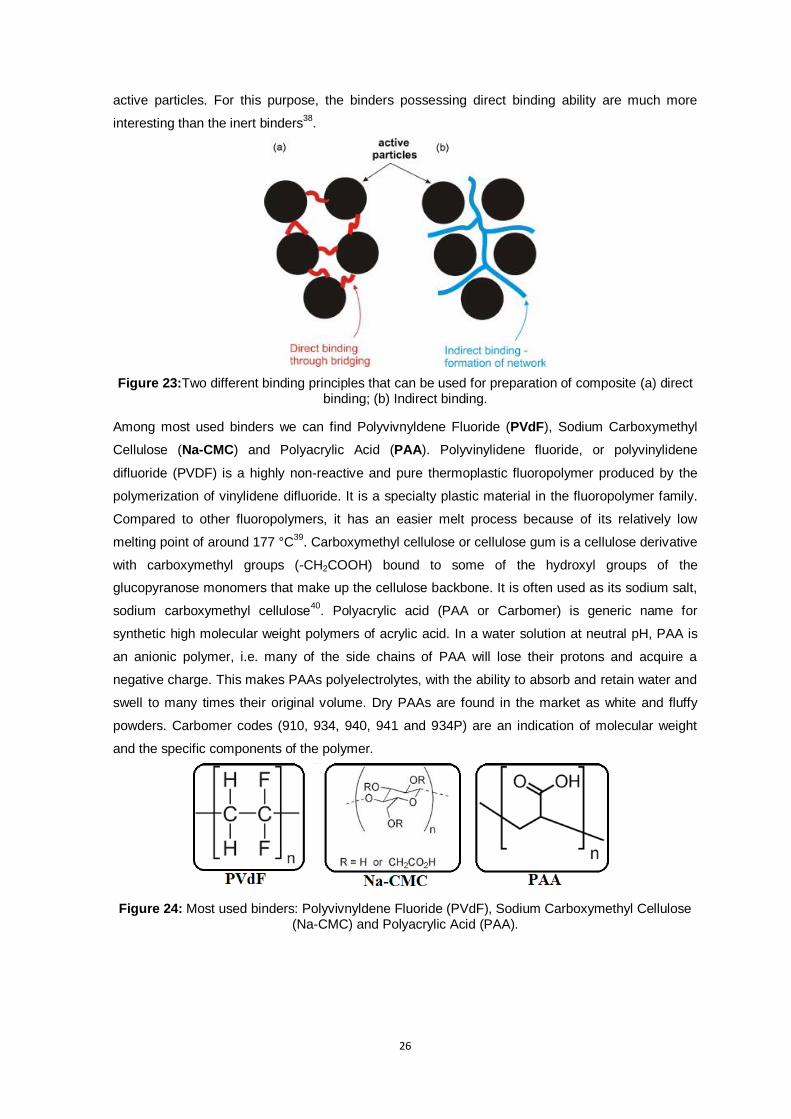
26
active particles. For this purpose, the binders possessing direct binding ability are much more
interesting than the inert binders38
.
Figure 23:Two different binding principles that can be used for preparation of composite (a) direct binding; (b) Indirect binding.
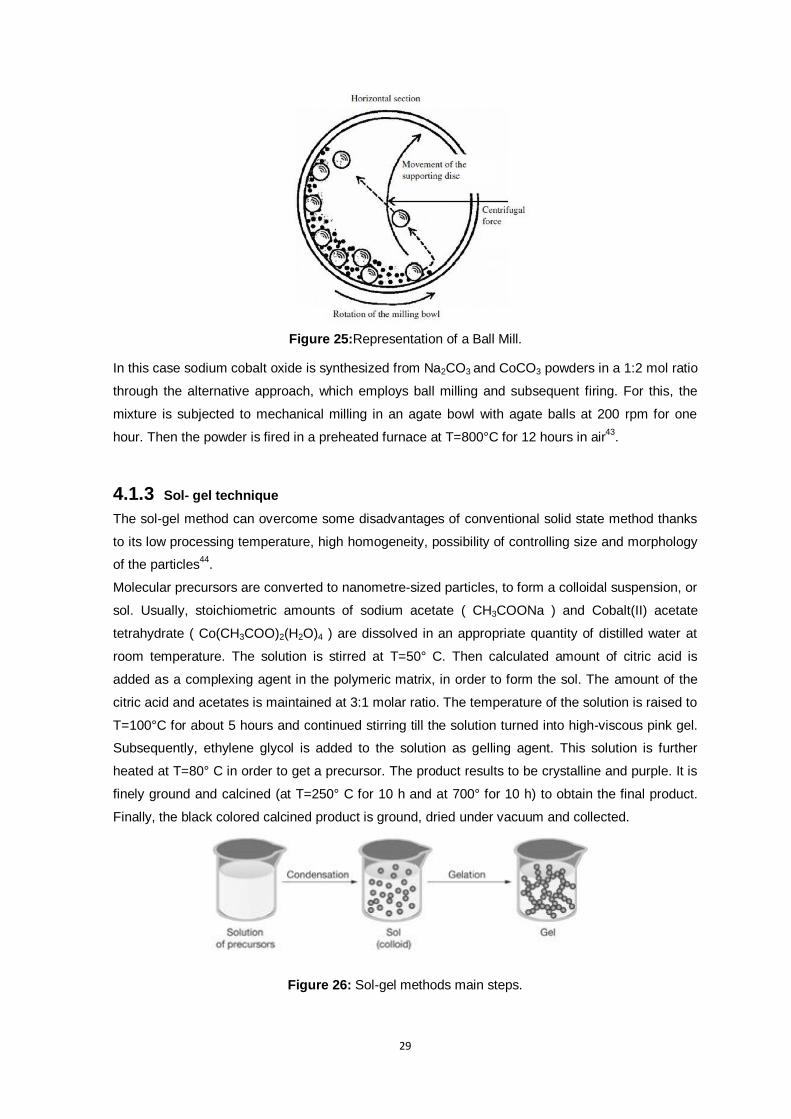
Among most used binders we can find Polyvivnyldene Fluoride (PVdF), Sodium Carboxymethyl
Cellulose (Na-CMC) and Polyacrylic Acid (PAA). Polyvinylidene fluoride, or polyvinylidene
difluoride (PVDF) is a highly non-reactive and pure thermoplastic fluoropolymer produced by the
polymerization of vinylidene difluoride. It is a specialty plastic material in the fluoropolymer family.
Compared to other fluoropolymers, it has an easier melt process because of its relatively low
melting point of around 177 °C39
. Carboxymethyl cellulose or cellulose gum is a cellulose derivative
with carboxymethyl groups (-CH2COOH) bound to some of the hydroxyl groups of the
glucopyranose monomers that make up the cellulose backbone. It is often used as its sodium salt,
sodium carboxymethyl cellulose40
. Polyacrylic acid (PAA or Carbomer) is generic name for
synthetic high molecular weight polymers of acrylic acid. In a water solution at neutral pH, PAA is
an anionic polymer, i.e. many of the side chains of PAA will lose their protons and acquire a
negative charge. This makes PAAs polyelectrolytes, with the ability to absorb and retain water and
swell to many times their original volume. Dry PAAs are found in the market as white and fluffy
powders. Carbomer codes (910, 934, 940, 941 and 934P) are an indication of molecular weight
and the specific components of the polymer.
Figure 24: Most used binders: Polyvivnyldene Fluoride (PVdF), Sodium Carboxymethyl Cellulose (Na-CMC) and Polyacrylic Acid (PAA).

27
3 Aim of the research
The research work presented in this thesis deals with the investigation of electrochemical
properties of electrode materials for this sodium-ion batteries, in particular NaxCoO2 as cathode.
In the first part of this thesis, several synthetic routes have been studied. The active materials
obtained have been investigated by X-ray and Inductively Coupled Plasma Mass Spectrometry
(ICP-MS) analysis to evaluate the correlation between stoichiometry and crystal structure. A
morphological characterization was carried out using Scanning Electron Microscope (SEM).
In the second part of this thesis, materials have been tested electrochemically by Galvanostatic
Cycling with Potential Limitation (GCPL), Cyclic Voltammetry (CV) and Electrochemical Impedance
Spectroscopy (EIS). Finally an optimization of the system has been done evaluating the use of
different electrolytes and binders.

28
4 Experimental procedures and techniques
4.1. Synthetic techniques
Several literature articles deal with the synthetic routes to obtain cathode materials for Sodium-ion
batteries technology, since their electrochemical behaviour and performances depend on the
synthesis.
As regards NaxCoO2, the most commonly used synthesis are: solid state method, ball milling
accompanied by post firing and sol-gel method.
4.1.1 Solid State reaction
This is the most common method in which stoichiometric mixture of starting materials is ground
together and the resultant mixture is heat–treated in furnace.
In the case of NaxCoO2, appropriate amount of starting materials, Na2Co3 and CoO4, are
thoroughly mixed in the ratio of 1:1. Subsequently, the mixture is ground to ensure complete
reaction. After drying, the powder is calcined in a preheated furnace at 800° C to form the
precursor. Initially the reaction is carried out for 12 hours. The product was again subjected to solid
state reaction for 12 hours, under oxygen flow, after intermediate grinding41
.
The purity of the material depends on the choice of the ratio of starting materials, calcination
temperature and time.
4.1.2 High energy ball milling and post firing
This is an alternative way to use the classical solid state synthetic method. Reagents are mixed
together in a different way, using a ball mill. It is a type of grinder used to grind and blend
materials, it is used wherever the highest degree of fineness is required. A ball mill works on the
principle of impact and attrition, size reduction is done by impact as the balls drop from near the top
of the bowl. It consists of a hollow cylindrical bowl rotating about its axis. The bowl is partially filled
with balls (grinding media). Both bowl and balls may be made of steel , stainless steel, agate or
rubber42
, since grinding degrees depend on the materials balls. Agate is a very interesting material
because of its extreme hardness (Mohs hardness of ~7). The only grinding balls that have a higher
hardness value are those made from zirconia (Mohs hardness of ~ 10), but unfortunately they were
not available in the lab during my thesis. It has been found that agate balls are quite acceptable for
most of applications where freedom from grinding media contamination is crucial, like synthesis of
this type of cathode materials. The steel grinding media balls present a high hardness but can
contaminate the samples, mainly with the iron.
29
Figure 25:Representation of a Ball Mill.
In this case sodium cobalt oxide is synthesized from Na2CO3 and CoCO3 powders in a 1:2 mol ratio
through the alternative approach, which employs ball milling and subsequent firing. For this, the
mixture is subjected to mechanical milling in an agate bowl with agate balls at 200 rpm for one
hour. Then the powder is fired in a preheated furnace at T=800°C for 12 hours in air43
.
4.1.3 Sol- gel technique
The sol-gel method can overcome some disadvantages of conventional solid state method thanks
to its low processing temperature, high homogeneity, possibility of controlling size and morphology
of the particles44
.
Molecular precursors are converted to nanometre-sized particles, to form a colloidal suspension, or
sol. Usually, stoichiometric amounts of sodium acetate ( CH3COONa ) and Cobalt(II) acetate
tetrahydrate ( Co(CH3COO)2(H2O)4 ) are dissolved in an appropriate quantity of distilled water at
room temperature. The solution is stirred at T=50° C. Then calculated amount of citric acid is
added as a complexing agent in the polymeric matrix, in order to form the sol. The amount of the
citric acid and acetates is maintained at 3:1 molar ratio. The temperature of the solution is raised to
T=100°C for about 5 hours and continued stirring till the solution turned into high-viscous pink gel.
Subsequently, ethylene glycol is added to the solution as gelling agent. This solution is further
heated at T=80° C in order to get a precursor. The product results to be crystalline and purple. It is
finely ground and calcined (at T=250° C for 10 h and at 700° for 10 h) to obtain the final product.
Finally, the black colored calcined product is ground, dried under vacuum and collected.
Figure 26: Sol-gel methods main steps.
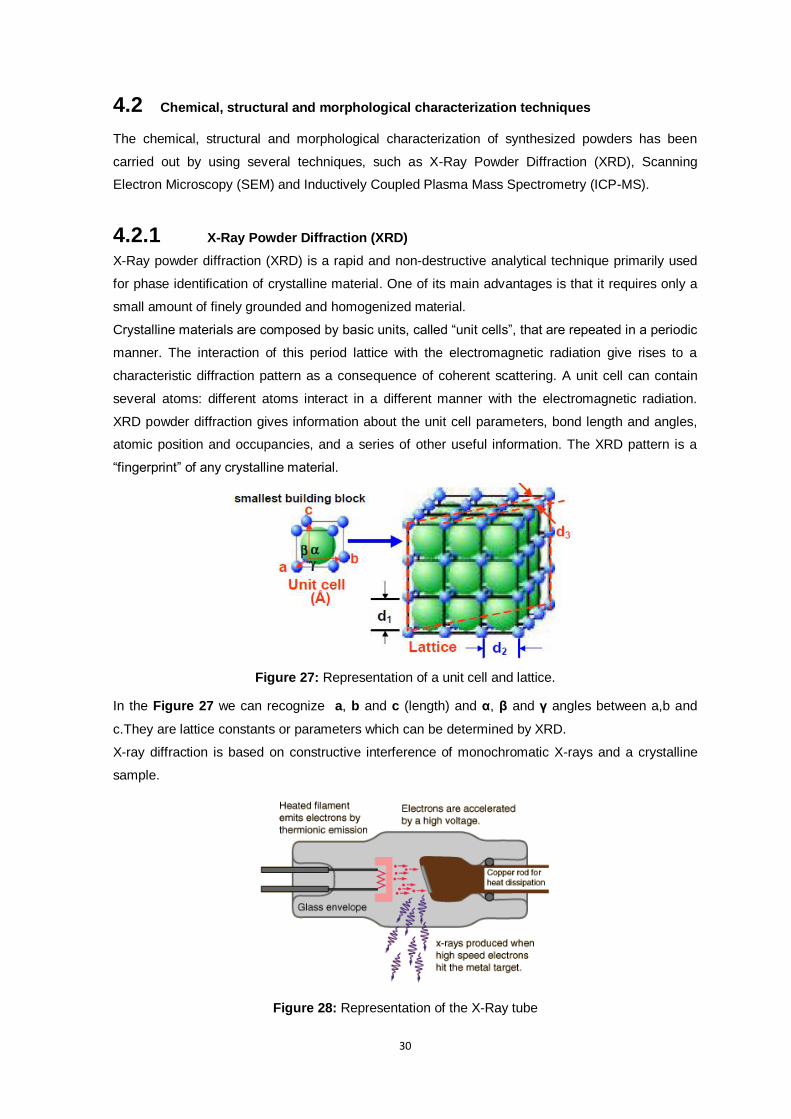
30
4.2 Chemical, structural and morphological characterization techniques
The chemical, structural and morphological characterization of synthesized powders has been
carried out by using several techniques, such as X-Ray Powder Diffraction (XRD), Scanning
Electron Microscopy (SEM) and Inductively Coupled Plasma Mass Spectrometry (ICP-MS).
4.2.1 X-Ray Powder Diffraction (XRD)
X-Ray powder diffraction (XRD) is a rapid and non-destructive analytical technique primarily used
for phase identification of crystalline material. One of its main advantages is that it requires only a
small amount of finely grounded and homogenized material.
Crystalline materials are composed by basic units, called “unit cells”, that are repeated in a periodic
manner. The interaction of this period lattice with the electromagnetic radiation give rises to a
characteristic diffraction pattern as a consequence of coherent scattering. A unit cell can contain
several atoms: different atoms interact in a different manner with the electromagnetic radiation.
XRD powder diffraction gives information about the unit cell parameters, bond length and angles,
atomic position and occupancies, and a series of other useful information. The XRD pattern is a
“fingerprint” of any crystalline material.
Figure 27: Representation of a unit cell and lattice.
In the Figure 27 we can recognize a, b and c (length) and α, β and γ angles between a,b and
c.They are lattice constants or parameters which can be determined by XRD.
X-ray diffraction is based on constructive interference of monochromatic X-rays and a crystalline
sample.
Figure 28: Representation of the X-Ray tube
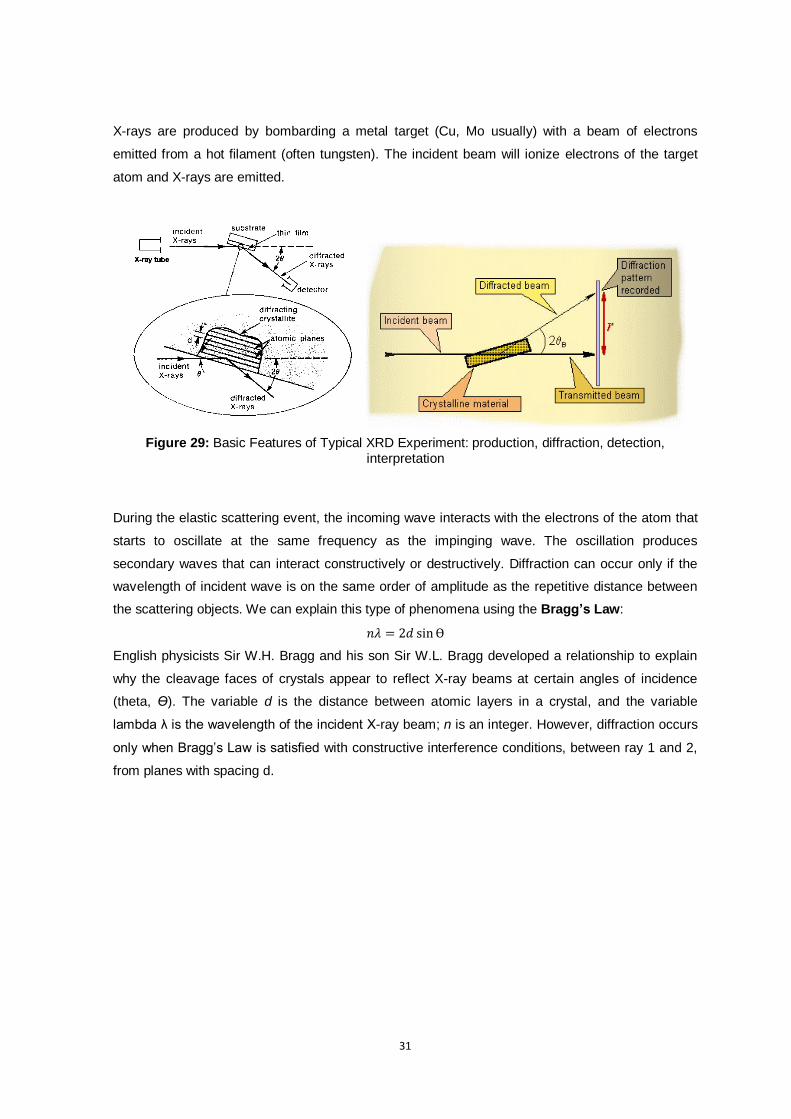
31
X-rays are produced by bombarding a metal target (Cu, Mo usually) with a beam of electrons
emitted from a hot filament (often tungsten). The incident beam will ionize electrons of the target
atom and X-rays are emitted.
Figure 29: Basic Features of Typical XRD Experiment: production, diffraction, detection, interpretation
During the elastic scattering event, the incoming wave interacts with the electrons of the atom that
starts to oscillate at the same frequency as the impinging wave. The oscillation produces
secondary waves that can interact constructively or destructively. Diffraction can occur only if the
wavelength of incident wave is on the same order of amplitude as the repetitive distance between
the scattering objects. We can explain this type of phenomena using the Bragg’s Law:
𝑛𝜆 = 2𝑑 sin Ө
English physicists Sir W.H. Bragg and his son Sir W.L. Bragg developed a relationship to explain
why the cleavage faces of crystals appear to reflect X-ray beams at certain angles of incidence
(theta, Ө). The variable d is the distance between atomic layers in a crystal, and the variable
lambda λ is the wavelength of the incident X-ray beam; n is an integer. However, diffraction occurs
only when Bragg’s Law is satisfied with constructive interference conditions, between ray 1 and 2,
from planes with spacing d.
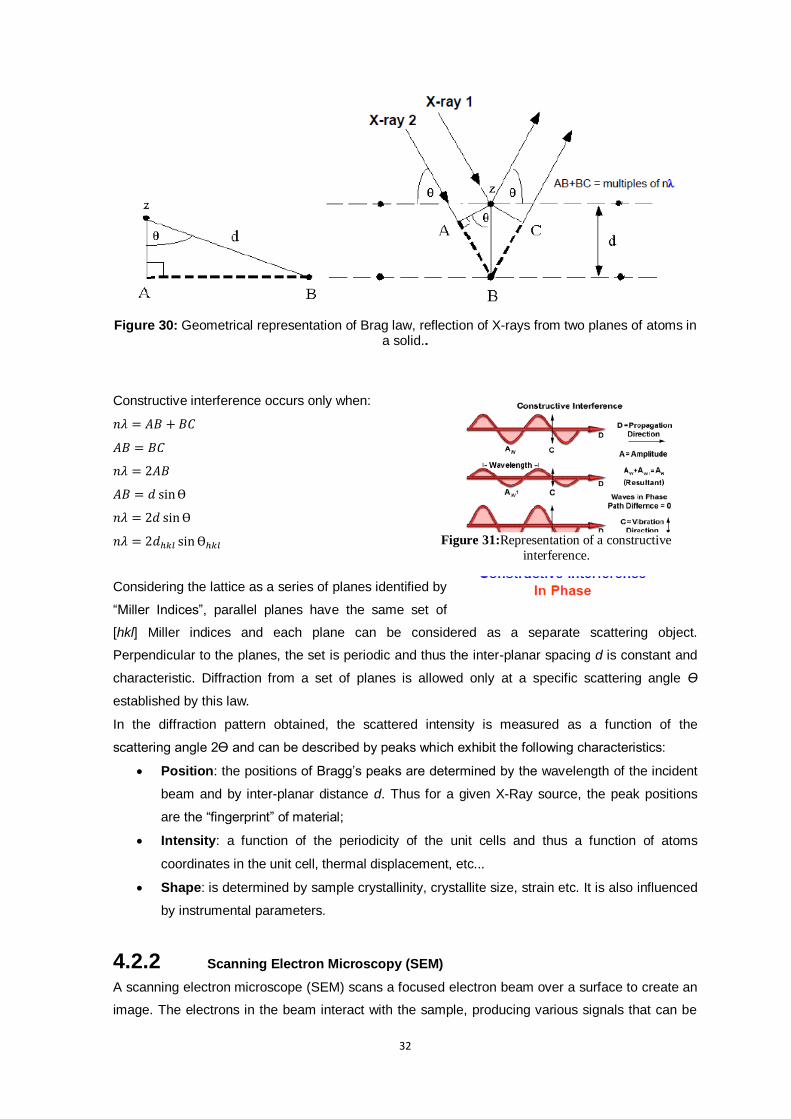
32
Figure 30: Geometrical representation of Brag law, reflection of X-rays from two planes of atoms in a solid..
Constructive interference occurs only when:
𝑛𝜆 = 𝐴𝐵 + 𝐵𝐶
𝐴𝐵 = 𝐵𝐶
𝑛𝜆 = 2𝐴𝐵
𝐴𝐵 = 𝑑 sin Ө
𝑛𝜆 = 2𝑑 sin Ө
𝑛𝜆 = 2𝑑ℎ𝑘𝑙 sin Өℎ𝑘𝑙
Considering the lattice as a series of planes identified by
“Miller Indices”, parallel planes have the same set of
[hkl] Miller indices and each plane can be considered as a separate scattering object.
Perpendicular to the planes, the set is periodic and thus the inter-planar spacing d is constant and
characteristic. Diffraction from a set of planes is allowed only at a specific scattering angle Ө
established by this law.
In the diffraction pattern obtained, the scattered intensity is measured as a function of the
scattering angle 2Ө and can be described by peaks which exhibit the following characteristics:
Position: the positions of Bragg’s peaks are determined by the wavelength of the incident
beam and by inter-planar distance d. Thus for a given X-Ray source, the peak positions
are the “fingerprint” of material;
Intensity: a function of the periodicity of the unit cells and thus a function of atoms
coordinates in the unit cell, thermal displacement, etc...
Shape: is determined by sample crystallinity, crystallite size, strain etc. It is also influenced
by instrumental parameters.
4.2.2 Scanning Electron Microscopy (SEM)
A scanning electron microscope (SEM) scans a focused electron beam over a surface to create an
image. The electrons in the beam interact with the sample, producing various signals that can be
Figure 31:Representation of a constructive
interference.
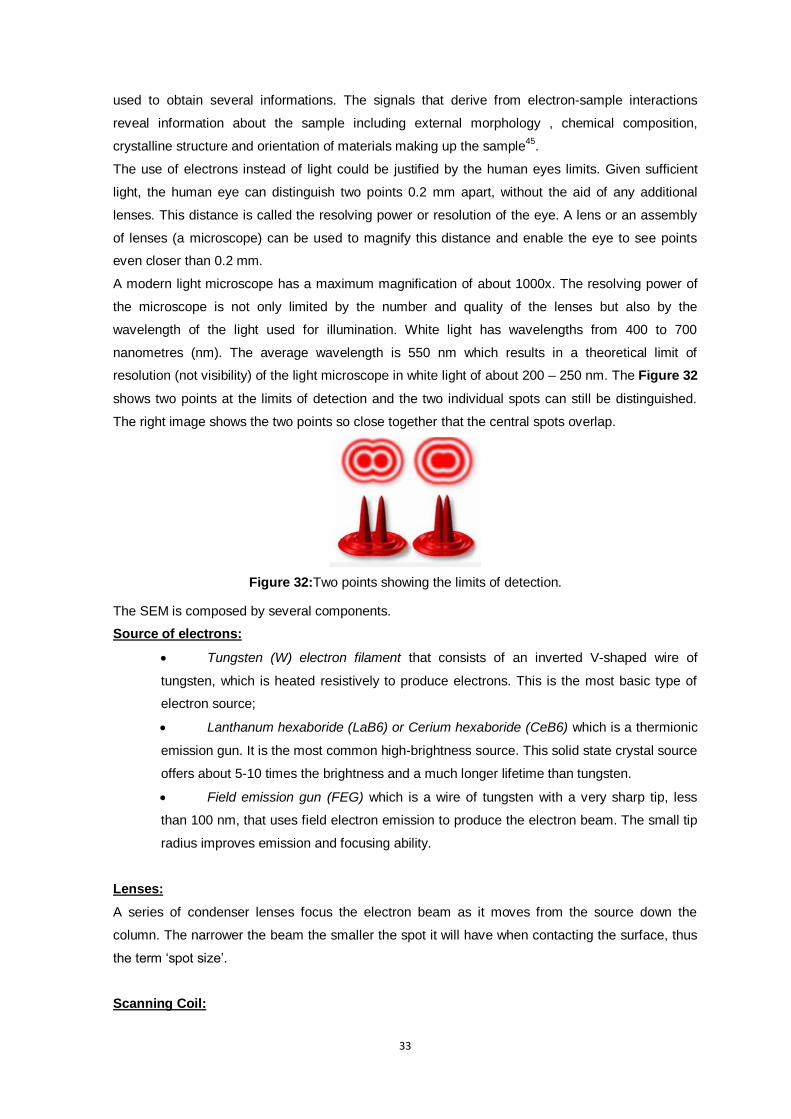
33
used to obtain several informations. The signals that derive from electron-sample interactions
reveal information about the sample including external morphology , chemical composition,
crystalline structure and orientation of materials making up the sample45
.
The use of electrons instead of light could be justified by the human eyes limits. Given sufficient
light, the human eye can distinguish two points 0.2 mm apart, without the aid of any additional
lenses. This distance is called the resolving power or resolution of the eye. A lens or an assembly
of lenses (a microscope) can be used to magnify this distance and enable the eye to see points
even closer than 0.2 mm.
A modern light microscope has a maximum magnification of about 1000x. The resolving power of
the microscope is not only limited by the number and quality of the lenses but also by the
wavelength of the light used for illumination. White light has wavelengths from 400 to 700
nanometres (nm). The average wavelength is 550 nm which results in a theoretical limit of
resolution (not visibility) of the light microscope in white light of about 200 – 250 nm. The Figure 32
shows two points at the limits of detection and the two individual spots can still be distinguished.
The right image shows the two points so close together that the central spots overlap.
Figure 32:Two points showing the limits of detection.
The SEM is composed by several components.
Source of electrons:
Tungsten (W) electron filament that consists of an inverted V-shaped wire of
tungsten, which is heated resistively to produce electrons. This is the most basic type of
electron source;
Lanthanum hexaboride (LaB6) or Cerium hexaboride (CeB6) which is a thermionic
emission gun. It is the most common high-brightness source. This solid state crystal source
offers about 5-10 times the brightness and a much longer lifetime than tungsten.
Field emission gun (FEG) which is a wire of tungsten with a very sharp tip, less
than 100 nm, that uses field electron emission to produce the electron beam. The small tip
radius improves emission and focusing ability.
Lenses:
A series of condenser lenses focus the electron beam as it moves from the source down the
column. The narrower the beam the smaller the spot it will have when contacting the surface, thus
the term ‘spot size’.
Scanning Coil:

34
After the beam is focused, scanning coils are used to deflect the beam in the X and Y axes so that
it scans in a raster fashion over the surface of the sample.
Sample Chamber:
Samples are mounted and placed into a chamber that is evacuated. The sample chamber can
include a translation stage, tilt and rotation devices, feed-through to the outside, temperature
stages, optical cameras, and a variety of other devices to assist in imaging the sample.
Detector:
The detector collects the electrons coming off of the sample. Two types of electrons are typically
used for imaging: secondary electrons (SE) and backscattered electrons (BSE):
Secondary electron detector- Secondary electrons are low energy electrons
produced when electrons are ejected from the k-orbitals of the sample atoms by the
imaging beam. The most popular detector in SEMs is the Everhart-Thornley detector. It
consists of a Faraday cage which accelerates the electrons towards a scintillator. This in
turn produces a current which is directed towards a photomultiplier and the amplified signal
is read on the monitor.
•Backscattered electron detector- Backscattered electrons are higher energy
electrons that are elastically backscattered by the atoms of the sample. Atoms with higher
atomic numbers backscatter more efficiently and therefore this detector can give
compositional information about the sample. These detectors can either be scintillators or
semiconductors. An advantage of having a semiconductor detector is that it can be split
into sections can be switched on or off to control the contrast and directionality, which
gives valuable topographical information about the sample as well.
Figure 33: Schematic representation of SEM.
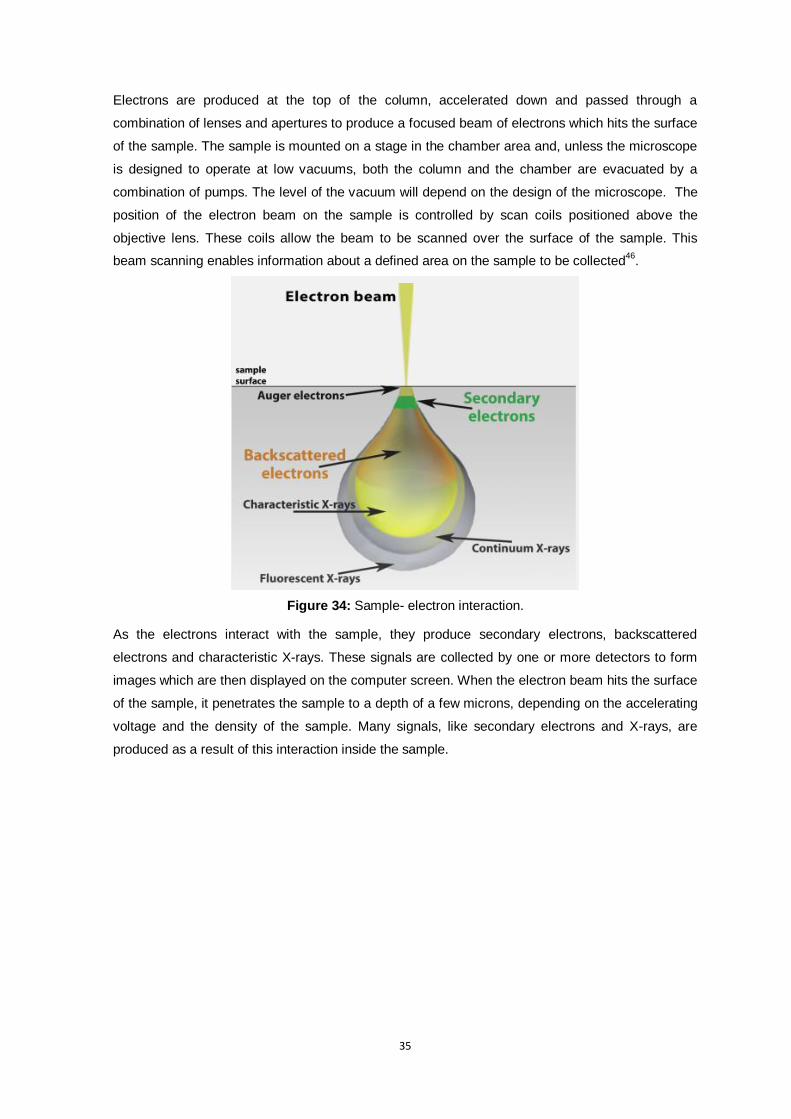
35
Electrons are produced at the top of the column, accelerated down and passed through a
combination of lenses and apertures to produce a focused beam of electrons which hits the surface
of the sample. The sample is mounted on a stage in the chamber area and, unless the microscope
is designed to operate at low vacuums, both the column and the chamber are evacuated by a
combination of pumps. The level of the vacuum will depend on the design of the microscope. The
position of the electron beam on the sample is controlled by scan coils positioned above the
objective lens. These coils allow the beam to be scanned over the surface of the sample. This
beam scanning enables information about a defined area on the sample to be collected46
.
Figure 34: Sample- electron interaction.
As the electrons interact with the sample, they produce secondary electrons, backscattered
electrons and characteristic X-rays. These signals are collected by one or more detectors to form
images which are then displayed on the computer screen. When the electron beam hits the surface
of the sample, it penetrates the sample to a depth of a few microns, depending on the accelerating
voltage and the density of the sample. Many signals, like secondary electrons and X-rays, are
produced as a result of this interaction inside the sample.
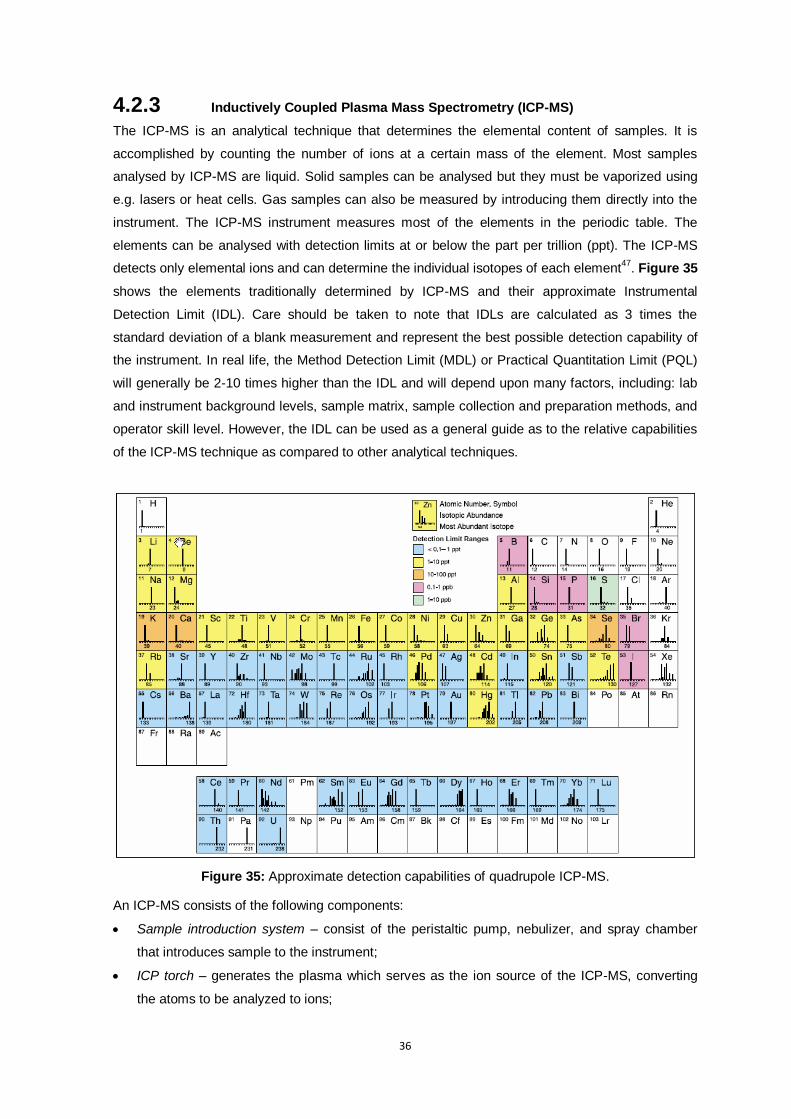
36
4.2.3 Inductively Coupled Plasma Mass Spectrometry (ICP-MS)
The ICP-MS is an analytical technique that determines the elemental content of samples. It is
accomplished by counting the number of ions at a certain mass of the element. Most samples
analysed by ICP-MS are liquid. Solid samples can be analysed but they must be vaporized using
e.g. lasers or heat cells. Gas samples can also be measured by introducing them directly into the
instrument. The ICP-MS instrument measures most of the elements in the periodic table. The
elements can be analysed with detection limits at or below the part per trillion (ppt). The ICP-MS
detects only elemental ions and can determine the individual isotopes of each element47
. Figure 35
shows the elements traditionally determined by ICP-MS and their approximate Instrumental
Detection Limit (IDL). Care should be taken to note that IDLs are calculated as 3 times the
standard deviation of a blank measurement and represent the best possible detection capability of
the instrument. In real life, the Method Detection Limit (MDL) or Practical Quantitation Limit (PQL)
will generally be 2-10 times higher than the IDL and will depend upon many factors, including: lab
and instrument background levels, sample matrix, sample collection and preparation methods, and
operator skill level. However, the IDL can be used as a general guide as to the relative capabilities
of the ICP-MS technique as compared to other analytical techniques.
Figure 35: Approximate detection capabilities of quadrupole ICP-MS.
An ICP-MS consists of the following components:
Sample introduction system – consist of the peristaltic pump, nebulizer, and spray chamber
that introduces sample to the instrument;
ICP torch – generates the plasma which serves as the ion source of the ICP-MS, converting
the atoms to be analyzed to ions;
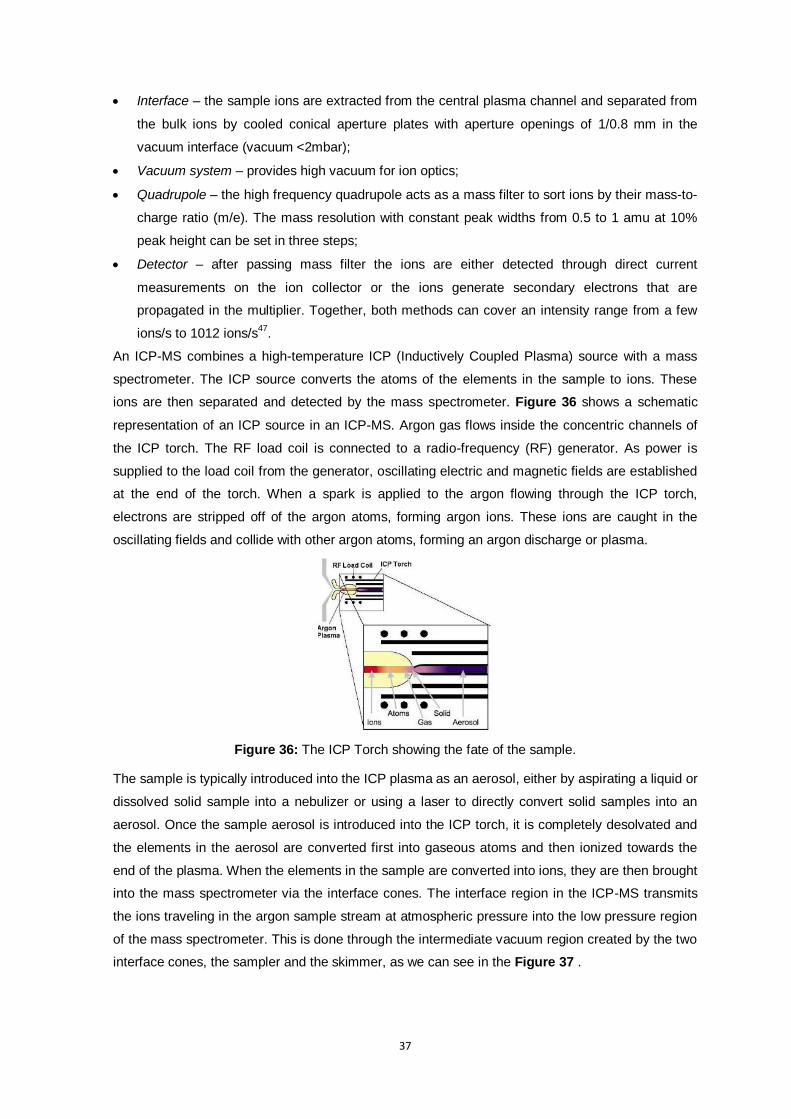
37
Interface – the sample ions are extracted from the central plasma channel and separated from
the bulk ions by cooled conical aperture plates with aperture openings of 1/0.8 mm in the
vacuum interface (vacuum <2mbar);
Vacuum system – provides high vacuum for ion optics;
Quadrupole – the high frequency quadrupole acts as a mass filter to sort ions by their mass-to-
charge ratio (m/e). The mass resolution with constant peak widths from 0.5 to 1 amu at 10%
peak height can be set in three steps;
Detector – after passing mass filter the ions are either detected through direct current
measurements on the ion collector or the ions generate secondary electrons that are
propagated in the multiplier. Together, both methods can cover an intensity range from a few
ions/s to 1012 ions/s47
.
An ICP-MS combines a high-temperature ICP (Inductively Coupled Plasma) source with a mass
spectrometer. The ICP source converts the atoms of the elements in the sample to ions. These
ions are then separated and detected by the mass spectrometer. Figure 36 shows a schematic
representation of an ICP source in an ICP-MS. Argon gas flows inside the concentric channels of
the ICP torch. The RF load coil is connected to a radio-frequency (RF) generator. As power is
supplied to the load coil from the generator, oscillating electric and magnetic fields are established
at the end of the torch. When a spark is applied to the argon flowing through the ICP torch,
electrons are stripped off of the argon atoms, forming argon ions. These ions are caught in the
oscillating fields and collide with other argon atoms, forming an argon discharge or plasma.
Figure 36: The ICP Torch showing the fate of the sample.
The sample is typically introduced into the ICP plasma as an aerosol, either by aspirating a liquid or
dissolved solid sample into a nebulizer or using a laser to directly convert solid samples into an
aerosol. Once the sample aerosol is introduced into the ICP torch, it is completely desolvated and
the elements in the aerosol are converted first into gaseous atoms and then ionized towards the
end of the plasma. When the elements in the sample are converted into ions, they are then brought
into the mass spectrometer via the interface cones. The interface region in the ICP-MS transmits
the ions traveling in the argon sample stream at atmospheric pressure into the low pressure region
of the mass spectrometer. This is done through the intermediate vacuum region created by the two
interface cones, the sampler and the skimmer, as we can see in the Figure 37 .
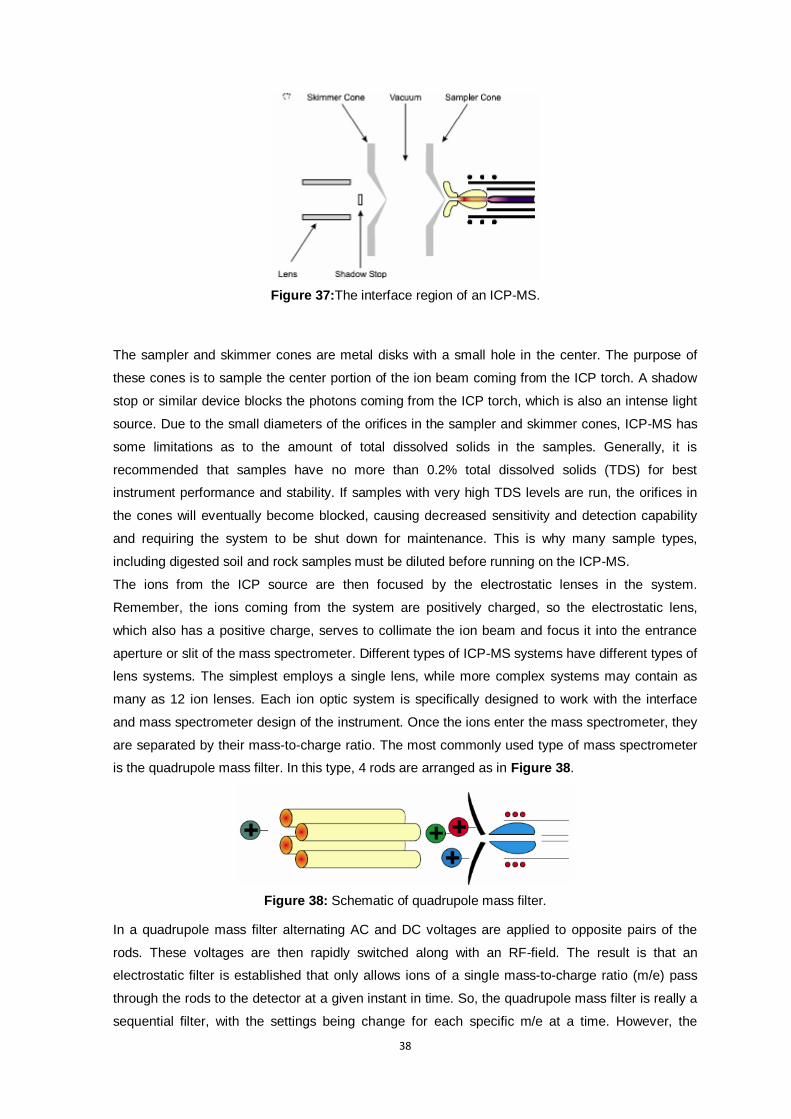
38
Figure 37:The interface region of an ICP-MS.
The sampler and skimmer cones are metal disks with a small hole in the center. The purpose of
these cones is to sample the center portion of the ion beam coming from the ICP torch. A shadow
stop or similar device blocks the photons coming from the ICP torch, which is also an intense light
source. Due to the small diameters of the orifices in the sampler and skimmer cones, ICP-MS has
some limitations as to the amount of total dissolved solids in the samples. Generally, it is
recommended that samples have no more than 0.2% total dissolved solids (TDS) for best
instrument performance and stability. If samples with very high TDS levels are run, the orifices in
the cones will eventually become blocked, causing decreased sensitivity and detection capability
and requiring the system to be shut down for maintenance. This is why many sample types,
including digested soil and rock samples must be diluted before running on the ICP-MS.
The ions from the ICP source are then focused by the electrostatic lenses in the system.
Remember, the ions coming from the system are positively charged, so the electrostatic lens,
which also has a positive charge, serves to collimate the ion beam and focus it into the entrance
aperture or slit of the mass spectrometer. Different types of ICP-MS systems have different types of
lens systems. The simplest employs a single lens, while more complex systems may contain as
many as 12 ion lenses. Each ion optic system is specifically designed to work with the interface
and mass spectrometer design of the instrument. Once the ions enter the mass spectrometer, they
are separated by their mass-to-charge ratio. The most commonly used type of mass spectrometer
is the quadrupole mass filter. In this type, 4 rods are arranged as in Figure 38.
Figure 38: Schematic of quadrupole mass filter.
In a quadrupole mass filter alternating AC and DC voltages are applied to opposite pairs of the
rods. These voltages are then rapidly switched along with an RF-field. The result is that an
electrostatic filter is established that only allows ions of a single mass-to-charge ratio (m/e) pass
through the rods to the detector at a given instant in time. So, the quadrupole mass filter is really a
sequential filter, with the settings being change for each specific m/e at a time. However, the

39
voltages on the rods can be switched at a very rapid rate. The result is that the quadrupole mass
filter can separate up to 2400 amu (atomic mass units) per second. This speed is why the
quadrupole ICP-MS is often considered to have simultaneous multi-elemental analysis properties.
The ability to filter ions on their mass-to-charge ratio allows ICP-MS to supply isotopic information,
since different isotopes of the same element have different masses.
Once the ions have been separated by their mass-to-charge ratio, they must then be detected or
counted by a suitable detector. The fundamental purpose of the detector is to translate the number
of ions striking the detector into an electrical signal that can be measured and related to the
number of atoms of that element in the sample via the use of calibration standards. Most detectors
use a high negative voltage on the front surface of the detector to attract the positively charged
ions to the detector. Once the ion hits the active surface of the detector, a number of electrons is
released which then strike the next surface of the detector, amplifying the signal48
.

40
4.3 Electrochemical Principles
4.3.1 Faraday’s Law
According to the general redox process reported below,
𝑂𝑥 + 𝑧𝑒− ⇆ 𝑅𝑒𝑑
the amount of electrical charge transferred in an electrochemical reaction is given by Faraday’s
law:
𝑄 =𝑧 ∙ 𝐹 ∙ 𝑚
𝑀
Where z is the number of equivalents per mole of reactant, m is the mass of the substance
undergoing electrochemical reaction, M is the molar mass of the substance and F is the Faraday
constant ( 96 487 coulombs/equivalent, or 26.8 Ah/equivalent).
It is clear from Faraday’s law that the mass of a given substance required for the transfer of a given
amount of charge is proportional to the equivalent mass. Of course, it is desirable that the mass of
reactants required be minimized by selecting electrode reactants of low equivalent mass. The
direction of charge transfer depends upon whether the electrode material is being oxidized (giving
up electrons) or reduced (receiving electrons). If a reduction reaction takes place, the electrode is
referred to as a cathode; if an oxidation reaction takes place, the electrode is an anode. Thus, the
negative electrode of a rechargeable cell is an anode during discharge, and acts as a cathode
during recharge. Correspondingly, the positive electrode is a cathode during discharge, and acts as
an anode during recharge49
.
41
4.3.2 Nernst’s equation
The Nernst’s Equation enables the determination of cell potential under non-standard conditions. It
relates the measured cell potential to the reaction quotient and allows the accurate determination of
equilibrium constants. It is derived from the Gibbs free energy under standard conditions.
E°=E°reduction−E°oxidation
ΔG is also related to E under general conditions via:
ΔG=−nFE°
Where n is the number of electrons transferred in the reaction (from balanced reaction), F is the
Faraday constant (96,500 C/mol) and E is potential difference. Starting from reactants in standard
conditions, equation is then:
ΔG°=−nFE°
Hence, when E° is positive, the reaction is spontaneous and when E° is negative, the reaction is
non-spontaneous. From thermodynamics, the Gibbs energy change under non-standard conditions
can be related to the Gibbs energy change under standard equations via:
ΔG=ΔG° +RTlnQ
Substituting ΔG=−nFE and ΔG°=−nFE° into equation, we have:
−nFE=−nFE°+RTlnQ
Divide both sides of the equation above by −nF , we have
E=Eo−(RT/nF) lnQ
It can be rewritten in the form of log 10 :
E=E°−2.303(RT/nF) logQ
(Generalized Nernst Equation)
At standard temperature T = 298 K, the 2.303 (RT/F) term equals 0.0592 V and this equation turns
into:
E=E°−(0.0592V/n) logQ
(Nernst Equation at 298 K)
The equation above indicates that the electrical potential of a cell depends upon the reaction
quotient Q of the reaction50
.
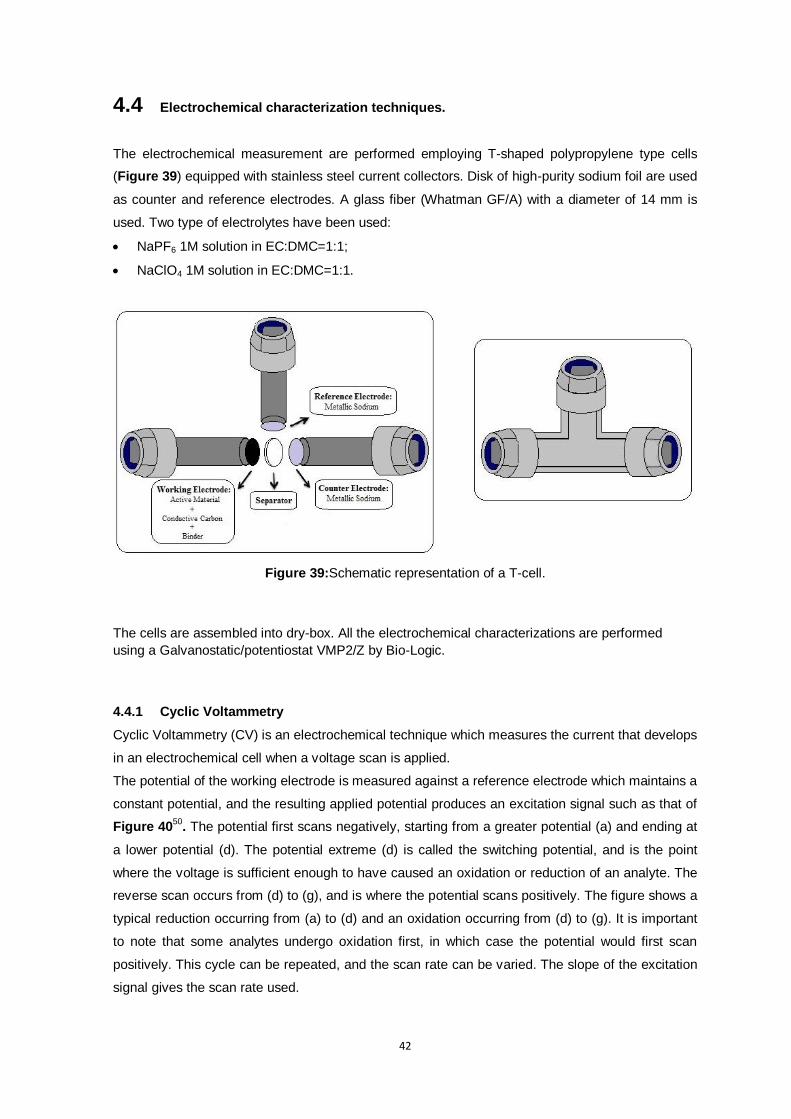
42
4.4 Electrochemical characterization techniques.
The electrochemical measurement are performed employing T-shaped polypropylene type cells
(Figure 39) equipped with stainless steel current collectors. Disk of high-purity sodium foil are used
as counter and reference electrodes. A glass fiber (Whatman GF/A) with a diameter of 14 mm is
used. Two type of electrolytes have been used:
NaPF6 1M solution in EC:DMC=1:1;
NaClO4 1M solution in EC:DMC=1:1.
Figure 39:Schematic representation of a T-cell.
The cells are assembled into dry-box. All the electrochemical characterizations are performed
using a Galvanostatic/potentiostat VMP2/Z by Bio-Logic.
4.4.1 Cyclic Voltammetry
Cyclic Voltammetry (CV) is an electrochemical technique which measures the current that develops
in an electrochemical cell when a voltage scan is applied.
The potential of the working electrode is measured against a reference electrode which maintains a
constant potential, and the resulting applied potential produces an excitation signal such as that of
Figure 4050
. The potential first scans negatively, starting from a greater potential (a) and ending at
a lower potential (d). The potential extreme (d) is called the switching potential, and is the point
where the voltage is sufficient enough to have caused an oxidation or reduction of an analyte. The
reverse scan occurs from (d) to (g), and is where the potential scans positively. The figure shows a
typical reduction occurring from (a) to (d) and an oxidation occurring from (d) to (g). It is important
to note that some analytes undergo oxidation first, in which case the potential would first scan
positively. This cycle can be repeated, and the scan rate can be varied. The slope of the excitation
signal gives the scan rate used.
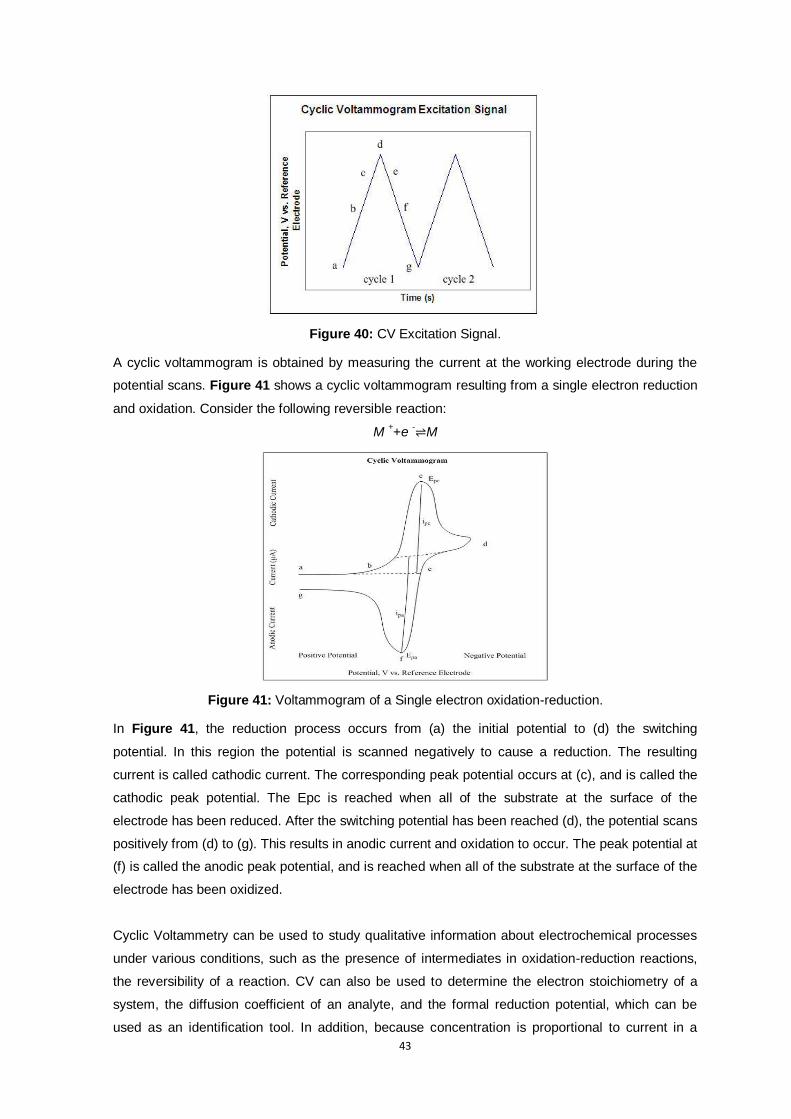
43
Figure 40: CV Excitation Signal.
A cyclic voltammogram is obtained by measuring the current at the working electrode during the
potential scans. Figure 41 shows a cyclic voltammogram resulting from a single electron reduction
and oxidation. Consider the following reversible reaction:
M ++e
-⇌M
Figure 41: Voltammogram of a Single electron oxidation-reduction.
In Figure 41, the reduction process occurs from (a) the initial potential to (d) the switching
potential. In this region the potential is scanned negatively to cause a reduction. The resulting
current is called cathodic current. The corresponding peak potential occurs at (c), and is called the
cathodic peak potential. The Epc is reached when all of the substrate at the surface of the
electrode has been reduced. After the switching potential has been reached (d), the potential scans
positively from (d) to (g). This results in anodic current and oxidation to occur. The peak potential at
(f) is called the anodic peak potential, and is reached when all of the substrate at the surface of the
electrode has been oxidized.
Cyclic Voltammetry can be used to study qualitative information about electrochemical processes
under various conditions, such as the presence of intermediates in oxidation-reduction reactions,
the reversibility of a reaction. CV can also be used to determine the electron stoichiometry of a
system, the diffusion coefficient of an analyte, and the formal reduction potential, which can be
used as an identification tool. In addition, because concentration is proportional to current in a

44
reversible, Nernstian system, concentration of an unknown solution can be determined by
generating a calibration curve of current vs. concentration.
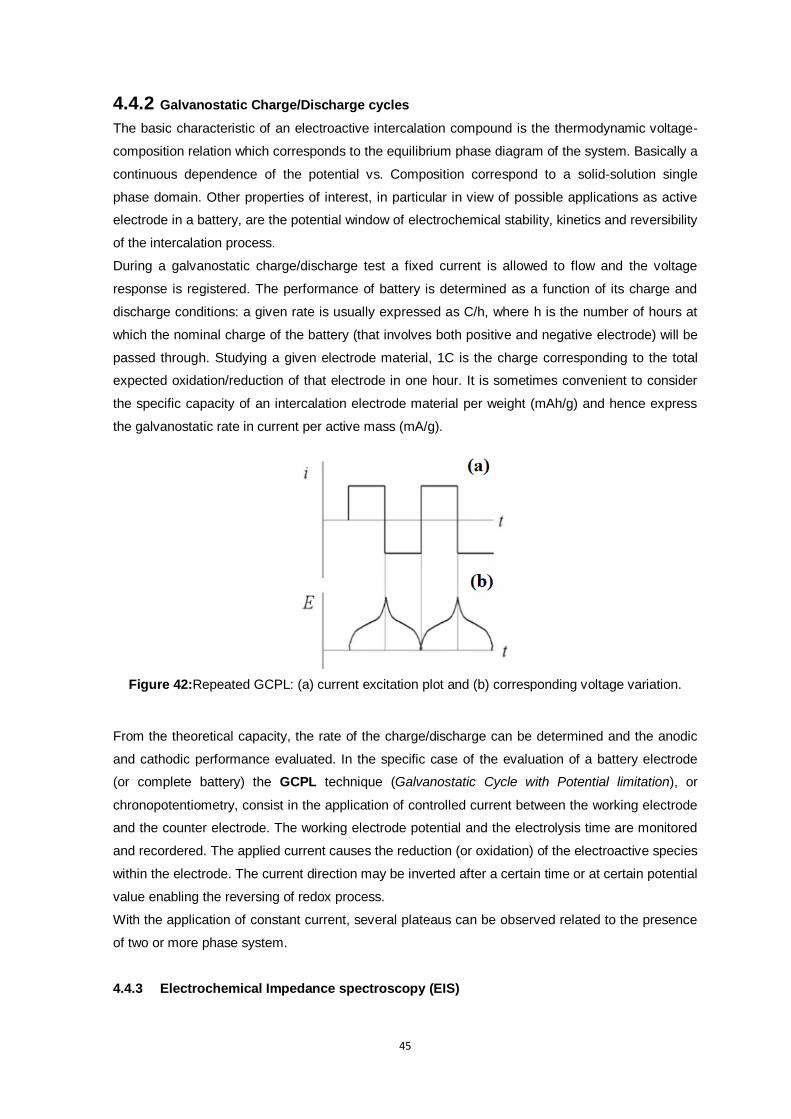
45
4.4.2 Galvanostatic Charge/Discharge cycles
The basic characteristic of an electroactive intercalation compound is the thermodynamic voltage-
composition relation which corresponds to the equilibrium phase diagram of the system. Basically a
continuous dependence of the potential vs. Composition correspond to a solid-solution single
phase domain. Other properties of interest, in particular in view of possible applications as active
electrode in a battery, are the potential window of electrochemical stability, kinetics and reversibility
of the intercalation process.
During a galvanostatic charge/discharge test a fixed current is allowed to flow and the voltage
response is registered. The performance of battery is determined as a function of its charge and
discharge conditions: a given rate is usually expressed as C/h, where h is the number of hours at
which the nominal charge of the battery (that involves both positive and negative electrode) will be
passed through. Studying a given electrode material, 1C is the charge corresponding to the total
expected oxidation/reduction of that electrode in one hour. It is sometimes convenient to consider
the specific capacity of an intercalation electrode material per weight (mAh/g) and hence express
the galvanostatic rate in current per active mass (mA/g).
Figure 42:Repeated GCPL: (a) current excitation plot and (b) corresponding voltage variation.
From the theoretical capacity, the rate of the charge/discharge can be determined and the anodic
and cathodic performance evaluated. In the specific case of the evaluation of a battery electrode
(or complete battery) the GCPL technique (Galvanostatic Cycle with Potential limitation), or
chronopotentiometry, consist in the application of controlled current between the working electrode
and the counter electrode. The working electrode potential and the electrolysis time are monitored
and recordered. The applied current causes the reduction (or oxidation) of the electroactive species
within the electrode. The current direction may be inverted after a certain time or at certain potential
value enabling the reversing of redox process.
With the application of constant current, several plateaus can be observed related to the presence
of two or more phase system.
4.4.3 Electrochemical Impedance spectroscopy (EIS)
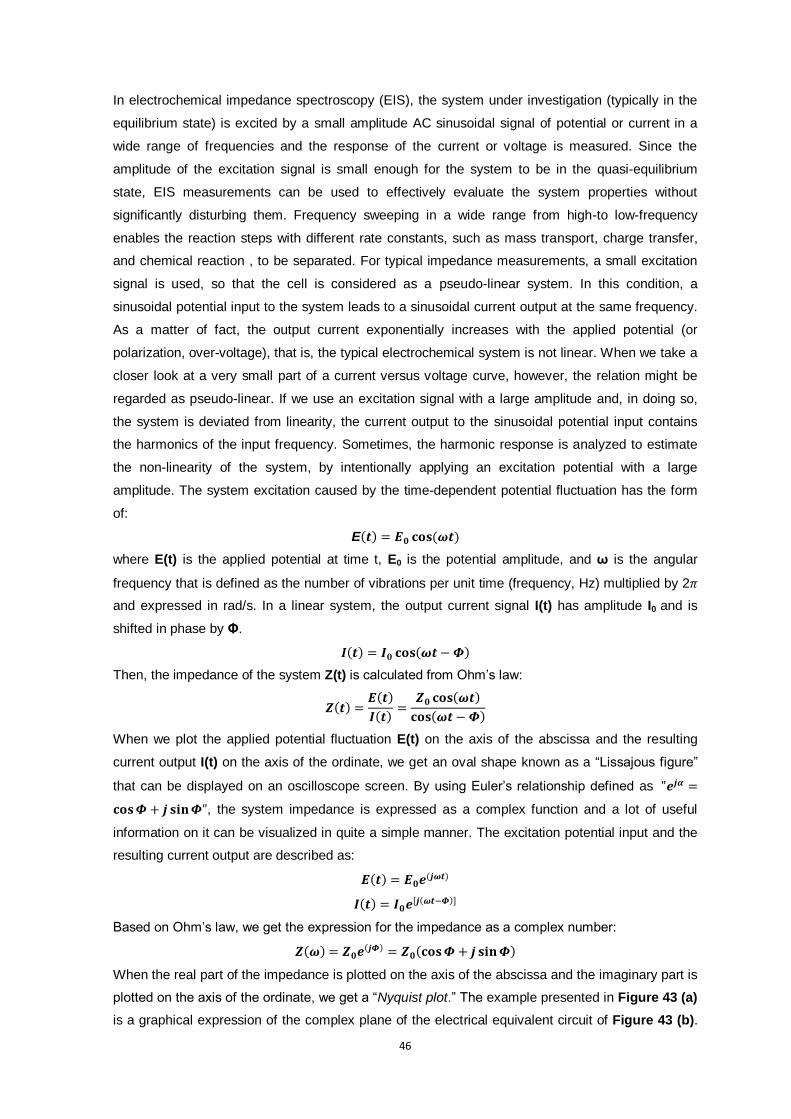
46
In electrochemical impedance spectroscopy (EIS), the system under investigation (typically in the
equilibrium state) is excited by a small amplitude AC sinusoidal signal of potential or current in a
wide range of frequencies and the response of the current or voltage is measured. Since the
amplitude of the excitation signal is small enough for the system to be in the quasi-equilibrium
state, EIS measurements can be used to effectively evaluate the system properties without
significantly disturbing them. Frequency sweeping in a wide range from high-to low-frequency
enables the reaction steps with different rate constants, such as mass transport, charge transfer,
and chemical reaction , to be separated. For typical impedance measurements, a small excitation
signal is used, so that the cell is considered as a pseudo-linear system. In this condition, a
sinusoidal potential input to the system leads to a sinusoidal current output at the same frequency.
As a matter of fact, the output current exponentially increases with the applied potential (or
polarization, over-voltage), that is, the typical electrochemical system is not linear. When we take a
closer look at a very small part of a current versus voltage curve, however, the relation might be
regarded as pseudo-linear. If we use an excitation signal with a large amplitude and, in doing so,
the system is deviated from linearity, the current output to the sinusoidal potential input contains
the harmonics of the input frequency. Sometimes, the harmonic response is analyzed to estimate
the non-linearity of the system, by intentionally applying an excitation potential with a large
amplitude. The system excitation caused by the time-dependent potential fluctuation has the form
of:
E(𝒕) = 𝑬𝟎 𝐜𝐨𝐬(𝝎𝒕)
where E(t) is the applied potential at time t, E0 is the potential amplitude, and ω is the angular
frequency that is defined as the number of vibrations per unit time (frequency, Hz) multiplied by 2𝜋
and expressed in rad/s. In a linear system, the output current signal I(t) has amplitude I0 and is
shifted in phase by Φ.
𝑰(𝒕) = 𝑰𝟎 𝐜𝐨𝐬(𝝎𝒕 − 𝜱)
Then, the impedance of the system Z(t) is calculated from Ohm’s law:
𝒁(𝒕) =𝑬(𝒕)
𝑰(𝒕)=
𝒁𝟎 𝐜𝐨𝐬(𝝎𝒕)
𝐜𝐨𝐬(𝝎𝒕 − 𝜱)
When we plot the applied potential fluctuation E(t) on the axis of the abscissa and the resulting
current output I(t) on the axis of the ordinate, we get an oval shape known as a “Lissajous figure”
that can be displayed on an oscilloscope screen. By using Euler’s relationship defined as "𝒆𝒋𝜶 =
𝐜𝐨𝐬 𝜱 + 𝒋 𝐬𝐢𝐧 𝜱", the system impedance is expressed as a complex function and a lot of useful
information on it can be visualized in quite a simple manner. The excitation potential input and the
resulting current output are described as:
𝑬(𝒕) = 𝑬𝟎𝒆(𝒋𝝎𝒕)
𝑰(𝒕) = 𝑰𝟎𝒆[𝒋(𝝎𝒕−𝜱)]
Based on Ohm’s law, we get the expression for the impedance as a complex number:
𝒁(𝝎) = 𝒁𝟎𝒆(𝒋𝜱) = 𝒁𝟎(𝐜𝐨𝐬 𝜱 + 𝒋 𝐬𝐢𝐧 𝜱)
When the real part of the impedance is plotted on the axis of the abscissa and the imaginary part is
plotted on the axis of the ordinate, we get a “Nyquist plot.” The example presented in Figure 43 (a)
is a graphical expression of the complex plane of the electrical equivalent circuit of Figure 43 (b).
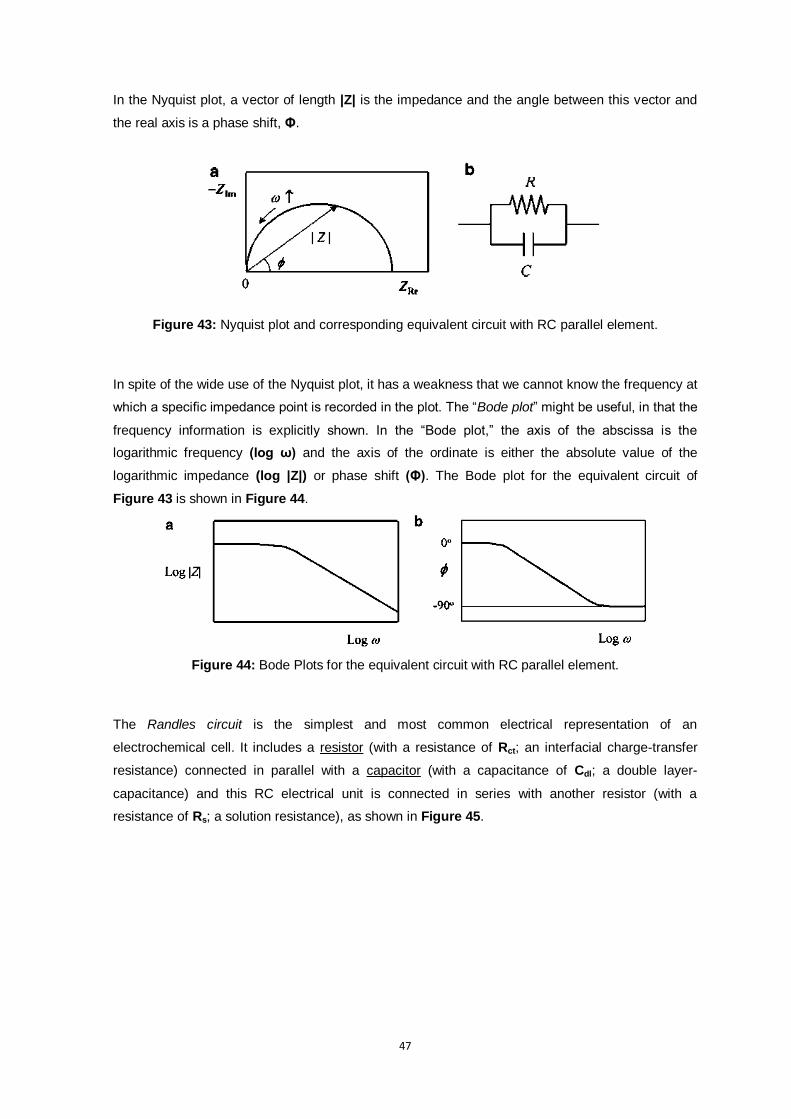
47
In the Nyquist plot, a vector of length |Z| is the impedance and the angle between this vector and
the real axis is a phase shift, Φ.
Figure 43: Nyquist plot and corresponding equivalent circuit with RC parallel element.
In spite of the wide use of the Nyquist plot, it has a weakness that we cannot know the frequency at
which a specific impedance point is recorded in the plot. The “Bode plot” might be useful, in that the
frequency information is explicitly shown. In the “Bode plot,” the axis of the abscissa is the
logarithmic frequency (log ω) and the axis of the ordinate is either the absolute value of the
logarithmic impedance (log |Z|) or phase shift (Φ). The Bode plot for the equivalent circuit of
Figure 43 is shown in Figure 44.
Figure 44: Bode Plots for the equivalent circuit with RC parallel element.
The Randles circuit is the simplest and most common electrical representation of an
electrochemical cell. It includes a resistor (with a resistance of Rct; an interfacial charge-transfer
resistance) connected in parallel with a capacitor (with a capacitance of Cdl; a double layer-
capacitance) and this RC electrical unit is connected in series with another resistor (with a
resistance of Rs; a solution resistance), as shown in Figure 45.
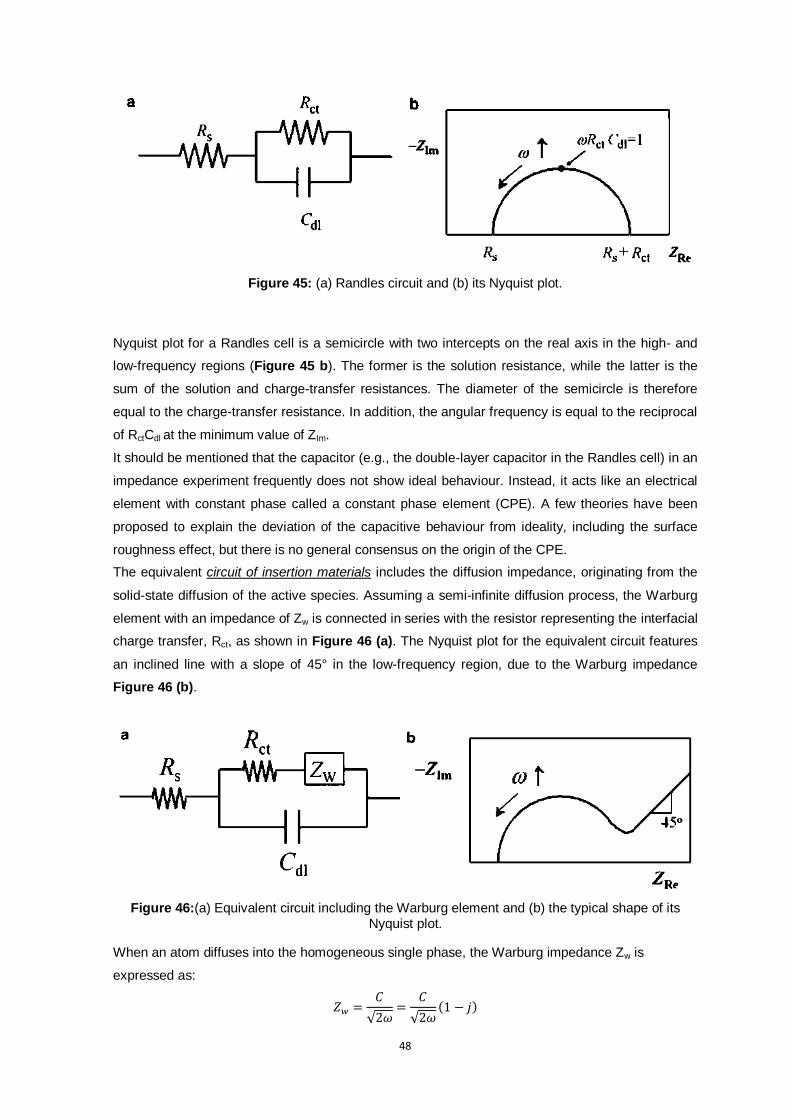
48
Figure 45: (a) Randles circuit and (b) its Nyquist plot.
Nyquist plot for a Randles cell is a semicircle with two intercepts on the real axis in the high- and
low-frequency regions (Figure 45 b). The former is the solution resistance, while the latter is the
sum of the solution and charge-transfer resistances. The diameter of the semicircle is therefore
equal to the charge-transfer resistance. In addition, the angular frequency is equal to the reciprocal
of RctCdl at the minimum value of ZIm.
It should be mentioned that the capacitor (e.g., the double-layer capacitor in the Randles cell) in an
impedance experiment frequently does not show ideal behaviour. Instead, it acts like an electrical
element with constant phase called a constant phase element (CPE). A few theories have been
proposed to explain the deviation of the capacitive behaviour from ideality, including the surface
roughness effect, but there is no general consensus on the origin of the CPE.
The equivalent circuit of insertion materials includes the diffusion impedance, originating from the
solid-state diffusion of the active species. Assuming a semi-infinite diffusion process, the Warburg
element with an impedance of Zw is connected in series with the resistor representing the interfacial
charge transfer, Rct, as shown in Figure 46 (a). The Nyquist plot for the equivalent circuit features
an inclined line with a slope of 45° in the low-frequency region, due to the Warburg impedance
Figure 46 (b).
Figure 46:(a) Equivalent circuit including the Warburg element and (b) the typical shape of its Nyquist plot.
When an atom diffuses into the homogeneous single phase, the Warburg impedance Zw is
expressed as:
𝑍𝑤 =𝐶
√2𝜔=
𝐶
√2𝜔(1 − 𝑗)
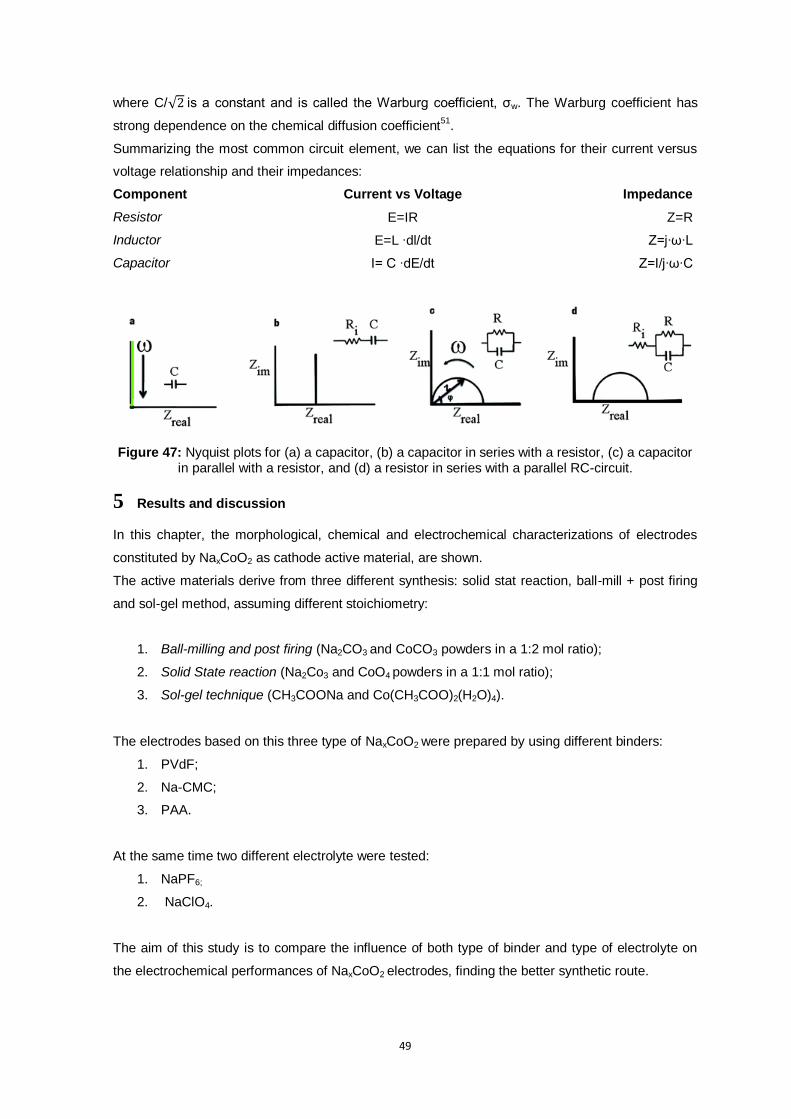
49
where C/√2 is a constant and is called the Warburg coefficient, σw. The Warburg coefficient has
strong dependence on the chemical diffusion coefficient51
.
Summarizing the most common circuit element, we can list the equations for their current versus
voltage relationship and their impedances:
Component Current vs Voltage Impedance
Resistor E=IR Z=R
Inductor E=L ∙dl/dt Z=j∙ω∙L
Capacitor I= C ∙dE/dt Z=I/j∙ω∙C
Figure 47: Nyquist plots for (a) a capacitor, (b) a capacitor in series with a resistor, (c) a capacitor in parallel with a resistor, and (d) a resistor in series with a parallel RC-circuit.
5 Results and discussion
In this chapter, the morphological, chemical and electrochemical characterizations of electrodes
constituted by NaxCoO2 as cathode active material, are shown.
The active materials derive from three different synthesis: solid stat reaction, ball-mill + post firing
and sol-gel method, assuming different stoichiometry:
1. Ball-milling and post firing (Na2CO3 and CoCO3 powders in a 1:2 mol ratio);
2. Solid State reaction (Na2Co3 and CoO4 powders in a 1:1 mol ratio);
3. Sol-gel technique (CH3COONa and Co(CH3COO)2(H2O)4).
The electrodes based on this three type of NaxCoO2 were prepared by using different binders:
1. PVdF;
2. Na-CMC;
3. PAA.
At the same time two different electrolyte were tested:
1. NaPF6;
2. NaClO4.
The aim of this study is to compare the influence of both type of binder and type of electrolyte on
the electrochemical performances of NaxCoO2 electrodes, finding the better synthetic route.
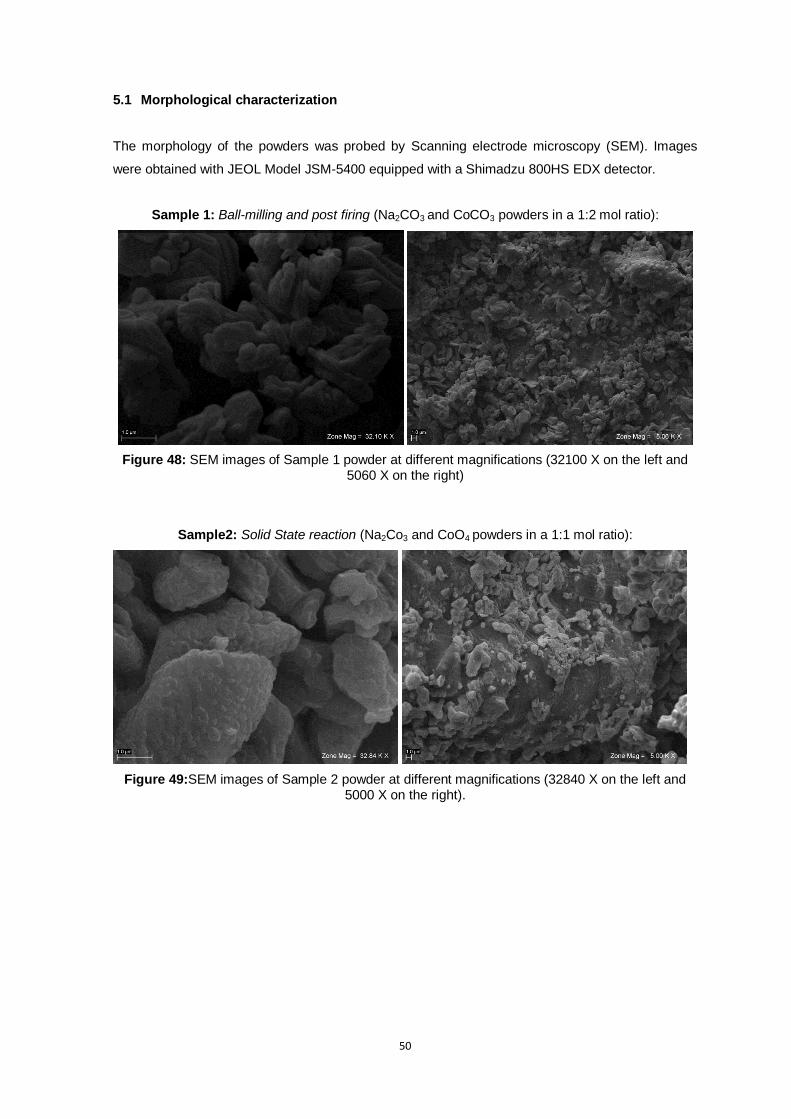
50
5.1 Morphological characterization
The morphology of the powders was probed by Scanning electrode microscopy (SEM). Images
were obtained with JEOL Model JSM-5400 equipped with a Shimadzu 800HS EDX detector.
Sample 1: Ball-milling and post firing (Na2CO3 and CoCO3 powders in a 1:2 mol ratio):
Figure 48: SEM images of Sample 1 powder at different magnifications (32100 X on the left and 5060 X on the right)
Sample2: Solid State reaction (Na2Co3 and CoO4 powders in a 1:1 mol ratio):
Figure 49:SEM images of Sample 2 powder at different magnifications (32840 X on the left and 5000 X on the right).
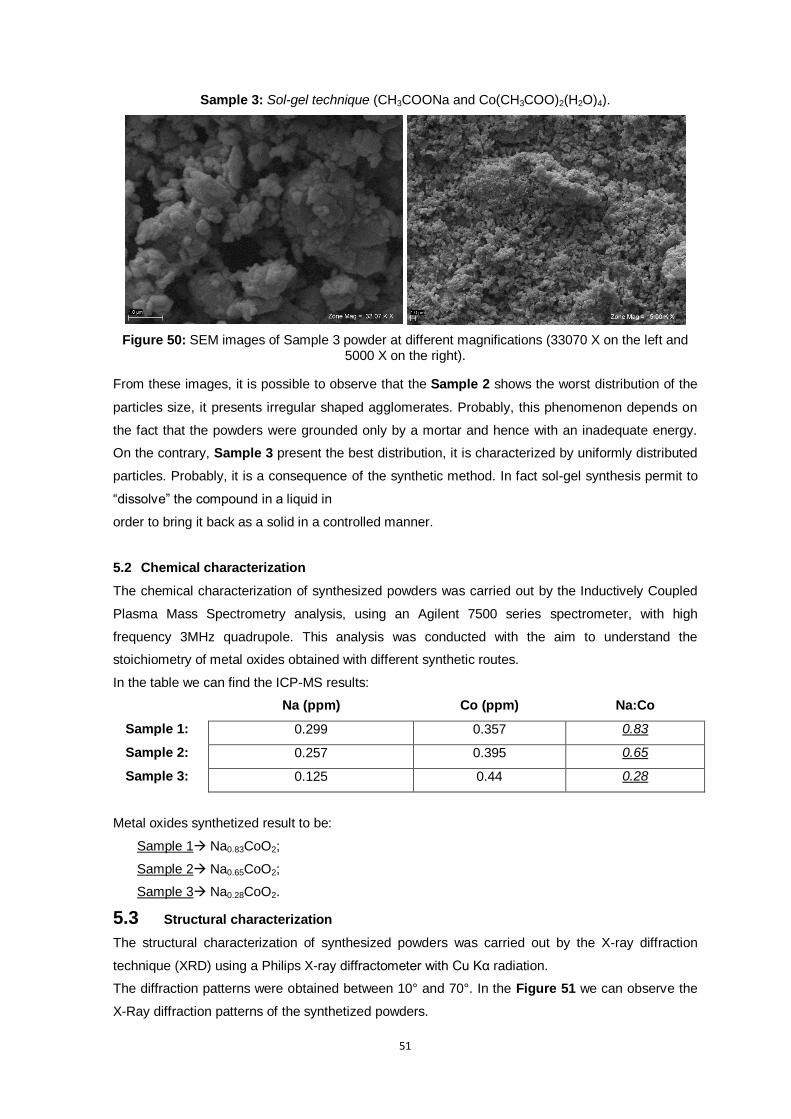
51
Sample 3: Sol-gel technique (CH3COONa and Co(CH3COO)2(H2O)4).
Figure 50: SEM images of Sample 3 powder at different magnifications (33070 X on the left and 5000 X on the right).
From these images, it is possible to observe that the Sample 2 shows the worst distribution of the
particles size, it presents irregular shaped agglomerates. Probably, this phenomenon depends on
the fact that the powders were grounded only by a mortar and hence with an inadequate energy.
On the contrary, Sample 3 present the best distribution, it is characterized by uniformly distributed
particles. Probably, it is a consequence of the synthetic method. In fact sol-gel synthesis permit to
“dissolve” the compound in a liquid in
order to bring it back as a solid in a controlled manner.
5.2 Chemical characterization
The chemical characterization of synthesized powders was carried out by the Inductively Coupled
Plasma Mass Spectrometry analysis, using an Agilent 7500 series spectrometer, with high
frequency 3MHz quadrupole. This analysis was conducted with the aim to understand the
stoichiometry of metal oxides obtained with different synthetic routes.
In the table we can find the ICP-MS results:
Na (ppm) Co (ppm) Na:Co
Sample 1: 0.299 0.357 0.83
Sample 2: 0.257 0.395 0.65
Sample 3: 0.125 0.44 0.28
Metal oxides synthetized result to be:
Sample 1 Na0.83CoO2;
Sample 2 Na0.65CoO2;
Sample 3 Na0.28CoO2.
5.3 Structural characterization
The structural characterization of synthesized powders was carried out by the X-ray diffraction
technique (XRD) using a Philips X-ray diffractometer with Cu Kα radiation.
The diffraction patterns were obtained between 10° and 70°. In the Figure 51 we can observe the
X-Ray diffraction patterns of the synthetized powders.
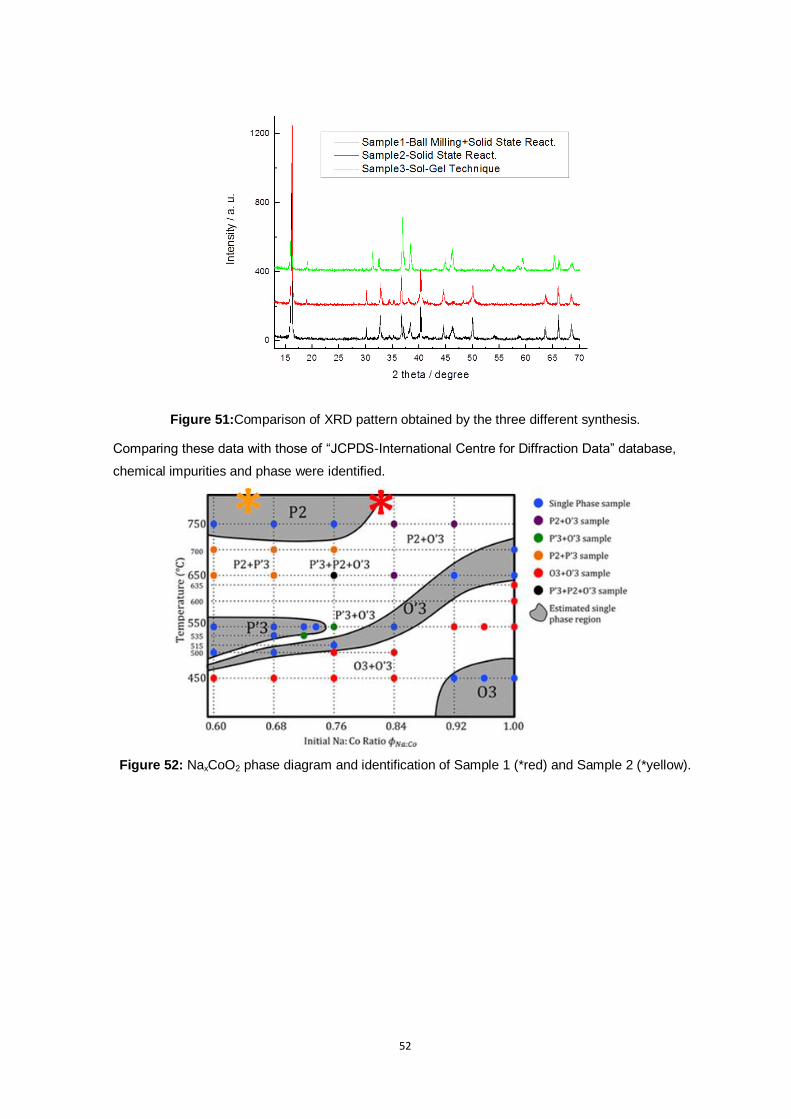
52
Figure 51:Comparison of XRD pattern obtained by the three different synthesis.
Comparing these data with those of “JCPDS-International Centre for Diffraction Data” database,
chemical impurities and phase were identified.
Figure 52: NaxCoO2 phase diagram and identification of Sample 1 (*red) and Sample 2 (*yellow).
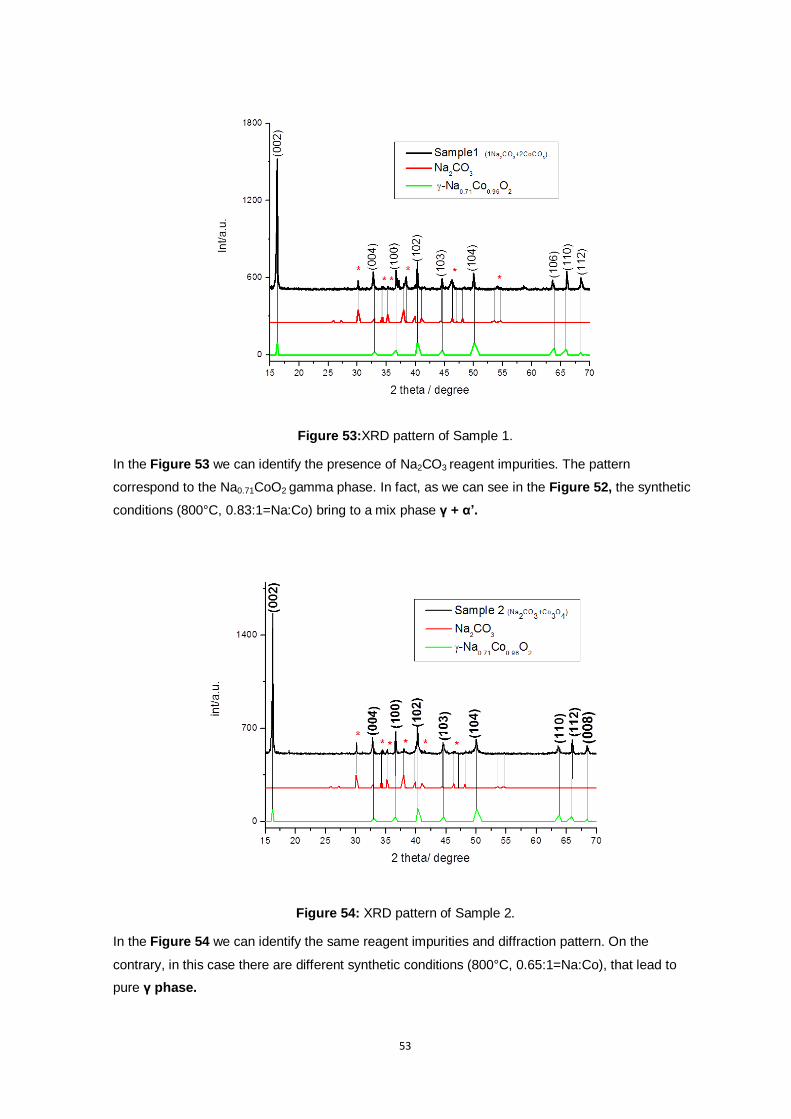
53
Figure 53:XRD pattern of Sample 1.
In the Figure 53 we can identify the presence of Na2CO3 reagent impurities. The pattern
correspond to the Na0.71CoO2 gamma phase. In fact, as we can see in the Figure 52, the synthetic
conditions (800°C, 0.83:1=Na:Co) bring to a mix phase γ + α’.
Figure 54: XRD pattern of Sample 2.
In the Figure 54 we can identify the same reagent impurities and diffraction pattern. On the
contrary, in this case there are different synthetic conditions (800°C, 0.65:1=Na:Co), that lead to
pure γ phase.
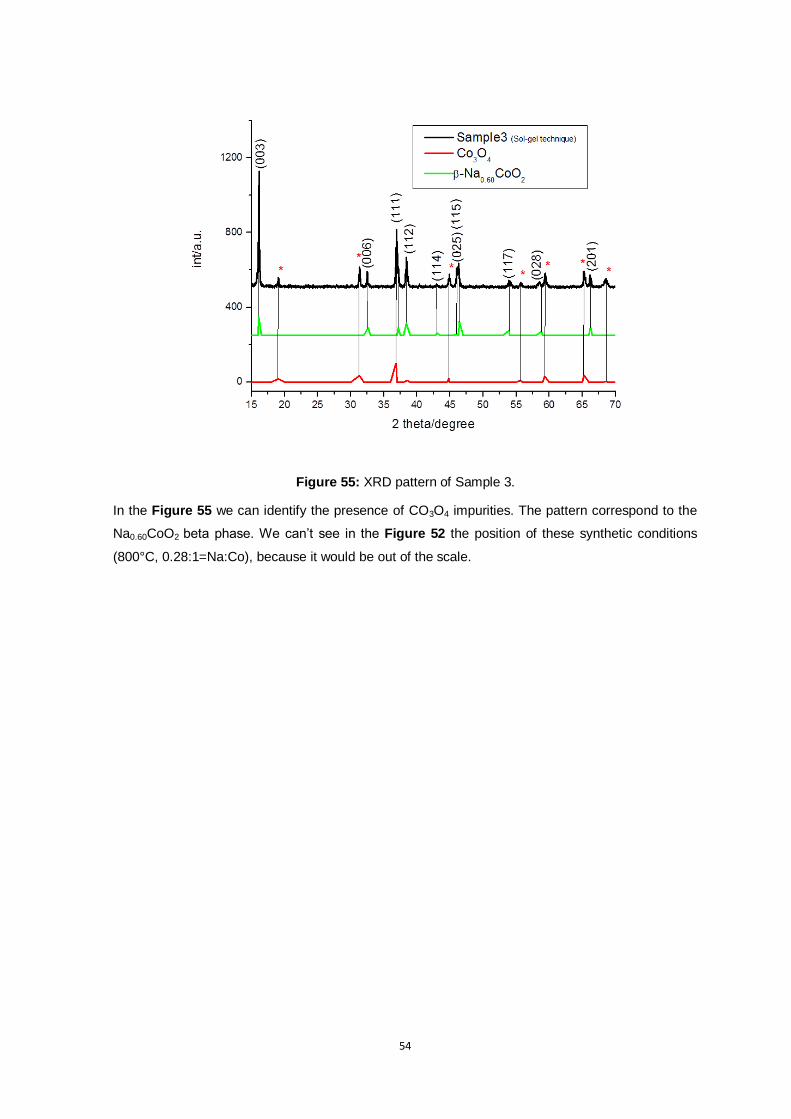
54
Figure 55: XRD pattern of Sample 3.
In the Figure 55 we can identify the presence of CO3O4 impurities. The pattern correspond to the
Na0.60CoO2 beta phase. We can’t see in the Figure 52 the position of these synthetic conditions
(800°C, 0.28:1=Na:Co), because it would be out of the scale.

55
5.4 Electrodes processing procedure
Three different type of binder were used in order to make layers, each one presents a different
preparation technique.
PVdF
Three different layer, for each powder synthetized, were manufactured using Polyvinylidene
fluoride.
Sample: Name of layer:
1 Co01
2 Co02
3 Co03
These layers have been prepared by casting a slurry of NaxCoO2 (active material), Super C65
(conductive carbon) and PVdF (binder) in NM2P (solvent), whose composition is shown in
Table 56.
NaxCoO2 80%
PVdF(5%wt) 10%
Super C 65 10%
NM2P 1.2 ml
Table 56: Percentage composition of Co01, Co02 and Co03 layers.
A solution of PVdF 5% in NMP (0.95 ml) .has been prepared into a vial. NaxCoO2 and SC65 have
been mixed finely in a mortar to obtain an homogeneous powder and then they have been poured
into the same vial which contains the solution of binder. Then, 0.25 mL of NM2P have been added
in order to obtain a suspension liquid enough. The slurry has been stirred overnight with a
magnetic anchor. The mixture has been stratified on an Al foil, scratched by employing sandpaper,
through Doctor Blade technique setting a thickness of 200 µm. The obtained layers has been dried
at 50°C, under hood, in order to remove completely the solvent. Several circular electrodes with
diameter of 9mm, have been cut before (Co01B, Co02B and Co03B) and after (Co01A, Co02A and
Co03A) the use of a roll press.
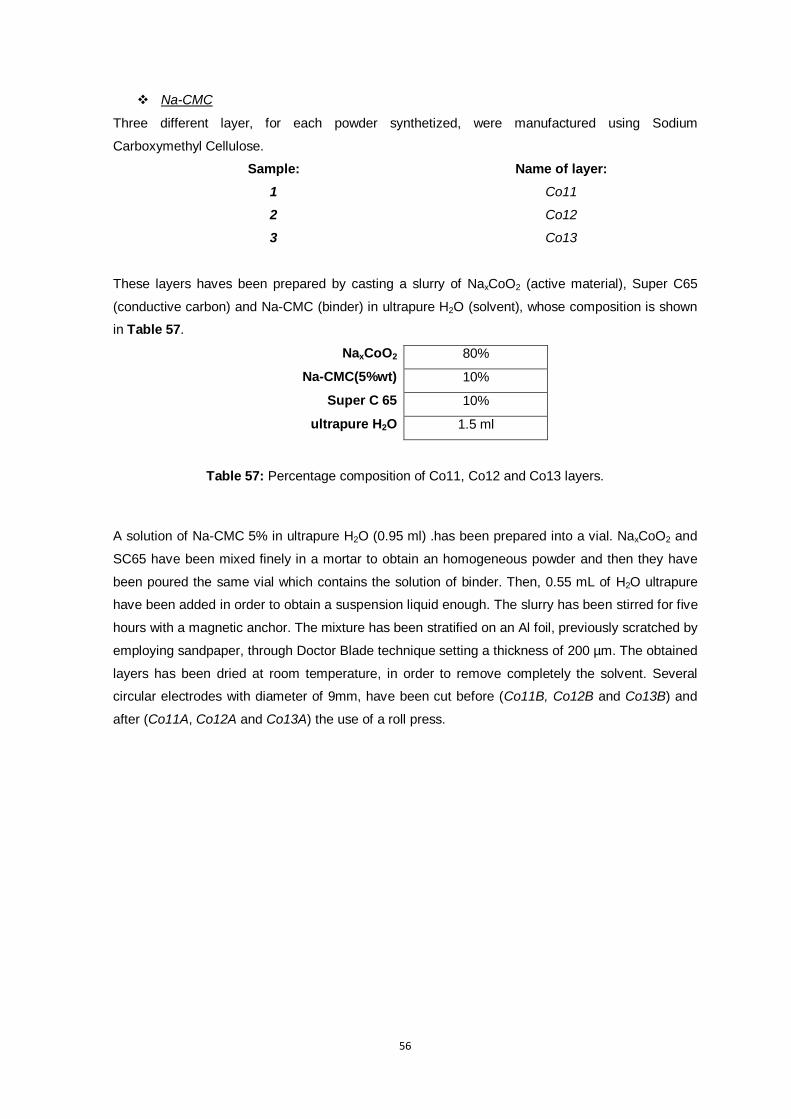
56
Na-CMC
Three different layer, for each powder synthetized, were manufactured using Sodium
Carboxymethyl Cellulose.
Sample: Name of layer:
1 Co11
2 Co12
3 Co13
These layers haves been prepared by casting a slurry of NaxCoO2 (active material), Super C65
(conductive carbon) and Na-CMC (binder) in ultrapure H2O (solvent), whose composition is shown
in Table 57.
NaxCoO2 80%
Na-CMC(5%wt) 10%
Super C 65 10%
ultrapure H2O 1.5 ml
Table 57: Percentage composition of Co11, Co12 and Co13 layers.
A solution of Na-CMC 5% in ultrapure H2O (0.95 ml) .has been prepared into a vial. NaxCoO2 and
SC65 have been mixed finely in a mortar to obtain an homogeneous powder and then they have
been poured the same vial which contains the solution of binder. Then, 0.55 mL of H2O ultrapure
have been added in order to obtain a suspension liquid enough. The slurry has been stirred for five
hours with a magnetic anchor. The mixture has been stratified on an Al foil, previously scratched by
employing sandpaper, through Doctor Blade technique setting a thickness of 200 µm. The obtained
layers has been dried at room temperature, in order to remove completely the solvent. Several
circular electrodes with diameter of 9mm, have been cut before (Co11B, Co12B and Co13B) and
after (Co11A, Co12A and Co13A) the use of a roll press.
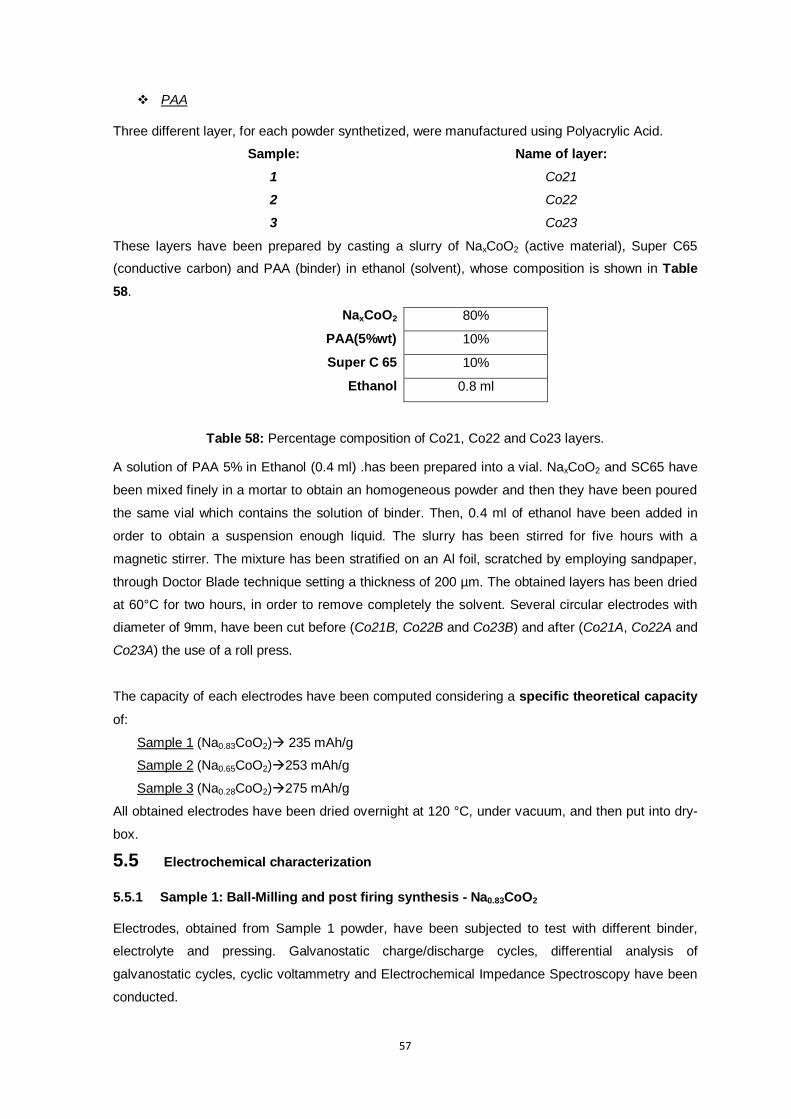
57
PAA
Three different layer, for each powder synthetized, were manufactured using Polyacrylic Acid.
Sample: Name of layer:
1 Co21
2 Co22
3 Co23
These layers have been prepared by casting a slurry of NaxCoO2 (active material), Super C65
(conductive carbon) and PAA (binder) in ethanol (solvent), whose composition is shown in Table
58.
NaxCoO2 80%
PAA(5%wt) 10%
Super C 65 10%
Ethanol 0.8 ml
Table 58: Percentage composition of Co21, Co22 and Co23 layers.
A solution of PAA 5% in Ethanol (0.4 ml) .has been prepared into a vial. NaxCoO2 and SC65 have
been mixed finely in a mortar to obtain an homogeneous powder and then they have been poured
the same vial which contains the solution of binder. Then, 0.4 ml of ethanol have been added in
order to obtain a suspension enough liquid. The slurry has been stirred for five hours with a
magnetic stirrer. The mixture has been stratified on an Al foil, scratched by employing sandpaper,
through Doctor Blade technique setting a thickness of 200 µm. The obtained layers has been dried
at 60°C for two hours, in order to remove completely the solvent. Several circular electrodes with
diameter of 9mm, have been cut before (Co21B, Co22B and Co23B) and after (Co21A, Co22A and
Co23A) the use of a roll press.
The capacity of each electrodes have been computed considering a specific theoretical capacity
of:
Sample 1 (Na0.83CoO2) 235 mAh/g
Sample 2 (Na0.65CoO2)253 mAh/g
Sample 3 (Na0.28CoO2)275 mAh/g
All obtained electrodes have been dried overnight at 120 °C, under vacuum, and then put into dry-
box.
5.5 Electrochemical characterization
5.5.1 Sample 1: Ball-Milling and post firing synthesis - Na0.83CoO2
Electrodes, obtained from Sample 1 powder, have been subjected to test with different binder,
electrolyte and pressing. Galvanostatic charge/discharge cycles, differential analysis of
galvanostatic cycles, cyclic voltammetry and Electrochemical Impedance Spectroscopy have been
conducted.
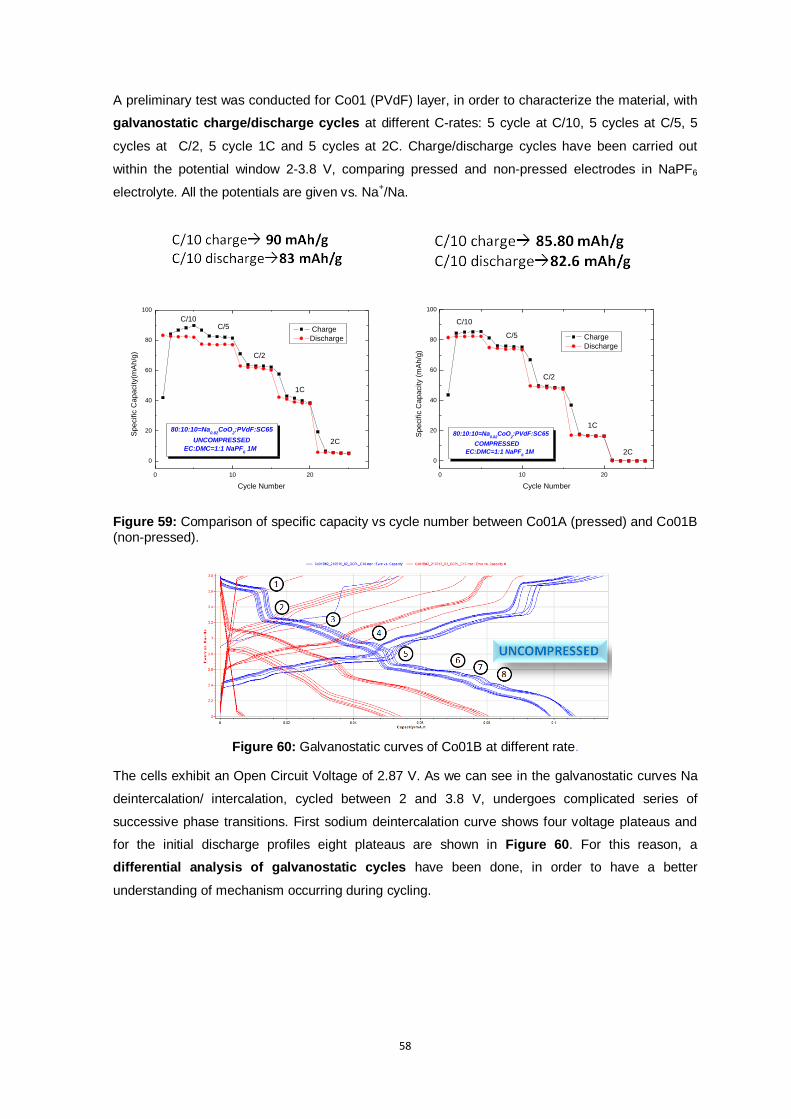
58
A preliminary test was conducted for Co01 (PVdF) layer, in order to characterize the material, with
galvanostatic charge/discharge cycles at different C-rates: 5 cycle at C/10, 5 cycles at C/5, 5
cycles at C/2, 5 cycle 1C and 5 cycles at 2C. Charge/discharge cycles have been carried out
within the potential window 2-3.8 V, comparing pressed and non-pressed electrodes in NaPF6
electrolyte. All the potentials are given vs. Na+/Na.
Figure 59: Comparison of specific capacity vs cycle number between Co01A (pressed) and Co01B (non-pressed).
Figure 60: Galvanostatic curves of Co01B at different rate.
The cells exhibit an Open Circuit Voltage of 2.87 V. As we can see in the galvanostatic curves Na
deintercalation/ intercalation, cycled between 2 and 3.8 V, undergoes complicated series of
successive phase transitions. First sodium deintercalation curve shows four voltage plateaus and
for the initial discharge profiles eight plateaus are shown in Figure 60. For this reason, a
differential analysis of galvanostatic cycles have been done, in order to have a better
understanding of mechanism occurring during cycling.
0 10 20
0
20
40
60
80
100
Sp
ecific
Ca
pa
city(m
Ah
/g)
Cycle Number
Charge
Discharge
C/10C/5
C/2
1C
2C
80:10:10=Na0.82
CoO2:PVdF:SC65
UNCOMPRESSED
EC:DMC=1:1 NaPF6 1M
0 10 20
0
20
40
60
80
100
80:10:10=Na0.82
CoO2:PVdF:SC65
COMPRESSED
EC:DMC=1:1 NaPF6 1M
Sp
ecific
Ca
pa
city (
mA
h/g
)
Cycle Number
Charge
Discharge
C/10
C/5
C/2
1C
2C

59
.
Figure 61: dQ/dE vs E curves of Co01A at different rate.
At this point an optimization of this type of active material was conducted with three type of binders,
comparing pressing conditions, differents potential windows and two different electrolyte.
In the following figures are depict the rate capabilities of Co01 (PVdF/Sample1) layers in different
electrochemical environments.
Co01B
2,0 2,2 2,4 2,6 2,8 3,0 3,2 3,4 3,6 3,8-300
-200
-100
0
100
200
300
400
500
600
dQ
/dE
(m
Ah
/gV
)
E (V vs Na+/Na)
1st
cycle C/10
2nd
cycle C/10
3rd
cycle C/10
2,0 2,2 2,4 2,6 2,8 3,0 3,2 3,4 3,6 3,8-200
-100
0
100
200
300
400
500
600
700
dQ
/dE
(mA
h/g
V)
E(V vs Na+/Na)
1st
cycle C/5
2nd
cycle C/5
3rd
cycle C/5
2,0 2,2 2,4 2,6 2,8 3,0 3,2 3,4 3,6 3,8
-200
0
200
400
600
dQ
/dE
(m
Ah
/Vg
)
E(V vs Na+/Na)
1st
cycle C/2
2nd
cycle C/2
3rd
cycle C/2
2,0 2,2 2,4 2,6 2,8 3,0 3,2 3,4 3,6 3,8
-200
0
200
400
600
dQ
/dE
(m
Ah
/gV
)
E (V vs Na+/Na)
1st cycle 1C
2nd cycle 1C
3rd cycle 1C
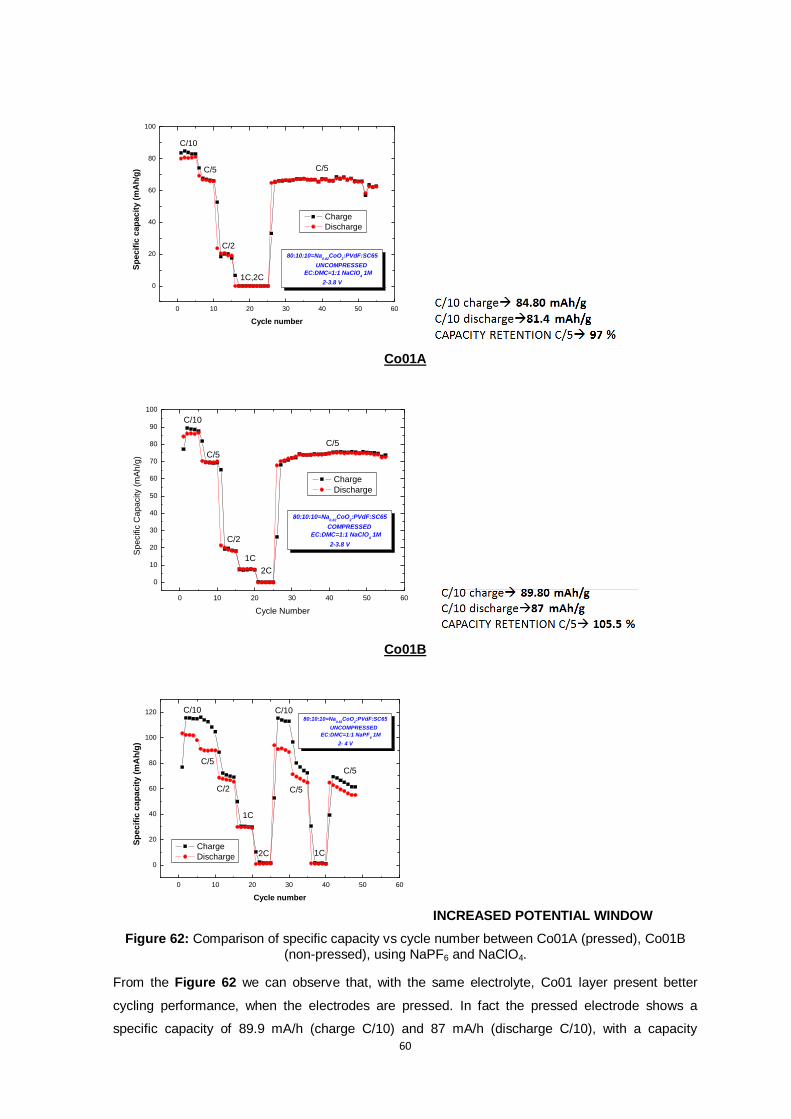
60
Co01A
Co01B
INCREASED POTENTIAL WINDOW
Figure 62: Comparison of specific capacity vs cycle number between Co01A (pressed), Co01B (non-pressed), using NaPF6 and NaClO4.
From the Figure 62 we can observe that, with the same electrolyte, Co01 layer present better
cycling performance, when the electrodes are pressed. In fact the pressed electrode shows a
specific capacity of 89.9 mA/h (charge C/10) and 87 mA/h (discharge C/10), with a capacity
0 10 20 30 40 50 60
0
20
40
60
80
100
80:10:10=Na0.82
CoO2:PVdF:SC65
UNCOMPRESSED
EC:DMC=1:1 NaClO4 1M
2-3.8 V
C/5
Sp
ec
ific
ca
pa
cit
y (
mA
h/g
)
Cycle number
Charge
Discharge
C/10
C/5
C/2
1C,2C
0 10 20 30 40 50 60
0
10
20
30
40
50
60
70
80
90
100
80:10:10=Na0.82
CoO2:PVdF:SC65
COMPRESSED
EC:DMC=1:1 NaClO4 1M
2-3.8 V
Sp
ecific
Ca
pa
city (
mA
h/g
)
Cycle Number
Charge
Discharge
C/10
C/5
C/2
1C
2C
C/5
0 10 20 30 40 50 60
0
20
40
60
80
100
120
80:10:10=Na0.82
CoO2:PVdF:SC65
UNCOMPRESSED
EC:DMC=1:1 NaPF6 1M
2- 4 V
Sp
ec
ific
ca
pa
cit
y (
mA
h/g
)
Cycle number
Charge
Discharge
C/10
C/5
C/2
1C
2C
C/10
C/5
1C
C/5
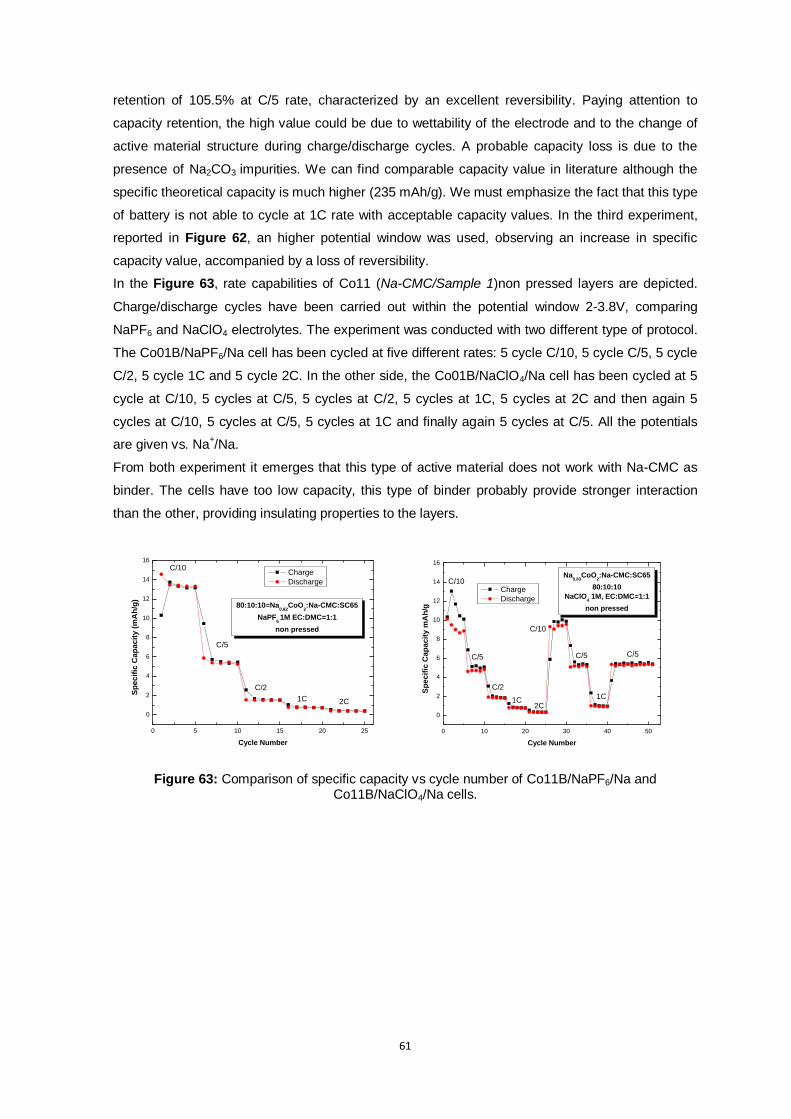
61
retention of 105.5% at C/5 rate, characterized by an excellent reversibility. Paying attention to
capacity retention, the high value could be due to wettability of the electrode and to the change of
active material structure during charge/discharge cycles. A probable capacity loss is due to the
presence of Na2CO3 impurities. We can find comparable capacity value in literature although the
specific theoretical capacity is much higher (235 mAh/g). We must emphasize the fact that this type
of battery is not able to cycle at 1C rate with acceptable capacity values. In the third experiment,
reported in Figure 62, an higher potential window was used, observing an increase in specific
capacity value, accompanied by a loss of reversibility.
In the Figure 63, rate capabilities of Co11 (Na-CMC/Sample 1)non pressed layers are depicted.
Charge/discharge cycles have been carried out within the potential window 2-3.8V, comparing
NaPF6 and NaClO4 electrolytes. The experiment was conducted with two different type of protocol.
The Co01B/NaPF6/Na cell has been cycled at five different rates: 5 cycle C/10, 5 cycle C/5, 5 cycle
C/2, 5 cycle 1C and 5 cycle 2C. In the other side, the Co01B/NaClO4/Na cell has been cycled at 5
cycle at C/10, 5 cycles at C/5, 5 cycles at C/2, 5 cycles at 1C, 5 cycles at 2C and then again 5
cycles at C/10, 5 cycles at C/5, 5 cycles at 1C and finally again 5 cycles at C/5. All the potentials
are given vs. Na+/Na.
From both experiment it emerges that this type of active material does not work with Na-CMC as
binder. The cells have too low capacity, this type of binder probably provide stronger interaction
than the other, providing insulating properties to the layers.
Figure 63: Comparison of specific capacity vs cycle number of Co11B/NaPF6/Na and Co11B/NaClO4/Na cells.
0 5 10 15 20 25
0
2
4
6
8
10
12
14
16
Sp
ec
ific
Ca
pa
cit
y (
mA
h/g
)
Cycle Number
Charge
Discharge
C/10
C/5
C/2
1C 2C
80:10:10=Na0.82
CoO2:Na-CMC:SC65
NaPF6 1M EC:DMC=1:1
non pressed
0 10 20 30 40 50
0
2
4
6
8
10
12
14
16
Sp
ec
ific
Ca
pa
cit
y m
Ah
/g
Cycle Number
Charge
Discharge
C/10
C/5
C/2
1C2C
C/10
C/5
1C
C/5
Na0.83
CoO2:Na-CMC:SC65
80:10:10
NaClO4 1M, EC:DMC=1:1
non pressed
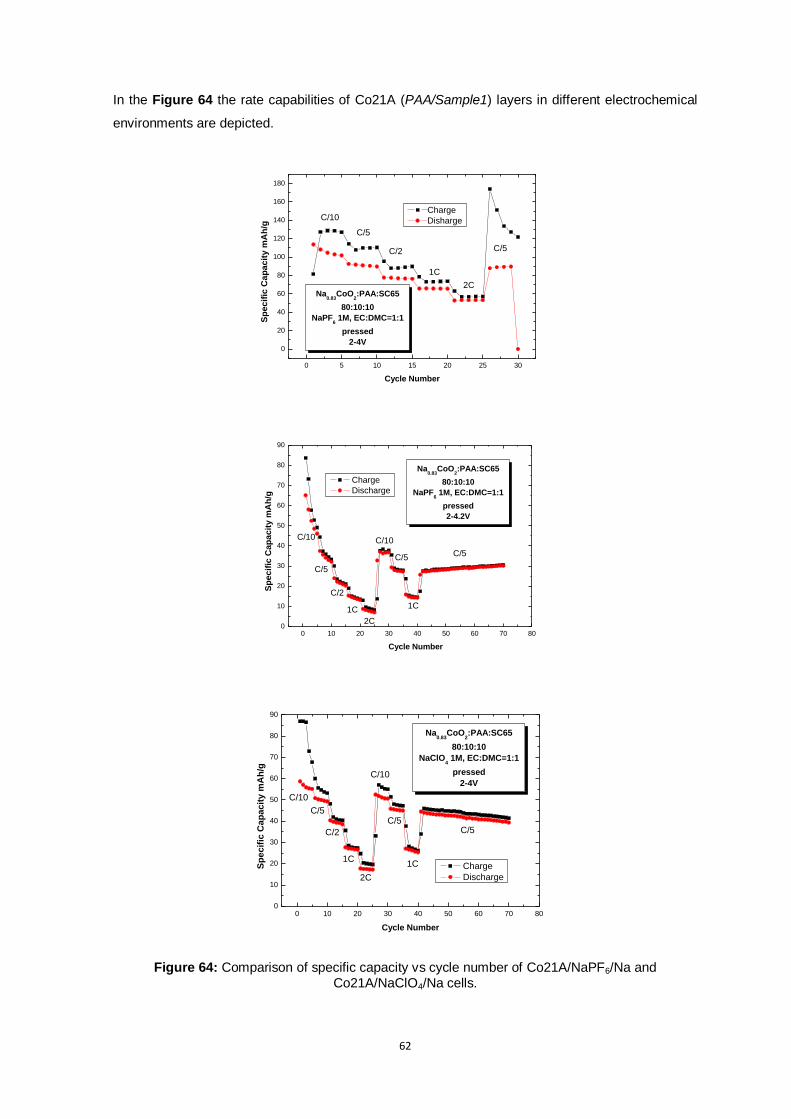
62
In the Figure 64 the rate capabilities of Co21A (PAA/Sample1) layers in different electrochemical
environments are depicted.
Figure 64: Comparison of specific capacity vs cycle number of Co21A/NaPF6/Na and Co21A/NaClO4/Na cells.
0 5 10 15 20 25 30
0
20
40
60
80
100
120
140
160
180
Na0.83
CoO2:PAA:SC65
80:10:10
NaPF6 1M, EC:DMC=1:1
pressed
2-4V
Sp
ec
ific
Ca
pa
cit
y m
Ah
/g
Cycle Number
Charge
DishargeC/10
C/5
C/2
1C
2C
C/5
0 10 20 30 40 50 60 70 800
10
20
30
40
50
60
70
80
90
C/5
1C
C/5
C/10
Na0.83
CoO2:PAA:SC65
80:10:10
NaPF6 1M, EC:DMC=1:1
pressed
2-4.2V
Sp
ec
ific
Ca
pa
cit
y m
Ah
/g
Cycle Number
Charge
Discharge
C/10
C/5
C/2
1C
2C
0 10 20 30 40 50 60 70 800
10
20
30
40
50
60
70
80
90
C/5
1C
C/5
C/10
Na0.83
CoO2:PAA:SC65
80:10:10
NaClO4 1M, EC:DMC=1:1
pressed
2-4V
Sp
ec
ific
Ca
pa
cit
y m
Ah
/g
Cycle Number
Charge
Discharge
C/10
C/5
C/2
1C
2C
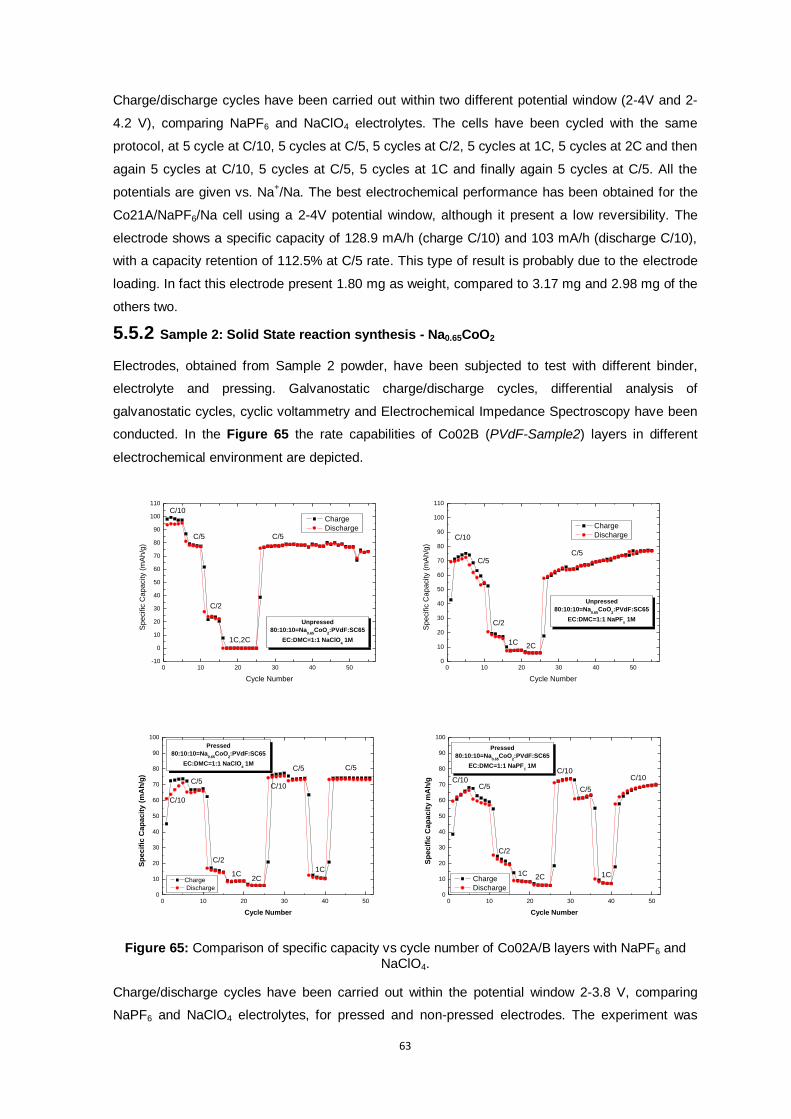
63
Charge/discharge cycles have been carried out within two different potential window (2-4V and 2-
4.2 V), comparing NaPF6 and NaClO4 electrolytes. The cells have been cycled with the same
protocol, at 5 cycle at C/10, 5 cycles at C/5, 5 cycles at C/2, 5 cycles at 1C, 5 cycles at 2C and then
again 5 cycles at C/10, 5 cycles at C/5, 5 cycles at 1C and finally again 5 cycles at C/5. All the
potentials are given vs. Na+/Na. The best electrochemical performance has been obtained for the
Co21A/NaPF6/Na cell using a 2-4V potential window, although it present a low reversibility. The
electrode shows a specific capacity of 128.9 mA/h (charge C/10) and 103 mA/h (discharge C/10),
with a capacity retention of 112.5% at C/5 rate. This type of result is probably due to the electrode
loading. In fact this electrode present 1.80 mg as weight, compared to 3.17 mg and 2.98 mg of the
others two.
5.5.2 Sample 2: Solid State reaction synthesis - Na0.65CoO2
Electrodes, obtained from Sample 2 powder, have been subjected to test with different binder,
electrolyte and pressing. Galvanostatic charge/discharge cycles, differential analysis of
galvanostatic cycles, cyclic voltammetry and Electrochemical Impedance Spectroscopy have been
conducted. In the Figure 65 the rate capabilities of Co02B (PVdF-Sample2) layers in different
electrochemical environment are depicted.
Figure 65: Comparison of specific capacity vs cycle number of Co02A/B layers with NaPF6 and NaClO4.
Charge/discharge cycles have been carried out within the potential window 2-3.8 V, comparing
NaPF6 and NaClO4 electrolytes, for pressed and non-pressed electrodes. The experiment was
0 10 20 30 40 50-10
0
10
20
30
40
50
60
70
80
90
100
110
Sp
ecific
Ca
pa
city (
mA
h/g
)
Cycle Number
Charge
Discharge
C/10
C/5
C/2
1C,2C
C/5
Unpressed
80:10:10=Na0.65
CoO2:PVdF:SC65
EC:DMC=1:1 NaClO4 1M
0 10 20 30 40 500
10
20
30
40
50
60
70
80
90
100
110
Unpressed
80:10:10=Na0.65
CoO2:PVdF:SC65
EC:DMC=1:1 NaPF6 1M
Sp
ecific
Ca
pa
city (
mA
h/g
)
Cycle Number
Charge
DischargeC/10
C/5
C/2
1C2C
C/5
0 10 20 30 40 500
10
20
30
40
50
60
70
80
90
100
Pressed
80:10:10=Na0.65
CoO2:PVdF:SC65
EC:DMC=1:1 NaClO4 1M
Sp
ec
ific
Ca
pa
cit
y (
mA
h/g
)
Cycle Number
Charge
Discharge
C/10
C/5
C/2
1C2C
C/10
C/5
1C
C/5
0 10 20 30 40 500
10
20
30
40
50
60
70
80
90
100
Pressed
80:10:10=Na0.65
CoO2:PVdF:SC65
EC:DMC=1:1 NaPF6 1M
Sp
ec
ific
Ca
pa
cit
y m
Ah
/g
Cycle Number
Charge
Discharge
C/10C/5
C/2
1C 2C
C/10
C/5
1C
C/10
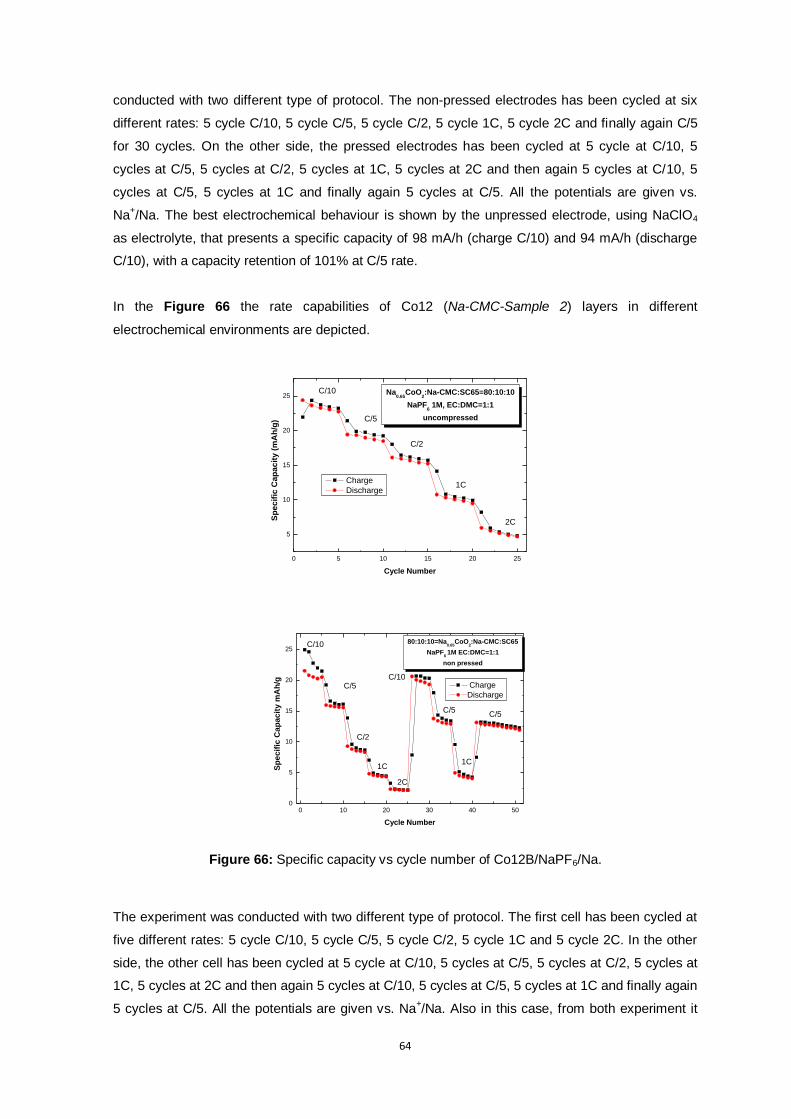
64
conducted with two different type of protocol. The non-pressed electrodes has been cycled at six
different rates: 5 cycle C/10, 5 cycle C/5, 5 cycle C/2, 5 cycle 1C, 5 cycle 2C and finally again C/5
for 30 cycles. On the other side, the pressed electrodes has been cycled at 5 cycle at C/10, 5
cycles at C/5, 5 cycles at C/2, 5 cycles at 1C, 5 cycles at 2C and then again 5 cycles at C/10, 5
cycles at C/5, 5 cycles at 1C and finally again 5 cycles at C/5. All the potentials are given vs.
Na+/Na. The best electrochemical behaviour is shown by the unpressed electrode, using NaClO4
as electrolyte, that presents a specific capacity of 98 mA/h (charge C/10) and 94 mA/h (discharge
C/10), with a capacity retention of 101% at C/5 rate.
In the Figure 66 the rate capabilities of Co12 (Na-CMC-Sample 2) layers in different
electrochemical environments are depicted.
Figure 66: Specific capacity vs cycle number of Co12B/NaPF6/Na.
The experiment was conducted with two different type of protocol. The first cell has been cycled at
five different rates: 5 cycle C/10, 5 cycle C/5, 5 cycle C/2, 5 cycle 1C and 5 cycle 2C. In the other
side, the other cell has been cycled at 5 cycle at C/10, 5 cycles at C/5, 5 cycles at C/2, 5 cycles at
1C, 5 cycles at 2C and then again 5 cycles at C/10, 5 cycles at C/5, 5 cycles at 1C and finally again
5 cycles at C/5. All the potentials are given vs. Na+/Na. Also in this case, from both experiment it
0 5 10 15 20 25
5
10
15
20
25
Sp
ec
ific
Ca
pa
cit
y (
mA
h/g
)
Cycle Number
Charge
Discharge
C/10
C/5
C/2
1C
2C
Na0.65
CoO2:Na-CMC:SC65=80:10:10
NaPF6 1M, EC:DMC=1:1
uncompressed
0 10 20 30 40 500
5
10
15
20
2580:10:10=Na
0.65CoO
2:Na-CMC:SC65
NaPF6 1M EC:DMC=1:1
non pressed
Sp
ec
ific
Ca
pa
cit
y m
Ah
/g
Cycle Number
Charge
Discharge
C/10
C/5
C/2
1C
2C
C/10
C/5
1C
C/5
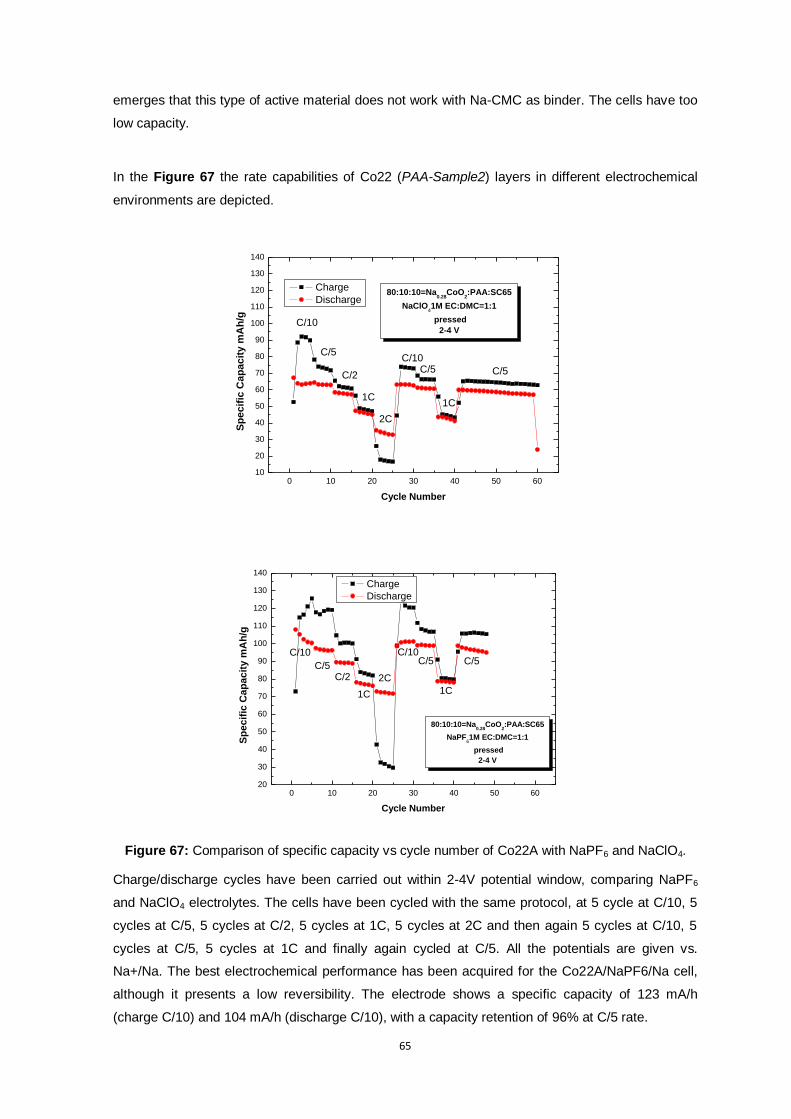
65
emerges that this type of active material does not work with Na-CMC as binder. The cells have too
low capacity.
In the Figure 67 the rate capabilities of Co22 (PAA-Sample2) layers in different electrochemical
environments are depicted.
Figure 67: Comparison of specific capacity vs cycle number of Co22A with NaPF6 and NaClO4.
Charge/discharge cycles have been carried out within 2-4V potential window, comparing NaPF6
and NaClO4 electrolytes. The cells have been cycled with the same protocol, at 5 cycle at C/10, 5
cycles at C/5, 5 cycles at C/2, 5 cycles at 1C, 5 cycles at 2C and then again 5 cycles at C/10, 5
cycles at C/5, 5 cycles at 1C and finally again cycled at C/5. All the potentials are given vs.
Na+/Na. The best electrochemical performance has been acquired for the Co22A/NaPF6/Na cell,
although it presents a low reversibility. The electrode shows a specific capacity of 123 mA/h
(charge C/10) and 104 mA/h (discharge C/10), with a capacity retention of 96% at C/5 rate.
0 10 20 30 40 50 6010
20
30
40
50
60
70
80
90
100
110
120
130
140
C/5
80:10:10=Na0.28
CoO2:PAA:SC65
NaClO41M EC:DMC=1:1
pressed
2-4 V
Sp
ec
ific
Ca
pa
cit
y m
Ah
/g
Cycle Number
Charge
Discharge
C/10
C/5
C/2
1C
2C
C/10C/5
1C
0 10 20 30 40 50 6020
30
40
50
60
70
80
90
100
110
120
130
140
C/5
1C
C/5
80:10:10=Na0.28
CoO2:PAA:SC65
NaPF61M EC:DMC=1:1
pressed
2-4 V
Sp
ec
ific
Ca
pa
cit
y m
Ah
/g
Cycle Number
Charge
Discharge
C/10
C/5C/2
1C
2C
C/10
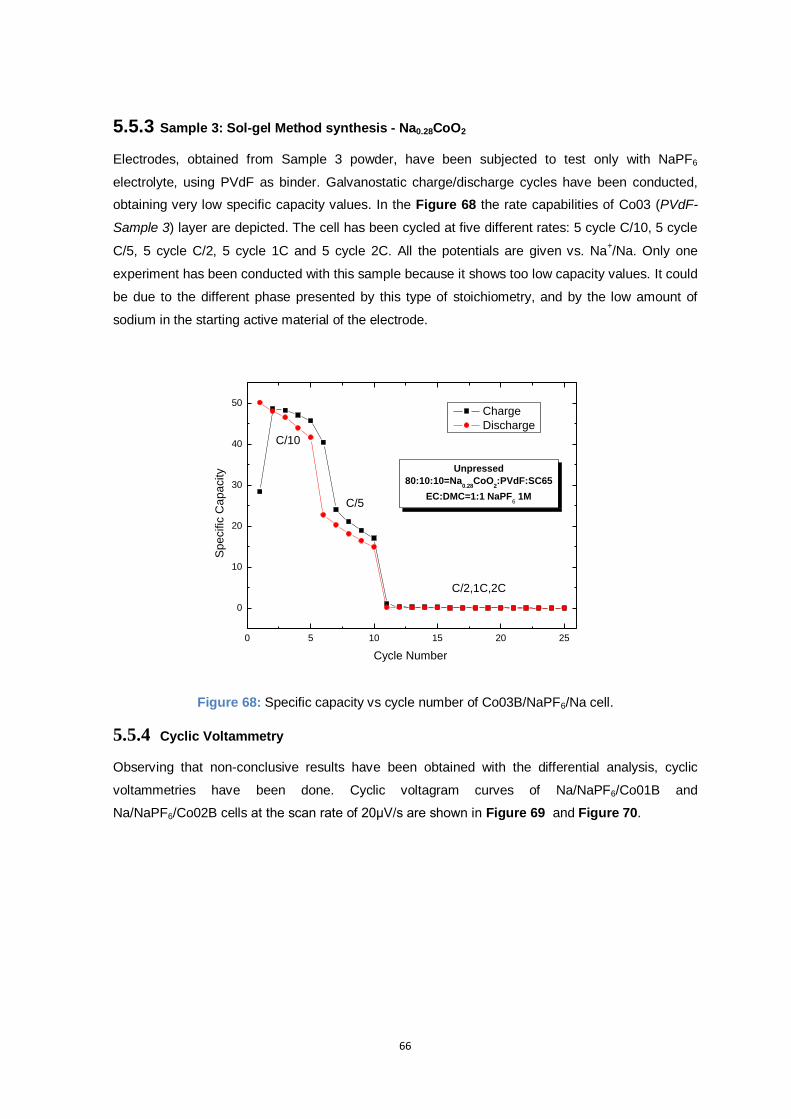
66
5.5.3 Sample 3: Sol-gel Method synthesis - Na0.28CoO2
Electrodes, obtained from Sample 3 powder, have been subjected to test only with NaPF6
electrolyte, using PVdF as binder. Galvanostatic charge/discharge cycles have been conducted,
obtaining very low specific capacity values. In the Figure 68 the rate capabilities of Co03 (PVdF-
Sample 3) layer are depicted. The cell has been cycled at five different rates: 5 cycle C/10, 5 cycle
C/5, 5 cycle C/2, 5 cycle 1C and 5 cycle 2C. All the potentials are given vs. Na+/Na. Only one
experiment has been conducted with this sample because it shows too low capacity values. It could
be due to the different phase presented by this type of stoichiometry, and by the low amount of
sodium in the starting active material of the electrode.
Figure 68: Specific capacity vs cycle number of Co03B/NaPF6/Na cell.
5.5.4 Cyclic Voltammetry
Observing that non-conclusive results have been obtained with the differential analysis, cyclic
voltammetries have been done. Cyclic voltagram curves of Na/NaPF6/Co01B and
Na/NaPF6/Co02B cells at the scan rate of 20μV/s are shown in Figure 69 and Figure 70.
0 5 10 15 20 25
0
10
20
30
40
50
Unpressed
80:10:10=Na0.28
CoO2:PVdF:SC65
EC:DMC=1:1 NaPF6 1M
Sp
ecific
Ca
pa
city
Cycle Number
Charge
Discharge
C/10
C/5
C/2,1C,2C
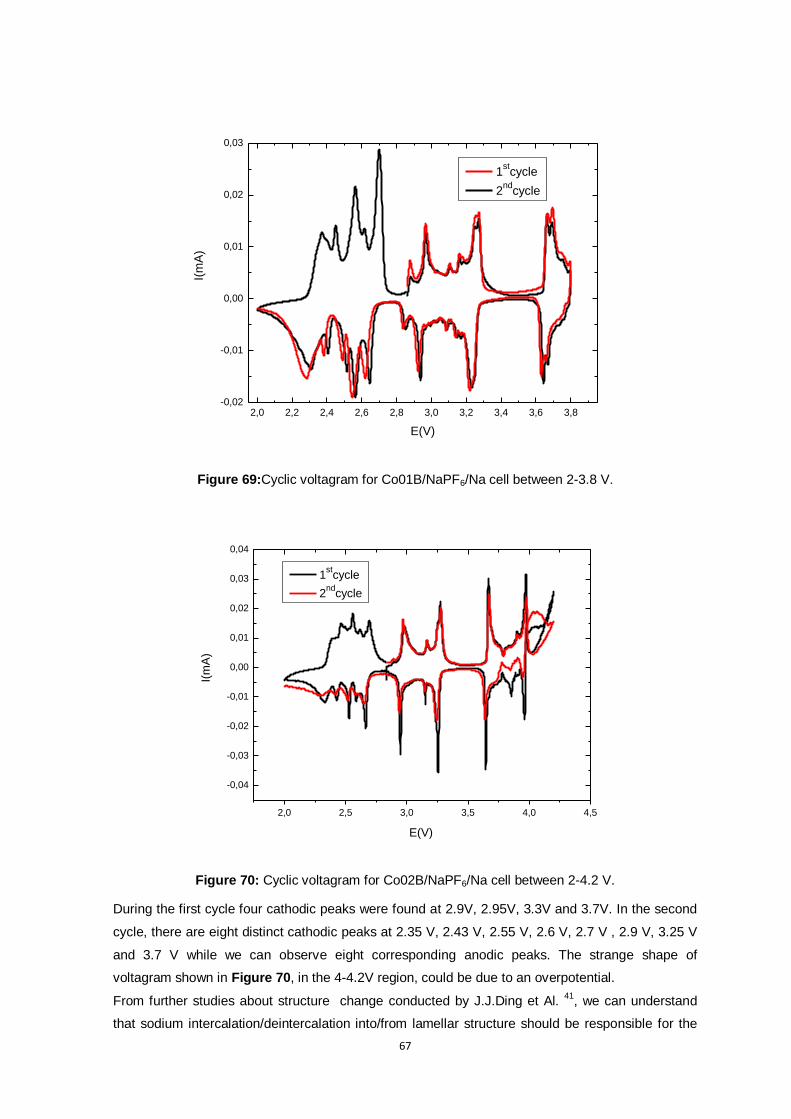
67
Figure 69:Cyclic voltagram for Co01B/NaPF6/Na cell between 2-3.8 V.
Figure 70: Cyclic voltagram for Co02B/NaPF6/Na cell between 2-4.2 V.
During the first cycle four cathodic peaks were found at 2.9V, 2.95V, 3.3V and 3.7V. In the second
cycle, there are eight distinct cathodic peaks at 2.35 V, 2.43 V, 2.55 V, 2.6 V, 2.7 V , 2.9 V, 3.25 V
and 3.7 V while we can observe eight corresponding anodic peaks. The strange shape of
voltagram shown in Figure 70, in the 4-4.2V region, could be due to an overpotential.
From further studies about structure change conducted by J.J.Ding et Al. 41
, we can understand
that sodium intercalation/deintercalation into/from lamellar structure should be responsible for the
2,0 2,2 2,4 2,6 2,8 3,0 3,2 3,4 3,6 3,8-0,02
-0,01
0,00
0,01
0,02
0,03
I(m
A)
E(V)
1st
cycle
2nd
cycle
2,0 2,5 3,0 3,5 4,0 4,5
-0,04
-0,03
-0,02
-0,01
0,00
0,01
0,02
0,03
0,04
E(V)
I(m
A)
1st
cycle
2nd
cycle
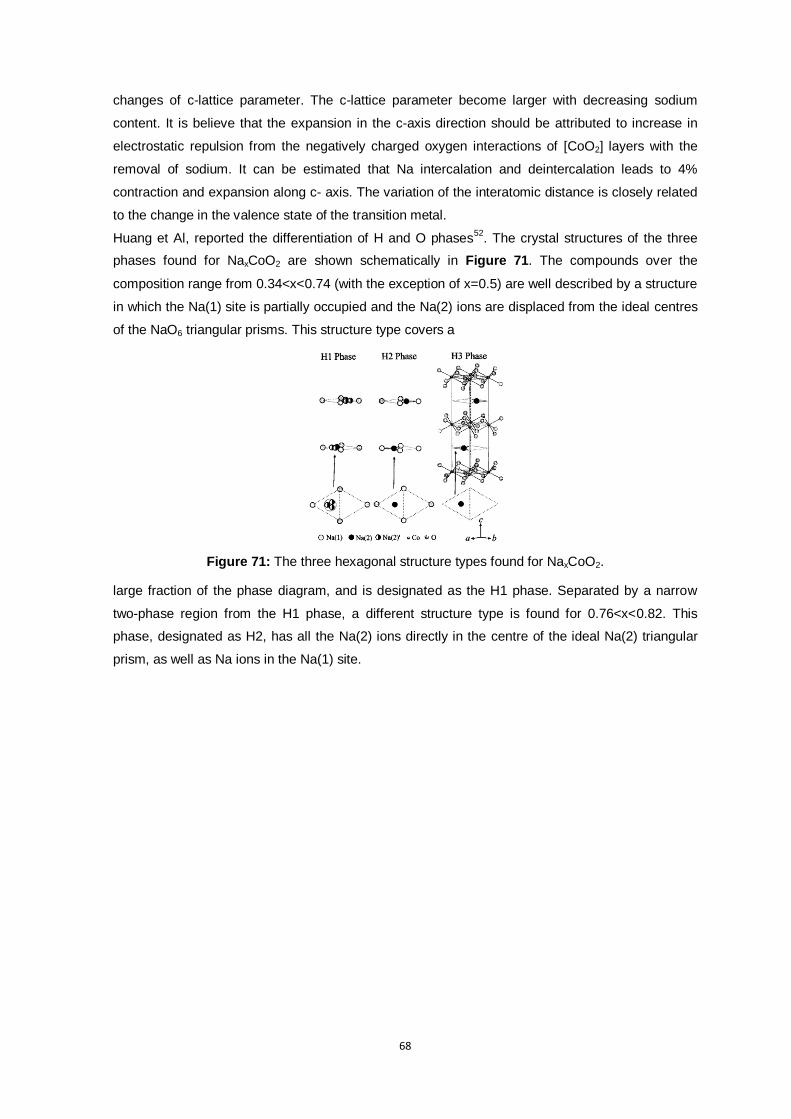
68
changes of c-lattice parameter. The c-lattice parameter become larger with decreasing sodium
content. It is believe that the expansion in the c-axis direction should be attributed to increase in
electrostatic repulsion from the negatively charged oxygen interactions of [CoO2] layers with the
removal of sodium. It can be estimated that Na intercalation and deintercalation leads to 4%
contraction and expansion along c- axis. The variation of the interatomic distance is closely related
to the change in the valence state of the transition metal.
Huang et Al, reported the differentiation of H and O phases52
. The crystal structures of the three
phases found for NaxCoO2 are shown schematically in Figure 71. The compounds over the
composition range from 0.34<x<0.74 (with the exception of x=0.5) are well described by a structure
in which the Na(1) site is partially occupied and the Na(2) ions are displaced from the ideal centres
of the NaO6 triangular prisms. This structure type covers a
Figure 71: The three hexagonal structure types found for NaxCoO2.
large fraction of the phase diagram, and is designated as the H1 phase. Separated by a narrow
two-phase region from the H1 phase, a different structure type is found for 0.76<x<0.82. This
phase, designated as H2, has all the Na(2) ions directly in the centre of the ideal Na(2) triangular
prism, as well as Na ions in the Na(1) site.
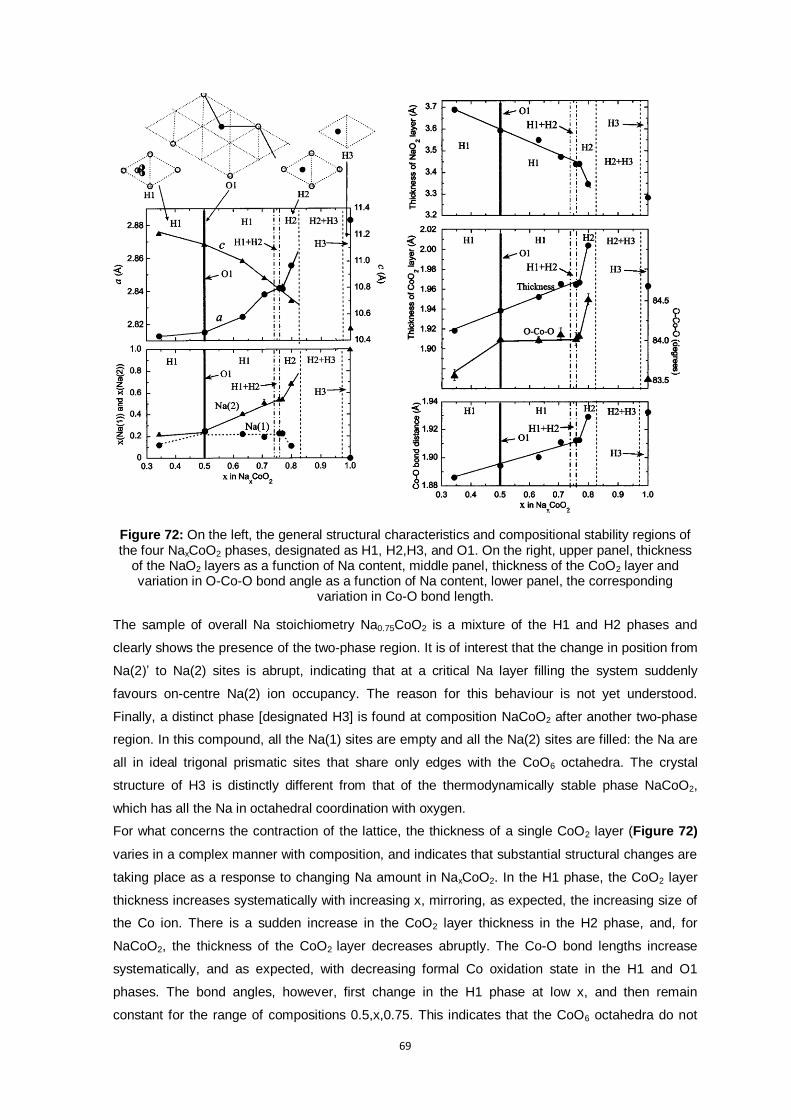
69
Figure 72: On the left, the general structural characteristics and compositional stability regions of the four NaxCoO2 phases, designated as H1, H2,H3, and O1. On the right, upper panel, thickness
of the NaO2 layers as a function of Na content, middle panel, thickness of the CoO2 layer and variation in O-Co-O bond angle as a function of Na content, lower panel, the corresponding
variation in Co-O bond length.
The sample of overall Na stoichiometry Na0.75CoO2 is a mixture of the H1 and H2 phases and
clearly shows the presence of the two-phase region. It is of interest that the change in position from
Na(2)’ to Na(2) sites is abrupt, indicating that at a critical Na layer filling the system suddenly
favours on-centre Na(2) ion occupancy. The reason for this behaviour is not yet understood.
Finally, a distinct phase [designated H3] is found at composition NaCoO2 after another two-phase
region. In this compound, all the Na(1) sites are empty and all the Na(2) sites are filled: the Na are
all in ideal trigonal prismatic sites that share only edges with the CoO6 octahedra. The crystal
structure of H3 is distinctly different from that of the thermodynamically stable phase NaCoO2,
which has all the Na in octahedral coordination with oxygen.
For what concerns the contraction of the lattice, the thickness of a single CoO2 layer (Figure 72)
varies in a complex manner with composition, and indicates that substantial structural changes are
taking place as a response to changing Na amount in NaxCoO2. In the H1 phase, the CoO2 layer
thickness increases systematically with increasing x, mirroring, as expected, the increasing size of
the Co ion. There is a sudden increase in the CoO2 layer thickness in the H2 phase, and, for
NaCoO2, the thickness of the CoO2 layer decreases abruptly. The Co-O bond lengths increase
systematically, and as expected, with decreasing formal Co oxidation state in the H1 and O1
phases. The bond angles, however, first change in the H1 phase at low x, and then remain
constant for the range of compositions 0.5,x,0.75. This indicates that the CoO6 octahedra do not
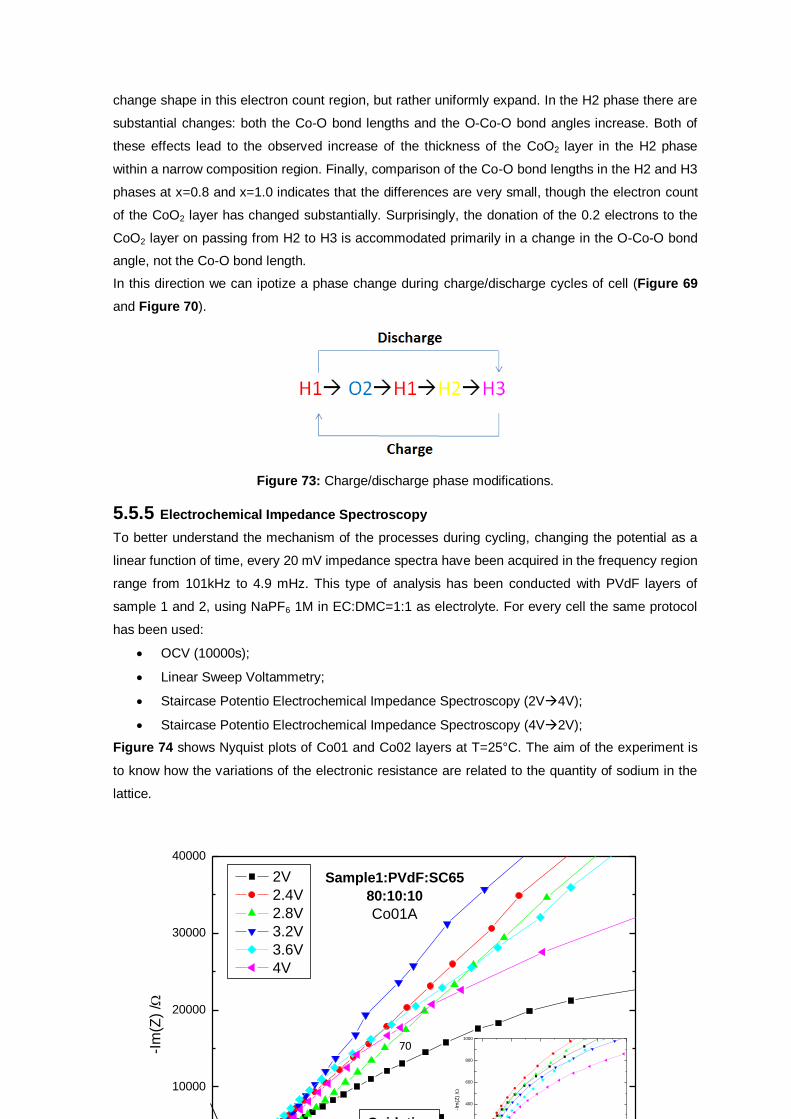
70
change shape in this electron count region, but rather uniformly expand. In the H2 phase there are
substantial changes: both the Co-O bond lengths and the O-Co-O bond angles increase. Both of
these effects lead to the observed increase of the thickness of the CoO2 layer in the H2 phase
within a narrow composition region. Finally, comparison of the Co-O bond lengths in the H2 and H3
phases at x=0.8 and x=1.0 indicates that the differences are very small, though the electron count
of the CoO2 layer has changed substantially. Surprisingly, the donation of the 0.2 electrons to the
CoO2 layer on passing from H2 to H3 is accommodated primarily in a change in the O-Co-O bond
angle, not the Co-O bond length.
In this direction we can ipotize a phase change during charge/discharge cycles of cell (Figure 69
and Figure 70).
Figure 73: Charge/discharge phase modifications.
5.5.5 Electrochemical Impedance Spectroscopy
To better understand the mechanism of the processes during cycling, changing the potential as a
linear function of time, every 20 mV impedance spectra have been acquired in the frequency region
range from 101kHz to 4.9 mHz. This type of analysis has been conducted with PVdF layers of
sample 1 and 2, using NaPF6 1M in EC:DMC=1:1 as electrolyte. For every cell the same protocol
has been used:
OCV (10000s);
Linear Sweep Voltammetry;
Staircase Potentio Electrochemical Impedance Spectroscopy (2V4V);
Staircase Potentio Electrochemical Impedance Spectroscopy (4V2V);
Figure 74 shows Nyquist plots of Co01 and Co02 layers at T=25°C. The aim of the experiment is
to know how the variations of the electronic resistance are related to the quantity of sodium in the
lattice.
0 10000 20000 30000 40000
0
10000
20000
30000
40000
Sample1:PVdF:SC65
80:10:10
Co01A
0 200 400 600 800 1000
0
200
400
600
800
1000
-Im
(Z)
/
Re(Z)/
-Im
(Z)
/
Re(Z)/
2V
2.4V
2.8V
3.2V
3.6V
4V
Oxidation
2V 4V
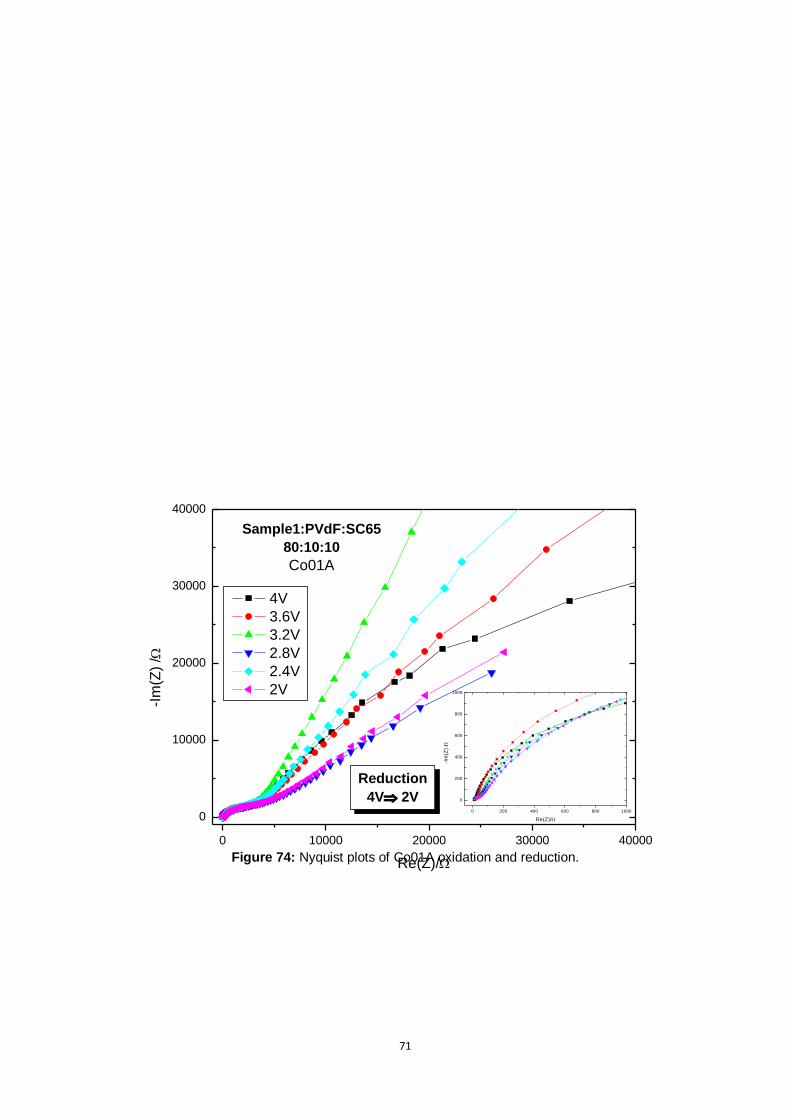
71
Figure 74: Nyquist plots of Co01A oxidation and reduction.
0 10000 20000 30000 40000
0
10000
20000
30000
40000
Sample1:PVdF:SC65
80:10:10
Co01A
Reduction
4V 2V0 200 400 600 800 1000
0
200
400
600
800
1000
-Im
(Z)
/
Re(Z)/
-Im
(Z)
/
Re(Z)/
4V
3.6V
3.2V
2.8V
2.4V
2V
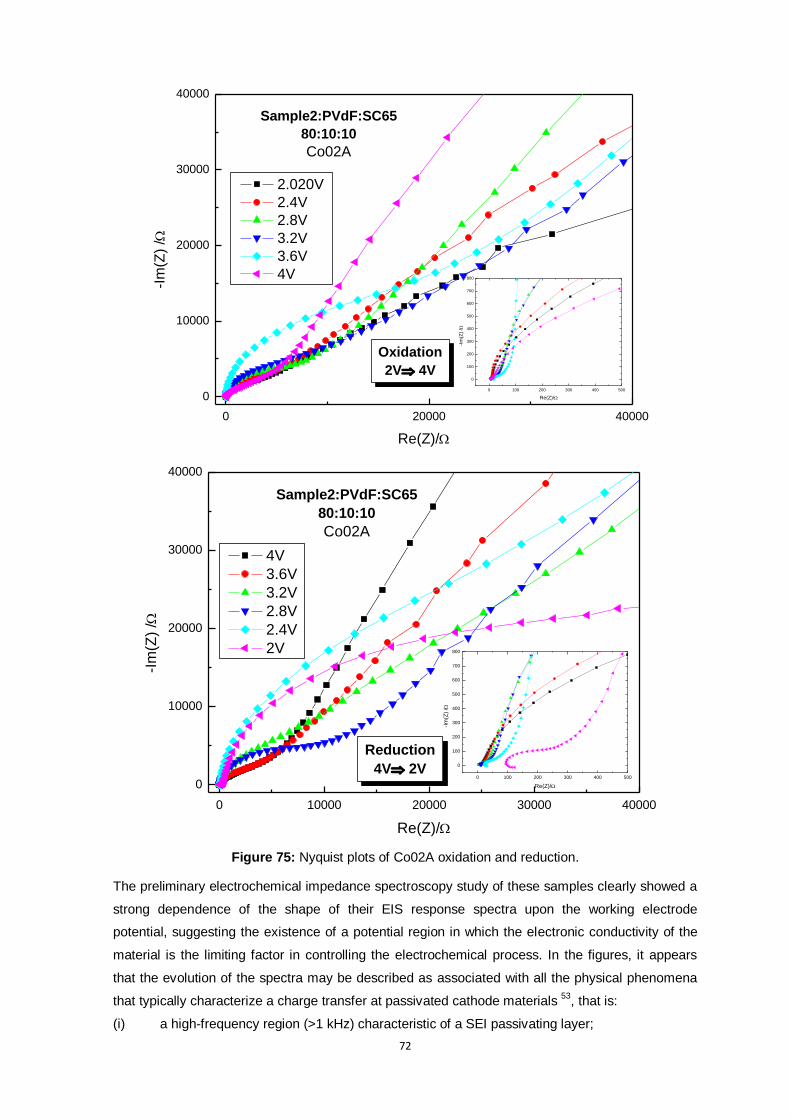
72
Figure 75: Nyquist plots of Co02A oxidation and reduction.
The preliminary electrochemical impedance spectroscopy study of these samples clearly showed a
strong dependence of the shape of their EIS response spectra upon the working electrode
potential, suggesting the existence of a potential region in which the electronic conductivity of the
material is the limiting factor in controlling the electrochemical process. In the figures, it appears
that the evolution of the spectra may be described as associated with all the physical phenomena
that typically characterize a charge transfer at passivated cathode materials 53
, that is:
(i) a high-frequency region (>1 kHz) characteristic of a SEI passivating layer;
0 20000 40000
0
10000
20000
30000
40000
Sample2:PVdF:SC65
80:10:10
Co02A
Oxidation
2V 4V0 100 200 300 400 500
0
100
200
300
400
500
600
700
800
-Im
(Z)
/
Re(Z)/
-Im
(Z)
/
Re(Z)/
2.020V
2.4V
2.8V
3.2V
3.6V
4V
0 10000 20000 30000 40000
0
10000
20000
30000
40000
Sample2:PVdF:SC65
80:10:10
Co02A
Reduction
4V 2V0 100 200 300 400 500
0
100
200
300
400
500
600
700
800
-Im
(Z)
/
Re(Z)/
-Im
(Z)
/
Re(Z)/
4V
3.6V
3.2V
2.8V
2.4V
2V
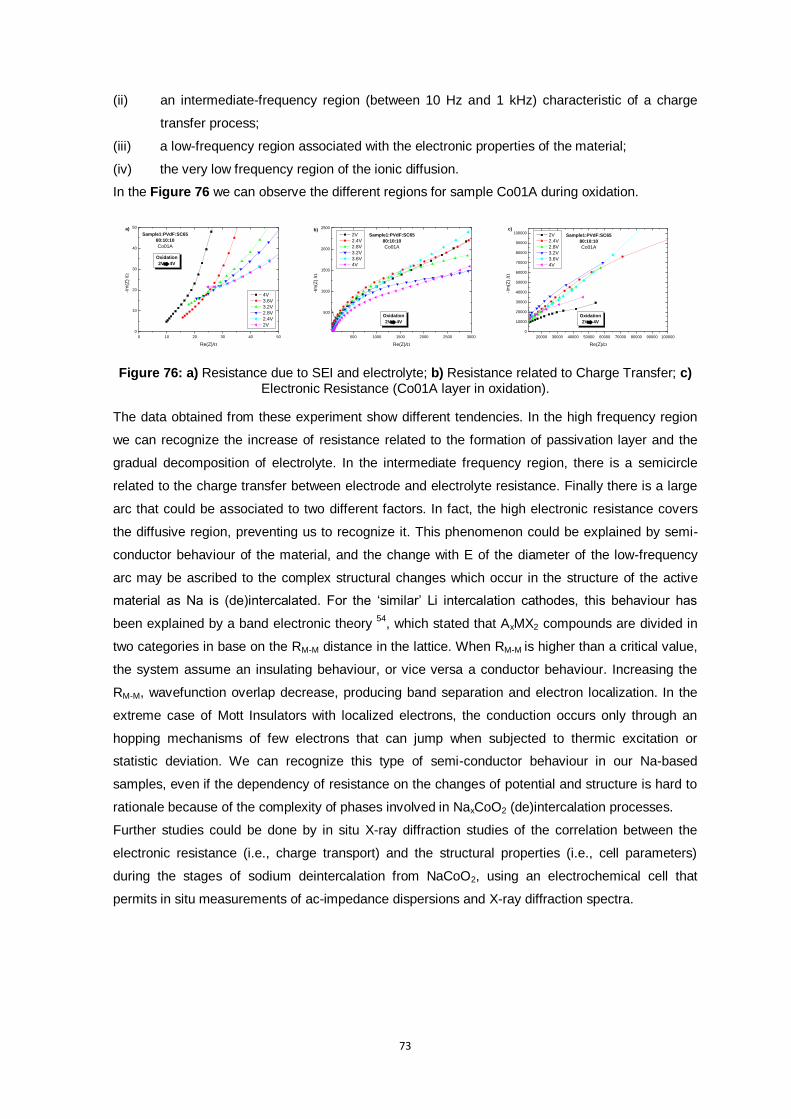
73
(ii) an intermediate-frequency region (between 10 Hz and 1 kHz) characteristic of a charge
transfer process;
(iii) a low-frequency region associated with the electronic properties of the material;
(iv) the very low frequency region of the ionic diffusion.
In the Figure 76 we can observe the different regions for sample Co01A during oxidation.
Figure 76: a) Resistance due to SEI and electrolyte; b) Resistance related to Charge Transfer; c) Electronic Resistance (Co01A layer in oxidation).
The data obtained from these experiment show different tendencies. In the high frequency region
we can recognize the increase of resistance related to the formation of passivation layer and the
gradual decomposition of electrolyte. In the intermediate frequency region, there is a semicircle
related to the charge transfer between electrode and electrolyte resistance. Finally there is a large
arc that could be associated to two different factors. In fact, the high electronic resistance covers
the diffusive region, preventing us to recognize it. This phenomenon could be explained by semi-
conductor behaviour of the material, and the change with E of the diameter of the low-frequency
arc may be ascribed to the complex structural changes which occur in the structure of the active
material as Na is (de)intercalated. For the ‘similar’ Li intercalation cathodes, this behaviour has
been explained by a band electronic theory 54
, which stated that AxMX2 compounds are divided in
two categories in base on the RM-M distance in the lattice. When RM-M is higher than a critical value,
the system assume an insulating behaviour, or vice versa a conductor behaviour. Increasing the
RM-M, wavefunction overlap decrease, producing band separation and electron localization. In the
extreme case of Mott Insulators with localized electrons, the conduction occurs only through an
hopping mechanisms of few electrons that can jump when subjected to thermic excitation or
statistic deviation. We can recognize this type of semi-conductor behaviour in our Na-based
samples, even if the dependency of resistance on the changes of potential and structure is hard to
rationale because of the complexity of phases involved in NaxCoO2 (de)intercalation processes.
Further studies could be done by in situ X-ray diffraction studies of the correlation between the
electronic resistance (i.e., charge transport) and the structural properties (i.e., cell parameters)
during the stages of sodium deintercalation from NaCoO2, using an electrochemical cell that
permits in situ measurements of ac-impedance dispersions and X-ray diffraction spectra.
0 10 20 30 40 50
0
10
20
30
40
50
Oxidation
2V 4V
Sample1:PVdF:SC65
80:10:10
Co01A
4V
3.6V
3.2V
2.8V
2.4V
2V
-Im
(Z)
/
Re(Z)/
a)
500 1000 1500 2000 2500 3000
500
1000
1500
2000
2500
Sample1:PVdF:SC65
80:10:10
Co01A
-Im
(Z)
/
Re(Z)/
2V
2.4V
2.8V
3.2V
3.6V
4V
Oxidation
2V 4V
b)
20000 30000 40000 50000 60000 70000 80000 90000 100000
0
10000
20000
30000
40000
50000
60000
70000
80000
90000
100000Sample1:PVdF:SC65
80:10:10
Co01A
-Im
(Z)
/
Re(Z)/
2V
2.4V
2.8V
3.2V
3.6V
4V
Oxidation
2V 4V
c)
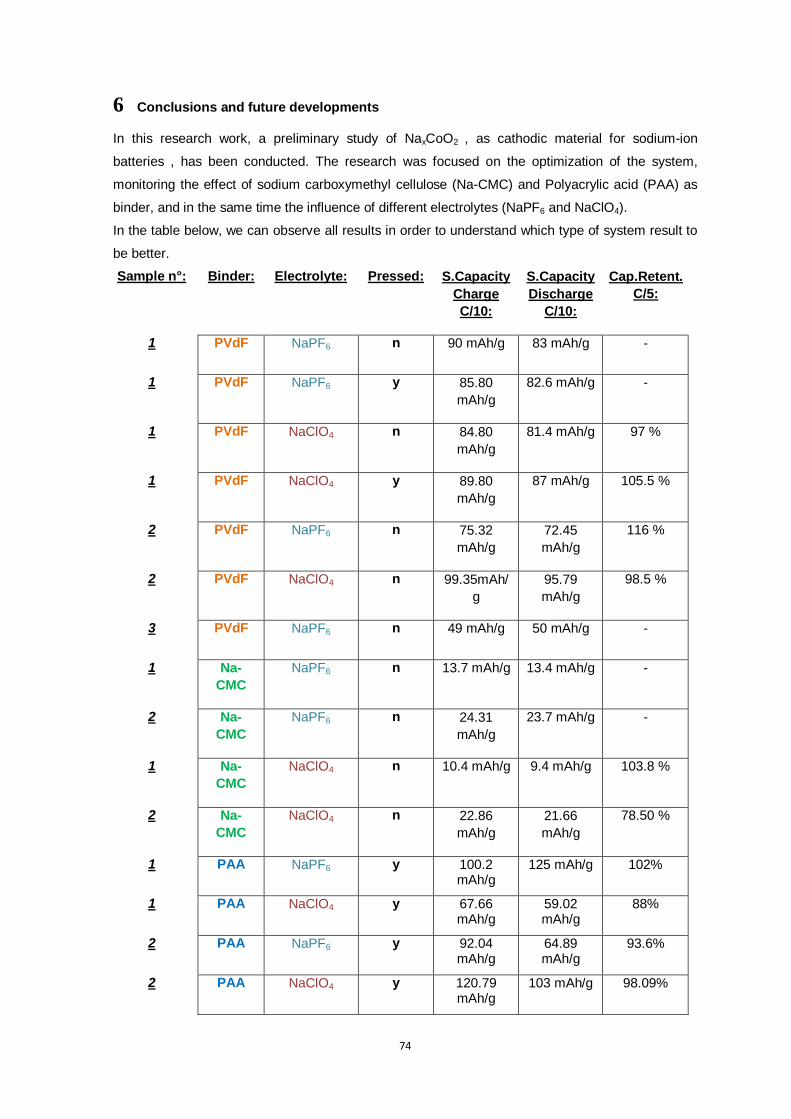
74
6 Conclusions and future developments
In this research work, a preliminary study of NaxCoO2 , as cathodic material for sodium-ion
batteries , has been conducted. The research was focused on the optimization of the system,
monitoring the effect of sodium carboxymethyl cellulose (Na-CMC) and Polyacrylic acid (PAA) as
binder, and in the same time the influence of different electrolytes (NaPF6 and NaClO4).
In the table below, we can observe all results in order to understand which type of system result to
be better.
Sample n°: Binder: Electrolyte: Pressed: S.Capacity
Charge
C/10:
S.Capacity
Discharge
C/10:
Cap.Retent.
C/5:
1 PVdF NaPF6 n 90 mAh/g 83 mAh/g -
1 PVdF NaPF6 y 85.80
mAh/g
82.6 mAh/g -
1 PVdF NaClO4 n 84.80
mAh/g
81.4 mAh/g 97 %
1 PVdF NaClO4 y 89.80
mAh/g
87 mAh/g 105.5 %
2 PVdF NaPF6 n 75.32
mAh/g
72.45
mAh/g
116 %
2 PVdF NaClO4 n 99.35mAh/
g
95.79
mAh/g
98.5 %
3 PVdF NaPF6 n 49 mAh/g 50 mAh/g -
1 Na-
CMC
NaPF6 n 13.7 mAh/g 13.4 mAh/g -
2 Na-
CMC
NaPF6 n 24.31
mAh/g
23.7 mAh/g -
1 Na-
CMC
NaClO4 n 10.4 mAh/g 9.4 mAh/g 103.8 %
2 Na-
CMC
NaClO4 n 22.86
mAh/g
21.66
mAh/g
78.50 %
1 PAA NaPF6 y 100.2 mAh/g
125 mAh/g 102%
1 PAA NaClO4 y 67.66 mAh/g
59.02 mAh/g
88%
2 PAA NaPF6 y 92.04 mAh/g
64.89 mAh/g
93.6%
2 PAA NaClO4 y 120.79 mAh/g
103 mAh/g 98.09%

75
From the data obtained, Na-CMC has shown negative effect in all experiment. Testing electrodes
with galvanostatic charge/discharge cycles at different C-rate, CMC presented very low specific
capacity, in the range between 8-25 mAh/g. These values result to be unacceptable for a battery
device. For what concern PAA as binder, it result to be a green valid substitute of PVdF. In fact it
present good performances in particular conditions (low values of mass loading). For these
reasons, further studies should be done to test the effect of the layer thickness. An optimization of
electrode preparation could be done, monitoring the capacity increase as a function of decrease in
mass loading.
On the other hand, no significant differences were observed, using NaClO4 or NaPF6 as the
electrolyte salt. The electrochemical performance, probably, depend on the electrolyte solvent
used. Further studies should be done using EC:PC as electrolyte solvent.
In regard on the active materials synthetized, it was possible to observe a strong dependence of
charge/discharge behaviour on the different stoichiometry obtained. This is related to different
phases assumed by the layered oxide, influencing the intercalation/deintercalation process and
strongly affecting the reversibility of charge/discharge process. The Sample 1(mix phase γ + α’)
obtained by “Ball-Milling and post firing”, result electrochemically active, but a loss of specific
capacity must be emphasized. It is probably due by the presence of impurities and two different
phases. Only one experiment has been conducted with Sample 3 (β phase), obtained by sol-gel
method, because it shows too low capacity values. It could be due to the not suitable phase
presented by this type of stoichiometry, and to the low amount of sodium in the starting active
material. Further studies could be done for the optimization of the synthetic condition of sol gel
method, with the aim to obtain higher sodium content. The Sample 2 (pure γ phase), obtained by
simple solid state reaction, result to be the best choice. It present high stability, reversibility and
good specific capacities, so it represents a good starting point for future material and electrode
optimization.

76
References:
1. Tarascon JM, Armand M., Nature, 414 (2001) 359-367. 2. Yaksic A, Tilton JE., Resource Policy, 34 (2009);185.
3 Ellis B.L., Nazar L.F. , Science, 16 (2012) 168–169. 4 Palomares V., Casas-Cabanas M., Castillo-Martınez E., Han M H, Rojo T., Energy Environ. Sci., 6 (2013) 2312. 5 Palomares V., Serras P., Villaluenga I., Hueso K.B., Carretero-Gonzalez J., Rojo T., Energy Enviro, Sci.,5 (2012) 5884. 6 Linden D., Reddy T. B., Handbook of Batteries 3rd Ed., McGraw-Hill Ed.,1.3-1.5.
7 Winter M., Brodd R. J., Chem.Rev.,104 (2004) 4245-4269. 8 Boundless. “Dry Cell Battery.” Boundless Chemistry. Boundless, (2015), www.boundless.com 9 Petrucci, Ralph H., General Chemistry: Principles & Modern Applcations 9th Ed. New Jersey, Pearson Education,
(2007).
10 Crompton T.R., The Battery Reference Book. Boston. Butterworth-Heinemann, (1995). 11 Zhao P, Zhang H., Zhou H., Chlen J., Gao S. Yi B., Journal of power sources,162 (2006) 1416-1420. 12 Badwal S., Giddey S., Munnings C., Bhattand A. I.,Hollenkamp A. F.,Frontiers in Chemistry, 2 (2014) 79. 13 Winter M., J. Brodd,Chem. Rev, 104(2004) 4245-4269.
14 Pan H., Hu Y. S. and Liquan, Chen Energy Environ. Sci.,6 (2013) 2339. 15 Kummer J.T., Weber N., US Patent , (1968), US 3413150. 16 Dunn B, Breiter MW, Park DS, J Appl Electrochem, 11, (1981),103. 17 Ryu H, Kim T, Kim K, Ahn J-H, Nam T, Wang G, J Power Sources ,196 (2011) 5186.
18 Ji X, Lee KT, Nazar LF., Nat Mater 8,(2009),500. 19 Hassoun J, Croce F, Armand M, Scrosati B., Angew Chem Int Ed, 50 (2011) 2999. 20 Peled E, Golodnitsky D, Mazor H, Goor M, Avshalomov S., J Power Sources 196 (2011) 6835. 21 Lu Y-C, Kwabi DG, Yao KPC, Harding JR, Zhou J, Shao-horn Y., Energy Environ Sci
4 (2011) 2999.
22 Bruce PG, Hardwick LJ, Abraham KM. MRS Bull 36 (2011)506. 23 Sudworth JL., J Power Sources, 100 (2001) 149. 24Zyl A. Solid State Ionic 883 (1996)86–88. 25 Brett DJL, Aguiar P, Brandon NP., J Power Sources 163 (2006) 514.
26 Sauvage F., Baudrin E. and Tarascon J. M., Sens. Actuators, B, 120(2), (2007), 638–644. 27 Wessells C. D., Peddada S. V., Huggins R. A. and Cui Y., Nano Lett., 11,(2011), 5421–5425. 28 Li Z., Young D., Xiang K., Carter W. C. and Chiang Y. M., Adv. Energy Mater.,3 (2013), 290–294. 29 K. Nobuhara, H. Nakayama, S. Nakanishi and H. Iba, Meet. Abstr., (2012), 1854.
30 C. Delmas, J. J. Braconnier, C. Fouassier and P. Hagenmuller, Solid State Ionics,3-4 (1981) 165–169. 31 Yuechuan Lei , Xin Li , Lei Liu , and Gerbrand Ceder, Chem. Mater.26 (2014) 288–5296

77
32 Y.Ono, R. Ishikawa, Y. Miyazaki, T.Kajatani, J.Phys. Soc. Jpn.70(2001)235.
33 Y.Ono, R. Ishikawa, Y. Miyazaki, T.Kajatani, Y. Miyazaki, Y. Ishii, Y Morii, Journal of solid State Chemistry, 166(2002)177-181
34 M. Medarde, M. Mena, J. L. Gavilano, E. Pomjakushina, J. Sugiyama, K. Kamazawa, V. Yu. Pomjakushin, D.
Sheptyakov, B. Batlogg, H. R. Ott, M. Månsson, and F. Juranyi Phys. Rev. Lett. 110(2013)
35 M Månsson, M. Medarde, Paul Scherrer Institut-www.psi.ch, 26. September 2013.
36 A. Ponrouch, E. Marchante, M. Courty, J.M. Tarascon, M. R. Palac, Energy Environ. Sci, 5,(2012)8572–8583 37 J.W.Fergus, J. Power Sources, 195(2010)4554-4569. 38 S. Pejovnika, R. Dominkoa, M. Belea, M. Gabersceka, J. Jamnika, Journal of Power Sources, 227(2013)204-210. 39 Zhang, Q. M., Bharti, V., Kavarnos, G., Schwartz, M. Encyclopedia of Smart Materials, 1–2,(2002),807–825
40 Sodium carboxymethyl cellulose, Codex Alimentarius, (2009). 41 J.J. Ding, Y. N. Zhou, Q. Sun, X. Q. Yu, X. Q. Yang, Z. W. Fu, Electrochimica Acta, 87(2013)388. 42 Lynch A., Rowland C, “The history of grinding”. SME. ISBN 0-87335-238-6(2005). 43 Amrtha Bhide, K. Hariharan, Solid State Ionics,192(2011)369.
44 B.J. Hwang, R. Santhanam, D.G. Liu, Journal of Power Sources,102(2001) 326. 45 http://serc.carleton.edu/research_education/geochemsheets/techniques/SEM.html 46 http://www.nanoscience.com/ 47 http://www.ucl.ac.uk/eastman/research/departments/biomaterials-and-tissue-engineering/facilities/inductively-
coupled-plasma-mass-spectrometry
48 http://crustal.usgs.gov/laboratories/icpms/ 49 O.Haas, E.J. Coirns, Annu. Rep. Prog. Chem., Sect. C, 95(1999)163 50 Kissinger, P. T., Heineman, W. R., Journal of Chemical Education, 60 (1983) 702. 51 Ho C, Raistrick ID, Huggins RA, J Electrochem Soc, 127(1980)343–350.
52 Q. Huang, M. L. Foo, R. A. Pascal, Jr., J. W. Lynn, B. H. Toby, Tao He, H. W. Zandbergen, and R. J. Cava, Physical
Review B, 70 (2004) 184110 53 F. Nobili, F. Croce, B. Scrosati, and R. Marassi,Chem. Mater. 13,(2001), 1642-1646. 54 J Molenda, A Stokłosa, T Ba̧k , Solid State Ionics, 36-1/2, (1989)53-58.