ELECTRICITY MARKET COUPLING IN EUROPE STATUS QUO AND ...
36
ELECTRICITY MARKET COUPLING IN EUROPE: STATUS QUO AND FUTURE CHALLENGES ROLAND FÜSS STEFFEN MAHRINGER MARCEL PROKOPCZUK WORKING PAPERS ON FINANCE NO. 2015/12 SWISS INSTITUTE OF BANKING AND FINANCE (S/BF – HSG) AUGUST 2015 THIS VERSION: MARCH 2017
Transcript of ELECTRICITY MARKET COUPLING IN EUROPE STATUS QUO AND ...

ELECTRICITY MARKET COUPLING IN EUROPE: STATUS QUO AND FUTURE CHALLENGES
ROLAND FÜSS STEFFEN MAHRINGER MARCEL PROKOPCZUK WORKING PAPERS ON FINANCE NO. 2015/12 SWISS INSTITUTE OF BANKING AND FINANCE (S/BF – HSG)
AUGUST 2015 THIS VERSION: MARCH 2017

Electricity Market Coupling in Europe:Status Quo and Future Challenges
Roland Fuss,* Steffen Mahringer,� and Marcel Prokopczuk�
This version: February 2017
Abstract
In electricity markets globally, market participants and policymakers increas-
ingly focus on integrating adjacent, yet separate market areas via cross-border trade
in electricity. Based on a discussion of the institutional framework for organizing
cross-border trade, this paper analyzes how spot and futures prices for wholesale
electricity are affected by different degrees of market integration. We first contrast
the two main mechanisms to allocate transmission capacity between neighboring
markets: explicit and implicit auctions. Subsequently, we study the impact of these
allocation schemes on the empirical price dynamics of major electricity markets
in Europe. Our empirical analysis thereby confirms that under market coupling,
economically inefficient cross-border flows in the wrong direction can be avoided.
From a policy point of view, however, we show that further market integration can
be hindered by individual energy market regulation on a national level, which may
be opposed to supra-national frameworks such as market coupling.
JEL classification: Q4, Q41, D47
Keywords: Energy Market Coupling, Electricity Market Reforms, Explicit and ImplicitAuction, Price Convergence
*Swiss Institute of Banking and Finance (s/bf), University of St.Gallen, Unterer Graben 21, 9000St.Gallen, Switzerland. Email: [email protected] (corresponding author).
�Goldman Sachs AG, Friedrich-Ebert-Anlage 49, 60308 Frankfurt am Main, Germany. Email:[email protected].
�School of Economics and Management, Leibniz University Hannover, Koenigsworther Platz 1, 30167Hannover, Germany. Email: [email protected].

I Introduction
In the aftermath of market liberalization, energy markets in the US and Europe have been
undergoing a number of significant structural developments and institutional changes that
strongly affect the interplay of supply and demand, and, hence, the general price formation
process in these markets. In the case of electricity markets, the rise of exchange-based
trading along with regulatory developments (such as the introduction of emissions trading
schemes), but also other aspects of market design (such as power exchanges admitting
negative prices), have had a marked and long-lasting impact on the price dynamics of
spot and derivative contracts. However, the most significant structural change that both
US and European electricity markets have seen recently is caused by a general, continued
shift towards generation from renewable energy sources.
However, it is not only the volatile nature and general intermittency of renewable
generation that makes network integration a demanding task for transmission system
operators (TSOs). It is also a problem that, especially for “green” electricity, the location
of generation sites may be far away from the actual centers of demand: for instance, with
rising numbers of solar panels in Arizona or European wind farms in the North Sea, new
ways must be found in order to efficiently direct these electricity flows to high-demand
areas which may be thousands of miles away. Hence, increasing interconnectivity – i.e.,
transmission capacity – between electricity wholesale markets is a crucial prerequisite for
a successful integration of renewable generation across both Europe and the US.
Within the European Union (EU), reaching this aim coincides with the intended
establishment of the “Internal Electricity Market” (IEM),1 an initiative to support further
integration of European electricity markets, with the ultimate goal not only to realize
uncongested transfer of “green” energy but also to achieve full electricity price convergence
across member states.2 Fostering integration between national markets, in turn, requires
substantial investments in transmission infrastructure both within and across national
markets. Already in March 2002, the Barcelona European Council agreed on a minimum
1See Article 194 of the Lisbon Treaty (Treaty on the Functioning of the European Union) thatstipulates to further “(...) promote the interconnection of energy networks.”
2See, e.g., Article 60(2) of Directive 2009/72/EC: “(...) leading, in the long term, to priceconvergence.”
1

level of interconnectivity between member states of 10% of installed generation capacities
within the respective markets. In this context, the European Network of Transmission
System Operators for Electricity (ENTSO-E) estimates that for investment projects of
“pan-European significance,” a total capital expenditure of approx. EUR 104bn will be
required until 2022 (ENTSO-E, 2012).
However, to fulfill the aim of creating a single electricity market across Europe,
a well-defined and functioning market model of how to provide access to cross-border
transmission capacity is at least as important as further investment into transmission
infrastructure. Generally, only few interconnectors in Europe are uncongested,3 and
over time a variety of different congestion management methods has been developed to
govern access to scarce transmission capacity for cross-border trade in electricity. In
the past, these allocation mechanisms have primarily relied on explicit ex-ante schemes,
where traders first have to acquire transmission capacity in order to then trade in
two interconnected, yet institutionally separated, electricity markets. In Europe, in
their most widespread form, explicit schemes are usually implemented as (sealed-bid)
auction processes where capacity is allocated for different timeframes.4 While explicit
ex-ante auctions of transmission capacity meet the requirement by the EU that access
be provided based on “non-discriminatory market based solutions,”5 they nevertheless
lead to an inefficient market design. Among a number of deficiencies, it is primarily the
timing sequence of capacity and electricity spot markets that forces traders to acquire
cross-border transmission capacity for a given direction before the spread in electricity
spot prices between the two respective markets is actually determined. Hence, a trader’s
decision about both the direction and the amount of transmission capacity to be requested
can only be based on an expectation of the price differential between these markets, and
in view of generally high levels of volatility in electricity spot markets, this noisy signal
3For instance, this is the case between Germany and Austria, where transmission capacity is sufficientand no auctioning of rights for interconnector use is required.
4Prior to the implementation of market coupling, explicit auction schemes prevailed throughoutEurope and were (or still are) used to allocate capacity for exchange between, e.g., England–France,France–Spain, France–Belgium, Belgium–the Netherlands, or the Netherlands–Germany.
5See Regulations No. 1228/2003/EC and its follow-up No. 714/2009/EC. Note that this rules outthe use of other cross-border congestion management methods, such as rationing or allocation on a“first-come, first-served” basis, given their lack of an inherent market-based mechanism.
2

may often cause the trader to acquire capacity for the wrong direction.
Since these inefficiencies conflict with the objective of (day-ahead) price convergence
within a single pan-European electricity market, the more efficient alternative of implicitly
allocating cross-border capacity rights via market coupling is increasingly rolled out across
European markets nowadays. Here, markets for transmission capacity and spot electricity
are integrated and, hence, clear simultaneously, which allows for an optimal allocation of
capacities and results in economically efficient cross-border flows. However, although
the previous explicit ex-ante design has already been replaced by an implicit mechanism
for a number of interconnectors, it will continue to play a dominant role wherever the
harmonization efforts required for market coupling are too high or just infeasible.6
In the US, market architecture for most regions is fundamentally different from the
uniform (zonal) pricing approach that is prevalent in Europe: instead, nodal pricing
(or locational marginal pricing; LMP) has become the standard pricing approach.7 In
an LMP-based market, the market area is subdivided into numerous pricing points,
or nodes, for each of which an individual marginal electricity price is calculated. For
instance, in the day-ahead market, participants submit bids and offers for specified
point-to-point transactions which are then aggregated and matched by the central market
administrator that clears the market. Thus, both day-ahead prices and corresponding
flows are determined simultaneously, and in the case of no congestion marginal prices will
be equal at each node.8 However, it is important to note that this approach optimally
addresses transmission constraints within markets only, whereas the above-mentioned
problems in efficiently setting up cross-border transactions in Europe also apply for
transactions between markets in the US. For instance, if a trader wants to trade in the
PJM and NYISO markets, this transaction still needs to be based on an expectation of
the price spread, i.e., the price differential between the two markets. As a consequence,
6Also see, e.g., McInerney and Bunn (2013) on this argument. Moreover, should the market couplingalgorithm (that determines the optimal cross-border flows) not be available due to technical problems,the explicit ex-ante scheme will be used as the default option to allocate capacity.
7See, e.g., Bohn et al. (1984), Schweppe et al. (1988), and Hogan (1992) for an overview. Nodalpricing (in different forms) has been implemented, e.g., in California (CAISO), Texas (ERCOT), in theMidwest (MISO), New York (NYISO), and New England (ISO-NE) markets, in the PJM Interconnection,and in the Southwest Power Pool (SPP).
8Exact price convergence, however, will only be reached if transmission losses are not taken intoaccount or are deemed negligible. Otherwise, even in case of no congestion, prices will still not be equal.
3

market participants are facing similar problems in organizing efficient cross-border trade
as in Europe, making less-than-optimal or even adverse interconnector flows a common
problem on both sides of the Atlantic.
In the future, interconnectivity within the still fragmented US electricity grid is
generally expected to further increase – e.g., through projects such as the planned “Tres
Amigas Superstation,” a bundle of three 5-gigawatt (GW) transmission lines that are
supposed to unite the three regional grids in the US into a single national grid.9 While
the market design for this emerging huge trading hub is still being worked out, a solution
based on implicit allocation, i.e., market coupling, may likely be expected.10
Historically, the literature has looked at the question of how to organize cross-border
trading mostly form a theoretical point of view. Bohn et al. (1984), Schweppe et al.
(1988) and Hogan (1992) develop a theory of electricity pricing in networks that accounts
for the physical properties of electricity. Chao and Peck (1996) extend this analysis and
investigate how competition may affect optimal market design. Several studies have shown
that market coupling under implicit auctioning leads to a reduction in producers’ market
power and a reallocation of rents from producers to consumers (Gilbert et al., 2004;
Parisio and Bosco, 2008; Ehrenmann and Neuhoff, 2009), but there exist also studies
that show that consumers might be hurt by increasing prices due to market coupling
(Hobbs et al., 2005). More recently, there have also been some empirical studies. Meeus
(2011b) and Parisio and Pelagatti (2014) discuss and analyze the interconnection between
Denmark–Germany and Italy–Slovenia, respectively. Finally, Creti et al. (2010) provide
some evidence from Italy.
In this paper, we provide a detailed account of the current status of market coupling
as a promising and efficient framework to organize the cross-border trade in electricity
between adjacent, yet institutionally separated market areas. As such, we contribute to
9Note that a grid or interconnection is defined as comprising several markets (such as PJM, NYISO,ISO-NE etc. for the Eastern Interconnection) that are electrically tied together and operate at asynchronized frequency. Currently, the three regional grids – the Eastern Interconnection, the WesternElectricity Coordinating Council (WECC), and the Electric Reliability Council of Texas (ERCOT) – areonly loosely tied together, which impedes, e.g., the transfer of “green” energy generated from wind inTexas or sun in Arizona to centers of high demand within the Eastern Interconnection.
10In 2012, Tres Amigas LLC and EPEX Spot have announced a joint cooperation agreement in orderto “share mutual expertise in the development and coupling of their respective markets” (EPEX-Spot,2012). EPEX Spot operates, among others, the coupled electricity spot markets in Germany and France.
4
the literature in the following ways. First, we give a comprehensive overview of the various
institutional frameworks currently in place for cross-border trade between electricity
markets. Given that these organizational settings are ultimately of high significance for
electricity volumes to be exchanged in the economically efficient direction, we explicitly
focus on microstructure effects, such as the timing sequence of traders’ decisions when
setting up a trade.
Second, we provide substantial empirical evidence of how electricity prices are
impacted by the different ways of organizing cross-border exchange between electricity
markets. Based on both interconnector flows and corresponding electricity prices in
adjacent markets, we contrast explicit and implicit allocation schemes and examine how
the workings of either mechanism are reflected in empirical spot price dynamics. For the
period under review, our empirical analysis clearly confirms the well-known inefficiencies
of explicit allocation schemes (resulting from traders having to acquire transmission
capacity before the price differential between the respective market areas has actually
been determined), which can effectively be avoided under a market coupling scenario. In
addition, however, we broaden the scope of our analysis by also discussing the behavior
of futures prices under market coupling, which has so far not been in the focus of extant
research.
Third, we assess the current achievements (and drawbacks) of the recent market
coupling initiative in Europe from a broader policy perspective. Taking price rigidities in
the French market as an example, it becomes obvious that individual electricity market
regulation on a national level may easily conflict with a supra-national framework such as
market coupling. To our knowledge, this aspect has not been discussed in the literature
thus far – and may well warrant further analysis in the future.
The remainder of this paper is structured as follows. Section II outlines the workings
of the explicit and implicit schemes in more detail and provides further institutional
background for the cross-border trading of electricity. Section III continues the discussion
of the two allocation regimes from an empirical point of view by examining in more detail
the price dynamics of coupled and non-coupled electricity markets in Europe. Section IV
discusses from a policy perspective how the merits and effectiveness of market coupling
5

find their boundaries in individual national policies that clearly oppose the idea of the
Internal Electricity Market. Section V concludes.
II Institutional Background
In a first step, we qualitatively discuss and compare the two existing allocation schemes
in the remainder of this section. This is important since, by its nature, cross-border
electricity trade is characterized by a variety of institutional specificities and operational
complexities, each of which with significant impact on the topic under consideration.
Thereby, several different electricity markets serve as examples for this discussion. We
then move on to conduct a detailed empirical analysis of the German-French electricity
market where both explicit and implicit allocation schemes have been (or still are) in place.
We hence carefully analyze the effect of market coupling by studying price convergence of
spot and futures prices in the German-French market before and after the introduction of
market coupling. Finally, in a last step, we discuss the issue of policy challenges arising
from differences in individual national market designs by using a case-study approach.
Here, taking again the French electricity market as an example, we discuss how classic
policy intervention can hinder the efficiency of a cross-border trading scheme such as
market coupling.
A. Explicit Allocation Schemes
The generally widespread implementation of explicit allocation mechanisms is mainly due
to the fact that they can quickly be set up without requiring a particularly high level
of institutional harmonization between adjacent electricity markets. Importantly, as is
characteristic of explicit schemes, physical transmission capacity markets and electricity
(spot) markets are separated from each other, with the former usually clearing ahead of
the latter. Hence, enabling cross-border trade in this way only requires a low degree of
integration and joint coordination between both transmission system operators (TSOs)
and power exchanges in adjacent markets. This avoids the necessity for a common trading
platform and uniform exchange rules, including a simultaneous closing of day-ahead
6

auctions for (spot) electricity across markets. However, given that day-ahead prices in
both markets are not yet known by the time that traders have to submit their bids
for transmission capacity, it generally leads to an inefficient market design.11 These
inefficiencies manifest in such interconnectors frequently not being used up to their
thermal capacity limits or in adverse physical flows, where electricity is directed from a
more expensive market to a cheaper connected market. In such a situation, cross-border
traders have failed to correctly anticipate the price spread ex-ante, and hence end up
having acquired transmission capacity for the “wrong” direction.
From an operational point of view, for most interconnectors, explicitly allocated
transmission rights are physical in nature and are assigned for a pre-specified direction of
flow (e.g., F→ GER) and for different timeframes. For instance, prior to the introduction
of market coupling at the French–German border, physical transmission rights (PTRs)
could be acquired via explicit annual, monthly, and daily auctions. Depending on the
timeframe, allocated transmission rights would hence entitle a trader to nominate and
physically exchange electricity in a given direction from one market to the other during
any hour of the year (month or day, respectively). Figure 1 illustrates in more detail the
relevant steps to set up such a cross-border transaction, taking as example the explicit
ex-ante auction scheme at the French–German border before it was replaced by market
coupling in 2010.12 When the holder of a periodic (i.e., monthly or yearly) transmission
right wanted to engage in a cross-border transaction on day t, the TSO had to be notified
by 08:15am on day t− 1 and provided with a schedule detailing the respective capacities
to be nominated during every hour on day t.13 In case these capacity holders did not want
to trade, their non-nominated capacities originally “earmarked” for periodic transactions
were implicitly transferred and added to those capacities to be allocated in the daily
market. In that case, according to the “use it or sell it” (UIOSI) principle, traders
with monthly or yearly rights received as financial compensation for every megawatt
11This is a well-documented fact in the literature. Inefficient cross-border trade across variousEuropean markets has been analyzed by, e.g., Turvey (2006), Kristiansen (2007), Marckhoff and Muck(2009), Bunn and Zachmann (2010), Bunn and Martoccia (2010), and McInerney and Bunn (2013).
12Although auction rules may differ across markets, the overall structure and timeline of the allocationprocedure described here can generally be seen as representative of other explicit ex-ante schemes.
13See RTE (2009a), p. 17, for transactions between Germany and France.
7
(MW) of non-nominated capacity the price as determined during the daily auction for the
corresponding hour.14 Based on the nominations received by the holders of monthly and
yearly transmission rights, the TSO then published an update of the available transmission
capacity (ATC) that was to be offered on the daily market by 08:45am on day t− 1; bids
for the daily auction then had to be submitted by 09:30am at the latest, and results
were released half an hour later.15 As already mentioned, this is well ahead of the close
of electricity spot (i.e., day-ahead) markets at around noon: 11:00am for the French
exchange Powernext and 12:00pm (noon) for its German counterpart EEX at that time.
Finally, having been awarded a transmission right in the daily market, traders had to
notify the TSO by 02:00pm whether they were going to use it and set up a cross-border
transaction on the following day t. As opposed to the UIOSI principle, for holders of daily
transmission rights, however, the “use it or lose it” (UIOLI) principle applied instead. In
the case of non-nomination, this implied that there was no financial compensation; these
unused rights were then, in turn, transferred to the intraday market.
With regard to the electricity markets in the US, the institutional design for cross-
border (i.e., market-to-market) transactions is less harmonized than in Europe and a
variety of different allocation methods coexists, sometimes even at the same border. While
a detailed description of these arrangements is beyond the scope of this article, we focus
on the following key issues. In view of the nodal pricing system in the US, combining
paths of fixed point-to-point transactions would generally allow a trader to ship electricity
across states with corresponding path reservations being allocated on a “first-come, first-
serve” basis. Given the inherent inefficiency of these fixed allocations, many markets
have replaced the physical reservations with a financial transmission rights framework
and offer-based export/import scheduling (Spees and Pfeifenberger, 2012). Alternatively,
several merchant lines have also been awarded transmission rights which are then re-
14See RTE (2009b), p. 20.15For further information on the functioning of the capacity daily market under explicit auction
schemes, see, e.g., Marckhoff and Muck (2009) who describe the auction design that used to prevail inthe capacity daily market at the Dutch-German border: “Investors bid price/volume combinations wereseveral bids per investor are allowed. In case the requested volume is lower than the available capacity,the PTR price is zero. Otherwise, all investors pay the price of the lowest successful bid. If there is morevolume requested at the lowest successful bid, the allocation for those bids is partitioned relative to therequested volume.”
8

allocated via long-term contracts or shorter-term auctions.16 Nevertheless, irrespective
of the precise institutional setting, bid selection and pricing by the independent system
operator (ISO) and the physical scheduling of a market-to-market transaction are still
two clearly distinct procedures for most electricity markets in the US. Hence, whereas
other non-auction based allocation mechanisms may be more common in the US, these
mechanisms share a crucial feature of explicit schemes, i.e. of requiring traders to schedule
their transactions ex-ante. Even though there are increasing efforts to move the physical
scheduling process closer to real-time,17 traders still need to rely on an expectation of the
price spread between markets, which is – roughly speaking – comparable to the explicit
allocation schemes used in Europe.
B. Implicit Allocation Schemes
By contrast, the concept of market coupling avoids the above timing problem for
cross-border traders by clearing capacity and electricity markets simultaneously, i.e., by
implicitly allocating transmission rights within the spot auction of electricity in each
market. Conceptually, a pricing mechanism that is closely related to market coupling
has already been implemented in the Nordic market, Nord Pool, the common electricity
market for Norway, Denmark, Sweden, Finland, Estonia, Latvia, and Lithuania. Here,
in a first step, the market clearing system price is determined by equating total demand
and supply, as aggregated across each national market, thereby ignoring any potential
constraints in transmission capacity between bidding areas.18 Hence, in the case of no
congestion, there is a single price for all bidding areas. Otherwise, depending on the
location of the transmission bottleneck(s), the market is “split” into several pricing zones
16Examples include the Hudson and Linden Variable Frequency Transformer (VFT) interconnectorsat the PJM–NYISO border.
17For instance, the PJM and NYISO markets have recently proposed “Coordinated TransactionScheduling” (CTS) where traders have the option to submit a price spread at which they are willingto set up a market-to-market transaction rather than placing individual bids in each market. While thisis supposed to enhance economically efficient interconnector use, transactions still need to be scheduledbased on an expectation of the spread.
18In the Nordic market, national markets are further subdivided into one or more bidding areas,reflecting transmission bottlenecks both within and across national markets. For instance, the Danishmarket is subdivided into two bidding areas (Western and Eastern Denmark) which are linked by a 600MW interconnector that is frequently congested.
9

that are assigned different area prices, and that comprise one or more bidding areas.
The results of the “market splitting” mechanism are in general similar to what is
achieved by the variant of market coupling that is currently being implemented between
major Western European markets, and that is examined in this study. Yet, in contrast
to Nord Pool, it is not a single power exchange that determines (in a “top-down” way)
whether to subdivide or retain a single pricing zone across markets. Instead, market
coupling is characterized by a more de-centralized (“bottom-up”) approach where the joint
coordination effort between all involved national TSOs and power exchanges determines
which national markets are “coupled” with each other to form a single pricing zone.
Specifically, for every day and each interconnector, TSOs determine the amount of
ATC for which the corresponding transmission rights are no longer allocated explicitly
but instead assigned to the respective power exchanges in the adjacent markets. In
order to achieve spot price convergence, a joint optimization algorithm considers the net
import/export positions of each participating exchange for a given clearing price and thus
determines the optimal cross-border flows. As such, a buy-order in a higher-priced market
can be matched with a sell-order in a cheaper adjacent market, thus mitigating the price
differential, with any resulting cross-border flows implicitly covered by the transferred
capacity rights. As shown by Meeus et al. (2009) or Weber et al. (2010), the underlying
optimization problem can be re-formulated as maximizing overall welfare, constrained by
interconnector capacities and other real-time limitations. If one of these constraints is
binding – e.g., if the flows necessary to equalize prices exceed the ATC – then prices
cannot fully converge and the resulting congestion rent is collected by the owner of the
interconnector.
The previously outlined explicit setup at the French–German border was modified
when Germany joined the already existing market coupling between France, the
Netherlands, and Belgium (the so-called “Trilateral Coupling”) on 09-Nov-2010, marking
the starting point for the Central Western Europe (CWE) day-ahead market coupling. As
a major change to the pre-existing setting, an explicit allocation of transmission rights for
interconnector access is henceforth only held for monthly and yearly contracts, whereas
on a day-ahead stage all cross-border transmission capacities are available to cover the
10

market coupling flows.19 Following the harmonization of day-ahead gate closure times
(12:00pm noon) at all involved power exchanges, the market coupling algorithm then starts
to determine the optimal cross-border flows at around 12:05pm. Finally, the resulting
day-ahead prices are published by the CWE power exchanges by 12:55pm.20
III Empirical Analysis
A. Ex-Ante Scheduled Transactions in Europe
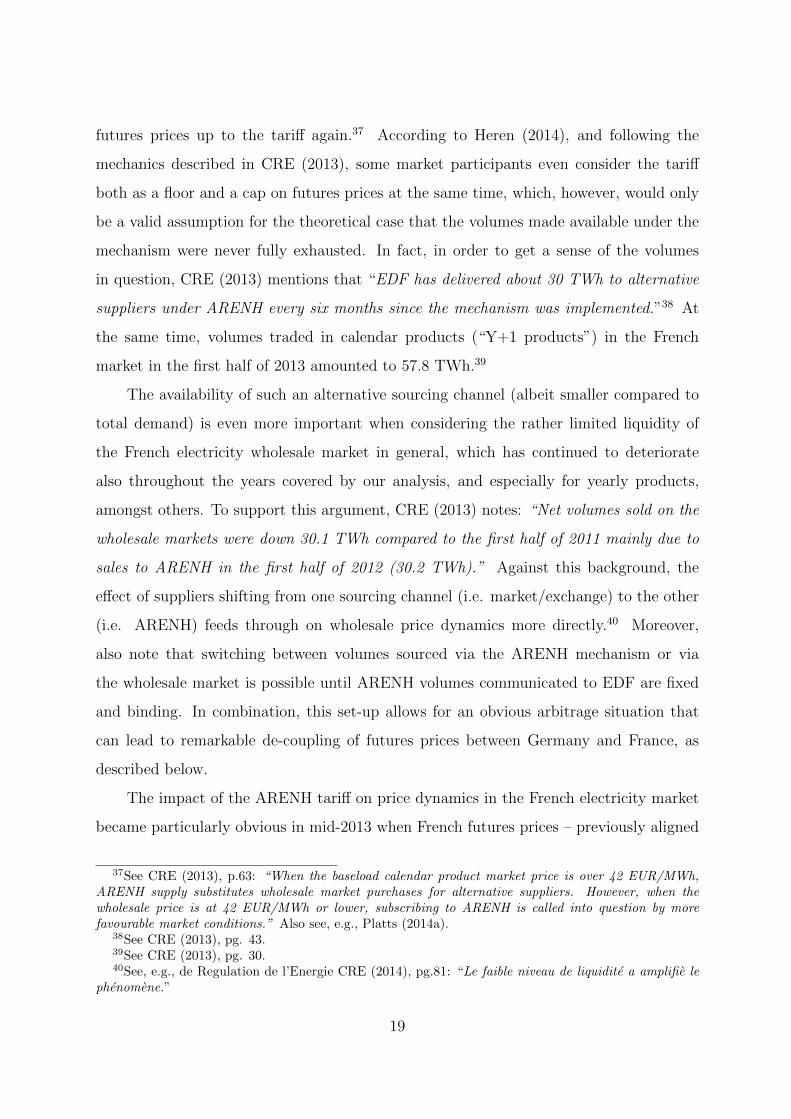
The general economic inefficiency of explicit ex-ante schemes is analyzed in Figure 2,
where the graph plots the spread between German and French day-ahead power prices
against corresponding net transit nominations as a percentage of available interconnector
capacity (sample period from 26-Oct-2006 to 09-Nov-2010, i.e. pre-market coupling).
Clearly, not only are interconnector capacities often left (partially) unused, although a
non-zero price spread in an efficient market setting would call for additional cross-border
flow until the price spread was fully exploited or the maximum interconnector capacity
was reached. Even worse, out of all nominations, approx. 32% led to flows in the wrong
direction altogether.
On a more detailed level, the data also reveal that during both peak and off-peak
hours, French day-ahead power prices exceed German prices more frequently than vice
versa – or, more precisely, during approx. 58% of all hourly periods.21 This pattern, in
turn, also seems to impact the nomination behavior by cross-border traders: conditional
on the spread being negative. In other words, for French day-ahead prices exceeding
German prices, net interconnector flows in the economically correct direction (i.e., to the
higher-priced market) can be observed during approx. 82% of all hourly peak and off-peak
19Note that the transmission capacity of an interconnector is usually “sliced” and allocated for differenttimescales. Thus, off-exchange transactions, such as customized OTC cross-border trades, can still beexecuted by traders acquiring monthly or yearly transmission rights, whereas all remaining interconnectorcapacity can be used by power exchanges for market coupling purposes. Importantly, as pointed out byMeeus (2011a), retaining such a split helps to avoid a potential monopolization of the entire organizationof cross-border trade of electricity by the power exchanges participating in market coupling.
20See http://www.marketcoupling.com/about-emcc/daily-operations.21Also note that the French–German interconnection, as a series of multiple alternating current (AC)
links, has a higher capacity for GER→F than for F→GER.
11

periods.22 By contrast, given a positive day-ahead spread (i.e., German prices exceed
their French counterparts), the share of net interconnector flows in the right direction is
disproportionately lower and correct flows can only be observed during approx. 49% of all
hours. Hence, market participants tend to bet on a negative spread, with a positive spread
not only being less frequently observed but apparently also harder to predict correctly.
This diverse picture also manifests itself as regards the degree of net capacity
utilization. On an overall basis, interconnectors are used at slightly less than 50% of
their thermal capacity when French power prices exceed German power prices. For the
opposite case, average net capacity utilization even gets driven down to less than 10%
since, as mentioned above, adverse flows are observed more frequently. Disaggregating
further, we can observe that for a price spread of up to 5 EUR/MWh (in either direction)
and excluding all adverse flows,23 French–German interconnectors are still used at only
slightly more than 40% of their thermal capacity. For the complementary case where only
price spreads larger than 5 EUR/MWh are considered, “gross” capacity utilization for
flows in the economically correct direction increases to 69%. Clearly, a comparably lower
(absolute-level) spread between day-ahead prices increases the likelihood for traders of
having predicted it wrongly during the capacity auction and of hence having to engage in
an unprofitable trade, which ultimately reduces both gross and net capacity utilization.
A general caveat is in order here: We generally acknowledge that “inefficient” flows
from high- to low-priced markets may in the end be caused by loop flows, as they typically
occur within highly meshed grids such as in Europe. As such, the above analysis may
likely have been subject to related distortions. While it is impossible to mitigate this issue
in practice, we point out to a specific pair of markets where loop flows could be excluded
from the research design: the British-French interconnection. Bunn and Zachmann (2010)
investigate the efficiency of interconnector flows between these two markets and, although
avoiding distortions from loop flows, still find that there are evident inefficiencies from
22Note that in practice, traders may schedule more flows for those hours where they can be sure toproperly anticipate the price differential between the markets. Hence, on a volume-weighted basis andconditional on a negative spread, even 93% of all exchanged MWs have flowed in the correct direction.
23By contrast, the previous two examples related to net capacity utilization including adverse flows.In the theoretical case of an interconnector being used up to its full thermal capacity in both directions,the resulting net capacity utilization would then accordingly be 0%.
12

related interconnector flows in the “wrong” direction.24
B. Spot and Futures Prices under the CWE Market Coupling
The start of the CWE market coupling has fundamentally changed the dynamics
of the day-ahead price spreads between Germany–France and Germany–Netherlands,
respectively. Figure 3 illustrates this for hours 9 and 18 of the day. For both
hourly periods, with few exceptions at mid-November 2010, the spreads are mainly
negative or zero, providing clear evidence for interconnector flows henceforth taking
economically correct directions – i.e., from the then mainly lower-priced German market
to the higher-priced Dutch and French day-ahead markets. The data show that until
year-end 2010, exact price convergence was reached in 81% of all hourly periods for the
German–Dutch day-ahead spread and in approx. 52% of all hours for the German–French
spread. Note, however, that for specific hours of the day, these percentages can vary
significantly. For instance, for the German–French spread over the same period, German
day-ahead prices during hour 24 of the day tend to clearly fall below French prices, so that
price convergence could only be reached during less than 23% of all hours. By contrast,
for hour 17 (18), a zero price spread was observed during 80% (74%) of all periods.
These patterns also manifest themselves when analyzing the long-term behavior of the
day-ahead spread between the German and the Dutch electricity market, as illustrated
in Figure 4. For the spread between the prices of electricity to be delivered in both
markets during hour 12 (11:00am–12:00pm/noon) on the next day, Figure 4 shows that
since the introduction of the CWE market coupling, positive price spreads were no longer
observed at all – with very few, notable exceptions. On 27 March 2011, after the close of
the day-ahead auction for the following day, the market coupling optimization algorithm
could not be run due to a bug in the system which was ultimately caused by the change
to daylight-saving time on that day. Consequently, as a fallback mechanism in the case of
such a de-coupling, explicit (“shadow”) auctions had to be organized in order to allocate
24In the meantime, the English-French interconnection is no longer the only link between Britain andthe Continent. Additional interconnection capacity has been made available, such as BritNed betweenEngland and the Netherlands, yet had not been commissioned by the time when Bunn and Zachmann(2010) undertook their study.
13
the available daily transmission capacity.25 For the remaining days, however, the spread
was either zero or negative, implying that whenever available transmission capacity is
insufficient in order to reach price convergence between the two markets, this applies to
flows for the direction GER→NL, but not vice versa. More recently, negative spreads
have been slightly more prevalent, thus driving down the rate of price convergence, which
can be attributed to the steadily growing renewables feed-in in Germany, combined with
continued strong levels of natural gas prices affecting the gas-based Dutch electricity
market.26
Table 1 summarizes the above qualitative observations by providing descriptive
statistics for the German–Dutch day-ahead spread during selected hours of the day and
for the corresponding baseload spread, i.e. the average of all 24 hourly spreads. The key
characteristic of market coupling, i.e., price convergence driving down the spread to zero,
is reflected in several of the statistics. For instance, note that a zero baseload spread
could be observed for approx. 30% of all days since 09-Nov-2010, implying that price
convergence was not only reached for several hours, but even for all 24 hours on these
days. On a more detailed level, we also see that conditional on the spread being negative,
both mean and standard deviation tend to be lower. Consequently, since the introduction
of market coupling, not only can negative spreads si < 0 be observed less frequently,
their spikiness is also reduced in terms of absolute size and variation. This change in
the dynamics of the spread and, hence of its individual components, can be explained
by the fact that under market coupling, supply and demand shocks occurring in the
interconnected markets can be mitigated more easily – to the extent that these shocks
are non-synchronous. The coordination of cross-border flows between coupled markets
always helps to reduce the economic scarcity (abundance) of net supplies that is signaled
by electricity prices in one market spiking upwards (downwards).27
While the results in Table 1 merely confirm the general working of the basic
25See, e.g., EPEX-Spot (2011) or CREG (2011). A positive spread could also be observed on 29-Oct-2011, which, interestingly again coincides with the clock change back to winter time.
26The role of natural gas as marginal fuel in the Dutch market has been further strengthened dueto additional exports to Great Britain since the commissioning of the BritNed subsea cable (linking theDutch with the British market).
27See De Jonghe et al. (2008) and Huisman and Kilic (2013) for an analysis of such volatility reductionpotential in the context of the Trilateral Market Coupling between France, Belgium, and the Netherlands.
14

market coupling idea, i.e., fostering price convergence by achieving economically efficient
cross-border trade, these empirical findings – in hindsight – could not have been expected
from the outset: Keppler et al. (2014), for example, report a significant deterioration in
convergence rates for German and French electricity spot prices for the years post-2012,
thereby essentially reversing the increases in welfare that the market coupling mechanism
initially had achieved during the years 2011 and 2012.28 Taking the German-Dutch
border as another example, Platts (2014b) briefly summarizes what can already be seen
in Figure 4: A clear deterioration in convergence at this border, too, ultimately driven
by “the Netherlands importing Germany’s national energy policy in the shape of massive,
fluctuating volumes of subsidized green power.” As such, the initial performance of the
market coupling mechanism right after the beginning of the CWE coupling in end-2010
appears remarkable; yet the drop in convergence rates thereafter raises doubts about
its ability in the long-term to mitigate adverse fundamentals underlying each individual
market, as evidenced by the massive challenges that the ever-increasing inflow from
renewable generation in Germany has put on the entire system.
Finally, as regards the impact of market coupling on futures prices, both empirical
findings and theoretical arguments provide a mixed picture thus far. On the one hand, as
is well known, it is the non-storability of electricity that causes the classic cost-of-carry
relationship between spot and futures prices to break down, which has led to the common
perception that electricity has a “split personality” with respect to spot and futures prices
(Pilipovic, 1998). As such, the argument that futures prices under market coupling need to
converge solely “because spot prices do” does not hold. On the other hand, and regardless
of the above, the well-known interpretation of futures prices as expected spot prices at
maturity under a suitably chosen (possibly non-unique) pricing measure (Cox and Ross,
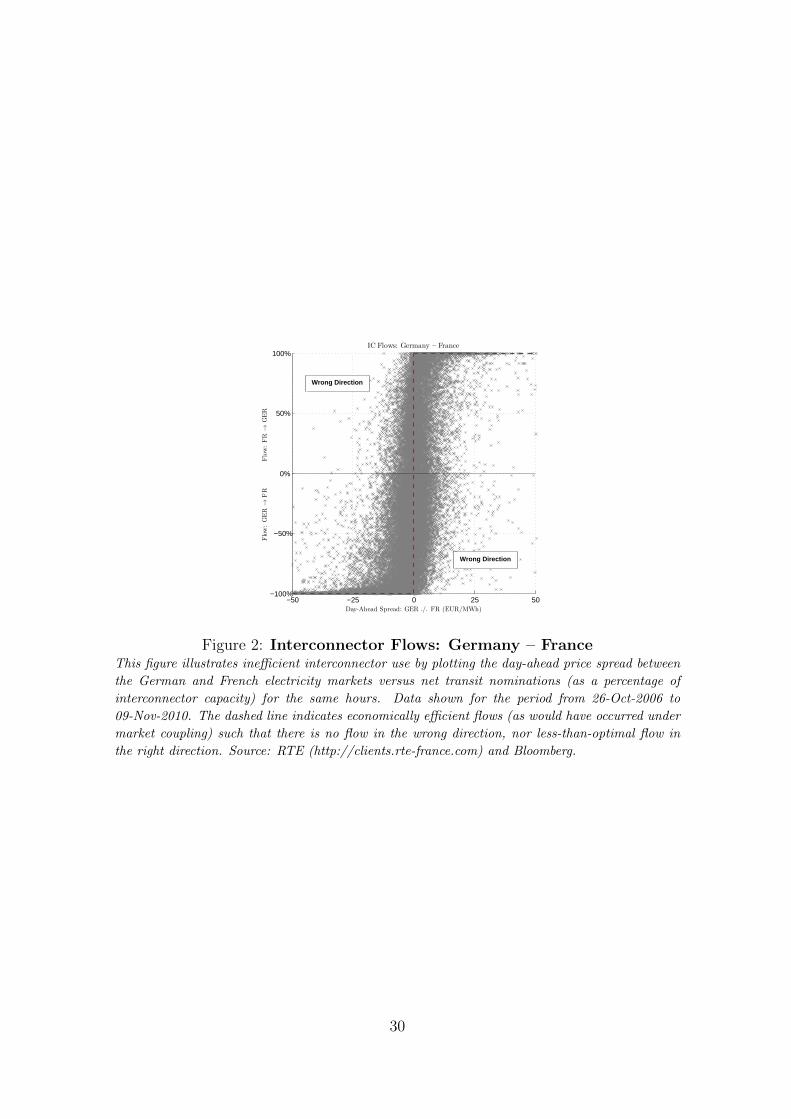
1976; Harrison and Kreps, 1979) still holds – also for electricity. Therefore, the fact that
the one-year-ahead German–Dutch futures spread in Figure 5 qualitatively tracks the
flat and, later on, widening trajectory of the corresponding spot spread during the years
28Keppler et al. (2014), for instance, estimate that the annual consumer surplus in the French electricitymarket increased by EUR1.5 billions in 2012.
15
2011 and 2012 in Figure 4, may be seen to be in line with this reasoning.29 Empirically,
the average spread between one-year-ahead German and Dutch futures contracts (from
01-Jan-2006 until the start of market coupling) amounts to -4.49 EUR/MWh, whereas the
average post-coupling spread has reduced to -1.23 EUR/MWh (0.05 EUR/MWh in 2011
and -2.61 EUR/MWh in 2012). Yet these results remain slightly inconclusive – especially
in view of a generally highly non-constant supply side in each of the two markets.30 By
contrast, the widening of the German–French futures spread since 2012 is not primarily
attributable to market-endogenous, fundamental factors, but to an external policy factor,
as will further be outlined in the Section IV.
IV Future Policy Challenges
With the institutional framework for market coupling now fully laid out, we shall focus
on the policy challenges that arise when a supra-nationally organized framework, such
as market coupling, meets with the “market realities” in each of the markets that have
joined the coupling mechanism. For although the previous analyses have found promising
indications that price convergence in European markets may be realized, there are still
considerable obstacles to market coupling becoming an actual “success story.” First of
all, these obstacles have to be seen in the continued scarcity of interconnector capacity –
a situation that is characteristic for European cross-border trade in electricity and that
is furthermore aggravated by massive increases in intermittent (renewable) generation
causing congestion on interconnectors even more frequently: Germany’s renewable energy
policy serves as a prime example here and we refer to Keppler et al. (2014) as one of the
first studies that investigates the potential link between increasing, volatile wind and solar
feed-in and decreasing price convergence rates within the CWE market coupling. Yet while
restrictions in available interconnector capacity (that could help improve convergence rates
29This simplified argument assumes any potential risk premia to be constant and sets expected spotspreads equal to realized spreads. Further note that although movements in the German–Dutch spot andfutures spreads may coincide as displayed in the two figures, Figure 4 only displays the day-ahead spreadfor hour 12 of the day and not an average baseload spread.
30For instance, structural changes such as the German nuclear phase-out or a further continued increasein German renewable generation capacity (that outpaces their European neighbors) may well have beenanticipated and reflected in futures prices at that time already, but not in spot prices.
16

again) and their inherent “drain” on the performance of the market coupling mechanism
have to be seen as a given, we want to primarily focus on the policy challenges that a
market coupling setting, once fully established and in place, may still face, i.e. irrespective
of how interconnector capacities or other market fundamentals are supporting or hindering
the functioning of the mechanism: We envisage these challenges primarily emanating from
individual electricity market policies on a national level that will inevitably see market
coupling run into headwinds to the extent they may even help to preserve price divergence
rather than convergence. This section focuses on a prominent example for national
electricity market regulation not in accordance with the EU-wide target of promoting the
Internal Electricity Market, and highlights from a policy point of view both the reasons
and the implications thereof.
The French electricity wholesale market has been integrated into a market coupling
framework since 2006, the start of the Trilateral Market Coupling between Belgium,
France, and the Netherlands.31 Given the strong position of (quasi-) integrated utility
Electricite de France (EDF) in both the generation and retail markets, enhancing further
competition, especially on the retail side, had been a top priority for policymakers since
the liberalization of the French market.32 In order to foster retail market entry and enable
new suppliers to participate in the cost advantages that EDF enjoyed thanks to its strong
nuclear generation position in the wholesale segment, other electricity suppliers were to
be supported via a fixed tariff at which they could purchase electricity from EDF. As
stipulated by the “NOME”33 Law passed by the French Government in 2010, EDF is
currently required to make available up to 25% of its nuclear electricity generation to
31The Trilateral Market Coupling was later extended when the German electricity wholesale marketjoined the existing arrangement to form the CWE market coupling.
32In fact, since the early 2000s, there have been several attempts by the European Commission (EC)to promote further competition on the French retail market. In 2006, it sent out a reasoned opinionto the French Government, complaining about yet incomplete implementation of the Electricity MarketDirectives. Among a number of issues, the Commission also criticized the “persistence of regulated supplytariffs for eligible clients, which blocks the arrival of newcomers and prevents the free choice of supplier”(EC, 2006). In fact, lower price levels for electricity in the retail market than in the wholesale market backat that time had helped to keep the barriers to entry high for potential alternative electricity suppliers.In 2007, the EC also launched a formal State Aid investigation on French retail electricity tariffs for largeand medium-sized companies (EC, 2007). For further information on the French retail electricity market,see, e.g., Creti et al. (2013).
33Nouvelle Organisation du Marche de l’Electricite – New Organization of the Electricity Market.
17

suppliers at a fixed tariff known as ARENH.34 The level of this regulated wholesale price
is intended to reflect the full cost of nuclear-generated electricity, i.e., essentially EDF’s
costs for operating and maintaining its nuclear plants as well as reactor life extensions
and future upgrades. Hence, by allocating ARENH volumes at such a fixed price to
alternative suppliers, their sourcing costs should decrease, thus finally supporting their
cost structures to become more competitive vis-a-vis a fully integrated utility such as
EDF.
When the ARENH mechanism finally came into effect in July 2011, the tariff had
initially been set to 40.00 EUR/MWh until 01-Jan-2012 and was subsequently increased
to today’s level of 42.00EUR/MWh. In early 2014, the tariff and its method of calculation
were under review, facing several delays as well as a strong political and public debate
around the question of what the “proper” costs for EDF’s nuclear-generated electricity
should be.35
From a contractual point of view, ARENH electricity volumes are allocated to
retail suppliers on a yearly basis,36 so that ARENH’s products are most comparable to
electricity futures contracts (as opposed to spot contracts). Consequently, practitioners
have frequently pointed to the importance of the ARENH tariff as a reference price for
the electricity futures market, notably one-year ahead futures contracts. When futures
prices for wholesale electricity rise (far) above the tariff, alternative suppliers will source
their volumes at the cheaper rate as offered by the ARENH mechanism, thus reducing
demand and liquidity at the OTC- and exchange-based forward and futures markets. For
the opposite case of wholesale prices falling below the tariff, previously ARENH-sourced
volumes have been observed to add to overall wholesale demand, thus driving traded
34Acces Regule a l’Electricite Nucleaire Historique - regulated access to historic nuclear energy. Note,however, that the amount of generation to be provided by EDF via the ARENH mechanism is capped at100 terrawatt hours (TWh).
35In this context, also see, e.g., Solier (2010): “Se pose alors la question de l’asymetrie d’informationentre le regulateur et l’operateur historique pour la determination des couts supportes par ce dernier.”
36See, e.g., Commission Decision 2012/C 398/05: “The first period of delivery of regulated access toexisting nuclear power started on 1 July 2011. Thirty-two suppliers signed a framework agreement withEDF and 61,3 TWh of regulated access to existing nuclear power were to be delivered between 1 July 2011and 30 June 2012.”
18
futures prices up to the tariff again.37 According to Heren (2014), and following the
mechanics described in CRE (2013), some market participants even consider the tariff
both as a floor and a cap on futures prices at the same time, which, however, would only
be a valid assumption for the theoretical case that the volumes made available under the
mechanism were never fully exhausted. In fact, in order to get a sense of the volumes
in question, CRE (2013) mentions that “EDF has delivered about 30 TWh to alternative
suppliers under ARENH every six months since the mechanism was implemented.”38 At
the same time, volumes traded in calendar products (“Y+1 products”) in the French
market in the first half of 2013 amounted to 57.8 TWh.39
The availability of such an alternative sourcing channel (albeit smaller compared to
total demand) is even more important when considering the rather limited liquidity of
the French electricity wholesale market in general, which has continued to deteriorate
also throughout the years covered by our analysis, and especially for yearly products,
amongst others. To support this argument, CRE (2013) notes: “Net volumes sold on the
wholesale markets were down 30.1 TWh compared to the first half of 2011 mainly due to
sales to ARENH in the first half of 2012 (30.2 TWh).” Against this background, the
effect of suppliers shifting from one sourcing channel (i.e. market/exchange) to the other
(i.e. ARENH) feeds through on wholesale price dynamics more directly.40 Moreover,
also note that switching between volumes sourced via the ARENH mechanism or via
the wholesale market is possible until ARENH volumes communicated to EDF are fixed
and binding. In combination, this set-up allows for an obvious arbitrage situation that
can lead to remarkable de-coupling of futures prices between Germany and France, as
described below.
The impact of the ARENH tariff on price dynamics in the French electricity market
became particularly obvious in mid-2013 when French futures prices – previously aligned
37See CRE (2013), p.63: “When the baseload calendar product market price is over 42 EUR/MWh,ARENH supply substitutes wholesale market purchases for alternative suppliers. However, when thewholesale price is at 42 EUR/MWh or lower, subscribing to ARENH is called into question by morefavourable market conditions.” Also see, e.g., Platts (2014a).
38See CRE (2013), pg. 43.39See CRE (2013), pg. 30.40See, e.g., de Regulation de l’Energie CRE (2014), pg.81: “Le faible niveau de liquidite a amplifie le
phenomene.”
19

with German futures prices in a general downward movement – kept oscillating around
the currently prevailing ARENH threshold, as shown in Figure 6. CRE (2013) accordingly
notes: “(...) Therefore, for supply for 2014, this mechanism provides alternative suppliers
with trade-off opportunities until 15 November 2013 when alternative suppliers must define
the firm quantities they wish to purchase under the ARENH. (...) The stabilisation
of French prices at 42 EUR/MWh in May and June 2013 reflects actions on the
market by participants involved in the ARENH mechanism. This mechanism explains the
polarisation of transaction around 42 EUR/MWh.” As can be imagined, the oscillating
behavior of the French futures price at that time is supported by arbitrage trades of
market participants that switch between the two sourcing channels (e.g. selling contracted
volumes initially agreed at prices below the ARENH level of 42 EUR/MWh once the
wholesale price would jump above the threshold and vice versa). In addition, suppliers
with access to ARENH are effectively assigned a long position in electricity with the
strike price of the call option set at the ARENH level of 42 EUR/MWh. Most likely,
suppliers therefore have contributed to the above mentioned oscillating price behavior by
writing call options, as supposed by de Regulation de l’Energie CRE (2014). Consequently,
with French prices at least temporarily supported by the tariff and with German prices
continuing their downturn, the futures spread between the two countries has widened
significantly in the course of 2013, even exceeding the 6 EUR/MWh threshold in absolute
terms.
Clearly, the existence of a fixed-price mechanism, such as the ARENH regime, cannot
be in accordance with the aims of the EU to establish a common electricity market across
European borders. Although market coupling, from a technical point of view, only targets
spot price convergence and does not directly interfere with forward and futures markets,
the classic perception of futures prices as expected spot prices nevertheless establishes
a link between these markets. Furthermore, although there are various effects on the
futures spread when switching to a coupling-based cross-border allocation mechanism,
a decoupling of futures prices as displayed in Figure 6 is, of course, not in line with
the theory of interconnected electricity markets. From a more general point of view,
despite the “split personality” of electricity prices (see Section III), the Internal Electricity
20

Market, as envisaged by the EU, should also seek to eliminate differentials in futures prices
between coupled markets – especially given that trade in futures contracts still surpasses
traded spot volumes by a factor of 5-7.41
More generally, this case is a prime example of a market structure deficiency that is
caused by the sequential evolution of electricity markets from national isolation towards
pan-European integration: While the ARENH mechanism may indeed be instrumental in
fostering competition on the retail level, subsequently overlaying such price rigidity with a
market coupling framework that essentially relies on wholesale prices adjusting freely, may
only yield a suboptimal market design. As such, whereas the implementation of market
coupling has also helped to harmonize wholesale spot markets and related institutions
across Europe, the generally holistic pan-European focus of the coupling initiative conflicts
with non-market-based allocation procedures in individual member states.
In view of the planned further roll-out of market coupling initiatives across Europe,
much of the discussion, thus far, has focused on the technical feasibility of this project.
With more and more markets joining the coupling, this will require even more powerful
mathematical algorithms to solve the optimization problem posed by the coupling
process.42 However, as highlighted in this example, whenever extending a coupling
mechanism by new member states/markets, “soft” criteria such as (i) vertical integration
of market participants and (ii) competitiveness in upstream/downstream markets will
need to be focused on more strongly than in the past. Otherwise, the idea of a common
market zone across multiple countries will only extend to certain markt segments of similar
structure across borders and, thus, will necessarily remain incomplete.
41Based on data provided by CRE (2013) for the French market.42The CWE market coupling is accompanied by other regional coupling initiatives throughout Europe,
such as the South-Western Europe (SWE) coupling between France, Spain and Portugal, or theNorth-Western Europe (NWE) coupling between CWE and the Scandinavian/Baltic countries. Withinthe “Price Coupling of Regions” (PCR) initiative, these different coupling projects are planned to beintegrated in order to finally reach the EU policy goal of a single Internal Electricity Market.
21

V Conclusion
Creating a common electricity market, one of the top priorities on the energy policy
agenda of the EU, is a complex and multifaceted task. Establishing a framework for
cross-border trading to exchange surplus generation between adjacent markets generally
opens up the possibility for prices across markets to converge under certain conditions
and, importantly, for the well-known efficiency gains of free trade to be realized. However,
as shown in this paper, the merits of cross-border trading per se can vary dramatically
depending not only on market fundamentals but, likewise, on the actual mechanics and
institutional design governing the exchange of electricity across markets.
Market coupling schemes have proven very successful as a way to achieve cross-border
flows in an economically efficient direction from low-price to high-price markets, thereby
avoiding the classic “defect” of explicit allocation schemes which are especially prone to
cause inefficient flows in the wrong direction. However, these efficiency enhancements,
as reflected in more frequent spot price convergence across markets, do not necessarily
translate into converging prices in other segments of the electricity market such as the
futures market. As we have seen, individual energy market policies on a national level
can act as severe obstacles, albeit temporarily, to the benefits of market coupling being
fully realized.
However, the history of electricity markets in Europe shows that individual national
(and formerly even isolated) markets had been established well before the idea of creating
a single market was put forward by the EU. As such, apart from the technical effort to
harmonize an increasing number of markets with different trading platforms, gate closure
times and other specificities, market coupling also faces the difficulty of linking historically
developed markets that strongly differ in terms of competitiveness along the energy value
chain. While not a case for the German or UK retail electricity markets, competition in the
French retail market suffers from a highly concentrated market structure where alternative
suppliers are granted access to cheaper nuclear generation volumes at a reduced fixed price
via the ARENH mechanism. Yet such a tariff represents a classic example of how price
rigidities in a single market not only take away liquidity from wholesale spot and futures
22

markets, but also help to maintain the very price differences that market coupling actually
seeks to eliminate.
In the future, it remains to be seen how the success of market coupling can be
preserved despite the increasing number of individual national energy market regulations
it will have to accommodate during its further roll-out. Further challenges ahead include,
e.g., the reformation of renewables support schemes in countries like Germany, and,
moreover, the potential introduction of capacity mechanisms in a number of European
markets. As a point in case, the new electricity market design in the UK was among
the first to introduce a capacity remuneration mechanism, thus posing a new threat
to the efficiencies and welfare gains expected from the pan-European coupling roll-out:
under market coupling, how will energy-only markets interact with those markets where
capacity payments are in place? New problems are bound to arise given that cross-border
flows will no longer be determined by the underlying fundamentals in each respective
market, but also by the way how available capacity is remunerated on both sides of the
interconnector.43 For the US, in a similar manner, ongoing efforts to promote market
integration will likely continue to be hindered by regulatory disconnects between different
market areas (see, e.g., Section II). Given this outlook, a common energy market policy
among EU member states (or across the US) must not only focus on price convergence as
key benchmark for the realization of a single electricity market; as a prerequisite to start
with, a more holistic approach will instead be required to also focus on the frequently
diverging sets of regulations as well as on their idiosyncracies that, at least in the past,
have been overlooked too often.
43See, e.g., Baker and Gottstein (2013) for more information on the problem of “double payments”if an energy-only market is coupled with a market where a capacity remuneration mechanism has beeninstalled.
23

References
P. Baker and M. Gottstein. Capacity markets and european market coupling - can they
co-exist? Working Paper, 2013.
R.E. Bohn, M.C. Caramanis, and F.C. Schweppe. Optimal pricing in electrical networks
over space and time. RAND Journal of Economics, 15(3):360–376, 1984.
D.W. Bunn and M. Martoccia. The Efficiency of Network Transmission Rights as
Derivatives on Energy Supply Chains. Journal of Derivatives, 18(2):46–57, 2010.
D.W. Bunn and G. Zachmann. Inefficient arbitrage in inter-regional electricity
transmission. Journal of Regulatory Economics, 37(3):243–265, 2010.
H.-P. Chao and S. Peck. A market mechanism for electric power transmission. Journal
of Regulatory Economics, 10:25–59, 1996.
J.C. Cox and S.A. Ross. The valuation of options for alternative stochastic processes.
Journal of Financial Economics, 3(1–2):145–166, 1976.
Commission de Regulation de l’Energie CRE. Wholesale electricity, CO2, and gas market
functioning. 2012-2013 Report, 2013.
Commission de Regulation de l’Electricite et du Gaz; CREG. The price spike on Belpex
DAM for 28-03-11. 2011. URL http://www.creg.info/pdf/Etudes/F1099EN.pdf.
A. Creti, E. Fumagalli, and E. Fumagalli. Integration of electricity marktes in europe:
Relevant issues for italy. Energy Policy, 38:6966–6976, 2010.
A. Creti, J. Pouyet, and M.E. Sanin. The NOME Law: implications for the French
electricity market. Journal of Regulatory Economics, 43(2):196–213, 2013.
C. De Jonghe, L. Meeus, and R. Belmans. Power Exchange Price Volatility Analysis
After One Year of Trilateral Market Coupling. Working Paper, Katholieke Universiteit
Leuven, 2008.
Commission de Regulation de l’Energie CRE. Wholesale electricity, CO2, and gas market
functioning. 2013–2014 Report, 2014.
EC. The Commission takes action against Member States which have still not properly
opened up their energy markets. Press Release (IP/06/1768), 2006.
EC. State aid: Commission opens investigation into regulated electricity tariffs in France.
Press Release (IP/07/815), 2007.
24

A. Ehrenmann and K. Neuhoff. A comparison of electricity market designs in networks.
Operations Research, 57:274–286, 2009.
ENTSO-E. Ten-Year Network Development Plan. 2012. URL https://www.entsoe.eu/
major-projects/ten-year-network-development-plan/tyndp-2012.
EPEX-Spot. 27 March 2011 CWE Incident – Public message to the market parties.
2011. URL http://static.epexspot.com/document/12668/CWE_MC_SC_1107-04d_
Communication_to_market_parties_final.pdf.
EPEX-Spot. Joint Cooperation Agreement Executed Between EPEX Spot And Tres
Amigas. 2012. URL http://static.epexspot.com/document/17470/2012-01-10_
Tres%20Amigas_EPEXSPOT.pdf.
R. Gilbert, K. Neuhoff, and D. Newbery. Allocating transmission to mitigate market
power in electricity networks. RAND Journal of Economics, 35:691–709, 2004.
J.M. Harrison and D.M. Kreps. Martingales and arbitrage in multiperiod securities
markets. Journal of Economic Theory, 20(3):381–408, 1979.
ICIS Heren. New French ARENH electricity tariff calculation delayed. Market
Commentary for 27 February 2014, 2014.
B.F. Hobbs, A.M. Rijkers, and M.G. Boots. The More Cooperation, The More
Competition? A Cournot Analysis of the Benefits of Electric Market Coupling. The
Energy Journal, 26(4):69–97, 2005.
W.W. Hogan. Contract Networks for Electric Power Transmission. Journal of Regulatory
Economics, 4(3):211–242, 1992.
R. Huisman and M. Kilic. A history of European electricity day-ahead prices. Applied
Economics, 45(18):2683–2693, 2013.
J.H. Keppler, S. Phan, Y. Le Pen, and C. Boureau. The impact of intermittent renewable
production and market coupling on the convergence of french and german electricity
prices. CEEM Working Paper 2014-07, 2014.
T. Kristiansen. An assessment of the German-Danish cross-border auctions. Energy
Policy, 35(6):3369–3382, 2007.
J. Marckhoff and M. Muck. Jump Risk Premia in Short-Term Spread Options: Evidence
from the German Electricity Market. Working Paper, University of Bamberg, 2009.
25

C. McInerney and D.W. Bunn. Valuation anomalies for interconnector transmission rights.
Energy Policy, 55:565–578, 2013.
L. Meeus. Why (and how) to regulate power exchanges in the EU market integration
context? Energy Policy, 39(3):1470–1475, 2011a.
L. Meeus. Implicit auctioning on the Kontek Cable: Third time lucky? Energy Economics,
33(3):413–418, 2011b.
L. Meeus, L. Vandezande, S. Cole, and R. Belmans. Market coupling and the importance
of price coordination between power exchanges. Energy, 34(3):228–234, 2009.
L. Parisio and B. Bosco. Electricity prices and cross-border trade: Volume and strategy
effects. Energy Economics, 30:1760–1775, 2008.
L. Parisio and M. Pelagatti. Market coupling between electricity markets: theory
and empirical evidence for the Italian-Slovenian interconnection. 11th International
Conference on the European Energy Market, Krakow, 2014.
D. Pilipovic. Energy Risk: Valuing and Managing Energy Derivatives. McGraw-Hill, New
York, 1998.
Platts. French prompt stronger as reactor delayed. Market Commentary for 02 April
2014, 2014a.
Platts. Cwe convergence down despite coupling. European Power Daily, 2014b.
RTE. Access Rules for Imports and Exports on the French Public Power Transmission
System. 2009a. URL http://clients.rte-france.com/lang/an/clients_traders_
fournisseurs/services_clients/inter_contrats.jsp.
RTE. Rules for Capacity Allocation by Explicit Auctions within Central West
Europe Region (CWE Auction Rules). 2009b. URL http://clients.rte-france.
com/lang/an/clients_traders_fournisseurs/services_clients/initiatives_
regionales.jsp.
F.C. Schweppe, M.C. Caramanis, R.D. Tabors, and R.E. Bohn. Spot Pricing of Electricity.
Kluwer Academic Publishers, Boston, MA, 1988.
B. Solier. La Reforme du Marche de l’Electricite Francais: Quels Impacts pour la
Tarification et la Concurrence? Les Cahiers du PREC, 4. Paris: Serie Information
et debats, 2010.
26

K. Spees and J. Pfeifenberger. Seams Inefficiencies – Problems and Solutions at Energy
Market Borders. Presentation by The Brattle Group, 2012.
R. Turvey. Interconnector economics. Energy Policy, 34(13):1457–1472, 2006.
A. Weber, D. Graeber, and A. Semmig. Market Coupling and the CWE Project.
Zeitschrift fı¿½r Energiewirtschaft, 34(4):303–309, 2010.
27

Table 1: Descriptive Statistics: GER–NL Day-Ahead Spread
This table reports summary statistics for the spread si between day-ahead electricity prices in
Germany and the Netherlands for selected hours of the day (i = {6, 9, 12, 15, 18, 21}). The baseload
spread (sbase; “Base”) is defined as the (unweighted) arithmetic average of all 24 hourly spreads
on a given day. The “Pre-Market Coupling” sample covers the period from 01-Jan-2002 until
08-Nov-2009. The “Post-Market Coupling” sample covers the period thereafter until 31-Dec-2012.
Mean+ and Std. Dev.+ are defined as µ+ = E[si|si > 0
]and σ+ =
√E[(si − µ+)
2 ∣∣ si > 0],
respectively. Note that spreads beyond a threshold of 500 EUR/MWh were excluded from the
samples in order to avoid distortions. All data is sourced from Bloomberg.
Hour of Day 6 9 12 15 18 21 Base
Pre
-Mark
et
Cou
pling
n 3234 3234 3225 3229 3205 3234 3234
si < 0 33.6% 52.3% 69.2% 73.1% 65.5% 61.9% 68.6%
si = 0 0.4% 0.1% 0.2% 0.2% 0.1% 0.3% 0.0%
Mean 2.01 -2.45 -15.09 -9.10 -12.07 -4.44 -4.84
Mean+ 5.34 6.58 7.89 5.64 6.29 3.83 3.30
Mean− -4.50 -10.66 -25.31 -14.51 -21.75 -9.51 -8.57
Median 1.81 -0.32 -3.90 -3.02 -2.00 -1.55 -1.83
Min -129.47 -464.17 -481.07 -477.09 -480.13 -376.49 -154.98
Max 43.11 256.84 345.05 430.09 412.31 70.14 74.63
Std. Dev. 7.13 21.97 46.34 33.84 47.07 15.31 13.47
Std. Dev.+ 4.94 13.45 19.82 18.96 19.79 4.92 6.10
Std. Dev.− 6.25 24.83 50.90 36.43 53.93 17.21 14.27
Skewness -2.03 -6.83 -4.58 -6.15 -4.97 -8.08 -4.17
Kurtosis 39.29 141.51 35.15 79.64 40.01 138.19 32.41
Post
-Mark
et
Coup
ling
n 784 784 784 784 784 784 784
si < 0 14.7% 15.1% 35.1% 38.5% 24.9% 24.1% 60.5%
si = 0 83.0% 82.7% 64.5% 61.4% 73.5% 74.4% 30.2%
Mean -1.77 -1.17 -4.22 -4.92 -3.00 -2.70 -3.11
Mean+ 2.38 12.15 2.92 0.75 9.10 5.07 0.77
Mean− -12.47 -9.64 -12.05 -12.78 -12.67 -11.53 -5.25
Median 0.00 0.00 0.00 0.00 0.00 0.00 -0.50
Min -217.23 -40.15 -76.90 -139.76 -57.39 -57.04 -89.43
Max 7.02 30.01 5.41 0.75 28.58 9.86 8.23
Std. Dev. 11.58 5.47 8.39 9.63 7.82 6.88 6.67
Std. Dev.+ 2.03 10.30 2.25 n.a. 7.26 3.33 1.38
Std. Dev.− 28.01 8.80 10.31 11.85 10.63 9.57 7.85
Skewness -15.45 -2.17 -2.92 -4.83 -2.89 -3.16 -6.43
Kurtosis 273.80 17.34 12.17 50.54 11.09 12.47 69.76
28

-08:15
08:45
09:30
10:00
...
�� ��
11:00
12:00
...
�� ��
14:00
Nom
ination
(periodic
)Publication
ofATC
Auction
Closure
Publication
ofResults
Powernext
GateClosure
EEX
GateClosure
Nom
ination
(daily)
︸︷︷
︸Transm
ission
CapacityTrading
︸︷︷
︸SpotMarketTrading
Fig
ure
1:T
imeline
for
the
Explici
tE
x-A
nte
Auct
ionin
gSch
em
eT
his
figu
reil
lust
rate
sth
eti
min
gse
quen
ceof
the
mark
etfo
rcr
oss
-bord
ertr
an
smis
sion
capa
city
betw
een
Fra
nce
an
dG
erm
an
yas
wel
las
of
the
day-
ahea
del
ectr
icit
ym
ark
ets
inth
ese
two
cou
ntr
ies.
Note
that
the
nom
inati
on
pro
cedu
re,
the
setu
pof
the
capa
city
au
ctio
nan
dth
ega
tecl
osu
reti
mes
of
the
pow
erex
chan
ges
rela
teto
the
expli
cit
ex-a
nte
au
ctio
nin
gsc
hem
ew
hic
hw
as
inpla
cepri
or
to
the
imple
men
tati
on
of
the
CW
E(C
entr
al
Wes
tern
Eu
rope
)m
ark
etco
upli
ng
as
per
09-N
ov-
2010.
See
RT
E(2
009a)
an
dR
TE
(2009b)
for
furt
her
info
rmati
on
.
48
Fig
ure
1:T
imeli
ne
for
the
Expli
cit
Ex-A
nte
Auct
ion
Sch
em
eT
his
figu
reil
lust
rate
sth
eti
min
gse
quen
ceof
the
mark
etfo
rcr
oss
-bord
ertr
an
smis
sion
capa
city
betw
een
Fra
nce
an
dG
erm
an
yas
wel
las
of
the
day-
ahea
del
ectr
icit
ym
ark
ets
inth
ese
two
cou
ntr
ies.
Note
that
the
nom
inati
on
pro
cedu
re,
the
setu
pof
the
capa
city
au
ctio
n,
an
dth
ega
tecl
osu
re
tim
esof
the
pow
erex
chan
ges
rela
teto
the
expli
cit
ex-a
nte
au
ctio
nsc
hem
ew
hic
hw
as
inpla
cepri
or
toth
eim
ple
men
tati
on
of
the
CW
E(C
entr
al
Wes
tern
Eu
rope
)m
ark
etco
upli
ng
as
per
09-N
ov-
2010.
See
RT
E(2
009a)
an
dR
TE
(2009b)
for
furt
her
info
rmati
on
.
29
−50 −25 0 25 50−100%
−50%
0%
50%
100%IC Flows: Germany – France
Day-Ahead Spread: GER ./. FR (EUR/MWh)
Flow:GER
→FR
Flow:FR
→GER
1
−100 −50 0 50 100−100%
−50%
0%
50%
100%IC Flows: PJM – NYISO
Real-Time Spread: NYISO ./. PJM (USD/MWh)
Flow:NYISO
→PJM
Flow:PJM
→NYISO
Wrong Direction
Wrong Direction
Wrong Direction
Wrong Direction
Figure 2: Interconnector Flows: Germany – FranceThis figure illustrates inefficient interconnector use by plotting the day-ahead price spread between
the German and French electricity markets versus net transit nominations (as a percentage of
interconnector capacity) for the same hours. Data shown for the period from 26-Oct-2006 to
09-Nov-2010. The dashed line indicates economically efficient flows (as would have occurred under
market coupling) such that there is no flow in the wrong direction, nor less-than-optimal flow in
the right direction. Source: RTE (http://clients.rte-france.com) and Bloomberg.
30

01−Oct−10 09−Nov−10 31−Dec−10−50
−40
−30
−20
−10
0
10
20Day-Ahead Spreads: Hour 9
Spread
(EUR/M
Wh)
GER − F
GER − NL
01−Oct−10 09−Nov−10 31−Dec−10−50
−40
−30
−20
−10
0
10
20Day-Ahead Spreads: Hour 18
GER − F
GER − NL
Student Version of MATLAB
Figure 3: Spread in Day-Ahead Prices: GER – F and GER – NLThis figure shows the spread in day-ahead electricity prices between Germany and France as well
as Germany and the Netherlands. The LHS graph displays day-ahead prices for hour 9 of the day
(8:00–9:00am), whereas the RHS graph relates to hour 18 (5:00-6:00pm). The vertical dashed line
marks the start of the CWE (Central Western Europe) market coupling between Germany, France,
the Netherlands, and Belgium as per 09-Nov-2010. All data is sourced from Bloomberg.
31

Jan−06 Jan−07 Jan−08 Jan−09 Jan−10 09−Nov−10 Jan−12 Jan−13−50
−25
0
25
50Day-Ahead Spread GER - NL: Hour 12
Spread(EUR/M
Wh)
Student Version of MATLAB
Figure 4: Spread in Day-Ahead Prices: Germany–NetherlandsThis figure shows the spread in day-ahead electricity prices between Germany and the Netherlands
during the period from 01-Jan-2006 to 31-Dec-2012. The underlying day-ahead prices relate to hour
12 of the day (11:00am–12:00pm). The vertical dashed line marks the start of the CWE (Central
Western Europe) market coupling between Germany, France, the Netherlands, and Belgium as per
09-Nov-2010. All data is sourced from Bloomberg.
32
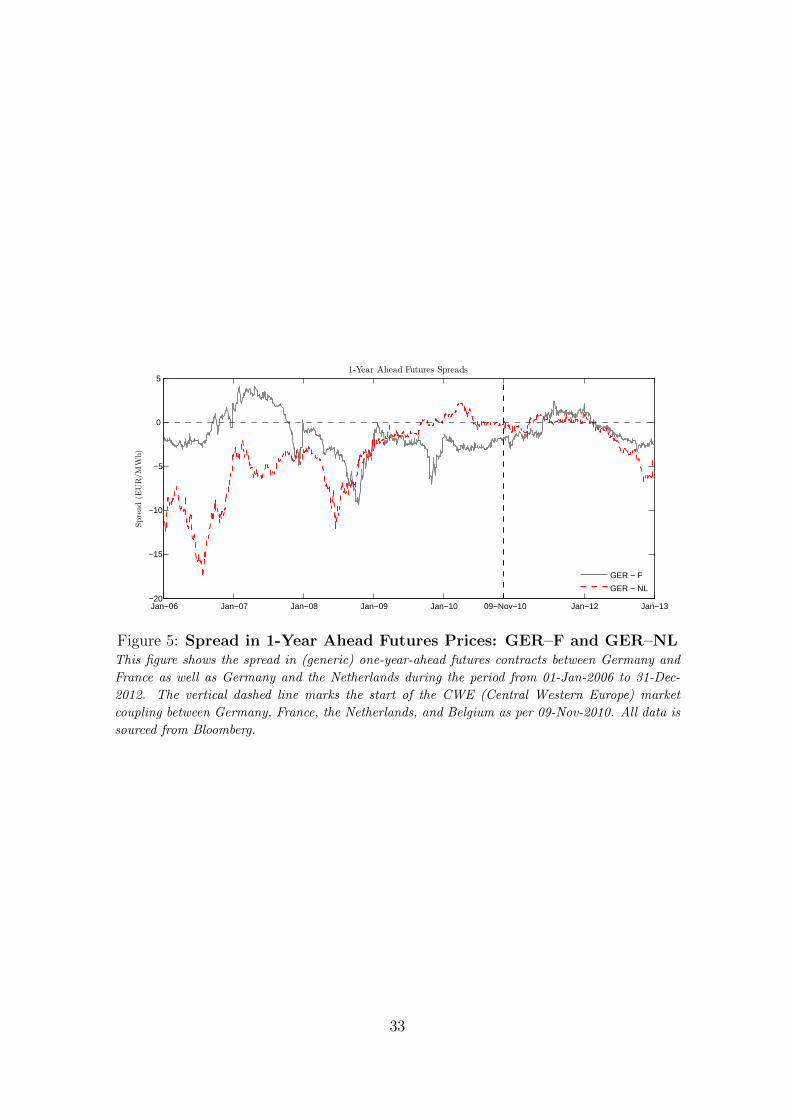
Jan−06 Jan−07 Jan−08 Jan−09 Jan−10 09−Nov−10 Jan−12 Jan−13−20
−15
−10
−5
0
51-Year Ahead Futures Spreads
Spread
(EUR/M
Wh)
GER − F
GER − NL
Student Version of MATLAB
Figure 5: Spread in 1-Year Ahead Futures Prices: GER–F and GER–NLThis figure shows the spread in (generic) one-year-ahead futures contracts between Germany and
France as well as Germany and the Netherlands during the period from 01-Jan-2006 to 31-Dec-
2012. The vertical dashed line marks the start of the CWE (Central Western Europe) market
coupling between Germany, France, the Netherlands, and Belgium as per 09-Nov-2010. All data is
sourced from Bloomberg.
33

Jul−11 Jan−12 Jul−12 Jan−13 Jul−13 Jan−14−8
−6
−4
−2
0
2
41-Year Ahead Futures Spread
Spread
(EUR/M
Wh)
GER − F
Jul−11 Jan−12 Jul−12 Jan−13 Jul−13 Jan−1435
40
45
50
55
601-Year Ahead German and French Futures
Price
(EUR/M
Wh)
Germany
France
ARENH
ARENH:EUR42/MWh
Student Version of MATLAB
Figure 6: One-Year-Ahead Futures and Futures Spreads: Germany–FranceThe RHS graph shows the development of French and German one-year-ahead baseload futures
prices between July-2011 and January-2014. The LHS graph shows the corresponding spread
between the two contracts, defined as German–French electricity price differential.
34