Permafrost what is permafrost where does it occur what problems exist.

Geophysica (2009), 45(1–2), 103–118
Electrical Resistivity Study of Permafrost on Ridnitšohkka Fell in Northwest Lapland, Finland
Heikki Vanhala, Petri Lintinen and Antti Ojala
Geological Survey of Finland, Betonimiehenkuja 4, FIN-02150 Espoo, Finland
(Received: April 2009; Accepted: September 2009)
Abstract
Electrical resistivity tomography (ERT) and laboratory resistivity measurements were used to examine the distribution of the near-surface (0–25 m) permafrost in sediments and bedrock on Ridnitšohkka fell in Enontekiö, northwest Finland. Three till-covered sites presenting periglacial activity but differing in altitude, vegetation, morphology and hydrology, were selected for study. In the summit plateau area (1290 m a.s.l.), where features of current periglacial activity (as sorted polygons) are well developed, the ERT results indicated the thickness of permafrost to be at least 5–15 m and the active layer ca. 1 m. On the eastern slope of the fell, ERT suggested frozen till and bedrock in the uppermost part of a solifluction terrace area (1030 m a.s.l.), but unfrozen conditions some 30 m lower down (1000 m a.s.l.). On the western slope (1000 m a.s.l.), no indications of permafrost were detected.
A special feature of Ridnitšohkka fell was the very high resistivity of the till in the summit area, i.e., 4–6 kΩm for unfrozen saturated till and 10- to 20-fold higher values (50–100 kΩm) for frozen till. In general, ERT proved to be an accurate and flexible technique to characterize near-surface permafrost properties in high-resistivity conditions of this kind. Partly because of the high resistivity of the frozen till layer, and the very high resistivity of the permafrost bedrock (up to 1 MΩm), the permafrost conditions at lower levels (depth 15–25 m) were difficult to assess. The ambiguity in the interpretation of the depth to bedrock and bedrock permafrost in the Ridnitsohkka area could only be reduced by reference drillings or complementary geophysical techniques such as seismic refraction.
Key words: electrical resistivity, resistivity sounding, permafrost, Finland
1. Introduction
Permafrost is widespread in cold regions, especially in the Arctic and Antarctic and in mountainous regions elsewhere. Almost a quarter of Earth’s land surface area, and in Canada and Russia half of the land area, is perennially frozen (Lemke et al., 2007). In Eurasia the thickness of permafrost varies from a few metres at the western and southern limits of the permafrost areas to more than one kilometre in the middle of Siberia (Kotlyakov and Khromova, 2002). In regions where permafrost gradually alternates with seasonal frost, such as in Finland (Fig. 1), the permafrost typically exists discontinuously in favourable locations. The occurrence of permafrost requires mean annual temperatures that are below zero. Locally, in areas of discontinuous and sporadic permafrost, the occurrence and thickness of permafrost depends on many factors, such as the elevation, the degree and orientation of the slope, thickness of the snow cover in winter, vegetation and properties of the surface soil and rock materials (Lemke et al., 2007).
Published by the Geophysical Society of Finland, Helsinki

104 Heikki Vanhala, Petri Lintinen and Antti Ojala
Fig. 1. (A) Location of the study area and the southern limit of the palsa zone (after Seppälä, 1997); (B) ERT lines and sampling sites at the summit of Ridnitšohkka fell, (C) Elevation model of the Halti – Ridnitšohkka-Govdosgaisi area showing the location of the study sites in the summit area and on the western and eastern (solifluction terraces) slopes of Ridnitšohkka fell. (Note that the vertical scale is strongly exaggerated, the elevation difference between the highest summits and the valleys being about 500 m).
Permafrost is currently a research target of increasing importance because of global warming and its impact on periglacial environments. One of the major impacts of this warming in cold regions is the degradation of permafrost. Thawing of ground ice and ice-rich soils can rapidly lead to construction failures and slope instability. Thawing of permafrost will also cause changes in surface and groundwater systems and ecosystems, and is predicted to increase the emission of greenhouse gases from soils to the atmosphere. The areas of discontinuous and thin permafrost are the most sensitive to climate warming (Lemke et al., 2007, Romanovsky et al., 2007).

Electrical Resistivity Study of Permafrost on Ridnitšohkka Fell in Northwest Lapland, Finland 105
Part of northwestern Finnish Lapland belongs to the Scandinavian permafrost zone (Brown et al., 1998; Harris et al., 2009). The southern limit of the discontinuous permafrost area in Finland (Fig. 1) has been delineated by the southern limit of palsa mires (Seppälä, 1997). Although the permafrost area in Finland is fairly large, few direct observations of permafrost other than palsas have been presented. Based on geophysical measurements, King and Seppälä (1987) suggested that some of the highest fells in Northern Finland have a 10- to 50 metre-thick permafrost layer. They presented no temperature or other reference data, but the observation of ice at a depth of 60 m in a drilled bedrock well at Ylläs fell (about 600 m a.s.l.) and the model calculations by Kukkonen and Safanda (2001) support the occurrence of relict mountain permafrost in Finnish Lapland. The only direct evidence of perennially frozen minerogenous overburden and ground in Finland is a drilling result from a frozen till layer on the summit of Ridnitšohkka fell, 1290 m a.s.l. (Hirvas et al., 2000).
Electrical resistivity techniques provide information on the electrical resistivity of the shallow subsurface. Because the electrical resistivity of earth materials strongly increases at the freezing point of water, electrical techniques have been used in permafrost studies for a long time (Keller and Frischknecht, 1966; Scott et al., 1990; Kneisel et al., 2008; Hauck and Kneisel, 2008). In the older studies, such as that of King and Seppälä (1987) in Finnish Lapland, 1D resistivity sounding was applied. This is a rapid and cost-effective tool, but requires flat and horizontally layered ground to provide accurate results. The multi-electrode 2D resistivity sounding method used in this study is based on real 2D sounding and 2D interpretation (inversion) of the data (Dahlin, 1996; Dahlin and Zhou, 2006). Modern resistivity sounding systems include a large number of steel electrodes in a single lay-out (typically 40–80), which produces high vertical and spatial accuracy. The method is commonly referred to as electrical resistivity tomography (ERT).
An early ERT trial to map permafrost in Finland was carried out over a palsa mound near Peera in 1999 (see Fig. 1) (Vanhala, 2000; Vanhala et al., 2001; Vanhala and Lintinen, 2002). This study demonstrated the sensitivity of the method and its potential in permafrost studies. However, the conditions on Ridnitšohkka fell, where permafrost has been detected in basal till (Hirvas et al., 2000), completely differ from those in the palsa mires. The main objectives of this study were therefore to adapt 2D resistivity sounding (ERT) for the study of near-surface permafrost in till covered bedrock areas in Finland and to investigate the permafrost on Ridnitšohkka fell. Field measurements and soil sampling for laboratory studies were carried out in 2004, 2005 and 2008. The preliminary results from 2004 have been discussed by Vanhala et al. (2005).
2. Characteristics of the study area
Ridnitšohkka fell is located in the north-western part of Finnish Lapland in the municipality of Enontekiö, about 40 kilometres northeast of the village of Kilpisjärvi, (Fig. 1). The area is characterized by marked relative and absolute altitudinal

106 Heikki Vanhala, Petri Lintinen and Antti Ojala
differences, with Ridnitšohkka (1317 m a.s.l.) and nearby Halti (1323 m a.s.l.) being the highest summits in Finland, rising steeply some 400–500 m above the surrounding valleys and lowland. Climatically, the area belongs to the hemiarctic climate region, between the North Atlantic oceanic climate and the Eurasian continental climate. According to the data of the Finnish Meteorological Institute (Kilpisjärvi Biological Station, 2009), the mean annual air temperature (MAAT) at the Kilpisjärvi weather station (69°02'N; 20°47'E, 480 m a.s.l.) from 1971 to 2000 was -2.3 oC, the warmest month being July (+10.9 °C) and the coldest January (-13.6 °C). The mean annual precipitation was 459 mm of which more than half falls as snow (Alalammi, 1987). The winter snow cover usually appears in October and disappears in early June. According to the Finnish Meteorological Institute (Kilpisjärvi Biological Station, 2009), between 1952–2007, the mean monthly snow depths on the 15th day on a month from October to May have been 7, 22, 41, 63, 82, 93 93, and 51 cm, respectively. Taking into account the fact that temperature decreases by approximately 0.6 °C per 100 m increase in altitude, temperatures in the study area are expected to be 3 to 5 °C colder than those at the Kilpisjärvi station. In the permafrost map of Nordic countries presented by Harris et al. (2009), Ridnitšohkka fell belongs to area with an MAAT < -4 oC.
The climatic conditions and data from nearby areas in Norway and Sweden strongly suggest permafrost conditions on Ridnitšohkka fell. Borehole temperatures 10 km NW from Ridnitšohkka refer to 30 m thick permafrost (-0.3 oC mean annual ground temperature) underneath a 5 m thick active layer at a level of 786 m a.s.l. (Harris et al., 2009). The temperature profile from a PACE monitoring well at Tarfalaryggen (1540 m a.s.l., MAAT -6 oC), some 200 km SW of Ridnitšohkka, indicates permafrost (ca. -3 oC ground temperature) from the surface to the bottom of the 100 m deep well (Harris et al., 2009). According to the temperature profile, permafrost is likely to extend essentially deeper than the 100 m. The occurrence of permafrost in the Abisko area some 150 km SW of Ridnitšohkka has been modelled by Ridefelt et al. (2008). Their results suggest probable permafrost for the western part of the area above 1300 m a.s.l., and in the eastern part of the area above 1100 m a.s.l. on the southern slopes of the fells, and above 850 m and 1000 m a.s.l. on northeastern and western slopes of the fells, respectively. King (1986) has presented a general assumption that in Scandinavia the -6 oC MAAT isotherm approximately follows the boundary between the continuous and discontinuous permafrost and the -1.5 oC MAAT isotherm the boundary between discontinuous and sporadic permafrost.
The bedrock in the Halti-Ridnitšohkka area consists of allochthonous sheets of early Palaeozoic Caledonian rocks, amphibolites, muscovite gneisses, and garnetiferous mica gneisses (the Nabar Nappe) that were overthrusted south-eastwards upon the Proterozoic Fennoscandian shield. The uppermost unit (laying on the Nabar Nappe) in the area of Halti and Ridnitšohkka fells, the Vaddas Nappe, is composed of a succession of ultramafic and mafic rocks, namely dunite, troctolite and olivine gabbro, and a sheeted gabbroic complex. The Caledonian allochthonous sheets, gently dipping towards the northwest, extend for only about 10–20 km into Finland from the Norwegian border (Lehtovaara, 1994 and 1995). The sheeted complex is composed of

Electrical Resistivity Study of Permafrost on Ridnitšohkka Fell in Northwest Lapland, Finland 107
gabbroic sills of varying thickness (from tens of centimetres to tens of metres) and interlayers of garnet-sillimanite gneisses (Sipilä, 1992; Lehtovaara, 1987). The gneisses are present as fragments or concordant layers between the sills. Their thickness is similar to that of gabbroic sills, from centimetres to tens of metres. The number of gneiss interlayers is low near to the peridotite – olivine gabbro cumulates, but increases by up to 30–40 % further from the contact.
Ridnitšohkka fell has morphological features that are typical for periglacial activity and also has several geological characteristics that are absent or rare elsewhere in Finland. The till on the summit plateau is devoid of vegetation cover and displays patterned ground features. Frozen ground was detected to a depth of 1.95 m in the overburden consisting of till at the end of July 1993 (Hirvas et al., 2000). Solifluction terraces and lobes are typical morphological features on the slopes of the fell, and the eastern slope of the fell has the most extensive (up to 3 km2) permanent snowfield in Finland (Hirvas et al., 2000 and 2005). The only known post glacial valley glacier in Finland has been active in Halti valley (Ojala et al., 2007).
Three areas having altitude differences of about 300 meters were selected as representative study locations (Fig. 1). Two of the areas were situated on the sheeted unit of the Halti-Ridnitšohkka complex, close to the contact with surrounding gneisses (summit area and western slope), and one on the gneiss of the Nabar Nappe (eastern slope). According to the polygonal surface morphology, the freezing and thawing activity was expected to vary considerably.
The study site on the summit of Ridnitšohkka fell was almost flat, dipping only gently (1–2 degrees) to the west-northwest. Some relatively unweathered rock outcrops are present in the summit area, but most of the area is covered by a field of boulders and fragmented rock. Close to the summit is situated a till-covered area of about two square kilometres. The surface of the till is composed of unsorted polygons, the diameter of which varies from 0.5 to 1 m. These polygons are free of vegetation and are therefore evidently caused by active freezing and thawing, and are evidence of ongoing periglacial processes. On the steeper slopes the morphology varies from elongated polygons to stone stripes, all showing a preferred downward trend. In the area of relatively symmetrical polygons the soil is composed of till, which according to earlier observations is at least 2 m thick, (Hirvas et al., 2000). The study site on the western slope of Ridnitšohkka (1000 m a.s.l) was a till plateau dipping five degrees to the west. The morphology of the till surface in this area includes polygons of 0.5–0.9 m in size. However, in contrast to the summit area, most of the polygons are covered with moss. The study site on the eastern slope of the fell was situated on the uppermost part (1000–1030 m a.s.l.) of the solifluction terrace zone. The most distinctive solifluction terraces have developed on the eastern slope of the fell. According to Hirvas et al. (2000 and 2005), there are some 30 sub-parallel till terraces between ca. 1000 and 850 m a.s.l., the largest reaching 4 m in height and more than 1 km in length.

108 Heikki Vanhala, Petri Lintinen and Antti Ojala
3. Methods
The resistivity soundings over the study sites were carried out in late July 2004 and 2005 and in late August 2008 using an AGI/Sting multi-electrode system. The Wenner electrode array was used, and the electrode spacing at the summit was 3 m. A few tests with a shorter 1-m and 2-m electrode spacing were also carried out. On the eastern and western slopes 2-m electrode spacing was used. The field data were inverted to 2D resistivity model sections using RES2DINV 2D-inversion software (Loke and Barker, 1996). The depth to frozen till, i.e., the thickness of an active layer, was measured with an iron rod. The iron rod results were verified by measurements of active layer temperature profiles from the ground surface to the permafrost.
Till samples for laboratory studies were taken in 2004 and 2008 (Fig. 1). The laboratory measurements included electrical resistivity and analysis of mineral matter grain size and geochemical properties. Geochemical characteristics of till samples were measured with ICP-MS after 0.01M BaCl2 leach (solid liquid ratio 1:10), and the pH of the leach was also measured. Cation exchange capacities (CEC) were calculated as the sum of base cations (Na+, K+, Ca2+, Mg2+) and acid cations (Al3+, H+). The grain-size distributions were determined with a combination of wet-sieving and sedigraphical analysis. These analyses were performed in order to evaluate the correlation between soil characteristics and electrical properties.
Electrical resistivity measurements of the till samples were taken in the laboratory using a HP 35665A Dynamic Signal Analyzer (Vanhala and Soininen, 1995). The length of the sample tube (glass) was 30 cm and diameter 3.1 cm. Due to the small diameter of the tube, stones larger than 2cm were removed from the sample material. After the laboratory tests the sample materials were packed into plastic tubes and the effect of freezing on the electrical resistivity was measured.
4. Results
4.1 Laboratory and in situ resistivity of till
The laboratory resistivity of the unfrozen till from the summit was characteristi cally 4–6 kΩm (Table 1). This is an exceptionally high value for saturated till. The till samples from the western slope were wet but not saturated. Their resistivity was also high, around 2 kΩm, but the values were not directly comparable with those from summit, because the degree of saturation of the material was unknown. The resistivity of saturated till in situ at the western slope site was 0.5–1 kΩm. On the eastern slope resistivity values of unfrozen saturated till in situ were 1–2 kΩm, i.e. between the values for the summit and the western slope. The reason for the very high resistivity of the summit till is evident from the geochemical properties presented in Table 1. The CEC values of the till from the summit (0.6–0.8 meq/kg) were low, and 10 times lower than the values from the western slope (7–9 meq/kg). CEC is a measure of the charged ions

Electrical Resistivity Study of Permafrost on Ridnitšohkka Fell in Northwest Lapland, Finland 109
weakly adsorbed onto soil particle surfaces, and these free charged particles in the pore water, are largely responsible for the electrical conductivity of the overburden.
Table 1. Laboratory results of till samples from the summit plateau of Ridnitšohkka fell (R-1, R21-R28), and from the western slope of the fell (R-2): Electrical resistivity, IP (-phase), pH, cation exchange capacity (CEC), the fines content (∅ <0.06 mm) and clay-fraction content (∅ <0.002 mm) in weight percentages. The temperature in resistivity measurement was +4 to +7 oC.
R-1, 1290m a.s.l. Resistivity Ωm
pH CEC meq/kg
<0.06mm % w
<0.002mm % w
0 – 3 cm 1460 5.0 0.62 30.8 7.4 3 – 10 cm 4610 5.1 0.65 32 8.5 10 – 15 cm 6750 5.1 0.78 30.1 7.1 15 – 20 cm 5295 5.1 0.76 23.1 5.8 20 – 40 cm 5178 5.1 0.75 25.4 6.2 R-2, 1010m a.s.l. 0 – 3 cm 2213 4.9 6.59 25.6 6.0 3 – 15 cm 2065 5.0 8.21 25.3 6.7 10 – 20 cm 1974 5.0 8.66 23.2 5.8 30 – 40 cm 2310 4.9 8.55 24.4 6.3 Summit, 1290 m a.s.l., depth 40 cm
Resistivity Ωm
Phase (1 Hz) mrad
R_21 4385 -3.9 R_22 3712 -4.5 R_23 913 -10.2 R_24 4724 -3.7 R_25 5810 -4.5 R_26 5300 -3.6 R_27 4811 -2.3 R_28 4762 -4.6 mean 4302
4786* -4.7
-3.9* *) R_23 (913 Ωm, -10.2 mrad) omitted
The resistivity of soil and rock materials increases slightly with decreasing
temperature. In the case of water the increase is ca. 2% per 1 oC decrease (Keller and Frischknecht, 1966) (Fig. 2). At the freezing point the resistivity increases rapidly due to the phase change from conducting water to nonconductive ice. Hoekstra and McNeill (1973); Hoekstra et al., (1975); Scott and Kay (1988) and Olhoeft (1978) reported a 5- to 10-fold increase in resistivity for gravel, sand and silt when the temperature decreases from unfrozen conditions to -5 oC. For clay, clayey till and peat they observed a 2- to 3-fold increase, but for crystalline rocks the increase was 50- to 100-fold under the same conditions. The size of the increase in resistivity from temperatures above zero to

110 Heikki Vanhala, Petri Lintinen and Antti Ojala
permafrost conditions (below 0 oC) strongly depends on the chemistry of the pore water. When the content of dissolved salts in the pore water is high, the water remains partially unfrozen at 0 oC, and even in lower temperatures, and the change in resistivity remains smooth and weak (King et al., 1988; Scott et al., 1990).
The laboratory test in which till samples from the study sites were frozen in the laboratory (Fig. 2) revealed a step-like 5- to 10-fold increase in resistivity from a temperature slightly above (+0.5 oC) to one below zero (-0.5 oC). The result is consistent with the data presented in previous studies, such as Hoekstra and McNeill (1973); Scott and Kay (1988) and Olhoeft (1978), and provides a basis for the interpretation of the field measurements.
Fig. 2. Effect of temperature and freezing on the resistivity of till samples from Ridnitšohkka fell. Samples are from 2004 and 2005. The curve “theoretical water” is calculated after Keller and Frischknecht, 1966.
4.2 Resistivity soundings
4.2.1 Summit area
The unfrozen till layer, or active layer, was independently verified by an iron rod and temperature measurements to be ca. 1 m thick. It appeared as a definite lower-resistivity layer on the higher-resistivity permafrost (Fig. 3). The interpreted resistivity values of the unfrozen till layer were slightly higher than those measured in the laboratory (4–6 kΩm). The difference mostly arose from the Wenner array electrode spacing (a = 3 m), which was too large to accurately image a thin 1-m layer (Fig. 6). Another reason for the difference was the lack of stones (highly non-conductive particles) in the laboratory samples, resulting in a slightly reduced resistivity in the laboratory measurements. According to observations, the stones and boulders in the till are local schists, gneisses, amphibolites and pegmatites, all having a higher resistivity
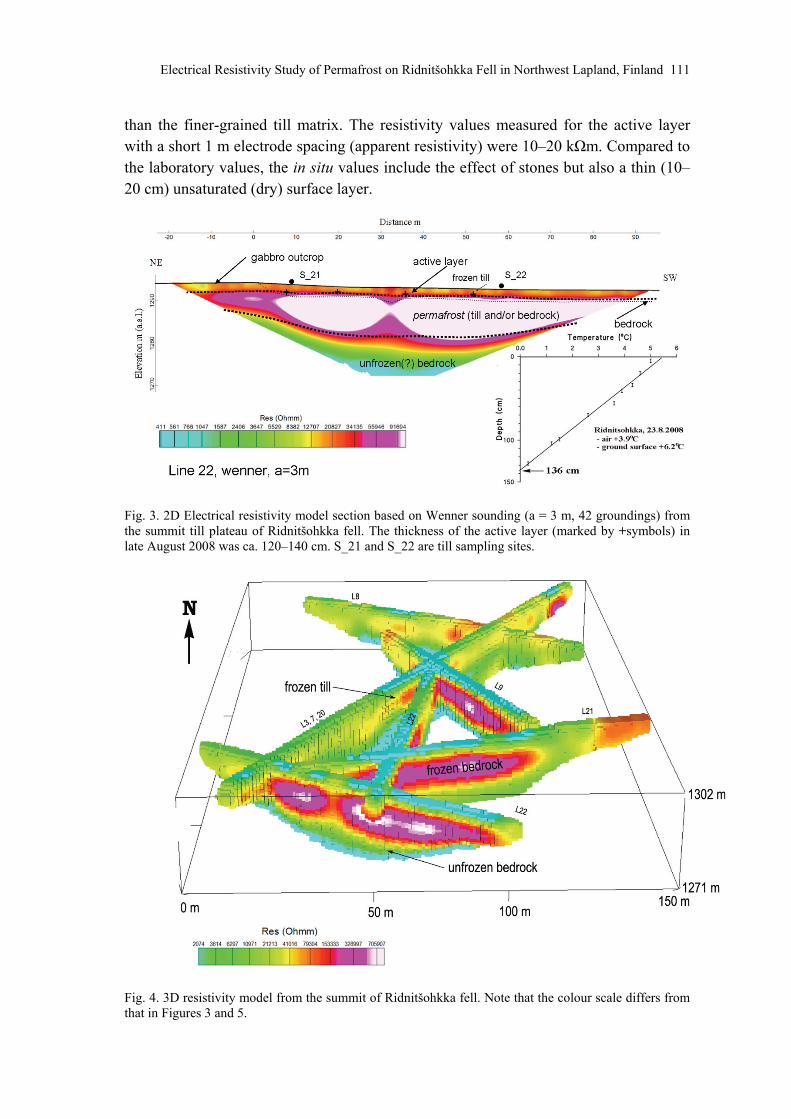
Electrical Resistivity Study of Permafrost on Ridnitšohkka Fell in Northwest Lapland, Finland 111
than the finer-grained till matrix. The resistivity values measured for the active layer with a short 1 m electrode spacing (apparent resistivity) were 10–20 kΩm. Compared to the laboratory values, the in situ values include the effect of stones but also a thin (10–20 cm) unsaturated (dry) surface layer.
Fig. 3. 2D Electrical resistivity model section based on Wenner sounding (a = 3 m, 42 groundings) from the summit till plateau of Ridnitšohkka fell. The thickness of the active layer (marked by +symbols) in late August 2008 was ca. 120–140 cm. S_21 and S_22 are till sampling sites.
Fig. 4. 3D resistivity model from the summit of Ridnitšohkka fell. Note that the colour scale differs from that in Figures 3 and 5.

112 Heikki Vanhala, Petri Lintinen and Antti Ojala
A layer having a resistivity from 50 kΩm to near 1 MΩm and a thickness between 5 m and 15 m was observed to underlie the lower-resistivity active layer (Fig. 3, 4 and 5). Assuming a 10- to 20-fold increase in resistivity when till freezes, as demonstrated in Figure 2 and in other studies such as Hoekstra and McNeill (1973), Hoekstra et al. (1975), Scott and Kay (1988) and Olhoeft (1978), the resistivity values of 50–100 kΩm on line L3 (Fig. 5) can be attributed to frozen till. Based on drillings, the till layer along L3 is at least 2 m thick (Hirvas et al., 2000). The resistivity section L3 in Figure 5 refers to a 2- to 3-fold thicker frozen till layer, which is about 5 m in thickness.
Fig. 5. Comparison of electrical resistivity model sections from the summit till plateau (a), eastern slope (b), and western slope (c) of Ridnitsohkka fell. Wenner array, (a) a=3m, (b, c) a = 2 m, (d) a = 1 m. In (e) the temperature of the active layer is plotted against resistivity. Panels (c) and (f) are the same but have a different colour scale. R1, R2 and S26 are sampling sites.
On line 22 in Figure 3, the high-resistivity layer yielded such high values, from 200 to 800 kΩm (see also Fig. 6), that they have mostly originated from frozen bedrock. Resistivities of 20–40 kΩm are typical for unfrozen bedrock, and the 10- to 20-fold increase due to freezing leads to values of 200–800 kΩm. High resistivity values around

Electrical Resistivity Study of Permafrost on Ridnitšohkka Fell in Northwest Lapland, Finland 113
1 MΩm are typical for mountain (bedrock) permafrost (Hauck and Muhll, 2003, Marescot at al., 2003, Ishikawa and Hirakawa, 2000).
The lowest layer, from the depth of 5–15 m to the bottom of the sections, yielded resistivity values from 1 to 10 kΩm. The layer is evidently bedrock and the resistivity values directly refer to unfrozen conditions. The values of 1–10 kΩm are noticeably low when compared to the values for the upper layer (50–800 kΩm). According to the model calculations presented in Figure 6, the resistivity of the bottom layer could be slightly higher, apparently 0.5–1 decades, than those presented in the sections. Thus, in the case of a top layer with very high resistivity, the interpretation (2D inversion) easily overestimates the conductivity of the low-resistivity bottom layer.
Fig. 6. (a) Resistivity-depth curves from the study sites. The resistivity values are extracted from the 2D resistivity models in Figures 3 and 5; (b) the same examination using calculated model data. The two models (model-1 and model-2) simulate the resistivity distribution on the summit of the fell.
4.2.2 Eastern slope solifluction terraces
The eastern slope solifluction terraces differ from the summit area in not being flat, but dipping ca. 11 degrees to the east. The 200 m long resistivity line in Figure 5 (b) crosses five terraces. The upper part of the section (1030–1020 m a.s.l.) shows a distinct 10-m-thick high-resistivity layer in which the highest resistivity values of 50–100 kΩm correspond to the frozen till values on the summit (see also Fig. 6). The high-resistivity layer is discontinuous so that the terrace rises are more resistive than the depressions in between them. In general, the resistivity decreases downwards and the high-resistivity layer completely disappears by the end of the line.
A thin lower-resistivity layer within the high-resistivity layers (dotted line in Fig. 5 (b)) was visible in almost every terrace. It is located at a depth of about 2 m, and has been interpreted as unfrozen wet till between apparently unfrozen dry till (above) and frozen bedrock or till below it. The low-resistivity “depressions” between the terraces typically consist of wet till. They, together with the thin low-resistivity layer, indicate the flow of melt waters on a surface of frozen till or rock, which prevents the water from infiltrating deeper into the ground. The fact that the winter snow cover on the terraces is

114 Heikki Vanhala, Petri Lintinen and Antti Ojala
thin or they are free of snow, while the “depressions” have a 2–3 m thick snow cover, supports the presence of permafrost under the terraces and thaw between them.
4.2.3 Western slope
The resistivity section from the western slope (1000 m a.s.l.) revealed resistivity values that were less than one-tenth of those on the summit and in the eastern slope (Fig. 5 and 6). In the light of the results from the other two sites, no permafrost exits here.
5. Discussion and conclusions
Electrical resistivity surveys over till deposits on Ridnitšohkka fell in Northern Finland provided detailed information on the present near-surface (0–25 m) permafrost appearance and structures. This study demonstrated, for the first time in Finland, that resistivity surveys (ERT) can provide detailed information on permafrost structures, such as the thickness of the active and frozen layers, in complicated conditions where crystalline bedrock is covered by a thin (1–5 m) till layer. The study also highlighted the problems that can arise under such circumstances. In particular, the assessment of permafrost conditions in deeper levels below the near-surface high-resistivity frozen till and frozen bedrock layers remains uncertain without additional reference data, such as drillings, temperature logs or other geophysical measurements.
The most important results and conclusions concerning the uppermost 25 m of the ground on the Ridnitšohkka fell area are as follows:
- the permafrost layer is 5 to 15 m on the summit of the fell, 1290 m a.s.l.; - probable permafrost patches exist on solifluction terraces of the eastern slope, 1030–
1000 m a.s.l.; - unfrozen conditions are present on the western slope of the fell, 1000 m a.s.l.; - there is a ca. 1 m thick active layer in the summit area; - both till overburden and underlying bedrock are perennially frozen in the summit
area; - apparently unfrozen bedrock exists under the 5- to 15-m-thick permafrost layer in
the summit area.
The contrast in electrical resistivity between unfrozen saturated till and frozen till was pronounced, 1–1.5 decades, and consistent with the laboratory tests and results presented elsewhere. The laboratory and in situ resistivity values of the unfrozen saturated till (4–6 kΩm and 10–20 kΩm, respectively) are exceptionally high and certainly have implications for future electrical resistivity studies in similar permafrost environments. Without reference data, a 4–20 kΩm layer in a till deposit would not refer to the active layer nor to any wet fine-grained sediment in general, but preferably to permafrost conditions. The very high resistivity also reduces the applicability of conventional EM techniques in discriminating unfrozen ground from permafrost or even

Electrical Resistivity Study of Permafrost on Ridnitšohkka Fell in Northwest Lapland, Finland 115
from unfrozen bedrock. The high resistivity of the till could possibly be explained by the lack of a humus layer and the biological activity in the summit area. The resistivity of frozen bedrock mostly varied from 200–300 kΩm up to 800 kΩm being at the same level as in comparable mountain permafrost areas elsewhere, (Hauck and Muhll, 2003, Marescot at al., 2003, Ishikawa and Hirakawa, 2000).
Unfrozen bedrock underneath this 5- to 15-m-thick permafrost layer on the summit of Ridnitšohkka fell is an unexpected result, because the climatic factors indicate permafrost conditions. The mean annual temperature is low, possibly 4–5 oC lower than at the Kilpisjärvi weather station (-2.3 oC), which is situated 800 m lower than the summit of the fell. One reason for the low resistivity in the deepest part of the resistivity sections could be the dissemination of electronically conducting minerals (such as sulphides or graphite) in the bedrock. Outcrops of fragmented bedrock surround the till plateau and the study field. Some of the schist fragments are rusty, indicating sulfide minerals. If the low resistivity deeper in the ground originates from metallic conductors it is impossible to state whether the ground is frozen or not.
The carrying out of measurements at different altitudes provided a preliminary insight into the spatial distribution of permafrost in Finnish Lapland. The results strongly suggest that the present near-surface permafrost is mostly restricted to the areas of the highest fells, i.e., roughly above 1000 m a.s.l..
Acknowledgements
The authors are grateful to Juhani Siivola from the Telia Sonera Finland for help with accommodation and the Lapland Frontier Guard District for help with logistics.
References
Alalammi, P., 1987. Atlas of Finland, 131: Climate. National Board of Survey Geographical Society of Finland, Helsinki.
Brown, J., O.J. Ferrians, J.A. Heginbottom, and E.S. Melnikov, 1998. Circum-Arctic map of permafrost and ground-ice conditions. Revised February 2001. Boulder, CO: National Snow and Ice Data Center/World Data Center for Glaciology. Digital Media.
Dahlin, T., 1996. 2D resistivity surveying for environmental and engineering applications. First Break, 14, 275–283.
Dahlin, T. and B. Zhou, 2006. Multiple-gradient array measurements for multichannel 2D resistivity imaging. Near Surface Geophysics, 2006, 113–123
Harris, C., L.U. Arenson, H.H. Christiansen, B. Etzelmüller, R. Frauenfelder, S. Gruber, W. Haeberli, C. Hauck, M. Hölzle, O. Humlum, K. Isaksen, A. Kääb, M.A. Kern-Lütschg, M. Lehning, N. Matsuoka, J.B. Murton, J. Nötzli, M. Phillips, N. Ross, M. Seppälä, S.M. Springman and D. Vonder Mühll, 2009. Permafrost and climate in Europe: Monitoring and modelling thermal, geomorphological and geotechnical responses. Earth-Science Reviews, 92, 117–171.

116 Heikki Vanhala, Petri Lintinen and Antti Ojala
Hauck, C. and C Kneisel, 2008. Applied geophysics in periglacial environments. Cambridge university press, 240p.
Hauck, C. and D.V. Muhll, 2003. Inversion and interpretation of two-dimensional geoelectrical measurements for detecting permafrost in mountainous regions. Permafrost and Periglacial Processes, 14, 305–318.
Hirvas, H., P. Lintinen and P. Kosloff, 2000. An extensive permanent snowfield and the possible occurrence of permafrost in till in the Ridnitšohkka area, Finnish Lapland. Bulletin of the Geological Society of Finland, 72, Parts 1–2, 47–56
Hirvas, H., P. Lintinen, A. Ojala and H. Vanhala, 2005. Geological characteristics of the Haltin-Ridnitsohkka region, Enontekiö, Finland. Geological Survey of Finland, Special Paper, 40, 7–12.
Hoekstra, P and D. McNeill, 1973. Electromagnetic probing of permafrost: Proc. 2nd
Internat. Conf. On Permafrost. Nat. Acad. Sci., 517–526. Hoekstra, P., Sellmann, P.V. and Delaney, A., 1975. Ground and airborne resistivity
surveys of permafrost near Fairbanks, Alaska. Geophysics, 40, 641–656. Ishikawa, M. and K. Hirakawa, 2000. Mountain Permafrost Distribution Based on BTS
Measurements and DC Resistivity Soundings in the Daisetsu Mountains, Hokkaido, Japan. Permafrost and Periglacial Processes, 11, 109–123.
Keller, G.V. and F.C. Frischknecht, 1966. Electrical methods in Geophysical prospecting. Pergamon Press, Oxford, 1–43.
Kilpisjärvi Biological Station, 2009. Basic climatological data on Kilpisjärvi. Data presented by the University of Helsinki at the web pages of the Kilpisjärvi biological station. www.helsinki.fi/kilpis.
King L., 1986. Zonation and ecology of high mountain permafrost in Scandinavia. Geografiska Annaler, 68A, 131–139.
King, L. and M. Seppälä, 1987. Permafrost thickness and distribution in Finnish Lapland – results of geoelectrical soundings. Polarforschung, 57 (3), 127–147.
King, M.S., R.W. Zimmerman and R.F. Corwin, 1988. Seismic and electrical properties of unconsolidated permafrost. Geophysical Prospecting, 36, 349–364.
Kneisel , C., C. Hauck, R. Fortier and B. Moorman, 2008. Advances in Geophysical Methods for Permafrost Investigations. Permafrost and Periglacial Processes, 19, 157–178.
Kotlyakov, V. and T. Khromova, 2002. Maps of permafrost and ground ice. In: Stolbovoi, V. and I. McCallum, Land Resources of Russia. Laxenburg, Austria: International Institute for Applied Systems Analysis and the Russian Academy of Science. CD-ROM. Distributed by the National Snow and Ice Data Center/World Data Center for Glaciology, Boulder.
Kukkonen, I. and J. Safanda, 2001. Numerical modelling of Permafrost in bedrock in northern Fennoscandia during the Holocene. Global and Planetary Change, 29, 259–273.

Electrical Resistivity Study of Permafrost on Ridnitšohkka Fell in Northwest Lapland, Finland 117
Lehtovaara, J.J., 1987. Enontekiön Ridnitsohkkan emäksinen juoniparvi. Summary: Basic dyke swarm at Ridnitsohkka fell in northwesternmost Enontekiö. In: Aro, K. and I. Laitakari, (eds.), Suomen diabaasit ja muut mafiset juonikivilajit (Diabases and other mafic dyke rocks in Finland. Tutkimusraportti/Raport of investigation, 76. Geologian tutkimuskeskus/Geological Survey of Finland, Espoo, Finland, 199–204.
Lehtovaara, J., 1994. Halti. Suomen geologinen kartta 1:100 000: kallioperäkartta (Geological map of Finland 1:100 000). Pre-Quaternary rocks. Lehti (sheet) 1842. Geologian tutkimuskeskus/Geological Survey of Finland, Espoo, Finland.
Lehtovaara, J., 1995. Kilpisjärven ja Haltin kartta-alueiden kallioperä. Summary: Pre-Quaternary rocks of the Kilpisjärvi and Halti map-sheet areas 1:100 000, Explanation to the Maps of Pre-Quaternary Rocks, Sheet 1823 and 1842, 64 p. Geologian tutkimuskeskus/Geological Survey of Finland, Espoo, Finland.
Lemke, P., J. Ren, R.B. Alley, I. Allison, J. Carrasco, G. Flato, Y. Fujii, G. Kaser, P. Mote, R.H. Thomas and T. Zhang, 2007. Changes in Snow, Ice and Frozen Ground. In: Climate Change 2007: The Physical Science Basis. Contribution of Working Group I to the Fourth Assessment Report of the Intergovernmental Panel on Climate Change (Solomon, S., D. Qin, M. Manning, Z. Chen, M. Marquis, K.B. p. 369–375. Averyt, M. T. and H.L. Miller (eds.). Cambridge University Press, Cambridge, United Kingdom and New York, NY, USA.
Loke, M.H. and R.D. Barker, 1996. Rapid least squares inversion of apparent resistivity pseudosections by a quasi-Newton method. Geophysical Prospecting, 44, 131–152.
Marescot, L., M.H. Loke, D. Chapellier, R. Delaloye, C. Lambiel and E. Reynard, 2003. Assessing reliability of 2D resistivity imaging in mountain permafrost studies using the depth of investigation index method. Near Surface Geophysics, 2003, 57–67.
Ojala, A.E.K, H. Hirvas, P. Lintinen and H. Vanhala, 2007. Neoglacial activity in Finland: dating the evidence from glaciolacustrine sediment sequences in the Halti – Ridnitšohkka region. The Holocene, 17 (1), 79–88.
Olhoeft G.R., 1978. Electrical properties of permafrost: Proc. 3rd Internat. Conf. On Permafrost. Nat. Res. Counc., Canada.
Ridefelt, H., B. Etzelmuller, J. Boelhouwers and C. Jonasson, 2008. Stastic-empirical modeling of mountain permafrost distribution in the Abisko region, sub-Arctic northern Sweden. Norsk Geografisk Tidsskrift, 62, 278–289.
Romanovsky, V.E., S. Grube, A. Instanes, H. Jin, S.S. Marchenko, S.L. Smith, D. Trombotto and K.M. Walter, 2007. Frozen ground. In: UNEP: Global outlook for ice & snow. UNEP/GRID-Arendal, Norway: p. 182–196.
Scott, W.J. and A.E. Kay, 1988. Earth resistivities of Canadian soils: Can. Elect. Assoc., Montreal. Vol 1, Main Rep., Vol 2., Site data.

118 Heikki Vanhala, Petri Lintinen and Antti Ojala
Scott, W.J., P.V. Sellmann and J.A. Hunter, 1990. Geophysics in the study of permafrost:, in Geotechnical and Environmental Geophysics, Ward, S.H. (ed), Investigations in Geophysics no. 5, Vol. 1 Review and Tutorial, Society of Exploration Geophysicists, Tulsa, 355–384.
Seppälä, M., 1997. Distribution of permafrost in Finland. Bulletin of the Geological society of Finland, 69, part 1–2, 87–96.
Sipilä, P., 1992. The Caledonian Halti-Ridnitsohkka igneous complex in Lapland. Geological Survey of Finland Bulletin, 362.
Vanhala, H. and H. Soininen, 1995. Laboratory technique for measurement of spectral induced polarization response of soil samples. Geophysical prospecting, 43, 655–676.
Vanhala, H., 2000. Vastusluotaus Peeran palsalla ja Saanatunturilla elokuussa 1999. 19 s., 9 liitesivua. Geologian tutkimuskeskus, arkistoraportti, Q 16.1/2000/3. (Resistivity soundings on the Peeras palsa and Saana fell in August 1999. 19 p., 9 app. Report Q16.1/2000/3, Geological Survey of Finland, in Finnish).
Vanhala, H., P. Lintinen and J. Lehtimäki, 2001. Mapping frozen ground using electrical measurements – a case from Peera, a palsa in Finnish Lapland. In: Hill, I. (ed.) 7thMeeting of Environmental and Engineering Geophysics, Birmingham, England, September 2nd–6th 2001: proceedings. Lausanne: Environmental and Engineering Geophysical Society, European Section, 70–71.
Vanhala, H. and P. Lintinen, 2002. Test of geophysics for monitoring frozen ground – a case from the southern limit of discontinuous permafrost in Finnish Lapland. In: The Second AMAP International Symposium on Environmental Pollution of the Arctic, Rovaniemi, Finland, October 1–4, 2002. Extended abstracts. AMAP Report 2002:2, 3 p.
Vanhala, H., I. Suppala, P. Lintinen, H. Hirvas and A.E.K. Ojala, 2005. Application of electrical and electromagnetic methods in studying frozen ground and bedrock – results from Ridnitsohkka, northern Finland. In: Quaternary studies in the northern and Arctic regions of Finland: Proceedings of the workshop organized within the Finnish National Committee for Quaternary Research (INQUA), Kilpisjärvi Biological Station, Finland, January 13–14th 2005. Geological Survey of Finland, Special Paper, 40.