Elections, Special Interests and Financial...
62
Elections, Special Interests and Financial Crisis Philip Keefer Development Research Group The World Bank January 2006 Abstract: A large literature concludes that democracy has ambiguous effects on public policy and that political checks and balances exacerbate crisis. The analysis here finds that although democracies are no less likely to experience banking crises, in the event of financial crisis competitively elected governments intervene more rapidly in insolvent banks and make transfers to them that are between 10 and 20 percent of GDP less than those made by non- democratic governments. Their countries suffer far smaller growth collapses. However, political checks and balances have no effect on government responses to financial crisis. A simple model offers new explanations for these regime effects. First, for those public policies for which voter information and political credibility are particularly likely to be problematic (financial regulation), electoral accountability matters only when the consequences of failure become large and visible (financial crisis). Second, checks and balances reduce political incentives to seek rents, offsetting the delays they induce in crisis response. The analysis here underlines the importance of considering regime effects on political incentives to cater to special interests at the expense of broad social interests, and of avoiding aggregated and subjective measures of democracy that can obscure the identification of regime effects. Phone (office): (202) 458-2479 Email : [email protected] Mailing address (home): 3728 Chesapeake St., NW Washington, DC 20016
Transcript of Elections, Special Interests and Financial...

Elections, Special Interests and Financial Crisis
Philip Keefer
Development Research Group
The World Bank
January 2006
Abstract: A large literature concludes that democracy has ambiguous effects on public policy and that political checks and balances exacerbate crisis. The analysis here finds that although democracies are no less likely to experience banking crises, in the event of financial crisis competitively elected governments intervene more rapidly in insolvent banks and make transfers to them that are between 10 and 20 percent of GDP less than those made by non-democratic governments. Their countries suffer far smaller growth collapses. However, political checks and balances have no effect on government responses to financial crisis. A simple model offers new explanations for these regime effects. First, for those public policies for which voter information and political credibility are particularly likely to be problematic (financial regulation), electoral accountability matters only when the consequences of failure become large and visible (financial crisis). Second, checks and balances reduce political incentives to seek rents, offsetting the delays they induce in crisis response. The analysis here underlines the importance of considering regime effects on political incentives to cater to special interests at the expense of broad social interests, and of avoiding aggregated and subjective measures of democracy that can obscure the identification of regime effects.
Phone (office): (202) 458-2479
Email : [email protected]
Mailing address (home): 3728 Chesapeake St., NW Washington, DC 20016

Elections, Special Interests and Financial Crisis
This paper presents robust evidence that countries exhibiting competitive elections
make significantly fewer fiscal transfers to insolvent banks and intervene more rapidly in
these banks. They also experience a much smaller decline in growth as a consequence of
financial crisis, though they are no less likely to experience crisis. These results, together
with the theoretical analysis that supports the econometric specifications, inform an
enduring puzzle in political economy: the apparent lack of a systematic influence of
elections on public policy. They also shed light on a narrower question: what explains wide
variation in the policy response of countries to crisis?
Surprisingly, since the introduction of competitive elections would appear to be a
fundamental institutional change in a country, the evidence is not particularly robust that
democracies grow faster, secure property rights more effectively, nor offer higher quality
public goods, such as universal, high-quality education. Mulligan and Sala-i-Martin (2004)
present evidence that democracies, despite giving greater influence to average, poorer
citizens, adopt less redistributive fiscal policies. They infer from these results that institutions
do not matter for public policy, but instead that policy is determined in both democracies
and autocracies by conflicts among interest groups. Bueno de Mesquita et al. (2003) and
Acemoglu, et al. (2002) disagree with this assessment and conclude that democracies, by
being more inclusive, give politicians fewer incentives to serve the interests of narrow elites.
The argument and evidence here help to bridge these differences.
In the crisis literature, some argue that institutions of conflict management moderate
the effects of crisis (Rodrik 1999). In contrast, Alesina and Drazen (1991) imply that in
countries in which opposing interests can both block policy change, crisis outcomes are
worse. Political checks and balances are the institution that endow opposing interests with

2
this blocking power, however, and are widely considered institutions of conflict
management. Satyanath (2005) develops the insight that political checks and balances can
generate information asymmetries that exacerbate financial crises. The argument here
identifies an offsetting effect of checks and empirical results indicate that political checks
and balances in fact have no effect on policies related to financial sector crisis.
Two related explanations developed below explain why electoral competition may
have limited effects on political incentives to cater to special interests at the expense of
society broadly. First, as is well-known, though not typically taken into account in the
democracy and crisis literature, democracies vary widely in the extent to which they exhibit
political market imperfections that disrupt electoral accountability. These include the extent
to which voters are informed about the actions of politicians and the extent to which
politicians can make credible pre-electoral promises to voters (see Keefer and Khemani 2005
for a review).
Second, these imperfections vary by policy. Education outcomes are difficult for
voters to observe and to attribute to political action. In contrast, voters can easily observe
the fulfillment of promises of patronage appointments. Government responsibility for crisis
falls somewhere in the middle: government policies that contribute to crisis are difficult to
observe, but crisis itself has large and visible effects. The relative performance of
democracies and non-democracies therefore depends on both the character of electoral
competition and of the policies at issue. The evidence below – showing that electoral
accountability exerts a significant effect on post-crisis policies, such as bailouts, but an
insignificant effect on the probability of experiencing a crisis, which is related to policies
such as prudential regulation – demonstrates this within the context of a single sector.

3
The analysis below extends a simple Barro-Ferejohn style model to highlight the role
of credibility and information problems in electoral accountability. The extension here adds
three elements not present in earlier analyses: the dependence of incumbent pecuniary rents
on deals with special interests; positive costs to citizens of expelling incumbents; and
multiple incumbent veto players. Though straightforward, the framework offers a
parsimonious explanation of why electoral accountability operates in the context of financial
crises but may not operate for other policies – indeed, why electoral accountability might
affect the response to crisis but not the probability of crisis itself.
The literature on democracy, special interests and crisis Government susceptibility to the demands of narrow interest groups is a key feature
shaping financial sector policy making and the analysis here. A substantial literature
examines the sources of special interest influence on elected governments, including
information asymmetries (Grossman and Helpman 1996), and institutions (Persson and
Tabellini 2000), to the credibility of pre-electoral political promises (Keefer and Vlaicu
2005). However, the mere fact of elections also affects the costs to politicians of catering to
special interests. This idea underlies Bueno de Mesquita, et al. (2003) and Acemoglu, et al.
(2002). In contrast to these analyses, the work here explicitly examines a policy setting in
which it is difficult for competitive elections and a universal franchise to exert strong
accountability effects. Also, in contrast to most empirical work looking at the effects of
democracy, the tests below use direct and disaggregated measures of competitive elections
and political checks and balances.
The focus on interest groups is standard in most analyses of crisis. Frieden (1991)
shows that differences in the internal cohesion of economic sectors and in their reliance on
specific assets explain the different responses of Latin American countries to the debt crisis

4
of the 1980s. In the context of financial sector regulation, Calomiris and White (1994)
demonstrate that US congressional support for deposit insurance proposals was a function
of the distribution of troubled banks across congressional districts. Romer and Weingast
(1991) link how congressmen voted on funding of the Federal Savings and Loan Insurance
Corporation to the economic interests in their districts. Hutchcroft (1998) documents the
capture of financial sector policy by special interests in the Philippines and the role this
played in crisis.
The foregoing work, in contrast to the analysis here, does not ask why the influence
of interest groups might yield different or worse policy outcomes in some countries rather
than others. Haggard (2000), however, conjectures that democracies in East Asia (South
Korea and Thailand) recovered more quickly from their crises than did Indonesia because
citizens in the more democratic countries could more easily sanction malfeasant
governments (p. 222). The empirical work below offers systematic tests of this conjecture.
The analysis here goes further, however, and explains why democratic accountability appears
to operate in the financial sector despite problems of voter information and political
credibility that can severely handicap it.
Satyanath (2005) argues the contrary: because political checks and balances limited
their ability to choose financial sector regulators, heads of democratic governments in East
Asia were less informed about crisis and less able to rein in regulator-approved rent-seeking.
Satyanath (2005) posits this as one of several channels through which regime type affects
financial sector outcomes. The focus here is on another one of these channels, the “crony”
channel – the incentives of governments to cater to special interests.
Other crisis analyses focus on conflicts between large social interests. Implicit in
Alesina and Drazen (1991) is the conclusion that multiple veto players – political checks and

5
balances – inefficiently delay country responses to crisis. They observe that if large groups
are uncertain of the costs that crisis imposes on the others, they each prefer to delay reform
in order to reduce the costs of adjustment that they specifically bear, even if overall costs of
adjustment rise. Rodrik (1999), in contrast, argues that growth collapses driven by
exogenous shocks are lower in countries with better institutions for managing conflict,
among which most observers would include political checks and balances.
Empirical evidence is mixed on these points. Rodrik (1999) finds some evidence
that aggregate measures encompassing checks and balances hasten growth recoveries from
shocks. Checks and balances have no significant direct effect on the duration of banking
crises in Montinola (2003), however, though in their absence IMF credits significantly
increase the duration of crisis. The response to debt crises of authoritarian and democratic
governments in Latin America is about the same in Remmer (1991). Here, consistent with a
new argument that multiple veto players reduce payoffs to rent-seeking, even if they also
cause delay, political checks and balances have no effect on the government response to
crisis.
Elections, checks and balances and special interest influence on legislation The simple model below asks how citizens can hold politicians accountable even
when they are poorly informed and politicians cannot make credible pre-electoral promises
to voters, two characteristics of policies related to financial crisis.1 Despite the absence of
credibility and full information, voters can still have an influence on policy if, following
Ferejohn (1986), they can coordinate on a performance threshold that determines whether
1 Feijen and Perotti (2005) take a different tack, analyzing the effect of special interest
competition on financial sector instability.
6
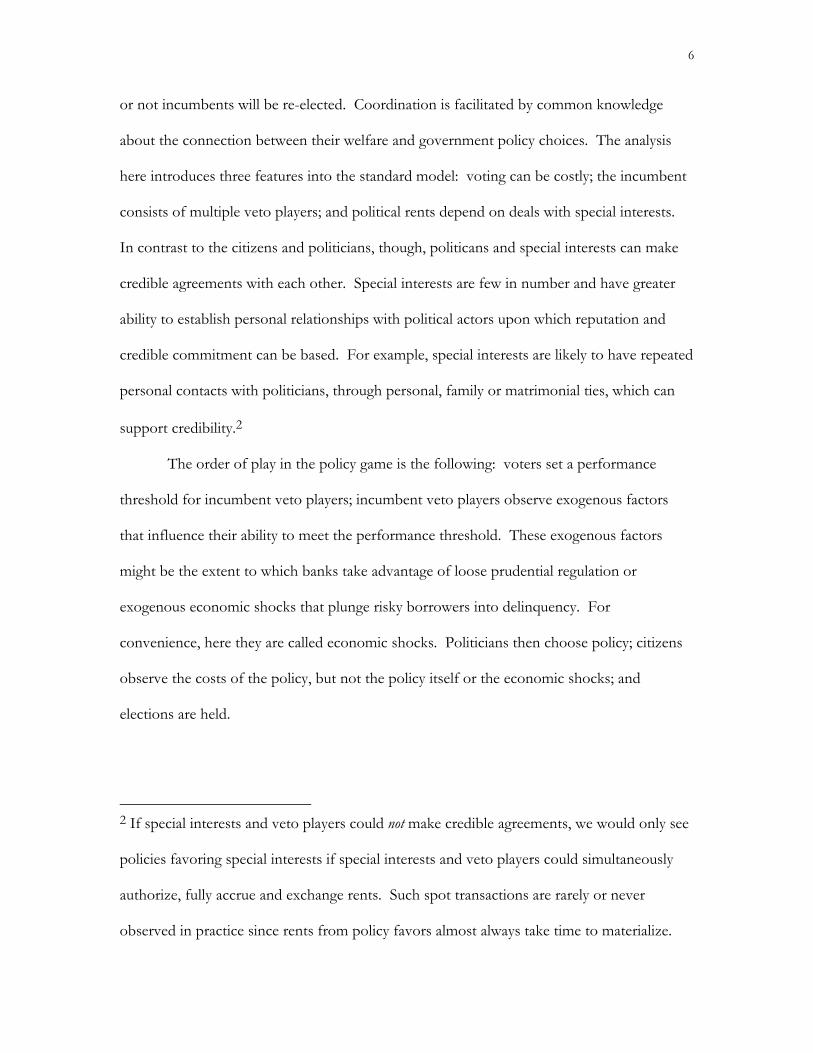
or not incumbents will be re-elected. Coordination is facilitated by common knowledge
about the connection between their welfare and government policy choices. The analysis
here introduces three features into the standard model: voting can be costly; the incumbent
consists of multiple veto players; and political rents depend on deals with special interests.
In contrast to the citizens and politicians, though, politicans and special interests can make
credible agreements with each other. Special interests are few in number and have greater
ability to establish personal relationships with political actors upon which reputation and
credible commitment can be based. For example, special interests are likely to have repeated
personal contacts with politicians, through personal, family or matrimonial ties, which can
support credibility.2
The order of play in the policy game is the following: voters set a performance
threshold for incumbent veto players; incumbent veto players observe exogenous factors
that influence their ability to meet the performance threshold. These exogenous factors
might be the extent to which banks take advantage of loose prudential regulation or
exogenous economic shocks that plunge risky borrowers into delinquency. For
convenience, here they are called economic shocks. Politicians then choose policy; citizens
observe the costs of the policy, but not the policy itself or the economic shocks; and
elections are held.
2 If special interests and veto players could not make credible agreements, we would only see
policies favoring special interests if special interests and veto players could simultaneously
authorize, fully accrue and exchange rents. Such spot transactions are rarely or never
observed in practice since rents from policy favors almost always take time to materialize.

7
Government is composed of n veto players who set a policy q ∈ [0, 1], where q is a
normalized subset of the real line assumed closed, bounded and connected. Without loss of
generality, q =0 is the policy most preferred by citizens; special interests most prefer the
policy given by q =1. The policy favors to special interests are then simply q, the distance of
the policies from citizens’ preferred outcome, 0.
Special interests earn rents π(q) from any policy q. Rent-seeking profits are greatest
at the most preferred policy of special interests, q = 1, and πq >0. The costs to citizens of
the policy q are, for simplicity, a function of the policy itself and a random parameter
(economic shock) δ distributed over [-d, d] with density function f (δ) and set equal to
π(q - δ): the more negative the shock, the more costly the policy for citizens. Politicians
observe δ prior to setting q. Citizens observe π but not q or δ. Citizen information
constraints are consistent with the characteristics of financial sector policy, where citizens are
poorly informed about the respective contribution to crisis of government regulatory
policies prior to crisis and economic shocks. Satyanath (2005) shows that information
asymmetries within government can also affect policy outcomes, specifically those related to
banking crises; the analysis here abstracts from this issue.3
Attention here is focused on the effect only of elections and the number of veto
players, so a simple institutional setting is assumed. As in Lizzeri and Persico (2001), veto
players are chosen in n simultaneous, not necessarily fair elections in a single, national
3 In a model with a single veto player, but also employing retrospective voting rules,
Rosendorff (2004) finds that democracy not only reduces rents directly, by making
incumbents easier to expel, as in Prediction 1 below, but also indirectly, by giving
incumbents greater incentives to reduce these information asymmetries.

8
electoral district. Each veto player faces one challenger. No policy can emerge without the
agreement of all veto players and voters have no other basis for distinguishing among veto
players than whether a policy was approved or not. Voters therefore hold veto players
jointly responsible for all policy decisions of the government, either rejecting or retaining all
veto players in any election.
Politicians maximize their pecuniary and non-pecuniary rents from holding office.
As in Besley and Coate (1999), the pecuniary rents that politicians extract directly enhance
their utility and play no role in their electoral chances.4 As in Ferejohn (1986) and Persson
and Tabellini (2000), veto players are also assumed to receive non-pecuniary rents R from
holding office, giving them total rewards from holding office equal to ( ) Rqn
+πα , where α is
the share of pecuniary rents that they receive. Non-pecuniary rents appear to figure
prominently in political calculations. Carlos Andres Pérez, for example, a former president
of Venezuela, maintained, “I have said many times I am a man with only one ambition –
history[.]” Gonzalo Sánchez de Lozada’s defeat in a presidential election in Bolivia was
described as “. . . a moment of disillusion and loss [that] had a profound impact. The
almost-president entered a period of deep depression[.]” (Grindle, p. 65 and p. 113).
For simplicity, non-pecuniary rents are independent of the number of veto players.
This follows immediately for ego rents that come from the power to veto legislation, since
veto power does not decline in the number of veto players. However, the results below
require only that they decline less than proportionally as the number of veto players
4 Since politician promises are not credible, they have no incentive to use rents to convey
their type or the content of their electoral promises to voters, as in Grossman and Helpman
(1996).

9
increases. That is, results hold as long as the non-pecuniary benefits of being, for example,
one of 435 members of the United States House of Representatives are more than one-
fourth (100/435) as large as those of being one of 100 United States senators.5 The share of
total rents that veto players receive is assumed to be exogenous. Veto players as a group
receive απ, 0<α<1 and special interests the remainder and veto players share rents equally,
each receiving απ/n. These assumptions are again purely for simplicity. Annex 2 shows that
the predictions are the same in the more realistic cases in which veto players and special
interests can bargain over rent shares.
Because challengers cannot credibly promise to do a better job than incumbents,
elections discipline incumbents only if citizens can coordinate on a performance threshold
π prior to the elections. Citizens replace incumbents if they experience welfare losses
above π ; otherwise, they retain incumbents. In contrast to other models in this vein,
citizens confront a cost m of expelling incumbents from office. As elections become entirely
free and competitive, m goes to zero; where incumbents prohibit electoral competition,
5 Three pieces of anecdotal evidence suggest that this is so. Senators and representatives
enjoy equal access to many perks of office (e.g., immunity from criminal prosecution when
Congress is in session). As measured by campaign contributions, House members seem to
enjoy more than one-fourth the influence over policy making as senators (for example,
House majority leader Hastert received $2.4 million in the 1999-2000 campaign cycle, Senate
majority leader Frist $5.8 million). And House staffs appear to be more than one-fourth as
large as Senate staffs (most congressional websites do not list staff, but two that do are
Congressman Case from Hawaii, with eight non-clerical staff in his Washington office, and
Senator Boxer from California, with 21).

10
however, m rises to reflect the higher costs that citizens must incur if they use extra-
institutional means of removing non-performing incumbents.
Incumbents observe the performance threshold and must determine whether to
meet it after observing the shock. If they choose to remain in office, they must therefore
choose q such that π(q -δ) <π . Since they prefer as many rents as possible, incumbents who
choose to meet the threshold at all will choose to meet it exactly, setting π(q - δ) =π and
earning rents given by Rn
+πα . If they choose not to meet the voter threshold, they are
thrown out of office no matter how far above the threshold their rents are. They therefore
choose the maximum level of rents, given by q = 1, earning )1(παn
(plus rents from a
private career, assumed to be zero). Incumbents therefore abide by the performance
threshold set by voters when, setting q such that ( ) πδπ =−q ,
(1) ( ) ( )1παπαn
Rqn
≥+ ,
recalling that the shock δ affects citizen costs but not the rents earned by incumbents.
It is well-known (Ferejohn 1986) that in equilibrium, if incumbents abide by the
performance threshold, voters re-elect them; if incumbents choose maximum rents, voters
expel them. This strategy is weakly dominant: players can do no better using a strategy
other than the equilibrium strategy. Weak dominance, however, is sufficient to give voters
some leverage over politicians even when politicians are not credible (as when, for example,
politicians have not built reputations through repeated interaction with voters).
In finding the performance threshold π , citizens take into account that the more
negative is the shock δ, the more that incumbents will have to reduce q to meet any given
performance threshold. For a given threshold and a sufficiently large shock, incumbents

11
forego re-election and choose q = 1. Citizens confront a tradeoff between how often
incumbents choose to meet the threshold and citizen welfare when they choose to meet it.
If citizens fix too strict a performance threshold (with a low π ), their welfare will be high
when incumbents meet the threshold, but incumbents will more often choose not to, since
even a mild shock makes it worthwhile to forego re-election.
A unique performance threshold π that fulfills condition (1) therefore depends on
the existence of a unique shock threshold δ for any value of π . Annex 1 presents the
proof that a unique δ exists. The performance threshold that corresponds to δ is then easy
to find by noting that it must meet condition (2) (similar to Persson and Tabellini 2000,
Chapter 4):
(2) ( )1παπαn
Rn
=+ , for ( ) πδπ =−q and ( ) m≥−ππ 1 , and
( ) ( )1παδπαn
Rqn
<+− for all q satisfying ( ) δδπδπ <=− ,q .
The first part of condition (2) states that the performance threshold must be set such that at
policy q , the policy at which the incumbents are just indifferent between seeking and
foregoing re-election, the incumbents can just meet the performance threshold given a shock
equal to the threshold δ . Voters have an incentive to expel the incumbents if they fail to
meet the threshold. For shocks more negative than δ , there is no policy q that both satisfies
the performance threshold and gives incumbents an incentive to seek re-election.
Substituting the solution for δ from Annex 1 into ( ) πδπ =−q from condition (2) then
solves for the performance threshold.
Two key predictions emerge from this analysis and are tested below. Annex 2
demonstrates that the predictions persist even if players can bargain over rent shares.

12
Prediction 1: A decline in expulsion costs m (freer elections) reduces rents. For
sufficiently high expulsion costs m , condition (2) is never satisfied: a performance threshold
sufficiently generous to satisfy ( ) ( )1παπαn
Rqn
=+ and persuade incumbents to pursue re-
election leaves too few gains to voters to make it worth their while to expel the incumbent
should the incumbent not meet the threshold (the condition ( ) m≥−ππ 1 is violated). At
this corner solution incumbents always pursue maximum rents and are always expelled. It
follows immediately from this that rents fall for sufficiently large declines in m, a result that
persists in the more complex case in which actors bargain over rent shares (Annex 2) Large
differences in m are built into the empirical work below: countries either have or do not
have free and competitive elections.
Electoral accountability is less likely to hold when voters cannot observe the welfare
effects of the policy in question, or observe them only with a lag. An example makes this is
easy to see in the context of prudential regulation of banks, discussed in more detail below.
Voters observe the welfare effects of weak prudential regulation only when it precipitates a
financial crisis. Assume that rents from weak prudential regulation are ( )1π every year. If
weak prudential regulation 1=q leads immediately to crisis, then governments will impose
prudential regulation 1<q as long as it meets the condition ( ) ( )1παπαn
Rqn
=+ . However,
if 1=q leads to crisis only with a constant 20 percent probability every year (simplifying,
since crisis risk surely increases over time), the expected rents from lax regulation rise to
( ) ( )18.10
ππ >∗∫∞
dtt . They will be willing to impose only regulation that meets the
13
condition ( ) ( )∫∞
∗=+0
8.1 dtn
Rqn
tπαπα , implying a lower (more permissive) q . This level
of lax regulation will prevail even in countries with low costs m of expelling incumbents.
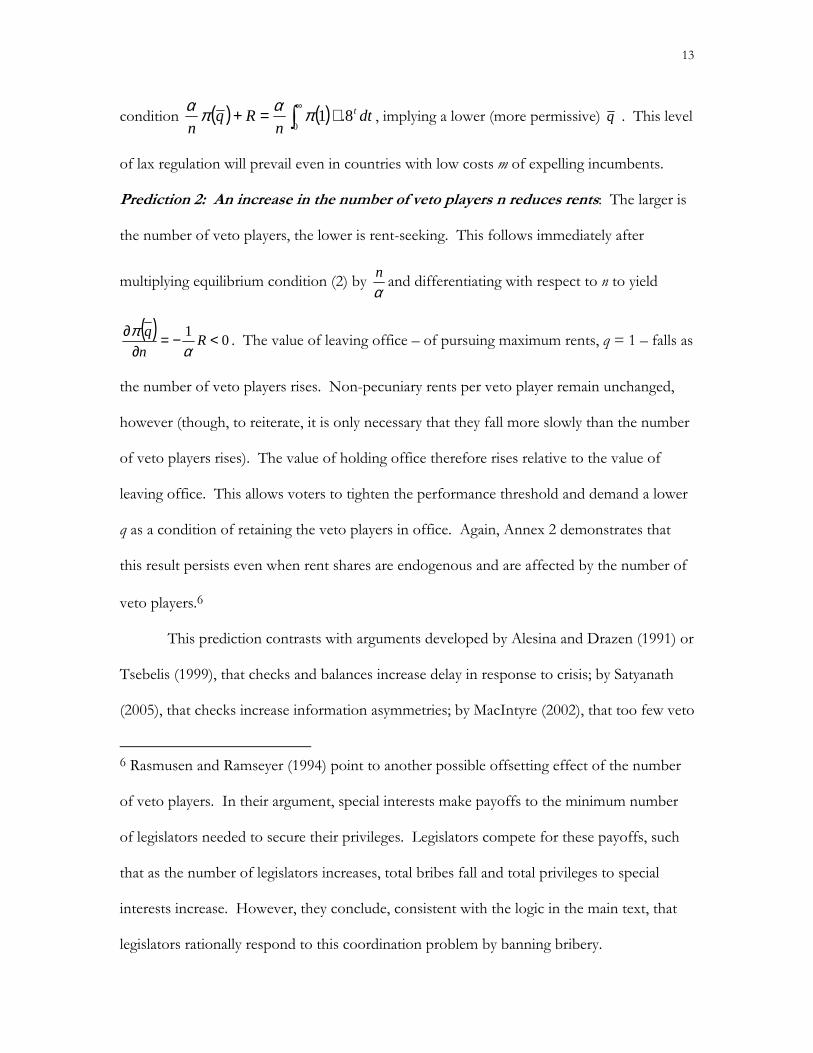
Prediction 2: An increase in the number of veto players n reduces rents: The larger is
the number of veto players, the lower is rent-seeking. This follows immediately after
multiplying equilibrium condition (2) by αn and differentiating with respect to n to yield
( )0
1 <−=∂
∂R
n
q
απ . The value of leaving office – of pursuing maximum rents, q = 1 – falls as
the number of veto players rises. Non-pecuniary rents per veto player remain unchanged,
however (though, to reiterate, it is only necessary that they fall more slowly than the number
of veto players rises). The value of holding office therefore rises relative to the value of
leaving office. This allows voters to tighten the performance threshold and demand a lower
q as a condition of retaining the veto players in office. Again, Annex 2 demonstrates that
this result persists even when rent shares are endogenous and are affected by the number of
veto players.6
This prediction contrasts with arguments developed by Alesina and Drazen (1991) or
Tsebelis (1999), that checks and balances increase delay in response to crisis; by Satyanath
(2005), that checks increase information asymmetries; by MacIntyre (2002), that too few veto
6 Rasmusen and Ramseyer (1994) point to another possible offsetting effect of the number
of veto players. In their argument, special interests make payoffs to the minimum number
of legislators needed to secure their privileges. Legislators compete for these payoffs, such
that as the number of legislators increases, total bribes fall and total privileges to special
interests increase. However, they conclude, consistent with the logic in the main text, that
legislators rationally respond to this coordination problem by banning bribery.
14
players undermine the credibility of reforms in the face of crisis and too many delay reforms
altogether; and by Powell and Whitten (1993), whose argument implies that divided control
of government clouds voters’ ability to hold the executive accountable for bad outcomes.
These predictions are not mutually exclusive; if they all hold, it is possible that the number of
veto players would have no observed effect on rents, exactly as observed below.
Using financial crises to examine the effects of electoral accountability In the last twenty years, more than 40 countries have experienced banking crises,
triggering losses sometimes exceeding 50 percent of national income. Government policies
play a large role in affecting whether crises will occur and in allocating the costs of crisis.
The model predicts that elections may not affect the first type of policies but should exert
strong effects on the second. This section presents a brief overview of how both types of
policies affect outcomes in the financial sector. It also makes clear that, consistent with the
assumptions of the model, financial sector policies are difficult for citizens to observe
directly and are rarely the subject of credible pre-electoral promises by political competitors.
However, once crises occur, voters can coordinate on ex post voting rules such as those
described above.

15
Table 1: Illiquidity and insolvency in banking Deposits Good loans
(interest on loans = 15%)
Bad (insider) loans (non-income producing)
Liquidity requirement (interest on deposits = 10%)
Liquidity that must be financed from new deposits
Excess of bank liabilities over assets
$1000 $100 $900 .10 * $1000 = $100
$100 – $15 = $85
$900

16
Prior to crises, bankers invest deposits in high risk loans or use bank deposits for
private purposes or consumption by bank insiders. When high risk loans stop returning
interest and principal payments to the lender, banks cannot pay off holders of bank
liabilities, including depositors, unless they attract new deposits. Of course, even if all of the
loans were low risk, a bank crisis could nevertheless occur if the country sustained a severe
economic shock that undermined the ability of borrowers to repay. Such shocks are
controlled for in the empirical work below.
Table 1 presents a snapshot of an insolvent bank or banking system that is ripe for
crisis. The bank has taken $1000 in deposits and given 90 percent of them to insiders, who
pay no interest. The other ten percent of deposits have been committed to low-risk,
income-generating loans. The bank will owe $100 in interest in the next period, but will
collect only $15 from the good loans it has made. It must attract $85 in deposits to make up
the difference. A bank crisis transpires when imprudent bankers cannot attract sufficient
new deposits to finance these interest obligations. If depositors think this might occur, they
rush to empty their accounts and create a run on the banking system.
Governments can limit the potential for crisis through strict prudential regulation of
bank portfolios. However, as the discussion of Prediction 1 makes clear, their incentives to
do so are weak given the often long time lags between weak regulation and crisis and the
rarity of crisis: crisis occurs in fewer than one percent of the country-years in the database
used for this paper. The incentives of all governments, elected or non-elected, to pursue
strict prudential regulation are therefore low.
Once crisis occurs, however, a much different picture emerges. Citizens now observe
welfare effects, though not the relative contribution of policy and exogenous shocks. The
political consequences for how governments deal with insolvent banks then diverge sharply

17
across regime types. Two of these, forbearance and fiscal transfers to insolvent banks, are at
the center of the empirical tests below. A government regulator can allow imprudent
behavior to continue in insolvent banks by forbearing from intervening in them.
Governments can also encourage imprudence if they make fiscal transfers to banks to
preserve their liquidity (supplying the $85 indicated in Table 1 that are needed to pay off the
current obligations to liability holders) or even by recapitalizing them (by infusing $900 to
cover the shortfall of assets relative to liabilities indicated in Table 1).
Forbearance closely matches the policies q in the earlier analysis. It has a direct
effect on citizen welfare (it allows imprudent bankers to extend and continue their risky
activities), but citizens cannot observe it. The fiscal costs of bailouts are also likely to be an
element of q. They are often off-budget and difficult to observe, and the impact of transfers
– as with forbearance – is not felt by citizens until the economic effects of crisis are revealed
in the form of currency devaluation, inflation, tax increases, a drastic fall in access to credit,
and recession (all of which can be considered π in the analysis above).7
The foregoing framework is useful for analyzing policy responses to financial crisis
for two additional reasons that are explored below. First, although there are arguments to
the contrary, forbearance and fiscal transfers actually do serve private interests at the
expense of public. Second, special interests tend to have homogeneous preferences in the
case of these policies: cross-country differences in responses are not likely to be caused by
heterogeneous distributions of interest groups, as Mulligan and Sala-i-Martin (2004) argue
(this possibility is tested empirically, as well).
7 If fiscal costs were observable by citizens, then a simple, full information model is a more
appropriate conceptual framework; such a model generates immediately the two key
predictions here.

18
Do bank bailouts serve public or private interests? Governments have three policy choices when confronted with bank insolvencies.
The first two are equivalent to bankruptcy and bank closure. From the Table 1 example,
government could re-possess $900 of assets from delinquent borrowers, forcing this narrow
group to bear the costs of crisis; or waive the bank’s obligation to return $900 of deposits,
obliging a generally small group of depositors who control most of the deposits to bear the
costs of crisis. Government’s third choice is a $900 bailout.
The premise of this analysis is that the fiscal transfers implied by the third choice
benefit special interests at the expense of citizens generally. However, bailouts could benefit
the public if bank crises are precipitated by exogenous shocks that undermine the balance
sheets of prudent banks. The closure of prudent banks severs the close relationship between
borrowers and bankers. High quality borrowers lose access to capital, since they cannot
quickly forge close relationships with other financial institutions. Forbearance and fiscal
transfers to keep banks open then serve the public interest (see Dewatripont and Tirole
1994). Certainly governments use these arguments in justifying bank bailouts, leaving
citizens uncertain about the relationship between q, fiscal transfers, and their welfare π.
There is little evidence to support this public interest view, however.
The public interest logic implies that the larger is the insolvency problem, the more
credit relationships are at risk and the greater should be government bailouts. Information
on the magnitude of bank insolvency (the excess of liabilities over assets) is available for a
handful of crisis countries. In these cases, there is no correlation between the magnitude of
insolvency and the size of fiscal transfers.8 In addition, using qualitative and econometric
8 In Chile, the assets of insolvent institutions (one measure of the magnitude of crisis)
amounted to approximately 22 percent of GDP, but bailout costs were twice as high, 41

19
evidence, Rosas (2002) concludes that bailouts and forbearance were largely a function of
political influence, not technocratic determinations about the prudence of banks. Finally,
even if it were true that fiscal transfers had broad social benefits, this would imply that
democracies might make larger transfers than autocracies, biasing the empirical tests below
towards rejecting the hypothesis that democracies curb fiscal bailouts.
Are bank bailouts the product of a struggle between interest groups, or between interest groups and the public interest?
In some countries the financial sector comprises large and small banks, prudent and
imprudent banks, and banks and non-bank financial institutions. These often do not have
convergent interests. Prudent financial institutions and competitors of defaulting borrowers
might resist bailouts of imprudent and insolvent institutions, for example. Nevertheless,
even heterogeneous financial interests often prefer the same policy responses to crisis.
Romer and Weingast (1991) document that both solvent and insolvent savings and loans
opposed increased funding for regulatory agencies, the first because they feared those
resources would be funded through taxes on all savings and loans; the second because they
knew better funded regulators would intervene more aggressively in their institutions.
percent. In Colombia, assets amounted to eight percent of GDP, but the fiscal costs of
resolving the crisis were lower, at five percent. Deposits in insolvent institutions (a second
measure of crisis magnitude) were approximately 5 percent of GDP in Uruguay, where
bailout costs were seven percent of GDP; however, deposits in insolvent institutions
amounted to nine percent of GDP in Malaysia in 1985, where the bailout was only 4.7
percent of GDP. The asset and deposit information are from Caprio and Klingebiel, 1997.
20
In any case, competing interests are simply not present in most of the countries
analyzed here. These countries do not exhibit the degree of dispersion of bank size that is
evident in the United States; most countries do not have highly developed non-bank
financial institutions, and even when they do, these do not register strong opposition to
financial sector bailouts financed by taxpayers (indeed, they are often also the recipients of
these bailouts). Finally, even if competing special interests were a significant phenomenon,
their presence would bias the tests below towards rejecting the institutional predictions
examined here.
Explaining fiscal transfers and forbearance: data and empirical specification The central hypothesis tested here is that fiscal transfers to special interests
(insolvent banks, their borrowers, and their creditors) should decline as the costs of
removing political decision makers from office falls and that political checks and balances
reduce incentives to cater to special interests, offsetting the effect that checks have in
delaying government response to crisis. These predictions are tested using ordinary least
squares estimation of: iitransfers εβ ++= ΒΧ0i . The correlates X include both political
and non-political determinants of fiscal transfers. The model also predicts that forbearance
should be less likely in the event of crisis. This is tested using a probit estimation of
iieforbearanc εβ ++= ΒΧ0i .
Fiscal transfers are taken from Honohan and Klingebiel (2003), who collected data
on government responses to financial crisis for 40 crises in 35 countries since 1975. Their
calculations incorporate both the fiscal and quasi-fiscal outlays for financial system
restructuring, including the recapitalization cost for banks and the costs of indemnifying
depositors. Transfers range from 0.5 to 55.1 percent of GDP. Using interviews with
country experts, IMF reports and other sources, Honohan and Klingebiel (2003) also

21
identify 26 crisis episodes in which governments exercised forbearance – relaxed or did not
enforce regulations for at least a twelve month period after being informed about solvency
problems in the financial sector. This variable is measured with less precision. For example,
their sources did not allow them to assess the extent to which, in the context of forbearance,
governments nevertheless placed informal limits on continuing imprudent behavior by
banks. Nevertheless, as we expect, fiscal costs of transfers were 12 percent of GDP higher
in countries that did not intervene in insolvent banks.
Political variables are taken from the 2000 release of the Database of Political
Institutions, or DPI (Beck, et al., 2000). In contrast to other analyses of these issues,
disaggregated, objective indicators of political institutions are employed here. The costs m to
average citizens of removing veto players are captured with two measures. The Executive
Index of Electoral Competitiveness (EIEC) reflects whether executive elections are non-
competitive, in which case the costs to citizens of removing non-performing incumbents is
likely to be high (results are robust to using the parallel Legislative Index of Electoral
Competitiveness). The variable scored from one, no elections, to seven, elections in which
there are multiple candidates running for office and no candidate obtains more than 75
percent of the vote. The prediction that a fall in m reduces rents is true for large changes in
m. Consistent with this, in the empirical work below EIEC is dichotomized, set equal to one
if EIEC equals six or seven (where six indicates that multiple candidates could and did run
for office, but the winner received more than 75 percent of the vote), and zero otherwise.
Results are also robust to using a second measure, the number of years from the crisis year
until the next election as a measure of m, as dated by the Database of Political Institutions.
The number of veto players is captured by the variable checks from DPI. In
presidential systems, checks is the sum of one (if EIEC is greater than four, to distinguish
22
elected and un-elected presidents), one (for the president), one for each legislative chamber,
and one if the first government party is closer in political orientation (left, right or center) to
the first opposition party than to the party of the president. If the legislature is closed list
(voters must vote for parties and cannot register candidate preferences) and the president’s
party has a majority in parliament, the legislature is not counted as a check. Similarly, if the
legislature is not competitively elected, the presumption is that the president entirely controls
policy and again the legislature is not counted as a check. The process is the same in
parliamentary systems, except that checks counts one for the prime minister and adds the
number of parties in the governing coalition; the number is reduced by one if there is a
closed list and the prime minister’s party is in the coalition.
By construction, in its raw form the DPI checks variable simultaneously captures
whether countries have competitive elections and the number of veto players. To isolate
the latter effect, the empirical analysis below employs the residual of the regression of the
checks variable on the competitive elections variable (the variation in the number of veto
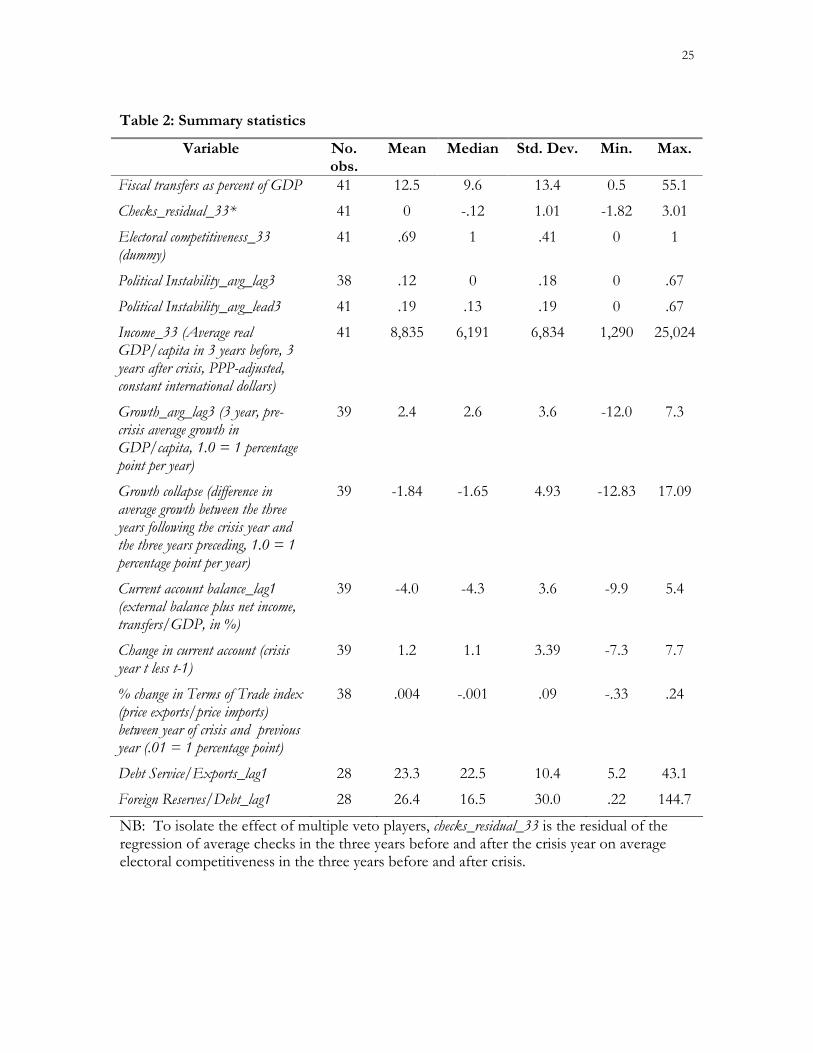
players independent of variation in electoral competitiveness). As the Table 2 data summary
indicates, countries exhibit significant variation with respect to this residual, or “pure”
checks and balances, with a standard deviation of one veto player, compared to 1.6 in the
raw variable.9
The theory assumes that special interests, unlike citizens, can make credible
agreements with politicians. This assumption is unlikely to hold if there is substantial
political instability prior to crisis, however: special interest representatives and politicians do
9 Most of the regressions below control for elections; in those cases, this transformation is
redundant. In some estimations, however, this is not the case, so for consistency of
presentation the checks residual is used throughout.

23
not have the opportunity to build up personalized reputations if the identity of political
decision makers shifts frequently. If special interests cannot credibly promise to share the
profits that they earn because of policy q, politicians have no reason to make such
agreements; rent-seeking π should therefore fall.10 The empirical analysis therefore controls
for political instability prior to the crisis year using a DPI variable stabns, labeled here political
instability, that takes into account the fact that governments may have multiple veto players.
For any period t, political instability is the fraction of veto players in period t-1 who
are no longer veto players in period t (e.g., because a party dropped out of a coalition
government or a government changed hands). Political Instability takes a value of either zero
or one in countries where there are no elections (the single veto player is an autocrat who is
either removed from office or not). In democratic governments, it can be any fraction from
zero to one, depending on the share of veto players who are replaced.
Bank crises can be precipitated by shocks that drive down the value of bank assets
relative to bank liabilities. To control for these, X variously includes movements in the
terms of trade and the current account balance, and the ratio of international reserves to
debt. The effect of these shocks on fiscal transfers is ambiguous because the exogenous
component of these shocks (the component unaffected by government policy) may or may
not be observed by voters. If the exogenous component is unobserved, the analysis predicts
10 This is similar to Frederiksson and Svensson (2003), who argue that political instability
reduces the returns to lobbyists of buying policy favors from incumbents. It contrasts with
Acemoglu and Robinson (2001), where the lack of credibility between special interests and
veto players leads governments to pursue less efficient subsidy modalities that mitigate the
commitment problem (e.g., by encouraging entry into the subsidized industry).

24
that these shocks should drive up the fiscal costs of crisis (because politicians realize that
they cannot achieve the performance threshold while retaining sufficient rents to make re-
election worthwhile). If it is observed, these shocks should have no effect on the transfers.
The variables capturing economic shocks are all lagged one year, since we expect these to
precipitate crisis.
In some specifications, per capita income and short-run economic growth are
included as controls. Both variables generate spurious downward bias in the election
coefficient since the first is strongly associated with the presence of competitive elections
and growth, in the short periods around financial crisis, is heavily influenced by the rapid
changes in private sector lending activity typically attributed to pre- and post-crisis changes
in the financial sector.
25
Table 2: Summary statistics
Variable No. obs.
Mean Median Std. Dev. Min. Max.
Fiscal transfers as percent of GDP 41 12.5 9.6 13.4 0.5 55.1
Checks_residual_33* 41 0 -.12 1.01 -1.82 3.01
Electoral competitiveness_33 (dummy)
41 .69 1 .41 0 1
Political Instability_avg_lag3 38 .12 0 .18 0 .67
Political Instability_avg_lead3 41 .19 .13 .19 0 .67
Income_33 (Average real GDP/capita in 3 years before, 3 years after crisis, PPP-adjusted, constant international dollars)
41 8,835 6,191 6,834 1,290 25,024
Growth_avg_lag3 (3 year, pre-crisis average growth in GDP/capita, 1.0 = 1 percentage point per year)
39 2.4 2.6 3.6 -12.0 7.3
Growth collapse (difference in average growth between the three years following the crisis year and the three years preceding, 1.0 = 1 percentage point per year)
39 -1.84 -1.65 4.93 -12.83 17.09
Current account balance_lag1 (external balance plus net income, transfers/GDP, in %)
39 -4.0 -4.3 3.6 -9.9 5.4
Change in current account (crisis year t less t-1)
39 1.2 1.1 3.39 -7.3 7.7
% change in Terms of Trade index (price exports/price imports) between year of crisis and previous year (.01 = 1 percentage point)
38 .004 -.001 .09 -.33 .24
Debt Service/Exports_lag1 28 23.3 22.5 10.4 5.2 43.1
Foreign Reserves/Debt_lag1 28 26.4 16.5 30.0 .22 144.7
NB: To isolate the effect of multiple veto players, checks_residual_33 is the residual of the regression of average checks in the three years before and after the crisis year on average electoral competitiveness in the three years before and after crisis.

26
Table 2a: Crisis countries and fiscal costs Country Crisis
Year Fiscal Cost of Crisis (% GDP)
Country Crisis Year Fiscal Cost of Crisis (% GDP
Argentina 1995 .5 Malaysia 1985 4.7
Argentina 1980 55.1 Mexico 1995 19.3
Australia 1989 1.9 New Zealand 1987 1
Brazil 1994 13.2 Norway 1987 8
Bulgaria 1996 13 Paraguay 1995 5.1
Chile 1981 41.2 Philippines 1983 13.2
Colombia 1982 5 Philippines 1998 .5
Cote d’Ivoire 1988 25 Poland 1992 3.5
Czechoslovakia 1989 12 Senegal 1988 9.61
Ecuador 1996 13 Slovenia 1992 14.61
Egypt 1991 .53 Spain 1977 5.6
Finland 1991 11 Sri Lanka 1989 5
France 1994 .69 Sweden 1991 4
Ghana 1982 3 Taiwan 1997 11.5
Hungary 1991 10 Thailand 1983 2
Indonesia 1997 50 Thailand 1997 32.8
Indonesia 1992 3.8 Turkey 1982 2.5
Japan 1991 12.3 Turkey 1994 1.1
Korea 1997 26.5 United States 1988 3.2
Malaysia 1997 16.4
27
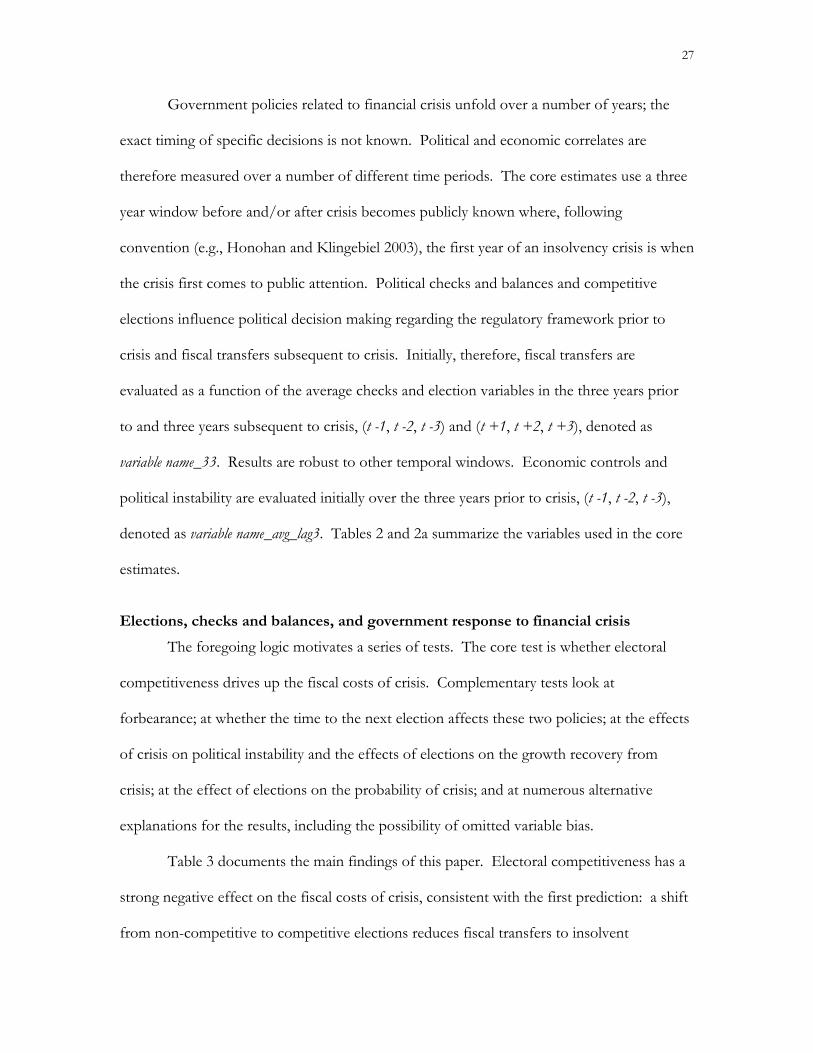
Government policies related to financial crisis unfold over a number of years; the
exact timing of specific decisions is not known. Political and economic correlates are
therefore measured over a number of different time periods. The core estimates use a three
year window before and/or after crisis becomes publicly known where, following
convention (e.g., Honohan and Klingebiel 2003), the first year of an insolvency crisis is when
the crisis first comes to public attention. Political checks and balances and competitive
elections influence political decision making regarding the regulatory framework prior to
crisis and fiscal transfers subsequent to crisis. Initially, therefore, fiscal transfers are
evaluated as a function of the average checks and election variables in the three years prior
to and three years subsequent to crisis, (t -1, t -2, t -3) and (t +1, t +2, t +3), denoted as
variable name_33. Results are robust to other temporal windows. Economic controls and
political instability are evaluated initially over the three years prior to crisis, (t -1, t -2, t -3),
denoted as variable name_avg_lag3. Tables 2 and 2a summarize the variables used in the core
estimates.
Elections, checks and balances, and government response to financial crisis The foregoing logic motivates a series of tests. The core test is whether electoral
competitiveness drives up the fiscal costs of crisis. Complementary tests look at
forbearance; at whether the time to the next election affects these two policies; at the effects
of crisis on political instability and the effects of elections on the growth recovery from
crisis; at the effect of elections on the probability of crisis; and at numerous alternative
explanations for the results, including the possibility of omitted variable bias.
Table 3 documents the main findings of this paper. Electoral competitiveness has a
strong negative effect on the fiscal costs of crisis, consistent with the first prediction: a shift
from non-competitive to competitive elections reduces fiscal transfers to insolvent

28
institutions of more than 14 – 22 percentage points of GDP. The offsetting influences of
multiple veto players yield no net effect of checks and balances on the government response
to financial crisis. The electoral effect persists in the presence of income controls in
columns 5 and 6, although the correlation between the two variables is greater than .40; and
in substantially smaller samples, in columns 4 and 6. However, consistent with the earlier
discussion of offsetting effects, in no specification does the number of veto players exercise
an independent influence on policy responses to crisis. Coefficient estimates in Table 3 are
reasonably stable and significant or nearly significant if one uses four other timing
assumptions: a two year window on either side of the crisis year; a four year window; a three
year window before the crisis year; or a three year window afterwards.
The final four columns of Table 3 take a variety of macroeconomic variables into
account. None of these – current account reserves, terms of trade shocks, economic growth
and income, debt service and total debt burden, nor government spending as a fraction of
GDP – exert a significant influence on the variables of interest. However, the effect of a
change in current account balance (but not of terms of trade or other shocks) turns out to
differ dramatically across regime types. Interacting the change in current account balance
with the elections variable in specification four reveals that a one percent of GDP decline in
the current account balance is associated with a three percent of GDP increase in the fiscal
payouts to banks in non-democracies, but an insignificant decrease in the fiscal payouts in
countries with competitive elections (not reported).11 Finally, Table 3 results are not at all
11 The magnitude and significance of the interaction fall significantly when three non-
democracies, Chile, Argentina and Egypt, are omitted. The interaction of checks and
current account changes is also highly significant.
29
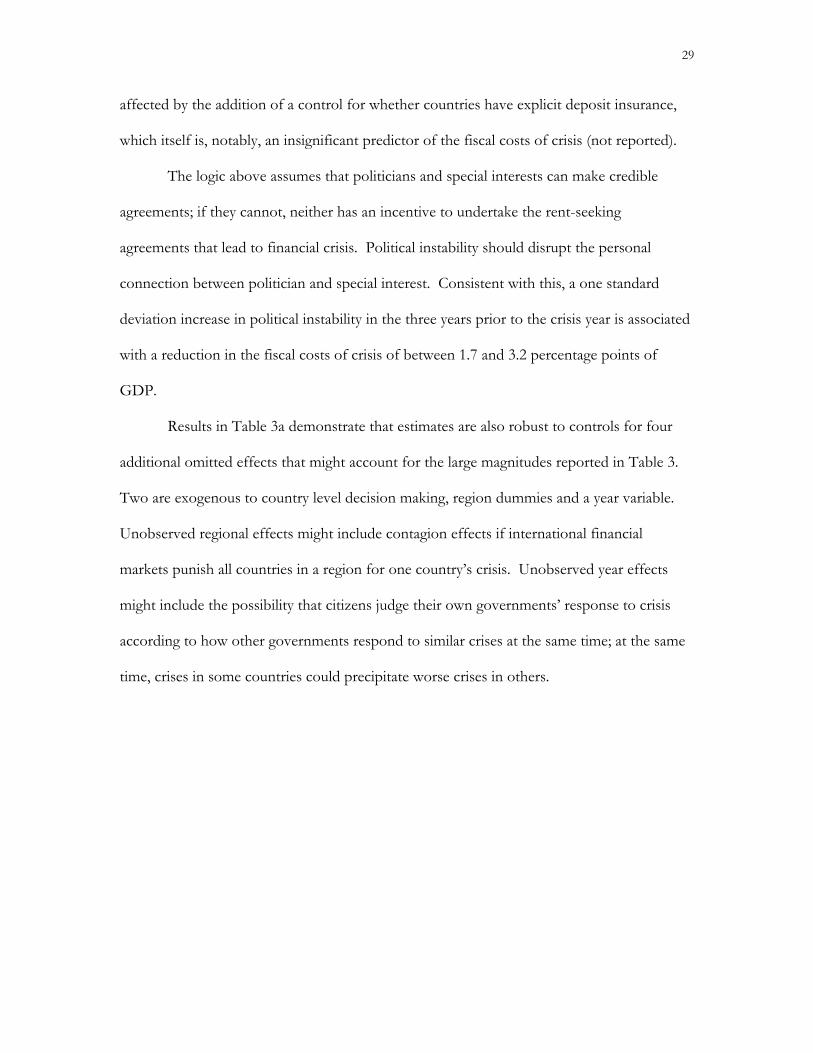
affected by the addition of a control for whether countries have explicit deposit insurance,
which itself is, notably, an insignificant predictor of the fiscal costs of crisis (not reported).
The logic above assumes that politicians and special interests can make credible
agreements; if they cannot, neither has an incentive to undertake the rent-seeking
agreements that lead to financial crisis. Political instability should disrupt the personal
connection between politician and special interest. Consistent with this, a one standard
deviation increase in political instability in the three years prior to the crisis year is associated
with a reduction in the fiscal costs of crisis of between 1.7 and 3.2 percentage points of
GDP.
Results in Table 3a demonstrate that estimates are also robust to controls for four
additional omitted effects that might account for the large magnitudes reported in Table 3.
Two are exogenous to country level decision making, region dummies and a year variable.
Unobserved regional effects might include contagion effects if international financial
markets punish all countries in a region for one country’s crisis. Unobserved year effects
might include the possibility that citizens judge their own governments’ response to crisis
according to how other governments respond to similar crises at the same time; at the same
time, crises in some countries could precipitate worse crises in others.

30
Table 3: Elections, political instability and fiscal transfers during financial crises (t-statistics in parentheses)
Dependent variable: Fiscal costs of crises/GDP
(1)
(2)
(3) (4) (5) (6)
checks_residual_33
.44 (.31)
.25 (0.13)
.63 (0.31)
2.53 (1.04)
.20 (.11)
3.13 (1.35)
Electoral competitiveness_33
-14.01 (-2.52)
-12.64 (-2.49)
-9.33 (-1.83)
-13.95 (-1.94)
-12.06 (-2.34)
political instability_avg_lag3
-16.19 (-2.27)
-14.43 (-1.90)
-19.00 (-2.06)
-10.31 (-1.50)
-20.52 (-1.75)
Current account balance (CAB, t-1, %GDP)
-.47 (-.77)
-.56 (-.67)
-1.22 (-1.33)
CAB(t) – CAB(t-1) -.63 (-.83)
-.75 (-.99)
-.63 (-1.15)
Terms of trade (percent change between t-1 and crisis year t)
-3.5 (-.10)
3.54 (.10)
Income_33 -.0001 (-.49)
.002 (2.70)
Growth_avg_lag3 1.09 (2.24)
.38 (.58)
Total reserves/total debt (t-1) .12
(2.00) .04
(.51)
R2 .10 .28 .28 .39 .32 .50
N 41 38 38 27 38 27
Note: Robust (White-adjusted) standard errors. Observations are “clustered”, such that independence is assumed across countries but not between observations from the same country (Argentina, Indonesia, Malaysia, Philippines, Turkey, and Thailand). Constant not reported.

31
Table 3a: The robustness of elections results to country, year, other controls
(t-statistics in parentheses)
Specifications from Table 3 Dependent variable: Fiscal costs of crises/GDP (1) (2) (3) (4) (5) (6)
checks_residual_33
2.94 (1.51)
2.95 (1.52)
3.73 (2.20)
6.32 (3.83)
2.53 (1.26)
5.86 (2.55)
Electoral competitiveness_33
-11.27 (-2.73)
-14.75 (-3.89)
-17.89 (-1.88)
-14.10 (-2.73)
-21.20 (-.77)
% change exchange rate ($/local currency, from year before to crisis year)
-11.22 (-1.60)
-8.60 (-1.05)
-14.16 (-1.74)
-19.60 (-1.67)
-17.43 (-1.69)
-22.76 (-1.28)
Average budget (surplus/deficit)/GDP, 3 years before crisis year
2.42 (3.12)
2.47 (3.59)
1.93 (4.52)
1.96 (2.03)
2.26 (2.71)
1.75 (.89)
Year -.27 (-.62)
-.008 (-.02)
.62 (1.80)
.83 (.70)
-.15 (-.50)
1.01 (.49)
Africa 12.62 (2.87)
4.16 (.72)
-6.09 (-1.14)
-11.65 (-1.31)
17.38 (1.44)
-7.74 (-.53)
Latin America 5.16 (1.00)
4.92 (1.07)
.99 (.26)
-.62 (-.12)
10.24 (1.30)
3.94 (.30)
East Asia 11.29 (3.31)
8.26 (2.22)
3.05 (.80)
-2.48 (-.45)
11.77 (1.20)
-.98 (-.09)
South Asia 24.9 (2.86)
28.20 (3.04)
19.67 (4.07)
21.67 (2.56)
36.55 (1.96)
26.55 (1.01)
R2 .48 .57 .65 .76 .63 .78
N 32 31 31 21 31 21
Note: Specifications are the same as in Table 3 with the seven additional controls reported here. Other controls from Table 3 are not reported. Robust (White-adjusted) standard errors. Observations are “clustered”, such that independence is assumed across countries but not between observations from the same country (Argentina, Indonesia, Malaysia, Philippines, Turkey, and Thailand). Constant not reported.

32
The other two controls are the percent change in exchange rate from the year before
to the year of the crisis and the average budget deficit as a fraction of GDP in the three years
preceding crisis. These proxy for the budget and other economic constraints that might
limit political flexibility in responding to crisis. However, both are clearly endogenous: they
are influenced by the same underlying political forces that dictate how a country responds to
a bank crisis. Indeed, if budget balance were a measure of the exogenous budget constraints
confronting governments, then the fiscal costs of crisis and the pre-crisis budget deficit
should be significant predictors of the post-crisis budget deficit; instead, they are entirely
insignificant. The introduction of these variables might therefore lead to spurious changes in
the significance and estimated coefficients of the checks and elections variables.
Controlling for four regional dummy variables (for East Asia, Africa, Latin America
and South Asia), currency devaluation, and for the year of crisis leads to no substantive
change in the estimates in Table 3: several of the regional dummies are frequently
significant; currency devaluation is not; the year of the crisis is not; the significance of the
elections variable is even greater; and checks and balances continue to exert no effect on
fiscal costs. Average budget balance is significantly and positively associated with the fiscal
costs of crisis. Nevertheless, the elections coefficient remains large and significant in all
cases except the last (where the budget variable is also insignificant). However, the
estimated coefficient of the checks variable rises substantially and is positive and significant
in three of six cases where budget balance is included. The instability of the estimates in
Table 3a and the evidence that budget balance does not behave like an exogenous constraint
on government behavior suggests that these results are likely due to multicollinearity.

33
Table 4: Democracy and forbearance
(z-statistics in parentheses)
Equation numbers from Table 2 Dependent variable: Did governments forbear? (1=yes, 0=no) (1) (2) (3) (4) (5) (6)
Electoral competitiveness_33 -.51 (-2.42)
-.54 (-2.25)
-.38 (-1.52)
-.36 (-1.59)
-.35 (-1.52)
Checks_residual_33 -.001 (-.02)
-.02 (-.22)
-.02 (-.25)
.013 (.14)
.03 (.33)
.32 (.30)
Note: Probit estimates of specifications corresponding to the same columns in Table 2. Marginal effects reported. Robust (White-adjusted) standard errors. Observations are “clustered”, such that independence is assumed across countries but not between observations from the same country (Argentina, Indonesia, Malaysia, Turkey, and Thailand). Constants and other correlates not reported.
34
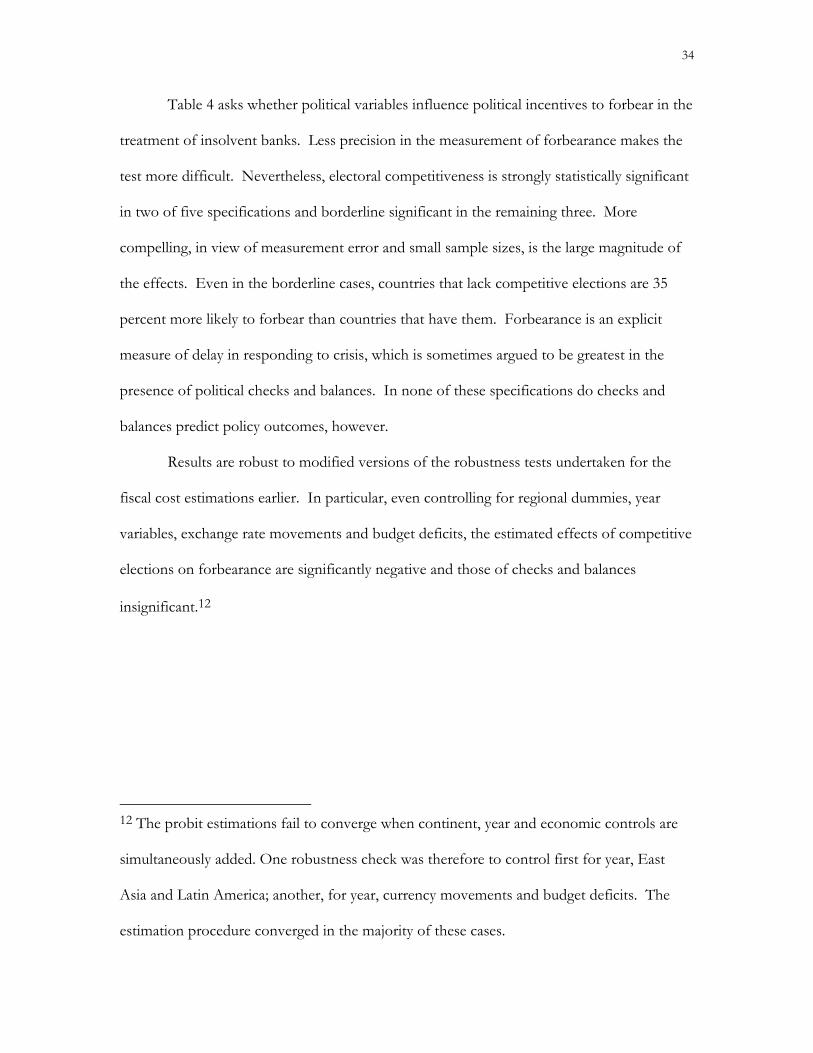
Table 4 asks whether political variables influence political incentives to forbear in the
treatment of insolvent banks. Less precision in the measurement of forbearance makes the
test more difficult. Nevertheless, electoral competitiveness is strongly statistically significant
in two of five specifications and borderline significant in the remaining three. More
compelling, in view of measurement error and small sample sizes, is the large magnitude of
the effects. Even in the borderline cases, countries that lack competitive elections are 35
percent more likely to forbear than countries that have them. Forbearance is an explicit
measure of delay in responding to crisis, which is sometimes argued to be greatest in the
presence of political checks and balances. In none of these specifications do checks and
balances predict policy outcomes, however.
Results are robust to modified versions of the robustness tests undertaken for the
fiscal cost estimations earlier. In particular, even controlling for regional dummies, year
variables, exchange rate movements and budget deficits, the estimated effects of competitive
elections on forbearance are significantly negative and those of checks and balances
insignificant.12
12 The probit estimations fail to converge when continent, year and economic controls are
simultaneously added. One robustness check was therefore to control first for year, East
Asia and Latin America; another, for year, currency movements and budget deficits. The
estimation procedure converged in the majority of these cases.
35
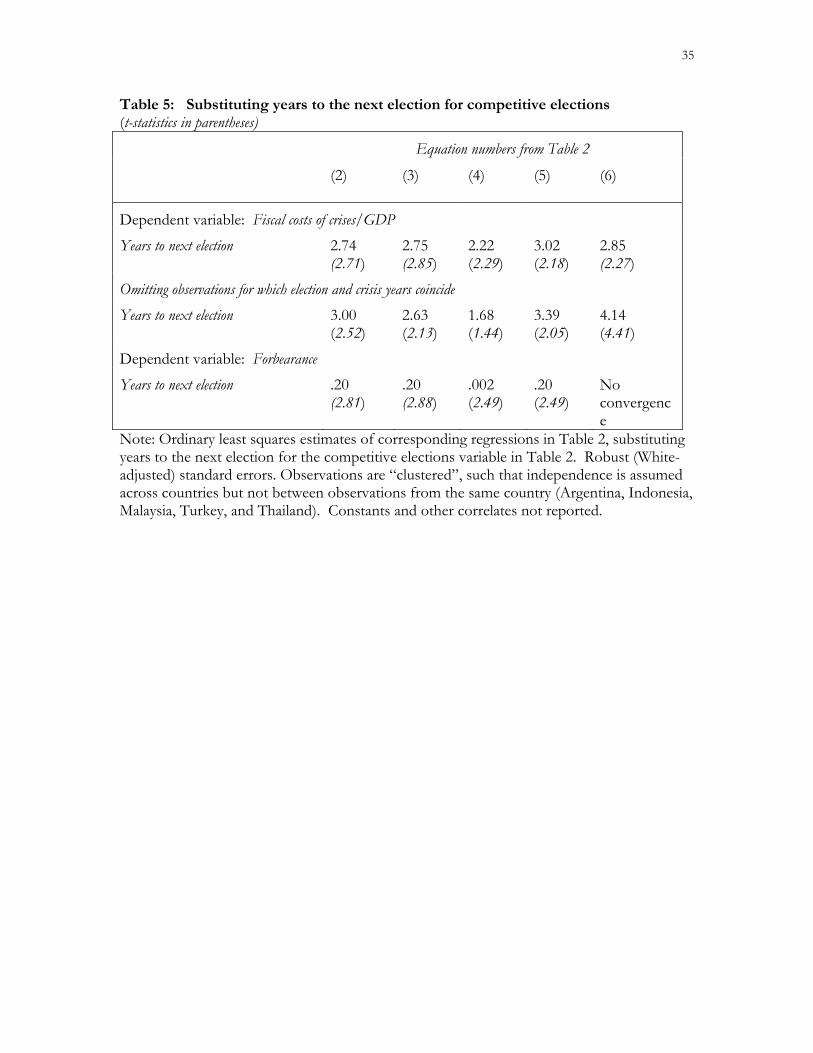
Table 5: Substituting years to the next election for competitive elections (t-statistics in parentheses)
Equation numbers from Table 2
(2)
(3)
(4) (5) (6)
Dependent variable: Fiscal costs of crises/GDP
Years to next election 2.74 (2.71)
2.75 (2.85)
2.22 (2.29)
3.02 (2.18)
2.85 (2.27)
Omitting observations for which election and crisis years coincide Years to next election 3.00
(2.52) 2.63 (2.13)
1.68 (1.44)
3.39 (2.05)
4.14 (4.41)
Dependent variable: Forbearance Years to next election .20
(2.81) .20 (2.88)
.002 (2.49)
.20 (2.49)
No convergence
Note: Ordinary least squares estimates of corresponding regressions in Table 2, substituting years to the next election for the competitive elections variable in Table 2. Robust (White-adjusted) standard errors. Observations are “clustered”, such that independence is assumed across countries but not between observations from the same country (Argentina, Indonesia, Malaysia, Turkey, and Thailand). Constants and other correlates not reported.
36
Table 5 presents estimates in which the number of years between the crisis year and
the next election is taken as the measure of the costs of removing incumbents, m. The
longer this period, the more likely it is that incumbents manipulate election dates to avoid
electoral accountability. In addition, the earlier analysis demonstrates that in order to hold
politicians accountable for bad performance, voters must coordinate on a performance
threshold. Coordination is more costly when a long time period separates incidents of bad
performance from elections. The results are substantively and statistically significant: the
closer are elections, the lower are the fiscal costs of crisis and the less likely are governments
to forbear. Every additional year adds approximately 2.5 percentage points of GDP to the
size of the fiscal transfers made to special interests.
Endogeneity is a naturally a concern with this variable. However, the most likely
source of endogeneity is that crisis itself may precipitate elections, which in turn is most
likely to be true for countries that hold elections in the same year as crisis. Estimates in the
second row of Table 5 omit the eighteen countries for which elections and crisis coincided.
Results remain largely significant and the estimated magnitude of the election effect is
essentially unchanged.13
Supporting evidence: Does democratic accountability explain differences in welfare outcomes induced by financial crisis?
If financial sector policies, q , are worse for citizens when competitive elections are
absent, observable welfare, π, should also be lower. One proxy for welfare changes is
growth. In fact, countries that make the largest transfers to insolvent banks (q) experience
the largest growth collapses (π), with each percentage point increase in transfers associated
13 This cannot be replicated for the forbearance regressions, since the maximum likelihood
estimations do not converge when the 18 observations are omitted.

37
with a .23 percentage point decline in growth (where a growth collapse is the fall in
economic growth rates in the three years subsequent to the crisis year compared to the three
years prior). Using the same specifications as in Tables 3 and 4, Table 6 demonstrates that
growth collapses associated with financial crisis are indeed much larger in countries lacking
competitive elections. As before, political checks and balances have no effect.
Hicken, et al. (2005) have related findings, showing that growth recoveries from
currency crises are accelerated when the winning coalition (a qualitative measure of electoral
competitiveness from Bueno de Mesquita, et al. 2003) is larger, but are unaffected by
political checks and balances. Rodrik (1999) presents an alternative explanation for growth
collapses, arguing that they are lower in countries with better institutions for managing
conflict, measured with aggregate indicators. It is not clear how this hypothesis applies to
the disaggregated institutional measures used here, a point made in Hicken, et al. (2005). In
addition, one set of institutions for conflict management are political checks and balances,
but these are insignificant here. Finally, the particular financial sector policies that contribute
to growth collapses (forbearance and fiscal transfers) are not obviously related to conflicts
between broad social groups. Consistent with this, controls for ethnic, linguistic and
religious fragmentation, important in crisis explanations rooted in social conflict, are entirely
insignificant in all of the relationships analyzed here; their inclusion has no discernible effect
on the magnitudes of the elections and checks coefficients.

38
Table 6: Democracy and growth collapses following financial crisis
(z-statistics in parentheses)
Equation numbers from Table 2 Dependent variable: Did governments forbear? (1=yes, 0=no) (1) (2) (3) (4) (5) (6)
Electoral competitiveness_33 3.02 (2.04)
2.66 (1.81)
3.51 (2.40)
3.37 (3.06)
3.37 (3.06)
Checks_residual_33 -.58 (-.88)
-.65 (-.91)
-.97 (-1.32)
-.24 (-.56)
-.48 (-.71)
-.48 (-.71)
Note: OLS estimates of corresponding regressions in Table 2. See also notes for Table 2.

39
Supporting evidence: Do fiscal transfers precipitate the expulsion of incumbents?
On those occasions when negative shocks are sufficiently large, ( )δδ < , the
performance threshold set by voters will be too high and politicians will choose not to meet
it. Instead, they will maximize rents (make large fiscal transfers) and be expelled from office.
Though apparently intuitive, upon reflection it is not obvious that large fiscal transfers
should precipitate expulsion. If transfers are not necessary to serve the public interest, why
would governments make them at the cost of being expelled from office? If the transfers
are necessary, why then would voters subsequently expel politicians from office? The
earlier analysis answers these questions by arguing that, following large shocks that are
unobservable to voters, politicians realize that they cannot meet the voter performance
threshold at any reasonable cost and pursue maximum rents, foregoing re-election. If this
logic is correct, unobserved shocks should drive both high fiscal transfers and post-crisis
political instability, creating an association between them.
Probit estimates of regressions of the form iinstability εα ++= ΑΖ0ii are reported
in Table 7, relating ex post political instability to fiscal transfers. The specifications in Table 7
take into account observable determinants of the performance threshold set by citizens,
which also affect transfers. These include competitive elections, since the heart of the earlier
analysis is that the performance threshold for expulsion rises the higher are the costs of
expulsion. Table 7 estimates control as well for the same observable shocks as in Tables 3
and 4, presumed to be observable by both citizens and politicians and therefore affecting the
fiscal costs of crisis but not influencing instability. They also take into account pre-crisis
political instability, which has an additional effect here of controlling for unobserved, time-
invariant features of countries that might make them prone to instability.

40
Table 7: Political instability and the fiscal costs of banking crises (marginal effects reported, z-statistics in parentheses)
Dependent variable: political instability_avg_lead3
(1)
(2)
(3)
Fiscal transfers/GDP .016 (2.65)
.019 (2.15)
.014 (2.55)
checks _residual_ lead3 .019 (.21)
-.19 (-1.36)
-.09 (-1.26)
Electoral compet_avg_lead3 .73 (3.57)
.71 (2.42)
.37 (2.46)
Political instability_avg_lag3 .54 (1.50)
1.53 (1.51)
1.22 (1.71)
Current account balance (CAB, t-1) .03 (.62)
-.002 (-.10)
Terms of trade (percent change between t-1 and crisis year t)
1.62 (.87)
1.71 (1.42)
Income_avg_lead3 .00001 (.23)
.00004 (2.43)
Growth collapse (growth_avg_lead3 – growth_avg_lag3)
Total reserves/total debt (t-1) .004 (1.08)
Pseudo R2 .26 .39 .43
N 38 27 38
Note: Probit regressions, robust (White-adjusted) standard errors. Observations are “clustered”, such that independence is assumed across countries but not between observations from the same country (Argentina, Indonesia, Malaysia, Turkey, and Thailand). The checks and electoral competition variables are the average of their values in the three years following the crisis (t+1, t+2, t+3).
41
All of the regressions in Table 7 demonstrate a large, positive association between
fiscal transfers on instability, with a one percentage point increase in fiscal costs increasing
the probability of government turnover by between 1.4 and 1.9 percentage points. These
results are also significant when one assesses political stability over two-year or four-year
windows. In addition, the results demonstrate a significant positive association between
elections and the expulsion of incumbents following crisis. This is consistent with the
arguments here, but contrasts with the ambiguous association between instability, democracy
and debt crises that other researchers have found.14
Supporting evidence: selection effects and the probability of crisis The results in Tables 3 and 4 could be driven by the possibility that pre-crisis
financial policies are different in democracies and autocracies, affecting the probability that
they experience crises or the nature of those crises and, as a consequence, their policy
response once crisis occurs. However, the earlier discussion emphasizes that pre-crisis
policies should not differ markedly between elected and non-elected governments. Both
have similarly low incentives to regulate prudentially because of the low probability that poor
regulation will precipitate crisis in any given year.
14 It is possible that the Table 7 results emerge from politician mistakes: politicians who
overestimate the voter’s performance threshold and make large transfers are then thrown
out of office. Other politicians underestimate it, make small transfers, and remain in office.
Even here, though, politician tendency to error may be related to elections: in countries
with a longer history of competitive elections, politicians may be more practiced at
estimating voter thresholds and make fewer mistakes.

42
Nevertheless, a majority of crisis countries are democracies and the odds that a
democracy experienced a crisis from 1975 – 2000 were twice as high as those for a non-
democracy.15 This association turns out to be driven entirely by income, however. Poor
countries are disproportionately non-democracies during the time period and generally do
not have developed financial systems that can experience crises in the first place. Once
income per capita is taken into account, and consistent with the argument that regime
differences should be strongest in the response to crisis and not in the policies leading up to
crisis, there is no significant relationship between democracy and the occurrence of crisis.
There is similarly no significant regime difference in the probability of crisis in logistic
estimations of the determinants of crisis that use the five specifications 2-6 in Table 3,
modifying the political variables so that they reflect only the three years prior to crisis.
Alternative explanations for the effect of regime type on fiscal transfers Other explanations for the permeability of governments to special interests range
from variations across countries in the composition of interest groups, to the political and
electoral institutions of democracies, to the dynamics of political competition. The results
reported above are robust to controls for each of these. In addition, results are robust to
using instrumental variables to control for unobserved effects that might determine both
whether countries have competitive elections and whether they are predisposed to make
bailouts to insolvent banks.
The structure of economic interests The distribution of economic interests could explain the results above if interests
opposed to bailouts were simply more influential in the sample democracies. Data
15 In a sample with 3,900 country-year observations.

43
limitations are severe in identifying such interests, but two key sectors relevant to financial
sector policy can be roughly quantified: manufacturers, who benefit from abundant credit
flows under lax prudential regulation and suffer from credit downturns during crisis; and
financial interests themselves. The results in Table 3 might emerge simply because these
sectors might happen to be under-represented in democracies. Adding manufacturing value-
added and lending to the private sector by deposit-taking institutions, both as a fraction of
national income, to the specifications in Table 3 has no effect on results, however. As
Table 8 reports, competitive elections continue to be strongly negatively associated with
fiscal transfers. The size of the financial sector is significantly larger in democratic crisis
countries but is not associated with the fiscal costs of financial crisis. Manufacturing,
however, though almost identical across democracies and non-democracies in the sample, is
significantly associated with high fiscal costs.
Other social cleavages The political costs of financial crisis could vary depending on whether a country is
large or small in population, whether it is primarily urban or rural, by whether its population
is disproportionately young or old, or whether the country is ethnically or linguistically
fragmented. These same variables might drive political instability, elections and checks and
balances. None is a significant predictor of fiscal transfers, nor do they change the pattern
of results observed in Table 3 (not reported). The elections variable is similarly robust to
these controls in explaining forbearance and growth collapses in the specifications of Tables
4 and 6.

44
Table 8: Manufacturing and the financial costs of banking crises (t-statistics in parentheses)
Equation numbers from Table 2 Dependent variable: Fiscal costs of crises/GDP (2)
(3)
(4) (5) (6)
Electoral competitiveness_33 -14.08 (-3.15)
-13.12 (-2.72)
-12.68 (-2.22)
-12.52 (-2.67)
-11.82 (-2.02)
Manufacturing/GDP 1.57 (4.47)
1.69 (3.91)
1.54 (1.11)
1.91 (3.58)
1.75 (1.07)
Lending to the private sector/GDP -2.21 (-.34)
-3.47 (-.51)
-6.13 (-.40)
-6.78 (-.96)
-4.67 (-.23)
R2 .56 .60 .61 .63 .62
N 31 31 24 31 24 Note: Ordinary least squares estimates of corresponding regressions in Table 3, with the addition of Manufacturing/GDP and private sector lending/GDP. Robust (White-adjusted) standard errors. Observations are “clustered”, such that independence is assumed across countries but not between observations from the same country (Argentina, Indonesia, Malaysia, Turkey, and Thailand). Constants and other correlates not reported. Manufacturing variable from World Development Indicators.

45
Political market imperfections Not only policies, but also democracies, vary in the extent to which they are plagued
by political market imperfections. The results found here could be simply explained if the
small sample of democracies here simply exhibited fewer information asymmetries and more
political credibility than the average democracy. One can test directly for this using controls
for citizen information and credibility. These have no effect on the election coefficient,
however, providing no support for this alternative hypothesis.
Researchers have used newspaper circulation to argue that citizen information is
associated with lower corruption (Adserà, Boix and Payne, 2003). One might also argue that
fiscal transfers would be most transparent to voters where newspaper circulation is greater.
In fact, in the sample of crisis countries here, the democratic countries exhibit much higher
newspaper circulation (226 per 1000 population versus 88 for non-democracies). However,
its addition it has no effect on the results in Table 3. Newspaper circulation is also
insignificant, whether or not the sample excludes non-democratic countries and whether or
not the elections variable is excluded.
Keefer and Vlaicu (2005) argue that whether or not politicians can make credible
promises should result in a specific pattern of policies. Keefer (2005) finds that young
democracies exhibit precisely this pattern, suggesting that the age of democracy might be a
useful proxy for the credibility of political promises. If one looks only at the democracies in
the crisis sample, the coefficient on the consecutive years of competitive elections shows a
significant and large negative effect on fiscal transfers (consistent as well with the earlier
observation that politicians may make fewer mistakes when exposed to elections over a
longer period of time). In the whole sample, however, where a value of zero is assigned to

46
this variable for non-democracies, even controlling for the years of elections, competitive
elections continue to exert a significant negative effect on fiscal transfers.
Electoral institutions and special interests Finally, the democracies in the sample here may simply be non-representative of
democracies generally with respect to institutions that affect incentives to cater to special
interests. Rosenbluth and Schaap (2003) argue that politicians in electoral systems with
plurality voting and single member districts are more likely to impose the costs of banking
regulation on banks rather than on citizens at large than politicians in proportional systems
with many seats per district and low vote thresholds. To see if a similar logic is at work here,
a dummy variable, majoritarian, is constructed from the Database of Political Institutions to equal
one if electoral systems are predominantly plurality-based with district magnitudes less than
three, and is otherwise zero.
It turns out that most of the democratic systems (17 of 23) in the crisis sample in
Table 2 are non-majoritarian and predicted to exhibit greater transfers to special interests. In
fact, consistent with predictions by Rosenbluth and Schaap, the non-majoritarian
democracies exhibit significantly larger fiscal costs in the event of banking crises: 11 percent
of GDP compared to four percent for majoritarian democracies. Since most of the
democracies are non-majoritarian and relatively favorable to special interests, the sample is
biased against finding that democracies are less friendly to special interests. Unsurprisingly,
therefore, controlling for majoritarian in the regressions in Table 3 has little effect on the
elections results. The majoritarian effect is also large and significant, providing systematic
evidence over a large number of countries in support of the predictions of Rosenbluth and
Schaap (not reported).
47
Endogeneity The fact that the results above are robust to controls for numerous political,
economic, social and demographic characteristics that are likely to be related to unobserved
effects argues strongly against the proposition that they are driven by the spurious influence
of omitted variables. Direct tests also reject endogeneity as the source of the results in
Tables 3 and 4, as seen in Table 9, which reports the results of two-stage least squares
estimates of the Table 3 regressions.
The specifications in Table 9 use four instruments frequently employed to control
for the potential endogeneity of institutions. Three dichotomous variables indicating
English, German or Scandinavian legal origin directly speak to the institutional origins of a
country and should not influence political decision making during banking crises. The
length of a country’s coastline captures the extent to which maritime access changes elite
incentives to allow democracy, for example by lowering the cost of trade and thereby
increasing the payoffs to investment by citizens, which citizens will only undertake if their
economic rights are secured through democracy, as in Acemoglu, et al. (2002).

48
Table 9: Two-stage least squares estimates of Table 2 regressions (z-statistics in parentheses)
Equation numbers from Table 2 Dependent variable: fiscal transfers/GDP (2) (3)
(4) (5) (6)
Electoral competitiveness_33 -15.00 (-2.56)
-18.51 (-3.36)
-18.12 (-2.834)
-13.698 (-2.17)
-17.39 (-2.33)
Significance of instruments in first stage (p-statistic from F-test of H0: they are jointly insignificant)
.001 .001 .01 .01 .002
Hansen J-statistic (p-value, H0: instruments can be excluded from second stage)
.59 .33 .38 .16 .82
Cragg-Donald test of underidentication (p-value, H0: equation is under-identified)
.03 .01 .09 .13 .004
N 37 37 26 37 26 Note: Two stage least squares estimates of the corresponding regressions in Table 3. Robust (White-adjusted) standard errors. Observations are “clustered”, such that independence is assumed across countries but not between observations from the same country (Argentina, Indonesia, Malaysia, Turkey, and Thailand). Constant and other correlates not reported.

49
The instruments are significant in the first stage equation explaining competitive
elections (other frequently used instruments for institutions, such as settler mortality and
latitude, are insignificant). They satisfy the Cragg-Donald test of under-identification and
they robustly satisfy the (admittedly weak) test of the exclusion restriction. In all cases, the
elections results are at least as significant and of the same magnitude as in Table 3 and the
checks residual is everywhere insignificant.16 In a similar exercise for the Table 4 results on
forbearance, forbearance remains large and statistically significant in three of five
specifications (not reported). These regressions provide no support for the argument that
the results here are driven by omitted variables.
Conclusion This paper contributes a robust new empirical result to the literature on regime
effects on policy and crisis: although no less likely to experience crisis in the first place,
competitively elected governments handle financial crises much differently, imposing
significantly fewer costs on citizens, but political checks and balances have no effect. The
findings advance the analysis of regime effects in several ways.
First, they explicitly demonstrate that regime effects differ depending on the
characteristics of the policies under consideration and the extent to which they are exposed
to political market imperfections such as lack of information or credibility. Financial crises
provide voters with information and coordination opportunities that are sufficient to at least
partially offset the information and credibility problems connected with financial sector
regulation. Second, and again consistent with the information requirements of
16 Instruments are not available to identify the checks variable separately. Results are
unchanged when the checks variable is omitted.

50
accountability, democracies are not less likely than non-democracies to experience crisis.
The expected lag between prudential regulation and crisis is sufficiently long that electoral
incentives make it difficult to impose ex post (post-crisis) electoral accountability on elected
leaders .
Third, unlike much of the earlier work in the democracy and crisis literatures, the
empirical results here disaggregate and use objective indicators of democratic political
institutions. This reveals a marked difference in the effects of political institutions that
earlier indicators had masked: electoral competitiveness constrains political decision makers’
tendencies to cater to special interests in the context of financial market regulation; political
checks and balances do not. Fourth, the analysis shifts the focus of comparison of regime
types away from whether they affect the interaction of broad social interests and towards the
idea that regime types affect the influence of narrow special interests on policy making.
These results suggest that future research revisit the issue of democratic performance
in areas such as growth, spending and education. Based on the findings here, the lack of
sharp differences with non-democracies might be traceable either to political market
imperfections in the democracies or to the characteristics of the policies and policy
outcomes themselves.

51
Annex 1: Proving the existence of a unique shock threshold δ
Recalling that the shock is random with density function f (δ ) distributed over [-d, d],
the expected costs to citizens of adopting a particular threshold shock δ , given π , are
(A.1) ( ) ( ) ( ) ( )∫∫ −+−−
d
d
dfqdfδ
δ
δδδπδδδπ 1 .
Citizens will not bother to replace incumbents if the costs of doing so, m, are greater than
the rents they can save by threatening to replace them. That is, they replace incumbents
only if ( )[ ] m≥−ππ 1 . Citizens therefore minimize their expected costs, expression (2),
subject to ( )[ ] m≥−ππ 1 . Assuming that the solution is interior and the constraint is not
binding, minimization yields the first order condition
( ) ( ) ( ) ( ) ( ) ( ) 01 =−′−−−− ∫d
dfqfqfδ
δδδπγδδπγδδγπ , or simplifying,
( ) ( ) ( )[ ] ( ) ( )( ) 011 =−−′−−−− δδπγδπδπδγ Fqqf , giving
(A.2) ( )( ) ( )
( )( )δ
δδπδπ
δπF
f
q
q
−=
−−−−′
11 .
The left hand side of (A.2) falls in δ for 0>′′π -- when the costs to voters rise at a rate
increasing in q. Therefore, as long as the right hand side is increasing in δ (as when, for
example, the distribution is uniform), a unique δ solves condition (A.2).17
17 Equation (A.2) has a natural interpretation: the right hand side of (4) is like a hazard rate,
the probability that the effects of policy are more negative relative to the range of possible
policy effects that are more benign than δ . The numerator of the left hand side reflects the
effect of a change in δ on the costs born by voters when incumbents seek re-election; the
52
Annex 2: The effect on rents of veto player numbers n and costs of voting m if rent shares are endogenous
Once veto players and special interests can bargain over α, they adjust rental shares
to take into account the number of veto players n and the costs of expelling incumbents m.
The extent of this adjustment depends on the respective bargaining power of veto players
and special interests, however. Two polar cases are examined here: veto players have all the
bargaining power, or special interests have all the bargaining power, such that one or the
other can make take-it-or-leave-it offers. In both cases, rental shares are, indeed, adjusted,
but in all relevant circumstances the adjustment is not enough to change the predictions that
an increase in n and a reduction in m reduces rents.
Veto players enjoy all the bargaining power If veto players have all of the bargaining power – if they can make a take-it-or-leave-
it offer to special interests – then veto players set α such that special interest rents, ( )πα−1 ,
are just equal to the opportunity costs of the special interests of pursuing the rents and
condition (2) is satisfied. That is, if the opportunity cost of special interests is W, then the
performance threshold for rents must satisfy (2) in the text and, in addition, ( ) W≥− πα1 .
Of course, veto players will set α such that this expression is satisfied exactly, ( ) W=− πα1 .
As we expect, the greater is the opportunity cost of special interests and the lower are
equilibrium rents, the more generous are veto players towards them (the lower is α).
denominator reflects the change in costs imposed on citizens when an increased δ leads
incumbents to prefer not to seek re-election.

53
Do reductions in m still reduce rents?
Given that veto players can adjust α, we first ask whether a reduction in the costs m
of expelling veto players reduces rents. Recall that reductions in m are only relevant when
the constraint ( ) m=−ππ 1 is binding. It follows immediately, however, that as long as the
constraint binds, total rents are independent of rent shares. Bargaining over rent shares in
this case does not influence at all the prediction that higher costs of expulsion m increase
total rents.
Do increases in n still reduce rents? We can also ask how the number of veto players influences total rents. In
equilibrium, substituting π
α W−=1 into condition (2), we can rewrite the condition as
( ) ( )11
11
1 ππ
ππ
−=+
−
n
WRq
n
W . Multiplying through by n and differentiating with
respect to n, yields ( ) 1
2
11
−
−−=
∂∂
πππ W
Rn
. Rents fall as the number of veto players rises
as long as ( ) 21 ππ <W , falling faster as ( )2
1
ππ W approaches one.
Under what conditions is ( ) 21 ππ <W ? Note that in equilibrium, ( ) Rn
αππ −= 1
and π
α W−=1 . Substituting and re-arranging, we can solve explicitly for π as the solution
to the quadratic equation, ( )( ) ( ) 0112 =++−−+ nRWW ππππ . As usual, there are two
possible solutions, given by

54
( ) ( )( ) ( )( )2
1411 2 nRWWW +−+±+=
ππππ . For real solutions, W and ( )1π must be
large enough relative to n and R so that ( )( ) ( )( )nRWW +−+ 141 2 ππ is positive, yielding
two positive solutions to π , 1π > 2π , where
( ) ( )( )4
1
2
1 22
11ππππ +>⇒
+> WW and ( ) ( )( )4
1
2
1 2222
ππππ +<⇒+< WW .
However, since for real solutions ( )( ) ( )( )nRWW +>+ 141 2 ππ , it must be the case
that ( )( ) ( )14
1 2
ππW
W >+ , with the difference between the two increasing the larger are
nR, W and ( )1π . For the first solution 1π , therefore, it is always the case that ( )121 ππ W> ,
such that rents always fall as the number of veto players rises, as predicted. For the second
solution it may be that ( )122 ππ W> ; even here, though, for nR, W and ( )1π sufficiently
large, an increase in the number of veto players reduces rents.
In most cases, therefore, even when veto players can increase their total share of
rents to take into account their diminishing individual shares as their number rises, they still
prefer to reduce total rents. This is intuitive. In most cases, veto players cannot increase
their share enough to offset the fall in pecuniary rents relative to non-pecuniary rents
without depriving special interests of an incentive to participate; this limitation is greater
when non-pecuniary rents are larger and the relative importance of pecuniary to non-
pecuniary rents is lower.
Special interests have all of the bargaining power If special interests have all of the bargaining power and can make take-it-or-leave-it
offers, they set α to maximize their rents subject to condition (2) being met (assuming for

55
simplicity that the opportunity cost W = 0). Condition (2) is met when ( ) Rn
αππ −= 1 .
Special interests therefore set α to maximize their share of the rents, ( ) ( )
−− R
n
απα 11 ,
yielding ( )1πα nR= : as the number of veto players and the non-pecuniary gains to holding
office increase, special interests offer a larger share of rents to the veto players.
Do reductions in m still reduce rents?
Given that special interests can adjust α, we first ask whether a reduction in the costs
m of expelling veto players reduces rents. It is clear that total rents are not influenced by
bargaining over α, however, since reductions in m are only relevant when the constraint
( ) m=−ππ 1 is binding. The performance threshold when m is binding is independent of
the rent share α.
Do increases in n still reduce rents? Bargaining plays a bigger role in the effect of the number of veto players on total
rents. However, even after special interests adjust α to the number of veto players, rents still
drop as n increases. To see this, substitute ( )1πα nR= into condition (2), multiply by n, and
differentiate with respect to n, yielding ( ).0
1
2
1 <−−=∂∂
nn
πππ
The intuition is again straightforward. Special interests use increases in α to
persuade veto players to approve more than offsetting increases in total rents. Their ability
to do this is limited, however, since the larger the rents that veto players approve, the greater
the probability that they will be expelled from office and lose non-pecuniary rents. To offset

56
the loss of non-pecuniary rents, special interests would have to reduce their own pecuniary
rents by even more, with the amount increasing the larger is n.

57
References Acemoglu, Daron and James A. Robinson (2001). “Inefficient Redistribution.” American
Political Science Review 95:3, 649-61 (September).
____ and Simon Johnson (2002). “Reversal of Fortune: Geography and Institutions in the
Making of the Modern World.” Quarterly Journal of Economics. 117: 1231 – 1294
(November).
Akerlof, George and Paul Romer (1994). “Looting: the economic underworld of
bankrupcty for profit.” Brookings Papers on Economic Activity 2:1-73.
Alesina, Alberto and Allan Drazen (1991). “Why are Stabilizations Delayed?” American
Economic Review. 82 (December): 1170-88.
Adserà, Alícia, Carlos Boix and Mark Payne (2003). “Ae you being served? Political
accountability and governmental performance.” Journal of Law, Economics and
Organization.
Beck, Thorsten, George Clarke, Alberto Groff, Philip Keefer, and Patrick Walsh (2000).
“New Tools and New Tests in Comparative Political Economy: The Database of
Political Institutions.” World Bank Policy Research Working Paper, no. 2283
(February).
Beck, Thorsten, Asli Demirgüç -Kunt and Ross Levine (forthcoming). “A new database on
financial development and structure.” World Bank Economic Review.
Besley, Timothy and Stephen Coate (1999). “Lobbying and Welfare in a Representative
Democracy.” Working paper (December 9).
Bueno de Mesquita, Bruce, et al. (2003). The Logic of Political Survival. Cambridge: MIT
Press.
Calomiris, Charles and Eugene White (1994). “The Origins of Federal Deposit Insurance.”

58
In Claudia Golden and Gary Libecap, eds., The Regulated Economy. Chicago:
University of Chicago Press.
Caprio, Gerard and Daniela Klingebiel (1997). “Bank Insolvency: Bad Luck, Bad Policy, or
Bad Banking.” In Michael Bruno and Boris Pleskovic (eds.), Annual World Bank
Conference on Development Economics. Washington: The World Bank.
Demirgüç-Kunt, Asli and Enrica Detragiache (2000). “Does deposit insurance increase
banking system stability? An empirical investigation.” The World Bank, Policy
Research Working Paper No. 2247.
Dewatripont, Mathias and Jean Tirole (1994). The Prudential Regulation of Banks. Cambridge:
MIT Press.
Feijen, Erik and Enrico Perotti (2005). “The Political Economy of Financial Sector
Fragility.” Mimeo. University of Amsterdam.
Ferejohn, John (1986). “Incumbent performance and electoral control.” Public Choice 50: 5-
26.
Frederiksson, Per G. and Jakob Svensson (2003). “Political instability, corruption and policy
formation: the case of environmental policy.” Journal of Public Economics 87, 1383-
1405.
Frieden, Jeffry (1991). Debt, Development and Democracy. Princeton, New Jersey: Princeton
University Press.
Grindle, Merilee S. (2000). Audacious Reforms: Institutional Invention and Democracy in Latin
America. Baltimore: Johns Hopkins University Press.
Grossman, Gene and Elhanan Helpman (1996). “Electoral competition and special interest
politics.” Review of Economic Studies 63:265-86.
Haggard, Stephan (2000). The Political Economy of the Asian Financial Crisis. Washington, DC:

59
The Institute for International Economics.
Hicken, Allen, Shanker Satyanath and Ernest Sergenti (2005). “Political Institutions and
Economic Performance: The Effects of Accountability and Obstacles to Policy
Change.” American Journal of Political Science 49:4, 897-907 (October).
Honohan, Patrick and Daniela Klingebiel (2003). “The Fiscal Cost Implications of an
Accomodating Approach to Banking Crises.” Journal of Banking and Finance 27:8,
1539-60 (August).
Hutchcroft, Paul D. (1998). Booty capitalism: the politics of banking in the Philippines. Ithaca, NY:
Cornell University Press, 1998.
Keefer, Philip (2005). “Democratization and Clientelism: Why are young democracies
badly governed?” World Bank Policy Research Working Paper #3594.
_____ and Stuti Khemani (2005). “Democracy, public expenditures, and the poor:
understanding political incentives for providing public services.” World Bank Research
Observer 20:1, 1-27 (Spring).
_____ and Razvan Vlaicu (2005). “Democracy, Credibility and Clientelism.” World Bank
Policy Research Working Paper #3472.
Lindgren, C., G. Garcia and M. Saal (1996). Bank Soundness and Macroeconomic Policy.
Washington, DC: International Monetary Fund.
Lizzeri, Alessandro and Nicola Persico (2001). “The Provision of Public Goods under
Alternative Electoral Incentives.” The American Economic Review 91:1, 225 – 239
(March).
MacIntyre, Andrew J. (2002). The Power of Institutions: Political Architecture and Governance.
Ithaca: Cornell University Press.
Montinola, Gabriela (2003). “Who Recovers First? Banking Crises Resolution in

60
Developing Countries.” Comparative Political Studies 36:5, 541-574.
Persson, Torsten and Guido Tabellini (2000). Political Economics: Explaining Public Policy.
Cambridge, MA: The MIT Press.
Powell, Jr. G. Bingham and Guy D. Whitten (1993). “A Cross-National Analysis of
Economic Voting: Taking Account of the Political Context.” American Journal of
Political Science 37:2, 391-414 (May).
Rasmusen, Eric and J. Mark Ramseyer (1994). “Cheap bribes and the corruption ban: A
coordination game among rational legislators.” Public Choice 78:3-4, 305-327.
Remmer, Karen L. (1991). “The Political Impact of Economic Crisis in Latin America in the
1980s.” American Political Science Review 85: 3, 777-800 (September).
Rodrik, Dani (1999). “Where did all the Growth Go? External Shocks, Social Conflict and
Growth Collapses.” Journal of Economic Growth (December) 4:4, 385-412.
Romer, Thomas and Barry Weingast (1991). “The Political Foundations of the Thrift
Debacle.” In Alberto Alesina and Geoffrey Carliner, eds., Politics and Economics in the
Eighties. Chicago: University of Chicago Press.
Rosenbluth, Frances and Ross Schaap (2003). “The Domestic Politics of Banking
Regulation.” International Organization 57, 307-336 (Spring).
Rosendorff, B. Peter (2004). “Democracy and the Supply of Transparency.” Mimeo,
University of Southern California.
Rosas, Guillermo (2002). Bagehot or Bailout? The Political Economy of Bank Crises, 1975-2000.
Ph.D. Thesis, Duke University.
Satyanath, Shanker (2005). Globalization, Politics, and Financial Turmoil: Asia’s Banking Crisis.
Cambridge: Cambridge University Press.
Tsebelis, George (1999). “Veto players and law production in parliamentary democracies:

61
an empirical analysis.” American Political Science Review 93:3 (September): 591-608.