ELECTION EDITION - Legend Financial
21
1 THE GLOBAL INVESTMENT PULSE, October, 2020 October, 2020 Election Cycle, continued on page 13 ELECTION EDITION Source: The Leuthold Group, LLC, Perception Express www.leutholdgroup.com As of: October 1, 2020 COPYRIGHT 2020 THE LEUTHOLD GROUP, LLC REPRINTED WITH PERMISSION FROM THE LEUTHOLD GROUP, LLC S&P 500’S (U.S. LARGE STOCK’S) ANNUAL & PRESIDENTIAL CYCLES COMBINED: ANNUALIZED TOTAL RETURNS, 1926 TO DATE Nov-Apr Post-Election Year Mid-Term Year Pre-Election Year Election Year 8.4% 12.9% 24.7% 1.1% 9.4% 11.0% 8.7% 5.8% May-Oct Nov-Apr May-Oct Nov-Apr May-Oct Nov-Apr May-Oct We are here THE PRESIDENTIAL ELECTION CYCLE By Louis P. Stanasolovich, CFP ® , CEO and President of Legend Financial Advisors, Inc. ® and EmergingWealth Investment Management, Inc. ® It is really important to understand the S&P 500 and its performance. In this chart, as the reader can see, these are the S&P 500’s results during the Presidential terms, which essentially runs from November 1st to April 30th (First Half), then May 1st to October 31st (Second Half). In most of these cases, the second half of that first year is lower than that second half of the fourth year.
Transcript of ELECTION EDITION - Legend Financial

1THE GLOBAL INVESTMENT PULSE, October, 2020
October, 2020
Election Cycle, continued on page 13
ELECTION EDITION
Source: The Leuthold Group, LLC, Perception Expresswww.leutholdgroup.com
As of: October 1, 2020COPYRIGHT 2020 THE LEUTHOLD GROUP, LLCREPRINTED WITH PERMISSION FROM THE LEUTHOLD GROUP, LLC
S&P 500’S (U.S. LARGE STOCK’S) ANNUAL & PRESIDENTIAL CYCLES COMBINED: ANNUALIZED TOTAL RETURNS, 1926 TO DATE
Nov-Apr
Post-Election Year Mid-Term Year Pre-Election Year Election Year
8.4%
12.9%
24.7%
1.1%
9.4%11.0%
8.7%
5.8%
May-Oct Nov-Apr May-Oct Nov-Apr May-Oct Nov-Apr May-Oct
We are here
THE PRESIDENTIAL ELECTION CYCLEBy Louis P. Stanasolovich, CFP®, CEO and President of Legend Financial Advisors, Inc.® and
EmergingWealth Investment Management, Inc.®
It is really important to understand the S&P 500 and its performance. In this chart, as the reader can see, these are the S&P 500’s results during the Presidential terms, which essentially runs from November 1st to April 30th (First Half), then May 1st to October 31st (Second Half). In most of these cases, the second half of that first year is lower than that second half of the fourth year.

2 THE GLOBAL INVESTMENT PULSE, October, 2020
ABOUT EMERGINGWEALTH INVESTMENT MANAGEMENT, INC.®
LOUIS P. STANASOLOVICH, CFP®, EDITORLouis P. Stanasolovich, CFP®, is founder, CEO and President of Legend Financial Advisors, Inc.® (Legend) and EmergingWealth Investment Management, Inc. Mr. Stanasolovich is also the Chief Investment Officer at both Legend and EmergingWealth. Lou is the Editor of The Global Investment Pulse, a publication designed to guide investors on how to build bet-ter investment portfolios and improve their investment decision-making.
Mr. Stanasolovich earned the Certified Financial Planner™ designation in 1984 and was admitted to The Registry of Financial Planning Practitioners in 1986. He is a member of the Financial Planning Association (FPA), and is a Registered Financial Advisor with The National Association of Personal Financial Advisors (NAPFA), the nation’s largest Fee-Only professional organization.
ABOUT LEGEND FINANCIAL ADVISORS, INC.®
EmergingWealth Investment Man-agement, Inc.® (EmergingWealth), is the sister firm of Legend Financial Advisors, Inc.® (Legend) and is a Fee-Only Securities and Exchange Commission (SEC) registered in-vestment advisory firm. EmergingWealth provides
Legend Financial Advisors, Inc.® (Legend) is a Fee-Only, Fiduciary U.S. Securities and Exchange Commission registered invest-ment advisory firm with its headquarters located in Pittsburgh, Pennsylvania. Leg-end provides Personalized Wealth Manage-ment Services Including Financial Planning and Investment Management Strategies to
FOUR REASONS TO CHOOSE LEGEND1. Legend is a Fee-Only, Fiduciary advisory firm. Fee-Only means Legend
is compensated exclusively by client fees. Unlike Legend, fee-based ad-visors and brokerage firms have numerous conflicts of interest due to the fact that they receive commissions.
2. Unlike most advisory firms and all brokerage houses, Legend and its advisors are governed by the Fiduciary Standard of Law. Fiduciaries are required to work in their clients’ best interests at all times.
3. Legend designs dynamic, creative and personalized financial planning and investment solutions for its clients.
4. Legend emphasizes low-cost investments where possible and attempts to trade and allocate investments in an income tax-efficient manner.
Investment Management services to individuals as well as business entities, medical practices and non-profit organizations whose wealth is emerging. All investment portfolios are sub-advised by Legend. Both Legend and EmergingWealth share a common advisory team, Investment Committee and Fee Schedule.
affluent and wealthy individuals as well as business entities, medical prac-tices and non-profit organizations as well as retirement plans. Legend and its advisors are Fiduciaries.

3THE GLOBAL INVESTMENT PULSE, October, 2020
PULSEThis article should not be construed as investment advice. The content is provided for news and/or educational purposes only.
WHAT IS THE ELECTORAL COLLEGE?
The United States Electoral College Is A Name Used To Describe The Official 538 Presidential Electors Who Come Together Every Four Years During The Presidential Election To Give Their Official Votes For President And Vice President Of The United States.
Each State Is Allocated Electors Equal To Its Number Of Representatives In The U.S. House Of Representatives (Currently A Total Of 435) Plus Its Two Senators (A Total Of 100). The District Of Columbia Is Also Allocated Three Electors.
In Reality, When You Cast Your Vote For President Of The United States You Are Directing Other People (Electors) To Vote For The Candidate Who Receives The Most Votes In Their State.
WHY DOES THIS PROCESS EXIST?
The Framers Of The Constitution Established The Electoral College In The Constitution To Forge A Compromise Between Those Who Wanted The President To Be Elected By Members Of Congress And Those Who Wanted A President Elected By A Popular Vote.
Source: Legend Financial Advisors, Inc.®INTERESTING FACTS ABOUT THE ELECTORAL COLLEGE
1. There Are Two States That Don’t Have A Winner-take-all Policy. Maine And Nebraska
2. Nine Times Since 1900 At Least One Elector Voted For Someone Other Than The Candidate They Promised To Support
3. In 2016 Seven Electors Voted Contrary To Their State’s Popular Vote For President, The Most Since 1972. (Electors Generally Vote According To Their State’s Popular Vote.
4. A President Has Been Elected By Winning The Electoral College Vote But Not The Popular Vote Five Times, 1824, 1876, 1888, 2000 And 2016.
5. Two Presidential Elections Have Been Decided In The House Of Representatives (This Chamber Of Congress Elects The President If No Candidate Wins A Majority Of Electoral Votes.) In 1800 And 1824
Source: Legend Financial Advisors, Inc.®
Source: Legend Financial Advisors,Inc.®

4 THE GLOBAL INVESTMENT PULSE, October, 2020
Sour
ce: D
imen
sion
al F
und
Advi
sors
GRO
WTH
OF
A DO
LLAR
INVE
STED
IN T
HE S
&P 5
00: J
ANUA
RY 1
926-
DECE
MBE
R 20
19

5THE GLOBAL INVESTMENT PULSE, October, 2020
Sour
ce: H
aver
, Inv
esco
w
ww
.inve
sco.
com
INVE
STO
RS A
RE B
ETTE
R O
FF S
TAYI
NG F
ULLY
INVE
STED
•Th
e be
st-p
erfo
rmin
g po
rtfol
io o
ver t
he p
ast
120
year
s wa
s on
e th
at
stay
ed fu
lly in
vest
ed
thro
ugh
both
Dem
ocra
tic
and
Repu
blic
an
adm
inis
tratio
ns.
•“P
artis
an” p
ortfo
lios
–wh
ich w
ould
inve
st o
nly
when
a D
emoc
rat o
r a
Repu
blica
n wa
s in
offi
ce
–un
derp
er-fo
rmed
, by
milli
ons
of d
olla
rs, t
he
“bip
artis
an” p
ortfo
lio th
at
stay
ed in
vest
ed
rega
rdle
ss o
f who
was
in
powe
r.
•Th
e di
ffere
nce
is a
resu
lt, in
par
t, of
the
fact
th
at th
e U.
S. s
tock
m
arke
t ros
e co
nsis
tent
ly ov
er th
e pa
st 1
20 y
ears
, ev
en w
hile
end
urin
g tw
o wo
rld w
ars
and
two
maj
or fi
nanc
ial c
rises
(th
e G
reat
Dep
ress
ion
and
the
glob
al fi
nanc
ial
cris
is of
200
8-20
09)
•Th
e m
ore
time
inve
stor
s sp
ent p
artic
ipat
ing
in
mar
kets
, the
bet
ter t
hey
did
finan
cially
.
Gro
wth
of $
10,0
00 in
the
Dow
Jon
es In
dust
rial A
vera
ge s
ince
189
6Fu
lly In
vest
edO
nly
Inve
sted
whe
n Re
publ
ican
s in
Offi
ceO
nly
Inve
sted
whe
n De
moc
rats
in O
ffice
Parti
san
portf
olio
s w
ere
alm
ost e
qual
up
until
the
2008
fin
anci
al c
risis

6 THE GLOBAL INVESTMENT PULSE, October, 2020
2020 OFFICES UP FOR ELECTION
I. President (Four Year Term)
II. Senate (Six Year Term)A. 2020 Senatorial Class – 35 Seats Up For Election
1. Current Situation (100 Elected Senators)a. Republicans 53b. Democrats 45c. Independent 2
2. Up For Election (35 Senators)a. Republicans 23b. Democrats 12
OFFICES UP FOR ELECTION (Continued)
III. House Of Representatives (Two Year Terms)
A. 2020 – 435 Congressional DistrictsWill Hold Elections – 218 Seats Needed For Control
1. Localsa. All 50 Statesb. The District Of Columbiac. The Inhabited Territories (5)
2. Current Situationa. 197 Republicansb. 232 Democratsc. 1 Independentd. 5 Vacancies
Source: Legend Financial Advisors, Inc.®Source: Legend Financial Advisors,Inc.®
2020 Offices Up For Election, continued on page 7

7THE GLOBAL INVESTMENT PULSE, October, 2020
OFFICES UP FOR ELECTION (Continued)
IV. Other Election Facts
A. Election Day – Tuesday, November 3, 2020
B. Inauguration Day – Wednesday, January 20, 2021
Source: Legend Financial Advisors, Inc.®
OTHER FACTS
One Political Party Has Controlled The White House, The
Senate And The House In 22 Of The Last 64 Years,
1957 To 2020.
Democrats Controlled The White House (Obama), The Senate
(58 – 40 – 2) And The House (257 – 178) In 2010 - 2012.
Republicans (Trump) Controlled All Three Entities. The Senate
(53 – 45 – 2) And The House (241 – 194) In 2016 – 2018.
Source: Legend Financial Advisors, Inc.®
PULSEThis article should not be construed as investment advice. The content is provided for news and/or educational purposes only.
Source: Legend Financial Advisors,Inc.®
2020 Offices Up For Election, continued from page 6

8 THE GLOBAL INVESTMENT PULSE, October, 2020
Sour
ce: M
orni
ngst
ar D
irect
, SAV
ANT
Wea
lth M
anag
emen
t
S&P
500
HIST
ORI
CAL
ANNU
AL R
ETUR
NS
Aver
age
Retu
rn U
nder
Rep
ublic
an P
resi
dent
s10
.6%
Aver
age
Retu
rn U
nder
Dem
ocra
tic P
resi
dent
s15
.1%

9THE GLOBAL INVESTMENT PULSE, October, 2020
Source: S&P Dow Jones Indices via Ned Davis Research, 2015, www.ndr.comREPRINTED WITH PERMISSION FROM NED DAVIS RESEARCH, INC.
COPYRIGHT 2020 NED DAVIS RESEARCH, INC.
S&P 500 INDEX ANNUAL PERCENT CHANGE BY PRESIDENTPresident Year 1 Year 2 Year 3 Year 4 Year 5 Year 6 Year 7 Year 8Grant -12.8 2.7 -3.7 -18.1
Hayes -9.2 6.2 42.6 18.7Garfield 2.9 -2.8 -8.6 -18.7Cleveland 19.8 8.5 -6.6 -2.5Harrison 3.5 -13.5 17.6 1.8Cleveland -20.0 -2.5 0.5 -2.3McKinley* 12.6 18.9 6.5 14.1 15.7Roosevelt, T. 1.3 -18.4 25.6 15.6 3.1 -33.2 37.4Taft 14.1 -12.1 0.7 3.0Wilson -14.3 -8.6 29.0 3.4 -30.6 16.2 14.0 -24.5Harding* 7.4 20.9 -1.5 18.7Coolidge 21.9 5.7 30.9 37.9Hoover -11.9 -28.5 -47.1 -15.1Roosevelt, F. 46.6 -5.9 41.4 27.9 -38.6 25.2 -5.5 -15.3Roosevelt, F.** -17.9 12.4 19.4 13.8Truman 30.7 -11.9 0.0 -0.7 10.3 21.8 16.5 11.8Eisenhower -6.6 45.0 26.4 2.6 -14.3 38.1 8.5 -3.0
*Died or resigned while in office. If during first term, then S&P 500 returns applied to original president. If occurred during second term, then subsequent returns applied to new president’s first term.**FDR’s third term included in second term statistics as it is a non-first term.
Source: S&P Dow Jones Indices via Ned Davis Research, 2015, www.ndr.comREPRINTED WITH PERMISSION FROM NED DAVIS RESEARCH, INC.
COPYRIGHT 2020 NED DAVIS RESEARCH, INC.
S&P 500 INDEX ANNUAL PERCENT CHANGE BY PRESIDENT (cont’d)
President Year 1 Year 2 Year 3 Year 4 Year 5 Year 6 Year 7 Year 8Kennedy* 23.1 -11.8 18.9 13.0Johnson 9.1 -13.1 20.1 7.7Nixon -11.4 0.1 10.8 15.6 -17.4Ford -29.7 31.5 19.1Carter -11.5 1.1 12.3 25.8Reagan -9.7 14.8 17.3 1.4 26.3 14.6 2.0 12.4Bush I 27.3 -6.6 26.3 4.5Clinton 7.1 -1.5 34.1 20.3 31.0 26.7 19.5 -10.1Bush II -13.0 -23.4 26.4 9.0 3.0 13.6 3.5 -38.5Obama 23.5 12.8 0.0 13.4 29.6 11.4 N/A N/ATrump +21.82 -4.39 +31.48
*Died or resigned while in office. If during first term, then S&P 500 returns applied to original president. If occurred during second term, then subsequent returns applied to new president’s first term.**FDR’s third term included in second term statistics as it is a non-first term.

10 THE GLOBAL INVESTMENT PULSE, October, 2020
Sour
ce: F
RED,
Glo
bal F
inan
cial
w
ww
.inve
sco.
com
WE
DO N
OT
RADI
CALL
Y RE
-ENG
INEE
R TH
E U.
S. E
CONO
MY
•Am
ong
the
bigg
est f
ears
am
ong
inve
stor
s is
that
a
prog
ress
ive c
andi
date
m
ight
radi
cally
re-
engi
neer
the
econ
omy.
Rem
embe
r: Al
l pr
esid
ents
also
nee
d co
ntro
l of c
ongr
ess,
and
ou
r sys
tem
of c
heck
and
ba
lanc
es re
sulte
d in
the
last
two
pres
iden
ts
getti
ng o
ne s
igna
ture
ac
hiev
emen
t bef
ore
losin
g th
e Ho
use.
•De
spite
con
cern
s ab
out
maj
or g
over
nmen
t pol
icy
chan
ges,
bus
ines
s In
vest
men
t and
go
vern
men
t spe
ndin
g ha
ve b
een
rem
arka
bly
cons
isten
t as
a pe
rcen
t of
GDP
.
•Ev
en th
roug
h th
e en
actm
ent o
f maj
or
gove
rnm
ent s
pend
ing
prog
ram
s, th
e S&
P 50
0 In
dex
has
still
achi
eved
re
turn
s of
app
roxim
atel
y 10
% a
nnua
lized
.
Brea
kdow
n of
maj
or c
ompo
nent
s of
GDP
as
a %
of t
otal
spe
ndin
g in
the
Unite
d St
ates
sin
ce 1
957
Gov
ernm
ent E
xpen
ditu
res
Busi
ness
Inve
stm
ent
Cons
umpt
ions
S&P
500
Inde
x Re
turn
ed 1
0.07
%An
nual
ized
from
195
7-6/
30/2
0
S&P
500
Tota
l Ret
urn
Inde
x (G
row
th o
f $10
0)

11THE GLOBAL INVESTMENT PULSE, October, 2020
Sour
ce: B
loom
berg
, L.P
., w
ww
.inve
sco.
com
MAR
KETS
DO
N’T
CARE
IF Y
OU
DON’
T LI
KE W
HO’S
PRE
SIDE
NT
•In
vest
ors
don’
t hav
e to
love
wh
at is
goi
ng o
n in
W
ashi
ngto
n, D
C, to
pro
sper
in
the
mar
kets
•So
me
of th
e be
st re
turn
s in
th
e m
arke
t cam
e wh
en th
e pr
esid
entia
l app
rova
l rat
ing
was
in th
e lo
w ra
nge
of
betw
een
36%
and
50%
.
•Th
at m
eans
the
mar
ket h
ad
deliv
ered
som
e of
its
best
re
turn
s du
ring
perio
ds w
hen
half
or m
ore
of th
e co
untry
di
dn’t
appr
ove
of th
e jo
b th
e cu
rrent
adm
inist
ratio
n wa
s do
ing!
•St
ill, it
’s ha
rd to
disc
ern
any
dire
ct re
latio
nshi
p be
twee
n a
pres
iden
t’s p
opul
arity
and
th
e he
alth
of t
he U
.S.
econ
omy
and
the
perfo
rman
ce o
f fin
ancia
l m
arke
ts.
Gal
lup
poll
pres
iden
tial a
ppro
val r
atin
gs a
nd th
e gr
owth
of $
100,
000

12 THE GLOBAL INVESTMENT PULSE, October, 2020
2020 YEAR-TO-DATE PERFORMANCEJanuary 1, 2020 to September 30, 2020
(9 months)2020
Year-To-Date Return
Consumer Price Index (Inflation) 1.29%
90-Day Treasury Bills Index-Total Return 0.34%
Bloomberg Intermediate Term Corporate Bond Index 5.61%
Barclays Aggregate Bond Index-Total Return 6.79%
High Yield Corporate Bond Index – Total Return 5.81%
S&P Leveraged Loan Index – Total Return -0.66%
S&P 500 Index (U.S. Stock Market) 5.57%
Russell 2000 Index (U.S. Small-Caps) -8.70%
MSCI EAFE Index (Developed Foreign Equities) -6.68%
MSCI Emerging Market Index (Equities) -0.96%
Newedge CTA Index (Managed Futures) -3.36%
HFRX Global Hedge Fund Index 1.62%
Dow Jones–UBS Commodity Index-Total Return (USD)** -12.41%
Dow Jones U.S. Real Estate Index-Total Return (USD)** -12.08%
Gold Bullion 23.69%
Compound and Total Returns include reinvested dividends. Newedge Index is equally-weighted.** USD = U.S. DollarSource: Bloomberg Investment Service COPYRIGHT 2020 LEGEND FINANCIAL ADVISORS, INC. ®
REPRINTED WITH PERMISSION OF LEGEND FINANCIAL ADVISORS, INC. ®
As of: September 30, 2020

13THE GLOBAL INVESTMENT PULSE, October, 2020
S&P 500 INDEX UNDER RECENT PRESIDENTS
10K
5K
01981 1989 1993 2001 2009 2017
% Return:
RonaldReagan14.1%
H.W.Bush15.1%
Bill Clinton16.7%
George W. Bush-3.2%
Barack Obama16.5%
Donald Trump13.7%
Source: Legend Financial Advisors, Inc.®
January 1, 1979 To July 10, 2020
The first year is the post-election year. The results are so-so, that’s usually because the Presi-dent has some problems starting with their administration in the first days of his term, starting to work with Senators as well as elected representatives from the House of Representatives (House). Therefore, the Presi-dent tries to have both the Sen-ate and the House on the same page trying to pass new legisla-tion, which is frequently rejected or a fight to have the new legisla-tion passed. The second fiscal year is generally a better time for passing new tax laws. Gen-erally, stock market returns are better in the second year. Notice the green block, which averaged 12.9%, ended up very well. By the way, in almost every case, except for the election year, the November through April period
is usually very good. In May to October, the stock market, by comparison, suffers.
Also, in the third year, the pre-election year, which was our situation in 2019, it is generally a very good year for the stock market because the new legisla-tion has been fully phased in. In the fourth year, the stock market generally starts out slow, then it picks up in the second half of the fourth year. During the second Presidential term, the pattern is the same, but the stock market returns are not as good. See returns year-by-year on page 9 (S&P 500’s Index Annual Percent Change by President) which lists the return of each year while a President is in office.
COPYRIGHT 2020 LEGEND FINANCIAL ADVISORS, INC.®
Election Cycle, continued from page 1
PULSEThis article should not be construed as investment advice. The content is provided for news and/or educational purposes only.
ELECTION WEBCAST
For further information regarding how the elections
affect the Stock Market, we would strongly recommend that you
watch our latest Webcast entitled “Elections and the Stock Market”:
www.legend-financial.com/webcasts#ElectionsAndTheStockMark
et2020

14 THE GLOBAL INVESTMENT PULSE, October, 2020
S&P 500 AROUND PRESIDENTIAL ELECTIONS(WHEN INCUMBENT PARTY WINS)
Source: The Leuthold Group, LLC, Perception Express, October, 2020, http://leuth.us/market-internals
REPRINTED WITH PERMISSION FROM THE LEUTHOLD GROUP, LLC
As of: October, 2020COPYRIGHT 2020 THE LEUTHOLD GROUP, LLC
S&P 500 AROUND PRESIDENTIAL ELECTIONS(WHEN INCUMBENT PARTY LOSES)
Source: The Leuthold Group, LLC, Perception Express, October, 2020, http://leuth.us/market-internals
REPRINTED WITH PERMISSION FROM THE LEUTHOLD GROUP, LLC
As of: October, 2020COPYRIGHT 2020 THE LEUTHOLD GROUP, LLC
15THE GLOBAL INVESTMENT PULSE, October, 2020
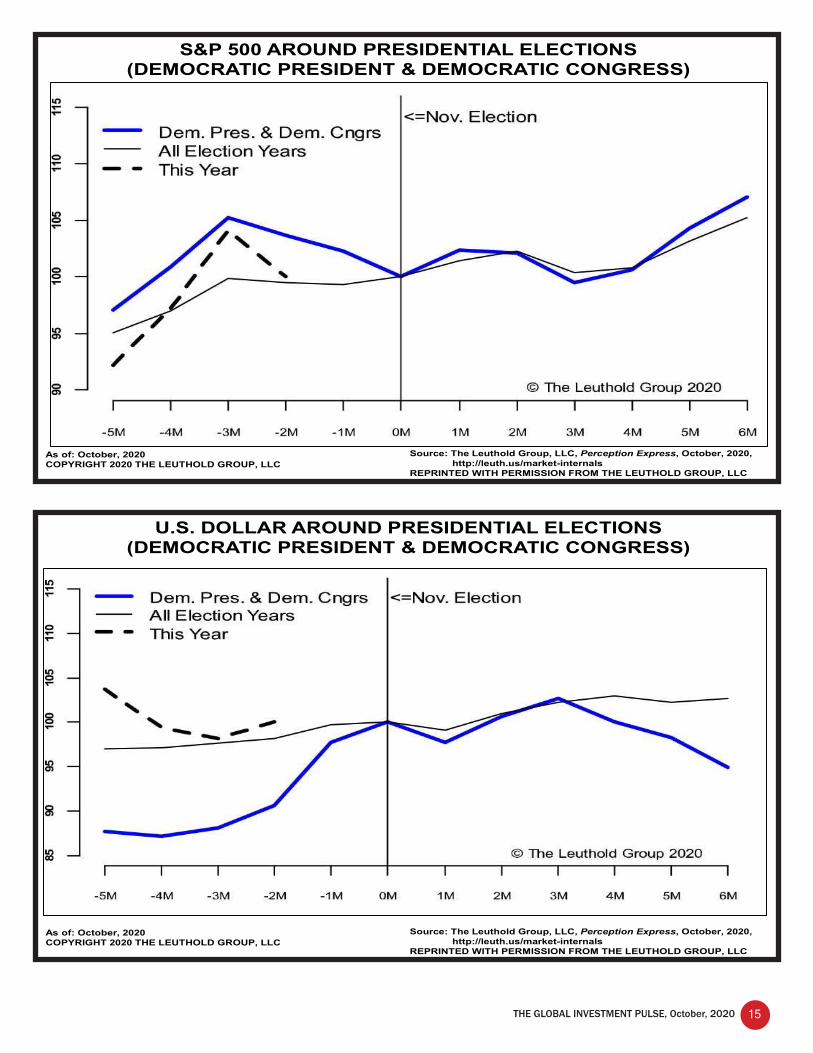
S&P 500 AROUND PRESIDENTIAL ELECTIONS(DEMOCRATIC PRESIDENT & DEMOCRATIC CONGRESS)
Source: The Leuthold Group, LLC, Perception Express, October, 2020, http://leuth.us/market-internals
REPRINTED WITH PERMISSION FROM THE LEUTHOLD GROUP, LLC
As of: October, 2020COPYRIGHT 2020 THE LEUTHOLD GROUP, LLC
U.S. DOLLAR AROUND PRESIDENTIAL ELECTIONS(DEMOCRATIC PRESIDENT & DEMOCRATIC CONGRESS)
Source: The Leuthold Group, LLC, Perception Express, October, 2020, http://leuth.us/market-internals
REPRINTED WITH PERMISSION FROM THE LEUTHOLD GROUP, LLC
As of: October, 2020COPYRIGHT 2020 THE LEUTHOLD GROUP, LLC

16 THE GLOBAL INVESTMENT PULSE, October, 2020
S&P 500 AROUND PRESIDENTIAL ELECTIONS(REPUBLICAN PRESIDENT & SPLIT CONGRESS)
Source: The Leuthold Group, LLC, Perception Express, October, 2020, http://leuth.us/market-internals
REPRINTED WITH PERMISSION FROM THE LEUTHOLD GROUP, LLC
As of: October, 2020COPYRIGHT 2020 THE LEUTHOLD GROUP, LLC
U.S. DOLLAR AROUND PRESIDENTIAL ELECTIONS(REPUBLICAN PRESIDENT & SPLIT CONGRESS)
Source: The Leuthold Group, LLC, Perception Express, October, 2020, http://leuth.us/market-internals
REPRINTED WITH PERMISSION FROM THE LEUTHOLD GROUP, LLC
As of: October, 2020COPYRIGHT 2020 THE LEUTHOLD GROUP, LLC
70.9%

17THE GLOBAL INVESTMENT PULSE, October, 2020
CONTESTED ELECTION2000 vs 2020: S&P 500
Source: The Leuthold Group, LLC, Perception Express, October, 2020, http://leuth.us/market-internals
REPRINTED WITH PERMISSION FROM THE LEUTHOLD GROUP, LLC
As of: October, 2020COPYRIGHT 2020 THE LEUTHOLD GROUP, LLC
PULSE
“Do You Want A SecondOpinion?”
To see if your investment portfolio is builtto navigate the pitfalls and opportunities ahead,
call us today for a “Free Second Opinion”at (412) 635-9210.
www.legend-financial.com

18 THE GLOBAL INVESTMENT PULSE, October, 2020
Sour
ce: B
urea
u of
Eco
nom
ic A
naly
sis,
Bur
eau
of L
abor
Sta
tistic
san
d Ha
erAn
alyt
ics.
ww
w.in
vesc
o.co
m
THE
HIST
ORI
CAL
NARR
ATIV
E IS
NO
T AL
WAY
S AS
YO
U RE
MEM
BER
IT
•Ji
mm
y C
arte
r pre
side
d ov
er
sign
ifica
nt jo
b gr
owth
.
•U
nder
Rea
gan,
inco
me
for
thos
e in
the
5oth
per
cent
ile
of th
e po
pula
tions
, ran
ked
by in
com
e, g
rew
by
alm
ost
20%
.
•D
urin
g O
bam
a’s
pres
iden
cy,
desp
ite c
once
rns
that
his
po
licie
s w
ould
be
mas
sive
ly in
flatio
nary
, the
U.S
. had
on
e of
the
long
est
disi
nfla
tiona
ry e
nviro
nmen
ts
on re
cord
.
•U
nder
Pre
side
nt T
rum
p,
capi
tal e
xpen
ditu
res
have
be
en b
elow
thei
r his
toric
al
grow
th ra
te, e
ven
in th
e af
term
ath
of la
rge
corp
orat
e ta
x cu
t.
•Th
e ca
rts h
ere
show
a
met
ric fo
r eac
h pr
esid
ent,
in
dark
blu
e, c
ompa
red
with
th
e lo
ng-te
rm a
vera
ge
grow
th ra
te fo
r tha
t met
ric
sinc
e th
e en
d of
Wor
ld W
ar
II.
•C
lear
ly, h
isto
ry is
ofte
n re
mem
bere
d di
ffere
ntly
than
th
e ac
tual
dat
a.

19THE GLOBAL INVESTMENT PULSE, October, 2020
Sour
ce: H
aver
, Inv
esco
w
ww
.inve
sco.
com
MAR
KETS
HAV
E PE
RFO
RMED
WEL
L UN
DER
BOTH
PAR
TIES
•Th
e S&
P 50
0 In
dex
deliv
ered
an
aver
age
annu
al re
turn
of
appr
oxim
atel
y 11
% o
ver
the
past
75
year
s,
thro
ugh
both
Dem
ocra
tic
and
Rep
ublic
an
adm
inis
tratio
ns.
•Th
e U
.S. e
cono
my
also
ex
pand
ed a
roun
d 3.
0%
durin
g th
at p
erio
d.
•Th
e st
ock
mar
ket’s
re
turn
was
neg
ativ
e fo
r a
pres
iden
tial
adm
inis
tratio
n on
ly w
hen
the
coun
try w
as in
a
finan
cial
cris
is (2
008)
or
expe
rienc
ing
a st
agfla
tiona
rysp
iral
(197
3).
•N
eith
er p
arty
can
lay
clai
m to
sup
erio
r ec
onom
ic o
r fin
anci
al
mar
ket p
erfo
rman
ce.
Annualized Stock Market Performance %
Annu
aliz
ed R
eal G
DP G
row
th D
urin
g Pr
esid
entia
l Ter
m %
Not
e: P
resi
dent
Tru
mp
stoc
k m
arke
t per
form
ance
da
ta fr
om 1
/20/
17-6
/30/
20,
real
GD
P da
ta fr
om
12/3
1/16
to 3
/31/
2020
as
GD
P is
repo
rted
with
a la
g.
Stoc
k m
arke
t per
form
ance
is
def
ined
by
the
tota
l ret
urn
of th
e S&
P 50
0 In
dex.

20 THE GLOBAL INVESTMENT PULSE, October, 2020
SECULAR BEAR MARKET WATCHApril 1, 2000 to September 30, 2020
(20 years and 6 month)Annual Total
Compound Return Return
Consumer Price Index (Inflation) 2.06% 52.03%
90-Day Treasury Bills Index-Total Return 1.53% 36.39%
Bloomberg Intermediate Term Corporate Bond Index 5.52% 201.26%
Barclays Aggregate Bond Index-Total Return 5.13% 178.84%
High Yield Corporate Bond Index – Total Return 8.73% 456.56%
S&P Leveraged Loan Index – Total Return 4.67% 154.86%
S&P 500 Index (U.S. Stock Market) 6.06% 234.40%
Russell 2000 Index (Small-Caps) 6.54% 266.94%
MSCI EAFE Index (Developed Foreign Equities) 3.43% 99.64%
MSCI Emerging Market Index (Equities) 6.63% 273.43%
Newedge CTA Index (Managed Futures) 3.85% 116.89%
HFRX Global Hedge Fund Index 2.35% 61.09%
Dow Jones–UBS Commodity Index-Total Return (USD)** -1.59% -28.09%
Dow Jones U.S. Real Estate Index-Total Return (USD)** 9.65% 561.49%
Gold Bullion 9.74% 573.46%
Compound and Total Returns include reinvested dividends. MSCI Indexes do not include dividends prior to 2002. Newedge Index isequally-weighted.
** USD = U.S. DollarSource: Bloomberg Investment Service
COPYRIGHT 2020 LEGEND FINANCIAL ADVISORS, INC. ®REPRINTED WITH PERMISSION OF LEGEND FINANCIAL ADVISORS, INC. ®
As of: September 30, 2020
Note: During Secular Bear markets U.S. Stocks have historically returned a little more than inflation or a little less than inflation—plus or minus 1.50%—and generally last between 15 to 25 years. The last Secular Bear market (1966 to 1982) lasted 17 years and underperformed inflation by approximately one-half of one percent per year. The other Secular Bear markets since 1900 were 1901 to 1920 and 1929 to 1949. In both cases, the U.S. Stock market outperformed inflation by approximately 1.50% per year. All of the aforementioned performance numbers are pre-tax.
The performance of the U.S. Stock market so far in the current period (April 1, 2000 to the present) certainly appears to indicate that we are in a Secular Bear market. Long-term returns (over the next 10 years) for the S&P 500 will probably be slightly worse than the last 20 years and 6 months. Current 10 year normalized P/Es (long-term valuations) indicate approximate annual compound returns of slightly less than 3.00% over the next 10 years. Of course during the next 10 years, returns during various periods will be significantly higher and lower than the expected return. For example, the more the stock market rises in the near term, the less returns after that period will be and vice versa.
SECULAR BEAR MARKET WATCH (CONTINUED)April 1, 2000 to September 30, 2020
(20 years and 6 month)
COPYRIGHT 2020 LEGEND FINANCIAL ADVISORS, INC. ®
REPRINTED WITH PERMISSION OF LEGEND FINANCIAL ADVISORS, INC. ®
As of: September 30, 2020

21THE GLOBAL INVESTMENT PULSE, October, 2020
LEGEND FINANCIAL ADVISORS, INC.® &EMERGINGWEALTH INVESTMENT MANAGEMENT, INC.’S®
INVESTMENT MANAGEMENT SERVICES
Legend Financial Advisors, Inc.® (Legend) and EmergingWealth Investment Management, Inc.® (EmergingWealth) offer Personalized Investment Management Services to individuals and institutions. Investment portfolios are developed to match the client’s return and risk requirements, which are determined by the clients’ completion of a Risk Comfort Zone Questionnaire, with the guidance of a Legend Wealth Advisor or EmergingWealth Advisor, respectively. Each type of investment portfolio is managed to achieve the short, intermediate and long-term investment objectives of the client, as may be applicable.
INVESTMENT PROCESS
Investment Portfolios:
Unlike most financial advisory firms that offer one style of investment or portfolio type, we offer a wide array of investment portfolios that usually fit with the large majority of client needs. If necessary, we will create customized solutions as well. For the types of investment portfolios, please see our Investment Portfolios, Potential Return and Risk Spectrum Chart on the next page. For a detailed description of our portfolios, please contact Louis P. Stanasolovich, CFP®, founder, CEO and President of both firms for a confidential discussion at (412) 635-9210 or e-mail us at [email protected].
Investment Research:
Our Investment Committee performs extensive research to identify opportunities, mitigate risks and structure investment portfolios. Emphasis is placed on developing portfolios that maximize the potential return relative to the amount of risk taken.
In-depth due diligence including face-to-face interviews in many instances with portfolio managers for open-end mutual funds is performed on each investment we select for a portfolio. Factors (both from a qualitative and quantitative standpoint) that we conduct a thorough analysis of each investment include, but is not limited to, liquidity (including the primary investment and/or the underlying investments, if utilizing pass through vehicles such as open-end mutual funds or exchange-traded products), income taxation, all related costs, return potential, drawdown potential (historical declines from peak-to-trough), volatility and management issues (Anything having to do with the management team of a stock, open-end mutual fund or an exchange-traded product.).
All portfolios for EmergingWealth are subadvised by Legend.
Client Education:
Education is very important to us. We are dedicated to educating each client about the different investment portfolio types and how they relate to market volatility, time horizons, and investment returns. It is our goal to ensure that the client understands and agrees with our investment philosophy. Furthermore, we assist each client in selecting a risk tolerance level with which they are comfortable. Ultimately, an investment portfolio is designed to meet the client’s objectives.
PERFORMANCE REPORTING
Many investment firms only offer monthly brokerage statements, which provide minimal information; typically only account and investment balances. We, on the other hand, provide detailed quarterly reports that outline performance, income and management fees (among other items) in a simple, easy-to-read report. In addition, each performance report is sent with an extensive index page that illustrates the investment environment during the reporting period.
FEES
To find out more about the fees for either Legend or EmergingWealth’s Investment Management services, please contact Louis P. Stanasolovich, CFP®, founder, CEO and President of both firms for a confidential discussion at (412) 635-9210 or e-mail us at [email protected].